Embed Size (px)
Citation preview

CLC2006, CLC2000 and CLC-Changes in ICELAND
Grant agreements:
3601/B2007.EEA53004 and 3601/RO/CLC/B2007.EEA52971
Final report
National Land Survey of Iceland / Landmælingar Íslands. October 2009

2
FINAL REPORT
Grant agreements:
3601/B2007.EEA53004 and
3601/RO/CLC/B2007.EEA52971
Prepared by: Kolbeinn Árnason
Ingvar Matthíasson
Figures on front page:
Upper figure: CLC2006 classification map of Iceland
Lower figure: CLC-Change2006-2000 map of Iceland
CONTENT

3
FOREWORD …………………………………………………………………………………………… 4
1. SUMMARY ………………………………………………………………………………………….. 5
2. INTRODUCTION …………………………………………………………………………………… 7
3. BACKGROUND ……………………………………………………………………………………. 8
3.1. BASIC PRINCIPLES …………………………………………………………………………… 8
3.2. TECHNICAL SPECIFICATIONS ………………………………………………………………. 8
3.3. COORDINATE SYSTEM OF ICELAND ……………………………………………………… 10
4. ICELAND …………………………………………………………………………………………… 11
4.1. GENERAL ………………………………………………………………………………………… 11
4.2. ICELAND AND CORINE NOMENCLATURE ………………………………………………… 13
4.2.1. Forests and transitional woodland/schrub (311, 312, 313 and 324) ………………….. 13
4.2.2. Pastures (231) ………………………………………………………………………………… 13
4.2.3. Peatbogs (412) ……………………………………………………………………………….. 14
4.2.4. Sand planes and Bare rock (331 and 332) ………………………………………………… 14
4.2.5. Mosses and lychens …………………………………………………………………………. 15
5. PROJECT FRAMEWORK AND METHODOLOGY ……………………………………………. 16
5.1. TIME SCHEDULE – AND SETBACK ………………………………………………………….. 16
5.2. PROCEDURE ……………………………………………………………………………………. 17
5.3. VERIFICATION OF THE CLC RESULTS ……………………………………………………. 21
5.3.1. Verification of the CLC2006 results ………………………………………………………… 21
5.3.2. Verification of the CLC-Change and CLC2000 results ………………………………….. 22
6. RESULTS OF THE CLC2006 CLASSIFICATION ……………………………………………. 23
6.1. SOME DETAILS OF THE CLC2006 RESULTS ……………………………………………. 26
6.1.1. Level 1 class 1. Artificial areas, 0,38% of the total area of Iceland ……………………. 26
6.1.2. Level 1 class 2. Agricultural areas, 2,4% of the total area …………………………….. 28
6.1.3. Level 1 class 3. Forest and semi-natural areas, 87,6% of the total area ………......... 30
6.1.4. Level 1 class 4. Wetlands, 7,2% of the total area ………………………………………. 32
6.1.5. Level 1 class 5. Water, 2,3% of the total area …………………………………............ 34
7. RESULTS OF CLC-CHANGE AND CLC2000 ……………………………………………….. 36
7.1. GENERAL REMARKS …………………………………………………………………………. 36
7.2. ANALYSIS OF CLC 2000 - 2006 CHANGES ……………………………………………….. 40
7.2.1. Artificial surfaces ……………………………………………………………………………… 40
7.2.2. Agricultural areas ……………………………………………………………………………… 42
7.2.3. Forests and semi-natural areas ……………………………………………………………… 42
7.2.4. Wetlands ……………………………………………………………………………………….. 43
7.2.5. Water bodies …………………………………………………………………………………… 44
8. FINANCIAL REPORT …………………………………………………………………………….. 45
8.1. BREAKDOWN OF COSTS FOR CLC2006, CLC-CHANGE AND CLC2000………………. 45
9. REFERENCES ……………………………………………………………………………………… 48
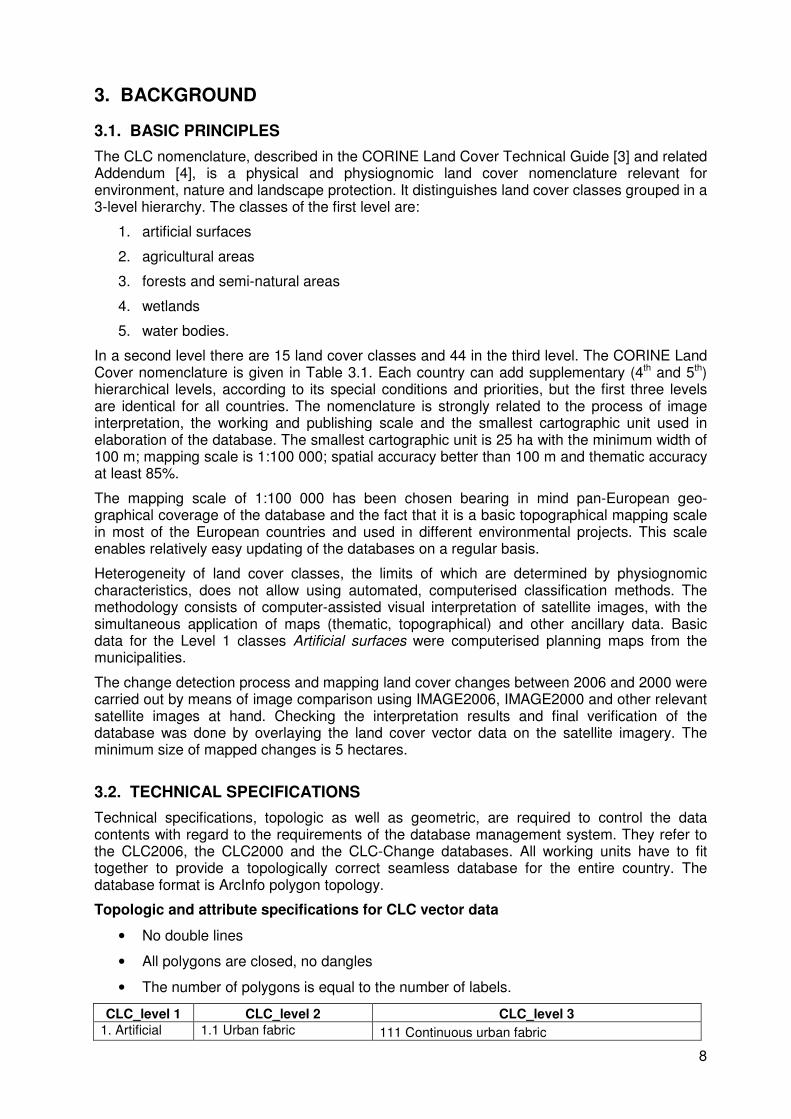
Annex I: Country level Metadata for Iceland, CLC2006 ……………………………………… 50
Annex II: Country level Metadata for Iceland, CLC2000 and CLC-CHANGE2000-2006 ……… 65
Annex III: CLC2006 Metadata – Working layer level …………………………………………….. 78
Annex IV: CLC2000 and CLC-Change2000-2006 Metadata – Working layer level …………….. 103

4
FOREWORD
Iceland joined the CORINE project in 2007 and the CLC2006 classification was finished in December 2008. It was the first CLC classification to be implemented for the country. Concurrently with the CLC2006 mapping data and information on land cover changes between 2006 and 2000 were compiled and CLC2000 and CLC-Changes databases were produced by down-dating the CLC2006 results.
In December 2008 the final report for CLC2006 in Iceland (Grant agreement 3601/B2007. EEA53004) was sent to the EEA [1]. After CLC2006 final report was delivered some errors and inaccuracies were found in the database and corrected. After the CLC2000 and CLC-Changes databases were finished they were uploaded on the Central Data Repository (CDR) at EEA along with the new and corrected version of the CLC2006 database. The database technical acceptance for Iceland was issued on June 26, 2009.
This report is a joint final report for CLC2006, CLC2000 and CLC-Change for Iceland based on the CLC2006 final report from December 2008, but substantially enlarged to include CLC2000 and CLC-Change results. Also errors found in the CLC2006 database after December 2008 have been corrected in this report.
Consequently this joint report replaces the previous CLC2006 final report [1].

5
1. SUMMARY
Iceland joined the CORINE programme in 2007 and CLC2006 was finished in December 2008. It was the first detailed land cover classification to be completed in the country. Concurrently with the CLC2006 mapping data and information on land cover changes between 2006 and 2000 were compiled and integrated in the CORINE database resulting in the CLC2000 and CLC-Changes databases by down-dating the CLC2006 results. The Database Technical Acceptance report was issued on June 26. 2009.
The Ministry for the Environment acted as the national authority for the CORINE project and the National Land Survey of Iceland (NLSI) was responsible for its implementation. Many public institutions and all municipalities contributed to the CLC2006 and CLC2000 projects by providing relevant data which were subsequently processed and integrated into the NLSI data bases.
According to the original time schedule CLC2006 was to be completed in Q2 of 2008 and CLC2000 shortly thereafter. However, the overall project was substantially delayed because of late data delivery from some of the partner institutions. The success of the CLC mapping in Iceland depended to a large extent on using results of a recent classification of natural surfaces in the country based on Landsat-7 images. These data turned out to be erroneous and incomplete and therefore needed significant man power over several months for manual correction. Hence the completion of the CLC2006 was delayed until December 2008 and the implementation of the CLC2000 and CLC-Changes results were set back by six months.
Concurrently with the CLC2006 higher resolution data was also collected and integrated into a domestic database (HiRes Land Cover, or HRLC) at the NLSI. This database comprises all the CORINE classes except some of the natural land cover types where higher mapping accuracy is not relevant (i.e. glaciers, barren and sparsely vegetated land, natural vegetation). The HRLC database, that is considered to be very important for inland research, has also been completed for 2006 and will be accessible free of charge on the NLSI home page.
CLC2006 results
Land cover in Iceland is characterised by 32 out of the 44 CORINE Land Cover classes in 2006 but the results for CLC2000 have one class less (class 122 Roads was absent in 2000). Semi-natural surfaces dominate but artificial surfaces are very small compared to other European countries. 15 land cover classes are infinitesimal in size and some of them almost disappear due to CORINE classification constraints. These 15 classes occupy less than 100 km2 each and are therefore smaller than 1 promille of the country´s total area. The 5 largest classes on the other hand make up almost 90% of the total area. The main results of the CLC2006 classification in Iceland are as follows:
Level 1 class 1. Artificial areas cover 0,38% of the total area of the country where the largest surface types are 142 Sport and leisure facilities (mostly settlements of summer houses) and 112 Discontinuous urban fabric.
Level 1 class 2. Agricultural areas cover 2,4% of the country and consist of only three surface types: 231 Pastures (97%) and very small patches of 211 Non-irrigated arable land and 242 Complex Cultivation Patterns.
Level 1 class 3. Forest and semi-natural areas comprise almost 88% of the total area of the country. The largest surface classes are; 322 Moors and heathland (35% of Iceland), 332 Bare rocks (23%), 333 Sparsely vegetated areas (13%) and 335 Glaciers (10.5%).
Level 1 class 4. Wetlands occupy 7,2% of Iceland of which 87% has been classified as 412 Peatbogs.
Finally, Level 1 class 5. Water occupies 2,3% of the total area of Iceland.
CLC2000 and CLC-Changes2000-2006 results
Between 2000 and 2006 some 0,62% of Iceland changed its land cover. The most prominent land cover changes occur in class 3 Forests and semi-natural surfaces which is self-evident as

6
class 3 comprises all the largest surface classes in the country. On the other hand there are four surface classes that do not change over this 6 years period of time; 124 Airports, 312 Coniferous forests, 411 Inland marshes and 421 Salt marshes.
The largest land cover change was the conversion from glacier ice to bare rocks due to melting of the ice caps in the last years. Between 2000 and 2006 the glaciers shrinked by 180 km2 or 1,63% which is an annual reduction of 0,27%.
Another typical land cover change in Iceland is the conversion of 331 Beaches, dunes and sand planes to 511 Water courses and vice versa due to the natural instability of braided glacial rivers that tend to change their channels regularly resulting in a classification of the very same areas either as sand (331) or as water courses (511) depending on the current position of the rivers. Class 331 increases by 172 km2 and decreases by 159 km2 between 2000 and 2006 while the total areal change is an increase of only 3,2 km2.
Several land cover classes under Artificial surfaces increased considerably; 112 Discontinuous urban fabric by 10%, 121 Industrial and commercial units (20%) and 142 Sport and leisure facilities (15%) but the largest change recorded was in 133 Construction areas which increased by 1055%. This increase is mainly due to several construction sites for new residential and industrial districts in the capital area and a new hydropower plant in eastern Iceland.
The CLC2006, CLC2000 and CLC-Change results are accessible on the NLSI homepage and can be downloaded as shapefiles free of charge. The results may also be viewed and examined on a map viewer (http://atlas.lmi.is/corine/) [2] where users can make their remarks and indicate possible errors or mistakes.

7
2. INTRODUCTION Grant Agreements, 3601/B2007.EEA53004 and 3601/RO/CLC/B2007.EEA52971, for the production of CLC2006, CLC2000 and CLC-Change maps respectively were signed with the EEA in July 2007. The Ministry for the Environment acted as the national authority for the CORINE project in Iceland and the National Land Survey of Iceland (NLSI) was responsible for its implementation. Before the realisation of the CLC agreements NLSI already had cooperation contracts with most of the national institutions in Iceland working in the various fields of compilation of land information and GIS processing. Many of these institutions and all 78 municipalities in the country contributed in one way or another to the CORINE projects, predominantly by providing relevant data and performing accuracy control of the data.
CLC2006 was the first CORINE classification to be implemented in Iceland followed by CLC-Change and CLC2000 that were concluded by down- or back-dating the CLC2006 results. The situation therefore differs somewhat from most of the other European countries where CLC2000 was completed before CLC2006 started.
According to the original time plan the implementation of the CLC2006 database for Iceland was supposed to be finished by Q2 of 2008 but the work process was delayed. The main reason for this delay was late delivery of important data from one of the cooperating institutions and the unfinished status of this data. Consequently, CLC-Change and CLC-2000 were delayed by one year, until mid-2009.
8
3. BACKGROUND
3.1. BASIC PRINCIPLES
The CLC nomenclature, described in the CORINE Land Cover Technical Guide [3] and related Addendum [4], is a physical and physiognomic land cover nomenclature relevant for environment, nature and landscape protection. It distinguishes land cover classes grouped in a 3-level hierarchy. The classes of the first level are:
1. artificial surfaces
2. agricultural areas
3. forests and semi-natural areas
4. wetlands
5. water bodies.
In a second level there are 15 land cover classes and 44 in the third level. The CORINE Land Cover nomenclature is given in Table 3.1. Each country can add supplementary (4th and 5th) hierarchical levels, according to its special conditions and priorities, but the first three levels are identical for all countries. The nomenclature is strongly related to the process of image interpretation, the working and publishing scale and the smallest cartographic unit used in elaboration of the database. The smallest cartographic unit is 25 ha with the minimum width of 100 m; mapping scale is 1:100 000; spatial accuracy better than 100 m and thematic accuracy at least 85%.
The mapping scale of 1:100 000 has been chosen bearing in mind pan-European geo-graphical coverage of the database and the fact that it is a basic topographical mapping scale in most of the European countries and used in different environmental projects. This scale enables relatively easy updating of the databases on a regular basis.
Heterogeneity of land cover classes, the limits of which are determined by physiognomic characteristics, does not allow using automated, computerised classification methods. The methodology consists of computer-assisted visual interpretation of satellite images, with the simultaneous application of maps (thematic, topographical) and other ancillary data. Basic data for the Level 1 classes Artificial surfaces were computerised planning maps from the municipalities.
The change detection process and mapping land cover changes between 2006 and 2000 were carried out by means of image comparison using IMAGE2006, IMAGE2000 and other relevant satellite images at hand. Checking the interpretation results and final verification of the database was done by overlaying the land cover vector data on the satellite imagery. The minimum size of mapped changes is 5 hectares.
3.2. TECHNICAL SPECIFICATIONS
Technical specifications, topologic as well as geometric, are required to control the data contents with regard to the requirements of the database management system. They refer to the CLC2006, the CLC2000 and the CLC-Change databases. All working units have to fit together to provide a topologically correct seamless database for the entire country. The database format is ArcInfo polygon topology.
Topologic and attribute specifications for CLC vector data
• No double lines
• All polygons are closed, no dangles
• The number of polygons is equal to the number of labels.
CLC_level 1 CLC_level 2 CLC_level 3 1. Artificial 1.1 Urban fabric 111 Continuous urban fabric

9
surfaces 112 Discontinuous urban fabric 1.2 Industrial, commercial and transport unit
121 Industrial or commercial units 122 Roads and associated land 123 Port areas 124 Airports
1.3 Mine, dump and construction site
131 Mineral extraction sites 132 Dump sites 133 Construction sites
1.4 Artificial areas, non-agricultural vegetated
141 Green urban areas 142 Sport and leisure facilities
2. Agricultural areas
2.1 Arable land 211 Non-irrigated arable land 212 Permanently irrigated land 213 Rice fields
2.2 Permanent crops 221 Vineyards 222 Fruit trees and berry plantations 223 Olive groves
2.3 Pastures 231 Pastures 2.4 Heterogeneous agricultural areas
241 Annual crops associated with permanent crops 242 Complex cultivation pattern
243 Land principally occupied by agriculture, with significant areas of natural vegetation 244 Agro-forestry areas
3. Forest and semi-natural areas
3.1 Forest 311 Broad-leaved forest 312 Coniferous forest 313 Mixed forest
3.2 Shrub and/or herbaceous vegetation associations
321 Natural grassland 322 Moors and heathland 323 Sclerophyllous vegetation 324 Transitional woodland/shrub
3.3 Open spaces with little or no vegetation
331 Beaches, dunes, and sand plains 332 Bare rocks 333 Sparsely vegetated areas 334 Burnt areas 335 Glaciers and perpetual snow
4. Wetlands 4.1 Inland wetlands 411 Inland marshes 412 Peatbogs
4.2 Coastal wetlands 421 Salt marshes 422 Salines 423 Intertidal flats
5. Water 5.1 Inland waters 511 Water courses 512 Water bodies
5.2 Marine waters 521 Coastal lagoons 522 Estuaries 523 Sea and ocean
Table 3.1. CORINE Land Cover Nomenclature. 32 classes written in bold were present in Iceland in 2006 but only 31 classes in 2000 as class 122 Roads didn´t fulfill the CLC constrains at that time.

10
• The feature ID must be unique; it does not contain the CLC code.
• Each polygon of CLC2000 and CLC2006 databases must have a character attribute: the 3-digit CLC code.
• Each polygon of the CLC-Change database must have two character attributes: a 3-digit CLC code for both 2000 and 2006 datasets.
• No unclassified polygons (0 code), only codes compatible with nomenclature.
• Neighbouring polygons should not have the same CLC code.
• A seamless digital database should be produced without any non-coded gaps; this means a perfect edge matching between the working units.
Geometric specifications for CLC vector data
• The final delivery of the National CLC results of each country is produced in the national projection system.
• The coordinates of the data delivered to the EEA should have ‘double precision’.
• There should be no visible map sheet boundaries in the data sets.
• The area of smallest polygons is 25 ha for the CLC2000 and CLC2006 databases.
• The minimum width of linear features is 100m.
• Only land cover changes larger than 5 hectars are mapped in the CLC-Change database. Contiguous >5 ha changes can consist of several change polygon, some of which not necessarily exceed the 5 ha limit.
3.3. COORDINATE SYSTEM OF ICELAND
The Icelandic national grid coordinate system is the Lambert Conformal Conic (LCC) projection with two standard parallels. All maps, satellite images an other geographical information used for CLC2006, CLC2000 and CLC-Change are in this coordinate system [5].
Projection Lambert 2SP Units Meters SPHEROID GRS80 DATUM ISN93 (ITRF93) Parameters: 1.000 /* scale factor at central meridian -19 0 0.000 /* longitude of central meridian 65 0 0.000 /* latitude of central meridian 64 15 0.000 /* latitude of 1st SP 65 45 0.000 /* latitude of 2nd SP 50000.000 / * false easting (meters) 50000.000/* false northing (meters)

11
4. ICELAND
4.1. GENERAL
Iceland is situated on the Mid-Atlantic Ridge and its bedrock and surface deposits are almost entirely of volcanic origin. Volcanic activity is very high with, on the average, one eruption every 4 - 5 years. The rift associated with the Mid-Atlantic Ridge, which marks the boundary between the Eurasian and North American tectonic plates, runs across Iceland from southwest to northeast. The total area of the island is 103.440 km2.
About half of Iceland's land area consists of a mountainous lava desert (highest elevation 2110 m above sea level, and mean elevation of 508 meters) and other wasteland. Glaciers make up 10,5%. Some 20% of the land is used for grazing, and only 1 - 2% is cultivated (mostly hayfields). An ambitious reforestation program is in progress. It is assumed that prior to human settlement in the 8-900´s, trees covered about 30-40% of the island. Today, however, only small patches of the original birch forests are left.
Iceland is very sparsely populated with only 300.000 inhabitants. The inhabited areas are in the lowlands at, or close to, the coast, particularly in the southwest; the central highlands are totally uninhabited. Because of the Gulf Stream's moderating influence, climate is character-ized by damp, cool summers and relatively mild but windy winters. In Reykjavík, the average temperature is 11°C in July and 0°C in January.
The soil cover in Iceland is discontinuous and delicate. The interior is more or less barren. Especially in areas of active volcanism desert-like conditions prevail as the water soaks into the porous ground. The young volcanic terrain of the interior supplies immense quantities of wind blown dust and volcanic ash making the soils of the fringing areas sandy and dry. In the older Tertiary and Plio-Pleistocene areas the soils are more boggy and peat is extensively developed. Since settlement time, Iceland has been deprived of much of its soil and vegetation cover, and birch woods have been reduced so thoroughly that today only insignificant remnants are left [6].
Figure 1 on the next page shows a simplified geological map of Iceland. The active Neovolcanic zone characterized by volcanic systems in en echelon arrays crosses the island from the southwest to the north. Due to continental drift the Icelandic bedrock grows gradually older to the west and to the east with increasing distance from the axial rift zone. Consequently the oldest rocks are in the western- and easternmost parts of the country.

12
Figure 4.1. Simplified geological map of Iceland

13
4.2. ICELAND AND CORINE NOMENCLATURE Today, CORINE datasets and methodology have become a standard for land cover mapping, spatial analysis applications and integrated environmental assessment. CORINE Land Cover (CLC) pan-European geographical coverage and unique nomenclature allow to use it as a key reference data for spatial and regional analysis at different territorial levels. Obviously it is very important that original CLC nomenclature is preserved and will not be altered if temporal land cover changes are to be mapped correctly and in a comparable way in all European countries.
The CORINE nomenclature was originally defined to fit surface characteristics of countries in Southern- and Central-Europe. As the Nordic countries also joined in the CORINE programme this nomenclature has shown to be somewhat problematic regarding some surface types in these countries.
Out of the 44 CORINE land cover classes 32 are present in Iceland in 2006 (and 31 in 2000). Most of these 32 classes can be relatively easily discerned in Iceland. Some Icelandic land cover types, however, do not fit in the nomenclature and have to be squeezed in one certain CORINE class even though it can hardly be regarded as an appropriate class. In the following pages the most obvious misfits between the CORINE nomenclature and Iceland´s natural characteristics are discussed.
4.2.1. Forests and transitional woodland/shrub (311, 312, 313 and 324)
Prior to the settlement of Iceland large areas are assumed to have been covered by birch woods. Today, however, there are only small patches of the original woods left where most of the trees are only some 4 – 5 meters high. An ambitious reforestation program is now in progress where imported species, both coniferous and broad leaved, are used.
The Icelandic Forestry Service (IFS) has mapped all woods and tree plantations in the country and made the data available to the CORINE project. In the IFS database the forest trees are considered to be at least 2 meters high (compared to 5m tree height in CLC). The CLC Technical Team agreed to follow the Icelandic definition of forests with tree height > 2 meters [7].
Woodland areas composed of trees and bushes less than 2 m high are classified as 322 (Moors and heathland). Class 324 (Transitional woodland/shrub) consist exclusively of new tree plantations that will turn into woods in due time. Currently logging areas are nowhere large enough to be mapped
4.2.2. Pastures (231)
Agricultural areas in Iceland are separated in only 3 surface classes, namely: 211 (Non-irrigated arable land), 231 (Pastures) and 242 (Complex cultivation pattern) where pastures dominate. According to the CLC definition pastures are “areas of dense grass cover mainly used for grazing, but the fodder may also be harvested mechanically”.
Pastures in Iceland are composed of hayfields and grazing areas whereof the hayfields have been carefully mapped (they can easily be identified on aerial photographs and high resolution satellite images) but grazing areas have not been mapped at all. Traditionally grazing of sheep and horses (and to a lesser extent also cattle) is not confined to fenced areas but comprises practically all vegetated land in the country. Sheep are driven into the mountains in spring and rounded up again in the autumn and kept indoors during winter.
In the CORINE land cover technical guide – Addendum 2000 the following is stated on pastures: “Pastures can be described as extensively used grasslands with presence of farm structure such as fences, … drainage, … “. It is almost impossible to obtain solid information on all land parcels used extensively for grazing without consulting every farmer in the country. Hence class 231 in Iceland is simply defined as surrounding areas of farms that can be delineated on high resolution satellite images or areal photographs by tracking regular

14
structures such as drainage ditches and fences. Some of these areas are presumably not extensively grazed except in spring or autumn and some might not be grazed at all.
In some cases where ditches have obviously had very little draining effect as deduced from infrared satellite images (ditches too far apart in large flat areas) land is classified as wetland (mostly 412).
4.2.3. Peatbogs (412)
Mires and bogs in Iceland are not always pure peatbogs. The most common bogs are slope mires which may have an inclination of up to 10° and are not always characterised by thick peaty ground. Due to active volcanism and wind blown volcanic ash Icelandic soils are not always unmixed histosols but more often have considerable proportion of andosol materials, i.e. histic andosol and gleyic andosol [8].
As previously stated, some drained areas, where the ditches have obviously had very little draining effect (clearly wet on satellite images), are classified as wetland (mostly 412). Bogs and mires in Iceland can be further divided into level 4 sub-classes similar to what has been done in Ireland. This division is likely to be undertaken in the near future but is not relevant for this report.
4.2.4. Sand planes and Bare rock (331 and 332)
Iceland consists solely of volcanic materials and large parts of the land´s total area are mountainous lava deserts and sparsely vegetated areas. Land in the vicinity of the large glaciers is characterised by vast glacio-fluvial planes that clearly classify as 331. Scree and rock outcrops in the montaineous regions, however, belong without ambiguity to class 332. Continuous intermediate levels exist between those two extremes.
CLC definitions of classes 331 and 332 seem to be contradictory with regard to Iceland [3]. As previously stated all rocks in Iceland are of volcanic origin and volcanic eruptions are very common, both lava eruptions and pyroclastic eruptions. After large pyroclastic eruptions airborne materials tend to form large ash fields that are in fact typical sand planes. These sand planes are subsequently reworked by winds and running water.
Class 332 includes the following: “Sites and products of recent volcanic activities, volcanic ash and lapilli fields, barren lava fields”. In Iceland the part concerning “volcanic ash and lapilli fields” of recent volcanic activity fits better to class 331 than 332. Distinction between classes 331 and 332 strictly based on their CLC definitions is not always easy in Iceland. Therefore it was decided to separate those two classes based on their texture and morphology as observed in satellie images and aerial photographs:
331: Barren sand and gravel plains which occur by the coast, close to glaciers, glacial rivers and lakes. These planes are flat or almost flat and without any distinct morphology or texture but can be characterised by braided riverbeds that may either be dry or wet. This class includes volcanic ash fields of recent volcanic activities inside the neovolcanic zone.
332: All other types of barren land, including undular hilly areas, formed during the ice age and is morphologically older than 8.000 – 10.000 years. Aso recent (Holocene) terminal moraines are part of this class although the adjacent sand planes that are made up of the same material belong to class 331.
4.2.5. Mosses and lychens
Much of the vegetation in the Icelandic highlands are mosses and lychens. Also many recent lava flows on the lowlands are covered with mosses. Right after their formation these lava

15
flows are completely barren with no traces of soil or vegetation. Mosses are the first plants to settle on their most often rough surface and gradually (time span of decades and centuries) soil is developed and vascular plants take over and root out the mosses.
The issue was discussed with the members of the CLC technical team if only vascular plants should be taken into account when vegetation cover was to be decided or if mosses and lychens should also be regarded. Also the CLC team in Norway was consulted. Based on the traditional vegetation mapping in Iceland and the opinion of leading Icelandic botanists it was finally accepted that mosses and lychens are such an important part of the Icelandic vegetation cover (and arctic vegetation cover in general) that they should definitely be included in the mapping.
Moss and lychen covered areas are included in class 322 Moors and heathland. It is assumed that class 322 be split in two sub-classes; 322-1 Moors and heathland and 322-2 Mosses and lychens in later improvements of the Icelandic CLC data base.

16
5. PROJECT FRAMEWORK AND METHODOLOGY
5.1. TIME SCHEDULE – AND SETBACK
A precondition for the start of CLC2006 in Iceland was the assumption that most of the necessary data already existed at various mapping institutions and merely had to be collected and integrated into one database. This was also more or less true for almost all datasets except the classification of some of the natural surfaces. The success of the CLC2006 depended to a large extent on using results of a recent classification of natural surfaces in Iceland (Nytjaland [9]) that was implemented by the Agricultural University (AUI) using multispectral satellite imagery (mostly Landsat-7). Not only were these data delivered with a considerable delay (3 – 4 months) but they also turned out to be erroneous and incomplete. Hence, they needed significant man power over several months for manual correction at the NLSI. As a result the completion of the CLC2006 database was delayed until December 2008 and CLC2000 and CLC-Change was consequently delayed until June 2009. The costs have gone up accordingly.
Table 5.1. is taken from the Technical Proposal for the CLC2006 (with minor changes) and shows the original time scedule of the project. Table 5.2., on the other hand, is the actual time schedule. Although all tasks were somewhat delayed the overall delay of the CLC2006 and also the CLC2000 project can be attributed to the Nytjaland problem.
Sub-tasks in CLC2006, planned 2007 2008
Acquisition of data from municipalities
Processing/integration of municipalities data
Verification of municipalities data
AUI classification: processing and generalization
Forestry Service: Data on forest classes
All other ancillary data, acquisition and QC
General data integration
Data generalization & production of CLC2006 map
CLC2000 and CLC-Change, planned 2007 2008
Acquisition of change data
Integration and production of CLC-Change map
Production of CLC2000 map
Table 5.1. Original time schedule for CLC2006, CLC2000 and CLC-Change. According to original time schedule CLC2006 was to be completed in Q2 of 2008 but the overall project was substantially delayed because of late data delivery from the AUI and a considerable effort in processing and generalising this dataset at the NLSI. Accordingly CLC2000 and CLC-Change were also deferred (see Table 5.2. on next page).

17
Sub-tasks in CLC2006, actual 2007 2008 2009
Acquisition of data from municipalities
Processing/integration of municipalities data
Verification of municipalities data
AUI classification: processing and generalization
Forestry Service: Data on forest classes
All other ancillary data, acquisition and QC
General data integration
Data generalization & production of CLC2006 map
CLC2000 and CLC-Change, actual 2007 2008 2009
Acquisition of change data
Integration and production of CLC-Change map
Production of CLC2000 map
Table 5.2. Actual time schedule for CLC2006. List of main sub-tasks and actual time schedule for CLC2006 in Iceland. According to original time schedule CLC2006 was to be completed in Q2 of 2008 but the overall project was delayed until Q4 2008 because of late data delivery from the AUI and a considerable effort in processing and generalising this dataset at the NLSI. Consequently the implementation of CLC2000 and CLC-Change was delayed until mid-2009 (compare to Table 5.1. on previous page).
5.2. PROCEDURE
The CLC2006 project was implemented at the National Land Survey of Iceland in close cooperation with various public institutions and other parties working in the fields of land information and mapping. Table 5.3. lists the co-working institutions and the specialists who contributed to the project in one way or another. Concurrently with the CLC2006 higher resolution data was also collected and integrated into a domestic database (HiRes Land Cover, or HRLC) at the NLSI. This database comprises all the CORINE classes except some of the natural land cover types where higher mapping accuracy is not relevant (i.e. glaciers, barren and sparsely vegetated land, natural vegetation). The HRLC database, that is considered to be very important for inland research, has also been completed for 2006 and will be accessible free of charge on the NLSI home page.
As already mentioned the Nytjaland [9] raster database of the AUI was the most important dataset but also the most problematic one. Mostly it was edited manually but computer reclassification was also performed. Optical comparison of the Nytjaland raster results with satellite imagery showed obvious errors of the former with regard to easily discernable surface types like wetlands in some areas. Classification experiments with regard to wetlands using recent SPOT- and Landsat-images were performed at the University of Iceland leading to considerably improved results that were made available to the CORINE project and subsequently integrated in the CLC database. Some of the delivered datasets, e.g. forests, glaciers, lakes, coastal lagoons, etc., spanned the whole country and were integrated as a whole into the CLC2006 database. Much of the

18
CLC data processing, however, was done in certain working units, i.e. each interpreter working individually in a limited area and fully completing the classification within that area before the results were integrated into the database. As working units the 78 municipalities in the country were used. Figure 5.1. shows the boundaries of the 78 municipalities in Iceland. Data sets, data providers and working process for the CLC2006, CLC-Change and CLC2000 mapping in Iceland are listed in Table 5.4.
The CORINE staff at NLSI and specialists at cooperating institutions who have contributed to the CLC mapping Institute Specialist e-mail
National Land Survey of Iceland, NLSI Ásta Óladóttir [email protected]
Ingvar Matthíasson [email protected]
Jóhann Helgason [email protected]
Kolbeinn Árnason [email protected]
Margrét Ragnarsdóttir [email protected]
Saulius Prizginas [email protected]
Sigrún Árnadóttir [email protected]
Þórey Þórðardóttir [email protected]
Agricultural University of Iceland, AUI Fanney Ósk Gísladóttir [email protected]
Hlynur Óskarsson [email protected]
Jón Guðmundsson [email protected]
Ólafur Arnalds [email protected]
Sigmar Metúsalemsson [email protected]
Iceland Forestry Service, IFS Arnór Snorrason [email protected]
Björn Traustason [email protected] The Icelandic Institute of Natural History, IINH Borgþór Magnússon [email protected]
Guðmundur Guðjónsson [email protected]
Rannveig Thoroddsen [email protected]
National Energy Authority, NEA Oddur Sigurðsson [email protected]
University of Iceland, UI Arnþór Garðarsson [email protected]
Agnar Ingólfsson [email protected]
Björn Waske [email protected]
The Icelandic Coast Guard, ICG Árni Þór Vésteinsson [email protected]
Níels Bjarki Finsen [email protected]
The Farmers Association, FA Borgar Páll Bragason [email protected]
Institute of Freshwater Fisheries, IFF Ingi Rúnar Jónsson [email protected]
The National Power Company, NPC Theodór Theodórsson [email protected]
Table 5.3. The CORINE staff at NLSI and specialists at cooperating institutions who have contributed to the CLC mapping. Besides these institutions, all 78 municipalities in Iceland also provided data and other information to the CLC-mapping.

Figure 5.1. Subdivision of Iceland into 78 municipalities
most of the datasets used incompleted the CLC classification the conclusion of the classification the results were crosseach other´s work.
Table 5.4. Datasets, data providers andand CLC2000 mapping in Iceland
class Data, data providers
1. Artificial su
rfaces 112 Digitized general plans from all 78
municipalities, georeferenced and overlaid on SPOT-5 mosaic of Iceland, Iaerial photographs for visual interpretation and updating at NLSI.
Polygons manually digitized with 0,minimum mapping units for thefor inland use.
Interim results sent to planning departments of all municipalities foHRLC database updated at NLSI where needed.
HRLC database generalized to 25 ha MMU CLC2006 polygons.
Local Power Plants provided information on land use for energy generation (hydrogeothermal plants) where needed.
121
122
123
124
131
132
133
141
142
ivision of Iceland into 78 municipalities that served as working units (WU)
in the CLC2006 project. Members of the national CLC team completed the CLC classification within a certain municipality before going to the nextthe conclusion of the classification the results were cross-checked, i.e. the interpreters
Datasets, data providers and working procedure of the CLC2006Iceland
CLC2006 , data providers and working procedure
CLC-Change, CLC2000Data and working procedure
Digitized general plans from all 78 municipalities, georeferenced and overlaid on
5 mosaic of Iceland, IMAGE2006 data or aerial photographs for visual interpretation and
Polygons manually digitized with 0,5 ha minimum mapping units for the HRLC database
Interim results sent to planning departments of all municipalities for verification or correction.
database updated at NLSI where needed.
database generalized to 25 ha MMU CLC2006 polygons.
Local Power Plants provided information on land use for energy generation (hydro-power and
) where needed.
Comparison of CLC2006 results for artificial areas with IMAGE2000.
Interim Change-municipalities for verification. Results updated at NLSI according to corrections.
Information on new and enlarged power plants (hydropower and geothermal) from NPC and Reykjavík Energy.
Information on 123 changes from the Icelandic Maritime Administration.
Information on 124 changes from the Icelandic Civil Aviation Administration
19
working units (WU) for
Members of the national CLC team going to the next one. At
checked, i.e. the interpreters revised
of the CLC2006, CLC-Change
Change, CLC2000 Data and working procedure
Comparison of CLC2006 results for artificial areas with IMAGE2000.
-results sent to the municipalities for verification. Results updated at NLSI according to
new and enlarged power plants (hydropower and
l) from NPC and Reykjavík
Information on 123 changes from the Icelandic Maritime Administration.
Information on 124 changes from the Icelandic Civil Aviation Administration.

20
2. Ag
ricultu
ral areas
211 FA provided HiRes vector dataset for fodder crops (barley) which was generalized at the NLSI.
FA also provided NLSI with important contacts for information on root crops (potatoes).
Polygons digitized using SPOT-5 mosaic and IMAGE2006 taking account of information from the contacts.
FA and agricultural advisers provided information on changes between 2000 and 2006. Digitised at NLSI.
231 Pastures were manually digitized at the NLSI by visual interpretation of SPOT-5 mosaic and comparison with vector data layers of AUI and NLSI. FA consultancy.
Comparison of IMAGE2000 and IMAGE-2006. Mapping of changes problematic due to definition of class (see chapter 4.2.2.).
242 Complex cultivation patterns were manually digitized by visual interpretation of the SPOT 5 mosaic and IMAGE2006. Mostly a mixture of classes 211 and 231 as individual 211 meadows are usually small and scattered.
Information from FA and agricultural consultans.
3. Fo
rests and
semi-n
atural areas
311 IFS provided HiRes vector datasets on all forests. Generalization to 25ha minimum mapping units followed at NLSI.
IFS provided HiRes vector datasets on all forest changes. Generalization to 25ha minimum mapping units followed at NLSI.
312
313
321 AUI provided a HiRes raster dataset "Nytjaland" which unfortunately turned out to be very erroneous. Optical interpretation of SPOT-5 images with close comparison of the Nytjaland results and existing topographic and thematic maps were used to deduce classes 321 and 322. Mostly manual digitising.
Information of transitional woodland shrubs was included in the IFS HiRes dataset.
Comparison of IMAGE-2000 and IMAGE2006. No changes exept where artificial classes have expanded.
IFS provided HiRes vector data on all tree plantations between 2000 and 2006. Generalization to 25 ha MMU at NLSI.
322
324
331 Non- and sparsely vegetated areas were digitised from the HiRes "Nytjaland" raster data by close comparison with SPOT-5 mosaic, IMAGE2006 and maps.
Non vegetated areas were split into 331 and 332 with reference to geographical context and by visual interpretation of SPOT-5 and IMAGE2006 and comparison with topographic maps in scale 1:50 000 and 1:100 000.
HiRes vector dataset of glaciers and perpetual snow was provided by the NEA and subsequently generalised at the NLSI.
Comparison of IMAGE2006 and IMAGE2000. Changes where glacial rivers change their courses, glaciers retreat or due to revegetation.
332 Changes where glaciers decrease.
333 Comparison of IMAGE2006 and IMAGE2000.
335 HiRes vector dataset of glacier changes was provided by the NEA and subsequently generalised at the NLSI.
4. 411 IINH provided HiRes vector dataset of class 411 which was generalised at the NLSI.
Peat bogs were mapped from "Nytjaland" (AUI) results where they appeared to be correct by
No changes according to IINH information.

21
412 comparison with IINH vegetation map in scale 1:500 000, SPOT-5 mosaic and Image 2006.
UI performed advanced supervised classification of multispectral Image 2006 data to extract peatbogs in selected areas.
Information from AUI and IINH. Only changes due to expansion of artificial surfaces.
421 Salt marshes were provided in HiRes format by the IINH and subsequently generalised at the NLSI.
Intertidal flats were digitised from ICG maps (Hydrogr. dept.) where they exist, from SPOT images if acquired at low tide and by consultancy with specialists at the UI.
No changes according to IINH information.
423 No changes exept where port areas have changed (one occurrence).
5. Water
511 Water courses and water bodies are taken from the NLSI IS 50V database and generalised for CLC2006. The National Power Company, NPC, provided information on reservoir lakes and changes of these since last updates of IS 50V.
Comparison of IMAGE2006 and IMAGE2000. Many changes in 511 due to instable glacial rivers continu-ously changing their courses. Few changes of 512.
512
521 Basic information from UI. Contours of costal lagoons mapped from IS 50V database and generalised at the NLSI.
Information on estuaries were provided by IFF and vectorised and integrated at NLSI. Supporting literature and remarks on 521 as well as 522 was provided by UI.
The coastline was acquired from IS 50V database and IMAGE2006. Generalised at the NLSI to fulfill the CLC requirements.
Comparison of IMAGE2006 and IMAGE2000. Only one change discovered.
522
Comparison of IMAGE2006 and IMAGE2000. Changes in several glacial rivers estuaries.
523 Comparison of IMAGE2006 and IMAGE2000. Changes at the south coast due to floods in glacial rivers.
5.3. VERIFICATION OF THE CLC RESULTS
All institutions that provided data to the CORINE project also verified the results with regard to their data or areas of interest. On this note, classification results for Level 1 class Artificial surfaces were sent to all 78 municipalities for verification and correction where necessary before being sent back to the NLSI where the database was consequently updated. Likewise, the IINH verified its data on classes 411, 412 and 421. The NEA verified the glaciers and the IFS verified all forest classes and tree plantations.
5.3.1. Verification of the CLC2006 results
The CLC2006 implementation in Iceland was to a large extent done manually by several interpreters vectorising the classes on a computer monitor by overlaying maps and other types of georeferenced data. Each interpreter was working individually within one of the 78 municipalities and finishing it before going to the next one. The database implementation was finalised in October 2008 and consequently the members of the national team spent some 6 weeks on cross-checking each other´s results, i.e. the interpreters revised each other´s work by looking for and eliminating mistakes and ensuring consistency of the entire work.
The CLC technical team undertook two verification missions to Iceland in 2008: 25. – 28. March and 2. – 4. July. Both missions took place before the CLC2006 classification work had been completed. For the first verification three individual data layers had been produced:

22
• Layer 1 included all classes under Level 1 class Artificial surfaces and moreover, classes 211, 335, 411, 423, 511, 512, 521 and 522.
• Layer 2 included all classes related to forest and tree plantations (31x and 324).
• Layer 3 included all semi-natural classes except forests, i.e. 321, 322, 332, 333 and 412 that are exactly the most problematic Nytjaland classes.
The result of the first verification was the following: Layer 1 was accepted, layer 2 was conditionally accepted and layer 3 was rejected [18].
In the second verification the data showed great improvement compared to the results presented for the first verification. Only minor technical problems were discovered. Thematic problems found were only locally important, very few systematic problems were found. Both delineation and thematic detail was usually very good. Sporadically missing features, imprecise delineation, mistyped codes and mixing up of classes were found. The database was generally accepted by the Technical Team [19].
The errors found in the second verification mission were reviewed and corrected by the national team. They could almost entirely be attributed to the fact that the national team didn´t have enough time to verify the results before the visit of the CLC Technical Team.
5.3.2. Verification of the CLC-Change and CLC2000 results
As in the CLC2006 case, the CLC-Changes and CLC2000 results were verified by institutions and municipalities providing the data. Also the members of the national team spent some time on cross-checking each other´s results.
The CLC technical team visited Iceland in March 2009 to verify the CLC-Change and CLC2000 results and spent two days on examining the data in 14 working units that the country had been devided into [12]. The overall evaluation was estimated as good; the results in 10 of the working units were accepted but four needed some improvements. These improvements were mainly concerning changes in natural phenomena; i.e. between the following classes; 331-512, 331-511, 335-332, and 335-331.
Altogether, the CLC technical team made many remarks (a total of several hundred). All these remarks were reviewed by the national team after the visit. Many of the remarks indicated concrete errors that were promptly corrected. Some of the remarks, however, were not justified, probably owing to the poor quality of the IMAGE2000 data in many parts of Iceland and limited knowledge of some typical natural processes in the country, i.e. the continuously changing glacial river beds on the large outwash planes.
After final corrections of all mistakes and errors the CLC2000 and CLC-Changes databases were uploaded on the Central Data Repository (CDR) at EEA along with the new and corrected version of the CLC2006 database. The database technical acceptance for Iceland was issued on June 26, 2009 [13].

23
6. RESULTS OF THE CLC2006 CLASSIFICATION CLC2006 is the first detailed land use / land cover classification to be completed in Iceland that comprises the whole country. Land cover is characterised by 32 out of the 44 CLC classes where semi-natural surfaces dominate (see table 3.1.). 16 land cover classes are very small or even infinitesimal in size as they almost disappear due to CORINE classification constraints (25 ha MMU and 100 m minimum width of linear features). These 16 classes occupy less than 100 km2 each and are therefore smaller than 1 promille of the country´s total area (103.440 km2). The 5 largest classes on the other hand make up almost 90% of the total area of the country.
The statistical results of the CLC2006 classification in Iceland are given in figure 6.1. and table 6.1. The pie chart of figure 6.1. shows total areas (in km2) and percentage areas (in %) of all 32 CLC classes in Iceland. Additionally table 6.1. depicts the number of mapped polygons for each class.
Fig. 6.2. on the next page shows the CLC2006 map of Iceland. Most obvious classes are the large glaciers (white), the barren lava and ash deserts of the Neovolcanic zone and the yellowish colour of class 322 Moors and heathland which also comprises moss and lychen covered areas. Also compare Figure 6.2. with the geological map in figure 4.1.
Figure 6.1. CLC2006 results for Iceland. The graph shows total area (km2) and percentage area (%) of all 32 CLC classes in Iceland.

24
Figure 6.2. CLC2006 map of Iceland. Most obvious classes are the large glaciers (light grey), the barren lava and ash deserts of the Neovolcanic zone (grey) and the yellowish colour of the largest class of the country, moors and heathland. See also geological map of Iceland in Figure 4.1.

25
CLC class CLC2006 results
Class Name km² % of total # polygons
112 Discontinuous urban fabric 99,10 0,10 110
121 Industrial or commercial units 66,94 0,06 91
122 Roads and associated land 1,34 0,001 1
123 Port areas 10,60 0,01 26
124 Airports 26,88 0,03 15
131 Mineral extraction sites 14,05 0,01 23
132 Dump sites 0,47 0,0005 1
133 Construction sites 24,71 0,02 27
141 Green urban areas 16,35 0,02 20
142 Sport and leisure facilities 135,51 0,13 216
211 Non-irrigated arable land 20,62 0,02 34
231 Pastures 2452,23 2,37 1936
242 Complex cultivation pattern 50,21 0,05 126
311 Broad-leaved forest 229,06 0,22 174
312 Coniferous forest 16,85 0,02 34
313 Mixed forest 67,82 0,07 71
321 Natural grassland 2884,66 2,79 1899
322 Moors and heathland 35984,76 34,79 2004
324 Transitional woodland/shrub 263,85 0,26 376
331 Beaches, dunes, and sand plains 3168,54 3,06 831
332 Bare rocks 23694,10 22,91 1419
333 Sparsely vegetated areas 13450,87 13,00 3853
335 Glaciers and perpetual snow 10900,53 10,54 185
411 Inland marshes 386,84 0,37 121
412 Peatbogs 6503,92 6,29 2343
421 Salt marshes 26,28 0,03 32
423 Intertidal flats 559,05 0,54 185
511 Water courses 819,20 0,79 74
512 Water bodies 1222,29 1,18 829
521 Coastal lagoons 270,45 0,26 68
522 Estuaries 73,85 0,07 21
523 Sea and ocean (not included) 139318 1
Total: 103441,93 100,00 17145 Table 6.1. CLC2006 results for Iceland. The table shows total area (km2), percentage area and number of mapped polygons for all 32 CLC classes in Iceland. The smallest classes, 122 Roads and 132 Dump sites are only 1 and 2 polygons respectively. The largest class, 322, Moors and heathland, that covers 35% of the country is divided into 2004 polygons or 12% of the total number of polygons whereas the third largest class, 333 Sparsely vegetated areas with 13% of the total area, has 3853 polygons or almost 22,5% of their total number.

26
6.1. SOME DETAILS OF THE CLC2006 RESULTS
In the following pages the results of the CLC2006 classification in Iceland and particular character-istics and occurrences that might seem unusual or strange are discussed for all five Level 1 classes.
6.1.1. Level 1 class 1. Artificial areas, 0,38% of the total area of Iceland
Subdivision of the Level 1 class 1. Artificial areas into surface classes and their areas is listed in figure 6.3. Artificial areas cover 0,38% of the total area of the country. The largest surface types are 142 Sport and leisure facilities (mostly settlements of summer houses) and 112 Discontinuous urban fabric.
Continuous urban fabric (111) doesn´t exist in Iceland when CORINE condition of 25 ha minimum mapping unit is applied.
There is no rail network in Iceland and the road system (122) consists almost entirely of roads with only one lane in each direction. Hence all roads are omitted in the CLC database except a segment of the highway from Reykjavik to the international airport in Keflavik in SW-Iceland. The area of class 122 roads is only 1,34 km2. This class is a single polygon in the CLC database.
The smallest CLC class in the country is 132 Dump sites with an area of only 0,47 km2. Only one dumpsite, close to Reykjavik, is large enough to stay in the database.
Figure 6.4. shows the distribution of class 1. Artificial areas in Iceland. Almost all urban areas are at the coast. More than 60% of the inhabitants live in Reykjavik and adjacent cities in SW-Iceland. Small inland patches of artificial surfaces are mostly areas or settlements of summer houses (classified as 142 Sport and leisure facilities).

27
Figure 6.3. Pie chart showing the division of Level 1 class 1. Artificial areas into 10 Level 3 surface classes. Class 111 does not exist in Iceland.
Figure 6.4. Spatial distribution of Level 1 class 1. Artificial areas in Iceland. Almost all urban areas are at or near the coast. More than 60% of the inhabitants live in Reykjavik and adjacent cities in SW-Iceland. Small inland patches of artificial surfaces are mostly areas of summer houses, but some are power plants (hydro or geothermal).

28
6.1.2. Level 1 class 2. Agricultural areas, 2,4% of the total area
Level 1 class 2. Agricultural areas cover 2,4% of the country and consist of only three surface types: 231 Pastures (97% and 2.452 km2), 211 Non-irrigated arable land (0,8% and 20,6 km2) and 242 Complex Cultivation Patterns (2%).
Class 211 consists mostly of potato fields and fodder crops (barley). Individual fields are usually small (only several hectares) and scattered. Therefore, many of them must be ommitted in the CLC classification or generalised together with class 231 to form class 242 (see further down). The total area of this class in the CLC database is only 20,6 km2, but its actual size is 41,7 km2 according to the records of the Farmers Association.
Class 231 is defined in chapter 4.2.2. It comprises almost all agricultural land in the country.
Class 242 is generally a mixture of classes 211 and 231, i.e. small patches of class 211 adjacent to polygons of class 231 (with at least 25% contribution of class 211 to the total area of the final 242 polygon according to the CLC generalisation rules). In several places class 242 comprises agriculture in conjunction with local geothermal areas and consists of scattered houses with greenhouses and open air cultivation. The total area of class 242 is only 50 km2.
The pie chart in Figure 6.5. shows the division of class 2. Agricultural areas into the 3 surface types (where classes 231 and 242 are of course hardly visible). Figure 6.6. shows the agricultural areas in Iceland that are almost entirely confined to the lowlands below 200 m elevation.

29
Figure 6.5. Division of Level 1 class 2. Agricultural areas in the 3 relevant surface classes in Iceland. Almost all agricultural areas are pastures (97,2%). Class 211 is only 20,6 km2 in the CLC results but considerably larger in reality. It consists mostly of small and scattered fields and hence almost half of this class must be discarded in the CLC classification. Class 242 compensates for this effect as it is a mixture of classes 211 and 231.
Figure 6.6. Spatial distribution of Level 1 class 2. Agricultural areas in Iceland. Only three Level 3 agricultural surface classes exist in Iceland of which pastures are more than 97%. Most agricultural areas are confined to main walleys and the lowlands in western and south-western Iceland below 200 m elevation.

30
6.1.3. Level 1 class 3. Forest and semi-natural areas, 87,6% of the total area
Level 1 class 3. Forest and semi-natural areas is by far the largest CLC class in Iceland. It comprises almost 88% of the total area of the country. The four largest surface types in Iceland belong to Semi-natural areas.
Forest classes and tree plantations. It is assumed that prior to human settlement in the 9th and 10th century, trees covered about 30 – 40% of the island. Today, however, only small patches of the original birch forests are left. The sum of all forest classes and tree plantations (311, 312, 313 and 324) is only 578 km2 or 0,56% of the total area of the contry. An ambitious reforestation program is currently in progress.
Semi-natural surfaces. The 4 largest surface classes in Iceland all belong to class 3. Semi-natural surfaces. These 4 classes are:
• 322 Moors and heathland (35% of the total area of the country), • 332 Bare rocks (23%), • 333 Sparsely vegetated areas (13%) and
• 335 Glaciers (10,5% of the total area).
The total area of these 4 classes is 84.030 km2 or 81,2% of Iceland.
Barren and sparsely vegetated areas consist of 3 classes: 331, 332 and 333. These classes make up 40.313 km2 or 39% of the total area of the country. Comparison of the CLC2006 result in figure 6.2. and the geological map in figure 4.1. shows that these classes are to a great extent within the Neovolcanic zone. Other barren surfaces are the mountaineous areas in north-western, northern and eastern parts of the country as well as the extensive glacio-fluvial sand planes close to the largest glaciers.
Figure 6.7. and figure 6.8. show the division of Level 1 class 3. Forests and semi-natural surfaces into surface classes and the distribution of these surface classes in Iceland respectively.

31
Figure 6.7. Division of Level 1 class 3. Forests and semi-natural areas into surface classes.
Figure 6.8. Distribution of Level 1 class 3. Forests and semi-natural areas in surface types in Iceland. Forests and semi-natural areas cover 87,6% of the country but forests and tree plantations are only 0,64% of class 3.

32
6.1.4. Level 1 class 4. Wetlands, 7,2% of the total area
Level 1 class 4. Wetlands occupy 7,2% of Iceland. Of this class 87% have been classified as 412 Peatbogs although this class includes types of bogs other than pure peatbogs (see discussion in chapter 4.2.3.). Figure 6.9. depicts the subdivision of wetlands into 4 surface classes (class 422 Salines does not exist in Iceland) and lists total areas of each class. Figure 6.10. shows the distribution of class 4. Wetlands in Iceland.
The necessary data for class 411 Inland marshes were provided by the Icelandic Institute for Natural History (IINH). This class only occurs in restricted areas mainly in the lowlands close to the largest rivers and cannot be separated from 412 by image interpretation. Its total area is 387 km2.
The definition of class 412 Peatbogs is discussed in chapter 4.2.3. This class, along with 411, can most often be identified on multispectral satellite imagery. Its total area is 6.504 km2 and it occupies 87% of all wetland area in the country.
Class 421 Salt marshes is of very limited spatial extent in Iceland. All occurrences of this surface class are known and have been investigated and mapped by researches of the University of Iceland and the IINH. In many locations 421 is confined to very narrow strips that don´t fulfill the 100 m minimum width of mapped features. Total CLC area is 26 km2 although its HiRes area is considerably greater.
Class 423 Intertidal flats. The coastline of Iceland on a 1:100 000 scale is many thousands kilometers long but the intertidal flats are mostly too narrow to be mapped for the CLC database. Only their occurrences in W-Iceland where the tidal differences are greatest (> 4 meters) and some large mud planes in SE-Iceland are of importance to the CORINE mapping. Intertidal flats in the CLC-results are 559 km2 and 7,5% of the wetlands.

33
Figure 6.9. Division of Level 1 class 4. Wetlands in four surface classes in Iceland. Wetlands classified as 412 Peatbogs are 6.504 km2 in area and occupy 87% of all wetland area in the country.
Figure 6.10. Distribution of Level 1 class 4. Wetlands in Iceland. Wetlands are mainly confined to several large areas outside the Neovolcanic zone (see figure 4.1.) and consist of numerous relatively small polygons. The mean area of peatbogs in Iceland is only 2,6 km2. The wetland areas therefore appear very patchy.

34
6.1.5. Level 1 class 5. Water, 2,3% of the total area
Level 1 class 5. Water occupies 2,3% of the total area of Iceland. About half of all water surfaces are 512 water bodies and 34% belong to class 511 water courses. Figure 6.11. depicts the division of wetlands into surface classes and lists total areas of each class. Figure 6.12 shows the distribution of the water classes in Iceland.
All four water classes are small in spatial extent compared to the total area of Iceland and therefore tend to be underestimated in the generalised CLC database. A comparison between the water classes in the CLC2006 database on one hand and the HiRes inland use database on the other hand is shown in table 6.2.
Class
CLC2006 HiRes database
No. of polygons Total area (km2) No. of polygons Total area (km2)
511 74 819 2500 ?
512 829 1222 24.326 1737
521 68 270 94 350
522 21 74 2500 ?
Table 6.2. Comparison between the water classes in the CLC2006 database and the HiRes inland use database showing the enormous reduction of polygons in the CLC2006 database due to CORINE conditions of 25 ha minimum mapping unit. Direct comparison between the total areas for classes 511 and 522 is not possible because many rivers are displayed as vector lines in the HiRes database.

35
Figure 6.11. Division of Level 1 class 5. Water into the four Level 3 water classes in Iceland (class 523 Sea and ocean is excluded). All the water classes are small and therefore tend to be underestimated in the CLC results due to the classification constraints.
Figure 6.12. Spatial distribution of Level 1 class 5. Water in Iceland. Almost all the rivers that remain in the CLC database after generalization are the country´s largest glacial rivers. These rivers, however, are discontinuous.

36
7. RESULTS OF CLC-CHANGE AND CLC2000 The results of the CLC2000 and CLC-Change are represented in tables 7.1. and 7.2. and figures 7.1. and 7.2. on the next pages.
Table 7.1. shows areas (in km2) and relative sizes (in %) of all CLC classes in Iceland for CLC2006 as well as CLC2000. The last four columns show how much individual land cover classes have decreased or increased from 2000 to 2006 and the absolute (in km2) and relative (in %) change in the resulting area of each class. Some classes show both increase and decrease as they expand in some areas and shrink in other places, but other classes either solely increase or decrease. It is particularly true for the artificial surfaces that most of them only increase.
Figure 7.1. displays graphically the areal changes in all land cover classes between 2000 and 2006 (the values in the next to last column in table 7.1.) and table 7.2. shows the nature of the changes, i.e. from which class in 2000 to which class in 2006 the changes are confined.
Figure 7.2. shows the spatial distribution of the mapped land cover changes in Iceland between 2000 and 2006.
7.1. GENERAL REMARKS
Between 2000 and 2006 some 0,62% of Iceland changed its land cover. The most prominent land cover changes occur in class 3 Forests and semi-natural surfaces which is self-evident as class 3 comprises all the largest surface classes in the country. On the other hand there are four surface classes that do not change over this 6 years period of time. These classes are; 124 Airports, 312 Coniferous forests, 411 Inland marshes and 421 Salt marshes.
The largest land cover change was the conversion from glacier ice to bare rocks due to melting of the ice caps in the last years. Between 2000 and 2006 the glaciers shrinked by 180 km2 or 1,63% which is an annual reduction of 0,27%.
Another typical land cover change in Iceland is the conversion of 331 Beaches, dunes and sand planes to 511 Water courses and vice versa due to the natural instability of braided glacial rivers that tend to change their channels regularly resulting in a classification of the very same areas either as sand (331) or as water courses (511) depending on the current. position of the rivers. Class 331 increases by 172 km2 and decreases by 159 km2 between 2000 and 2006 while the total areal change is an increase of only 3,2 km2.
Several land cover classes under Artificial surfaces increased considerably; 112 Discontinuous urban fabric by 10%, 121 Industrial and commercial units (20%) and 142 Sport and leisure facilities (15%) but the largest change recorded was in 133 Construction areas which increasd by 1055%. This increase is mainly due to several construction sites for new residential and industrial districts in the capital area and a new hydropower plant in eastern Iceland.

Table 7.1. Results of CLC2006, CLC2000 and CLCResults of CLC2006, CLC2000 and CLC-Change in Iceland.
37

38
Figure 7.1. CORINE land cover changes in hectares between 2000 and 2006. The graph displays the results of the next to last column in table 7.1. It is evident that the largest changes occur in class 3. Forests and semi-natural areas, but big changes in some surface classes under class 1. Artificial surfaces are also remarkable (see further in text).

39

40
112 121 122 123 124 131 132 133 141 142 211 231 242 311 312 313 321 322 324 331 332 333 335 411 412 423 511 512 521 522 523 total area112121122123124131132133 183 31 214
141 12 43 56
142 10 10
211231 58 125 32 144 28 261 25 81 92 21 867
242311 19 32 51
312313 28 28
321 115 36 160 44 26 42 528 952
322 462 763 134 6 33 21 1639 80 1268 55 37 87 2671 72 55 7384
324 21 18 9 49
331 113 15036 147 516 74 15886
332 129 12 185 208 2948 108 3589
333 6 15 113 7 58 922 125 239 17 22 25 1552
335 2007 14552 89 909 411 17967
411412 6 186 106 5 47 81 82 514
423 6 6
511 14277 44 14321
512 397 251 31 28 708
521522 105 14 120
523 7 20 48 415 35 43 569
total area 876 1116 134 90 92 21 2480 109 1747 86 110 349 922 125 3819 17219 14803 3093 15282 1264 411 559 132
200620
00
Table 7.2. Land cover changes in Iceland between 2000 and 2006. The table shows the nature of all land cover changes, i.e. from which class in 2000 to which class in 2006 the changes are confined. The lines reveal how much of a certain land cover class in 2000 (in hectares) had changed to another class in 2006. The columns display how much of a certain land cover class in 2006 had changed from other classes after 2000.

41
Figure 7.2. Spatial distribution of land cover changes in Iceland between 2000 and 2006. The most obvious changes are due to melting (decrease) of the icecaps and spatial fluctuations of some of the glacial rivers.
7.2. ANALYSIS OF CLC 2000 - 2006 CHANGES
Some 0,62% of Iceland changed its land cover between 2000 and 2006. The spatial extent of 27 out of 31 land cover classes in 2000 either increases or decreases or both. One new class, 122 Roads, was introduced in 2006 and hence there are 32 classes in the CLC2006 database. The total area increase is 647,1 km2, but the total decrease is 642,9 km2, which means that the area of Iceland increases by 4,2 km2 in the time interval 2000 – 2006. The reason for this is a local shift in the coastline at the estuaries of some of the largest glacial rivers due to deposition of sediments. In the following paragraphs some details of CLC changes in all Level 1 classes are discussed and analysed.
7.2.1. Artificial surfaces
The small share of artificial areas (0,36%) might indicate that a large part of the Icelandic population lives outside urban fabric areas. This however is not true; some 245.000 people or 74% of the 330.000 population live in the 12 largest towns or villages with more than 4000 inhabitants. 11 of those 12 residential areas are situated in the SW-quarter of the country.
Reykjavík, the capital and largest city in Iceland has 119.000 inhabitants and the second largest one; Kópavogur, has 30.000 inhabitants. Alltogether the capital area comprises 7 municipalities where the urban areas are all connated. The total population of this largest by far urban area is 200.000 or 60% of the total population of the country.

42
Class 111 Continuous urban fabric does not exist in Iceland if the CORINE requirement of 25 hectares MMU is to be fullfilled.
112 Discontinuous urban fabric. There are 108 occurrences of class 112 in 2000. The total area of this class increases by 8,76 km2 from 90,1 km2 in 2000 to 99,1 km2 in 2006. The increase is 10% and is confined to 33 places in 22 urban areas. 85% of the change polygons (or 28 of 33) are in the SW-quarter of Iceland whereof 16 are situated in the capital area.
121 Industrial and commercial units. There are 84 occurrences of class 121 in the year 2000 making up a total area of 56,1 km2. In 2006 the total number of polygons is 91 and the area has increased to 66,9 km2. Thus the total area of class 121 increases by 19,3% between 2000 and 2006, mainly in the SW-part of Iceland.
122 Roads. There are no roads in the CLC2000 database due to the 100 m minimum width requirement. In CLC2006 a part (1,34 km2) of the highway between Reykjavík and Keflavík international airport is the single mapped polygon of the Icelandic road network (one polygon).
123 Port areas. Most of the ports in Iceland are small fishery ports and much smaller than 25 ha. Hence, they are mostly generalised into class 121 (the larger adjoining area of fish processing industry) to make up a mappable unit. In 2006 there were 27 port areas but only 26 in 2006 due to merging of port polygons in the capital area. Port areas were enlarged in five places mainly with new piers. The total area was enlarged by 9,28% from 9,7 km2 in 2000 to 10,6 km2 in 2006. One new port was built between 2000 and 2006 in E-Iceland in connection with a new aluminium smelter.
124 Airports. There are 11 airports in Iceland (with a total area of 26,9 km2) for international and regular domestic flights. No change was registered in this class between 2000 and 2006.
131 Mineral extraction sites. All class 131 sites are gravel and/or sand mines and most of them are too small to be mapped (< 25 ha) in the CLC project. There are 21 gravel mines in 2000 and two more or 23 in 2006. Their total area increased from 13,1 km2 to 14,1 km2 in the 2000 – 2006 time span. The increase is 7,09%.
132 Dump sites. Most dump sites are very small and only one site exceeds the 25 ha limit. It serves the Reykjavik capital area. The total area increased by almost 81% between 2000 and 2006, from 0,26 km2 to 0,47 km2. This great percentage increase is of course only an effect of the small size of this class (the total spatial increase is only 0,21 km2).
133 Construction sites. There are only 5 polygons of class 133 in 2000 but this number has increased to 27 in 2006. The total area immensely increases between 2000 and 2006, from 2,14 km2 to 24,71 km2, an increase of 1055%!! The construction sites in 2006 are mainly new residential and commercial districts in the Reykjavik capital area, but also the site of a new hydropower plant in E-Iceland.
141 Green urban areas. Class 141 comprises 20 polygons in 2006 and increases from 15,8 km2 in 2000 to 16,4 km2 in 2006. The increase is 3,35%.
142 Sport and leisure facilities. There are 216 polygons of class 142 present in 2006 and have grown in number by 20 since 2000. The total area increases from 118,2 km2 to 135,5 km2 which is an increase of 14,6%. The reason for this increase is mainly new areas of summer houses and golf courses.
7.2.2. Agricultural areas

43
211 Non-irrigated arable land. Class 211 is a very small class in Iceland. It consists essentially of small and scattered fields (generally potatoes and fodder crops). Individual fields are usually small (only several hectares) and scattered. Therefore, many of them must be ommitted in the CLC classification. New fields and increase in size of existing ones are also small and scattered and therefore only partly included in the CLC-Change. CLC class 211 km2 increased from 19,77 to 20,62 km2 in the 2000 - 2006 time interval. That is an increase of 4,30%.
231 Pastures. Pastures in Iceland are composed of hayfields and grazing areas whereof the hayfields have been carefully mapped (can easily be identified on aerial photographs and high resolution satellite images) but grazing areas had not been mapped at all. Traditionally grazing of sheep and horses (and also cattle) is not confined to fenced areas but comprised practically all vegetated land in the country. Sheep are driven into the mountains in spring and rounded up again in the autumn and kept indoors during winter. It is almost impossible to obtain solid information on all land parcels used extensively for grazing without consulting every farmer in the country. Hence class 231 in Iceland is simply defined (after consultancy with the CLC technical team) as surrounding areas of farms that can be delineated on high resolution satellite images or aerial photographs by following regular structures such as drainage ditches, fences and roads. Some of these areas are presumably not extensively grazed except in spring or autumn and some might not be grazed at all. As a result the mapped changes of pastures are limited to the changes of other land cover classes directly affecting the spatial extent of this class. It is expected that better information will be available in near future in cooperation with the Farmers Association. The overall recorded change is a decrease of only 7,38 km2 (from 2459,6 km2 to 2452,2 km2) or 0,3%.
242 Complex cultivation pattern. Class 242 is a small class, generally a mixture of classes 211 and 231, i.e. small patches of class 211 adjacent to polygons of class 231, but in several places it comprises agriculture in conjunction with local geothermal areas and consists of scattered houses with greenhouses and open air cultivation. The total area of class 242 was 46,7 km2 in 2000 and had grown to 50,2 km2 in 2006, which is an increase of 7,5%.
7.2.3. Forests and semi-natural areas
311 Broad leaved forest. Class 311 consists mainly of remnants of the original birch woods in Iceland. Its total area was 229,6 km2 in 2000 and had been reduced by 0,5 km2 in 2006 (0,23%) due to new residential estates and areas of summer cottages.
312 Coniferous forest. Coniferous forests cover 16.85 km2. No change was registered in this class between 2000 and 2006.
312 Mixed forest. Mixed forests covered 68,1 km2 in 2000 and had decreased by 28 hectares in 2006 due to an increase in class 142 (summer houses).
321 Natural grassland. Grasslands are widespread throughout the country, mainly in the lowlands and on mountainsides. There were several changes to (revegetation) and from (new artificial areas and tree plantations) class 321 between 2000 and 2006 but the net areal change was a decrease of only 0,04%, from 2885,84 in 2000 to 2884,66 in 2006.
322 Moors and heathland. 322 is by far the largest land cover class in Iceland. It covered 35985 km2 or 34.8% of the country in 2006. The area of class 322 was reduced by some 72 km2 between 2000 and 2006 (a decrease of only 0.2%). This decrease is mainly due to new artificial areas (i.e. classes 112, 121, 133 and 142) and new tree plantations (class 324).
324 Transitional woodland/shrub. Class 324 consists mainly of new tree plantations but an ambitious reforestation program is now in progress. The total area of class 324 was 226 km2 in 2000 and increased to 264 km2 in 2006 (16.7% increase). This increase is mainly at the expense of classes 321 and 322).

44
331 Beaches, dunes and sand planes. Class 331 comprises sand and gravel plains which occur by the coast, and close to glaciers, glacial rivers and lakes. These planes are flat and without any distinct morphology or texture but can be characterised by braided riverbeds that may either be dry or wet. This class also includes volcanic ash fields of recent volcanic activities inside the neovolcanic zone. The total area of class 331 was 3165,4 km2 in 2000 and it increases by 172 km2 and decreases by 159 km2 between 2000 and 2006 while the net areal change is an increase of only 3,2 km2 (0,1%). The reason for these changes is the natural instability of braided glacial rivers that tend to change their channels regularly resulting in a classification of the very same areas either as sand (331) or as water courses (511). Also the quantity of water carried by the glacial rivers is variable from one year to another depending on weather conditions. Therefore, an increase in the area covered by glacial rivers means a decrease in the areas classified as sand planes (class 331) and vice versa.
332 Bare rock. Class 332 comprises all types of barren land not included in 331. These are barren lava flows and rocky areas but also undular hilly areas, formed during the ice age and morphologically older than 8.000 – 10.000 years. Class 332 is the typical surface class of the Neovolcanic Zone in the highlands. Its total area was 23580 km2 in 2000 but was enlarged to 23694 km2 in 2006. Class 332 decreased by 36 km2 (turned to 333 through revegetation efforts) and increased by 148 km2 because of general retreat of the glaciers gradually bringing more barren land to appearance. Overall areal change is an increase of 114 km2 (0,48%).
333 Sparsely vegetated areas. Class 333 is a large surface class in Iceland. It is especially abundant in the highlands above 300 meters height and within the Neovolcanic Zone. The total area was 13435 km2 in 2000 and 13451 km2 in 2006. It decreased by 15,52 km2 (basically due to revegetation, new tree plantations and construction areas) and increased by 30,93 km2, mainly from 332. The net change was an areal increase of 16 km2 (0,12%).
335 Glaciers and perpetual snow. Glaciers cover 10,5% of Iceland. The area of class 335 was 11082 km2 in 2000 and decreased to 10901 km2 in 2006. This decrease amounts to 180 km2 and 1,63% or a yearly rate of almost 0,3%. Increase in classes 331, 332, 512 and 521 compensate for the glacier decrease caused by melting due to warmer climate conditions in the last decades.
7.2.4. Wetlands
411 Inland marshes. Inland marshes are only some 5% of all wetlands in Iceland. Their total area is 387 km2. No change was registered between 2000 and 2006.
412 Peat bogs. Peat bogs are 87% of the wetlands and 6,3% of the total area of Iceland. They covered an area of 6509 km2 in 2000 but decreased by some 5 km2 until 2006 (only 0,08%) due to new artificial areas (133 and 142) and tree plantations.
421 Salt marshes. Salt marshes are a very small class in Iceland. Their total area is 26,3 km2 and no change was registered between 2000 and 2006.
423 Intertidal flats. The coastline of Iceland can be estimated to be roughly 6500 km in length but its greatest portion consists of moderately steep or very steep rocky shores. Hence the intertidal flats are mostly too narrow to be mapped for the CLC database. Of importance to the CORINE mapping are only their occurrences in W-Iceland where the tidal differences are greatest (3.5 - 4 meters) and some large mud planes in SE-Iceland. The total area of CLC class 423 is 559 km2 and it decreased by only 6 hectares until 2006 due to a an increase in one port area (123).
7.2.5. Water bodies

45
511 Water courses. Most of the rivers in Iceland are too narrow to be mapped for CORINE. The wide rivers are predominantly glacial rivers that are instable in nature and tend to change their channels regularly where they run across the great alluvial planes (class 331) in the vicinity of the largest glaciers. This class therefore shows the same behaviour as 331 concerning changes; its area increases by 153 km2 and decreases by 143 km2 between 2000 and 2006 resulting in a net areal increase of only 19 km2 or 2,4% (from 800 km2 to 819 km2).
512 Water bodies. The total area of class 512 increases from 824 polygons and 1218 km2 in 2000 to 829 polygons and 1222 km2 in 2006. The net areal increase is 4,5 km2 (0,37%) that predominantly takes place at the borders of glaciers where small lakes normally enlarge as the glaciers retreat. The most abundant change is 335 > 512.
521 Coastal lagoons. There are 68 mappable coastal lagoons for the CLC database. Their total area was 266 km2 in 2000 and increased to 270 km2 in 2006 (1,55% increase). This increase is confined to one location and is a result of the retreat of the glacier tongue from Breiðamerkurlón-lagoon at the south coast of Iceland.
522 Estuaries. Just like most of the rivers in Iceland are too narrow to be mapped the same is true for the estuaries. Only 21 estuaries are in the CLC database. Their total area was 69 km2 in 2000 and increased to 74 km2 in 2006 that is a 7,1% increase. The changes are confined to several glacial rivers and the reason is (as explained above for 331 and 511) the instability of this type of rivers. The changes are mainly 331 > 522 and 522 > 331.
523 Sea and ocean. The outer limits of the ocean area around Iceland form a rectangle defined by four arbitrary points. The inner limits are the simplified coastline from the 1:50 000 database of the NLSI. The coastline changed at several places adjacent to estuaries of glacial rivers between 2000 and 2006 due to sedimentation resulting in a net increase of the total area of Iceland from 103.438 km2 to 103.442 km2 (4,34 km2 increase).

46
8. FINANCIAL REPORT As the CLC2006 was the first CORINE mapping in Iceland the standard CLC2000 cost model of the EEA was applicable as the CLC2006 cost model for Iceland. According to this model the cost (in €) is as follows:
Total area of Iceland (km2) 102.820
Total cost for Iceland, 3,13 €/km2 ( € ) 322.000
Cost covered by EEA centralised services ( € ) 67.000
Maximum EEA financial contribution ( € ) 94.000
Minimum cost covered by Iceland ( € ) 161.000
Table 8.1. Total cost of the CLC2006 mapping in Iceland (first CLC mapping in the country) according to the standard CLC2000 cost model.
According to the standard CLC2000 model the total cost for Iceland is €322.000 whereby the minimum cost covered by Iceland is 50% or €161.000.
Preparatory work for the CLC2006 mapping started in 2005 with a experimental classification on a 1500 km2 test area. The project work then continued through the year 2006 and consequently the NLSI had invested several man months in the project until the end of 2006.
According to estimations based on the experience gathered in 2005 - 2007 the total national contribution for the generation of the CLC2006 for Iceland was supposed to be somewhat higher than stated in Table 3 or €180.000 instead of the €161.000 cost minimum.
This plan changed drastically by the end of 2007 when it was clear that one of the most important datasets for the CLC2006, the Nytjaland classification results of the Agricultural University, was not delivered on time. Actually it was not delivered until end of March 2008 with a delay of more than 4 months. Furthermore, this dataset turned out to be incomplete as well as erroneous and needed considerable work load to be completed. It was a full time work for 4 - 5 GIS-workers at the NLSI until October 2008 to correct and vectorise this dataset and integrate it into the CLC2006 database. The CLC2006 cost covered by Iceland is accordingly higher.
The financial crisis of 2008 struck Iceland particularly hard. Iceland is not (yet) a EU member state and still has its own currency, the Icelandic crown or IKR. The IKR was devaluated heavily in 2008, its mean value in 2008 was 128 IKR = 1 € as compared to 88 IKR = 1 € in 2007. In 2009 things got even worse and the IKR still continued to weaken. In the first half of 2009 (until the end of the CLC-mapping) one Euro was worth 164 IKR. As stated above the work load for CLC2006 was significantly higher than the standard cost model suggested but on the other hand it has to be regarded that the drastic devaluation of the IKR compensates largely for the higher costs, if calculated in euros, resulting in 10% higher total national costs than the originally planned costs of € 180.000.
8.1. Breakdown of costs for CLC2006, CLC-Change and CLC2000
In the following breakdown of costs the preparatory work in 2005 –2006 (partly research work financed by the Icelandic Research Council) is not considered to be a part of CLC2006 classification for Iceland. Only the costs in the years 2007 and 2008 are included in the following table (Table 8.2.).

47
The costs for CLC2006 are as much as 87% personnel costs and 11,5% were spent on data from sub-contractors. The rest is travel and subsidence costs.
CLC2006, breakdown of costs 2007 1 € = 88 IKR, 1 MM = 3750 €
Costs of personnel assigned to CLC2006 31 Man-Months (MM) at the NLSI, @3750 €/MM
Total personnel costs: 31 x 3750 €/mm = 116.250 €
Travel and subsidence costs Only several short inland travels and meetings.
Total costs: 1.800 €
Durable equipment and stationary costs 0 €
Sub-contracting and/or transfer of funds Agricultural University of Iceland: dataset „Nytjaland“
Total sub-contracting costs 2007: 21.000 €
Acquisition of ancillary data and other direct costs
0 €
Total costs 2007 139.050 €
EEA financial contribution at time of interim report.
53% of 94.000 € = 49.820 €
National contribution 2007 89.230 €
CLC2006, breakdown of costs 2008 1€ = 128 IKR, 1 MM = 2580 €
Costs of personnel assigned to CLC2006 54 Man-Months (MM) at the NLSI, @2580 €/MM
Total personnel costs: 54 x 2580 €/mm = 139.320 €
Travel and subsidence costs Only several short inland travels and meetings.
Total costs: 1.500 €
Durable equipment and stationary costs 0 €
Sub-contracting and/or transfer of funds Forestry service: classes 311, 312, 313 and 324. Institute for Natural History: classes 411 and 421
Total sub-contracting costs 2008: 12.580 €
Acquisition of ancillary data and other direct costs
0 €
Total costs 2008 153.400 €
EEA financial contribution at time of final report.
47% of 94.000 € = 44.180 €
National contribution 2008 109.220 €
Total national contribution 2007 and 2008 198.450 €
Table 8.2. Breakdown of CLC2006 costs for 2007 and 2008 in Iceland. Because of data delivery behind schedule and highly defective data (Nytjaland) from the Agricultural University the costs for the CLC2006 turned out to be much higher than planned.
The drastic devaluation of the Icelandic currency as a consequence of the financial crisis in 2008 compensates largely for the higher costs if computed in Euros resulting in total national costs of €198.450 or 10% higher than the originally planned costs of €180.000.

48
The work on CLC-Change and CLC2000 started in the beginning of 2008 with data collection from the same public institutions and municipalities that delivered data and information for CLC2006. As with the CLC2006 classification, the work load for the CLC-Change and CLC2000 mapping was considerably higher than planned, but due to the devaluation of the Icelandic currency in 2008 compared to the Euro the total national costs were about 10% higher than the costs originally planned. The personnel costs are even higher than with CLC2006 or 96%, the rest being travel and subsidence costs for some inland meetings.
Table 8.3. lists the cost figures for CLC-Change and CLC2000 for 2008 until the end of the project in June 2009.
CLC-Change & CLC2000, breakdown of costs 2008 1 € = 128 IKR, 1 MM = 2580 €
Costs of personnel assigned to CLC-Change and CLC2000
18 Man-Months (MM) at the NLSI, @2580 €/MM
Total personnel costs: 18 x 2580 €/mm = 46.440 €
Travel and subsidence costs Total costs: 1.500 €
Durable equipment and stationary costs 0 €
Sub-contracting and/or transfer of funds 0 €
Acquisition of ancillary data and other direct costs 0 €
Total costs 2008 47.940 €
EEA pre-financing payment 10% of 27.579 € = 2.758 €
National contribution 2008 45.182 €
CLC-Change, CLC2000, costs breakdown Q1 & Q2 2009, 1 € = 164 IKR, 1 MM = 2010 €
Costs of personnel assigned to CLC-Change and CLC2000
12 Man-Months (MM) at the NLSI, @2010 €/MM
Total personnel costs: 12 x 2010 €/mm = 24.120 €
Travel and subsidence costs Total costs: 1.200 €
Durable equipment and stationary costs 0 €
Sub-contracting and/or transfer of funds 0 €
Acquisition of ancillary data and other direct costs 0 €
Total costs 2009 25.320 €
EEA financial contribution at time of final report. 90% of 27.579 € = 24.821 €
National contribution 2008 499 €
Total national contribution 2007 and 2008 45.681 €
Table 8.3. Breakdown of costs for CLC-Change and CLC2000 that lasted from beginning of 2008 to mid-2009. As in the CLC2006 case the workload for the CLC-Change and CLC2000 mapping was much higher than planned, but due to the devaluation of the IKR in 2008 compared to the Euro the total national costs of € 45.681 are only about 10% higher than the originally planned costs.

49
9. REFERENCES
[1] Árnason, K., Matthíasson, I.: CORINE Land Cover 2006 of Iceland. Grant agreement 3601/B2007.EEA53004. Final report. December 2008. National Land Survey of Iceland.
[2] http://atlas.lmi.is/corine/.
[3] CEC (1994). CORINE land cover. Technical guide. Luxembourg (Office for Official Publications of European Communities).
http://www.eea.europa.eu/publications/COR0-landcover.
[4] CORINE land cover technical guide – Addendum 2000, EEA Technical report No 40 http://www.eea.eu.int.
[5] http://www.lmi.is/sersvid/landshnitakerfi-isnet-2004/reglugerd-um-vidmidun-isn93/.
[6] Saemundsson, K.,1979, Outline of the geology of Iceland. Jökull 29 (7-28), Reykjavík.
[7] Büttner, G., Mari.,L., 2007, CLC2000/2006 training seminar report, Iceland. Mission Report, NLSI, Akranes, 29-30. May 2007. ETC-TE/Universitat Autònoma de Barcelona.
[8] Oskarsson, H., Arnalds, O., Gudmundsson, J., and Gudbergsson, G., 2004. Organic carbon in Icelandic Andosols: geographical variation and impact of erosion. CATENA 56(1-3): 225-238).
[9] http://www.nytjaland.is/landbunadur/wgrala.nsf/key2/nytjaland.html.
[10] Büttner, G., Ferance, J., 2008, CLC2006 first verification report, Iceland. Mission Report, NLSI, Akranes, 2-4. July 2008. ETC-TE/Universitat Autònoma de Barcelona.
[11] Kosztra, B., Mari.,L., 2008, CLC2006 second verification report, Iceland. Mission Report, NLSI, Akranes, 26-28. March 2008. ETC-TE/Universitat Autònoma de Barcelona.
[12] Büttner, G., Kosztra, B.; CLC2006 third verification report, Iceland. EEA subvention 2009. EEA Mission Report. 09.04.2009.
[13] Soukup, T.; CLC2006 Database Technical Acceptance, Iceland (IS), Final. EEA Report. 26.06.2009.

50
ANNEXES

51
ANNEX I:
Country Level Metadata for Iceland, CLC2006
EEA METADATA FORM FOR SPATIAL DATASETS (GIS DATA) &
EEA METADATA STANDARD FOR GEOGRAPHIC INFORMATION (EEA-MSGI V.1.1)

52
The use of the form This form should be used by EEA, ETCs, national organisations being partners in EIONET and external contractors delivering GIS-data.
GIS-data or original geodata in this context can be all data sets containing geographical coordinates – firstly commonly know GIS data formats e.g. shapefile, Arc Coverage, Geodatabase, SDE database, geotiff file, imagine-file and vpf, secondly other files which can contain location information (points) such as xls, dBASE file, access database, text files.
The form should only be used for datasets and not for maps or graphs.
The EEA metadata standard for geodata The table show a tree structure which can be used for viewing and registering metadata of spatial data sets, supplied according to the European Environment Agency – Metadata Standard for Geographic Information (EEA-MSGI). EEA-MSGI is a profile of ISO19115 (First edition) Metadata standard.
The tree has a max depth of 3 levels, which makes it easy for a user to navigate the tree.
• The field names have a description that is defined by the EEA and partly derived from the ISO descriptions.
• The fields, which contain a metadata item, are mapped with the corresponding ISO number.
• The “Max” column defines how many occurrences EEA allows in a view of one datasets metadata. N equals any number of occurrences. There may be more occurrences delivered by other metadata writers, but the EEA will only support these numbers of occurrences.
EEA reference:
Thor Jessen ([email protected])

53
Dataset metadata form mapped to ISO19115
Please fill in one metadata form for each dataset. Only lines with ISO numbers need to be filled. Predefined code lists are to be used for a few of the metadata elements.
EEA
Field name
ISO Number
EEA Description Please fill in Max
Level 1 Level 2 Level 3
Metadata on metadata
Defines the metadata on the dataset
1
Point of contact
Responsible organisation and individual for the metadata
1
Organisation name 8.376 Responsible organisation name National Land Survey of Iceland (NLSI) 1
Individual name 8.375 Responsible individual name Dr. Kolbeinn Arnason 1
Position name 8.377 The responsible individual role or position in the organisation
Project manager 1
Role 8.379 Function performed by the responsible organisation
1
Address: Delivery point 8.378.381 Address line for the location Stillholt 16 - 18 1
Address: City 8.378.382 City of the location Akranes 1
Address: State, Province 8.378.383 State, province of the location - 1
Address: Postal code 8.378.384 Postal code of the location IS-300 1
Address: Country 8.378.385 Country of the location Iceland 1
Address: E-mail 8.378.386 The electronic mail address of the responsible organisation or individual
Last modified 9 Date of the last modification of the metadata (YYYYMMDD)
20080621 1

54
Name of standard
10 Name of metadata standard EEA-MSGI/ISO19115 (First Edition) 1
Version of standard
11 Version of the metadata standard EEA-MSGI 1.1 1
Dataset identi-fication
Basic information required to identify the dataset
1
Title 15.24.360 Title of the dataset clc2006_is 1
Alternative title 15.24.361 Alternative titles of the dataset CLC2006 Iceland N
Brief Abstract
15.EEABriefAbstract
Brief abstract explaining in short the content of the dataset
CORINE Land Cover 2006 database of Iceland; 1
Abstract
15.25 An abstract explaining the content of the dataset The European Environment Agency (EEA) launched
the CLC2006 project in the framework of GMES Land Monitoring Fast Track Service/CLC2006 activities in order to update the CLC 2000 database at the reference year 2006 and to create a change database of the period 2000-2006.
CLC2006 is the first CORINE classification to be imple-mented in Iceland. CLC2000 and 2006-2000Change databases were created subsequently by back-dating of the CLC2006 results.
The project was supported by the European Environment Agency (EEA). Grant agreement: 3601/B2007.EEA53004.
In Iceland the project was co-financed by the National Land Survey of Iceland (NLSI).
1
Keywords 15.33.53 Keywords helping to classify the dataset
CLC2006, CORINE, geographic, landcover, environment, vector data, Iceland
N
Topic category 15.41 A predefined ISO category, see code list 2 underneath
010 (imageryBaseMapsEarthCover) 1
Dataset version 15.24.363 Version of the dataset Version 1. 1
Reference date 15.24.362.394
Date of last modification to the dataset (YYYYMMDD)
20090618 1

55
Reference system
Definition of the reference system used for the dataset
1
Name 13.196.207
Name of reference system ISN93 1
Datum Identity of the datum 1
Name 13.192.207
Name of datum ISN93 1
Ellipsoid Identity of the ellipsoid 1
Name 13.191.207
Name of ellipsoid GRS 80 1
Semi-major axis 13.193.202
Radius of the equatorial axis of the ellipsoid
6378137 1
Axis units 13.193.203
Units of the semi-major axis Meters 1
Flattening ratio 13.193.204
Ratio of the difference between the equatorial and polar radii of the ellipsoid to the equatorial radius when the numerator is set to 1
298.257
1
Projection Identity of the projection 1
Name 13.190.207
Name of projection Lambert Conformal Conic 2SP 1
Zone 13.194.216
Unique identifier for grid zone 1
Standard parallel 13.194.217
Line of constant latitude at which the surface of Earth and the plane or developable surface intersect
1st standard parallel: 64°15’00.00’’ N 2nd standard parallel: 65°45’00.00’’ N
1
Longitude Of Central Meridian
13.194.218
Line of longitude at the centre of a map projection generally used as the basis for constructing the projection
-19°00’00.00’’ E 1
Latitude of projection origin 13.194.219
Latitude chosen as the origin of rectangular coordinates for a map projection
65°00’00.00’’ N 1

56
False easting 13.194.220
Value added to all “x” values in the rectangular coordinates for a map projection. This value frequently is assigned to eliminate negative numbers. Expressed in the unit of measure identified in planar coordinate units
500000 1
False northing 13.194.221
Value added to all “y” values in the rectangular coordinates for a map projection. This value frequently is assigned to eliminate negative numbers. Expressed in the unit of measure identified in planar coordinate units
500000 1
False easting northing units
13.194.222
Units of false northing and false easting
Meters 1
Scale factor at equator 13.194.223
Ratio between physical distance and corresponding map distance, along the equator
-
1
Longitude of projection centre
13.194.224
Longitude of the point of projection for azimuthal projections
- 1
Latitude of projection centre
13.194.225
Latitude of the point of projection for azimuthal projections
- 1
Distri-bution information
Information about the distributors of the dataset
1
Owner 1 Information about the owner organisation
N
Organisation name 15.29.376 Name of the owner organisation European Environment Agency 1
Individual name 15.29.375 Name contact person in the owner organisation
See contract with EEA! 1
Position name 15.29.377 Position of the contact person in the owner organisation
See contract with EEA! 1
Role 15.29.379 Always “Owner” role owner 1

57
Address: Delivery point 15.29.378.389.381
Address line for the location Kongens Nytorv 6 1
Address: City 15.29.378.389.382
City of the location Copenhagen 1
Address: State, Province 15.29.378.389.383
State, province of the location K 1
Address: Postal code 15.29.378.389.384
Postal code of the location 1050 1
Address: Country 15.29.378.389.385
Country of the location Denmark 1
Address: E-mail 15.29.378.389.386
The electronic mail address of the owner organisation or individual
Information about the distributors of the dataset
Owner 2 Information about the owner organisation
Organisation name 15.29.376 Name of the owner organisation National Land Survey of Iceland (NLSI)
Individual name 15.29.375 Name contact person in the owner organisation
Mr. Magnus Gudmundsson
Position name 15.29.377 Position of the contact person in the owner organisation
Director
Role 15.29.379 Always “Owner” role owner
Address: Delivery point 15.29.378.389.381
Address line for the location Stillholt 16 - 18
Address: City 15.29.378.389.382
City of the location Akranes
Address: State, Province 15.29.378.389.383
State, province of the location -
Address: Postal code 15.29.378.389.384
Postal code of the location IS-300
Address: Country 15.29.378.389.385
Country of the location Iceland
Address: E-mail 15.29.378.389.386
The electronic mail address of the owner organisation or individual

58
Originator Information about intellectual creator (person and/or organisation with intellectual rights) of the dataset
N
Organisation name 15.29.376 Name of the creating organisation National Land Survey of Iceland 1
Individual name 15.29.375 Name contact person in the creating organisation
Dr. Kolbeinn Arnason 1
Position name 15.29.377 Position of the contact person in the creating organisation
project manager 1
Role 15.29.379 Always “Originator” role originator 1
Address: Delivery point 15.29.378.389.381
Address line for the location Stillholt 16 - 18 1
Address: City 15.29.378.389.382
City of the location Akranes 1
Address: State, Province 15.29.378.389.383
State, province of the location - 1
Address: Postal code 15.29.378.389.384
Postal code of the location IS-300 1
Address: Country 15.29.378.389.385
Country of the location Iceland 1
Address: E-mail 15.29.378.389.386
The electronic mail address of the originator/creator organisation or individual
Processor The technical producer or processor of the data
N
Organisation name 15.29.376 Name of the processor organisation
National Land Survey of Iceland 1
Individual name 15.29.375 Name contact person in the processor organisation
Dr. Kolbeinn Arnason 1
Position name 15.29.377 Position of the contact person in the processor organisation
project manager 1
Role 15.29.379 Always “Processor” role processor 1
Address: Delivery point 15.29.378.389.381
Address line for the location Stillholt 16 - 18 1
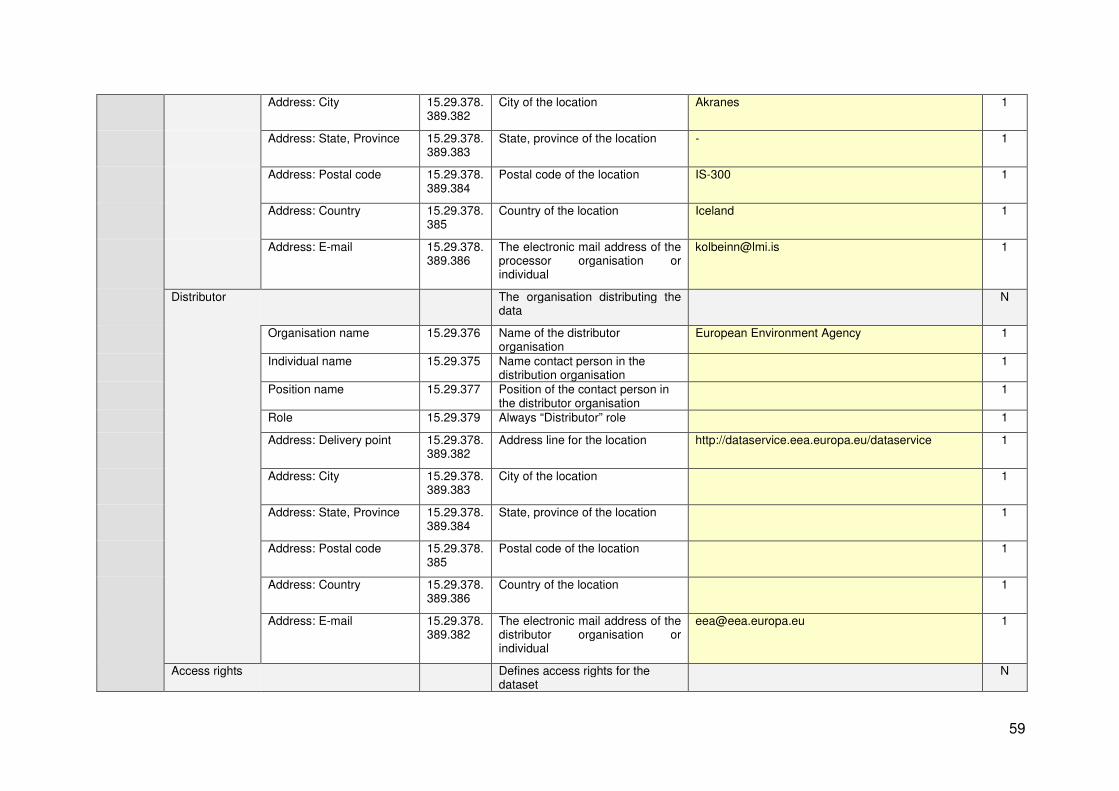
59
Address: City 15.29.378.389.382
City of the location Akranes 1
Address: State, Province 15.29.378.389.383
State, province of the location - 1
Address: Postal code 15.29.378.389.384
Postal code of the location IS-300 1
Address: Country 15.29.378.385
Country of the location Iceland 1
Address: E-mail 15.29.378.389.386
The electronic mail address of the processor organisation or individual
Distributor The organisation distributing the data
N
Organisation name 15.29.376 Name of the distributor organisation
European Environment Agency 1
Individual name 15.29.375 Name contact person in the distribution organisation
1
Position name 15.29.377 Position of the contact person in the distributor organisation
1
Role 15.29.379 Always “Distributor” role 1
Address: Delivery point 15.29.378.389.382
Address line for the location http://dataservice.eea.europa.eu/dataservice 1
Address: City 15.29.378.389.383
City of the location 1
Address: State, Province 15.29.378.389.384
State, province of the location 1
Address: Postal code 15.29.378.385
Postal code of the location 1
Address: Country 15.29.378.389.386
Country of the location 1
Address: E-mail 15.29.378.389.382
The electronic mail address of the distributor organisation or individual
Access rights Defines access rights for the dataset
N
60
Type of constraint 20.70 The type of access right applied to assure the protection of privacy or intellectual property, and any special restriction or limitations on obtaining the resource. See code list 1.
005 (licence) 1
Restriction 20.72 Description of the restriction of the access right.
1
Other dataset information
Other aspects explaining the dataset
1
Language 15.39 Language used within the dataset EN 1
Format name 15.32.285 Name of the used exchange format for the dataset
ArcInfo coverage 1
Format version 15.32.286 Version of the used exchange format for the dataset
- 1

61
Methodology description 18.81.83 General explanation of the data producer’s knowledge about how the geometry was constructed/derived and how the attribute information being part of the dataset was generated.
The CLC2006 was the first CORINE classification to be undertaken in Iceland. Principal data and information used was: IMAGE2006, recent orthorectified SPOT-5 images, topomaps (scale 1: 50.000 and 1: 100.000), municipal plans and aerial photos. The CLC2006 database contains polygons with a minimum mapping unit of 25 ha and a minimum feature width of 100 m.
After the completion of CLC2006 the CLC2000 and 2006-2000Change databases were subsequently produced by back-dating the CLC2006 results.
Bossard, M., Feranec, J., Otahel, J.: CORINE land cover technical guide – Addendum 2000. May 2000. EEA, Technical report No. 40. http://terrestrial.eionet.eu.int
Büttner, G., Feranec, G., Jaffrain, G., 2002. CORINE Land Cover update, Technical Guidelines, http://terrestrial.eionet.eu.int, EEA Technical Report No. 89.
CLC2006 technical guidelines. EEA Technical report. No 17/2007. ISSN 1725-2273.
Feranec, J., Büttner, G., Jaffrain, G., 2006. CORINE Land Cover Technical Guide – Addendum 2006.
1
Changes 18.EEAChanges
Description of the changes since last version of the dataset
- 1
Process steps Information about the event in the creation process of the dataset
N

62
Description 18.81.84.87
Description of the process step including related parameters or tolerance
Step1: Definition of CORINE classes in Iceland. Visual interpretation and comparison of relevant digital satellite and map data and head-up digitising of all 32 land cover classes in Iceland. Also using results of a supervised classification of Landsat ETM images (a raster data layer) for classes of natural vegetation in the country taken into consideration.
The CLC2006 database has a 25 ha minimum mapping unit and a minimum feature width of 100 m. Absolute mapping accuracy 100m.
1
Source data reference title 18.81.84.91.360
Name of the resource used in process step
Orthorectified satellite images, i.e. IMAGE2006 (SPOT 5 and 4) and additional orthorectified SPOT 5 images with 10m spatial reolution from 2004 – 2007.
N
Source data reference date
18.81.84.91.362
Date of the resource used in process step
N
Source data reference title 18.81.84.91.360
Name of the resource used in process step
Digital topographic map database in scale 1: 50.000. Scanned topographic paper maps, scale 1:50.000 and 1: 100.000. Latest updates
Source data reference date
18.81.84.91.362
Date of the resource used in process step
Source data reference title 18.81.84.91.360
Name of the resource used in process step
Thematic maps (vegetation, geology, soil, … ), municipal plans, city maps of most recent updates.
Source data reference date
18.81.84.91.362
Date of the resource used in process step
Description 18.81.84.87
Description of the process step including related parameters or tolerance
Step 2: Internal verification (Technical & thematic)
Description 18.81.84.87
Description of the process step including related parameters or tolerance
Step 3: External verification by the CLC2006 Technical Team
Description 18.81.84.87
Description of the process step including related parameters or tolerance
Step 4: Corrections and amendments according to the recommendations of the CLC2006 Technical Team. Completion of the CLC2006 database.

63
Scale 15.38.60.57
Gives a rough value of accuracy of the dataset; e.g. 2500000 means dataset has an accuracy suitable for use at scale 1:2.5 million at best
1: 100.000 1
Geographic accuracy 15.38.61 Geographic accuracy of location, ground distance as an value in meters
100 1
Geographic box
Geographic position bounding box of the dataset
1
West bound longitude 15.42.336.344
Western-most coordinate of the limit of the dataset extent, expressed in longitude in decimal degrees (positive east)
-24.742462
1
East bound longitude 15.42.336.345
Eastern-most coordinate of the limit of the dataset extent, expressed in longitude in decimal degrees (positive east)
-13.192362
1
South bound latitude 15.42.336.346
Southern-most coordinate of the limit of the dataset extent, expressed in latitude in decimal degrees (positive north)
63.210329
1
North bound latitude 15.42.336.347
Northern-most coordinate of the limit of the dataset extent, expressed in latitude in decimal degrees (positive north)
66.569184
1
CODE LIST 1: MD_RESTRICTIONCODE
Name Domain code
Definition
MD_RestrictionCode RestrictCd limitation(s) placed upon the access or use of the data

64
copyright 001 exclusive right to the publication, production, or publication.
licence 005 formal regulation of user rights
intellectualPropertyRights 006 rights to financial benefits from and control of distribution of a non-tangible property that is the result of creativity
restricted 007 withheld from general circulation or disclosure
otherRestrictions 008 limitation not listed
CODE LIST 2: MD_TOPICCATEGORYCODE
Name Domain code
Definition
MD_TopicCategoryCode
TopicCatCd high-level geographic data thematic classification to assist in the grouping and search of available geographic data sets.
Listed examples are not exhaustive. NOTE It is understood there are overlaps between general categories and the user is encouraged to select the one most appropriate.
farming 001 rearing of animals and/or cultivation of plants. Examples: agriculture, irrigation, aquaculture, plantations, herding, pests and diseases affecting crops and livestock
biota 002 flora and/or fauna in natural environment. Examples: wildlife, vegetation, biological sciences, ecology, wilderness, sealife, wetlands, habitat
boundaries 003 legal land descriptions. Examples: political and administrative boundaries
climatologyMeteorologyAt
mosphere
004 processes and phenomena of the atmosphere. Examples: cloud cover, weather, climate, atmospheric conditions, climate change, precipitation
economy 005 economic activities, conditions and employment. Examples: production, labour, revenue, commerce, industry, tourism and ecotourism, forestry, fisheries, commercial or subsistence hunting, exploration and exploitation of resources such as minerals, oil and gas
elevation 006 height above or below sea level. Examples: altitude, bathymetry, digital elevation models, slope, derived products, monitoring environmental risk, nature reserves, landscape
environment 007 environmental resources, protection and conservation. Examples: environmental pollution, waste storage and treatment, environmental impact assessment

65
geoscientificInformation 008 information pertaining to earth sciences. Examples: geophysical features and processes, geology, minerals, sciences dealing with the composition, structure and origin of the earth’s rocks, risks of earthquakes, volcanic activity, landslides, gravity information, soils, permafrost, hydrogeology, erosion
health 009 health, health services, human ecology, and safety. Examples: disease and illness, factors affecting health, hygiene, substance abuse, mental and physical health, health services
imageryBaseMapsEarthCover
010 base maps. Examples: land cover, topographic maps, imagery, unclassified images, annotations
intelligenceMilitary 011 military bases, structures, activities. Examples: barracks, training grounds, military transportation, information collection
inlandWaters 012 inland water features, drainage systems and their characteristics. Examples: rivers and glaciers, salt lakes, water utilization plans, dams, currents, floods, water quality, hydrographic charts
location 013 positional information and services. Examples: addresses, geodetic networks, control points, postal zones and services, place names
oceans 014 features and characteristics of salt water bodies (excluding inland waters). Examples: tides, tidal waves, coastal information, reefs
planningCadastre 015 information used for appropriate actions for future use of the land. Examples: land use maps, zoning maps, cadastral surveys, land ownership
society 016 characteristics of society and cultures. Examples: settlements, anthropology, archaeology, education, traditional beliefs, manners and customs, demographic data, recreational areas and activities, social impact assessments, crime and justice, census information
structure 017 man-made construction. Examples: buildings, museums, churches, factories, housing, monuments, shops, towers
transportation
018 means and aids for conveying persons and/or goods. Examples: roads, airports/airstrips, shipping routes, tunnels, nautical charts, vehicle or vessel location, aeronautical charts, railways
utilitiesCommunication 019 energy, water and waste systems and communications infrastructure and services. Examples: hydroelectricity, geothermal, solar and nuclear sources of energy, water purification and distribution, sewage collection and disposal, electricity and gas distribution, data communication, telecommunication, radio, communication networks

66
ANNEX II:
COUNTRY LEVEL METADATA FOR ICELAND, CLC2000 AND CLC-CHANGE2000-2006
COUNTRY LEVEL METADATA FOR CLC2000 AND 2000-2006CHANGE IN ICELAND
EEA METADATA FORM FOR SPATIAL DATASETS (GIS DATA) &
EEA METADATA STANDARD FOR GEOGRAPHIC INFORMATION (EEA-MSGI V.1.1)
The use of the form This form should be used by EEA, ETCs, national organisations being partners in EIONET and external contractors delivering GIS-data.
GIS-data or original geodata in this context can be all data sets containing geographical coordinates – firstly commonly know GIS data formats e.g. shapefile, Arc Coverage, Geodatabase, SDE database, geotiff file, imagine-file and vpf, secondly other files which can contain location information (points) such as xls, dBASE file, access database, text files.
The form should only be used for datasets and not for maps or graphs.
The EEA metadata standard for geodata The table show a tree structure which can be used for viewing and registering metadata of spatial data sets, supplied according to the European Environment Agency – Metadata Standard for Geographic Information (EEA-MSGI). EEA-MSGI is a profile of ISO19115 (First edition) Metadata standard.
The tree has a max depth of 3 levels, which makes it easy for a user to navigate the tree.
• The field names have a description that is defined by the EEA and partly derived from the ISO descriptions.
• The fields, which contain a metadata item, are mapped with the corresponding ISO number.
• The “Max” column defines how many occurrences EEA allows in a view of one datasets metadata. N equals any number of occurrences. There may be more occurrences delivered by other metadata writers, but the EEA will only support these numbers of occurrences.
EEA reference:
Thor Jessen ([email protected])

67
Dataset metadata form mapped to ISO19115
Please fill in one metadata form for each dataset. Only lines with ISO numbers need to be filled. Predefined code lists are to be used for a few of the metadata elements.
EEA
Field name
ISO Number
EEA Description Please fill in Max
Level 1 Level 2 Level 3
Metadata on metadata
Defines the metadata on the dataset
1
Point of contact
Responsible organisation and individual for the metadata
1
Organisation name 8.376 Responsible organisation name National Land Survey of Iceland (NLSI) 1
Individual name 8.375 Responsible individual name Dr. Kolbeinn Arnason 1
Position name 8.377 The responsible individual role or position in the organisation
Project manager 1
Role 8.379 Function performed by the responsible organisation
1
Address: Delivery point 8.378.381 Address line for the location Stillholt 16 - 18 1
Address: City 8.378.382 City of the location Akranes 1
Address: State, Province 8.378.383 State, province of the location - 1
Address: Postal code 8.378.384 Postal code of the location IS-300 1
Address: Country 8.378.385 Country of the location Iceland 1

68
Address: E-mail 8.378.386 The electronic mail address of the responsible organisation or individual
Last modified 9 Date of the last modification of the metadata (YYYYMMDD)
20080621 1
Name of standard
10 Name of metadata standard EEA-MSGI/ISO19115 (First Edition) 1
Version of standard
11 Version of the metadata standard EEA-MSGI 1.1 1
Dataset identi-fication
Basic information required to identify the dataset
1
Title 15.24.360 Title of the dataset clc2000_is 1
Alternative title 15.24.361 Alternative titles of the dataset CLC2000 and 2006-2000Change Iceland N
Brief Abstract
15.EEABriefAbstract
Brief abstract explaining in short the content of the dataset
CORINE Land Cover 2000 database and CORINE Land Cover Change (2006 – 2000 of Iceland;
1
Abstract
15.25 An abstract explaining the content of the dataset The European Environment Agency (EEA) launched
the CLC2006 project in the framework of GMES Land Monitoring Fast Track Service/CLC2006 activities in order to update the CLC 2000 database at the reference year 2006 and to create a change database of the period 2000-2006.
In Iceland the CLC2006 was the first CORINE classifica-tion to be implemented and subsequently the CLC2000 and the 2006 – 2000 Change databases were created by back-dating the CLC2006 database.
The project was supported by the European Environment Agency (EEA). Grant agreement:
3601/RO/CLC/B2007.EEA52971.
In Iceland the project was co-financed by the National Land Survey of Iceland (NLSI).
1
Keywords 15.33.53 Keywords helping to classify the dataset
CLC2000, CLC Change, CORINE, geographic, landcover, environment, vector data, Iceland
N

69
Topic category 15.41 A predefined ISO category, see code list 2 underneath
010 (imageryBaseMapsEarthCover) 1
Dataset version 15.24.363 Version of the dataset Version 1. 1
Reference date 15.24.362.394
Date of last modification to the dataset (YYYYMMDD)
20090618 1
Reference system
Definition of the reference system used for the dataset
1
Name 13.196.207
Name of reference system ISN93 1
Datum Identity of the datum 1
Name 13.192.207
Name of datum ISN93 1
Ellipsoid Identity of the ellipsoid 1
Name 13.191.207
Name of ellipsoid GRS 80 1
Semi-major axis 13.193.202
Radius of the equatorial axis of the ellipsoid
6378137 1
Axis units 13.193.203
Units of the semi-major axis Meters 1
Flattening ratio 13.193.204
Ratio of the difference between the equatorial and polar radii of the ellipsoid to the equatorial radius when the numerator is set to 1
298.257
1
Projection Identity of the projection 1
Name 13.190.207
Name of projection Lambert Conformal Conic 2SP 1
Zone 13.194.216
Unique identifier for grid zone 1
Standard parallel 13.194.217
Line of constant latitude at which the surface of Earth and the plane or developable surface intersect
1st standard parallel: 64°15’00.00’’ N 2nd standard parallel: 65°45’00.00’’ N
1

70
Longitude Of Central Meridian
13.194.218
Line of longitude at the centre of a map projection generally used as the basis for constructing the projection
-19°00’00.00’’ E 1
Latitude of projection origin 13.194.219
Latitude chosen as the origin of rectangular coordinates for a map projection
65°00’00.00’’ N 1
False easting 13.194.220
Value added to all “x” values in the rectangular coordinates for a map projection. This value frequently is assigned to eliminate negative numbers. Expressed in the unit of measure identified in planar coordinate units
500000 1
False northing 13.194.221
Value added to all “y” values in the rectangular coordinates for a map projection. This value frequently is assigned to eliminate negative numbers. Expressed in the unit of measure identified in planar coordinate units
500000 1
False easting northing units
13.194.222
Units of false northing and false easting
Meters 1
Scale factor at equator 13.194.223
Ratio between physical distance and corresponding map distance, along the equator
- 1
Longitude of projection centre
13.194.224
Longitude of the point of projection for azimuthal projections
- 1
Latitude of projection centre
13.194.225
Latitude of the point of projection for azimuthal projections
- 1
Distri-
Information about the distributors of the dataset
1

71
bution information
Owner 1 Information about the owner organisation
N
Organisation name 15.29.376 Name of the owner organisation European Environment Agency 1
Individual name 15.29.375 Name contact person in the owner organisation
See contract with EEA! 1
Position name 15.29.377 Position of the contact person in the owner organisation
See contract with EEA! 1
Role 15.29.379 Always “Owner” role owner 1
Address: Delivery point 15.29.378.389.381
Address line for the location Kongens Nytorv 6 1
Address: City 15.29.378.389.382
City of the location Copenhagen 1
Address: State, Province 15.29.378.389.383
State, province of the location K 1
Address: Postal code 15.29.378.389.384
Postal code of the location 1050 1
Address: Country 15.29.378.389.385
Country of the location Denmark 1
Address: E-mail 15.29.378.389.386
The electronic mail address of the owner organisation or individual
Information about the distributors of the dataset
Owner 2 Information about the owner organisation
Organisation name 15.29.376 Name of the owner organisation National Land Survey of Iceland (NLSI)
Individual name 15.29.375 Name contact person in the owner organisation
Mr. Magnus Gudmundsson
Position name 15.29.377 Position of the contact person in the owner organisation
Director
Role 15.29.379 Always “Owner” role owner
Address: Delivery point 15.29.378.389.381
Address line for the location Stillholt 16 - 18
Address: City 15.29.378.389.382
City of the location Akranes

72
Address: State, Province 15.29.378.389.383
State, province of the location -
Address: Postal code 15.29.378.389.384
Postal code of the location IS-300
Address: Country 15.29.378.389.385
Country of the location Iceland
Address: E-mail 15.29.378.389.386
The electronic mail address of the owner organisation or individual
Originator Information about intellectual creator (person and/or organisation with intellectual rights) of the dataset
N
Organisation name 15.29.376 Name of the creating organisation National Land Survey of Iceland 1
Individual name 15.29.375 Name contact person in the creating organisation
Dr. Kolbeinn Arnason 1
Position name 15.29.377 Position of the contact person in the creating organisation
project manager 1
Role 15.29.379 Always “Originator” role originator 1
Address: Delivery point 15.29.378.389.381
Address line for the location Stillholt 16 - 18 1
Address: City 15.29.378.389.382
City of the location Akranes 1
Address: State, Province 15.29.378.389.383
State, province of the location - 1
Address: Postal code 15.29.378.389.384
Postal code of the location IS-300 1
Address: Country 15.29.378.389.385
Country of the location Iceland 1
Address: E-mail 15.29.378.389.386
The electronic mail address of the originator/creator organisation or individual
Processor The technical producer or processor of the data
N
Organisation name 15.29.376 Name of the processor organisation
National Land Survey of Iceland 1

73
Individual name 15.29.375 Name contact person in the processor organisation
Dr. Kolbeinn Arnason 1
Position name 15.29.377 Position of the contact person in the processor organisation
project manager 1
Role 15.29.379 Always “Processor” role processor 1
Address: Delivery point 15.29.378.389.381
Address line for the location Stillholt 16 - 18 1
Address: City 15.29.378.389.382
City of the location Akranes 1
Address: State, Province 15.29.378.389.383
State, province of the location - 1
Address: Postal code 15.29.378.389.384
Postal code of the location IS-300 1
Address: Country 15.29.378.385
Country of the location Iceland 1
Address: E-mail 15.29.378.389.386
The electronic mail address of the processor organisation or individual
Distributor The organisation distributing the data
N
Organisation name 15.29.376 Name of the distributor organisation
European Environment Agency 1
Individual name 15.29.375 Name contact person in the distribution organisation
1
Position name 15.29.377 Position of the contact person in the distributor organisation
1
Role 15.29.379 Always “Distributor” role 1
Address: Delivery point 15.29.378.389.382
Address line for the location http://dataservice.eea.europa.eu/dataservice 1
Address: City 15.29.378.389.383
City of the location 1
Address: State, Province 15.29.378.389.384
State, province of the location 1
Address: Postal code 15.29.378.385
Postal code of the location 1

74
Address: Country 15.29.378.389.386
Country of the location 1
Address: E-mail 15.29.378.389.382
The electronic mail address of the distributor organisation or individual
Access rights Defines access rights for the dataset
N
Type of constraint 20.70 The type of access right applied to assure the protection of privacy or intellectual property, and any special restriction or limitations on obtaining the resource. See code list 1.
005 (licence) 1
Restriction 20.72 Description of the restriction of the access right.
1
Other dataset information
Other aspects explaining the dataset
1
Language 15.39 Language used within the dataset EN 1
Format name 15.32.285 Name of the used exchange format for the dataset
ArcInfo coverage 1
Format version 15.32.286 Version of the used exchange format for the dataset
- 1

75
Methodology description 18.81.83 General explanation of the data producer’s knowledge about how the geometry was constructed/derived and how the attribute information being part of the dataset was generated.
The CLC2006 was the first CORINE classification to be implemented in Iceland. After the completion of CLC2006 the CLC2000 and 2006-2000Change databases were subsequently prepared by back-dating the CLC2006 results.
Principal data and information used was: IMAGE2000 and some additional Landsat-7 images from 2000 +/- 1yr, topomaps (scale 1: 50.000 and 1: 100.000), municipal plans and aerial photos. Land cover changes as small as 5 ha were mapped in the 2006-2000Change database. The CLC2000 database (like the CLC2006) contains polygons with a minimum mappable area of 25 ha and a minimum feature width of 100 m.
Bossard, M., Feranec, J., Otahel, J.: CORINE land cover technical guide – Addendum 2000. May 2000. EEA, Technical report No. 40. http://terrestrial.eionet.eu.int
Büttner, G., Feranec, G., Jaffrain, G., 2002. CORINE Land Cover update, Technical Guidelines, http://terrestrial.eionet.eu.int, EEA Technical Report No. 89.
CLC2006 technical guidelines. EEA Technical report. No 17/2007. ISSN 1725-2273.
Feranec, J., Büttner, G., Jaffrain, G., 2006. CORINE Land Cover Technical Guide – Addendum 2006.
1
Changes 18.EEAChanges
Description of the changes since last version of the dataset
- 1
Process steps Information about the event in the creation process of the dataset
N

76
Description 18.81.84.87
Description of the process step including related parameters or tolerance
Step1: Visual comparison of IMAGE2000 with IMAGE2006, CLC2006 results and other relevant data to discover and delineate changes. Direct digitising of changes >5 hectares on computer screen.
The minimum mapping unit for the 2006-2000Change database is 5 ha whereas the CLC2000 database has a 25 ha minimum mappable area and a minimum feature width of 100 m. Absolute mapping accuracy 100m.
1
Source data reference title 18.81.84.91.360
Name of the resource used in process step
IMAGE2000 (Landsat ETM imagery, dating from 1999 – 2001) plus several additional orthorectified Landsat ETM images from the same period of time. IMAGE2006 (SPOT 5 and 4) was used for comparison.
N
Source data reference date
18.81.84.91.362
Date of the resource used in process step
N
Source data reference title 18.81.84.91.360
Name of the resource used in process step
Digital topographic map database in scale 1: 50.000. Scanned topographic paper maps, scale 1:50.000 and 1: 100.000. Latest updates
Source data reference date
18.81.84.91.362
Date of the resource used in process step
Source data reference title 18.81.84.91.360
Name of the resource used in process step
Thematic maps at various scales (vegetation, geology, soil, … ), municipal plans, city maps of most recent updates.
Source data reference date
18.81.84.91.362
Date of the resource used in process step
Description 18.81.84.87
Description of the process step including related parameters or tolerance
Step 2: Internal verification (Technical & thematic)
Description 18.81.84.87
Description of the process step including related parameters or tolerance
Step 3: External verification by the CLC2000 Technical Team
Description 18.81.84.87
Description of the process step including related parameters or tolerance
Step 4: Corrections and amendments according to the recommendations of the CLC2006 Technical Team. Completion of the CLC2000 and 2006-2000Change databases.

77
Scale 15.38.60.57
Gives a rough value of accuracy of the dataset; e.g. 2500000 means dataset has an accuracy suitable for use at scale 1:2.5 million at best
1: 100.000 1
Geographic accuracy 15.38.61 Geographic accuracy of location, ground distance as an value in meters
100 1
Geographic box
Geographic position bounding box of the dataset
1
West bound longitude 15.42.336.344
Western-most coordinate of the limit of the dataset extent, expressed in longitude in decimal degrees (positive east)
-24.742462
1
East bound longitude 15.42.336.345
Eastern-most coordinate of the limit of the dataset extent, expressed in longitude in decimal degrees (positive east)
-13.192362
1
South bound latitude 15.42.336.346
Southern-most coordinate of the limit of the dataset extent, expressed in latitude in decimal degrees (positive north)
63.210329
1
North bound latitude 15.42.336.347
Northern-most coordinate of the limit of the dataset extent, expressed in latitude in decimal degrees (positive north)
66.569184
1
CODE LIST 1: MD_RESTRICTIONCODE
Name Domain code
Definition
MD_RestrictionCode RestrictCd limitation(s) placed upon the access or use of the data

78
copyright 001 exclusive right to the publication, production, or publication.
licence 005 formal regulation of user rights
intellectualPropertyRights 006 rights to financial benefits from and control of distribution of a non-tangible property that is the result of creativity
restricted 007 withheld from general circulation or disclosure
otherRestrictions 008 limitation not listed
CODE LIST 2: MD_TOPICCATEGORYCODE
Name Domain code
Definition
MD_TopicCategoryCode
TopicCatCd high-level geographic data thematic classification to assist in the grouping and search of available geographic data sets.
Listed examples are not exhaustive. NOTE It is understood there are overlaps between general categories and the user is encouraged to select the one most appropriate.
farming 001 rearing of animals and/or cultivation of plants. Examples: agriculture, irrigation, aquaculture, plantations, herding, pests and diseases affecting crops and livestock
biota 002 flora and/or fauna in natural environment. Examples: wildlife, vegetation, biological sciences, ecology, wilderness, sealife, wetlands, habitat
boundaries 003 legal land descriptions. Examples: political and administrative boundaries
climatologyMeteorologyAt
mosphere
004 processes and phenomena of the atmosphere. Examples: cloud cover, weather, climate, atmospheric conditions, climate change, precipitation
economy 005 economic activities, conditions and employment. Examples: production, labour, revenue, commerce, industry, tourism and ecotourism, forestry, fisheries, commercial or subsistence hunting, exploration and exploitation of resources such as minerals, oil and gas
elevation 006 height above or below sea level. Examples: altitude, bathymetry, digital elevation models, slope, derived products, monitoring environmental risk, nature reserves, landscape
environment 007 environmental resources, protection and conservation. Examples: environmental pollution, waste storage and treatment, environmental impact assessment

79
geoscientificInformation 008 information pertaining to earth sciences. Examples: geophysical features and processes, geology, minerals, sciences dealing with the composition, structure and origin of the earth’s rocks, risks of earthquakes, volcanic activity, landslides, gravity information, soils, permafrost, hydrogeology, erosion
health 009 health, health services, human ecology, and safety. Examples: disease and illness, factors affecting health, hygiene, substance abuse, mental and physical health, health services
imageryBaseMapsEarthCover
010 base maps. Examples: land cover, topographic maps, imagery, unclassified images, annotations
intelligenceMilitary 011 military bases, structures, activities. Examples: barracks, training grounds, military transportation, information collection
inlandWaters 012 inland water features, drainage systems and their characteristics. Examples: rivers and glaciers, salt lakes, water utilization plans, dams, currents, floods, water quality, hydrographic charts
location 013 positional information and services. Examples: addresses, geodetic networks, control points, postal zones and services, place names
oceans 014 features and characteristics of salt water bodies (excluding inland waters). Examples: tides, tidal waves, coastal information, reefs
planningCadastre 015 information used for appropriate actions for future use of the land. Examples: land use maps, zoning maps, cadastral surveys, land ownership
society 016 characteristics of society and cultures. Examples: settlements, anthropology, archaeology, education, traditional beliefs, manners and customs, demographic data, recreational areas and activities, social impact assessments, crime and justice, census information
structure 017 man-made construction. Examples: buildings, museums, churches, factories, housing, monuments, shops, towers
transportation
018 means and aids for conveying persons and/or goods. Examples: roads, airports/airstrips, shipping routes, tunnels, nautical charts, vehicle or vessel location, aeronautical charts, railways
utilitiesCommunication 019 energy, water and waste systems and communications infrastructure and services. Examples: hydroelectricity, geothermal, solar and nuclear sources of energy, water purification and distribution, sewage collection and disposal, electricity and gas distribution, data communication, telecommunication, radio, communication networks

80
ANNEX III:
CLC2006 METADATA1
– Working layer level
- Please provide a single summary file for each layer -
Title of working layer: 1. ARTIFICIAL SURFACES – ALL SURFACE CLASSES
A: GENERAL INFORMATION
Sponsor: National Land Survey of Iceland NLSI
Contractor / data provider:
All 78 municipalities of Iceland. Data collected by NLSI staff via internet, telephone, e-mail and mail.
Address: Stillholt 16-18, 300 Akranes
Address: various
Phone: +354/ 430-9000 Phone:
Fax: +354/ 430-9090 Fax:
Responsible:
Kolbeinn Árnason Project leader:
Kolbeinn Árnason, Ingvar Matthíasson
E-mail: [email protected] E-mail: [email protected], [email protected]
1. Main data used (thematic data, aerial photos, city maps, vegetation maps, etc.)
ID Data source/type Data providers and remarks
112 General municipal plans, city maps, aerial photos, IMAGE2006.
Necessary information from planning departments of all 78 municipalities in Iceland.
121 General municipal plans, city maps, aerial photos, IMAGE2006.
All 78 municipalities in Iceland, hydropower and geothermal companies.
122 NLSI IS 50V database. GPS-measured road network, Abs. acc. <5 m RMS.
123 General municipal plans, city maps, aerial photos, IMAGE2006.
All 78 municipalities in Iceland, Icelandic Maritime Administration.
124 General municipal plans, city maps, aerial photos, IMAGE2006.
All 78 municipalities in Iceland, Icelandic Civil Aviation Administration.
131 General municipal plans, aerial photos, IMAGE2006.
All 78 municipalities in Iceland.
132 General municipal plans, aerial photos. Municipalities in the capital area.
1 Annex 1 of the CLC2006 Technical Guidelines, modified by G. Büttner to fulfil the special Icelandic needs.

81
133 General municipal plans, city maps, aerial photos, IMAGE2006.
Municipalities, power companies, Icelandic Road Administration.
141 General municipal plans, city maps, aerial photos, IMAGE2006.
All 78 municipalities in Iceland.
142 General municipal plans, city maps, aerial photos, IMAGE2006.
All 78 municipalities in Iceland, Golf Union of Iceland.
2. Topographic maps used
Scale Title/Name
Year of
production
Remark
1:50 000 IS 50V 1999-2003 Digital Vector Database of the NLSI from AMS and DMA maps, updated on a regular basis.
1:100 000 Atlas 1900-1935 87 scanned paper sheets.
1:50 000 AMS 1946-1951 105 scanned paper sheets.
1:50 000 DMA 1977-1997 128 scanned paper sheets.
3. IMAGE2006 satellite data used
Satellite &
Sensor
Date (m/d/y) Remark (e.g. clouds)
SPOT-5, SPOT-4
Mainly 2006, only few 2005 and 2007 images.
A total of 76 images. One complete cloud free coverage of Iceland
4. Additional satellite data used
Satellite &
Sensor
Date (m/d/y) Remark (e.g. clouds)
SPOT-5 2003 - 2008 Real colour and false colour mosaics of Iceland with 10 m spatial resolution.
B: GENERALISATION, DATA INTEGRATION, FINAL TECHNICAL QUALITY CONTROL
1. Generalisation, control of topology, unnecessary boundaries, 25 ha limit, invalid codes (internal control)
Date (m/d/y) Controlled by Remark
CLC2006 December, 2008 Ásta Óladóttir CLC2006 was digitised, generalised

82
December, 2008 Ingvar Matthíasson and cross checked by the staff of NLSI. Final control of topology and other technical mistakes was done by Ingvar Matthíasson.
December, 2008 Kolbeinn Árnason
December, 2008 Margrét Ragnarsdóttir
December, 2008 Sigrún Árnadóttir
December, 2008 Þórey Þórðardóttir
2. Verification and acceptance of CLC2006
Date (m/d/y) Name Signature Remark
National level Dec. 2008 Ingvar Matthíasson
CLC technical team August, 2008
Barbara Kosztra
László Mari
D: SOFTWARE / HARDWARE
Work phase Software used Hardware used
Database compilation, generalisation ArcInfo PC
Satellite image processing ArcInfo PC
Technical quality control ArcInfo PC

83
Title of working layer: 2. AGRICULTURAL AREAS – ALL SURFACE CLASSES
A: GENERAL INFORMATION
Sponsor: National Land Survey of Iceland NLSI
Contractor / data provider:
Farmers Association mainly, but also personal communication with some farmers by telephone, e-mail and mail.
Address: Stillholt 16-18, 300 Akranes
Address: Bændahöllin Hagatorgi, 101 Reykjavík
Phone: +354/ 430-9000 Phone: +354 / 563 03 00
Fax: +354/ 430-9090 Fax: +354 / 563 03 58
Responsible:
Kolbeinn Árnason Contact person:
Borgar P. Bragason
E-mail: [email protected] E-mail: [email protected]
1. Main data used (thematic data, aerial photos, city maps, vegetation maps, etc.)
ID Data source/type Data providers and remarks
211 Cornfield database of the Farmers Association, IMAGE2006, topographic maps, aerial photos.
Farmers Association of Iceland, personal communication with farmers.
231 IMAGE2006, topographic maps,aerial photos.
Farmers Association of Iceland.
242 Cornfield database of the Farmers Association, IMAGE2006, topographic maps, aerial photos.
Farmers Association of Iceland, personal communication with farmers.
2. Topographic maps used
Scale Title/Name
Year of
production
Remark
1:50 000 IS 50V 1999-2003 Digital Vector Database of the NLSI from AMS and DMA maps, updated on a regular basis.
1:100 000 Atlas 1900-1935 87 scanned paper sheets.
1:50 000 AMS 1946-1951 105 scanned paper sheets.
1:50 000 DMA 1977-1997 128 scanned paper sheets.
3. IMAGE2006 satellite data used
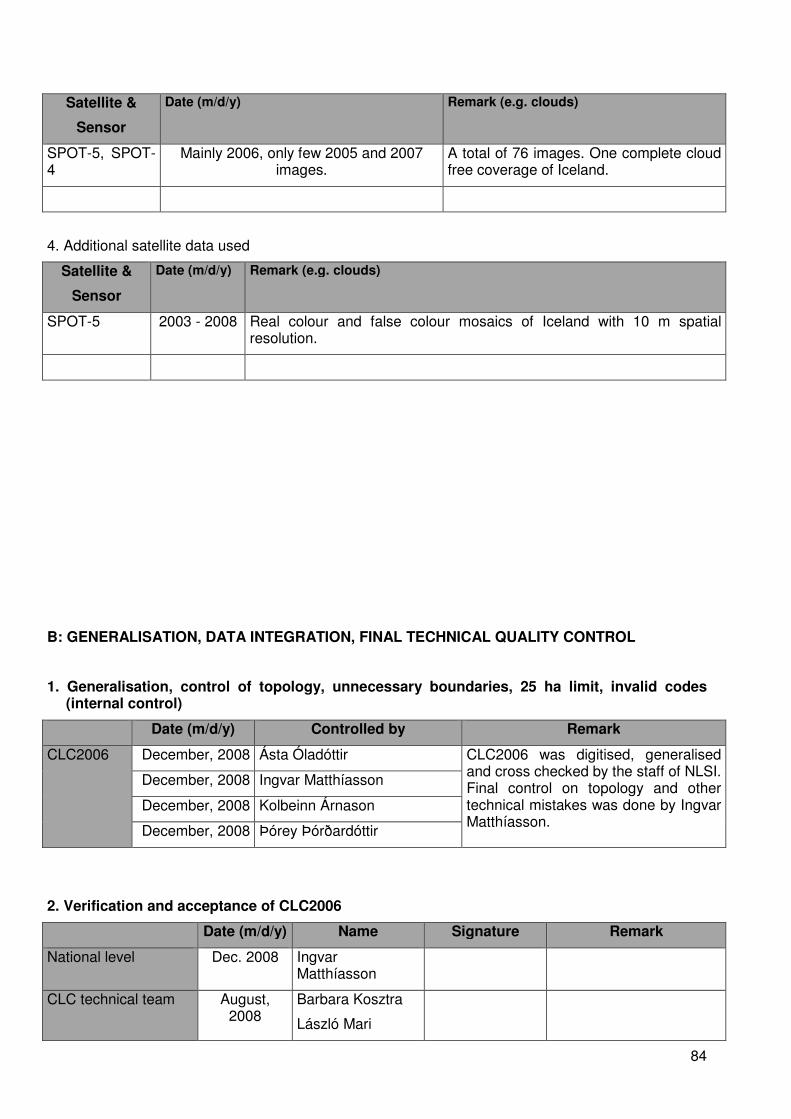
84
Satellite &
Sensor
Date (m/d/y) Remark (e.g. clouds)
SPOT-5, SPOT-4
Mainly 2006, only few 2005 and 2007 images.
A total of 76 images. One complete cloud free coverage of Iceland.
4. Additional satellite data used
Satellite &
Sensor
Date (m/d/y) Remark (e.g. clouds)
SPOT-5 2003 - 2008 Real colour and false colour mosaics of Iceland with 10 m spatial resolution.
B: GENERALISATION, DATA INTEGRATION, FINAL TECHNICAL QUALITY CONTROL
1. Generalisation, control of topology, unnecessary boundaries, 25 ha limit, invalid codes (internal control)
Date (m/d/y) Controlled by Remark
CLC2006 December, 2008 Ásta Óladóttir CLC2006 was digitised, generalised and cross checked by the staff of NLSI. Final control on topology and other technical mistakes was done by Ingvar Matthíasson.
December, 2008 Ingvar Matthíasson
December, 2008 Kolbeinn Árnason
December, 2008 Þórey Þórðardóttir
2. Verification and acceptance of CLC2006
Date (m/d/y) Name Signature Remark
National level Dec. 2008 Ingvar Matthíasson
CLC technical team August, 2008
Barbara Kosztra
László Mari

85
D: SOFTWARE / HARDWARE
Work phase Software used Hardware used
Database compilation, generalisation ArcInfo PC
Satellite image processing ArcInfo PC
Technical quality control ArcInfo PC

86
Title of working layer: 311 BROAD LEAVED FOREST
312 CONIFEROUS FOREST
313 MIXED FOREST
324 TRANSITIONAL WOODLAND
A: GENERAL INFORMATION
Sponsor: National Land Survey of Iceland NLSI
Contractor / data provider:
Iceland Forestry Service
Address: Stillholt 16-18, 300 Akranes
Address: Mógilsá, Kjalarnes, 116 Reykjavík
Phone: +354/ 430-9000 Phone: +354/ 5154500
Fax: +354/ 430-9090 Fax: +354/ 5154501
Responsible:
Kolbeinn Árnason Project leader: Arnór Snorrason
E-mail: [email protected] E-mail: [email protected]
1. Main data used (thematic data, aerial photos, city maps, vegetation maps, etc.)
ID Data source/type Data providers and remarks
311 GPS-measured polygons, field observations, aerial photographs.
Iceland Forestry Service (IFS)
312 GPS-measured polygons, field observations, aerial photographs.
Iceland Forestry Service (IFS)
313 GPS-measured polygons, field observations, aerial photographs.
Iceland Forestry Service
324 GPS-measured polygons, field observations, aerial photographs.
Iceland Forestry Service
2. Topographic maps used
Scale Title/Name
Year of
production
Remark
1:50 000 IS 50V 1999-2003 Digital Vector Database of the NLSI from AMS and DMA maps, updated on a regular basis.
1:100 000 Atlas 1900-1935 87 scanned paper sheets.
1:50 000 AMS 1946-1951 105 scanned paper sheets.
1:50 000 DMA 1977-1997 128 scanned paper sheets.
3. IMAGE2006 satellite data used

87
Satellite &
Sensor
Date (m/d/y) Remark (e.g. clouds)
SPOT-5, SPOT-4
Mainly 2006, only few 2005 and 2007 images.
A total of 76 images. One complete cloud free coverage of Iceland.
4. Additional satellite data used
Satellite &
Sensor
Date (m/d/y) Remark (e.g. clouds)
SPOT-5 2003 - 2008 Real colour and false colour mosaics of Iceland with 10 m spatial resolution.
B: GENERALISATION, DATA INTEGRATION, FINAL TECHNICAL QUALITY CONTROL
1. Generalisation, control of topology, unnecessary boundaries, 25 ha limit, invalid codes (internal control)
Date (m/d/y) Controlled by Remark
CLC2006 December, 2008 Ásta Óladóttir Digital data was provided by the IFS and generalised and cross checked by the staff of NLSI. Final control of topology and other technical mistakes was done by Ingvar Matthíasson.
December, 2008 Ingvar Matthíasson
December, 2008 Kolbeinn Árnason
December, 2008 Margrét Ragnarsdóttir
December, 2008 Sigrún Árnadóttir
December, 2008 Þórey Þórðardóttir
2. Verification and acceptance of CLC2006
Date (m/d/y) Name Signature Remark
National level Dec. 2008 Ingvar Matthíasson
CLC technical team August, 2008
Barbara Kosztra
László Mari
D: SOFTWARE / HARDWARE

88
Work phase Software used Hardware used
Database compilation, generalisation ArcInfo PC
Satellite image processing ArcInfo PC
Technical quality control ArcInfo PC

89
Title of working layer: 321 NATURAL GRASSLAND 322 MOORS AND HEATH LAND 331 BEACHES, DUNES AND SAND PLAINS 332 BARE ROCKS 333 SPARSELY VEGETATED AREAS 412 PEAT BOGS
A: GENERAL INFORMATION
Sponsor: National Land Survey of Iceland NLSI
Contractor / data provider:
Agricultural University of Iceland
Address: Stillholt 16-18, 300 Akranes
Address: Hvanneyri, 311 Borgarnes
Phone: +354/ 430-9000 Phone: +354/ 433-5000
Fax: +354/ 430-9090 Fax: +354/ 433-5001
Responsible:
Kolbeinn Árnason Project leader: Ólafur Arnalds
E-mail: [email protected] E-mail: [email protected]
1. Main data used (thematic data, aerial photos, city maps, vegetation maps, etc.)
ID Data source/type Data providers and remarks
321 Raster data based on extensive field work, 12.800 filed control points, 7.700 check-up points, 20.500 field photos. IMAGE2006.
Agricultural University of Iceland (AUI). CLC based on semi-automatic classification of Landsat and SPOT images. Raster results vectorised at NLSI.
322 Raster data based on extensive field work, 12.800 field control points, 7.700 check-up points, 20.500 field photos. IMAGE2006.
Agricultural University of Iceland (AUI). CLC based on semi-automatic classification of Landsat and SPOT images. Raster results vectorised at NLSI.
331 Raster data based on extensive field work, 12.800 fild control points, 7.700 check-up points, 20.500 field photos. IMAGE2006.
Agricultural University of Iceland (AUI). CLC based on semi-automatic classification of Landsat and SPOT images. Raster results vectorised at NLSI. Class separated from 3.3.2. at NLSI by visual interpretation of IMAGE2006.
332 Raster data based on extensive field work, 12.800 field control points, 7.700 check-up points, 20.500 field photos. IMAGE2006.
Agricultural University of Iceland (AUI). CLC based on semi-automatic classification of Landsat and SPOT images. Raster results vectorised at NLSI. Class separated from 3.3.1. at NLSI by visual interpretation of IMAGE2006.
333 Raster data based on extensive field work, 12.800 field control points, 7.700 check-up points, 20.500 field photos. IMAGE2006.
Agricultural University of Iceland (AUI). CLC based on semi-automatic classification of Landsat and SPOT images. Raster results vectorised at NLSI.

90
412 Raster data based on extensive field work, 12.800 field control points, 7.700 check-up points, 20.500 field photos. IMAGE2006, Vegetation maps.
Agricultural University of Iceland (AUI). CLC based on semi-automatic classification of Landsat and SPOT images. Raster results improved and vector-ised at NLSI. Vegetation maps provided by IINH.
2. Topographic maps used
Scale Title/Name
Year of
production
Remark
1:50 000 IS 50V 1999-2003 Digital Vector Database of the NLSI from AMS and DMA maps, updated on a regular basis.
1:100 000 Atlas 1900-1935 87 scanned paper sheets.
1:50 000 AMS 1946-1951 105 scanned paper sheets.
1:50 000 DMA 1977-1997 128 scanned paper sheets.
3. IMAGE2006 satellite data used
Satellite &
Sensor
Date (m/d/y) Remark (e.g. clouds)
SPOT-5, SPOT-4
Mainly 2006, only few 2005 and 2007 images.
A total of 76 images. One complete cloud free coverage of Iceland.
4. Additional satellite data used
Satellite &
Sensor
Date (m/d/y) Remark (e.g. clouds)
SPOT-5 2003 - 2008 Real colour and false colour mosaics of Iceland with 10 m spatial resolution.
Landsat 2000 +/- 2 y Used for semi-automated classification at the AUI.
B: GENERALISATION, DATA INTEGRATION, FINAL TECHNICAL QUALITY CONTROL
1. Generalisation, control of topology, unnecessary boundaries, 25 ha limit, invalid codes (internal control)
Date (m/d/y) Controlled by Remark
CLC2006 December, 2008 Ásta Óladóttir Raster results of AUI semi-automated classification vectorised, generalised
December, 2008 Björn Waske

91
December, 2008 Ingvar Matthíasson and cross checked by the staff of NLSI. Final control of topology and other technical mistakes was done by Ingvar Matthíasson.
December, 2008 Jóhann Helgason
December, 2008 Kolbeinn Árnason
December, 2008 Margrét Ragnarsdóttir
December, 2008 Saulius Prizginas
December, 2008 Sigrún Árnadóttir
December, 2008 Þórey Þórðardóttir
2. Verification and acceptance of CLC2006
Date (m/d/y) Name Signature Remark
National level Dec. 2008 Ingvar Matthíasson
CLC technical team August, 2008
Barbara Kosztra
László Mari
D: SOFTWARE / HARDWARE
Work phase Software used Hardware used
Database compilation, generalisation ArcInfo PC
Satellite image processing ArcInfo, Erdas Imagine PC
Technical quality control ArcInfo PC

92
Title of working layer: 335 GLACIERS AND PERPETUAL SNOW
A: GENERAL INFORMATION
Sponsor: National Land Survey of Iceland NLSI
Contractor / data provider:
National Energy Authority
Address: Stillholt 16-18, 300 Akranes
Address: Grensásvegur 9, 108 Reykjavík
Phone: +354/ 430-9000 Phone: +354/ 569-6000
Fax: +354/ 430-9090 Fax: +354/ 568-8896
Responsible:
Kolbeinn Árnason Project leader: Oddur Sigurðsson
E-mail: [email protected] E-mail: [email protected]
1. Main data used (thematic data, aerial photos, city maps, vegetation maps, etc.)
ID Data source/type Data providers and remarks
335 Vector data based on aerial oblique (stereo) photos, GPS-tracks. IMAGE2006.
National Energy Authority (NEA). Original mapping applies to 2000, changes mapped for CLC2006.
2. Topographic maps used
Scale Title/Name
Year of
production
Remark
1:50 000 IS 50V 1999-2003 Digital Vector Database of the NLSI from AMS and DMA maps, updated on a regular basis.
3. IMAGE2006 satellite data used
Satellite &
Sensor
Date (m/d/y) Remark (e.g. clouds)
SPOT-5, SPOT-4
Mainly 2006, only few 2005 and 2007 images.
A total of 76 images. One complete cloud free coverage of Iceland.
4. Additional satellite data used
Satellite &
Sensor
Date (m/d/y) Remark (e.g. clouds)
SPOT-5 2003 - 2008 Real colour and false colour mosaics of Iceland with 10 m spatial resolution.
Landsat 2000 +/- 1 y Original mapping of glacier contours applies to year 2000.

93
B: GENERALISATION, DATA INTEGRATION, FINAL TECHNICAL QUALITY CONTROL
1. Generalisation, control of topology, unnecessary boundaries, 25 ha limit, invalid codes (internal control)
Date (m/d/y) Controlled by Remark
CLC2006 December, 2008 Ásta Óladóttir Digital data provided by NEA, generalised and cross checked by the staff of NLSI. Final control on topology and other technical mistakes was done by Ingvar Matthíasson.
December, 2008 Ingvar Matthíasson
December, 2008 Kolbeinn Árnason
December, 2008 Margrét Ragnarsdóttir
December, 2008 Sigrún Árnadóttir
December, 2008 Þórey Þórðardóttir
2. Verification and acceptance of CLC2006
Date (m/d/y) Name Signature Remark
National level Dec. 2008 Ingvar Matthíasson
CLC technical team August, 2008
Barbara Kosztra
László Mari
D: SOFTWARE / HARDWARE
Work phase Software used Hardware used
Database compilation, generalisation ArcInfo PC
Satellite image processing ArcInfo PC
Technical quality control ArcInfo PC

94
Title of working layer: 411 INLAND MARSHES 421 SALT MARSHES
A: GENERAL INFORMATION
Sponsor: National Land Survey of Iceland NLSI
Contractor / data provider:
The Icelandic Institute of Natural History (IINH)
Address: Stillholt 16-18, 300 Akranes
Address: Hlemmi 3, 125 Reykjavík
Phone: +354/ 430-9000 Phone: +354/ 590-0500
Fax: +354/ 430-9090 Fax: +354/ 590-0595
Responsible:
Kolbeinn Árnason Project leader: Guðmundur Guðjónsson
E-mail: [email protected] E-mail: [email protected]
1. Main data used (thematic data, aerial photos, city maps, vegetation maps, etc.)
ID Data source/type Data providers and remarks
411 Vector data based on intensive field observations, aerial photographs, vegetation maps.
The Icelandic Institute of Natural History (IINH), digital HiRes data delivered.
421 Intensive field observations, aerial photographs, vegetation maps.
The Icelandic Institute of Natural History (IINH) and the University of Iceland (UI), digital HiRes data delivered.
2. Topographic maps used
Scale Title/Name
Year of
production
Remark
1:50 000 IS 50V 1999-2003 Digital Vector Database of the NLSI from AMS and DMA maps, updated on a regular basis.
1:100 000 Atlas 1900-1935 87 scanned paper sheets.
1:50 000 AMS 1946-1951 105 scanned paper sheets.
1:50 000 DMA 1977-1997 128 scanned paper sheets.
3. IMAGE2006 satellite data used
Satellite &
Sensor
Date (m/d/y) Remark (e.g. clouds)
SPOT-5, SPOT-4
Mainly 2006, only few 2005 and 2007 images.
A total of 76 images. One complete cloud free coverage of Iceland.
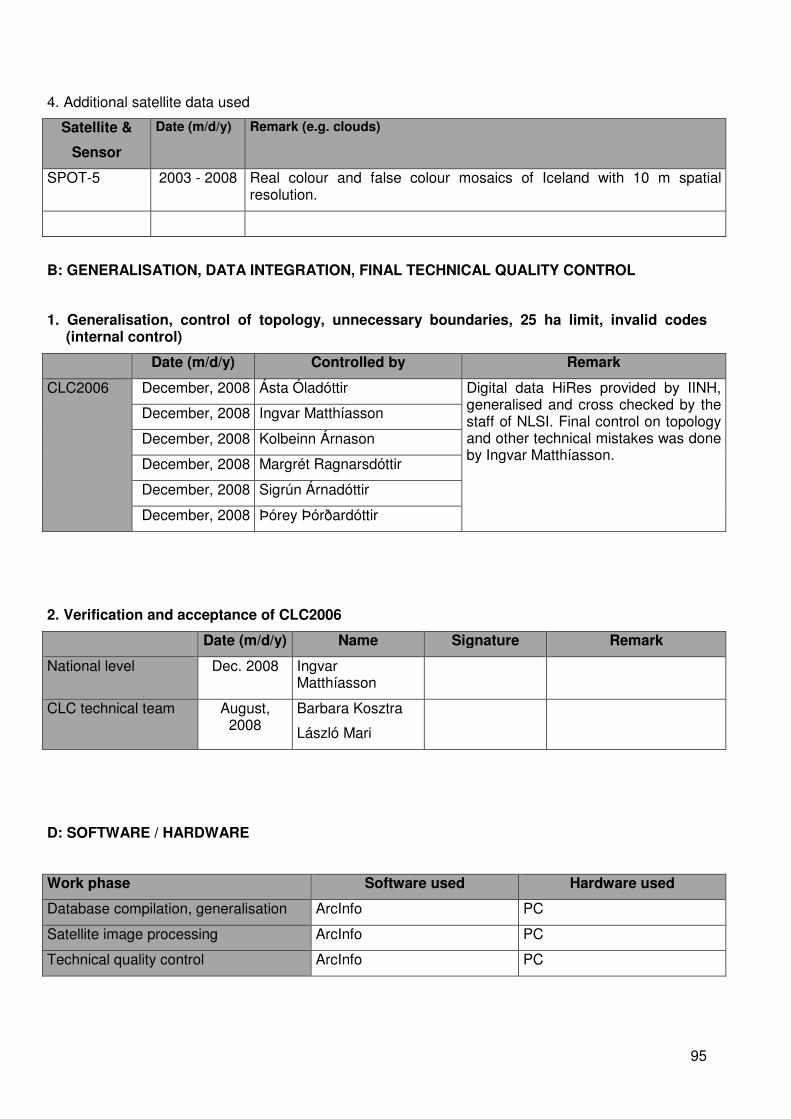
95
4. Additional satellite data used
Satellite &
Sensor
Date (m/d/y) Remark (e.g. clouds)
SPOT-5 2003 - 2008 Real colour and false colour mosaics of Iceland with 10 m spatial resolution.
B: GENERALISATION, DATA INTEGRATION, FINAL TECHNICAL QUALITY CONTROL
1. Generalisation, control of topology, unnecessary boundaries, 25 ha limit, invalid codes (internal control)
Date (m/d/y) Controlled by Remark
CLC2006 December, 2008 Ásta Óladóttir Digital data HiRes provided by IINH, generalised and cross checked by the staff of NLSI. Final control on topology and other technical mistakes was done by Ingvar Matthíasson.
December, 2008 Ingvar Matthíasson
December, 2008 Kolbeinn Árnason
December, 2008 Margrét Ragnarsdóttir
December, 2008 Sigrún Árnadóttir
December, 2008 Þórey Þórðardóttir
2. Verification and acceptance of CLC2006
Date (m/d/y) Name Signature Remark
National level Dec. 2008 Ingvar Matthíasson
CLC technical team August, 2008
Barbara Kosztra
László Mari
D: SOFTWARE / HARDWARE
Work phase Software used Hardware used
Database compilation, generalisation ArcInfo PC
Satellite image processing ArcInfo PC
Technical quality control ArcInfo PC

96
Title of working layer: 423 INTERTIDAL FLATS
A: GENERAL INFORMATION
Sponsor: National Land Survey of Iceland NLSI
Contractor / data provider:
The Icelandic Coast Guard, Hydrographic Department
Address: Stillholt 16-18, 300 Akranes
Address: Skógarhlíð 14, 105 Reykjavík
Phone: +354/ 430-9000 Phone: +354/ 545-2000
Fax: +354/ 430-9090 Fax: +354/ 545-2101
Responsible:
Kolbeinn Árnason Project leader: Árni Þór Vésteinsson
E-mail: [email protected] E-mail: [email protected]
1. Main data used (thematic data, aerial photos, city maps, vegetation maps, etc.)
ID Data source/type Data providers and remarks
423 Digital hydrographic maps, aerial photos, satellite images.
The Icelandic Coast Guard, Hydrographic Department, University of Iceland (UI).
2. Topographic maps used
Scale Title/Name
Year of
production
Remark
1:50 000 IS 50V 1999-2003 Digital Vector Database of the NLSI from AMS and DMA maps, updated on a regular basis.
1:100 000 Atlas 1900-1935 87 scanned paper sheets.
1:50 000 AMS 1946-1951 105 scanned paper sheets.
1:50 000 DMA 1977-1997 128 scanned paper sheets.
3. IMAGE2006 satellite data used
Satellite &
Sensor
Date (m/d/y) Remark (e.g. clouds)
SPOT-5, SPOT-4
Mainly 2006, only few 2005 and 2007 images.
A total of 76 images. One complete cloud free coverage of Iceland.
4. Additional satellite data used
Satellite &
Sensor
Date (m/d/y) Remark (e.g. clouds)
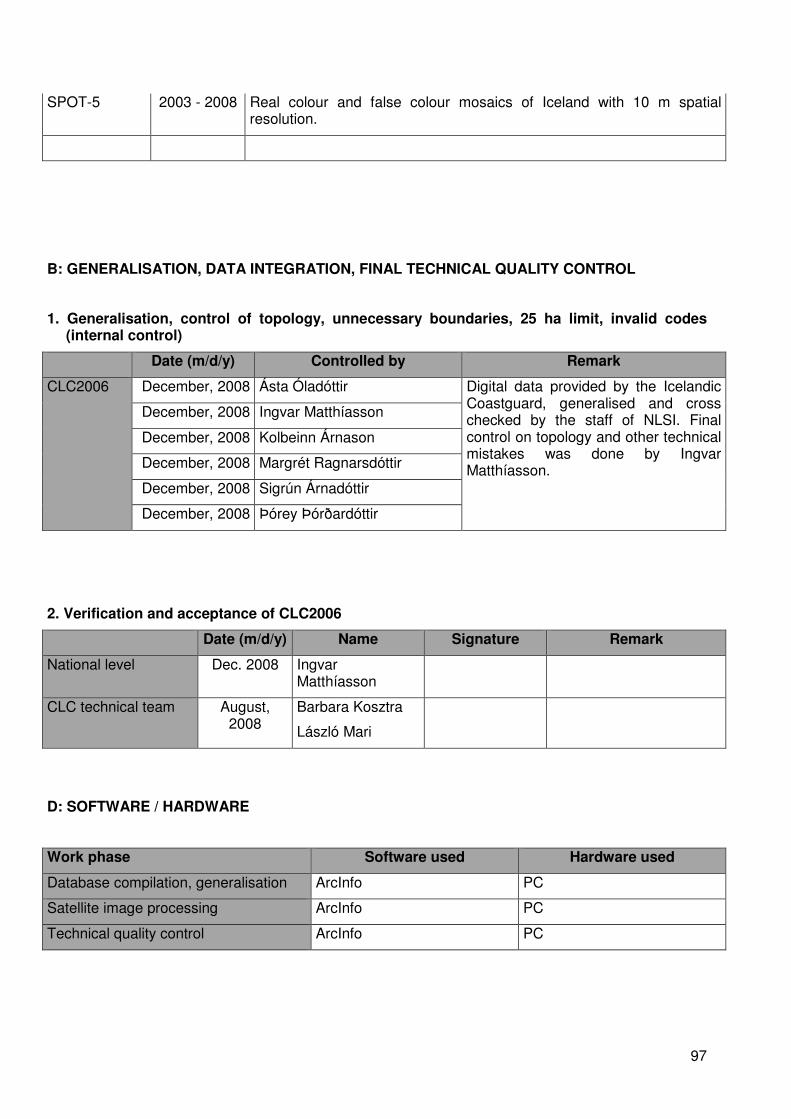
97
SPOT-5 2003 - 2008 Real colour and false colour mosaics of Iceland with 10 m spatial resolution.
B: GENERALISATION, DATA INTEGRATION, FINAL TECHNICAL QUALITY CONTROL
1. Generalisation, control of topology, unnecessary boundaries, 25 ha limit, invalid codes (internal control)
Date (m/d/y) Controlled by Remark
CLC2006 December, 2008 Ásta Óladóttir Digital data provided by the Icelandic Coastguard, generalised and cross checked by the staff of NLSI. Final control on topology and other technical mistakes was done by Ingvar Matthíasson.
December, 2008 Ingvar Matthíasson
December, 2008 Kolbeinn Árnason
December, 2008 Margrét Ragnarsdóttir
December, 2008 Sigrún Árnadóttir
December, 2008 Þórey Þórðardóttir
2. Verification and acceptance of CLC2006
Date (m/d/y) Name Signature Remark
National level Dec. 2008 Ingvar Matthíasson
CLC technical team August, 2008
Barbara Kosztra
László Mari
D: SOFTWARE / HARDWARE
Work phase Software used Hardware used
Database compilation, generalisation ArcInfo PC
Satellite image processing ArcInfo PC
Technical quality control ArcInfo PC
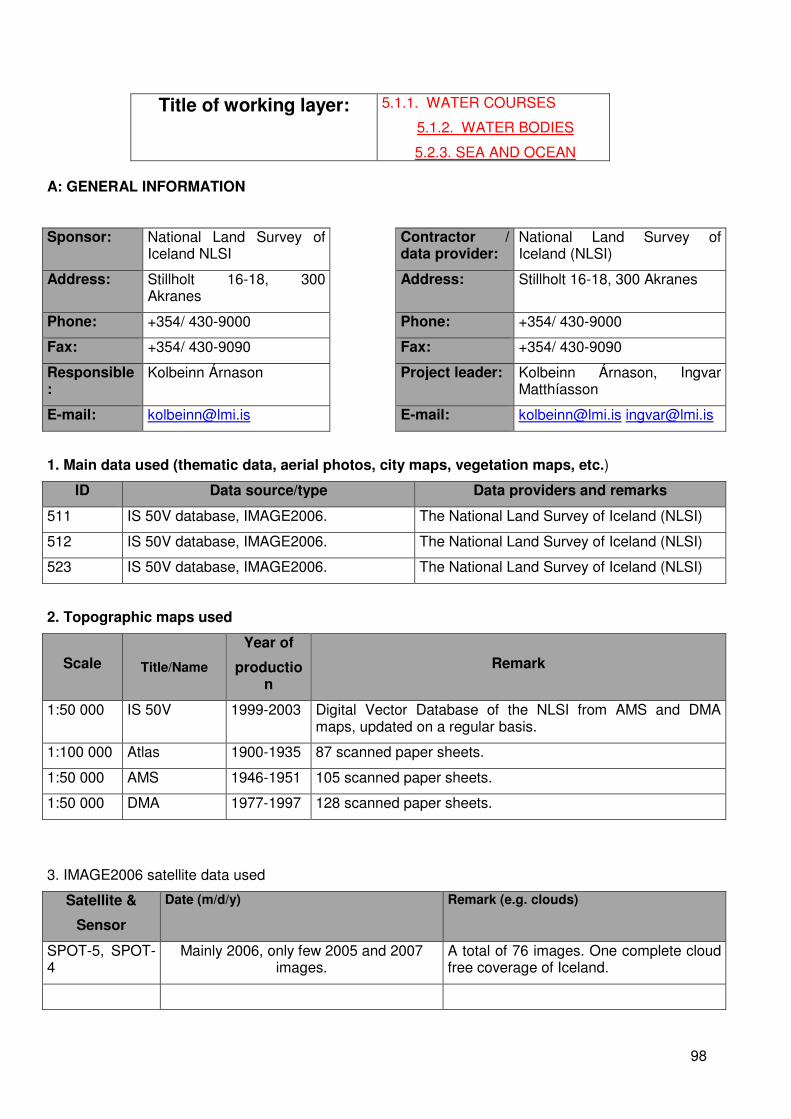
98
Title of working layer: 5.1.1. WATER COURSES
5.1.2. WATER BODIES
5.2.3. SEA AND OCEAN A: GENERAL INFORMATION
Sponsor: National Land Survey of Iceland NLSI
Contractor / data provider:
National Land Survey of Iceland (NLSI)
Address: Stillholt 16-18, 300 Akranes
Address: Stillholt 16-18, 300 Akranes
Phone: +354/ 430-9000 Phone: +354/ 430-9000
Fax: +354/ 430-9090 Fax: +354/ 430-9090
Responsible:
Kolbeinn Árnason Project leader: Kolbeinn Árnason, Ingvar Matthíasson
E-mail: [email protected] E-mail: [email protected] [email protected]
1. Main data used (thematic data, aerial photos, city maps, vegetation maps, etc.)
ID Data source/type Data providers and remarks
511 IS 50V database, IMAGE2006. The National Land Survey of Iceland (NLSI)
512 IS 50V database, IMAGE2006. The National Land Survey of Iceland (NLSI)
523 IS 50V database, IMAGE2006. The National Land Survey of Iceland (NLSI)
2. Topographic maps used
Scale Title/Name
Year of
production
Remark
1:50 000 IS 50V 1999-2003 Digital Vector Database of the NLSI from AMS and DMA maps, updated on a regular basis.
1:100 000 Atlas 1900-1935 87 scanned paper sheets.
1:50 000 AMS 1946-1951 105 scanned paper sheets.
1:50 000 DMA 1977-1997 128 scanned paper sheets.
3. IMAGE2006 satellite data used
Satellite &
Sensor
Date (m/d/y) Remark (e.g. clouds)
SPOT-5, SPOT-4
Mainly 2006, only few 2005 and 2007 images.
A total of 76 images. One complete cloud free coverage of Iceland.

99
4. Additional satellite data used
Satellite &
Sensor
Date (m/d/y) Remark (e.g. clouds)
SPOT-5 2003 - 2008 Real colour and false colour mosaics of Iceland with 10 m spatial resolution.
B: GENERALISATION, DATA INTEGRATION, FINAL TECHNICAL QUALITY CONTROL
1. Generalisation, control of topology, unnecessary boundaries, 25 ha limit, invalid codes (internal control)
Date (m/d/y) Controlled by Remark
CLC2006 December, 2008 Ásta Óladóttir Data from the IS 50V vector database was generalised and cross checked by the staff of NLSI. Final control on topology and other technical mistakes was done by Ingvar Matthíasson.
December, 2008 Ingvar Matthíasson
December, 2008 Kolbeinn Árnason
December, 2008 Margrét Ragnarsdóttir
December, 2008 Sigrún Árnadóttir
December, 2008 Þórey Þórðardóttir
December, 2008 Saulius Prizginas
December, 2008 Suzanne Slegers
2. Verification and acceptance of CLC2006
Date (m/d/y) Name Signature Remark
National level Dec. 2008 Ingvar Matthíasson
CLC technical team August, 2008
Barbara Kosztra
László Mari
D: SOFTWARE / HARDWARE
Work phase Software used Hardware used
Database compilation, generalisation ArcInfo PC
Satellite image processing ArcInfo PC
Technical quality control ArcInfo PC
Title of working layer: 521 COASTAL LAGOONS

100
A: GENERAL INFORMATION
Sponsor: National Land Survey of Iceland NLSI
Contractor / data provider:
National Land Survey of Iceland (NLSI)
Address: Stillholt 16-18, 300 Akranes
Address: Stillholt 16-18, 300 Akranes
Phone: +354/ 430-9000 Phone: +354/ 430-9000
Fax: +354/ 430-9090 Fax: +354/ 430-9090
Responsible:
Kolbeinn Árnason Project leader: Kolbeinn Árnason, Ingvar Matthíasson
E-mail: [email protected] E-mail: [email protected] [email protected]
1. Main data used (thematic data, aerial photos, city maps, vegetation maps, etc.)
ID Data source/type Data providers and remarks
521 IS 50V database, IMAGE2006, reports and publications.
The National Land Survey of Iceland (NLSI), University of Iceland, Biological department.
2. Topographic maps used
Scale Title/Name
Year of
production
Remark
1:50 000 IS 50V 1999-2003 Digital Vector Database of the NLSI from AMS and DMA maps, updated on a regular basis.
1:100 000 Atlas 1900-1935 87 scanned paper sheets.
1:50 000 AMS 1946-1951 105 scanned paper sheets.
1:50 000 DMA 1977-1997 128 scanned paper sheets.
3. IMAGE2006 satellite data used
Satellite &
Sensor
Date (m/d/y) Remark (e.g. clouds)
SPOT-5, SPOT-4
Mainly 2006, only few 2005 and 2007 images.
A total of 76 images. One complete cloud free coverage of Iceland.
4. Additional satellite data used
Satellite &
Sensor
Date (m/d/y) Remark (e.g. clouds)

101
SPOT-5 2003 - 2008 Real colour and false colour mosaics of Iceland with 10 m spatial resolution.
B: GENERALISATION, DATA INTEGRATION, FINAL TECHNICAL QUALITY CONTROL
1. Generalisation, control of topology, unnecessary boundaries, 25 ha limit, invalid codes (internal control)
Date (m/d/y) Controlled by Remark
CLC2006 December, 2008 Ásta Óladóttir Data from the IS 50V vector database was generalised and cross checked by the staff of NLSI. Final control on topology and other technical mistakes was done by Ingvar Matthíasson.
December, 2008 Ingvar Matthíasson
December, 2008 Kolbeinn Árnason
December, 2008 Suzanne Schlegers
December, 2008 Margrét Ragnarsdóttir
December, 2008 Sigrún Árnadóttir
December, 2008 Þórey Þórðardóttir
2. Verification and acceptance of CLC2006
Date (m/d/y) Name Signature Remark
National level Dec. 2008 Ingvar Matthíasson
CLC technical team August, 2008
Barbara Kosztra
László Mari
D: SOFTWARE / HARDWARE
Work phase Software used Hardware used
Database compilation, generalisation ArcInfo PC
Satellite image processing ArcInfo PC
Technical quality control ArcInfo PC

102
Title of working layer: 5.2.2. ESTUARIES
A: GENERAL INFORMATION
Sponsor: National Land Survey of Iceland NLSI
Contractor / data provider:
Institute of Freshwater Fisheries
Address: Stillholt 16-18, 300 Akranes
Address: Keldnaholti, 112 Reykjavík
Phone: +354/ 430-9000 Phone: +354/ 580-6300
Fax: +354/ 430-9090 Fax: +354/ 580-6301
Responsible:
Kolbeinn Árnason Project leader: Ingi Rúnar Jónsson
E-mail: [email protected] E-mail: [email protected]
1. Main data used (thematic data, aerial photos, city maps, vegetation maps, etc.)
ID Data source/type Data providers and remarks
522 IMAGE2006, reports and personal communication with local people.
Institute of Freshwater Fisheries (IFF).
2. Topographic maps used
Scale Title/Name
Year of
production
Remark
1:50 000 IS 50V 1999-2003 Digital Vector Database of the NLSI from AMS and DMA maps, updated on a regular basis.
1:100 000 Atlas 1900-1935 87 scanned paper sheets.
1:50 000 AMS 1946-1951 105 scanned paper sheets.
1:50 000 DMA 1977-1997 128 scanned paper sheets.
3. IMAGE2006 satellite data used
Satellite &
Sensor
Date (m/d/y) Remark (e.g. clouds)
SPOT-5, SPOT-4
Mainly 2006, only few 2005 and 2007 images.
A total of 76 images. One complete cloud free coverage of Iceland.
4. Additional satellite data used

103
Satellite &
Sensor
Date (m/d/y) Remark (e.g. clouds)
SPOT-5 2003 - 2008 Real colour and false colour mosaics of Iceland with 10 m spatial resolution.
B: GENERALISATION, DATA INTEGRATION, FINAL TECHNICAL QUALITY CONTROL
1. Generalisation, control of topology, unnecessary boundaries, 25 ha limit, invalid codes (internal control)
Date (m/d/y) Controlled by Remark
CLC2006 December, 2008 Ásta Óladóttir Data provided by IFF, then generalised and cross checked by the staff of NLSI. Final control on topology and other technical mistakes was done by Ingvar Matthíasson.
December, 2008 Ingvar Matthíasson
December, 2008 Kolbeinn Árnason
December 5, 2008 Margrét Ragnarsdóttir
December 5, 2008 Sigrún Árnadóttir
December 5, 2008 Þórey Þórðardóttir
2. Verification and acceptance of CLC2006
Date (m/d/y) Name Signature Remark
National level Dec. 2008 Ingvar Matthíasson
CLC technical team August, 2008
Barbara Kosztra
László Mari
D: SOFTWARE / HARDWARE
Work phase Software used Hardware used
Database compilation, generalisation ArcInfo PC
Satellite image processing ArcInfo PC
Technical quality control ArcInfo PC
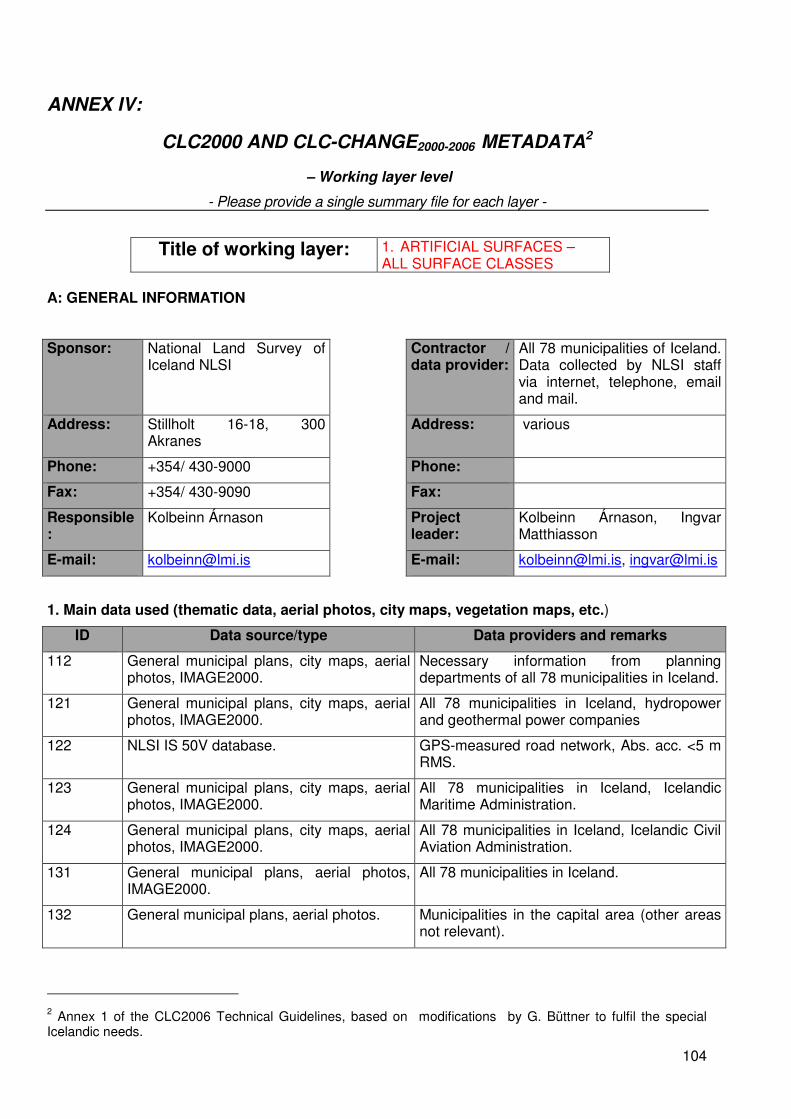
104
ANNEX IV:
CLC2000 AND CLC-CHANGE2000-2006 METADATA2
– Working layer level
- Please provide a single summary file for each layer -
Title of working layer: 1. ARTIFICIAL SURFACES – ALL SURFACE CLASSES
A: GENERAL INFORMATION
Sponsor: National Land Survey of Iceland NLSI
Contractor / data provider:
All 78 municipalities of Iceland. Data collected by NLSI staff via internet, telephone, email and mail.
Address: Stillholt 16-18, 300 Akranes
Address: various
Phone: +354/ 430-9000 Phone:
Fax: +354/ 430-9090 Fax:
Responsible:
Kolbeinn Árnason Project leader:
Kolbeinn Árnason, Ingvar Matthiasson
E-mail: [email protected] E-mail: [email protected], [email protected]
1. Main data used (thematic data, aerial photos, city maps, vegetation maps, etc.)
ID Data source/type Data providers and remarks
112 General municipal plans, city maps, aerial photos, IMAGE2000.
Necessary information from planning departments of all 78 municipalities in Iceland.
121 General municipal plans, city maps, aerial photos, IMAGE2000.
All 78 municipalities in Iceland, hydropower and geothermal power companies
122 NLSI IS 50V database. GPS-measured road network, Abs. acc. <5 m RMS.
123 General municipal plans, city maps, aerial photos, IMAGE2000.
All 78 municipalities in Iceland, Icelandic Maritime Administration.
124 General municipal plans, city maps, aerial photos, IMAGE2000.
All 78 municipalities in Iceland, Icelandic Civil Aviation Administration.
131 General municipal plans, aerial photos, IMAGE2000.
All 78 municipalities in Iceland.
132 General municipal plans, aerial photos. Municipalities in the capital area (other areas not relevant).
2 Annex 1 of the CLC2006 Technical Guidelines, based on modifications by G. Büttner to fulfil the special Icelandic needs.

105
133 General municipal plans, city maps, aerial photos, IMAGE2000.
Municipalities, power companies, Icelandic Road Administration.
141 General municipal plans, city maps, aerial photos, IMAGE2000.
All 78 municipalities in Iceland.
142 General municipal plans, city maps, aerial photos, IMAGE2000.
All 78 municipalities in Iceland, Golf Union of Iceland.
2. Topographic maps used
Scale Title/Name
Year of
production
Remark
1:50 000 IS 50V 1999-2003 Digital Vector Database of the NLSI from AMS and DMA maps, updated on a regular basis.
1:100 000 Atlas 1900-1935 87 scanned paper sheets.
1:50 000 AMS 1946-1951 105 scanned paper sheets.
1:50 000 DMA 1977-1997 128 scanned paper sheets.
3. IMAGE2000 satellite data used
Satellite &
Sensor
Date (m/d/y) Remark (e.g. clouds)
Landsat-7, TM 8 images from 2000, 3 images from 1999, one from 2001 and 2002 respectively.
A total of 13 images. Some images are of very poor quality (snow, clouds). The whole country not totally covered by cloud free data.
4. Additional satellite data used
Satellite &
Sensor
Date (m/d/y) Remark (e.g. clouds)
None
B: GENERALISATION, DATA INTEGRATION, FINAL TECHNICAL QUALITY CONTROL
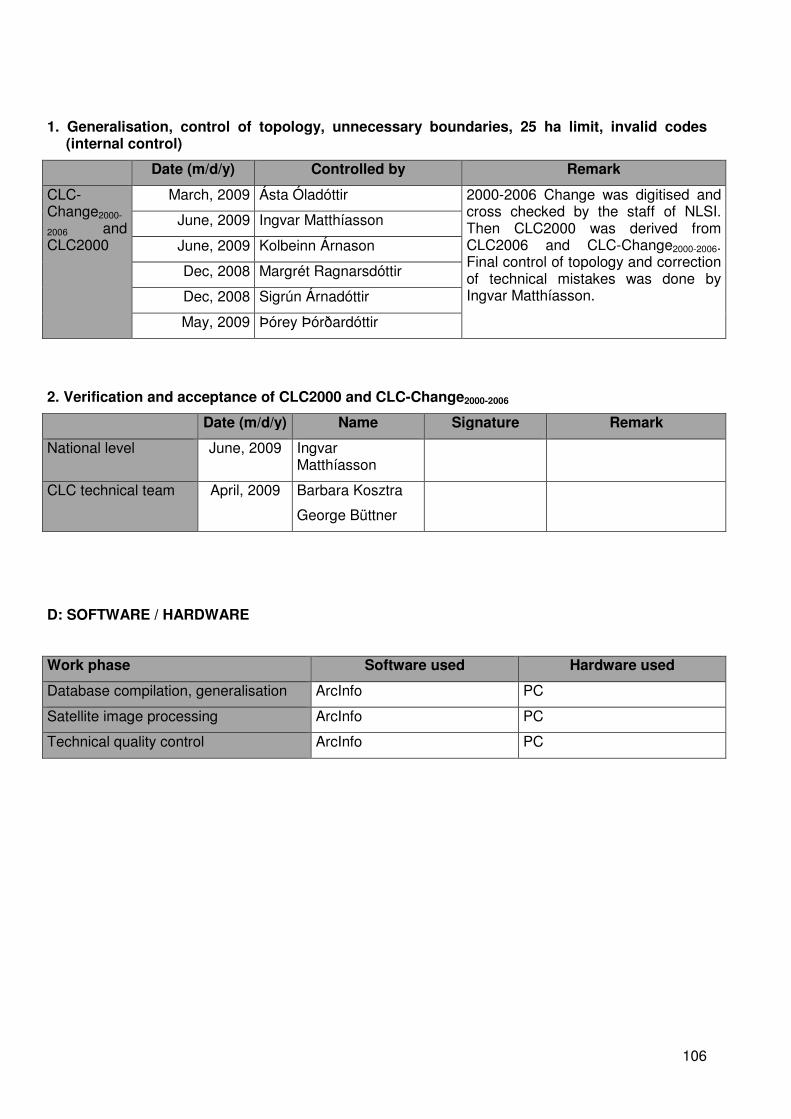
106
1. Generalisation, control of topology, unnecessary boundaries, 25 ha limit, invalid codes (internal control)
Date (m/d/y) Controlled by Remark
CLC-Change2000-
2006 and CLC2000
March, 2009 Ásta Óladóttir 2000-2006 Change was digitised and cross checked by the staff of NLSI. Then CLC2000 was derived from CLC2006 and CLC-Change2000-2006. Final control of topology and correction of technical mistakes was done by Ingvar Matthíasson.
June, 2009 Ingvar Matthíasson
June, 2009 Kolbeinn Árnason
Dec, 2008 Margrét Ragnarsdóttir
Dec, 2008 Sigrún Árnadóttir
May, 2009 Þórey Þórðardóttir
2. Verification and acceptance of CLC2000 and CLC-Change2000-2006
Date (m/d/y) Name Signature Remark
National level June, 2009 Ingvar Matthíasson
CLC technical team April, 2009 Barbara Kosztra
George Büttner
D: SOFTWARE / HARDWARE
Work phase Software used Hardware used
Database compilation, generalisation ArcInfo PC
Satellite image processing ArcInfo PC
Technical quality control ArcInfo PC

107
Title of working layer: 2. AGRICULTURAL AREAS – ALL SURFACE CLASSES
A: GENERAL INFORMATION
Sponsor: National Land Survey of Iceland NLSI
Contractor / data provider:
Farmers Association mainly, but also personal communication with some farmers by telephone, e-mail and mail.
Address: Stillholt 16-18, 300 Akranes
Address: Bændahöllin Hagatorgi, 101 Reykjavík
Phone: +354/ 430-9000 Phone: +354 / 563 03 00
Fax: +354/ 430-9090 Fax: +354 / 563 03 58
Responsible:
Kolbeinn Árnason Contact person:
Borgar P. Bragason
E-mail: [email protected] E-mail: [email protected]
1. Main data used (thematic data, aerial photos, city maps, vegetation maps, etc.)
ID Data source/type Data providers and remarks
211 Cornfield database of the Farmers Association, IMAGE2000, topographic maps, aerial photos.
Farmers Association of Iceland, personal communication with farmers.
231 IMAGE2000, topographic maps, aerial photos.
Farmers Association of Iceland.
242 Cornfield database of the Farmers Association, IMAGE2000, topographic maps, aerial photos.
Farmers Association of Iceland, personal communication with farmers.
2. Topographic maps used
Scale Title/Name
Year of
production
Remark
1:50 000 IS 50V 1999-2003 Digital Vector Database of the NLSI from AMS and DMA maps, updated on a regular basis.
1:100 000 Atlas 1900-1935 87 scanned paper sheets.
1:50 000 AMS 1946-1951 105 scanned paper sheets.
1:50 000 DMA 1977-1997 128 scanned paper sheets.
3. IMAGE2000 satellite data used
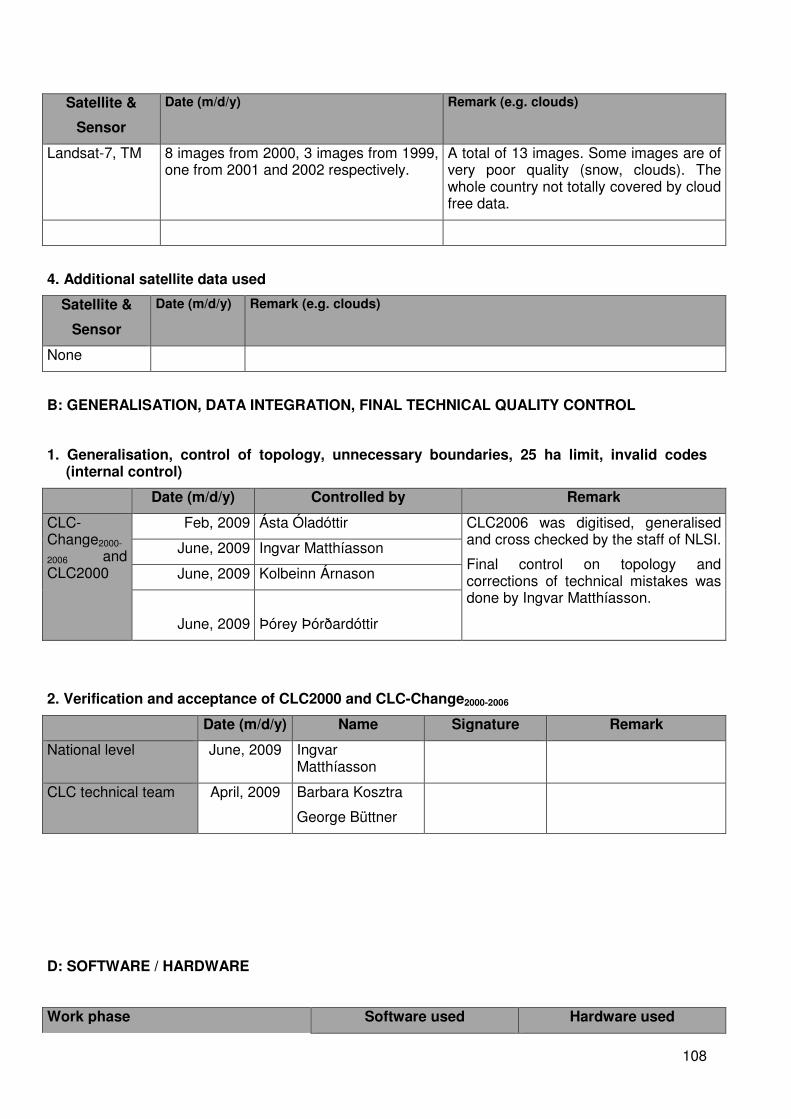
108
Satellite &
Sensor
Date (m/d/y) Remark (e.g. clouds)
Landsat-7, TM 8 images from 2000, 3 images from 1999, one from 2001 and 2002 respectively.
A total of 13 images. Some images are of very poor quality (snow, clouds). The whole country not totally covered by cloud free data.
4. Additional satellite data used
Satellite &
Sensor
Date (m/d/y) Remark (e.g. clouds)
None
B: GENERALISATION, DATA INTEGRATION, FINAL TECHNICAL QUALITY CONTROL
1. Generalisation, control of topology, unnecessary boundaries, 25 ha limit, invalid codes (internal control)
Date (m/d/y) Controlled by Remark
CLC-Change2000-
2006 and CLC2000
Feb, 2009 Ásta Óladóttir CLC2006 was digitised, generalised and cross checked by the staff of NLSI.
Final control on topology and corrections of technical mistakes was done by Ingvar Matthíasson.
June, 2009 Ingvar Matthíasson
June, 2009 Kolbeinn Árnason
June, 2009 Þórey Þórðardóttir
2. Verification and acceptance of CLC2000 and CLC-Change2000-2006
Date (m/d/y) Name Signature Remark
National level June, 2009 Ingvar Matthíasson
CLC technical team April, 2009 Barbara Kosztra
George Büttner
D: SOFTWARE / HARDWARE
Work phase Software used Hardware used

109
Database compilation, generalisation ArcInfo PC
Satellite image processing ArcInfo PC
Technical quality control ArcInfo PC

110
Title of working layer: 3.1.1. BROAD LEAVED FOREST 3.1.2. CONIFEROUS FOREST 3.1.3. MIXED FOREST 3.2.4. TRANSITIONAL WOODLAND
A: GENERAL INFORMATION
Sponsor: National Land Survey of Iceland NLSI
Contractor / data provider:
Iceland Forestry Service
Address: Stillholt 16-18, 300 Akranes
Address: Mógilsá, Kjalarnes, 116 Reykjavík
Phone: +354/ 430-9000 Phone: +354/ 5154500
Fax: +354/ 430-9090 Fax: +354/ 5154501
Responsible:
Kolbeinn Árnason Project leader: Arnór Snorrason
E-mail: [email protected] E-mail: [email protected]
1. Main data used (thematic data, aerial photos, city maps, vegetation maps, etc.)
ID Data source/type Data providers and remarks
311 GPS-measured polygons, field observations, aerial photographs.
Iceland Forestry Service (IFS)
312 GPS-measured polygons, field observations, aerial photographs.
Iceland Forestry Service (IFS)
313 GPS-measured polygons, field observations, aerial photographs.
Iceland Forestry Service (IFS)
324 GPS-measured polygons, field observations, aerial photographs.
Iceland Forestry Service (IFS)
2. Topographic maps used
Scale Title/Name
Year of
production
Remark
1:50 000 IS 50V 1999-2003 Digital Vector Database of the NLSI from AMS and DMA maps, updated on a regular basis.
1:100 000 Atlas 1900-1935 87 scanned paper sheets.
1:50 000 AMS 1946-1951 105 scanned paper sheets.
1:50 000 DMA 1977-1997 128 scanned paper sheets.
3. IMAGE2000 satellite data used

111
Satellite &
Sensor
Date (m/d/y) Remark (e.g. clouds)
Landsat-7, TM 8 images from 2000, 3 images from 1999, one from 2001 and 2002 respectively.
A total of 13 images. Some images are of very poor quality (snow, clouds). The whole country not totally covered by cloud free data.
4. Additional satellite data used
Satellite &
Sensor
Date (m/d/y) Remark (e.g. clouds)
None
B: GENERALISATION, DATA INTEGRATION, FINAL TECHNICAL QUALITY CONTROL
1. Generalisation, control of topology, unnecessary boundaries, 25 ha limit, invalid codes (internal control)
Date (m/d/y) Controlled by Remark
CLC-Change2000-
2006 and CLC2000
Feb, 2009 Ásta Óladóttir Digital data was provided by the IFS and generalised and cross checked by the staff of NLSI.
Final control of topology and corrections of technical mistakes was done by Ingvar Matthíasson.
June, 2009 Ingvar Matthíasson
June, 2009 Kolbeinn Árnason
June, 2009 Þórey Þórðardóttir
2. Verification and acceptance of CLC2000 and CLC-Change2000-2006
Date (m/d/y) Name Signature Remark
National level June, 2009 Ingvar Matthíasson
CLC technical team April, 2009 Barbara Kosztra
George Büttner
D: SOFTWARE / HARDWARE
Work phase Software used Hardware used

112
Database compilation, generalisation ArcInfo PC
Satellite image processing ArcInfo PC
Technical quality control ArcInfo PC

113
Title of working layer: 3 2.1. NATURAL GRASSLAND 3.2.2. MOORS AND HEATH LAND 3.3.1. BEACHES, DUNES AND SAND PLAINS 3.3.2. BARE ROCKS 3.3.3. SPARSELY VEGETATED AREAS 4.1.2. PEAT BOGS
A: GENERAL INFORMATION
Sponsor: National Land Survey of Iceland NLSI
Contractor / data provider:
Agricultural University of Iceland
Address: Stillholt 16-18, 300 Akranes
Address: Hvanneyri, 311 Borgarnes
Phone: +354/ 430-9000 Phone: +354/ 433-5000
Fax: +354/ 430-9090 Fax: +354/ 433-5001
Responsible:
Kolbeinn Árnason Project leader: Ólafur Arnalds
E-mail: [email protected] E-mail: [email protected]
1. Main data used (thematic data, aerial photos, city maps, vegetation maps, etc.)
ID Data source/type Data providers and remarks
321 Raster data based on extensive field work, 12.800 filed control points, 7.700 check-up points, 20.500 field photos. IMAGE2006.
Agricultural University of Iceland (AUI). CLC based on semi-automatic classification of Landsat 7 and SPOT images. Raster results vectorised at NLSI.
322 Raster data based on extensive field work, 12.800 field control points, 7.700 check-up points, 20.500 field photos. IMAGE2000.
Agricultural University of Iceland (AUI). CLC based on semi-automatic classification of Landsat 7 and SPOT images. Raster results vectorised at NLSI.
331 Raster data based on extensive field work, 12.800 fild control points, 7.700 check-up points, 20.500 field photos. IMAGE2000.
Agricultural University of Iceland (AUI). CLC based on semi-automatic classification of Landsat 7 and SPOT images. Raster results vectorised at NLSI. Class seperated from 3.3.2. at NLSI by visual interpretation.
332 Raster data based on extensive field work, 12.800 field control points, 7.700 check-up points, 20.500 field photos. IMAGE2000.
Agricultural University of Iceland (AUI). CLC based on semi-automatic classification of Landsat 7 and SPOT images. Raster results vectorised at NLSI. Class seperated from 3.3.1. at NLSI by visual interpretation.
333 Raster data based on extensive field work, 12.800 field control points, 7.700 check-up points, 20.500 field photos. IMAGE2000.
Agricultural University of Iceland (AUI). CLC based on semi-automatic classification of Landsat 7 and SPOT images. Raster results vectorised at NLSI.
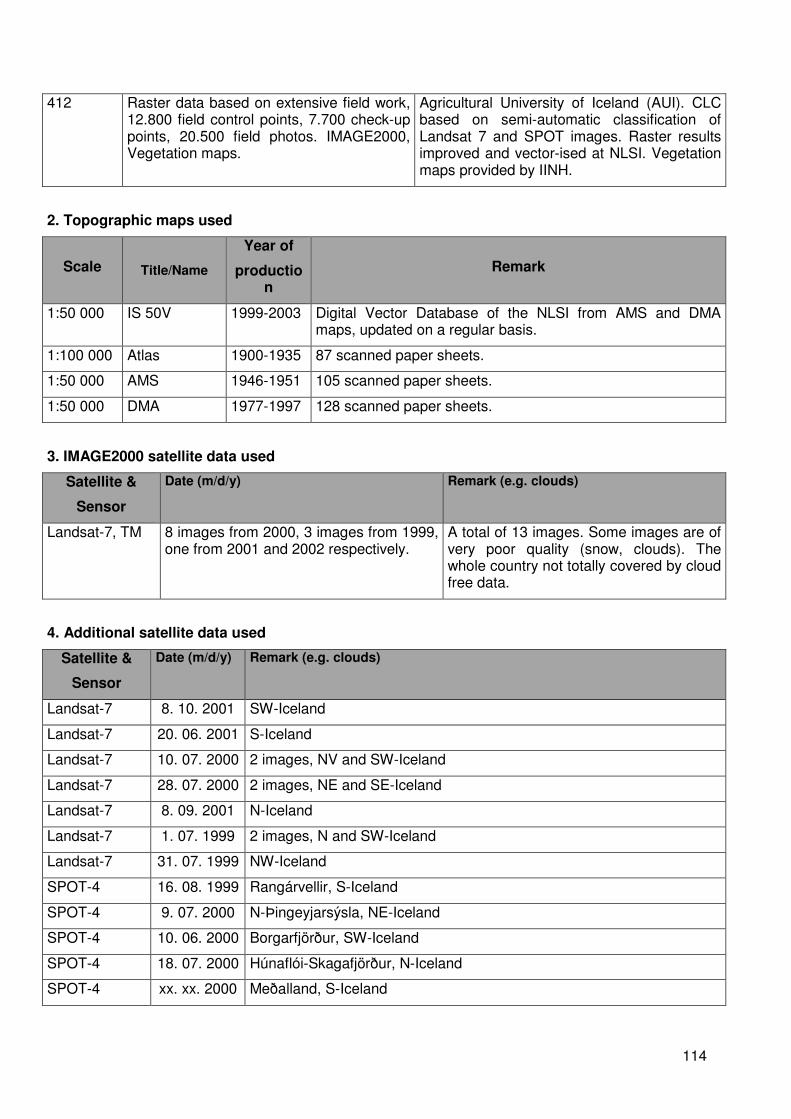
114
412 Raster data based on extensive field work, 12.800 field control points, 7.700 check-up points, 20.500 field photos. IMAGE2000, Vegetation maps.
Agricultural University of Iceland (AUI). CLC based on semi-automatic classification of Landsat 7 and SPOT images. Raster results improved and vector-ised at NLSI. Vegetation maps provided by IINH.
2. Topographic maps used
Scale Title/Name
Year of
production
Remark
1:50 000 IS 50V 1999-2003 Digital Vector Database of the NLSI from AMS and DMA maps, updated on a regular basis.
1:100 000 Atlas 1900-1935 87 scanned paper sheets.
1:50 000 AMS 1946-1951 105 scanned paper sheets.
1:50 000 DMA 1977-1997 128 scanned paper sheets.
3. IMAGE2000 satellite data used
Satellite &
Sensor
Date (m/d/y) Remark (e.g. clouds)
Landsat-7, TM 8 images from 2000, 3 images from 1999, one from 2001 and 2002 respectively.
A total of 13 images. Some images are of very poor quality (snow, clouds). The whole country not totally covered by cloud free data.
4. Additional satellite data used
Satellite &
Sensor
Date (m/d/y) Remark (e.g. clouds)
Landsat-7 8. 10. 2001 SW-Iceland
Landsat-7 20. 06. 2001 S-Iceland
Landsat-7 10. 07. 2000 2 images, NV and SW-Iceland
Landsat-7 28. 07. 2000 2 images, NE and SE-Iceland
Landsat-7 8. 09. 2001 N-Iceland
Landsat-7 1. 07. 1999 2 images, N and SW-Iceland
Landsat-7 31. 07. 1999 NW-Iceland
SPOT-4 16. 08. 1999 Rangárvellir, S-Iceland
SPOT-4 9. 07. 2000 N-Þingeyjarsýsla, NE-Iceland
SPOT-4 10. 06. 2000 Borgarfjörður, SW-Iceland
SPOT-4 18. 07. 2000 Húnaflói-Skagafjörður, N-Iceland
SPOT-4 xx. xx. 2000 Meðalland, S-Iceland

115
B: GENERALISATION, DATA INTEGRATION, FINAL TECHNICAL QUALITY CONTROL
1. Generalisation, control of topology, unnecessary boundaries, 25 ha limit, invalid codes (internal control)
Date (m/d/y) Controlled by Remark
CLC-Change2000-
2006 and CLC2000
Feb, 2009 Ásta Óladóttir Raster results of AUI semi-automated classification vectorised, generalised and cross checked by the staff of NLSI. Final control of topology and corrections of technical mistakes was done by Ingvar Matthíasson.
June, 2009 Ingvar Matthíasson
June, 2009 Kolbeinn Árnason
June, 2009 Þórey Þórðardóttir
2. Verification and acceptance of CLC2000 and CLC-Change 2000-2006
Date (m/d/y) Name Signature Remark
National level June, 2009 Ingvar Matthíasson
CLC technical team April, 2009 Barbara Kosztra
George Büttner
D: SOFTWARE / HARDWARE
Work phase Software used Hardware used
Database compilation, generalisation ArcInfo PC
Satellite image processing ArcInfo, Erdas Imagine PC
Technical quality control ArcInfo PC

116
Title of working layer: 3.3.5 GLACIERS AND PERPETUAL SNOW
A: GENERAL INFORMATION
Sponsor: National Land Survey of Iceland NLSI
Contractor / data provider:
National Energy Authority
Address: Stillholt 16-18, 300 Akranes
Address: Grensásvegur 9, 108 Reykjavík
Phone: +354/ 430-9000 Phone: +354/ 569-6000
Fax: +354/ 430-9090 Fax: +354/ 568-8896
Responsible:
Kolbeinn Árnason Project leader: Oddur Sigurðsson
E-mail: [email protected] E-mail: [email protected]
1. Main data used (thematic data, aerial photos, city maps, vegetation maps, etc.)
ID Data source/type Data providers and remarks
335 Vector data based on aerial oblique (stereo) photos, GPS-tracks. IMAGE2000.
National Energy Authority (NEA). Original glacier mapping applies to 2000, changes mapped for CLC2006 by using IMAGE2006.
2. Topographic maps used
Scale Title/Name
Year of
production
Remark
1:50 000 IS 50V 1999-2003 Digital Vector Database of the NLSI from AMS and DMA maps, updated on a regular basis.
1:50 000 DMA 1977-1997 128 scanned paper sheets.
3. IMAGE2000 satellite data used
Satellite &
Sensor
Date (m/d/y) Remark (e.g. clouds)
Landsat-7, TM 8 images from 2000, 3 images from 1999, one from 2001 and 2002 respectively.
A total of 13 images. Some images are of very poor quality (snow, clouds). The whole country not totally covered by cloud free data.
4. Additional satellite data used

117
Satellite &
Sensor
Date (m/d/y) Remark (e.g. clouds)
Landsat-7 2000 ID7219015000023350
Landsat-7 2000 ID7217015000026718
Landsat-7 1999 ID7217015009921650
B: GENERALISATION, DATA INTEGRATION, FINAL TECHNICAL QUALITY CONTROL
1. Generalisation, control of topology, unnecessary boundaries, 25 ha limit, invalid codes (internal control)
Date (m/d/y) Controlled by Remark
CLC-Change2000-
2006 and CLC2000
Feb, 2009 Ásta Óladóttir Digital data provided by NEA, generalised and cross checked by the staff of NLSI. Final control on topology and corrections of technical mistakes was done by Ingvar Matthíasson.
June, 2009 Ingvar Matthíasson
June, 2009 Kolbeinn Árnason
June, 2009 Þórey Þórðardóttir
2. Verification and acceptance of CLC2000 and CLC-Change 2000-2006
Date (m/d/y) Name Signature Remark
National level June, 2009 Ingvar Matthíasson
CLC technical team April, 2009 Barbara Kosztra
George Büttner
D: SOFTWARE / HARDWARE
Work phase Software used Hardware used
Database compilation, generalisation ArcInfo PC
Satellite image processing ArcInfo, Erdas Imagine PC
Technical quality control ArcInfo PC

118
Title of working layer: 4.1.1. INLAND MARSHES 4.2.1. SALT MARSHES
A: GENERAL INFORMATION
Sponsor: National Land Survey of Iceland NLSI
Contractor / data provider:
The Icelandic Institute of Natural History (IINH)
Address: Stillholt 16-18, 300 Akranes
Address: Hlemmi 3, 125 Reykjavík
Phone: +354/ 430-9000 Phone: +354/ 590-0500
Fax: +354/ 430-9090 Fax: +354/ 590-0595
Responsible:
Kolbeinn Árnason Project leader: Guðmundur Guðjónsson
E-mail: [email protected] E-mail: [email protected]
1. Main data used (thematic data, aerial photos, city maps, vegetation maps, etc.)
ID Data source/type Data providers and remarks
411 Vector data based on intensive field observations, aerial photographs, vegetation maps.
The Icelandic Institute of Natural History (IINH), digital HiRes data delivered.
421 Intensive field observations, aerial photographs, vegetation maps.
The Icelandic Institute of Natural History (IINH) and the University of Iceland (UI), digital HiRes data delivered.
2. Topographic maps used
Scale Title/Name
Year of
production
Remark
1:50 000 IS 50V 1999-2003 Digital Vector Database of the NLSI from AMS and DMA maps, updated on a regular basis.
1:100 000 Atlas 1900-1935 87 scanned paper sheets.
1:50 000 AMS 1946-1951 105 scanned paper sheets.
1:50 000 DMA 1977-1997 128 scanned paper sheets.
3. IMAGE2000 satellite data used

119
Satellite &
Sensor
Date (m/d/y) Remark (e.g. clouds)
Landsat-7, TM 8 images from 2000, 3 images from 1999, one from 2001 and 2002 respectively.
A total of 13 images. Some images are of very poor quality (snow, clouds). The whole country not totally covered by cloud free data.
4. Additional satellite data used
Satellite &
Sensor
Date (m/d/y) Remark (e.g. clouds)
None
B: GENERALISATION, DATA INTEGRATION, FINAL TECHNICAL QUALITY CONTROL
1. Generalisation, control of topology, unnecessary boundaries, 25 ha limit, invalid codes (internal control)
Date (m/d/y) Controlled by Remark
CLC-Change2000-
2006 and CLC2000
Feb, 2009 Ásta Óladóttir Digital data HiRes provided by IINH, generalised and cross checked by the staff of NLSI. Final control on topology and technical mistakes was done by Ingvar Matthíasson.
June, 2009 Ingvar Matthíasson
June, 2009 Kolbeinn Árnason
June, 2009 Þórey Þórðardóttir
2. Verification and acceptance of CLC2000 and CLC-Change2000-2006
Date (m/d/y) Name Signature Remark
National level June, 2009 Ingvar Matthíasson
CLC technical team April, 2009 Barbara Kosztra
George Büttner
D: SOFTWARE / HARDWARE
Work phase Software used Hardware used

120
Database compilation, generalisation ArcInfo PC
Satellite image processing ArcInfo PC
Technical quality control ArcInfo PC

121
Title of working layer: 4.2.3. INTERTIDAL FLATS
A: GENERAL INFORMATION
Sponsor: National Land Survey of Iceland NLSI
Contractor / data provider:
The Icelandic Coast Guard, Hydrographic Department
Address: Stillholt 16-18, 300 Akranes
Address: Skógarhlíð 14, 105 Reykjavík
Phone: +354/ 430-9000 Phone: +354/ 545-2000
Fax: +354/ 430-9090 Fax: +354/ 545-2101
Responsible:
Kolbeinn Árnason Project leader: Árni Þór Vésteinsson
E-mail: [email protected] E-mail: [email protected]
1. Main data used (thematic data, aerial photos, city maps, vegetation maps, etc.)
ID Data source/type Data providers and remarks
423 Digital hydrographic maps, aerial photos, satellite images.
The Icelandic Coast Guard, Hydrographic Department, University of Iceland (UI).
2. Topographic maps used
Scale Title/Name
Year of
production
Remark
1:50 000 IS 50V 1999-2003 Digital Vector Database of the NLSI from AMS and DMA maps, updated on a regular basis.
1:100 000 Atlas 1900-1935 87 scanned paper sheets.
1:50 000 AMS 1946-1951 105 scanned paper sheets.
1:50 000 DMA 1977-1997 128 scanned paper sheets.
3. IMAGE2000 satellite data used
Satellite &
Sensor
Date (m/d/y) Remark (e.g. clouds)
Landsat-7, TM 8 images from 2000, 3 images from 1999, one from 2001 and 2002 respectively.
A total of 13 images. Some images are of very poor quality (snow, clouds). The whole country not totally covered by cloud free data.
4. Additional satellite data used

122
Satellite &
Sensor
Date (m/d/y) Remark (e.g. clouds)
None
B: GENERALISATION, DATA INTEGRATION, FINAL TECHNICAL QUALITY CONTROL
1. Generalisation, control of topology, unnecessary boundaries, 25 ha limit, invalid codes (internal control)
Date (m/d/y) Controlled by Remark
CLC-Change2000-
2006 and CLC2000
Feb, 2009 Ásta Óladóttir Digital data provided by the Icelandic Coastguard, generalised and cross checked by the staff of NLSI. Final control on topology and technical mistakes was done by Ingvar Matthíasson.
June, 2009 Ingvar Matthíasson
June, 2009 Kolbeinn Árnason
2. Verification and acceptance of CLC2000 and CLC-Change2000-2006
Date (m/d/y) Name Signature Remark
National level June, 2009 Ingvar Matthíasson
CLC technical team April, 2009 Barbara Kosztra
George Büttner
D: SOFTWARE / HARDWARE
Work phase Software used Hardware used
Database compilation, generalisation ArcInfo PC
Satellite image processing ArcInfo PC
Technical quality control ArcInfo PC

123
Title of working layer: 5.1.1. WATER COURSES
5.1.2. WATER BODIES
5.2.3. SEA AND OCEAN A: GENERAL INFORMATION
Sponsor: National Land Survey of Iceland NLSI
Contractor / data provider:
National Land Survey of Iceland (NLSI)
Address: Stillholt 16-18, 300 Akranes
Address: Stillholt 16-18, 300 Akranes
Phone: +354/ 430-9000 Phone: +354/ 430-9000
Fax: +354/ 430-9090 Fax: +354/ 430-9090
Responsible:
Kolbeinn Árnason Project leader: Kolbeinn Árnason, Ingvar Matthíasson
E-mail: [email protected] E-mail: [email protected] [email protected]
1. Main data used (thematic data, aerial photos, city maps, vegetation maps, etc.)
ID Data source/type Data providers and remarks
511 IS 50V database, IMAGE2006. The National Land Survey of Iceland (NLSI).
512 IS 50V database, IMAGE2006. The National Land Survey of Iceland (NLSI).
523 IS 50V database, IMAGE2006. The National Land Survey of Iceland (NLSI).
2. Topographic maps used
Scale Title/Name
Year of
production
Remark
1:50 000 IS 50V 1999-2003 Digital Vector Database of the NLSI from AMS and DMA maps, updated on a regular basis.
1:100 000 Atlas 1900-1935 87 scanned paper sheets.
1:50 000 AMS 1946-1951 105 scanned paper sheets.
1:50 000 DMA 1977-1997 128 scanned paper sheets.
3. IMAGE2000 satellite data used

124
Satellite &
Sensor
Date (m/d/y) Remark (e.g. clouds)
Landsat-7, TM 8 images from 2000, 3 images from 1999, one from 2001 and 2002 respectively.
A total of 13 images. Some images are of very poor quality (snow, clouds). The whole country not totally covered by cloud free data.
4. Additional satellite data used
Satellite &
Sensor
Date (m/d/y) Remark (e.g. clouds)
None
B: GENERALISATION, DATA INTEGRATION, FINAL TECHNICAL QUALITY CONTROL
1. Generalisation, control of topology, unnecessary boundaries, 25 ha limit, invalid codes (internal control)
Date (m/d/y) Controlled by Remark
CLC-Change2000-
2006 and CLC2000
Feb, 2009 Ásta Óladóttir Data from the IS 50V vector database was generalised and cross checked by the staff of NLSI. Final control on topology and technical mistakes was done by Ingvar Matthíasson.
June, 2009 Ingvar Matthíasson
June, 2009 Kolbeinn Árnason
May, 2009 Þórey Þórðardóttir
2. Verification and acceptance of CLC2006 and CLC-Change2000-2006
Date (m/d/y) Name Signature Remark
National level June, 2009 Ingvar Matthíasson
CLC technical team April, 2009 Barbara Kosztra
George Büttner
D: SOFTWARE / HARDWARE
Work phase Software used Hardware used
Database compilation, generalisation ArcInfo PC
Satellite image processing ArcInfo PC
Technical quality control ArcInfo PC
125
Title of working layer: 5.2.1. COASTAL LAGOONS
A: GENERAL INFORMATION
Sponsor: National Land Survey of Iceland NLSI
Contractor / data provider:
National Land Survey of Iceland (NLSI)
Address: Stillholt 16-18, 300 Akranes
Address: Stillholt 16-18, 300 Akranes
Phone: +354/ 430-9000 Phone: +354/ 430-9000
Fax: +354/ 430-9090 Fax: +354/ 430-9090
Responsible:
Kolbeinn Árnason Project leader: Kolbeinn Árnason, Ingvar Matthíasson
E-mail: [email protected] E-mail: [email protected] [email protected]
1. Main data used (thematic data, aerial photos, city maps, vegetation maps, etc.)
ID Data source/type Data providers and remarks
521 IS 50V database, IMAGE2006, reports and publications.
The National Land Survey of Iceland (NLSI), University of Iceland, Biological department.
2. Topographic maps used
Scale Title/Name
Year of
production
Remark
1:50 000 IS 50V 1999-2003 Digital Vector Database of the NLSI from AMS and DMA maps, updated on a regular basis.
1:100 000 Atlas 1900-1935 87 scanned paper sheets.
1:50 000 AMS 1946-1951 105 scanned paper sheets.
1:50 000 DMA 1977-1997 128 scanned paper sheets.
3. IMAGE2000 satellite data used
Satellite &
Sensor
Date (m/d/y) Remark (e.g. clouds)
Landsat-7, TM 8 images from 2000, 3 images from 1999, one from 2001 and 2002 respectively.
A total of 13 images. Some images are of very poor quality (snow, clouds). The whole country not totally covered by cloud free data.
4. Additional satellite data used

126
Satellite &
Sensor
Date (m/d/y) Remark (e.g. clouds)
None
B: GENERALISATION, DATA INTEGRATION, FINAL TECHNICAL QUALITY CONTROL
1. Generalisation, control of topology, unnecessary boundaries, 25 ha limit, invalid codes (internal control)
Date (m/d/y) Controlled by Remark
CLC-Change2000-
2006 and CLC2000
Feb, 2009 Ásta Óladóttir Data from the IS 50V vector database was generalised and cross checked by the staff of NLSI. Final control on topology and technical mistakes was done by Ingvar Matthíasson.
June, 2009 Ingvar Matthíasson
June, 2009 Kolbeinn Árnason
2. Verification and acceptance of CLC2006 and CLC-Change2000-2006
Date (m/d/y) Name Signature Remark
National level June, 2009 Ingvar Matthíasson
CLC technical team April, 2009 Barbara Kosztra
George Büttner
D: SOFTWARE / HARDWARE
Work phase Software used Hardware used
Database compilation, generalisation ArcInfo PC
Satellite image processing ArcInfo PC
Technical quality control ArcInfo PC

127
Title of working layer: 5.2.2. ESTUARIES
A: GENERAL INFORMATION
Sponsor: National Land Survey of Iceland NLSI
Contractor / data provider:
Institute of Freshwater Fisheries
Address: Stillholt 16-18, 300 Akranes
Address: Keldnaholti, 112 Reykjavík
Phone: +354/ 430-9000 Phone: +354/ 580-6300
Fax: +354/ 430-9090 Fax: +354/ 580-6301
Responsible:
Kolbeinn Árnason Project leader: Ingi Rúnar Jónsson
E-mail: [email protected] E-mail: [email protected]
1. Main data used (thematic data, aerial photos, city maps, vegetation maps, etc.)
ID Data source/type Data providers and remarks
522 IMAGE2006, reports and personal communication with local people.
Institute of Freshwater Fisheries (IFF).
2. Topographic maps used
Scale Title/Name
Year of
production
Remark
1:50 000 IS 50V 1999-2003 Digital Vector Database of the NLSI from AMS and DMA maps, updated on a regular basis.
1:100 000 Atlas 1900-1935 87 scanned paper sheets.
1:50 000 AMS 1946-1951 105 scanned paper sheets.
1:50 000 DMA 1977-1997 128 scanned paper sheets.
3. IMAGE2000 satellite data used
Satellite &
Sensor
Date (m/d/y) Remark (e.g. clouds)
Landsat-7, TM 8 images from 2000, 3 images from 1999, one from 2001 and 2002 respectively.
A total of 13 images. Some images are of very poor quality (snow, clouds). The whole country not totally covered by cloud free data.
4. Additional satellite data used

128
Satellite &
Sensor
Date (m/d/y) Remark (e.g. clouds)
SPOT-5 2003 - 2008 Real colour and false colour mosaics of Iceland with 10 m spatial resolution.
B: GENERALISATION, DATA INTEGRATION, FINAL TECHNICAL QUALITY CONTROL
1. Generalisation, control of topology, unnecessary boundaries, 25 ha limit, invalid codes (internal control)
Date (m/d/y) Controlled by Remark
CLC-Change2000-
2006 and CLC2000
Feb, 2009 Ásta Óladóttir Data provided by IFF, then generalised and cross checked by the staff of NLSI. Final control on topology and technical mistakes was done by Ingvar Matthíasson.
June, 2009 Ingvar Matthíasson
June, 2009 Kolbeinn Árnason
2. Verification and acceptance of CLC2006 and CLC-Change2000-2006
Date (m/d/y) Name Signature Remark
National level June, 2009 Ingvar Matthíasson
CLC technical team April, 2009 Barbara Kosztra
George Büttner
D: SOFTWARE / HARDWARE
Work phase Software used Hardware used
Database compilation, generalisation ArcInfo PC
Satellite image processing ArcInfo PC
Technical quality control ArcInfo PC