Embed Size (px)
Citation preview
CLASS C FLY ASH IN PAVEMENTS
PROJECT: SPR (501)
July 2010
CLASS C FLY ASH IN PAVEMENTS
PROJECT: SPR (501)
FINAL REPORT
PRINCIPAL INVESTIGATORS
Kromel E Hanna, George Morcous, and Maher k Tadros
SPONSORED BY
NEBRASKA DEPARTMENT OF ROADS
OMAHA PUBLIC POWER DISTRICT
NEBRASKA PUBLIC POWER DISTRICT
July 2010
TECHNICAL REPORT DOCUMENTATION PAGE
1. Report No.
2. Government Accession No. 3. Recipient’s Catalog No.
1. Title and Subtitle
CLASS C FLY ASH IN PAVEMENTS
2. Report Date
July, 2010
3. Performing Organization Code
4. Author(s)
Kromel E. Hanna, George Morcous, and Maher K. Tadros
5. Performing Organization Report
No.
6. Performing Organization Name and Address
Department of Civil Engineering
7. Work Unit No.
University of Nebraska-Lincoln
Omaha, Nebraska 68182-0178
8. Contract or Grant No.
SPR501
9. Sponsoring Agency Name and Address
Nebraska Department of Roads,
Omaha Public Power District (OPPD) and Nebraska Public Power
District (NPPD).
10. Type of Report and Period Covered
Final Report
11. Sponsoring Agency Code
12. Supplementary Notes
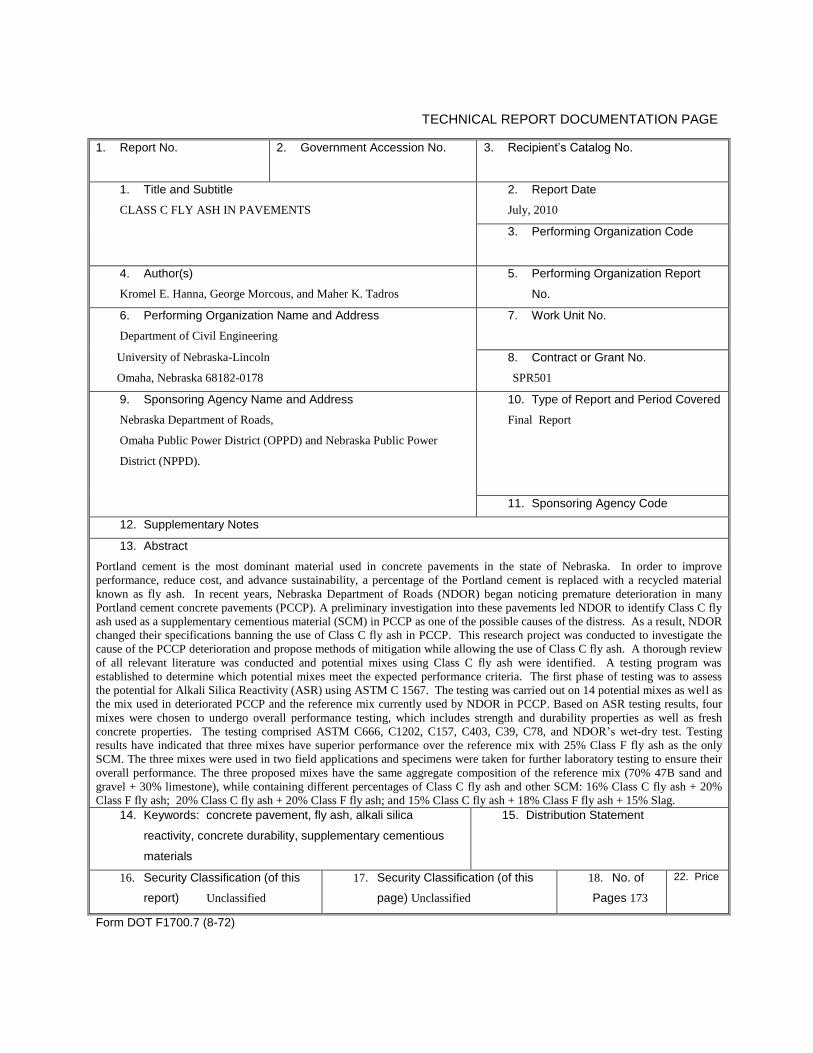
13. Abstract
Portland cement is the most dominant material used in concrete pavements in the state of Nebraska. In order to improve
performance, reduce cost, and advance sustainability, a percentage of the Portland cement is replaced with a recycled material
known as fly ash. In recent years, Nebraska Department of Roads (NDOR) began noticing premature deterioration in many
Portland cement concrete pavements (PCCP). A preliminary investigation into these pavements led NDOR to identify Class C fly
ash used as a supplementary cementious material (SCM) in PCCP as one of the possible causes of the distress. As a result, NDOR
changed their specifications banning the use of Class C fly ash in PCCP. This research project was conducted to investigate the
cause of the PCCP deterioration and propose methods of mitigation while allowing the use of Class C fly ash. A thorough review
of all relevant literature was conducted and potential mixes using Class C fly ash were identified. A testing program was
established to determine which potential mixes meet the expected performance criteria. The first phase of testing was to assess
the potential for Alkali Silica Reactivity (ASR) using ASTM C 1567. The testing was carried out on 14 potential mixes as well as
the mix used in deteriorated PCCP and the reference mix currently used by NDOR in PCCP. Based on ASR testing results, four
mixes were chosen to undergo overall performance testing, which includes strength and durability properties as well as fresh
concrete properties. The testing comprised ASTM C666, C1202, C157, C403, C39, C78, and NDOR’s wet-dry test. Testing
results have indicated that three mixes have superior performance over the reference mix with 25% Class F fly ash as the only
SCM. The three mixes were used in two field applications and specimens were taken for further laboratory testing to ensure their
overall performance. The three proposed mixes have the same aggregate composition of the reference mix (70% 47B sand and
gravel + 30% limestone), while containing different percentages of Class C fly ash and other SCM: 16% Class C fly ash + 20%
Class F fly ash; 20% Class C fly ash + 20% Class F fly ash; and 15% Class C fly ash + 18% Class F fly ash + 15% Slag.
14. Keywords: concrete pavement, fly ash, alkali silica
reactivity, concrete durability, supplementary cementious
materials
15. Distribution Statement
16. Security Classification (of this
report) Unclassified
17. Security Classification (of this
page) Unclassified
18. No. of
Pages 173
22. Price
Form DOT F1700.7 (8-72)

DISCLAIMER
The contents of this report reflect the views of the authors who are responsible for the facts
and the accuracy of the data presented herein. The contents do not necessarily reflect the official
views or policies of the Nebraska Department of Roads, nor of the University of Nebraska-
Lincoln. This report does not constitute a standard, specification, or regulation. Trade or
manufacturers’ names, which may appear in this report, are cited only because they are
considered essential to the objectives of the report. The United States (U.S.) government and the
State of Nebraska do not endorse products or manufacturers.
ACKNOWLEDGEMENTS
This project was sponsored by the Nebraska Department of Roads (NDOR), Omaha Public
Power District (OPPD) and Nebraska Public Power District (NPPD). The support of the
technical advisory committee (TAC) members is gratefully acknowledged. They spent a lot of
time and effort in coordinating this project, discussing its technical direction, and inspiring the
university researchers.
Acknowledgement also goes to the following graduate students who participated in the different
tasks of the project:
1- Matt J Kleymann
2- Cesar Garcia
3- Nicholas P Reiser
4- Marc Maguire
5- Faten Fawzy
6- Nathanael J Toenies
ABSTRACT
Portland cement is the most dominant material used in concrete pavements in the state of Nebraska. In
order to improve performance, reduce cost, and advance sustainability, a percentage of the Portland
cement is replaced with a recycled material known as fly ash. In recent years, Nebraska Department of
Roads (NDOR) began noticing premature deterioration in many Portland cement concrete pavements
(PCCP). A preliminary investigation into these pavements led NDOR to identify Class C fly ash used as a
supplementary cementious material (SCM) in PCCP as one of the possible causes of the distress .
As a result, NDOR changed their specifications banning the use of Class C fly ash in PCCP until further
investigation. This research project was conducted to investigate the cause of the PCCP deterioration and
propose methods of mitigation while allowing the use of Class C fly ash. A thorough review of all
relevant literature was conducted and potential mixes using Class C fly ash were identified. A testing
program was established to determine which potential mixes meet the expected performance criteria. The
first phase of testing was to assess the potential for Alkali Silica Reactivity (ASR) using ASTM C 1567.
The testing was carried out on 14 potential mixes as well as the mix used in deteriorated PCCP and the
reference mix currently used by NDOR in PCCP. Based on ASR testing results, four mixes were chosen
to undergo overall performance testing, which includes strength and durability properties as well as fresh
concrete properties. The testing comprised ASTM C666, C1202, C157, C403, C39, C78, and NDOR’s
wet-dry test. Testing results have indicated that three mixes have superior performance over the reference
mix with 25% Class F fly ash as the only SCM. The three mixes were used in two field applications and
specimens were taken for further laboratory testing to ensure their overall performance. The three
proposed mixes have the same aggregate composition of the reference mix (70% 47B sand and gravel +
30% limestone), while containing different percentages of Class C fly ash and other SCM: 16% Class C
fly ash + 20% Class F fly ash; 20% Class C fly ash + 20% Class F fly ash; and 15% Class C fly ash +
18% Class F fly ash + 15% Slag.
Acronyms
AASHTO American Association of State and Highway Transportation Officials
ACI American Concrete Institute
ASR Alkali Silica Reactivity
ASTM American Society for Testing and Materials
FBC Fluidized-Bed Combustion
GGBFS Ground Granulated Blast Furnace Slag
LON Loss On Ignition
NDOR Nebraska Department of Roads
NPPD Nebraska Public Power District
OPPD Omaha Public Power District
SCM Supplementary Cementious Material
TAC Technical Advisory Committee
PC Pulverized Coal
PCCP Portland Cement Concrete Pavements

viii
TABLE OF CONTENTS
DISCLAIMER ............................................................................................................................................ IV
ACKNOWLEDGEMENTS ......................................................................................................................... V
ABSTRACT ................................................................................................................................................ VI
ACRONYMS ............................................................................................................................................. VII
LIST OF TABLES ....................................................................................................................................... X
LIST FIGURES ......................................................................................................................................... XII
PART 1 – THEORTICAL INVESTIGATION ........................................................................................... 1
1.0 INTRODUCTION ................................................................................................................................... 1
1.1 BACKGROUND INFORMATION ...................................................................................................... 1 1.2 RESEARCH SIGNIFICANCE ............................................................................................................. 2
2.0 LITERATURE REVIEW ...................................................................................................................... 4
2.1 FLY ASH CHARACTERISTICS ........................................................................................................ 4 2.1.1 OVERVIEW .................................................................................................................................. 4 2.1.2 CHEMICAL COMPOSITION ...................................................................................................... 5 2.1.3 CHARACTERISTICS RELATED TO QUALITY .......................................................................... 6 2.1.4 STANDARD SPECIFICATIONS FOR FLY ASH ......................................................................... 7
2.2 ISSUES OF DURABILITY ................................................................................................................. 8 2.2.1 STRENGTH .................................................................................................................................. 8 2.2.2 SET TIME .................................................................................................................................... 9 2.2.3 FREEZING AND THAWING ..................................................................................................... 12
2.2.3.1 Air Content ......................................................................................................................................... 13 2.2.4 SALT SCALING ......................................................................................................................... 16 2.2.5 ALKALI-SILICA REACTION ..................................................................................................... 20
2.2.5.1 Mechanism of ASR ............................................................................................................................ 20 2.2.5.2 Symptoms of ASR .............................................................................................................................. 23 2.2.5.3 Methods of Mitigation ........................................................................................................................ 25 2.2.5.4 Testing for ASR Potential .................................................................................................................. 29 2.2.5.5 Effect of Deicing Chemicals on ASR ................................................................................................. 31
2.2.6 PERMEABILITY ........................................................................................................................ 33 2.2.7 MATERIAL INCOMPATIBILITY ............................................................................................... 36 2.2.8 AGGREGRATE GRADATION ................................................................................................... 37 2.2.9 JOINT CONSTRUCTION .......................................................................................................... 44
2.3 MEETING AT IOWA STATE UNIVERSITY .................................................................................. 48 2.3 SURVEY OF STATE DOT’S ............................................................................................................ 48 2.4 UNIVERSITY OF NEBRASKA WORKSHOP ................................................................................ 49
3.0 POTENTIAL MIXES .......................................................................................................................... 50
3.1 MIX DESCRIPTION ......................................................................................................................... 50 3.2 COST ESTIMATE ............................................................................................................................. 51
PART 2 – EXPERIMENTAL INVESTIGATION ................................................................................... 53
4.0 MATERIALS ........................................................................................................................................ 53
4.1 MATERIAL CHARACTERISTICS .................................................................................................. 53 4.1.1 SOURCE OF MATERIALS ........................................................................................................ 53
ix
4.1.2 ANALYSIS OF AGGREGATE .................................................................................................... 54 4.1.3 CHEMICAL AND PHYSICAL ANALYSES OF CEMENTITIOUS MATERIAL .... 59
5.0 ASR TESTING USING ASTM C 1567 .............................................................................................. 68
5.1 TESTING PROCEDURE ................................................................................................................... 68 5.2 EXPANSION RESULTS .................................................................................................................... 72 5.3 ADDITIONAL POTENTIAL MIXES ............................................................................................... 81 5.4 EXPANSION RESULTS FOR ADDITIONAL MIXES..................................................................... 83 5.5 ANALYSIS OF ASTM C 1567 RESULTS ........................................................................................ 92 5.6 SELECTION OF TOP MIXES ........................................................................................................... 95
6.0 OVERALL PERFORMANCE TESTING .......................................................................................... 97
6.1 PLASTIC CONCRETE TESTS .................................................................................................................. 97 6.1.1 Slump test .................................................................................................................................. 97 6.1.2 Unit Weight ................................................................................................................................. 98 6.1.3 Air Content .................................................................................................................................. 99 6.1.4 Time of Setting .......................................................................................................................... 100
6.2 HARDENED CONCRETE STRENGTH TESTS .......................................................................................... 102 6.2.1 Compressive Strength ............................................................................................................... 102 6.2.2 Flexural Strength ...................................................................................................................... 104
6.3 HARDENED CONCRETE DURABILITY TESTS ....................................................................................... 105 6.3.1 Freeze and Thaw ....................................................................................................................... 105
6.4 SUMMARY OF TEST RESULTS ................................................................................................... 115
7.0 TESTING OF FIELD APPLICATIONS .......................................................................................... 116
7.1 INTRODUCTION .................................................................................................................................. 116 7.2 FIRST LOCATION ................................................................................................................................ 118 7.3 SECOND LOCATION............................................................................................................................ 119 7.4 TESTS CONDUCTED IN FIELD .............................................................................................................. 121 7.5 TESTS CONDUCTED IN LABORATORY ................................................................................................. 121 7.6 RECOMMENDATION FOR THE TEST SECTIONS ..................................................................................... 124
8.0 CONCLUSIONS AND RECOMMENDATIONS ............................................................................ 125
8.1 CONCLUSIONS .............................................................................................................................. 125 8.2 RECOMMENDATIONS .................................................................................................................. 126
IMPLEMENTATION ............................................................................................................................... 128
REFERENCES .......................................................................................................................................... 129
APPENDIX A: MEETING AT IOWA STATE UNIVERSITY ................................................................. I APPENDIX B: UNIVERSITY OF NEBRASKA WORKSHOP .......................................................... VIII APPENDIX C: PICTURES OF PREMATURE DETIORATION ...................................................... XXII APPENDIX D: SURVEY OF STATE DOT’S ................................................................................... XXVI

x
LIST OF TABLES
TABLE 2.1.2.1 CHEMICAL ANALYSIS OF TYPICAL FLY ASH USED IN NEBRASKA ............................................ 5 TABLE 2.1.4.1 SPECIFICATIONS FOR FLY ASH IN PCC ...................................................................................... 7 TABLE 2.2.5.1.1 ROCKS AND MINERALS SUSCEPTIBLE TO ASR .................................................................... 21 TABLE 2.2.8.1 DESIRED ZONES IN COARSENESS CHART............................................................................... 39 TABLE 3.1.1 SUMMARY OF POTENTIAL MIXES .............................................................................................. 51 TABLE 3.2.1 TYPICAL MATERIAL COST AS OF 2006 ...................................................................................... 52 TABLE 3.2.2 ESTIMATED CONCRETE COST OF POTENTIAL MIXES ................................................................. 52 TABLE 4.1.1.1 SOURCE OF MATERIALS ......................................................................................................... 54 TABLE 5.2.1 SUMMARY OF ASTM C 1567 EXPANSIONS FOR MIX 1A ........................................................... 72 TABLE 5.2.2 SUMMARY OF ASTM C 1567 EXPANSIONS FOR MIX 1B ........................................................... 73 TABLE 5.2.3 SUMMARY OF ASTM C 1567 EXPANSIONS FOR MIX 2 ............................................................. 74 TABLE 5.2.4 SUMMARY OF ASTM C 1567 EXPANSIONS FOR MIX 3 ............................................................. 75 TABLE 5.2.5 SUMMARY OF ASTM C 1567 EXPANSIONS FOR MIX 4A ........................................................... 76 TABLE 5.2.6 SUMMARY OF ASTM C 1567 EXPANSIONS FOR MIX 4B ........................................................... 77 TABLE 5.2.7 SUMMARY OF ASTM C 1567 EXPANSIONS FOR MIX 5 ............................................................. 78 TABLE 5.2.8 SUMMARY OF ASTM C 1567 EXPANSIONS FOR MIX 6 ............................................................. 79 TABLE 5.2.9 ASTM C 1567 EXPANSION RESULTS FOR ALL MIXES (%) ....................................................... 80 TABLE 5.3.1 SUMMARY OF ADDITIONAL PROPOSED MIXES FOR ASTM C 1567 TESTING............................. 82 TABLE 5.3.2 DETAILED MIX MATRIX AND COST ESTIMATE FOR ALL POTENTIAL MIXES .............................. 82 TABLE 5.4.1 SUMMARY OF ASTM C 1567 EXPANSIONS FOR MIX 1C ........................................................... 83 TABLE 5.4.2 SUMMARY OF ASTM C 1567 EXPANSIONS FOR MIX 1D ........................................................... 84 TABLE 5.4.3 SUMMARY OF ASTM C 1567 EXPANSIONS FOR MIX 2B ........................................................... 85 TABLE 5.4.4 SUMMARY OF ASTM C 1567 EXPANSIONS FOR MIX 2C ........................................................... 86 TABLE 5.4.5 SUMMARY OF ASTM C 1567 EXPANSIONS FOR MIX 2D ........................................................... 87 TABLE 5.4.6 SUMMARY OF ASTM C 1567 EXPANSIONS FOR MIX 2E ........................................................... 88 TABLE 5.4.7 SUMMARY OF ASTM C 1567 EXPANSIONS FOR MIX 2F ........................................................... 89 TABLE 5.4.8 SUMMARY OF ASTM C 1567 EXPANSIONS FOR MIX 3B ........................................................... 90 TABLE 5.4.9 SUMMARY OF ASTM C 1567 EXPANSION RESULTS FOR NEW MIXES ....................................... 91 TABLE 5.5.1 PASS/FAIL RESULTS FOR ASTM C 1567 ................................................................................... 92 TABLE 5.5.2 ASR RESULTS USING 100% PLATTE RIVER SAND AND GRAVEL ................................................ 96 TABLE 6.1 LIST OF TEST PERFORMED ............................................................................................................ 97 TABLE 6.1.1 PLASTIC CONCRETE TESTING RESULTS (W/C = 0.45) ............................................................... 100 TABLE 6.1.2 PLASTIC CONCRETE TESTING RESULTS (W/C 0.4 TO 0.42) ....................................................... 100 TABLE 6.2.1.1 COMPRESSIVE STRENGTH (PSI) (W/C 0.45) ............................................................................ 103 TABLE 6.2.1.2 COMPRESSIVE STRENGTH (PSI) (W/C 0.4 TO 0.42) ................................................................. 103 TABLE 6.2.2.1 FLEXURAL STRENGTH (PSI)(W/C 0.45) ................................................................................. 104 TABLE 6.2.2.2 FLEXURAL STRENGTH (PSI) (W/C 0.40 TO 0.42) .................................................................... 105 TABLE 6.3.1.1 FREEZE AND THAW (W/C 0.40).............................................................................................. 107 TABLE 6.3.2.1 LENGTH CHANGE (W/C 0.45) ................................................................................................. 109 TABLE 6.3.2.1 LENGTH CHANGE (W/C 0.40) ................................................................................................. 109 TABLE 6.3.3.1 CHLORIDE ION PENETRATION (W/C 0.45) .............................................................................. 111 TABLE 6.3.3.1 CHLORIDE ION PENETRATION (W/C 0.45) .............................................................................. 111 TABLE 6.3.4.1 WET AND DRY, DURABILITY FACTOR (W/C 0.45) ................................................................. 114 TABLE 6.3.4.2 WET AND DRY, DURABILITY FACTOR (W/C 0.40) ................................................................. 114 TABLE 6.4.1 SUMMARY OF TEST RESULTS ................................................................................................... 115 TABLE 7.2.1 REQUIRED AND PROVIDED MIXES............................................................................................ 119 TABLE 7.4.1 FILED TESTS RESULTS ............................................................................................................... 121 TABLE 7.5.1 COMPRESSIVE STRENGTH (PSI) , UNL ...................................................................................... 121 TABLE 7.5.2 COMPRESSIVE STRENGTH (PSI), NDOR .................................................................................... 122 TABLE 7.5.3 FLEXURAL STRENGTH(PSI), UNL ............................................................................................. 122

xi
TABLE 7.5.4 FLEXURAL STRENGTH (PSI), NDOR ......................................................................................... 122
xii
LIST FIGURES
FIGURE 2.2.1.1 EFFECT OF SCM’S ON STRENGTH ........................................................................................... 9 FIGURE 2.2.2.2 FINAL SET TIMES FOR HOLCIM CONCRETE ........................................................................... 11 FIGURE 2.2.2.3 TIME OF SETTING OF 47-B CONCRETE MIXES ....................................................................... 11 FIGURE 2.2.4.1 SCALING FIELD PERFORMANCE OF FLY ASH CONCRETE ...................................................... 19 FIGURE 2.2.5.5.1 ASTM C 1260/1567 EXPANSIONS FOR 1N NAOH ............................................................. 32 FIGURE 2.2.5.5.2 ASTM C 1260/1567 EXPANSIONS FOR POTASSIUM ACETATE ........................................... 33 FIGURE 2.2.6.1 CHLORIDE PENETRATION OF CLASS F FLY ASH AND SLAG MIXES ....................................... 35 FIGURE 2.2.8.1 COARSENESS CHART ............................................................................................................. 38 FIGURE 2.2.8.2 0.45 POWER CHART .............................................................................................................. 40 FIGURE 2.2.8.3 PERCENTAGE RETAINED CHART ........................................................................................... 41 FIGURE 2.2.8.4 PERCENT RETAINED CHART WITH NE AGGREGATES ............................................................ 43 FIGURE 2.2.8.5 0.45 POWER CHART WITH NE AGGREGATES ........................................................................ 43 FIGURE 2.2.8.6 COARSENESS CHART WITH NE AGGREGATES ....................................................................... 44 FIGURE 2.2.9.1 TYPICAL LONGITUDINAL JOINT ............................................................................................ 45 FIGURE 2.2.9.2 KNIFE MOUNTED ON PAVER ................................................................................................. 46 FIGURE 2.2.9.3 KNIFE FORMED JOINT ............................................................................................................ 47 FIGURE 2.2.9.4 CORE OF KNIFE FORMED JOINT............................................................................................. 47 FIGURE 4.1.2.1 PHYSICAL ANALYSIS OF CLASS B AGGREGATE - 47B SAND & GRAVEL ............................... 55 FIGURE 4.1.2.2 PHYSICAL ANALYSIS OF CLASS E AGGREGATE - LIMESTONE ............................................... 57 FIGURE 4.1.2.3 PHYSICAL ANALYSIS OF CLASS E AGGREGATE – LIMESTONE SAMPLE 2 ............................... 58 FIGURE 4.1.3.1 CHEMICAL ANALYSIS OF ASH GROVE TYPE 1PF CEMENT .................................................... 60 FIGURE 4.1.3.2 PHYSICAL ANALYSIS OF ASH GROVE TYPE 1PF CEMENT ..................................................... 61 FIGURE 4.1.3.3 CHEMICAL ANALYSIS OF ASH GROVE TYPE I/II CEMENT ..................................................... 62 FIGURE 4.1.3.4 PHYSICAL ANALYSIS OF ASHGROVE TYPE I/II CEMENT ....................................................... 63 FIGURE 4.1.3.5 CHEMICAL ANALYSIS OF CLASS C FLY ASH ......................................................................... 64 FIGURE 4.1.3.6 PHYSICAL ANALYSIS OF CLASS C FLY ASH .......................................................................... 65 FIGURE 4.1.3.7 CHEMICAL ANALYSIS OF GROUND GRANULATED BLAST FURNACE SLAG ........................... 66 FIGURE 4.1.3.8 PHYSICAL ANALYSIS OF GROUND GRANULATED BLAST FURNACE SLAG ............................. 67 FIGURE 5.2.1 WEIGHED MATERIALS AND WORK AREA ................................................................................ 68 FIGURE 5.2.2 CASTING OF MORTAR BARS ..................................................................................................... 69 FIGURE 5.2.3 INITIAL CURING OF CAST MORTAR BARS ................................................................................ 69 FIGURE 5.2.4 HARDENED MORTAR BARS WITH MIX IDENTIFICATION........................................................... 70 FIGURE 5.2.5 TAKING COMPARATOR READING OF MORTAR BAR ................................................................. 70 FIGURE 5.2.6 STORAGE CONTAINERS FOR MORTAR BARS ............................................................................ 71 FIGURE 5.2.7 STORAGE CONTAINERS IN 80
OC OVEN ..................................................................................... 71
FIGURE 5.2.8 MORTAR BARS FOLLOWING 28 DAY TESTING .......................................................................... 72 FIGURE 5.2.1 ASTM C 1567 EXPANSION RESULTS FOR MIX 1A ................................................................... 73 FIGURE 5.2.2 ASTM C 1567 EXPANSION RESULTS FOR MIX 1B ................................................................... 74 FIGURE 5.2.3 ASTM C 1567 EXPANSION RESULTS FOR MIX 2 ..................................................................... 75 FIGURE 5.2.4 ASTM C 1567 EXPANSION RESULTS FOR MIX 3 ..................................................................... 76 FIGURE 5.2.5 ASTM C 1567 EXPANSION RESULTS FOR MIX 4A ................................................................... 77 FIGURE 5.2.6 ASTM C 1567 EXPANSION RESULTS FOR MIX 4B ................................................................... 78 FIGURE 5.2.7 ASTM C 1567 EXPANSION RESULTS FOR MIX 5 ..................................................................... 79 FIGURE 5.2.8 ASTM C 1567 EXPANSION RESULTS FOR MIX 6 ..................................................................... 80 FIGURE 5.2.9 COMPARISON OF ASTM C 1567 EXPANSION RESULTS ............................................................ 81 FIGURE 5.4.1 ASTM C 1567 EXPANSION RESULTS FOR MIX 1C ................................................................... 84 FIGURE 5.4.2 ASTM C 1567 EXPANSION RESULTS FOR MIX 1D ................................................................... 85 FIGURE 5.4.3 ASTM C 1567 EXPANSION RESULTS FOR MIX 2B ................................................................... 86 FIGURE 5.4.4 ASTM C 1567 EXPANSION RESULTS FOR MIX 2C ................................................................... 87
xiii
FIGURE 5.4.5 ASTM C 1567 EXPANSION RESULTS FOR MIX 2D ................................................................... 88 FIGURE 5.4.6 ASTM C 1567 EXPANSION RESULTS FOR MIX 2E ................................................................... 89 FIGURE 5.4.7 ASTM C 1567 EXPANSION RESULTS FOR MIX 2F ................................................................... 90 FIGURE 5.4.8 ASTM C 1567 EXPANSION RESULTS FOR MIX 3B ................................................................... 91 FIGURE 5.4.9 COMPARISON OF ASTM C 1567 EXPANSION RESULTS FOR NEW MIXES ................................. 92 FIGURE 6.1.1.1 SLUMP TEST ........................................................................................................................... 98 FIGURE 6.1.2.1 UNIT WEIGHT ......................................................................................................................... 99 FIGURE 6.1.3.1 AIR CONTENT ....................................................................................................................... 99 FIGURE 6.1.4.1 SET TIME TEST .................................................................................................................... 101 FIGURE 6.1.4.2 SETTING TIME (W/CM = 0.45) .............................................................................................. 101 FIGURE 6.1.4.3 SETTING TIME (W/CM = 0.40 TO 0.42).................................................................................. 102 FIGURE 6.2.1.1 COMPRESSIVE STRENGTH TESTING...................................................................................... 103 FIGURE 6.2.2.1 FLEXURAL STRENGTH TESTING .......................................................................................... 104 FIGURE 6.3.1.1 FREEZE AND THAW CABINET .............................................................................................. 106 FIGURE 6.3.1.2 FREEZE AND THAW TEST SPECIMENS (MIX 2E) ................................................................... 106 FIGURE 6.3.2.1 LENGTH CHANGE, COMPARATOR READING .......................................................................... 108 FIGURE 6.3.2.1 LENGTH CHANGE, SPECIMENS IN THE CHAMBER .................................................................. 108 FIGURE 6.3.3.1 CHLORIDE ION PENETRATION, TEST SPECIMEN MIX 2D ........................................................ 110 FIGURE 6.3.3.2 PREPARING TEST SPECIMEN .................................................................................................. 110 FIGURE 6.3.3.3 TEST RUNNING ..................................................................................................................... 111 FIGURE 6.3.4.1 WET AND DRY TEST, SONIC ANALYSIS ............................................................................... 113 FIGURE 6.3.4.2 WET AND DRY TEST, LENGTH CHANGE READING ................................................................. 114 FIGURE 7.1.1 CONSTRUCTED PAVEMENT ..................................................................................................... 116 FIGURE 7.1.2 CONSTRUCTED PAVEMENT ..................................................................................................... 117 FIGURE 7.1.3 CONSTRUCTED PAVEMENT ..................................................................................................... 117 FIGURE 7.1.4 CONSTRUCTED PAVEMENT ..................................................................................................... 117 FIGURE 7.1.5 TEST SPECIMENS AT THE FIELD ............................................................................................... 118 FIGURE 7.2.1 CONSTRUCTED PAVEMENT LOCATION (HIGHWAY 275) ......................................................... 119 FIGURE 7.3.1 CONSTRUCTED PAVEMENT LOCATION (LINCOLN, NE) ........................................................... 120
1
PART 1 – THEORTICAL INVESTIGATION
1.0 INTRODUCTION
1.1 BACKGROUND INFORMATION
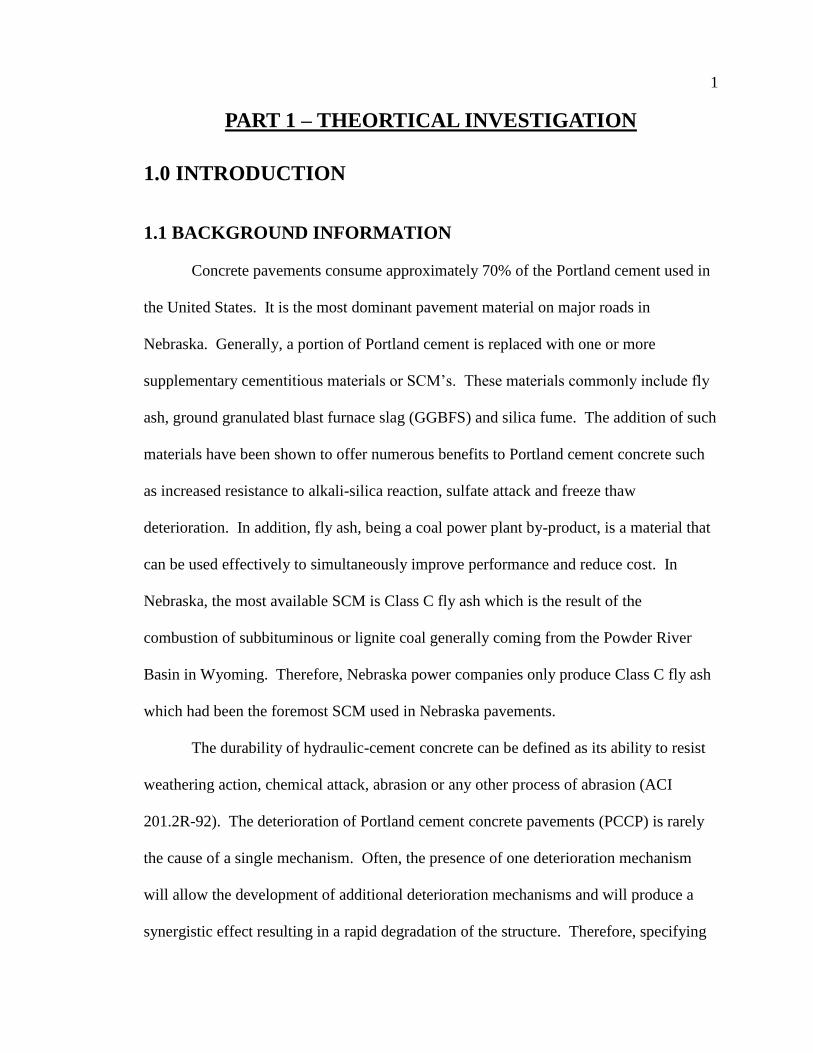
Concrete pavements consume approximately 70% of the Portland cement used in
the United States. It is the most dominant pavement material on major roads in
Nebraska. Generally, a portion of Portland cement is replaced with one or more
supplementary cementitious materials or SCM’s. These materials commonly include fly
ash, ground granulated blast furnace slag (GGBFS) and silica fume. The addition of such
materials have been shown to offer numerous benefits to Portland cement concrete such
as increased resistance to alkali-silica reaction, sulfate attack and freeze thaw
deterioration. In addition, fly ash, being a coal power plant by-product, is a material that
can be used effectively to simultaneously improve performance and reduce cost. In
Nebraska, the most available SCM is Class C fly ash which is the result of the
combustion of subbituminous or lignite coal generally coming from the Powder River
Basin in Wyoming. Therefore, Nebraska power companies only produce Class C fly ash
which had been the foremost SCM used in Nebraska pavements.
The durability of hydraulic-cement concrete can be defined as its ability to resist
weathering action, chemical attack, abrasion or any other process of abrasion (ACI
201.2R-92). The deterioration of Portland cement concrete pavements (PCCP) is rarely
the cause of a single mechanism. Often, the presence of one deterioration mechanism
will allow the development of additional deterioration mechanisms and will produce a
synergistic effect resulting in a rapid degradation of the structure. Therefore, specifying
2
mix designs and construction practices that properly account for all of the potential
deleterious effects is essential in ensuring that PCCP will reach its expected service life.
Although the processes as well as effective preventive measures involved in many
of the common deterioration mechanisms are well understand, the continual development
of new materials and wide spread use of recycled materials requires a constant
evaluation of a concrete’s durability. While it is true that the use of SCM’s can improve
concrete durability, the high variability of the SCM’s eliminates the possibility of a one-
size-fits-all approach in specifying mix proportions. Therefore, the factors influencing
the effect a given SCM will have on specific deterioration mechanisms must be carefully
studied and extensive testing procedures are required to verify these effects.
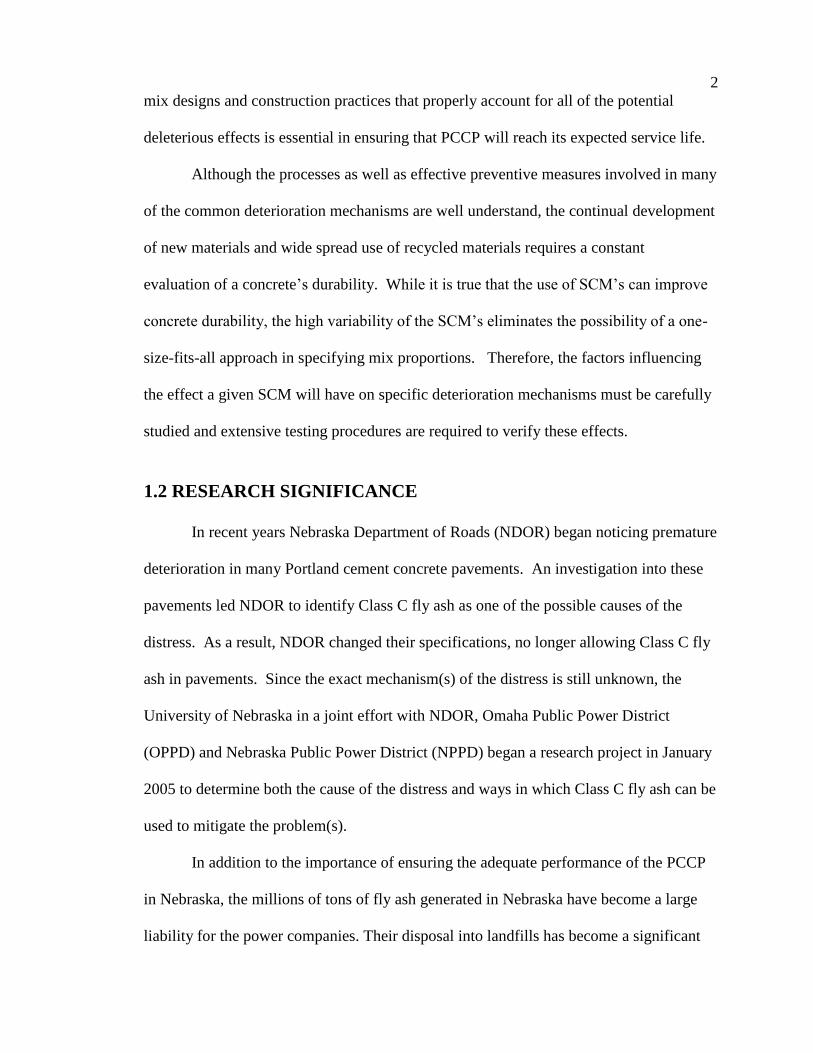
1.2 RESEARCH SIGNIFICANCE
In recent years Nebraska Department of Roads (NDOR) began noticing premature
deterioration in many Portland cement concrete pavements. An investigation into these
pavements led NDOR to identify Class C fly ash as one of the possible causes of the
distress. As a result, NDOR changed their specifications, no longer allowing Class C fly
ash in pavements. Since the exact mechanism(s) of the distress is still unknown, the
University of Nebraska in a joint effort with NDOR, Omaha Public Power District
(OPPD) and Nebraska Public Power District (NPPD) began a research project in January
2005 to determine both the cause of the distress and ways in which Class C fly ash can be
used to mitigate the problem(s).
In addition to the importance of ensuring the adequate performance of the PCCP
in Nebraska, the millions of tons of fly ash generated in Nebraska have become a large
liability for the power companies. Their disposal into landfills has become a significant

3
economical concern due to both the cost of disposal and the wasting of a useful
commodity as well as a lost opportunity to lower emissions from cement manufacturing
facilities. In the meantime, the Class F fly ash being specified for pavements in current
projects has to be imported at an additional cost. The price of the blended cement used in
Nebraska is the same price as type I/II cement.
4
2.0 LITERATURE REVIEW
As previously discussed, a through understanding of the effect of any materials
used in a PCCP mix design is essential before any potential mix proportions can be
identified. Therefore, the study began with extensive review of relevant literature
regarding concrete durability and more specifically the issues being faced in Nebraska.
2.1 FLY ASH CHARACTERISTICS
The most available and cost-effective SCM is fly ash. Therefore, the
characteristics of this material were carefully investigated. Since a significant difference
is seen between the performance of PCCP using Class C fly ash and Class F fly ash, the
differences between these materials were of interest.
2.1.1 OVERVIEW
Fly ash is the result of the combustion of pulverized coal. It is produced by coal-
fired electric and steam generating plants. Once the coal is pulverized it is placed into the
combustion chamber where it is immediately ignited, creating heat and a molten coal
residue. Boiler tubes extract the heat from the boiler causing the flue gas to cool. The
molten coal residue then hardens and forms ash. The coarse ash particles fall to the
bottom of the chamber and are referred to as bottom ash. The lighter ash particles remain
suspended in the flue. These particles are known as fly ash. (FHWA-IF-03-019)
There are four basic types of coal-fired boilers: pulverized coal (PC), stoker-
fired, cyclone and fluidized-bed combustion (FBC). From the boiler, fly ash is collected
from the flue using electrostatic precipitators (ESP) or bag houses and is typically
conveyed to storage silos where it is kept dry. This is referred to as dry transfer. The
5
method of fly ash transfer can also be wet which is a system where the dry ash is mixed
with water and conveyed to an onsite storage pond. The physical and chemical
characteristics of fly ash vary greatly among different methods of combustion and
transfer as well as the coal source. (FHWA-IF-03-019)
Currently over 25 million tons of fly ash are used annually in a variety of
engineering applications. The largest user of fly ash is Portland cement concrete with
other uses including soil and road base stabilization, flowable fills, grouts and asphalt
filler. (FHWA-IF-03-019)
2.1.2 CHEMICAL COMPOSITION
When fly ash is used as a mineral admixture in concrete, it is classified as either
Class C or Class F ash based on its chemical composition. Class C ashes are generally
derived from sub-bituminous or lignite coals and consist primarily of calcium alumino-
sulfate and are usually referred to as high calcium fly ash since they usually contain more
than 20 percent CaO. Class F fly ashes come from bituminous and anthracite coals and
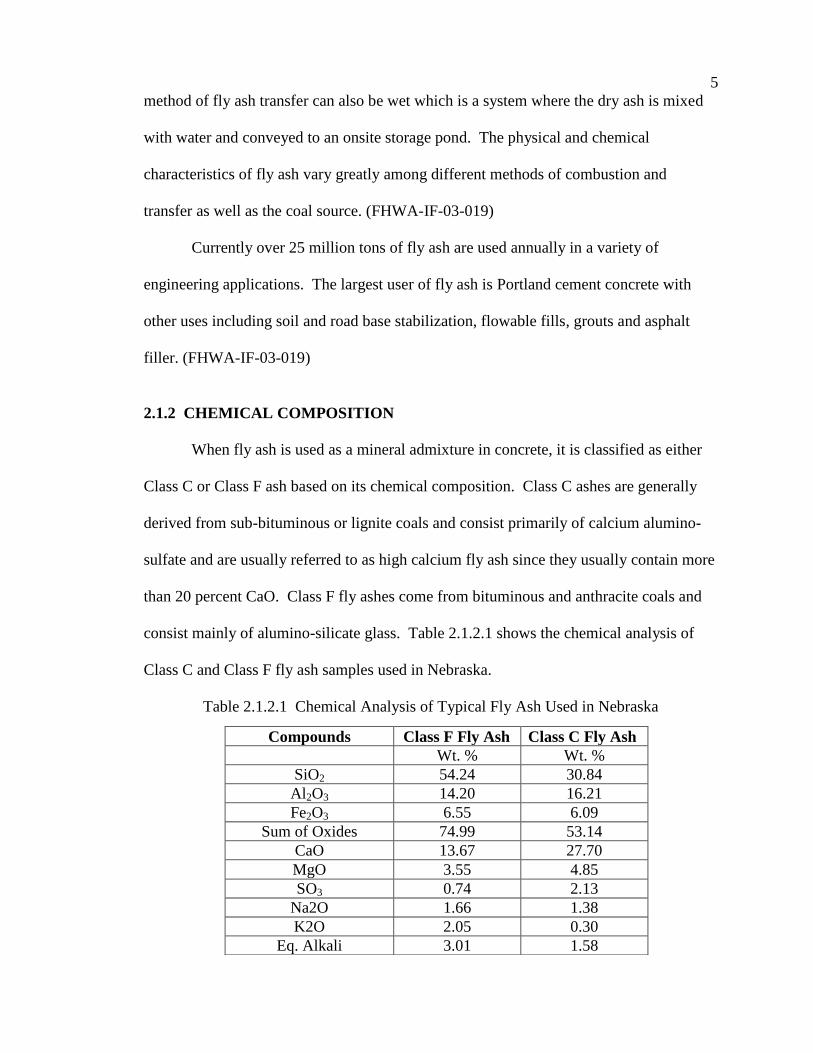
consist mainly of alumino-silicate glass. Table 2.1.2.1 shows the chemical analysis of
Class C and Class F fly ash samples used in Nebraska.
Table 2.1.2.1 Chemical Analysis of Typical Fly Ash Used in Nebraska
Compounds Class F Fly Ash Class C Fly Ash
Wt. % Wt. %
SiO2 54.24 30.84
Al2O3 14.20 16.21
Fe2O3 6.55 6.09
Sum of Oxides 74.99 53.14
CaO 13.67 27.70
MgO 3.55 4.85
SO3 0.74 2.13
Na2O 1.66 1.38
K2O 2.05 0.30
Eq. Alkali 3.01 1.58
6
2.1.3 CHARACTERISTICS RELATED TO QUALITY
The quality and consistency of the fly ash being used is very important, especially
when its intended use is in Portland cement concrete (PCC). The quality of a certain fly
ash is affected by numerous things such as the coal source, and the method of
combustion, transfer and storage. The four most relevant characteristics of fly ash in
connection with quality are loss on ignition (LOI), fineness, chemical composition and
uniformity.
Loss on Ignition (LOI) is the amount of unburned carbon that remains within the
ash. It is an extremely important characteristic of fly ash, especially for concrete
applications. High carbon levels, as well as the type of carbon and variability of the
carbon content can cause substantial air entrainment problems in fresh concrete.
Consequently, AASHTO and ASTM have specified limits for LOI, although some state
DOTs require a lower value for LOI.
The fineness of fly ash is almost directly related to the operating conditions of the
coal crusher as well as the grindability of the coal itself. Fineness is defined as the
percent by weight of the material retained on the 0.044 mm (No. 325) sieve. Finer fly ash
samples are more reactive and typically contain lower carbon levels. AASHTO and
ASTM specify limits for fineness of 34 percent for both Class C and Class F fly ash.
(FHWA-IF-03-019)
As discussed earlier, the chemical composition of fly ash is related directly to the
mineral chemistry of the coal source. The chemical composition can also be affected by
the use of additives during the combustion process as well and any pollution control
technology that is used. The chemistry of the coal should be checked constantly and
evaluated for compliance with its intended use. (FHWA-IF-03-019)

7
Since fly ash characteristics are usually known in advance, appropriate concrete
mixes are designed. Therefore, it is extremely important to have uniformity of
characteristics from shipment to shipment. If any changes are made to the operating
methods of the plant, fly ash characteristics should be re-evaluated. In addition, on the
job site each concrete delivery should be checked for the desired characteristics,
especially air content. (FHWA-IF-03-019)
2.1.4 STANDARD SPECIFICATIONS FOR FLY ASH
The American Association of State and Highway Transportation Officials
(AASHTO) and American Society for Testing and Materials (ASTM) specify
requirements for Class C and Class F fly ash. These requirements are related to the
chemical and physical characteristics of fly ash. Table 2.1.4.1 shows the specifications
for fly ash in PCC.
Table 2.1.4.1 Specifications for fly ash in PCC (FHWA-IF-03-019)
AASHTO M 295 (ASTM C 618) –
Classes F and C
Chemical Requirements Class F Class C
SiO2 + Al2O3 + Fe2O3 min % 70 50
SiO3 max % 5 5
Moisture Content max % 3 3
Loss on Ignition (LOI)1 max % 5
1 5
1
Optional Chemical Requirements
Available Alkalies max % 1.5 1.5
Physical Requirements
Fineness (+325 Mesh) max % 34 34
Pozzolanic Activity/Cement (7 days) min % 75 75
Pozzolanic Activity/Cement (28 days) min % 75 75
Water Requirement max % 105 105
Autoclave Expansion max % 0.8 0.8
Uniformity Requirements: Density
Fineness
max %
max %
5
5
5
5
Optional Physical Requirements
Multiple Factor (LOI x Fineness) 255 -
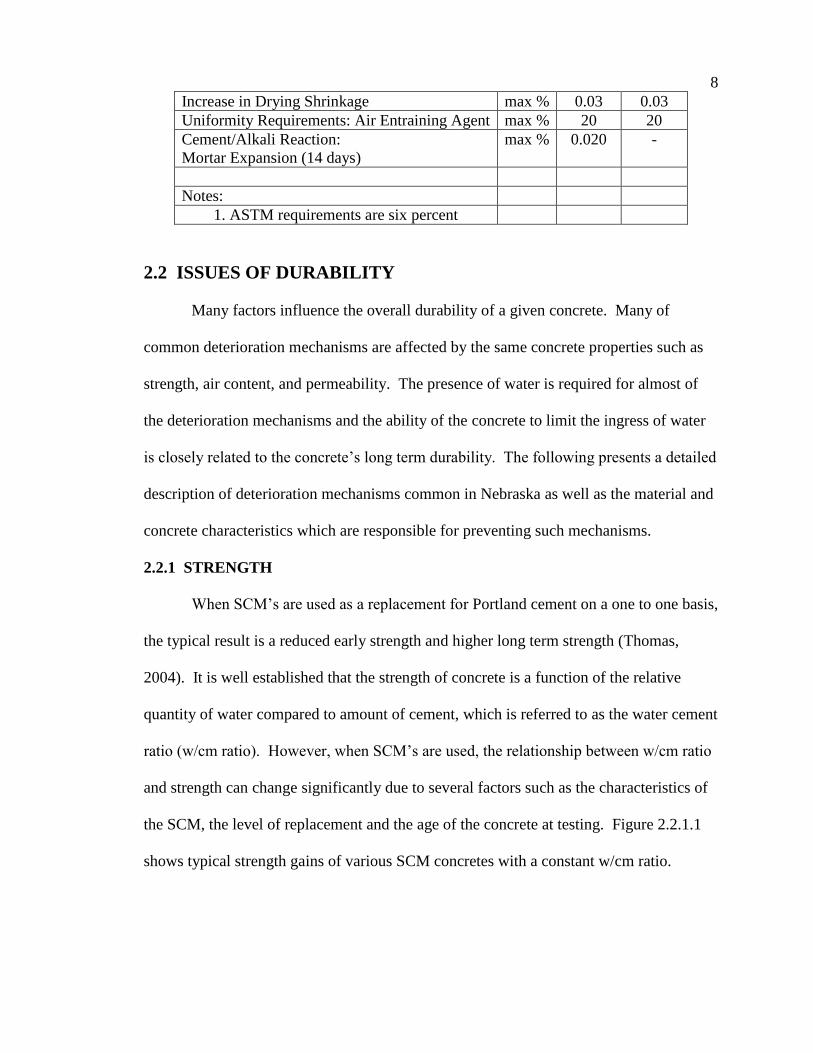
8
Increase in Drying Shrinkage max % 0.03 0.03
Uniformity Requirements: Air Entraining Agent max % 20 20
Cement/Alkali Reaction:
Mortar Expansion (14 days)
max % 0.020 -
Notes:
1. ASTM requirements are six percent
2.2 ISSUES OF DURABILITY
Many factors influence the overall durability of a given concrete. Many of
common deterioration mechanisms are affected by the same concrete properties such as
strength, air content, and permeability. The presence of water is required for almost of
the deterioration mechanisms and the ability of the concrete to limit the ingress of water
is closely related to the concrete’s long term durability. The following presents a detailed
description of deterioration mechanisms common in Nebraska as well as the material and
concrete characteristics which are responsible for preventing such mechanisms.
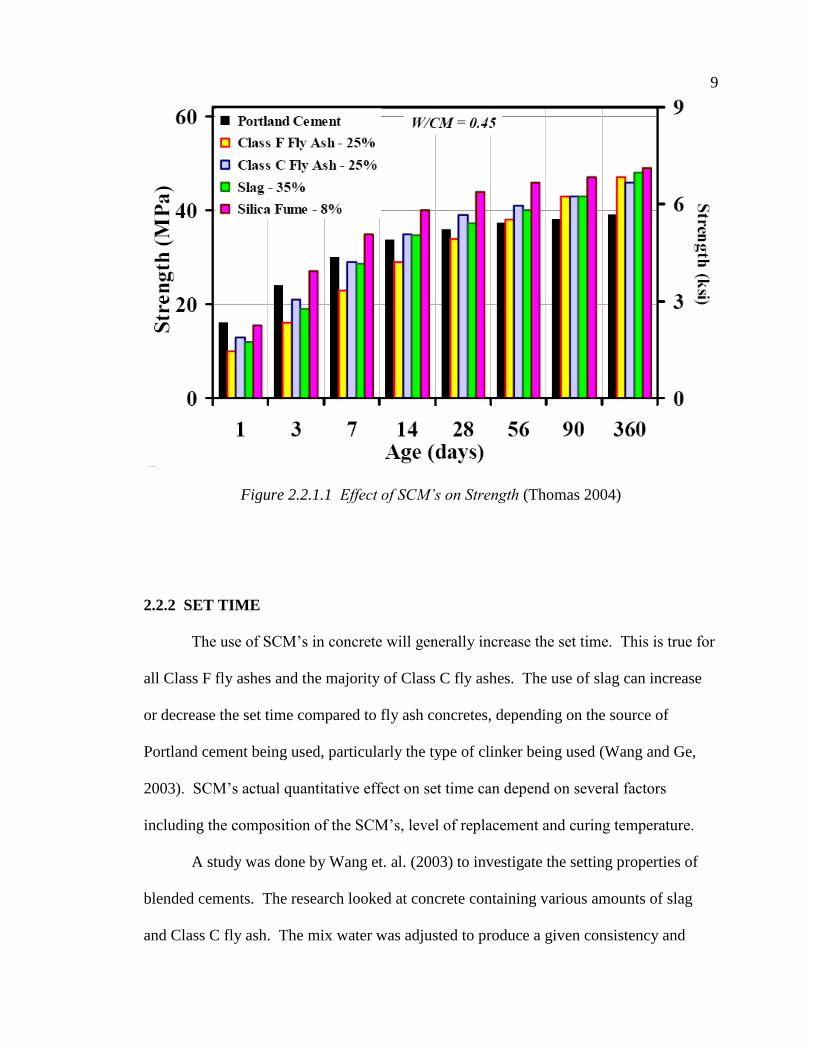
2.2.1 STRENGTH
When SCM’s are used as a replacement for Portland cement on a one to one basis,
the typical result is a reduced early strength and higher long term strength (Thomas,
2004). It is well established that the strength of concrete is a function of the relative
quantity of water compared to amount of cement, which is referred to as the water cement
ratio (w/cm ratio). However, when SCM’s are used, the relationship between w/cm ratio
and strength can change significantly due to several factors such as the characteristics of
the SCM, the level of replacement and the age of the concrete at testing. Figure 2.2.1.1
shows typical strength gains of various SCM concretes with a constant w/cm ratio.
9
Figure 2.2.1.1 Effect of SCM’s on Strength (Thomas 2004)
2.2.2 SET TIME
The use of SCM’s in concrete will generally increase the set time. This is true for
all Class F fly ashes and the majority of Class C fly ashes. The use of slag can increase
or decrease the set time compared to fly ash concretes, depending on the source of
Portland cement being used, particularly the type of clinker being used (Wang and Ge,
2003). SCM’s actual quantitative effect on set time can depend on several factors
including the composition of the SCM’s, level of replacement and curing temperature.
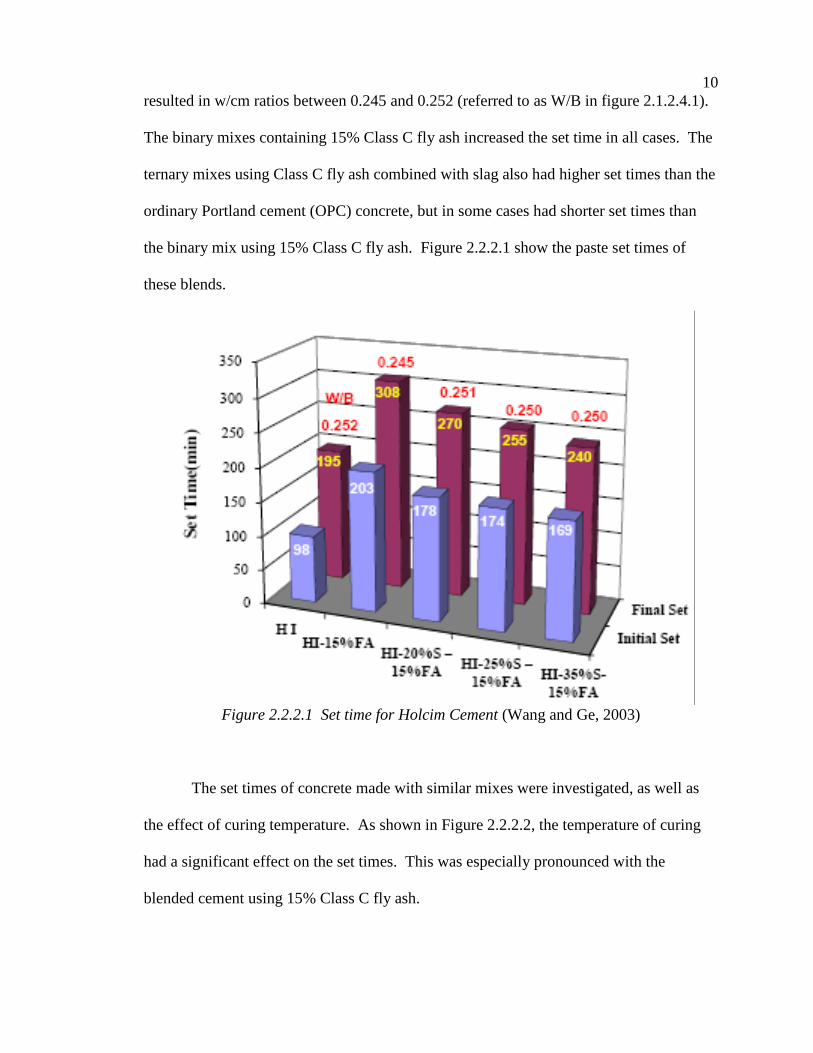
A study was done by Wang et. al. (2003) to investigate the setting properties of
blended cements. The research looked at concrete containing various amounts of slag
and Class C fly ash. The mix water was adjusted to produce a given consistency and
10
resulted in w/cm ratios between 0.245 and 0.252 (referred to as W/B in figure 2.1.2.4.1).
The binary mixes containing 15% Class C fly ash increased the set time in all cases. The
ternary mixes using Class C fly ash combined with slag also had higher set times than the
ordinary Portland cement (OPC) concrete, but in some cases had shorter set times than
the binary mix using 15% Class C fly ash. Figure 2.2.2.1 show the paste set times of
these blends.
Figure 2.2.2.1 Set time for Holcim Cement (Wang and Ge, 2003)
The set times of concrete made with similar mixes were investigated, as well as
the effect of curing temperature. As shown in Figure 2.2.2.2, the temperature of curing
had a significant effect on the set times. This was especially pronounced with the
blended cement using 15% Class C fly ash.

11
Figure 2.2.2.2 Final Set Times for Holcim Concrete (Wang and Ge, 2003)
In addition, Figure 2.2.2.3 shows the initial and final set times of various mixes
used in Nebraska.
Figure 2.2.2.3 Time of Setting of 47-B Concrete Mixes (Hanson, 2005)

12
From the previous figures it is clear that the set time of a given concrete is very
dependent on many factors including the type and amount of SCM’s and the temperature
during curing. It is very important to accurately characterize the setting properties of any
binary or ternary mixes that are used, especially for contractors. When mixes with
SCM’s are used, the time frame for saw-cutting joints must be adjusted. In addition,
because of the significant effect of curing temperature on pozzolanic reaction, covering
slabs to trap heat or extending curing time will be necessary for SCM concrete in cold
weather conditions. Due to this fact, some agencies restrict the use of fly ash or slag
during the early spring or late fall. However, guidelines or specifications for curing
management may be more appropriate for the use of SCM concrete in pavement. (Wang
and Ge, 2003)
2.2.3 FREEZING AND THAWING
Expansions from freezing and thawing are often a major cause of damage in
concrete structures such as pavements. Especially in cold climates, it is critical for
concrete to have a high resistance to freeze thaw cycling. The porosity of concrete is an
interconnected pore system formed by the space occupied by the mix water that did not
participate in hydration. This is generally referred to as capillary pores. When the
concrete is exposed to moisture, water travels through the concrete in these pores. If
temperatures fall below freezing, the water in these pores freezes and can expand up to
9% of its original volume. The expanding ice exerts pressure on the concrete and can
cause cracking. (Whiting and Nagi, 1998)
The resistance of concrete to freeze thaw cycling is a direct function of the air
entrainment and air-void system of the concrete (Malhotra and Mehta, 2002). Therefore,
13
the concrete’s durability under freeze thaw cycling is not directly related to the amount or
type of fly ash in it. However, fly ash can create difficulties in obtaining proper air
content and could indirectly affect freezing and thawing durability. A detailed discussion
on achieving proper air content can be found in following section.
Numerous studies have been done to evaluate the effect of fly ash and other
SCM’s on the performance of concrete under freezing and thawing. Naik et al., as well
as others, have shown acceptable performance when the concrete possessed adequate
strength and appropriate air-void systems. Adequately proportioned concrete should
have 4 to 7 percent air content with an air bubble spacing factor less than 200µm and
specific surface greater than 24 mm2/mm
3 (Naik, 1997). According to Mather (1989),
concrete with or without fly ash will be durable against freezing and thawing if: (1) it is
properly air entrained, (2) it has attained approximately 4000 psi compressive stress when
it is subjected to freezing and thawing, (3) it is made with sound aggregates, and (4)
proper construction, in particular surface finishing, operations are followed correctly.
In addition, the effect of freeze thaw cycling is greatly influenced by the moisture
in the concrete. Areas within the structure that are exposed to saturated conditions will
experience greater deterioration due to freezing and thawing. Therefore, for a given air
void system, concrete with fly ash will generally show higher freeze thaw resistance due
to its lower permeability.
2.2.3.1 Air Content
As discussed, for PCCP located in cold weather regions proper air content is
essential in achieving a durable concrete and is therefore an aspect of mix proportioning
that needs careful consideration. For over 50 years, entrained air has been deliberately

14
incorporated in concrete mixes to reduce damage from freezing and thawing. This
process of entraining air is done through the use of chemical admixtures known as air-
entraining agents. In properly air-entrained concrete there are more than 1 million air
bubbles in one cubic inch. These bubbles provide voids within the concrete which act as
reservoirs for the water moving through the capillary pores, relieving the pressure caused
during the freezing of that water. (Whiting and Nagi. 1998)
When fly ash is used as a cement replacement material in PCC, air content
requires close monitoring. It is generally accepted that the use of fly ash in concrete will
increase the amount of air entrainment agent (AEA) needed to obtain the specified air
content. This is a result of the unburned carbon present in the fly ash. The carbon
absorbs the air-entraining agent and prevents it from stabilizing the air bubbles in fresh
concrete (Malvar, 2001). Therefore, fly ashes containing high LOI values will typically
require higher dosages of AEA. However, the LOI value alone is not always sufficient in
indicating the necessary amount of air-entraining agent. Some types of fly ashes contain
carbon particles with a higher surface area and therefore absorb more AEA. In addition,
with some combinations of fly ash, cement and air-entraining agents, the air-void system
may be unstable and trial mixes should be used to evaluate this effect.
When proper consideration is given to the potential problems, there is generally
no difficulty in entraining adequate air in fly ash mixtures. If a problem is encountered
with obtaining proper air content, changing the source of fly ash or the brand of air-
entraining admixture should be considered. Therefore it is essential to prepare trial mixes
and to regularly check the air content of incoming loads at the job site. (FHWA-RD-03-
047)
15
Although the incoming loads of concrete may contain adequate air content, a
significant degradation of the air void system may occur during placement and
consolidation. Problems with workability, often due to material incompatibility, hot
weather, or poor aggregate gradation, can force contractors to over-vibrate the concrete,
effectively ruining the air void system. It is recommended that vibration frequency be
limited to 8,000 vpm for paver speeds greater than 3 ft/min, and should be further
reduced for slower paving speeds.
The state of Iowa began observing early deterioration of pavements built between
1984 and 1994. The deterioration being observed was very similar to that in Nebraska
pavements. After further investigation into these pavements, it was seen that they
possessed air contents well below the recommend values. The petrographic analysis
revealed spacing factors almost double the recommend value of 0.2 mm. A significant
difference in the air void system was seen for the top and bottom of the cores and
cracking was generally confined to the top 6” where air content was the lowest.
Therefore, the problem was believed to be the result of a poor air void system. (IDOT -
MLR-98-06)
In 1994, the Iowa DOT implemented changes in their specifications. Previously,
specifications called for a target air content of 6 ± 1 % and a minimum vibration of 7000
vpm’s with no maximum value. After 1994 a new target air content of 7 ± 1% was
specified. In addition, vibration specifications were changed to a range of 5000 to 8000
vpm’s. Since adoption of the new specifications, pavements experiencing the premature
deterioration have been greatly reduced. In addition, cores of the good performing
pavements were analyzed. These cores showed the air content in the mortar was above
the recommend value of 9% and the air content of the concrete was above the
16
specification of 6%. It was also observed that good performing pavements all had
spacing factors below 0.200 mm, while the poor performing pavements had spacing
factors above 0.25 mm. These results confirmed their belief that the cause of the
deterioration was an inadequate air void system. (IDOT -MLR-98-06)
Recently, Iowa DOT has adjusted their specification for air content to further
ensure an adequate air void system. The specifications require an air content of 6% plus
the loss from the paver, +1.5/-1 %. Therefore, once a day the air content is measured in
front of and behind the paver. The calculated loss of air is then added to the 6% and that
is the value for the target air content +1.5/-1 %.
A recent development has the potential for accurate analysis of the air system in
fresh concrete. Unlike conventional tests that only measure the total volume of air, the
Air Void Analyzer or AVA can reportedly be used to evaluate the air void system
including the volume of entrained air, size of air voids and distribution of air voids within
fresh concrete (CPCCP, 2004). Using this information, real-time adjustments can be
made during paving to ensure an adequate air void system, greatly increasing the
durability of the pavement. However, this testing procedure is very new and can have
problems with repeatability. In addition, the test is very sensitive to any movement or
vibrations such as wind or road vibrations and can lead to unreliable results.
2.2.4 SALT SCALING
In cold weather regions, freezing and thawing is a major cause of damage to
concrete structures. The use of deicing chemicals further aggravates this problem. When
freezing and thawing occurs with the presence of moisture and deicing chemicals,
concrete surfaces can experience scaling. Scaling of concrete in the presence of a de-
17
icing chemical can be described as a delamination of surface layers of concrete (Mehta,
Olek, Weiss and Nantung, 2005). It has been shown that salt-scaling damage can occur
by both chemical and physical mechanisms (Naik, Krause, Ramme, and Chun, 2003).
The physical mechanism occurs when small flakes of concrete, break away from
the surface of the pavement. This mechanism is probably due to the deicer concentration
gradient and the degree of saturation. Due to hygroscopic character of deicer salts, the
degree of saturation of concrete increases with the use of deicers and differential stresses
are generated as a result of layer-by layer freezing, resulting from the salt concentration
gradients (Naik, Krause, Ramme, and Chun, 2003). The chemical mechanism through
which salt-scaling occurs was described by Neville (1969). It was shown that saturated
solutions of certain deicing chemicals can cause deleterious effects, even with out
freezing and thawing. This effect was greatly dependent on the water-cement ratio. For
concrete with high w/cm ratios, the deicing chemical resulted in increased expansions,
mass gains and loss in dynamic modulus of elasticity (Naik, Krause, Ramme, and Chun,
2003). Even for a low w/cm ratio, large mass losses and a degradation of the dynamic
modulus of elasticity was seen.
Many factors influence the salt-scaling resistance of concrete such as the level of
saturation, compressive strength, entrained air, w/cm ratio, type and amount of SCM,
aggregate type and gradation, finishing and curing procedures and exposure conditions.
Typically, high replacement levels of SCM’s will lower the salt-scaling resistance of a
concrete. For this reason, the ACI 318 building code places a limit on the maximum
amount of SCM’s allowed in concrete exposed to deicing chemicals as follows:
Slag ≤ 50%
Fly Ash ≤ 25%
18
Silica Fume ≤ 10%
Total SCM in Concrete with Slag ≤ 50%
Total SCM in Concrete without Slag ≤ 35%
Although pavements are not required to follow these limits, most state agencies specify
similar limits for PCCP.
The most commonly used test method to assess salt-scaling resistance is ASTM C
672: Standard Test Method for Scaling Resistance of Concrete Surfaces Exposed to
Deicing Chemicals. In this test method, specimens are cast and covered with ¼” of a
calcium chloride and water solution. The specimens are then subjected to 50 freezing
and thawing cycles. During these cycles, the proper depth of solution is maintained on
the top surface of the specimen. Visual ratings and mass loss are recorded throughout the
test. Visual ratings are done by evaluating the specimens with ratings of 1-5, with 1
being no scaling and 5 being severe scaling.
Although scaling resistance is dependent on many factors other than the amount
of SCM’s used, studies have shown concrete with high volumes of fly ash can have
satisfactory scaling resistance. Naik et al. (2003) showed that in some cases, concrete
containing 0-50% fly ash showed equal or greater resistance to salt-scaling when
compared to the control mix made with no fly ash. However, another series of mixes
showed the opposite trend with the salt-scaling resistance decreasing as the fly ash
content increases.
According to ASTM C 672, salt scaling resistance of concrete containing fly ash
should be a major durability concern in cold regions. However, unlike laboratory tests
which often show scaling, very few states have reported scaling problems in concrete
with fly ash (Mehta, Olek, Weiss and Nantung, 2005). Often, if scaling is observed it is

19
attributed to issues either with finishing or curing. Therefore, it has been suggested that
ASTM C 672 does not correlate well with actual field performance and often shows
concrete containing SCM’s to be at a large disadvantage. Several experts including
Thomas and Naik agree that ASTM C 672 is too severe (Thomas, 2004). Figure 2.2.4.1
shows field performances with respect to salt scaling of various fly ash mixes.
Figure 2.2.4.1 Scaling Field Performance of Fly Ash Concrete (Thomas, 2005)
A study was conducted by Mehta et al. (2005) to attempt to identify the potential
reasons for the apparent discrepancy between ASTM C 672 and actual field performance.
It was concluded that surface evaporation and slab thickness have a significant effect on
salt scaling resistance. This indicates that ASTM C 672 is too severe because it does not
account for several important conditions that are likely to be present in the field.
20
In addition, it has been suggested by other experts that ASTM C 679 may not be
rigorous enough in evaluating the scaling resistance of concrete. They have suggested
increasing the total number of freezing and thawing cycles as well as increasing the
number of cycles per day. Due to the immense disagreement concerning the accuracy of
ASTM C 679, any results obtained from this test should be analyzed very carefully
before any conclusions are made concerning the scaling resistance of a specific mix.
2.2.5 ALKALI-SILICA REACTION
Throughout the state of Nebraska, PCCP use Platte River Sand and Gravel
exclusively as a fine aggregate. Additionally, the limited supply of limestone in the state
results in mix designs heavy weighted towards the abundant Sand and Gravel aggregate.
It has been well established that Platte River Sand and Gravel is a reactive aggregate
which can potentially lead to Alkali-Silica Reaction or ASR. Therefore, ASR has been
identified as one of the leading deterioration mechanism in Nebraska. Currently, ASR
mitigation is the driving factor in the mix designs allowed in the state.
2.2.5.1 Mechanism of ASR
Alkali-silica reaction was first recognized by Stanton (1940,1942) of the
California State Division of Highways (ACI 221.1R-98). Since that time, alkali-silica
reaction or (ASR) has been identified as a major durability problem in the Unitd States,
resulting in premature deterioration of many types of concrete structures. Extensive
research has been done in recent years to both develop test methods to determine
expansive reactivity as well as effective means to control ASR-induced expansion.
21
Alkali-silica reaction is the reaction between alkali hydroxide and certain
siliceous rocks and minerals in the aggregates (Malvar, 2001). The product of this
reaction is a gel that absorbs water creating expansive stresses on the concrete. It is
widely acknowledged that the three essential components needed for ASR are reactive
silica, sufficient alkalies and sufficient moisture.
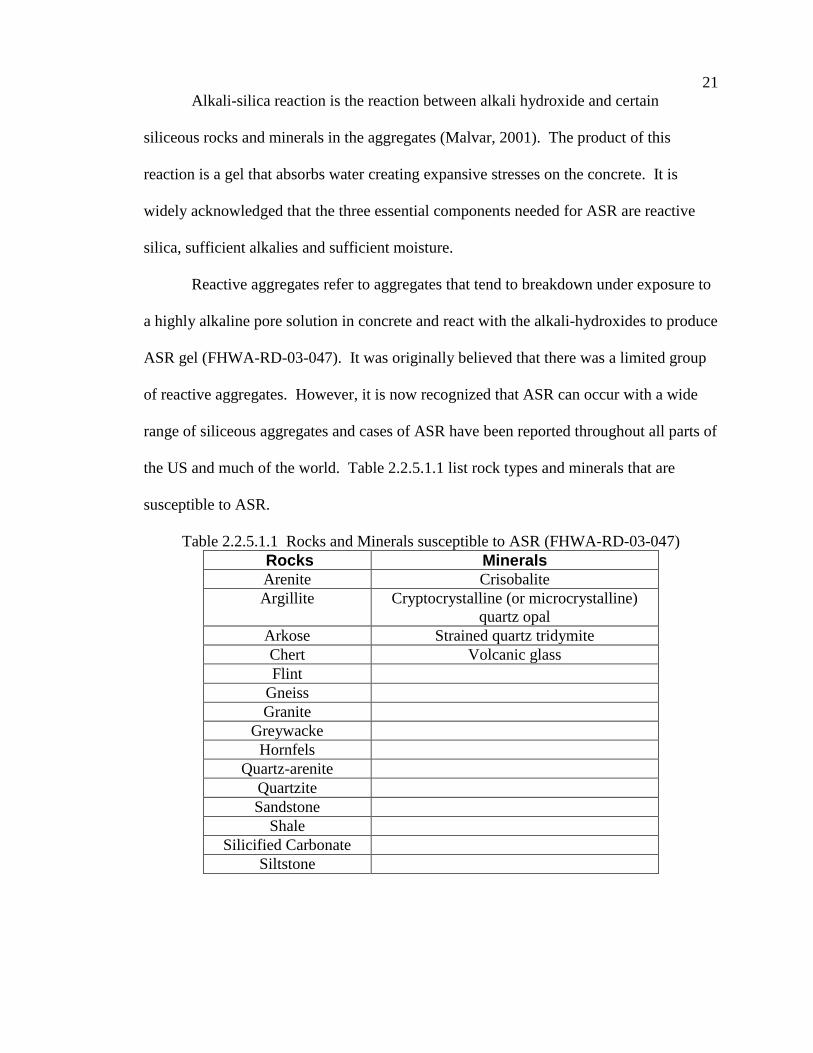
Reactive aggregates refer to aggregates that tend to breakdown under exposure to
a highly alkaline pore solution in concrete and react with the alkali-hydroxides to produce
ASR gel (FHWA-RD-03-047). It was originally believed that there was a limited group
of reactive aggregates. However, it is now recognized that ASR can occur with a wide
range of siliceous aggregates and cases of ASR have been reported throughout all parts of
the US and much of the world. Table 2.2.5.1.1 list rock types and minerals that are
susceptible to ASR.
Table 2.2.5.1.1 Rocks and Minerals susceptible to ASR (FHWA-RD-03-047)
Rocks Minerals Arenite Crisobalite
Argillite Cryptocrystalline (or microcrystalline)
quartz opal
Arkose Strained quartz tridymite
Chert Volcanic glass
Flint
Gneiss
Granite
Greywacke
Hornfels
Quartz-arenite
Quartzite
Sandstone
Shale
Silicified Carbonate
Siltstone
22
A study was done by David W. Hadley in 1968 on the sand and gravel aggregate
used widely throughout Nebraska and Kansas. These sand and gravel aggregates are
poorly graded siliceous stream gravels deposited in the high plains region as the result of
the erosion of the Rocky Mountains. The gravel sizes of the aggregate are composed
primarily of particles of coarse-grained granite and similar rock types. The sand sizes are
predominately individual grains of quartz and potassium feldspar. Many sand-gravels
also contain a significant amount of volcanic and opaline materials which are also known
to be reactive.
Another required component for ASR is sufficient alkalies. Generally, Portland
cement is the dominant source of available alkalies, but other sources such as SCM’s
(e.g. fly ash), chemical admixtures and deicing salts can be contributors to the available
alkalies in the system. The two alkali constituents present in Portland cement are sodium
oxide and potassium oxide. The total equivalent alkali is described as equivalent
Na2O(Na2Oe) and is calculated as percent Na2O plus 0.658 * percent K2O (ACI 221.1R-
98). Although the percentage of alkalies in Portland cement is relatively low compared
to other oxides, the bulk of the alkalies reside in the pore solution of the concrete, and it
is the associated hydroxyl (OH-) concentration that produces the inherent high pH in the
pore solution (FHWA-RD-03-047). Higher percentages of sodium and potassium
alkalies, produce higher concentrations of hydroxyl ions and raises the pH. The higher
the pH of the pore solution, the more readily it attacks the reactive silica. Once the silica
is in the pore solution, it reacts with the alkalies and forms alkali silica gel. (ACI 221.1R-
98)
Sufficient moisture is also required for ASR to occur. An internal relative
humidity of about 80% is required for the reaction. In most concretes, some of the
23
mixing water is usually available for a long period. For low w/cm ratios, all the water
may be used up during the hydration of the cement. However, for structures exposed to
external moisture such as pavement, it is very difficult to reduce the moisture below the
critical threshold value. Areas within pavements that tend to accumulate and retain
moisture, such as joints, will be particularly susceptible to ASR. (FHWA-RD-03-047)
2.2.5.2 Symptoms of ASR
The most common symptoms of deleterious ASR are map cracking, closed joints,
spalled surfaces and relative displacements of the structure. Deterioration due to ASR is
relatively slow. However, ASR cracking can lead to serviceability problems and can also
magnify other deterioration mechanisms such as freeze-thaw and sulfate attack.
In pavements and slabs on grade, cracking from ASR usually begins near free
edges and joints, where sufficient moisture is available. The cracks are usually
perpendicular to the transverse joints and parallel to the free edges or other areas of
minimum restraint. The appearance and intensity of ASR in pavements is usually highly
variable. The variable concentration of the necessary components, as well as the ambient
temperature produces significant differences in the rate and effect of the reaction.
Popouts and discoloration may indicate ASR, although these symptoms can occur for
other reasons. The presence of ASR gel on the surface indicates evidence of alkali-silica
reaction, but does not by itself mean that ASR is causing excessive expansion of the
concrete. (ACI 221.1R-98)
It is very difficult to absolutely identify distress caused by ASR based only on
visual examination. Commonly, the first step in evaluating a deteriorated pavement is to
test the mechanical properties of the concrete, particularly the tensile strength. In
24
addition, it is usually necessary to run ASTM C 856 Standard Practice for Petrographic
Examination of Hardened Concrete. With this procedure, in most cases with excessive
expansion from ASR, deposits of the reaction product or ASR gel can be found.
However, the amount of gel present is not always related to the extent of the cracking due
to ASR. In some cases, with high cracking due to ASR, the amount of gel can be limited.
The opposite can also be true, where a large amount of gel can produce no significant
cracking (ACI 221.1R-98). Therefore, it is important to distinguish between the ASR
reaction and the damage caused from the reaction (FHWA-IF-03-019).
Another method for identifying the presence of alkali silica gel in concrete is the
uranyl-acetate treatment procedure as outlined in the annex of ASTM C 856. The
concrete surface is sprayed with a solution of uranyl acetate, rinsed with water and
viewed under an ultraviolet light. Reacted particles and gel will appear as yellow or
green. However, the test does not separate between a non-detrimental presence of gel
and that which is detrimental. (FHWA-IF-03-019)
Another test method used to evaluate the chemical durability of a mix,
particularly ASR, is the NDOR wet-dry test. In this test method, specimens are cast and
after 28 days of moist curing they are placed in a wetting and drying chamber. The
chamber is kept at approximately 70oF and exposes the specimens to cycles of wetting
and drying. Every 28 days measurements are taken on the specimens including length
change, sonic modulus and weight. The test is run for a total of 548 days or
approximately 18 months. The repeated wetting and drying will accelerate any potential
chemical reactions within concrete, such as alkali-aggregate reaction.
A more advanced method for examining hardened concrete is x-ray image
analysis. In this procedure, electron beams are sent into the sample. X-ray photons are
25
then produced from the incoming electrons knocking inner shell electrons out of atoms in
the sample. Since each element has its own unique set of energy levels, the emitted
photons are indicative of the element that produced them. Analyzers are then used to
characterize the x-ray photons for their energy and abundance to determine the chemistry
of sample. In addition, due to the small size of the electron probe, it is possible to obtain
elemental analyses for volumes as small as 1 um in diameter. This capability is useful for
determining the presence of contaminants, investigating phase differences, and locating
inclusions, as well as determining qualitative or quantitative elemental composition.
2.2.5.3 Methods of Mitigation
As discussed previously, the three components necessary for alkali-silica reaction
are sufficient alkalies, reactive siliceous aggregates, and sufficient moisture. Methods for
preventing ASR expansion focus on controlling one or more of these components.
Limiting Alkalies
Limiting the total alkalies in the pore solution and in effect lowering the pH will
control ASR. For many years it was thought that ASR is unlikely to occur in concrete
with cements that have an alkali content below 0.6%. This is because studies showed
that the hydroxyl ion concentration is related to the alkali content of the Portland cement
(ACI 221.1R-98). Therefore, cements with higher alkali contents produce higher
expansions. However, it is now recognized that by itself, limiting the alkali content of
the Portland cement is not an effective way of controlling ASR. This is because it does
not control the total alkali content of the concrete. Laboratory tests have shown that total
alkali contents below 5 lb/yd3 is generally successful in controlling ASR. However, field
results have shown ASR expansion in structures with much lower alkali contents. This
26
may be due to the addition of alkalies from external sources such as deicing salts
(FHWA-RD-03-047). In addition, environmental regulations may make it difficult for
cement manufacturers to effectively limit the alkali content of the cement (ACI 221.1R-
98).
Limiting Moisture
As discussed earlier, it is very difficult to limit the available moisture in structures
exposed to external moisture such as pavements. However, any reduction in available
moisture through good mix design, drainage design or joint design will help to control
ASR and improve long term durability. Mixes that have low permeability will reduce the
ingress of moisture and deicing salts, which can reduce the potential for ASR expansion.
Reducing the amount of external moisture entering the concrete will also reduce the
water that is absorbed by the ASR gel and reduce expansion. One way to reduce
permeability is to use a low w/cm ratio. This will reduce the ion mobility and delay the
reaction (ACI 221.1R-98). However, lowering the w/cm ratio will also increase the alkali
concentrations of the pore solution. Therefore, it is better to use SCM’s to lower the
permeability than to reduce the w/cm ratio.
Aggregate Selection
For controlling alkali-silica reaction, using nonreactive aggregates is most
effective. However, this is not always practical in many regions. Field performance is
extremely important in predicting the reactivity of aggregates. When reactive aggregates
are used it may be possible to improve the aggregate quality with several beneficiation
strategies (Farny, and Kosmatka, 1997).
27
By blending reactive aggregates with non-reactive aggregates it is possible to
dilute the reactive silica concentration. Limestone sweetening or replacing a percentage
of the reactive sand and gravel with crushed limestone has been shown effective in some
parts of the country. Heavy media separation or selective quarry can be used to avoid
certain reactive materials although these processes can be expensive. In addition,
washing or scrubbing the aggregates can remove some of the reactive fines and reactive
coatings. (ACI 221.1R-98)
Using Supplementary Cementitious Materials
The most common method used to mitigate ASR expansion in concrete is the use
of supplementary cementitious materials. The use of SCM’s has many benefits both
chemically and physically. The most widely used SCM is fly ash due to its wide range of
economical and technical benefits.
a) Pozzolans/Fly Ash
Many issues affect the ability of a given fly ash to control expansion from ASR.
These include the dosage of fly ash, the chemical composition of the fly ash, the
reactivity of the aggregate and the alkali content of the concrete (FHWA-RD-03-047).
Fly ash can reduce ASR expansion by first reducing the permeability of the concrete
which limits the available moisture. The pozzolanic reaction created by the fly ash will
consume alkalies and reduce the mobility of the alkalies. In addition, by replacing
Portland cement, which has a relatively high concentration of alkalies, with fly ash
containing low levels of alkalies, it will reduce the total alkali content of the concrete.
The effectiveness of fly ash to control ASR varies significantly for different fly
ashes. The most important factor affecting the efficiency of a given fly ash is the CaO
content. Typically low lime fly ashes are more effective in reducing ASR. This is
28
because low CaO ashes produce a calcium silicate hydrate structure with a lower calcium
to silicon ratio which can absorb cations, particularly alkalies. High lime fly ashes may
react to a greater extent and release a large portion of its alkalies into the concrete.
(FHWA-RD-03-047)
Since Class C fly ashes have 10-40% CaO by mass, they are less effective in
controlling ASR than Class F fly ash which typically has less than 15% CaO (ACI
221.1R-98). Class F fly ash can usually control expansion with replacement levels from
15 to 30%. Class C fly ash replacement levels often exceed 30% and for use with
reactive aggregates necessary replacement levels may not be appropriate due to the effect
on other properties (ACI 221.1R-98).
Studies have shown that for fly ashes with high alkali content, there is a
pessimum limit (Naik, Krause, Ramme, B. and Chun, 2003). The pessimum limit is the
percent replacement for which the expansive reaction is the greatest and is usually very
pronounced for Class C fly ash. Any replacement levels below the pessimum limit will
cause equal or greater expansion than if fly ash was not used. Pessimum limits vary for
every fly ash, but are typically around 20% replacement by mass. There is no one size
fits all for using fly ash to mitigate ASR. It is generally required to use testing such as
ASTM C 1567 to determine the necessary replacement needed to control ASR.
Natural pozzolans, identified as Class N pozzolans, include naturally occurring
amorphous siliceous material (ACI 221.1R-98). Historically volcanic ash has been one
of the most commonly used natural pozzolans. In addition, calcining some siliceous
material to temperatures of 1000oC can produce a pozzolanic material. The pozzolanic
reactions caused by these materials can be very effective in limiting the amount and
29
mobility of the alkalies in the concrete. However, the use of natural pozzolans is
relatively limited in the Unitd States due to cost and availability.
b) Ground Granulated Blast Furnace Slag (GGBFS)
Ground granulated blast furnace slag is a by-product from manufacturing iron.
Slag can be effective in controlling ASR, but is needed in higher dosages. Slag is not a
pozzolan, but rather a latent hydraulic cement. However, unlike Portland cement, the
hydration of slag does not produce calcium hydroxide, which is weak and porous and
may contribute to ASR. Effective amounts of GGBFS to control ASR expansion range
from 25 to 50%. Although the alkalies in slag will contribute to the alkalinity of the
concrete, the alkalies in slag are released at a much slower rate than Portland cement
(ACI 221.1R-98).
2.2.5.4 Testing for ASR Potential
There are numerous test methods available to assess the ASR potential of
aggregates as well as specific concrete mixes. The three most widely used and accepted
tests are ASTM C 1293: Standard Test Method for Determination of Length Change of
Concrete Due to Alkali-Silica Reaction, ASTM C 1260: Standard Test Method for
Potential Alkali Reactivity of Aggregates (Mortar Bar Method) and ASTM C 1567:
Standard Test Method for Determining the Potential Alkali-Silica Reactivity of
combinations of Cementitious materials and Aggregate (Accelerated Mortar-Bar
Method)..
ASTM C 1293
Commonly referred to as the concrete prism test, ASTM C 1293, is generally
considered an accurate way of predicting field performance of aggregates. The cement

30
used is required to have an equivalent alkali content between 0.8 and 1.0 percent.
Additional alkalies are then added to the mixing water to obtain a total alkali content of
1.25 percent. Concrete prisms are cast and stored at 38oC with 100% relative humidity.
The test is generally run for 1 year, however, if evaluating SCM’s, the test may be run for
up to 2 years. Typically, maximum expansions of 0.04% are used with this test. (FHWA-
RD-03-047)
ASTM C 1293 is generally thought to be the most realistic in representing field
performance. However, this test is less conservative than ASTM C 1567 and can
potentially allow the use of some deleterious aggregates. The relatively long testing
period required for ASTM C 1293 is one of the major drawbacks of the test and has
limited its use recently.
ASTM C 1260
ASTM C 1260, or the accelerated mortar bar test, was developed by Oberholster
and Davies in 1986 at the National Building Research Institute in South Africa (FHWA-
RD-03-047). It is used to assess the potential for ASR of aggregates. In this test method,
mortar bars are cast with aggregates processed to a standard gradation. After curing, the
mortar bars are submersed in a 1 N NaOH solution at 80oC where they are stored for 14
to 56 days. Length change measurements are taken periodically during the storage
period. Typically, expansions at 14 days are used in specifications, although limits for
different agencies vary. The expansion criteria provided by ASTM, indicate that
expansions less than 0.1% are considered innocuous, 0.1 to 0.2% are considered
potentially reactive and greater than 0.2% is reactive. (FHWA-RD-03-047)
ASTM C 1567
31
ASTM C 1567 is probably the most widely used test method to assess the ASR
potential of specific mixes. This test method is very similar to that of ASTM C 1260.
However, this test method allows for the use of combinations of SCM’s in the mortar
bars to allow for the evaluation of specific concrete mixes. As with ASTM C 1260, these
mortar bars use aggregates processed to a specific gradation and are immersed in 1 N
NaOH solution. ASTM C 1567 is generally recognized as a conservative test since it
provides excess NaOH in the 1 N solution in which the specimen is immersed, as well
using high temperatures (Malvar, 2001). By providing essentially unlimited alkalies, this
test method is useful for identifying slowly reactive aggregates, however, the test can also
identify sound aggregates as being reactive. Because of the severity of the test,
aggregates found to be innocuous are very likely to perform well in the field. ASTM
recommends an expansion limit of 0.1% at 14 days (FHWA-RD-03-047). However, the
state of Nebraska due to its slowly reactive aggregates, requires an expansion limit of
0.1% at 28 days.
2.2.5.5 Effect of Deicing Chemicals on ASR
Recent research by the American Concrete Pavement Association or ACPA
(2005) has shown that common screening tests, such as ASTM C 1567, that are being
used to identify ASR potential may not be accurate if the materials are subjected to
certain deicing chemicals. In some airfields premature deterioration has been observed,
often in pavements less than 10 years old. In many of these cases, the surface
deteriorations can be correlated to the application patterns of the deicing chemicals.
Therefore, deicing agents commonly used on airfields are being investigated. These
chemicals include Potassium Acetate (KA) and Sodium Acetate (NaA). It was seen that
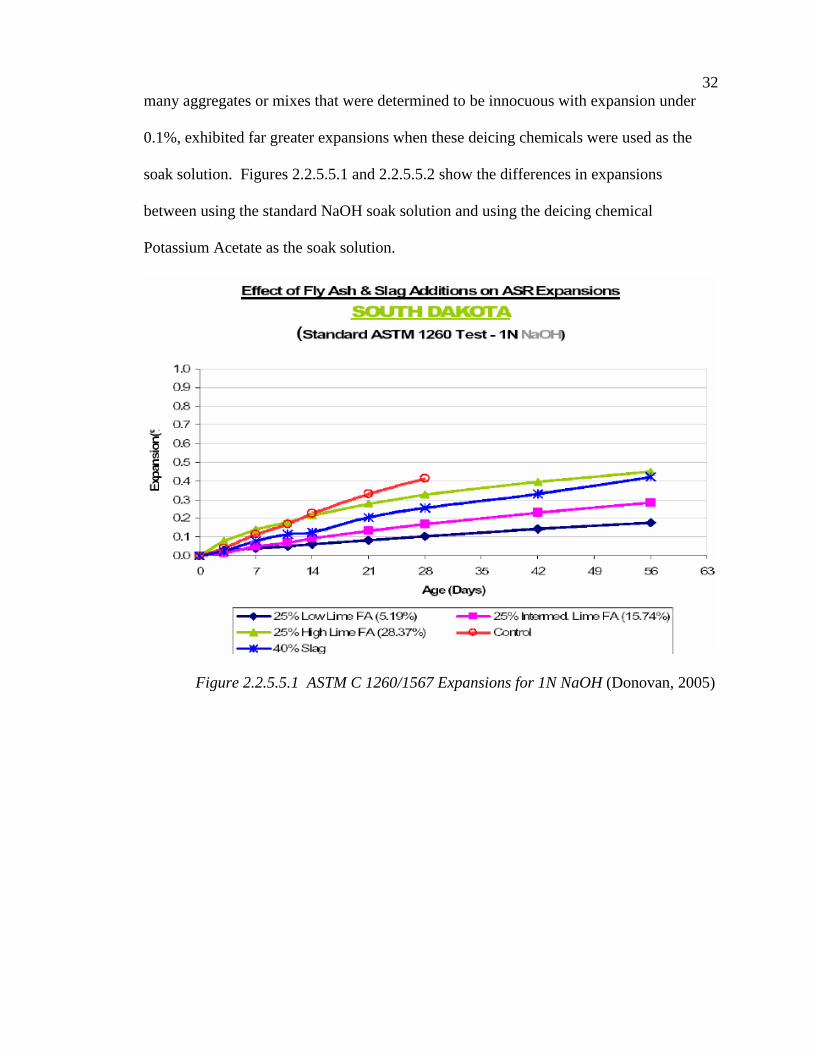
32
many aggregates or mixes that were determined to be innocuous with expansion under
0.1%, exhibited far greater expansions when these deicing chemicals were used as the
soak solution. Figures 2.2.5.5.1 and 2.2.5.5.2 show the differences in expansions
between using the standard NaOH soak solution and using the deicing chemical
Potassium Acetate as the soak solution.
Figure 2.2.5.5.1 ASTM C 1260/1567 Expansions for 1N NaOH (Donovan, 2005)
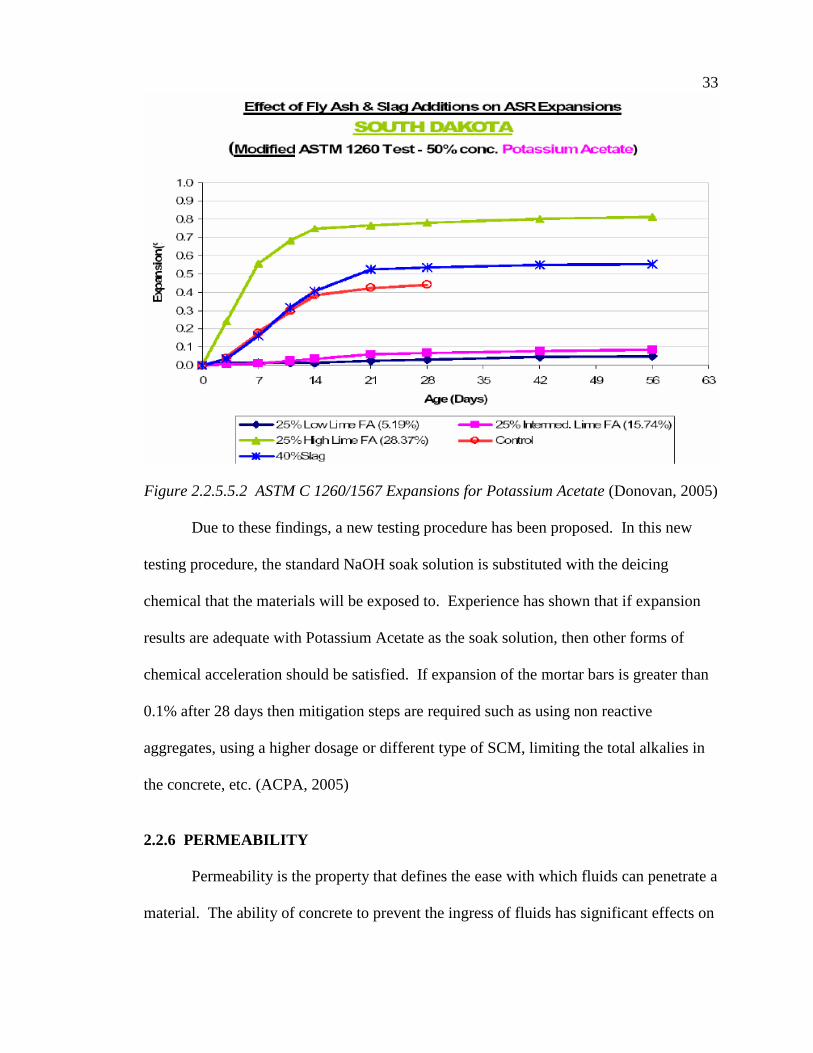
33
Figure 2.2.5.5.2 ASTM C 1260/1567 Expansions for Potassium Acetate (Donovan, 2005)
Due to these findings, a new testing procedure has been proposed. In this new
testing procedure, the standard NaOH soak solution is substituted with the deicing
chemical that the materials will be exposed to. Experience has shown that if expansion
results are adequate with Potassium Acetate as the soak solution, then other forms of
chemical acceleration should be satisfied. If expansion of the mortar bars is greater than
0.1% after 28 days then mitigation steps are required such as using non reactive
aggregates, using a higher dosage or different type of SCM, limiting the total alkalies in
the concrete, etc. (ACPA, 2005)
2.2.6 PERMEABILITY
Permeability is the property that defines the ease with which fluids can penetrate a
material. The ability of concrete to prevent the ingress of fluids has significant effects on

34
the concrete’s resistance to many durability issues such as ASR and freezing and
thawing. Therefore, permeability can be considered a primary factor in connection with
the durability of concrete. The primary factors influencing the permeability of concrete
are water/cementitious material ratio, water content, use of SCM’s and method of curing.
As with many other properties, the permeability of concrete containing SCM’s is very
dependent on the type and dosage of SCM’s used. Generally, concrete containing SCM’s
will have slightly higher permeability at early ages. However, after 14 to 28 days, SCM
concrete will generally have superior permeability compared to OPC concrete. This is
mainly due to the increased amount of Calcium Silicate Hydrate (C-S-H) phase which is
the “glue” that is responsible for the concrete’s strength and impermeability. In concretes
containing fly ash, during the pozzolanic reaction the fly ash reacts with the weak and
porous Calcium Hydroxide (CH) formed during cement hydration to form additional C-
S-H, lowering the permeability. The use of slag creates minimal pozzolanic reactions,
however, unlike Portland cement the hydration of slag produces no CH, also lowering the
permeability.
The permeability of concrete is often measured using ASTM C 1202: Standard
Test Method for Electrical Indication of Concrete’s Ability to Resist Chloride Ion
Penetration. This test measures the ability of concrete to resist the penetration of
chloride ions and the results are measured in coulombs. The following is the rating
system per ASTM C 1202.
Charged Passed Chloride Permeability
> 4000 High
2000-4000 Moderate
1000-2000 Low

35
100-1000 Very Low
<100 Negligible
Due to a pronounced synergistic effect, using ternary mixes with two types of
SCM’s will often produce concrete with extremely low permeability. Figure 2.2.6.1
shows the rapid chloride permeability results for various ternary blends using Class F fly
ash and slag.
Figure 2.2.6.1 Chloride Penetration of Class F Fly Ash and Slag Mixes (Thomas, 2004)
Studies have also shown that ternary mixes using both Class C and Class F fly ash
can produce a very low permeable concrete. Naik et. al. (1996) showed that concrete
using 20% Class C fly ash and 20% Class F fly ash had far superior permeability than
OPC concrete or binary mixes containing 35% Class C fly ash. The ternary mixes using
C and F ash had penetrations of 1330 coulombs at 28 days and 225 coulombs at 365 days.
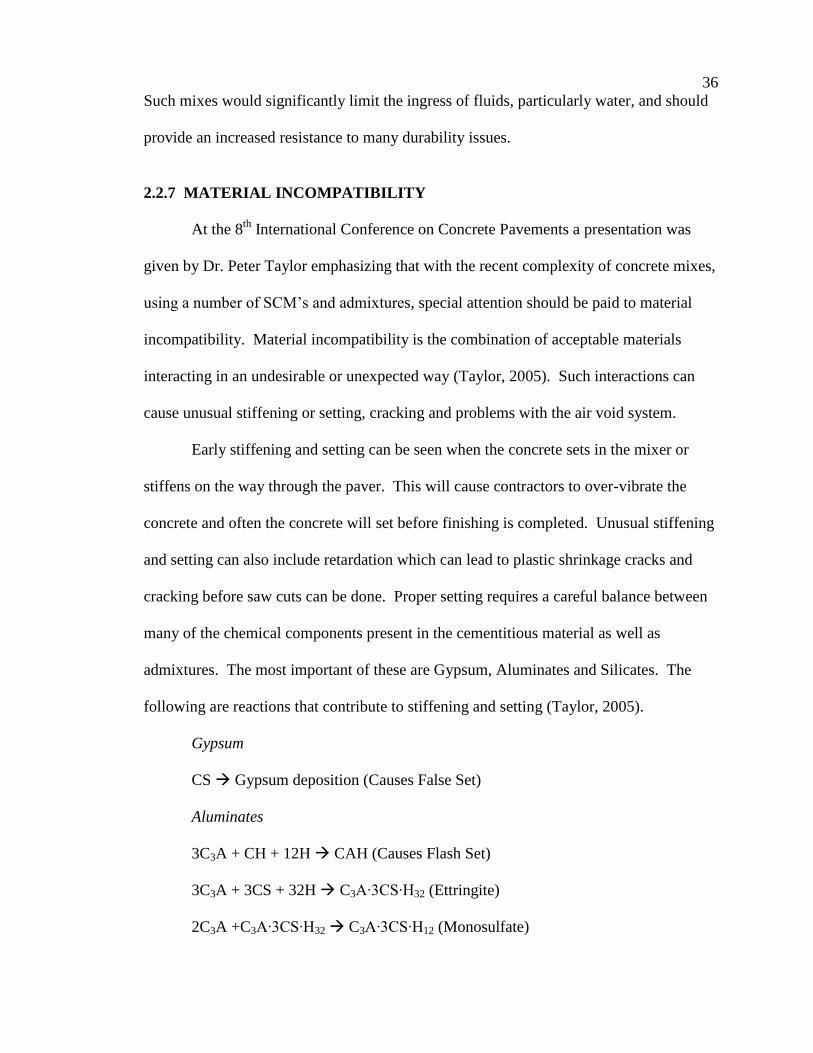
36
Such mixes would significantly limit the ingress of fluids, particularly water, and should
provide an increased resistance to many durability issues.
2.2.7 MATERIAL INCOMPATIBILITY
At the 8th
International Conference on Concrete Pavements a presentation was
given by Dr. Peter Taylor emphasizing that with the recent complexity of concrete mixes,
using a number of SCM’s and admixtures, special attention should be paid to material
incompatibility. Material incompatibility is the combination of acceptable materials
interacting in an undesirable or unexpected way (Taylor, 2005). Such interactions can
cause unusual stiffening or setting, cracking and problems with the air void system.
Early stiffening and setting can be seen when the concrete sets in the mixer or
stiffens on the way through the paver. This will cause contractors to over-vibrate the
concrete and often the concrete will set before finishing is completed. Unusual stiffening
and setting can also include retardation which can lead to plastic shrinkage cracks and
cracking before saw cuts can be done. Proper setting requires a careful balance between
many of the chemical components present in the cementitious material as well as
admixtures. The most important of these are Gypsum, Aluminates and Silicates. The
following are reactions that contribute to stiffening and setting (Taylor, 2005).
Gypsum
CS Gypsum deposition (Causes False Set)
Aluminates
3C3A + CH + 12H CAH (Causes Flash Set)
3C3A + 3CS + 32H C3A∙3CS∙H32 (Ettringite)
2C3A +C3A∙3CS∙H32 C3A∙3CS∙H12 (Monosulfate)

37
Silicates
3C3S +6H 3CSH +6CH
3C2S + 4H 3CSH + CH
Many factors can lead to early stiffening such as not enough or the wrong kind of
Sulfates, Class C fly ash with high C3A, very fine cement, some admixtures, w/cm ratio
or hot weather (Taylor, 2005). Cement manufactures carefully balance the Gypsum,
Aluminates and Silicates. However, when SCM’s are used, they can sometimes contain
some of these compounds, throwing off that balance. Therefore, it is recommended to
have Portland cement pre-blended with SCM’s so that cement manufacturers can obtain a
proper balance of the reactions controlling setting.
Other results of material incompatibility can be cracking and a poor air void
system. Cracking is a function of many things including shrinkage, restraint, stiffness,
strength and creep (Taylor, 2005). Shrinkage effects are always cumulative and cracking
is usually never due to a single mechanism. Problems with the air void system can
usually be categorized as the wrong amount of air or the wrong kind of air. Material
incompatibility can cause the wrong amount of air by making the air bubbles unstable
causing the air content to be unpredictable. The wrong kind of air can include entrapped
air where the bubbles are too coarse or coalescence where bubbles are clustered around
the outside of the aggregate.
2.2.8 AGGREGRATE GRADATION
Recently, aggregate optimization has received increasing attention due to higher
use of manufactured aggregates as well as new classes of concrete such as high
performance concrete and self compacting concrete. Optimizing aggregates can have

38
many beneficial results such as lower cost due to less cement, less segregation, less
shrinkage, less porosity, improved workability and improved finishability. (Fowler, 2005)
The most commonly used method for optimizing aggregates is the Shilstone
method. Shilstone’s method focuses on the combined aggregate gradation. It divides the
aggregates into coarse, intermediate and fine. This method proposes using the
“coarseness chart”, the “18-8 criteria chart” and the “0.45 power chart” to optimize the
aggregate gradation.
The “coarseness chart” shown in Figure 2.2.8.1 uses the Coarseness factor and
Workability factor.
Figure 2.2.8.1 Coarseness Chart (Fowler, 2005)
The Coarseness factor is the combined percentage retained above the 3/8” sieve
divided by the combined percentage retained above the #8 sieve. The workability factor
is the particles passing the #8 sieve. In addition, the workability factor is increased by
2.5% for each increase of 94 pounds of cement over 564 pounds per cubic yard. The
Coarseness Chart places aggregate gradations into 5 Zones (Shilstone, 2005).

39
Zone I: Mixtures have the tendency to segregate during placement
and contribute to edge slump or edge slough and, during
vibration lead to an excess of mortar rising to the surface
creating spalling and scaling.
Zone II: Mixes in this zone provide good workability and finishability
Zone III: Mixes in this zone are an extension of Zone II, but have a
nominal max. aggregate size of ½”.
Zone IV: Mixes in this zone are over-sanded requiring more water and
air-entraining agents.
Zone V: Mixes in this zone have too much coarse aggregate to be
plastic and workable
Table 2.2.8.1 shows the suggested zones in the “Coarseness Chart”
Table 2.2.8.1 Desired Zones in Coarseness Chart (Fowler, 2005)
The 0.45 power curve, shown in figure 2.2.8.2, is based on the percent passing on
each sieve. Historically, the 0.45 power curve has been used to develop uniform
gradations for asphalt mix designs, however, it is increasingly being used to develop

40
uniform gradations for Portland cement concrete mix designs (IDOT I.M. 532). The
plotted line should follow the trendline as close as possible.
Figure 2.2.8.2 0.45 Power Chart (Fowler, 2005)
The third tool used in the Shilstone method is the percent retained chart. In this
chart the combined percentage retained for each sieve is plotted. This chart attempts to
produce uniform grading and limits the amounts retained in most sieves between 8% and
18%. A well graded aggregate combination should have no major peaks or valleys and
should remain between the boundary lines shown in the chart.

41
Figure 2.2.8.3 Percentage Retained Chart (Fowler, 2005)
It is important to use all three charts together to determine the optimum aggregate
gradation. Although this method does not guarantee a good mix, using all these charts
will be very effective in identifying mixtures that may have potential problems. In
addition, it is important to realize that the “Coarseness Chart” does not account for the
shape or texture of the aggregate. The shape and texture of aggregate particles affect the
volume of paste needed to coat particles as well as the interactions during placement.
The ideal aggregate shape for workability is smooth and round. Smooth and round
particles, such as gravels, have a low surface to volume ratio and require less paste to
coat the surfaces of each particle. Crushed limestone aggregates, which usually tend to
be more angular and rough than gravel aggregates, have a higher surface to volume ratio,
and may require more paste to reduce particle interactions. (IDOT I.M. 532)

42
Due to a downward trend in concrete pavement performance, the state of Iowa
began a program called Quality Management Concrete or QM-C. The initiative was a
cooperation between industry and agency to develop a better performing concrete.
Today, the basis of QM-C is to have the contractor, with agency oversight, develop their
own concrete mix design using optimum aggregate gradation (Smith, 2005). This
provides contractors with the control and responsibility to ensure a quality product.
These new specifications eliminated many of the problems with past pavements such as
highly sanded and gap graded mixes. The new QM-C mixes exhibited much higher
workability, strength, consistency and decreased permeability.
Due to concerns from contractors, the new QM-C program started out as a
developmental specification with contractors analyzing mixes on pilot projects. As QM-
C gained support it moved through the Iowa DOT districts and was used primarily on
major projects. In addition, during the early years of implementation, a partnering
workshop was required for all QM-C projects. Today, over 60 projects have used the
QM-C specifications and the Iowa DOT now offers incentives based on aggregate
gradation, primarily the Shilstone principles. Although in order to meet the new
specifications most projects require the use of three sources of aggregates, the majority of
contractors have accepted the new policies due to better control of mixes and higher
quality concrete. (Smith, 2005)
A study was done by Todd Hanson of the Iowa Department of Transportation to
evaluate Nebraska’s aggregates using the Shilstone method. Figures 2.2.8.4 – 2.2.8.6
show the results of this analysis using 30% limestone and 70% sand and gravel. Figure
2.2.8.6 also shows the results for mixes using different percentages of limestone. From
the figures it is clear that mixes using 30% limestone do not produce a well-graded
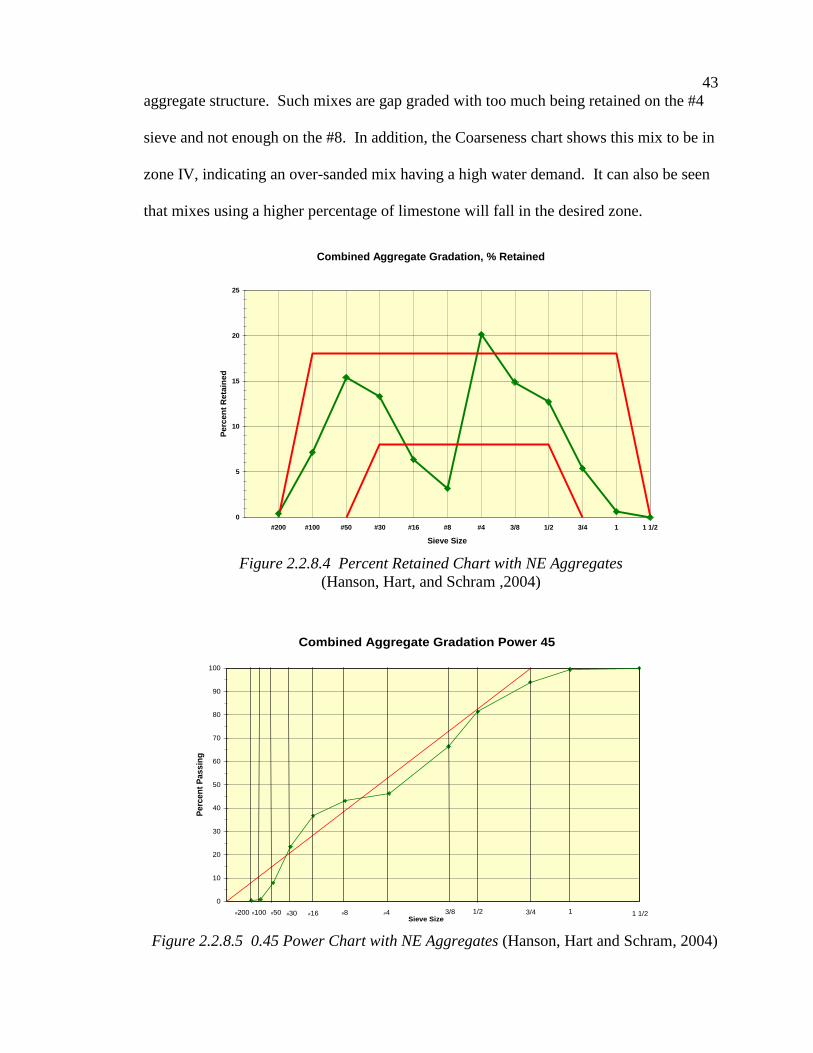
43
aggregate structure. Such mixes are gap graded with too much being retained on the #4
sieve and not enough on the #8. In addition, the Coarseness chart shows this mix to be in
zone IV, indicating an over-sanded mix having a high water demand. It can also be seen
that mixes using a higher percentage of limestone will fall in the desired zone.
Combined Aggregate Gradation, % Retained
0
5
10
15
20
25
#200 #100 #50 #30 #16 #8 #4 3/8 1/2 3/4 1 1 1/2
Sieve Size
Pe
rce
nt
Re
tain
ed
Figure 2.2.8.4 Percent Retained Chart with NE Aggregates
(Hanson, Hart, and Schram ,2004)
0
10
20
30
40
50
60
70
80
90
100
Sieve Size
Pe
rce
nt
Pa
ss
ing
1 1/213/41/23/8#4#8#16#30#50#100
Combined Aggregate Gradation Power 45
Scale
#200
Figure 2.2.8.5 0.45 Power Chart with NE Aggregates (Hanson, Hart and Schram, 2004)
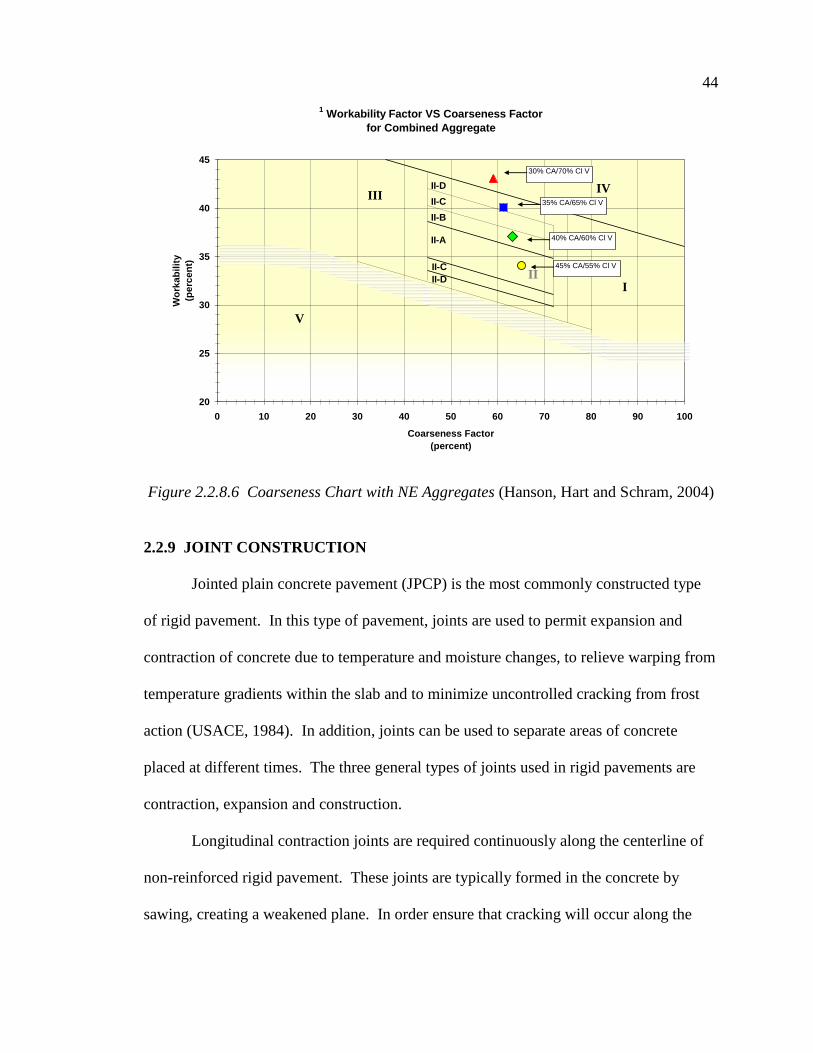
44
1 Workability Factor VS Coarseness Factor
for Combined Aggregate
20
25
30
35
40
45
0 10 20 30 40 50 60 70 80 90 100
Coarseness Factor
(percent)
Wo
rka
bil
ity
(pe
rce
nt)
IV
IIII-D
II-C
II-B
II-C
II-D
I
III
V
II-A
30% CA/70% Cl V
35% CA/65% Cl V
40% CA/60% Cl V
45% CA/55% Cl V
Figure 2.2.8.6 Coarseness Chart with NE Aggregates (Hanson, Hart and Schram, 2004)
2.2.9 JOINT CONSTRUCTION
Jointed plain concrete pavement (JPCP) is the most commonly constructed type
of rigid pavement. In this type of pavement, joints are used to permit expansion and
contraction of concrete due to temperature and moisture changes, to relieve warping from
temperature gradients within the slab and to minimize uncontrolled cracking from frost
action (USACE, 1984). In addition, joints can be used to separate areas of concrete
placed at different times. The three general types of joints used in rigid pavements are
contraction, expansion and construction.
Longitudinal contraction joints are required continuously along the centerline of
non-reinforced rigid pavement. These joints are typically formed in the concrete by
sawing, creating a weakened plane. In order ensure that cracking will occur along the
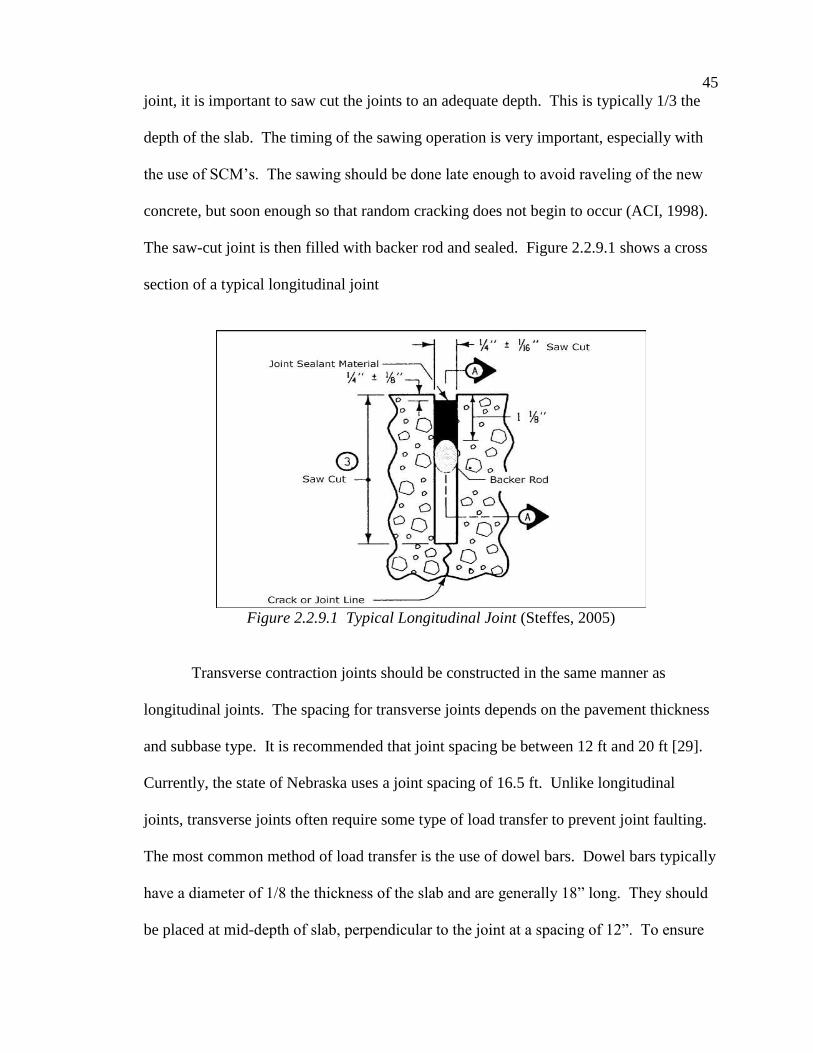
45
joint, it is important to saw cut the joints to an adequate depth. This is typically 1/3 the
depth of the slab. The timing of the sawing operation is very important, especially with
the use of SCM’s. The sawing should be done late enough to avoid raveling of the new
concrete, but soon enough so that random cracking does not begin to occur (ACI, 1998).
The saw-cut joint is then filled with backer rod and sealed. Figure 2.2.9.1 shows a cross
section of a typical longitudinal joint
Figure 2.2.9.1 Typical Longitudinal Joint (Steffes, 2005)
Transverse contraction joints should be constructed in the same manner as
longitudinal joints. The spacing for transverse joints depends on the pavement thickness
and subbase type. It is recommended that joint spacing be between 12 ft and 20 ft [29].
Currently, the state of Nebraska uses a joint spacing of 16.5 ft. Unlike longitudinal
joints, transverse joints often require some type of load transfer to prevent joint faulting.
The most common method of load transfer is the use of dowel bars. Dowel bars typically
have a diameter of 1/8 the thickness of the slab and are generally 18” long. They should
be placed at mid-depth of slab, perpendicular to the joint at a spacing of 12”. To ensure

46
adequate performance it is critical to prevent horizontal or vertical misalignment of the
dowel bars. Therefore, agencies will specify tolerances for vertical and horizontal
translational alignment. The tolerances vary but are typically around 0.25 to 0.375 in/ft.
(Rufino et. al., 2005)
Expansion joints are used for the relief of forces resulting from thermal expansion
of the pavement and to permit unrestrained differential horizontal movement of adjoining
pavement or structures (USACE, 2004). They are placed between any structure
projecting through, into or against the pavement (ACI, 1998). The joints should be a
minimum of ¼” and an expansion joint filler is placed in the joint. Construction joints
are formed at the end of each day or any time interruptions occur in the concreting
operation. These can be longitudinal joints (between lanes) or transverse joints (when
paving is stopped each day).
In addition, it is known that the current method of joint construction takes time
and money as well as creating large amounts of dust. These joints have a tendency to
accumulate and retain moisture, accelerating deterioration of the pavement. Therefore, a
new method for constructing longitudinal joints is being developed where the joints are
formed during paving. This method involves placing joint-forming knives in front and
behind the paver as shown in figures 2.2.9.2 and 2.2.9.3.
Figure 2.2.9.2 Knife Mounted on Paver (Steffes, 2005)

47
Figure 2.2.9.3 Knife Formed Joint (Steffes, 2005)
Figure 2.2.9.4 Core of Knife Formed Joint (Steffes, 2005)
This method of forming longitudinal joints is done with one pass during the
paving operation. It requires no joint sealing or joint cutting and results in a virtually cost
free longitudinal joint. However, further research still needs to be done to investigate the
optimum size and shape of the knife and to develop specifications for its use.

48
2.3 MEETING AT IOWA STATE UNIVERSITY
On May 9, 2005 researchers from the University of Nebraska traveled to Ames,
Iowa to meet with personal from the Iowa DOT and Iowa State University. The objective
of the meeting was to gain knowledge of research that has been done in Iowa that could
assist in the investigation of premature deterioration being observed in Nebraska roads.
The discussion was very helpful to the progress of the study because of the comparable
existing conditions in Iowa and the similar deterioration problems that they have seen and
mitigated. In their opinion, the deterioration being seen in Nebraska roads is most likely
due to the same type of problems that Iowa had been seeing. They suggested that Class C
fly ash is probably not directly responsible for the deterioration although it may be
leading to some of the problems causing the deterioration. A substandard air void system
could be mostly responsible for the deterioration. Several steps were suggested to ensure
an adequate air void system such as increasing the specifications for target air content as
well as putting limitations on vibrator frequencies. A change in the mix design would
also be very helpful. In addition, other factors such as joint cutting, joint sealing and
deicing chemicals need to be evaluated. The minutes of the meeting at Iowa State
University are included in Appendix A.
2.3 SURVEY OF STATE DOT’S A survey was conducted with experts from various DOTs throughout the Unitd
States and Canada. The purpose of the survey was to determine what SCMs were
allowed in other states and if other states were experiencing similar problems with their
pavements. In addition, the survey requested recommendations and comments for
49
identifying and mitigating the deterioration being seen in Nebraska. The responses of
that survey are included in Appendix D.
2.4 UNIVERSITY OF NEBRASKA WORKSHOP
A workshop was held in Nebraska and was attended by various experts in
concrete pavement technology and concrete chemistry. The attendees included people
from academia, DOTs as well as the project sponsors. The two day workshop included
site visits in Lincoln, Nebraska to show examples of the premature deterioration being
seen. Presentations were given by various experts on their experience with pavement
durability and mitigation measures that are effective in controlling deterioration
mechanism. In addition, a discussion was held regarding the information presented as
well as recommendations for potential mixes. The minutes of the roundtable discussion
can be found in Appendix B.

50
3.0 POTENTIAL MIXES Using the information gathered through the literature review, potential mixes
using Class C fly ash were identified. The potential mixes were carefully selected by the
UNL team along with NDOR personnel with the goal of producing a concrete that would
meet expected performance criteria. These mixes are both binary and ternary blends
using the appropriate replacement levels needed to satisfy performance criteria. Some of
the mixes also use alternative aggregate gradations instead of the standard 30% limestone
– 70% sand and gravel. Since the chemical durability of concrete is most effectively
increased by proper mix design, the foremost factor in determining the mix proportions
was the expected resistance to ASR. In addition, since the exact mix proportions that are
needed to effectively control ASR while meeting other performance criteria are unknown,
the mix proportions may be adjusted during throughout the testing procedures to produce
the best overall results. Any adjusted mixes must undergo all durability and performance
testing.
3.1 MIX DESCRIPTION
In order to effectively track and label each potential mix, a labeling system was
developed. The labeling system gives an overall description of each mix enabling the
mix design associated with each mix to be easily identified. The definitions of the
symbols used in the labeling system are given below.
CM = Total Cementitious Material
C = Class C Fly Ash
F = Class F Fly Ash
S = Ground Granulated Blast Furnace Slag

51
L = Limestone
The following table shows a summary of the potential mixes.
Table 3.1.1 Summary of Potential Mixes
Mix Total
Cementitious
Material
(lb/yd3)
Class C
Fly Ash
(%)
Class F
Fly Ash
(%)
Slag
(%)
Limestone
(% of
Total
Agg.)
Sand &
Gravel (%
of Total
Agg.
1A 564 40 0 0 30 70
1B 564 40 0 0 45 55
2 564 20 20 0 30 70
3 564 20 0 30 30 70
4A 650 35 0 0 30 70
4B 650 35 0 0 45 55
Reference
Mixes
5 564 17 0 0 30 70
6 564 0 25 0 30 70
3.2 COST ESTIMATE
Although the most important aspect of the potential mixes is the performance, the
cost of each mix must be considered. Since the current standard mix has shown excellent
performance, any proposed mixes must have an equal or lesser unit cost. Ideally, since
the standard 1PF mix uses Class F fly ash which must be imported at a cost equal to
Portland cement, the proposed mixes using Class C fly ash should have a significantly
reduced cost. In addition, as mentioned earlier, due to the limited availability of
limestone in the western parts of the state, a cost analysis must be performed for both
eastern and western Nebraska. Table 3.3.1 shows the estimated unit cost of each
material. In addition, Tables 3.1.2 and 3.1.3 show the concrete cost per cubic yard using
estimated material quantities assuming w/cm of 0.45 and an air content of 7%.
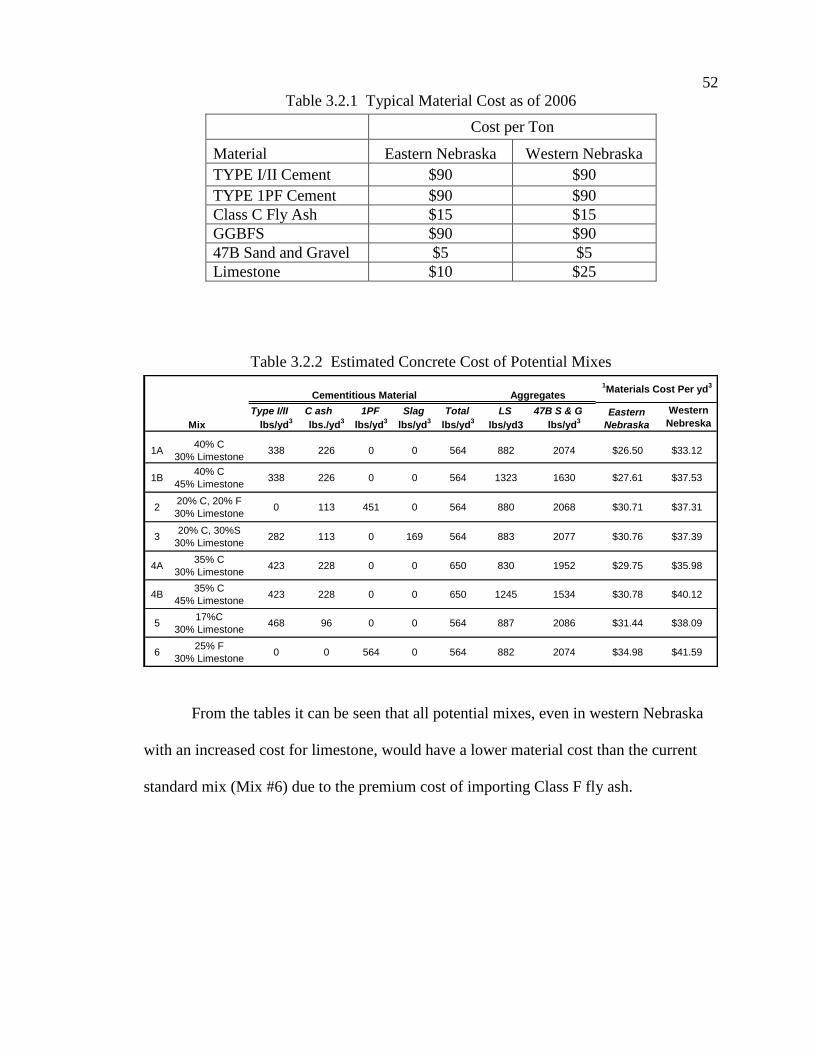
52
Table 3.2.1 Typical Material Cost as of 2006
Cost per Ton
Material Eastern Nebraska Western Nebraska
TYPE I/II Cement $90 $90
TYPE 1PF Cement $90 $90
Class C Fly Ash $15 $15
GGBFS $90 $90
47B Sand and Gravel $5 $5
Limestone $10 $25
Table 3.2.2 Estimated Concrete Cost of Potential Mixes
Type I/II C ash 1PF Slag Total LS 47B S & G
lbs/yd3
lbs./yd3
lbs/yd3
lbs/yd3
lbs/yd3
lbs/yd3 lbs/yd3
1A40% C
30% Limestone338 226 0 0 564 882 2074 $26.50 $33.12
1B40% C
45% Limestone338 226 0 0 564 1323 1630 $27.61 $37.53
220% C, 20% F
30% Limestone0 113 451 0 564 880 2068 $30.71 $37.31
320% C, 30%S
30% Limestone282 113 0 169 564 883 2077 $30.76 $37.39
4A35% C
30% Limestone423 228 0 0 650 830 1952 $29.75 $35.98
4B35% C
45% Limestone423 228 0 0 650 1245 1534 $30.78 $40.12
517%C
30% Limestone468 96 0 0 564 887 2086 $31.44 $38.09
625% F
30% Limestone0 0 564 0 564 882 2074 $34.98 $41.59
1Materials Cost Per yd
3
Eastern
Nebraska
Western
NebreskaMix
AggregatesCementitious Material
From the tables it can be seen that all potential mixes, even in western Nebraska
with an increased cost for limestone, would have a lower material cost than the current
standard mix (Mix #6) due to the premium cost of importing Class F fly ash.
53
PART 2 – EXPERIMENTAL INVESTIGATION
4.0 MATERIALS
Due to the longevity of the project and large testing program, only the results of
the ASTM C 1567 testing have completed to date. The results of that testing are
presented herein.
4.1 MATERIAL CHARACTERISTICS
As discussed previously, the resistance of a given concrete to Alkali-Silica
reaction is a very dependent on the amount and type of cementitious materials that are
used. However, the chemical composition of the materials and as well as the physical
properties can have a significant effect on the expansions caused by ASR. Therefore, it
was important to accurately identify the chemical and physical characteristics of any of
the materials used in the mixes. All of the physical and chemical analysis of the
cementitious material as well as the aggregates was conducted by NDOR. In addition, an
adequate amount of materials were obtained for the entire testing program. Therefore,
the mixes throughout the entire project will contain identical materials, making a
comparison of the results easier and more valuable.
4.1.1 SOURCE OF MATERIALS
For the scope of this project it was decided to use only one source of each
material. Due to the large testing program that was proposed as well as the number of
potential mixes, testing for effect of the different material sources would significantly
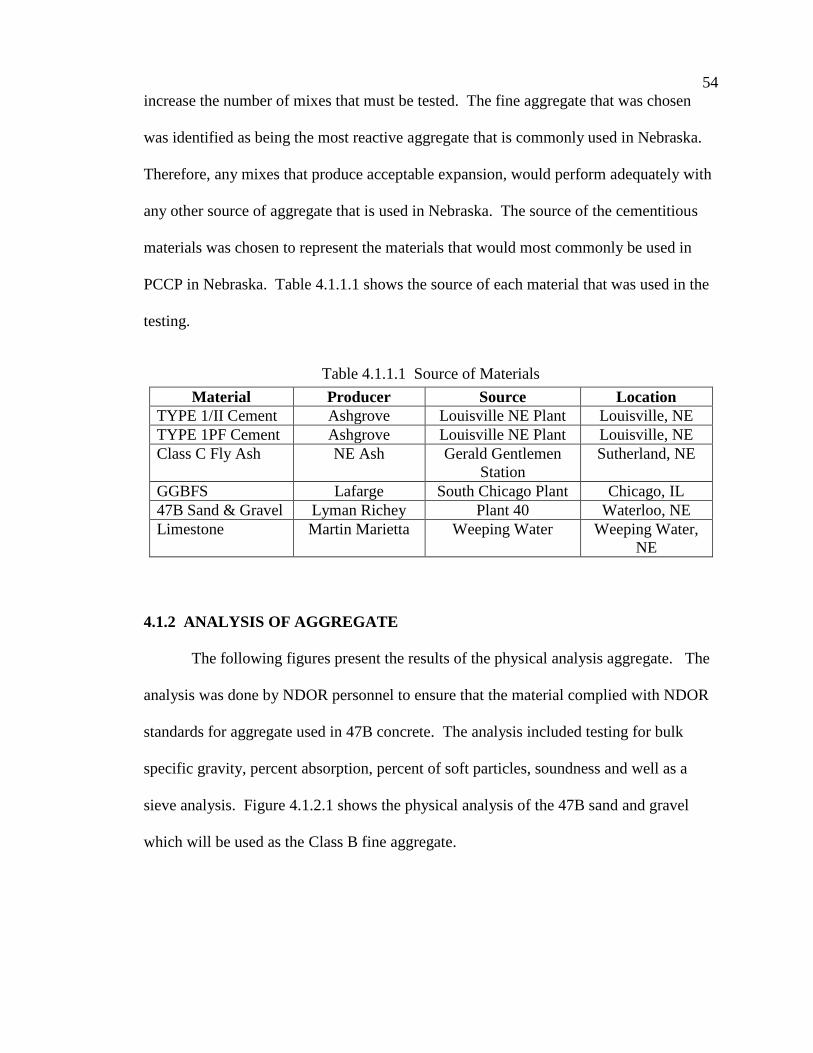
54
increase the number of mixes that must be tested. The fine aggregate that was chosen
was identified as being the most reactive aggregate that is commonly used in Nebraska.
Therefore, any mixes that produce acceptable expansion, would perform adequately with
any other source of aggregate that is used in Nebraska. The source of the cementitious
materials was chosen to represent the materials that would most commonly be used in
PCCP in Nebraska. Table 4.1.1.1 shows the source of each material that was used in the
testing.
Table 4.1.1.1 Source of Materials
Material Producer Source Location
TYPE 1/II Cement Ashgrove Louisville NE Plant Louisville, NE
TYPE 1PF Cement Ashgrove Louisville NE Plant Louisville, NE
Class C Fly Ash NE Ash Gerald Gentlemen
Station
Sutherland, NE
GGBFS Lafarge South Chicago Plant Chicago, IL
47B Sand & Gravel Lyman Richey Plant 40 Waterloo, NE
Limestone Martin Marietta Weeping Water Weeping Water,
NE
4.1.2 ANALYSIS OF AGGREGATE
The following figures present the results of the physical analysis aggregate. The
analysis was done by NDOR personnel to ensure that the material complied with NDOR
standards for aggregate used in 47B concrete. The analysis included testing for bulk
specific gravity, percent absorption, percent of soft particles, soundness and well as a
sieve analysis. Figure 4.1.2.1 shows the physical analysis of the 47B sand and gravel
which will be used as the Class B fine aggregate.
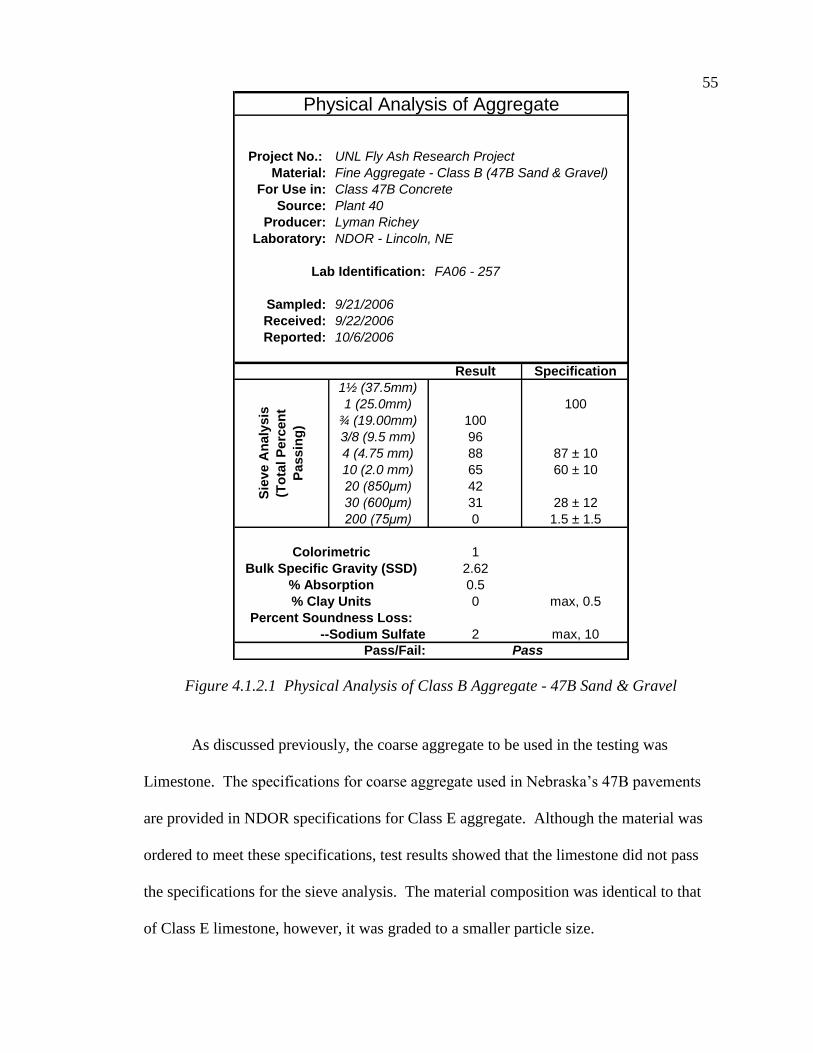
55
Project No.: UNL Fly Ash Research Project
Material: Fine Aggregate - Class B (47B Sand & Gravel)
For Use in: Class 47B Concrete
Source: Plant 40
Producer: Lyman Richey
Laboratory: NDOR - Lincoln, NE
FA06 - 257
Sampled: 9/21/2006
Received: 9/22/2006
Reported: 10/6/2006
Result Specification
1½ (37.5mm)
1 (25.0mm) 100
¾ (19.00mm) 100
3/8 (9.5 mm) 96
4 (4.75 mm) 88 87 ± 10
10 (2.0 mm) 65 60 ± 10
20 (850μm) 42
30 (600μm) 31 28 ± 12
200 (75μm) 0 1.5 ± 1.5
1
2.62
0.5
0 max, 0.5
2 max, 10
Pass/Fail: Pass
Lab Identification:
Physical Analysis of Aggregate
Percent Soundness Loss:
--Sodium Sulfate
Colorimetric
Bulk Specific Gravity (SSD)
% Absorption
% Clay Units
Sie
ve
An
aly
sis
(To
tal P
erc
en
t
Pa
ss
ing
)
Figure 4.1.2.1 Physical Analysis of Class B Aggregate - 47B Sand & Gravel
As discussed previously, the coarse aggregate to be used in the testing was
Limestone. The specifications for coarse aggregate used in Nebraska’s 47B pavements
are provided in NDOR specifications for Class E aggregate. Although the material was
ordered to meet these specifications, test results showed that the limestone did not pass
the specifications for the sieve analysis. The material composition was identical to that
of Class E limestone, however, it was graded to a smaller particle size.

56
Although it was shown that the limestone did not meet NDOR specifications, it
was decided to continue with the ASTM C 1567 testing using the not compliant
aggregate. The only aspect of the physical analysis that did not meet the specification
was the sieve analysis. However, the ASTM C 1567 standard specifications require that
all the aggregate be sieved to an exact gradation. Since the limestone had to be crushed
to meet the grading requirements, the particle gradation of the original limestone does not
have any effect on the testing. In addition, limestone is known to be a non-reactive
aggregate and the ASTM C 1567 test results will not be affected by the source of
limestone. However, for all further performance tests, where the limestone will not be
sieved, a new source of limestone will be used that complies with all NDOR standards for
Class E coarse aggregate used in 47B concrete. Figure 4.1.2.2 shows the physical
analysis for the non-compliant limestone that was used in the ASTM C 1567 testing.
Figure 4.1.2.3 presents the physical analysis of the limestone that will be used for all
further testing.

57
Project No.: UNL Fly Ash Research Project
Material: Coarse Aggregate - Class E (Limestone)
For Use in: Class 47B Concrete
Source: Weeping Water
Producer: Martin Marietta
Laboratory: NDOR - Lincoln, NE
CA06 - 264
Sampled: 9/21/2006
Received: 9/22/2006
Reported: 10/6/2006
Result Specification
1(25mm) 100 ± 8
3/4 (19mm) 100 78 ± 12
1/2 (12.7mm) 77
3/8 (9.5 mm) 49 30 ± 15
4 (4.75 mm) 10 6 ± 6
10 (2.0 mm) 2
20 (850μm) 1 2 ± 2
30 (600μm) 1
200 (75μm) 1 1.5 ± 1.5
1
2.65
1.6
0 max, 0.5
0 max, 1.0
0.5 max 3.5
0.5 max 3.5
4.5
2 max, 8,0
Pass/Fail:
30 max, 40
% Shale and Coal
% Soft Particles
Clay, Shale and Soft Particles
L.A. Abrasion Grading and %
Loss
Fail
Lab Identification:
Physical Analysis of Aggregate
Percent Soundness Loss:
--Freeze & Thaw
Colorimetric
Bulk Specific Gravity (SSD)
% Absorption
% Clay Units
Sie
ve A
naly
sis
(To
tal P
erc
en
t
Passin
g)
Figure 4.1.2.2 Physical Analysis of Class E Aggregate - Limestone
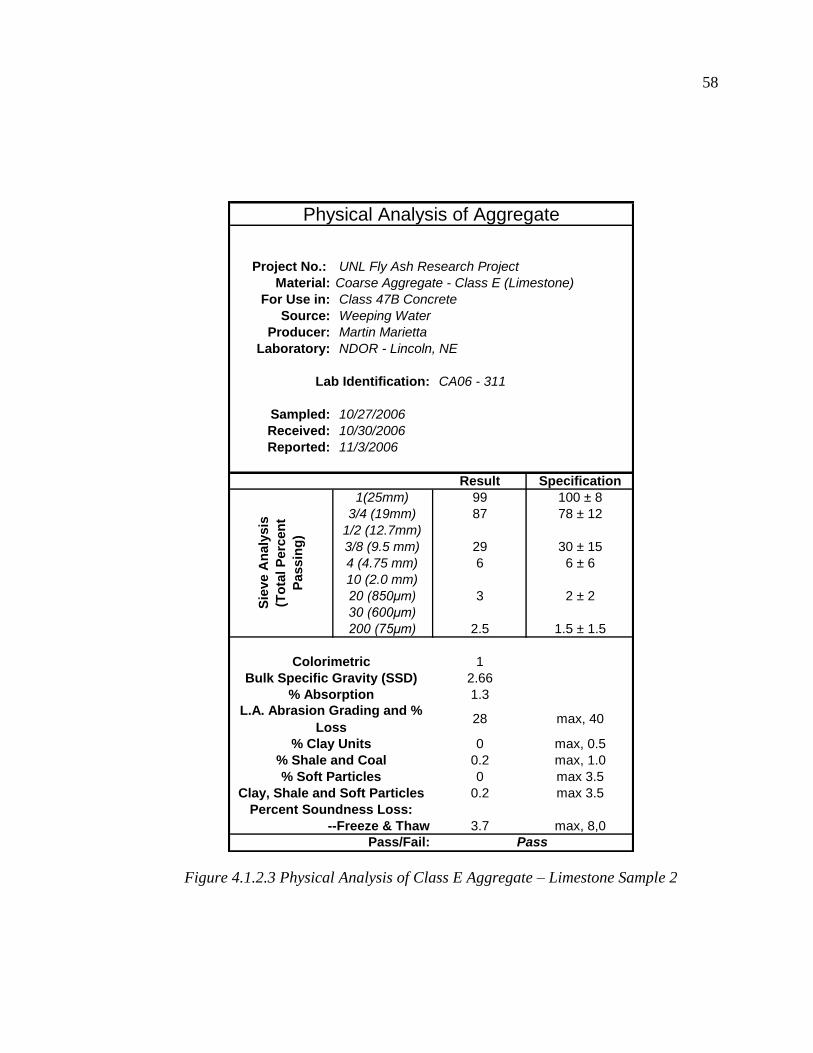
58
Project No.: UNL Fly Ash Research Project
Material: Coarse Aggregate - Class E (Limestone)
For Use in: Class 47B Concrete
Source: Weeping Water
Producer: Martin Marietta
Laboratory: NDOR - Lincoln, NE
CA06 - 311
Sampled: 10/27/2006
Received: 10/30/2006
Reported: 11/3/2006
Result Specification
1(25mm) 99 100 ± 8
3/4 (19mm) 87 78 ± 12
1/2 (12.7mm)
3/8 (9.5 mm) 29 30 ± 15
4 (4.75 mm) 6 6 ± 6
10 (2.0 mm)
20 (850μm) 3 2 ± 2
30 (600μm)
200 (75μm) 2.5 1.5 ± 1.5
1
2.66
1.3
0 max, 0.5
0.2 max, 1.0
0 max 3.5
0.2 max 3.5
3.7 max, 8,0
Pass/Fail:
Physical Analysis of Aggregate
Percent Soundness Loss:
--Freeze & Thaw
Colorimetric
Bulk Specific Gravity (SSD)
% Absorption
% Clay Units
Sie
ve
An
aly
sis
(To
tal P
erc
en
t
Pa
ss
ing
)
Clay, Shale and Soft Particles
L.A. Abrasion Grading and %
Loss
Pass
Lab Identification:
28 max, 40
% Shale and Coal
% Soft Particles
Figure 4.1.2.3 Physical Analysis of Class E Aggregate – Limestone Sample 2

59
4.1.3 CHEMICAL AND PHYSICAL ANALYSES OF CEMENTITIOUS
MATERIAL
All cementitious material was analyzed for chemical composition. This
information will be critical in the interpretation of the results since the chemical
composition of the cementitious material has a significant effect of the performance of
the concrete. In addition, an analyses of the physical characteristics was performed. The
analyses showed that all the cementitious material met NDOR specifications. The
following figures show the results of the chemical and physical analyses.
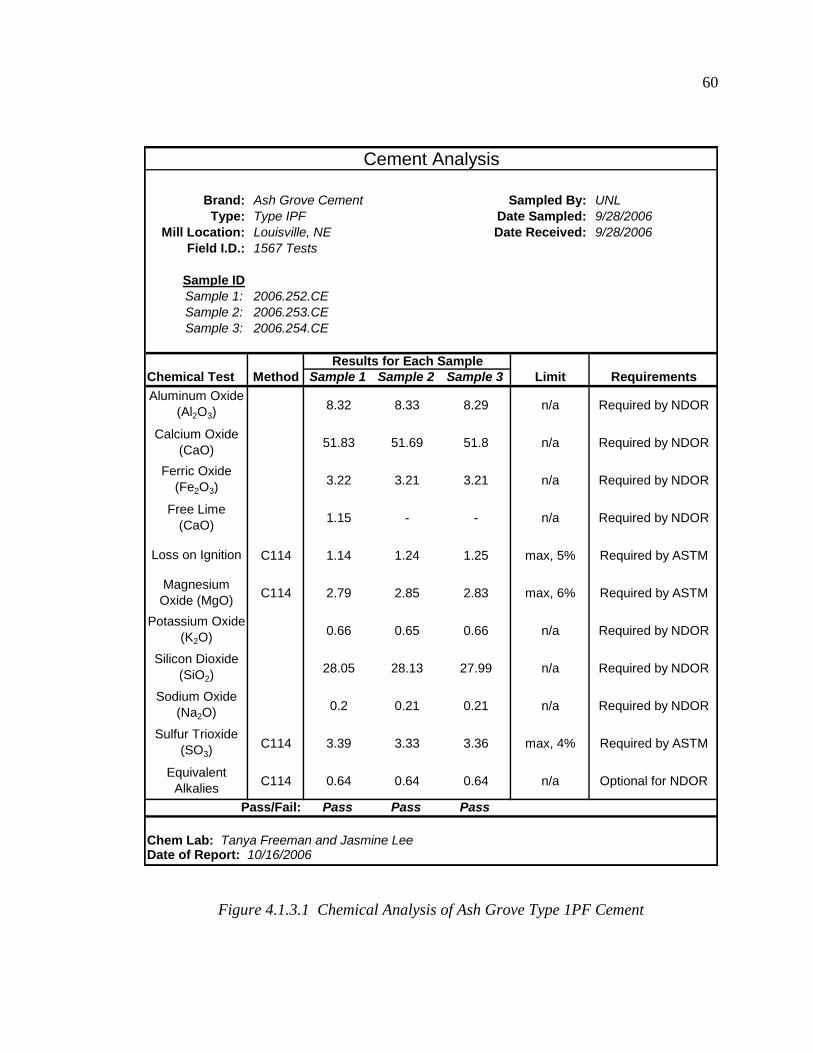
60
Ash Grove Cement UNL
Type IPF 9/28/2006
Louisville, NE 9/28/2006
1567 Tests
2006.252.CE
2006.253.CE
2006.254.CE
Method Sample 1 Sample 2 Sample 3 Limit Requirements
8.32 8.33 8.29 n/a Required by NDOR
51.83 51.69 51.8 n/a Required by NDOR
3.22 3.21 3.21 n/a Required by NDOR
1.15 - - n/a Required by NDOR
C114 1.14 1.24 1.25 max, 5% Required by ASTM
C114 2.79 2.85 2.83 max, 6% Required by ASTM
0.66 0.65 0.66 n/a Required by NDOR
28.05 28.13 27.99 n/a Required by NDOR
0.2 0.21 0.21 n/a Required by NDOR
C114 3.39 3.33 3.36 max, 4% Required by ASTM
C114 0.64 0.64 0.64 n/a Optional for NDOR
Pass Pass Pass
Chem Lab: Tanya Freeman and Jasmine LeeDate of Report: 10/16/2006
Pass/Fail:
Cement Analysis
Equivalent
Alkalies
Sampled By:
Date Sampled:
Date Received:
Brand:
Type:
Mill Location:
Field I.D.:
Sample ID
Sample 1:
Sample 2:
Sample 3:
Chemical Test
Results for Each Sample
Loss on Ignition
Magnesium
Oxide (MgO)
Aluminum Oxide
(Al2O3)
Calcium Oxide
(CaO)
Ferric Oxide
(Fe2O3)
Free Lime
(CaO)
Sodium Oxide
(Na2O)
Sulfur Trioxide
(SO3)
Potassium Oxide
(K2O)
Silicon Dioxide
(SiO2)
Figure 4.1.3.1 Chemical Analysis of Ash Grove Type 1PF Cement
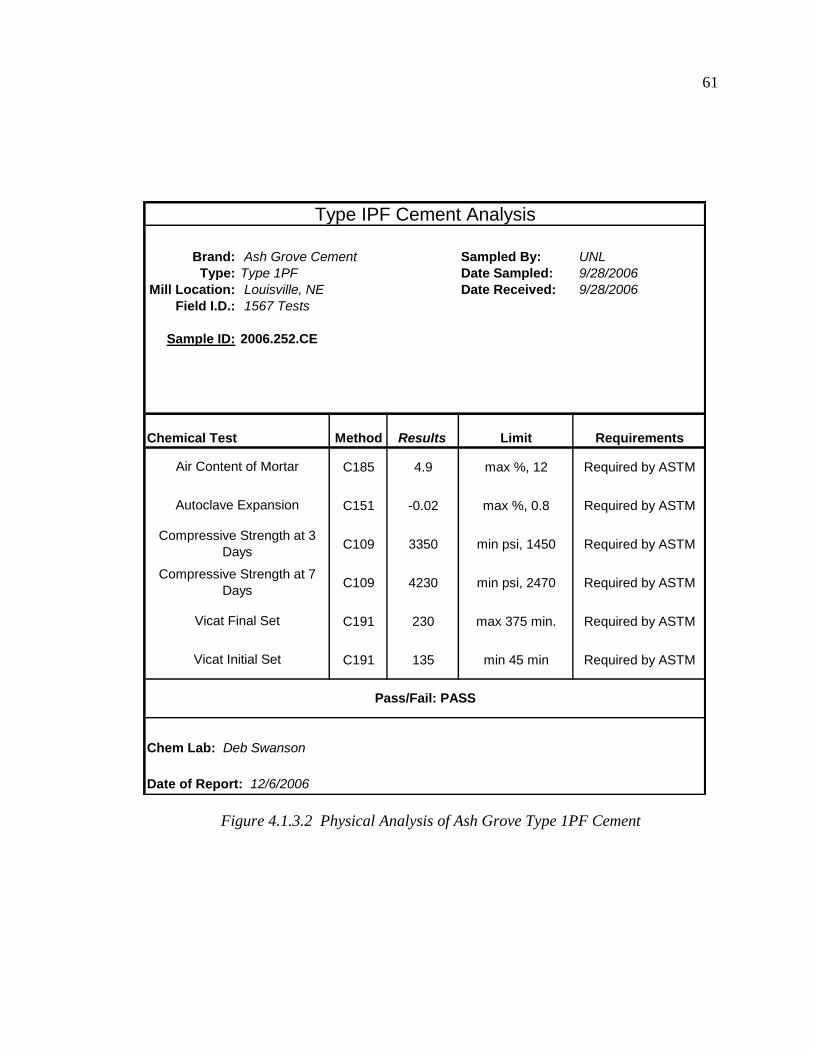
61
Brand: Ash Grove Cement Sampled By: UNL
Type: Type 1PF Date Sampled: 9/28/2006
Mill Location: Louisville, NE Date Received: 9/28/2006
Field I.D.: 1567 Tests
Sample ID: 2006.252.CE
Method Results Limit Requirements
C185 4.9 max %, 12 Required by ASTM
C151 -0.02 max %, 0.8 Required by ASTM
C109 3350 min psi, 1450 Required by ASTM
C109 4230 min psi, 2470 Required by ASTM
C191 230 max 375 min. Required by ASTM
C191 135 min 45 min Required by ASTM
Chem Lab: Deb Swanson
Date of Report: 12/6/2006
Vicat Final Set
Vicat Initial Set
Pass/Fail: PASS
Type IPF Cement Analysis
Chemical Test
Air Content of Mortar
Autoclave Expansion
Compressive Strength at 3
Days
Compressive Strength at 7
Days
Figure 4.1.3.2 Physical Analysis of Ash Grove Type 1PF Cement

62
Ash Grove Cement UNL
Type I/II 9/28/2006
Louisville, NE 9/28/2006
1567 Tests
2006.249.CE
2006.250.CE
2006.251.CE
Method Sample 1 Sample 2 Sample 3 Limit Requirements
C114 4.27 4.21 4.21 max, 6% Required by ASTM
61.84 61.93 61.84 n/a Required by NDOR
C114 3.02 3.02 3 max, 6% Required by ASTM
1.17 - - n/a Required by NDOR
C114 0.54 - - max, 0.75% Required by ASTM
C114 2.91 2.95 2.97 max, 3% Required by ASTM
C114 3.12 3.1 3.14 max, 6% Required by ASTM
0.58 0.58 0.59 n/a Required by NDOR
C114 20.37 20.27 20.29 n/a Required by ASTM
0.12 0.12 0.12 n/a Required by NDOR
C114 2.86 2.86 2.86 max, 3% Required by ASTM
C114 6.2 6 6.1 max, 8.5% Required by ASTM
C114 0.51 0.51 0.51 max, 0.6% Optional for ASTM
Pass Pass Pass
Chem Lab: Jasmine LeeDate of Report: 10/16/2006
Pass/Fail:
Cement Analysis
Equivalent
Alkalies
Sampled By:
Date Sampled:
Date Received:
Brand:
Type:
Mill Location:
Field I.D.:
Chemical Test
Results for Each Sample
Sample ID
Sample 1:
Sample 2:
Sample 3:
Silicon Dioxide
(SiO2)
Sodium Oxide
(Na2O)
Sulfur Trioxide
(SO3)
Tricalcium
Aluminate (C3A)
Insoluble
Residue
Loss on Ignition
Magnesium
Oxide (MgO)
Potassium Oxide
(K2O)
Aluminum Oxide
(Al2O3)
Calcium Oxide
(CaO)
Ferric Oxide
(Fe2O3)
Free Lime
(CaO)
Figure 4.1.3.3 Chemical Analysis of Ash Grove Type I/II Cement
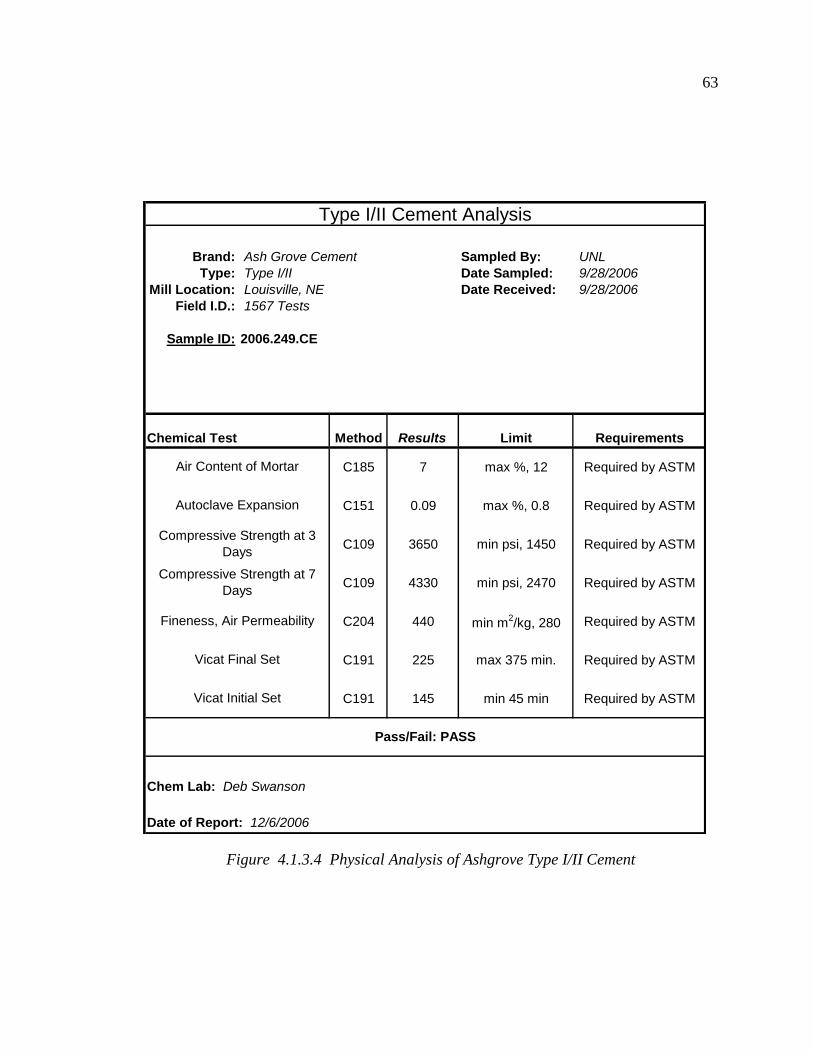
63
Brand: Ash Grove Cement Sampled By: UNL
Type: Type I/II Date Sampled: 9/28/2006
Mill Location: Louisville, NE Date Received: 9/28/2006
Field I.D.: 1567 Tests
Sample ID: 2006.249.CE
Method Results Limit Requirements
C185 7 max %, 12 Required by ASTM
C151 0.09 max %, 0.8 Required by ASTM
C109 3650 min psi, 1450 Required by ASTM
C109 4330 min psi, 2470 Required by ASTM
C204 440 min m2/kg, 280 Required by ASTM
C191 225 max 375 min. Required by ASTM
C191 145 min 45 min Required by ASTM
Chem Lab: Deb Swanson
Date of Report: 12/6/2006
Air Content of Mortar
Autoclave Expansion
Compressive Strength at 3
Days
Compressive Strength at 7
Days
Fineness, Air Permeability
Vicat Final Set
Vicat Initial Set
Pass/Fail: PASS
Type I/II Cement Analysis
Chemical Test
Figure 4.1.3.4 Physical Analysis of Ashgrove Type I/II Cement
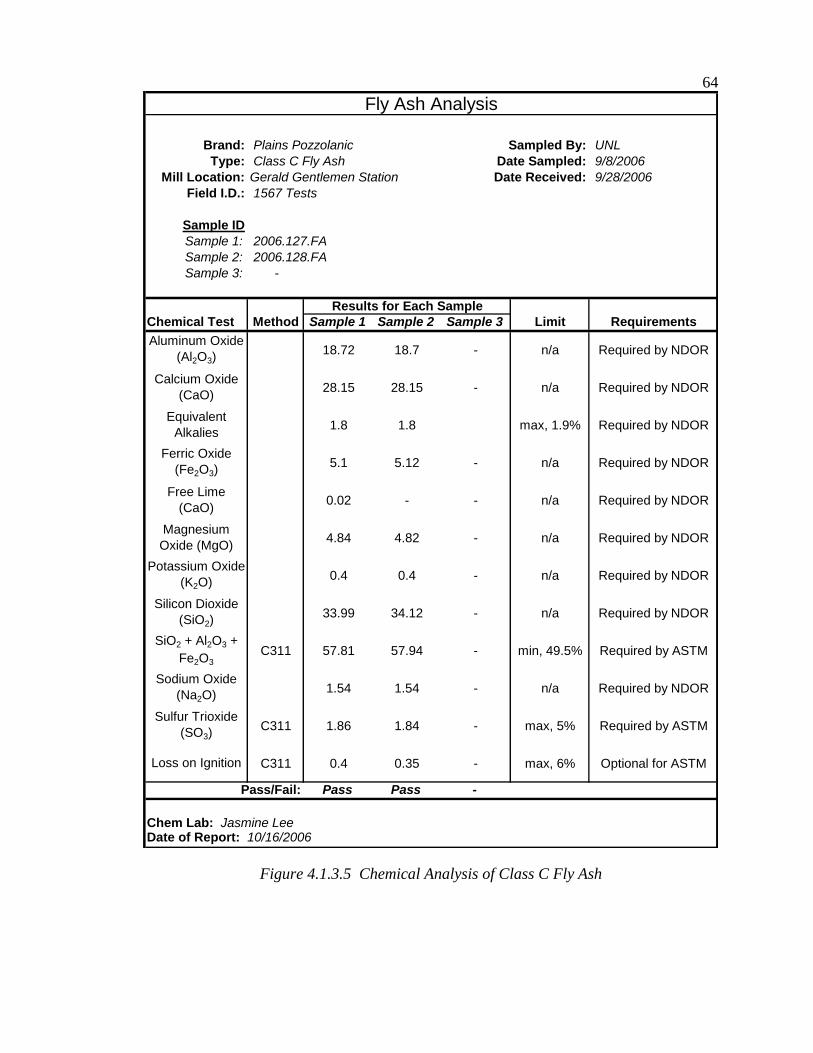
64
Plains Pozzolanic UNL
Class C Fly Ash 9/8/2006
Gerald Gentlemen Station 9/28/2006
1567 Tests
2006.127.FA
2006.128.FA
-
Method Sample 1 Sample 2 Sample 3 Limit Requirements
18.72 18.7 - n/a Required by NDOR
28.15 28.15 - n/a Required by NDOR
1.8 1.8 max, 1.9% Required by NDOR
5.1 5.12 - n/a Required by NDOR
0.02 - - n/a Required by NDOR
4.84 4.82 - n/a Required by NDOR
0.4 0.4 - n/a Required by NDOR
33.99 34.12 - n/a Required by NDOR
C311 57.81 57.94 - min, 49.5% Required by ASTM
1.54 1.54 - n/a Required by NDOR
C311 1.86 1.84 - max, 5% Required by ASTM
C311 0.4 0.35 - max, 6% Optional for ASTM
Pass Pass -
Chem Lab: Jasmine LeeDate of Report: 10/16/2006
Pass/Fail:
Fly Ash Analysis
Loss on Ignition
Sampled By:
Date Sampled:
Date Received:
Brand:
Type:
Mill Location:
Field I.D.:
Sample ID
Sample 1:
Sample 2:
Sample 3:
Sulfur Trioxide
(SO3)
Chemical Test
Results for Each Sample
Equivalent
Alkalies
Magnesium
Oxide (MgO)
Potassium Oxide
(K2O)
Silicon Dioxide
(SiO2)
SiO2 + Al2O3 +
Fe2O3
Aluminum Oxide
(Al2O3)
Calcium Oxide
(CaO)
Ferric Oxide
(Fe2O3)
Free Lime
(CaO)
Sodium Oxide
(Na2O)
Figure 4.1.3.5 Chemical Analysis of Class C Fly Ash
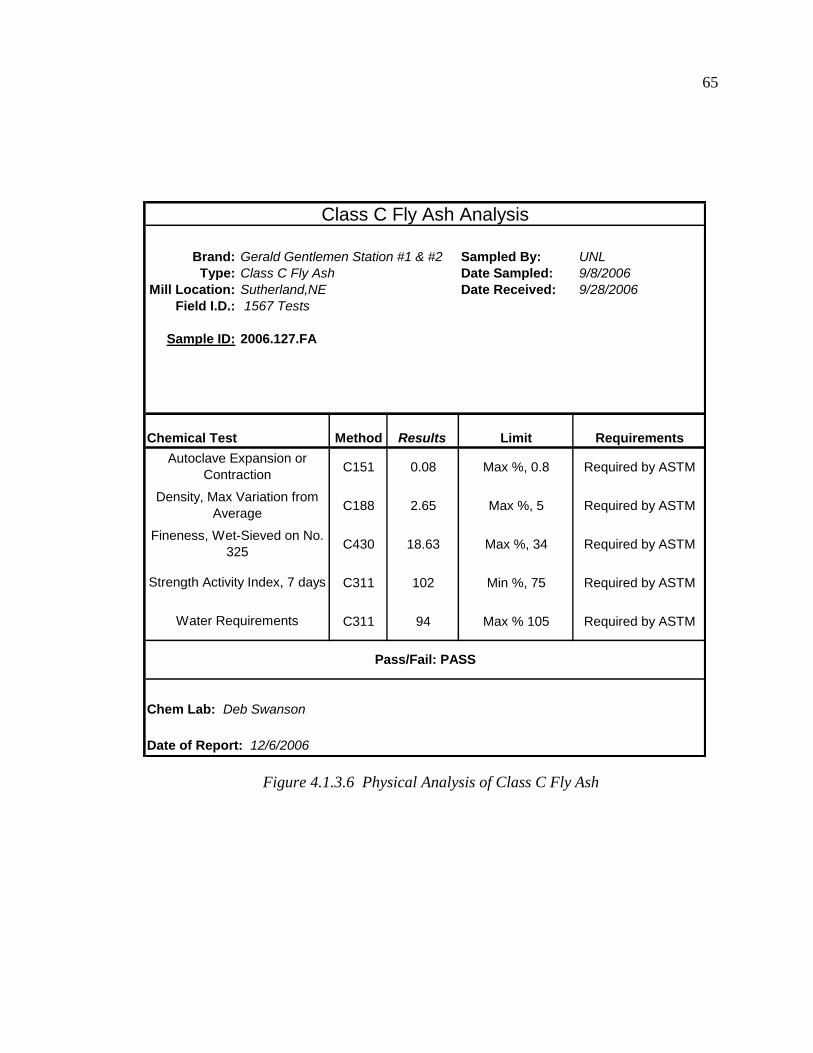
65
Brand: Gerald Gentlemen Station #1 & #2 Sampled By: UNL
Type: Class C Fly Ash Date Sampled: 9/8/2006
Mill Location: Sutherland,NE Date Received: 9/28/2006
Field I.D.: 1567 Tests
Sample ID: 2006.127.FA
Method Results Limit Requirements
C151 0.08 Max %, 0.8 Required by ASTM
C188 2.65 Max %, 5 Required by ASTM
C430 18.63 Max %, 34 Required by ASTM
C311 102 Min %, 75 Required by ASTM
C311 94 Max % 105 Required by ASTM
Chem Lab: Deb Swanson
Date of Report: 12/6/2006
Water Requirements
Pass/Fail: PASS
Chemical Test
Autoclave Expansion or
Contraction
Density, Max Variation from
Average
Fineness, Wet-Sieved on No.
325
Strength Activity Index, 7 days
Class C Fly Ash Analysis
Figure 4.1.3.6 Physical Analysis of Class C Fly Ash

66
Lafarge North America UNL
GGBFS (Slag) 9/12/2006
South Chicago Plant 9/28/2006
1567 Tests
2006.129.FA
2006.130.FA
2006.131.FA
Method Sample 1 Sample 2 Sample 3 Limit Requirements
C989 1.3 1.3 1.3 max, 2.5% Required by ASTM
C989 3.3 3.3 3.3 n/a Required by ASTM
11.25 11.31 11.31 n/a Optional for NDOR
43.31 43.27 43.3 n/a Optional for NDOR
0.36 0.35 0.34 n/a Optional for NDOR
10.6 10.74 10.73 n/a Optional for NDOR
0.43 0.43 0.42 n/a Optional for NDOR
0.02 0.02 0.02 n/a Optional for NDOR
0.36 0.36 0.36 n/a Optional for NDOR
31.63 31.69 31.83 n/a Optional for NDOR
0.19 0.19 0.19 n/a Optional for NDOR
0.04 0.04 0.04 n/a Optional for NDOR
0.55 0.56 0.56 n/a Optional for NDOR
Pass Pass Pass
Chem Lab: Jasmine LeeDate of Report: 10/16/2006
Calcium Oxide
(CaO)
Ferric Oxide
(Fe2O3)
Sodium Oxide
(Na2O)
Silicon Dioxide
(SiO2)
Strontium Oxide
(SrO)
Chemical Test
Results for Each Sample
Aluminum Oxide
(Al2O3)
Magnesium
Oxide (MgO)
Manganic Oxide
(Mn2O3)
Phosphorus
Pentoxide (P2O5)
Potassium Oxide
(K2O)
Sulfide Sulfur (S)
Total Sulfate ion
as SO3
Sample ID
Sample 1:
Sample 2:
Sample 3:
Pass/Fail:
Ground Granulated Blast Furnace Slag Analysis
Titanium Dioxide
(TiO2)
Sampled By:
Date Sampled:
Date Received:
Brand:
Type:
Mill Location:
Field I.D.:
Figure 4.1.3.7 Chemical Analysis of Ground Granulated Blast Furnace Slag
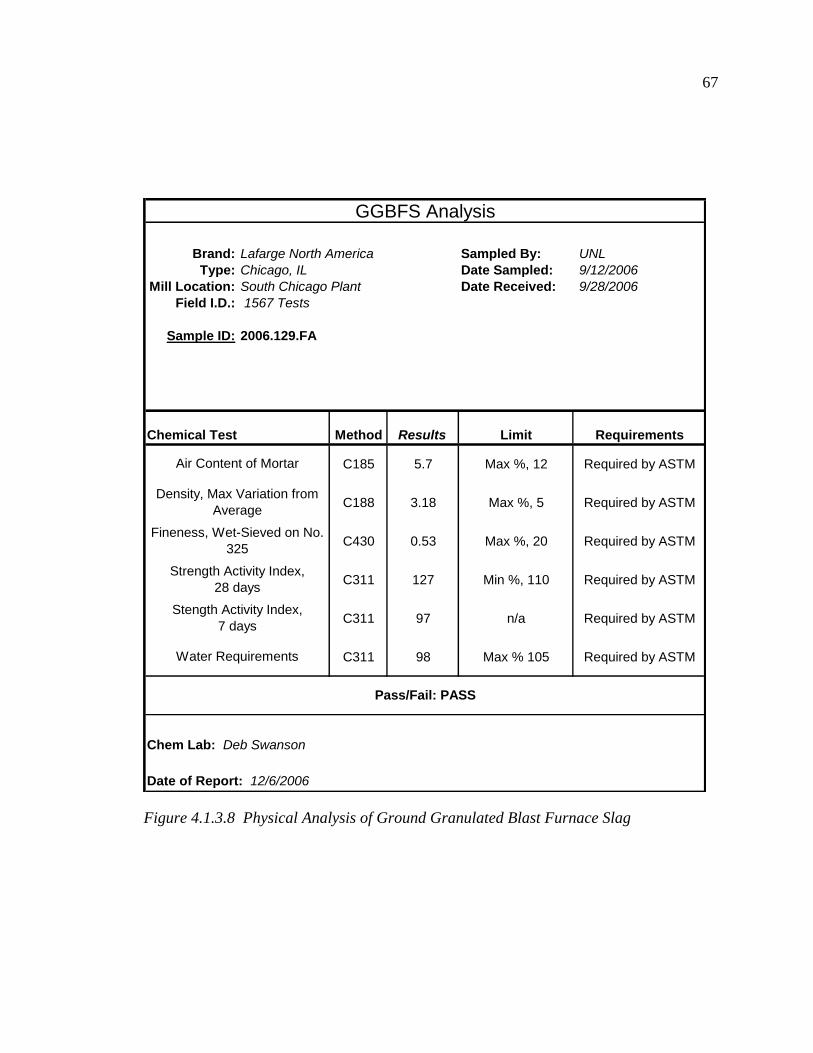
67
Brand: Lafarge North America Sampled By: UNL
Type: Chicago, IL Date Sampled: 9/12/2006
Mill Location: South Chicago Plant Date Received: 9/28/2006
Field I.D.: 1567 Tests
Sample ID: 2006.129.FA
Method Results Limit Requirements
C185 5.7 Max %, 12 Required by ASTM
C188 3.18 Max %, 5 Required by ASTM
C430 0.53 Max %, 20 Required by ASTM
C311 127 Min %, 110 Required by ASTM
C311 97 n/a Required by ASTM
C311 98 Max % 105 Required by ASTM
Chem Lab: Deb Swanson
Date of Report: 12/6/2006
Water Requirements
GGBFS Analysis
Pass/Fail: PASS
Chemical Test
Air Content of Mortar
Density, Max Variation from
Average
Fineness, Wet-Sieved on No.
325
Strength Activity Index,
28 days
Stength Activity Index,
7 days
Figure 4.1.3.8 Physical Analysis of Ground Granulated Blast Furnace Slag

68
5.0 ASR TESTING USING ASTM C 1567
5.1 TESTING PROCEDURE
The testing was conducting in strict accordance with ASTM C 1567 Standard
Test method for Determining the Potential Alkali-Silica Reactivity of combinations of
Cementitious materials and Aggregate (Accelerated Mortar-Bar Method). As previously
discussed, the test was carried out to 28 days per Nebraska Department of Roads
specifications requiring a maximum expansion of 0.1% at 28 days. The following figures
demonstrate the mixing, casting, curing and subsequent storage and readings throughout
the ASTM C 1567 testing.
Figure 5.2.1 Weighed Materials and Work Area
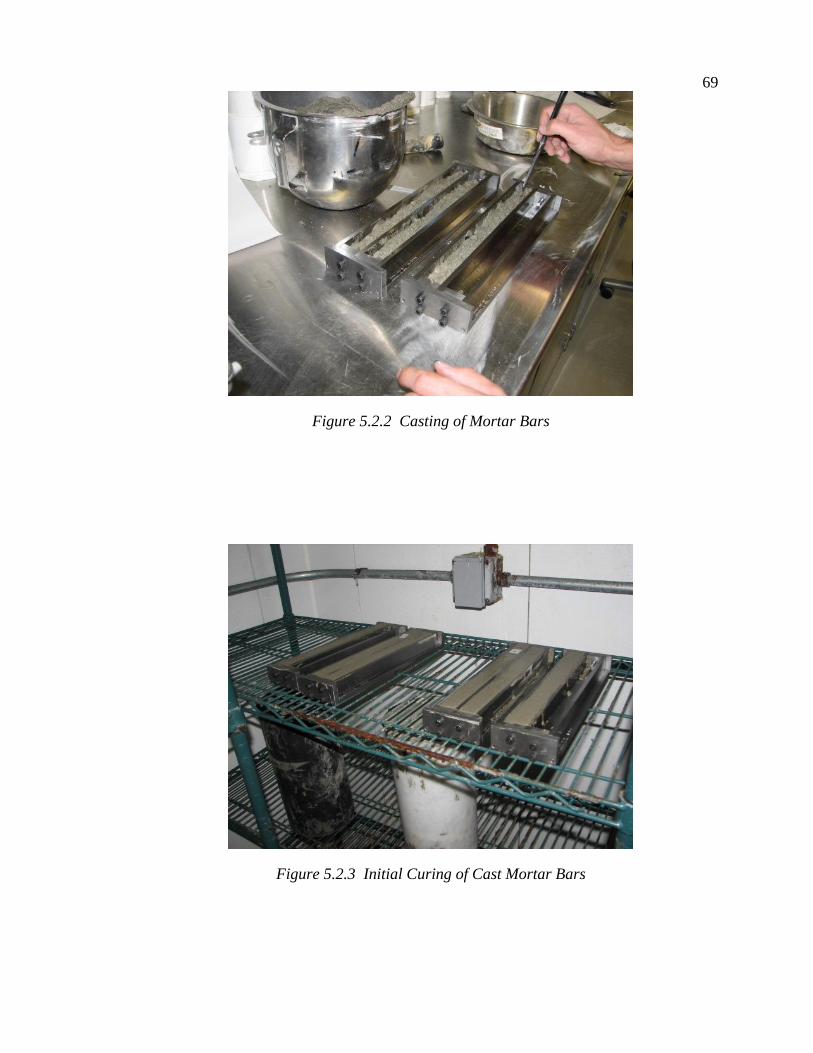
69
Figure 5.2.2 Casting of Mortar Bars
Figure 5.2.3 Initial Curing of Cast Mortar Bars
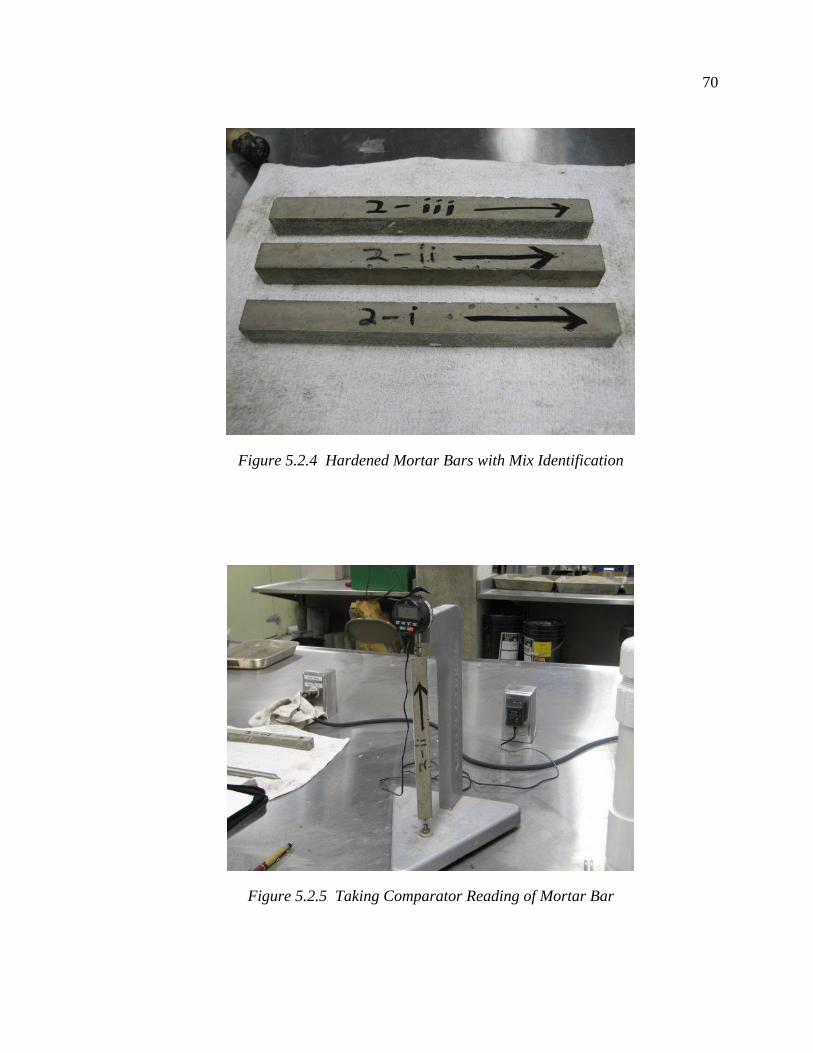
70
Figure 5.2.4 Hardened Mortar Bars with Mix Identification
Figure 5.2.5 Taking Comparator Reading of Mortar Bar
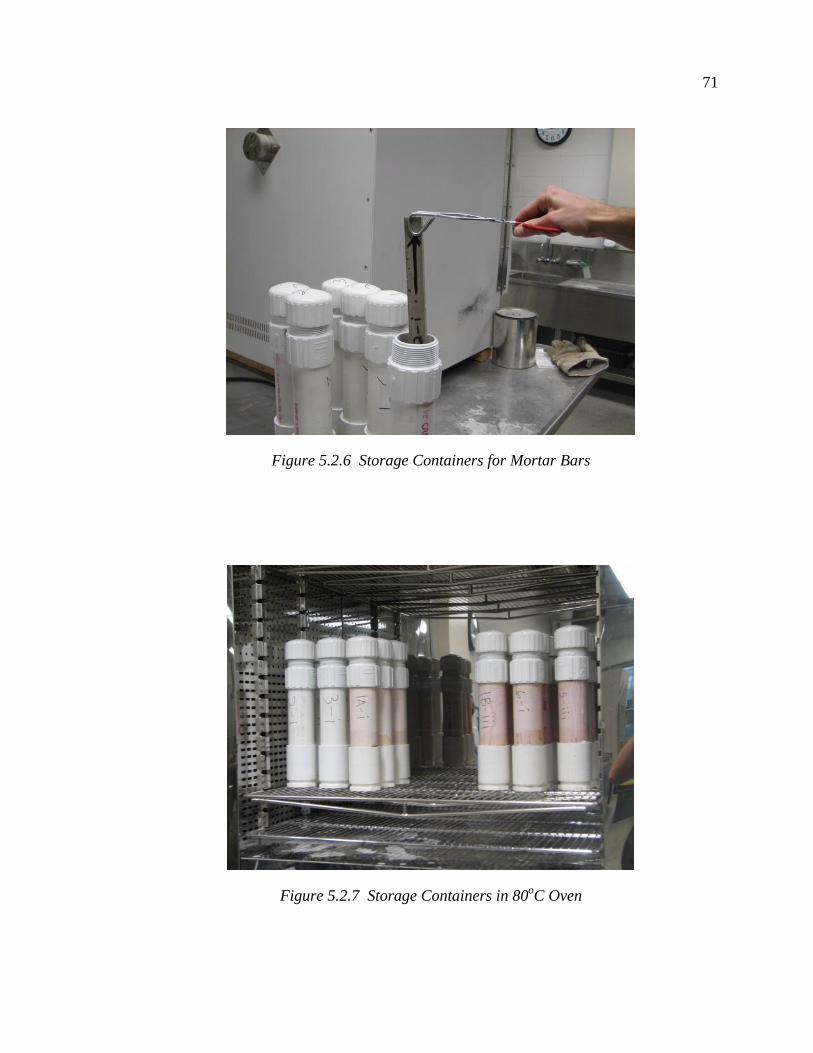
71
Figure 5.2.6 Storage Containers for Mortar Bars
Figure 5.2.7 Storage Containers in 80oC Oven
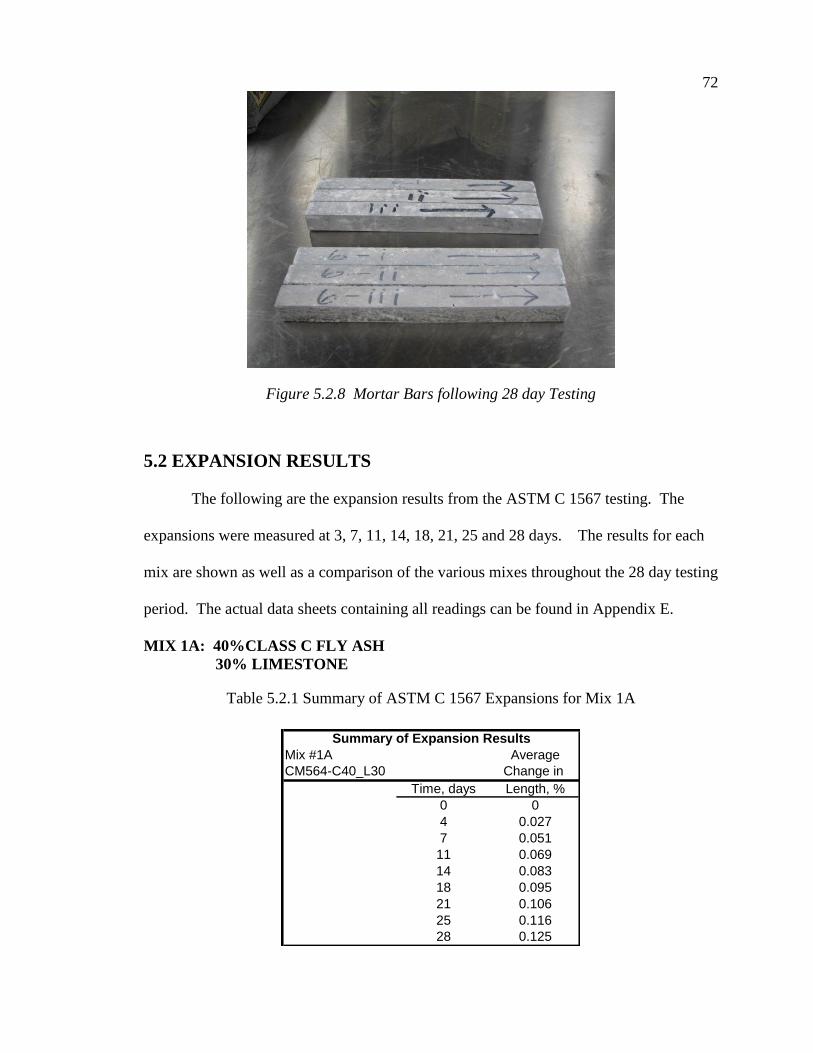
72
Figure 5.2.8 Mortar Bars following 28 day Testing
5.2 EXPANSION RESULTS
The following are the expansion results from the ASTM C 1567 testing. The
expansions were measured at 3, 7, 11, 14, 18, 21, 25 and 28 days. The results for each
mix are shown as well as a comparison of the various mixes throughout the 28 day testing
period. The actual data sheets containing all readings can be found in Appendix E.
MIX 1A: 40%CLASS C FLY ASH
30% LIMESTONE
Table 5.2.1 Summary of ASTM C 1567 Expansions for Mix 1A
Mix #1A Average
CM564-C40_L30 Change in
Time, days Length, %
0 0
4 0.027
7 0.051
11 0.069
14 0.083
18 0.095
21 0.106
25 0.116
28 0.125
Summary of Expansion Results

73
ASTM C 1567 Expansion Results
0
0.02
0.04
0.06
0.08
0.1
0.12
0.14
0 5 10 15 20 25 30
Time (days)
Av
era
ge
Ex
pa
ns
ion
(%
)
Mix 1A
NDOR Limit
Figure 5.2.1 ASTM C 1567 Expansion Results for Mix 1A
MIX 1B: 40% CLASS C FLY ASH
45% LIMESTONE
Table 5.2.2 Summary of ASTM C 1567 Expansions for Mix 1B
Mix #1B Average
CM564-C40_L45 Change in
Time, days Length, %
0 0
4 0.026
7 0.036
11 0.051
14 0.062
18 0.074
21 0.083
25 0.092
28 0.101
Summary of Expansion Results

74
ASTM C 1567 Expansion Results
0
0.02
0.04
0.06
0.08
0.1
0.12
0 5 10 15 20 25 30
Time (days)
Av
era
ge
Ex
pa
ns
ion
(%
)
Mix 1B
NDOR Limit
Figure 5.2.2 ASTM C 1567 Expansion Results for Mix 1B
MIX 2: 20% CLASS C FLY ASH
20% CLASS F FLY ASH
30% LIMESTONE
Table 5.2.3 Summary of ASTM C 1567 Expansions for Mix 2
Mix #2 Average
CM564-C20F20_L30 Change in
Time, days Length, %
0 0
4 0.008
7 0.013
11 0.021
14 0.026
18 0.028
21 0.035
25 0.040
28 0.051
Summary of Expansion Results
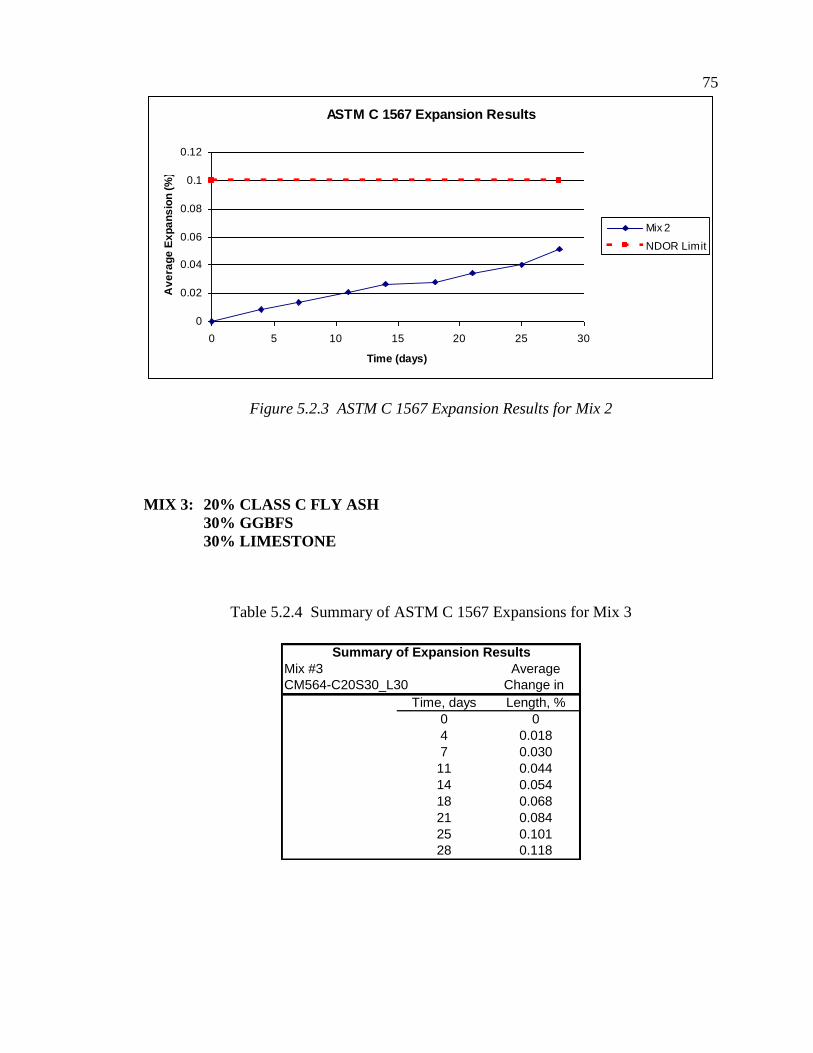
75
ASTM C 1567 Expansion Results
0
0.02
0.04
0.06
0.08
0.1
0.12
0 5 10 15 20 25 30
Time (days)
Av
era
ge
Ex
pa
ns
ion
(%
)
Mix 2
NDOR Limit
Figure 5.2.3 ASTM C 1567 Expansion Results for Mix 2
MIX 3: 20% CLASS C FLY ASH
30% GGBFS
30% LIMESTONE
Table 5.2.4 Summary of ASTM C 1567 Expansions for Mix 3
Mix #3 Average
CM564-C20S30_L30 Change in
Time, days Length, %
0 0
4 0.018
7 0.030
11 0.044
14 0.054
18 0.068
21 0.084
25 0.101
28 0.118
Summary of Expansion Results
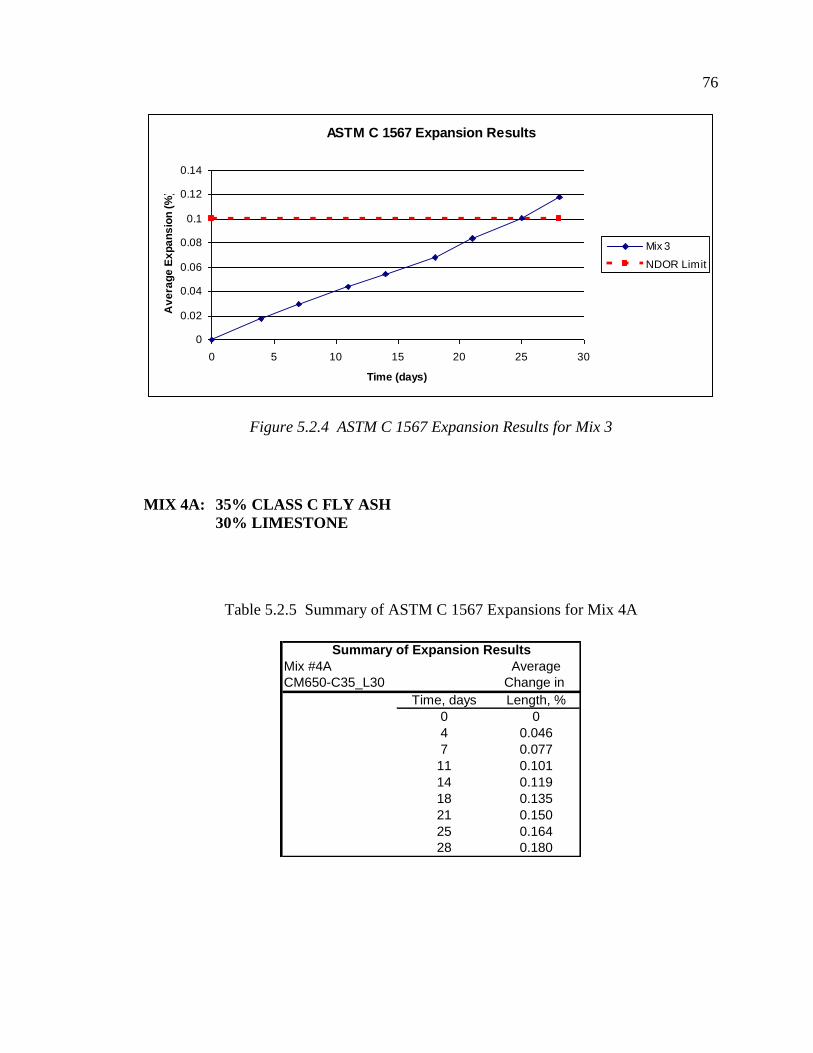
76
ASTM C 1567 Expansion Results
0
0.02
0.04
0.06
0.08
0.1
0.12
0.14
0 5 10 15 20 25 30
Time (days)
Av
era
ge
Ex
pa
ns
ion
(%
)
Mix 3
NDOR Limit
Figure 5.2.4 ASTM C 1567 Expansion Results for Mix 3
MIX 4A: 35% CLASS C FLY ASH
30% LIMESTONE
Table 5.2.5 Summary of ASTM C 1567 Expansions for Mix 4A
Mix #4A Average
CM650-C35_L30 Change in
Time, days Length, %
0 0
4 0.046
7 0.077
11 0.101
14 0.119
18 0.135
21 0.150
25 0.164
28 0.180
Summary of Expansion Results
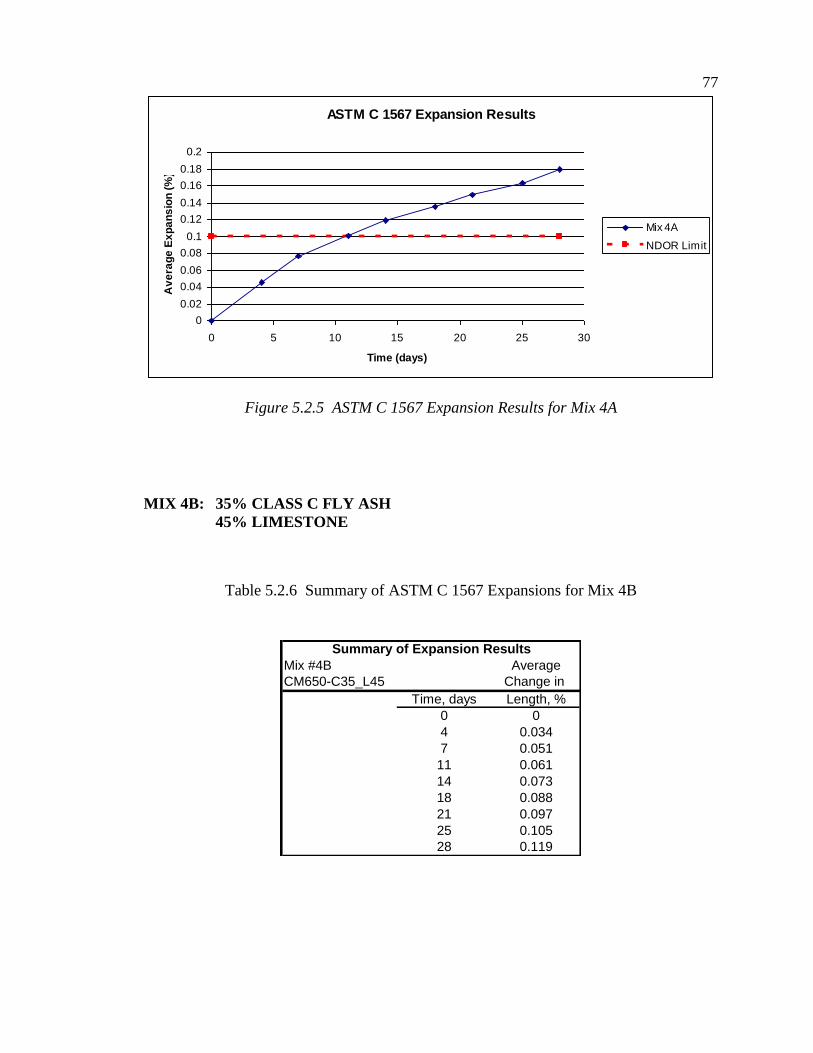
77
ASTM C 1567 Expansion Results
0
0.02
0.04
0.06
0.08
0.1
0.12
0.14
0.16
0.18
0.2
0 5 10 15 20 25 30
Time (days)
Av
era
ge
Ex
pa
ns
ion
(%
)
Mix 4A
NDOR Limit
Figure 5.2.5 ASTM C 1567 Expansion Results for Mix 4A
MIX 4B: 35% CLASS C FLY ASH
45% LIMESTONE
Table 5.2.6 Summary of ASTM C 1567 Expansions for Mix 4B
Mix #4B Average
CM650-C35_L45 Change in
Time, days Length, %
0 0
4 0.034
7 0.051
11 0.061
14 0.073
18 0.088
21 0.097
25 0.105
28 0.119
Summary of Expansion Results
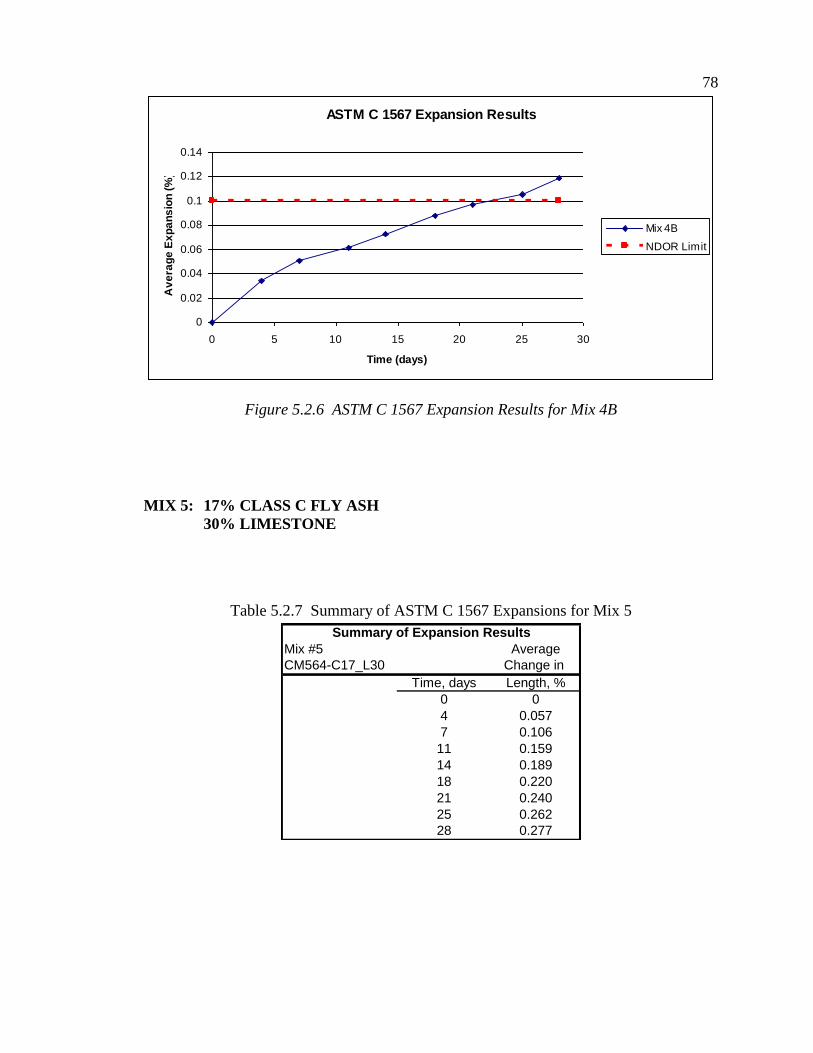
78
ASTM C 1567 Expansion Results
0
0.02
0.04
0.06
0.08
0.1
0.12
0.14
0 5 10 15 20 25 30
Time (days)
Av
era
ge
Ex
pa
ns
ion
(%
)
Mix 4B
NDOR Limit
Figure 5.2.6 ASTM C 1567 Expansion Results for Mix 4B
MIX 5: 17% CLASS C FLY ASH
30% LIMESTONE
Table 5.2.7 Summary of ASTM C 1567 Expansions for Mix 5
Mix #5 Average
CM564-C17_L30 Change in
Time, days Length, %
0 0
4 0.057
7 0.106
11 0.159
14 0.189
18 0.220
21 0.240
25 0.262
28 0.277
Summary of Expansion Results
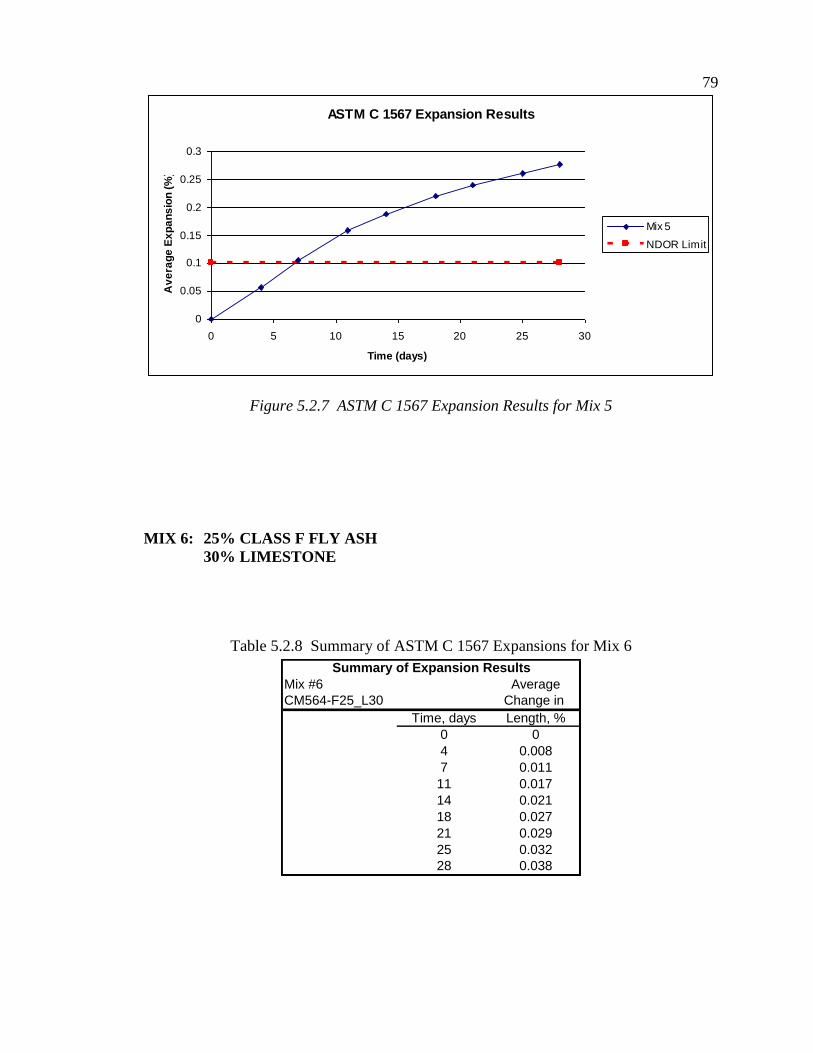
79
ASTM C 1567 Expansion Results
0
0.05
0.1
0.15
0.2
0.25
0.3
0 5 10 15 20 25 30
Time (days)
Av
era
ge
Ex
pa
ns
ion
(%
)
Mix 5
NDOR Limit
Figure 5.2.7 ASTM C 1567 Expansion Results for Mix 5
MIX 6: 25% CLASS F FLY ASH
30% LIMESTONE
Table 5.2.8 Summary of ASTM C 1567 Expansions for Mix 6
Mix #6 Average
CM564-F25_L30 Change in
Time, days Length, %
0 0
4 0.008
7 0.011
11 0.017
14 0.021
18 0.027
21 0.029
25 0.032
28 0.038
Summary of Expansion Results
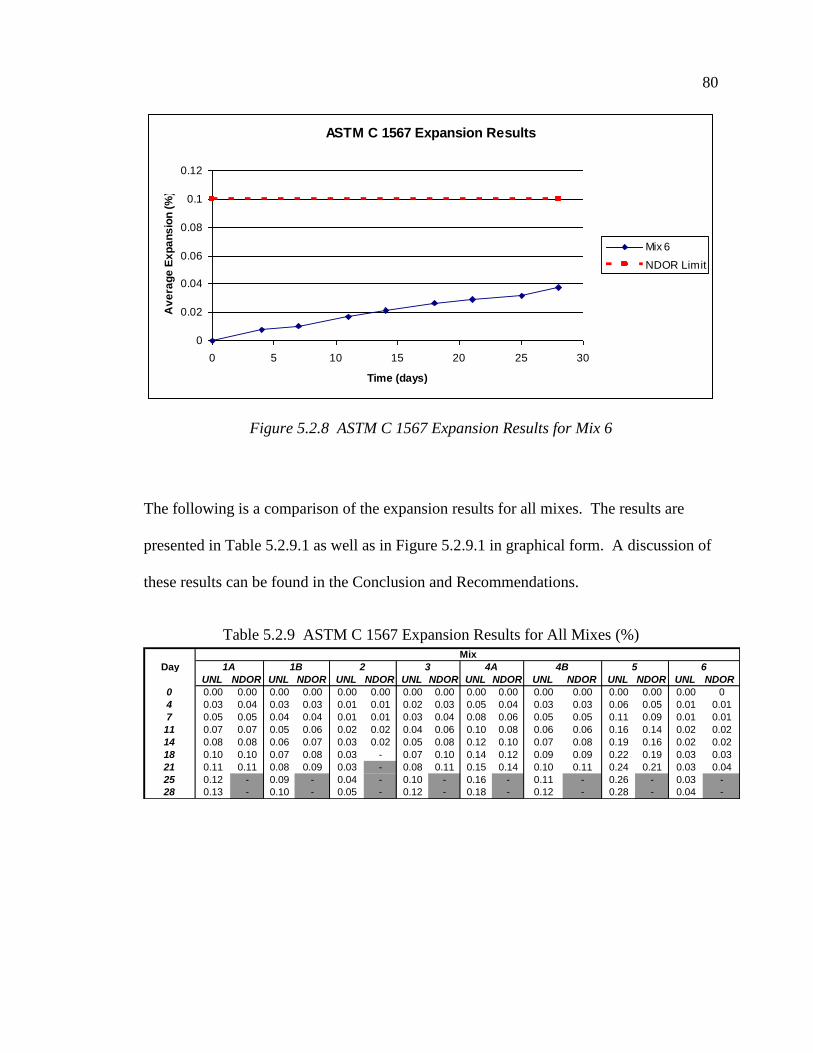
80
ASTM C 1567 Expansion Results
0
0.02
0.04
0.06
0.08
0.1
0.12
0 5 10 15 20 25 30
Time (days)
Av
era
ge
Ex
pa
ns
ion
(%
)
Mix 6
NDOR Limit
Figure 5.2.8 ASTM C 1567 Expansion Results for Mix 6
The following is a comparison of the expansion results for all mixes. The results are
presented in Table 5.2.9.1 as well as in Figure 5.2.9.1 in graphical form. A discussion of
these results can be found in the Conclusion and Recommendations.
Table 5.2.9 ASTM C 1567 Expansion Results for All Mixes (%)
Day
UNL NDOR UNL NDOR UNL NDOR UNL NDOR UNL NDOR UNL NDOR UNL NDOR UNL NDOR
0 0.00 0.00 0.00 0.00 0.00 0.00 0.00 0.00 0.00 0.00 0.00 0.00 0.00 0.00 0.00 0
4 0.03 0.04 0.03 0.03 0.01 0.01 0.02 0.03 0.05 0.04 0.03 0.03 0.06 0.05 0.01 0.01
7 0.05 0.05 0.04 0.04 0.01 0.01 0.03 0.04 0.08 0.06 0.05 0.05 0.11 0.09 0.01 0.01
11 0.07 0.07 0.05 0.06 0.02 0.02 0.04 0.06 0.10 0.08 0.06 0.06 0.16 0.14 0.02 0.02
14 0.08 0.08 0.06 0.07 0.03 0.02 0.05 0.08 0.12 0.10 0.07 0.08 0.19 0.16 0.02 0.02
18 0.10 0.10 0.07 0.08 0.03 - 0.07 0.10 0.14 0.12 0.09 0.09 0.22 0.19 0.03 0.03
21 0.11 0.11 0.08 0.09 0.03 - 0.08 0.11 0.15 0.14 0.10 0.11 0.24 0.21 0.03 0.04
25 0.12 - 0.09 - 0.04 - 0.10 - 0.16 - 0.11 - 0.26 - 0.03 -
28 0.13 - 0.10 - 0.05 - 0.12 - 0.18 - 0.12 - 0.28 - 0.04 -
Mix
61A 1B 2 3 4A 4B 5

81
Comparison of ASTM C 1567 Expansions
0
0.05
0.1
0.15
0.2
0.25
0.3
0 5 10 15 20 25 30
Time (Days)
% C
ha
ng
e in
Le
ng
th
Mix 1A
Mix 1B
Mix 2
Mix 3
Mix 4A
Mix 4B
Mix 5
Mix 6
NDOR limit
5
6
1A
1B
4A
4B
2
3
Figure 5.2.9 Comparison of ASTM C 1567 Expansion Results
5.3 ADDITIONAL POTENTIAL MIXES
Based on the results obtained from the ASTM C 1567 testing of 6 proposed
mixes, additional mixes were added to mix matrix. The testing of additional mixes will
provide a larger number of options when selecting the top mixes for additional
performance testing. These mixes are similar to the original proposed mixes but have
adjusted proportions. The additional mixes will be used to identify the optimal mix
proportions to satisfy the ASTM C 1567 testing as well produce the most cost effective
mix possible. The new mixes will once again include both binary and ternary blends but
will focus more on ternary mixes containing both Class C and Class F fly ash. This class
of mixes was shown to produce exceptional performance with regard to ASR resistance
and it was desired to determine the optimum replacement levels for both the Class C and
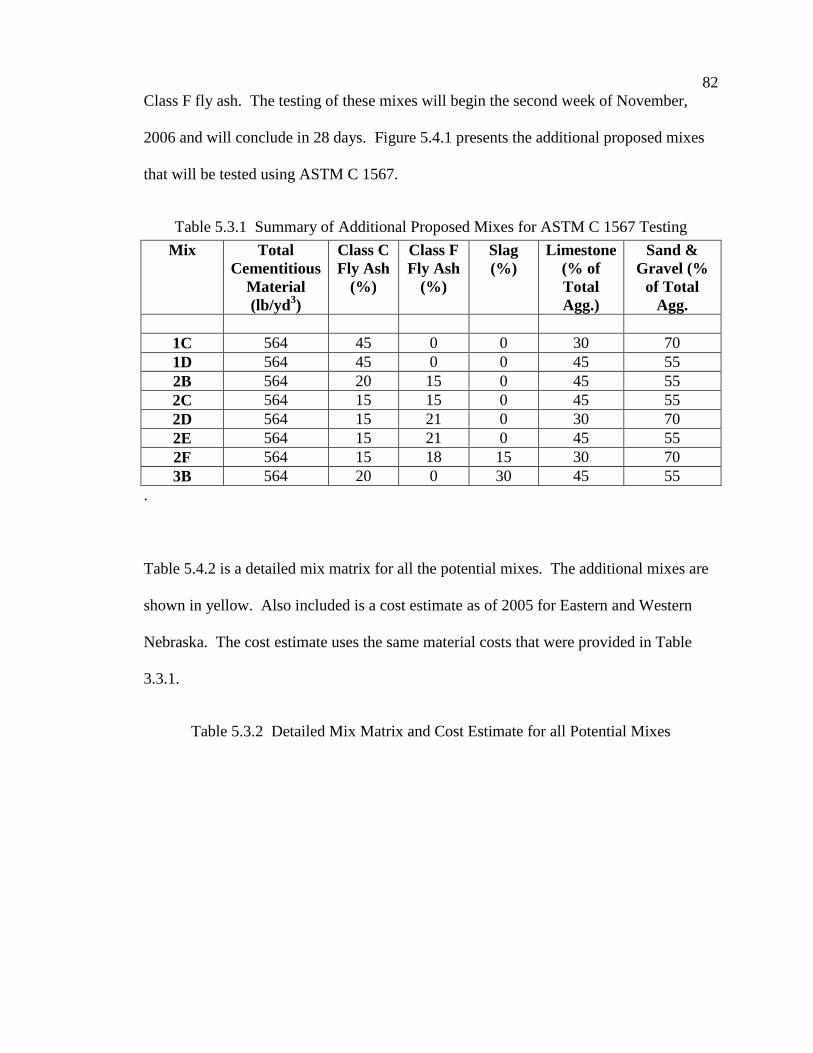
82
Class F fly ash. The testing of these mixes will begin the second week of November,
2006 and will conclude in 28 days. Figure 5.4.1 presents the additional proposed mixes
that will be tested using ASTM C 1567.
Table 5.3.1 Summary of Additional Proposed Mixes for ASTM C 1567 Testing
Mix Total
Cementitious
Material
(lb/yd3)
Class C
Fly Ash
(%)
Class F
Fly Ash
(%)
Slag
(%)
Limestone
(% of
Total
Agg.)
Sand &
Gravel (%
of Total
Agg.
1C 564 45 0 0 30 70
1D 564 45 0 0 45 55
2B 564 20 15 0 45 55
2C 564 15 15 0 45 55
2D 564 15 21 0 30 70
2E 564 15 21 0 45 55
2F 564 15 18 15 30 70
3B 564 20 0 30 45 55
.
Table 5.4.2 is a detailed mix matrix for all the potential mixes. The additional mixes are
shown in yellow. Also included is a cost estimate as of 2005 for Eastern and Western
Nebraska. The cost estimate uses the same material costs that were provided in Table
3.3.1.
Table 5.3.2 Detailed Mix Matrix and Cost Estimate for all Potential Mixes

83
Type I/II C ash 1PF Slag Total LS 47B S & G
lbs/yd3
lbs./yd3
lbs/yd3
lbs/yd3
lbs/yd3
lbs/yd3 lbs/yd3
1A40% C
30% Limestone338 226 0 0 564 882 2074 $26.50 $33.12
1B40% C
45% Limestone338 226 0 0 564 1323 1630 $27.61 $37.53
1C45% C
30% Limestone310 254 0 0 564 881 2072 $25.44 $32.05
1D45% C
45% Limestone310 254 0 0 564 1322 1628 $26.54 $36.45
220% C, 20% F
30% Limestone0 113 451 0 564 880 2068 $30.71 $37.31
2B20% C, 15% F
45% Limestone113 113 338 0 564 1322 1628 $31.82 $41.74
2C15% C, 15% F
45% Limestone141 85 338 0 564 1324 1630 $32.89 $42.82
2D15% C, 21% F
30% Limestone0 85 479 0 564 880 2070 $31.77 $38.37
2E15% C, 21% F
45% Limestone0 85 479 0 564 1320 1626 $32.86 $42.76
2F15%C, 18%F, 15%S
30% Limestone0 85 395 85 564 880 2069 $31.81 $38.41
320% C, 30%S
30% Limestone282 113 0 169 564 883 2077 $30.76 $37.39
3B20% C, 30% S
45% Limestone282 113 0 169 564 1325 1632 $31.85 $41.79
4A35% C
30% Limestone423 228 0 0 650 830 1952 $29.75 $35.98
4B35% C
45% Limestone423 228 0 0 650 1245 1534 $30.78 $40.12
517%C
30% Limestone468 96 0 0 564 887 2086 $31.44 $38.09
625% F
30% Limestone0 0 564 0 564 882 2074 $34.98 $41.59
1Materials Cost Per yd
3
Eastern
Nebraska
Western
NebreskaMix
AggregatesCementitious Material
5.4 EXPANSION RESULTS FOR ADDITIONAL MIXES
MIX 1C: 45% CLASS C FLY ASH
30% LIMESTONE
Table 5.4.1 Summary of ASTM C 1567 Expansions for Mix 1C
Mix #1C Average
CM564-C45_L30 Change in
Time, days Length, %
0 0
4 0.027
7 0.046
11 0.055
14 0.066
18 0.076
21 0.087
25 0.095
28 0.100
Summary of Expansion Results
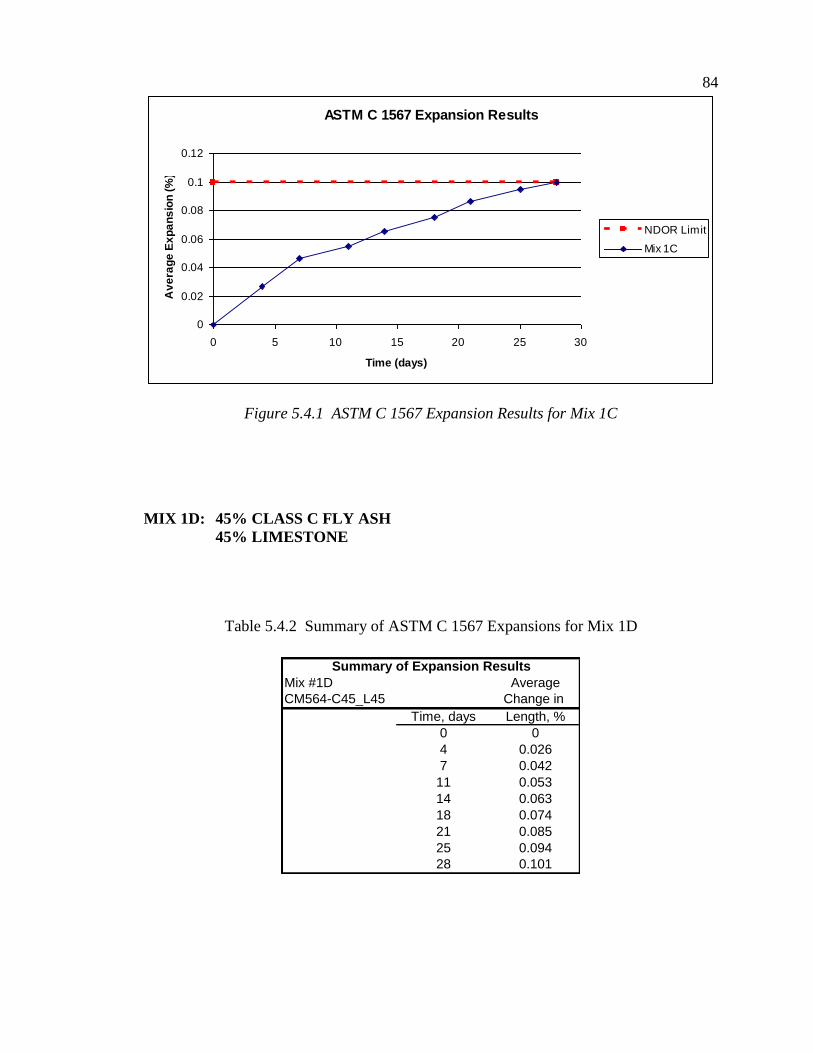
84
ASTM C 1567 Expansion Results
0
0.02
0.04
0.06
0.08
0.1
0.12
0 5 10 15 20 25 30
Time (days)
Av
era
ge
Ex
pa
ns
ion
(%
)
NDOR Limit
Mix 1C
Figure 5.4.1 ASTM C 1567 Expansion Results for Mix 1C
MIX 1D: 45% CLASS C FLY ASH
45% LIMESTONE
Table 5.4.2 Summary of ASTM C 1567 Expansions for Mix 1D
Mix #1D Average
CM564-C45_L45 Change in
Time, days Length, %
0 0
4 0.026
7 0.042
11 0.053
14 0.063
18 0.074
21 0.085
25 0.094
28 0.101
Summary of Expansion Results

85
ASTM C 1567 Expansion Results
0
0.02
0.04
0.06
0.08
0.1
0.12
0 5 10 15 20 25 30
Time (days)
Av
era
ge
Ex
pa
ns
ion
(%
)
NDOR Limit
Mix 1D
Figure 5.4.2 ASTM C 1567 Expansion Results for Mix 1D
MIX 2B: 20% CLASS C FLY ASH
15% CLASS F FLY ASH
45% LIMESTONE
Table 5.4.3 Summary of ASTM C 1567 Expansions for Mix 2B
Mix #2B Average
CM564-C20F15_L45 Change in
Time, days Length, %
0 0
4 0.014
7 0.023
11 0.028
14 0.039
18 0.048
21 0.053
25 0.065
28 0.073
Summary of Expansion Results
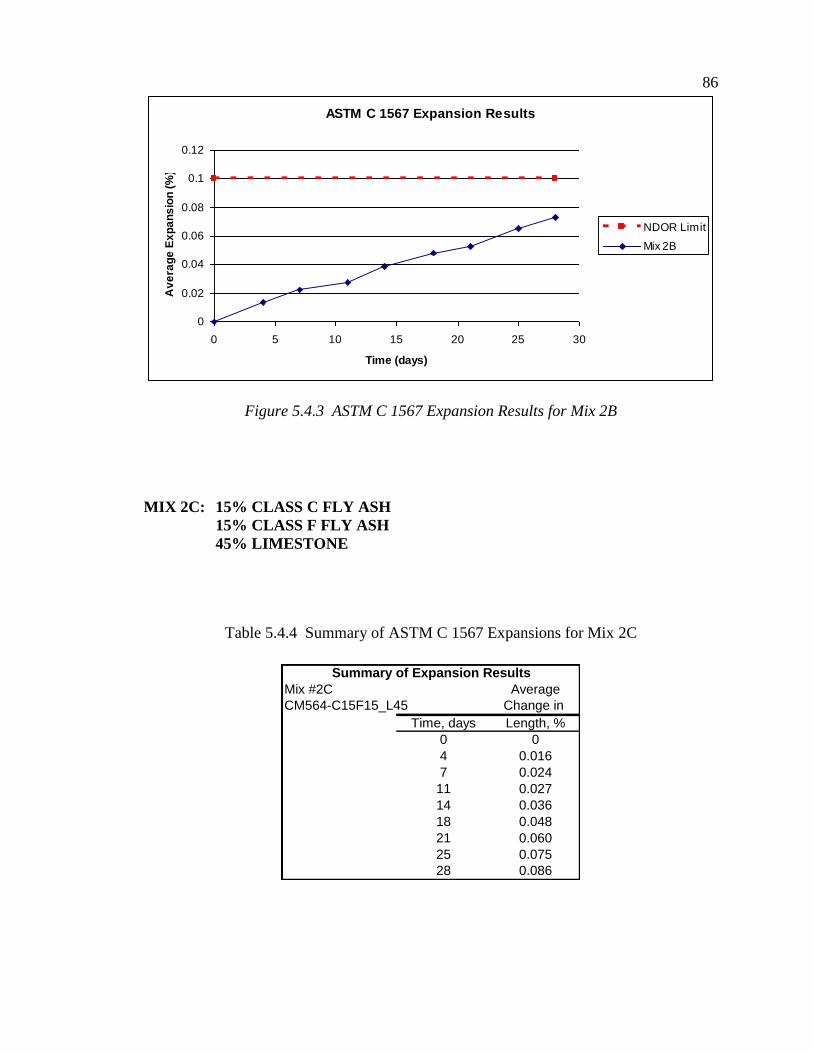
86
ASTM C 1567 Expansion Results
0
0.02
0.04
0.06
0.08
0.1
0.12
0 5 10 15 20 25 30
Time (days)
Av
era
ge
Ex
pa
ns
ion
(%
)
NDOR Limit
Mix 2B
Figure 5.4.3 ASTM C 1567 Expansion Results for Mix 2B
MIX 2C: 15% CLASS C FLY ASH
15% CLASS F FLY ASH
45% LIMESTONE
Table 5.4.4 Summary of ASTM C 1567 Expansions for Mix 2C
Mix #2C Average
CM564-C15F15_L45 Change in
Time, days Length, %
0 0
4 0.016
7 0.024
11 0.027
14 0.036
18 0.048
21 0.060
25 0.075
28 0.086
Summary of Expansion Results

87
ASTM C 1567 Expansion Results
0
0.02
0.04
0.06
0.08
0.1
0.12
0 5 10 15 20 25 30
Time (days)
Av
era
ge
Ex
pa
ns
ion
(%
)
NDOR Limit
Mix 2C
Figure 5.4.4 ASTM C 1567 Expansion Results for Mix 2C
MIX 2D: 15% CLASS C FLY ASH
21% CLASS F FLY ASH
30% LIMESTONE
Table 5.4.5 Summary of ASTM C 1567 Expansions for Mix 2D
Mix #2D Average
CM564-C15F21_L30 Change in
Time, days Length, %
0 0
4 0.011
7 0.015
11 0.023
14 0.028
18 0.028
21 0.041
25 0.044
28 0.045
Summary of Expansion Results
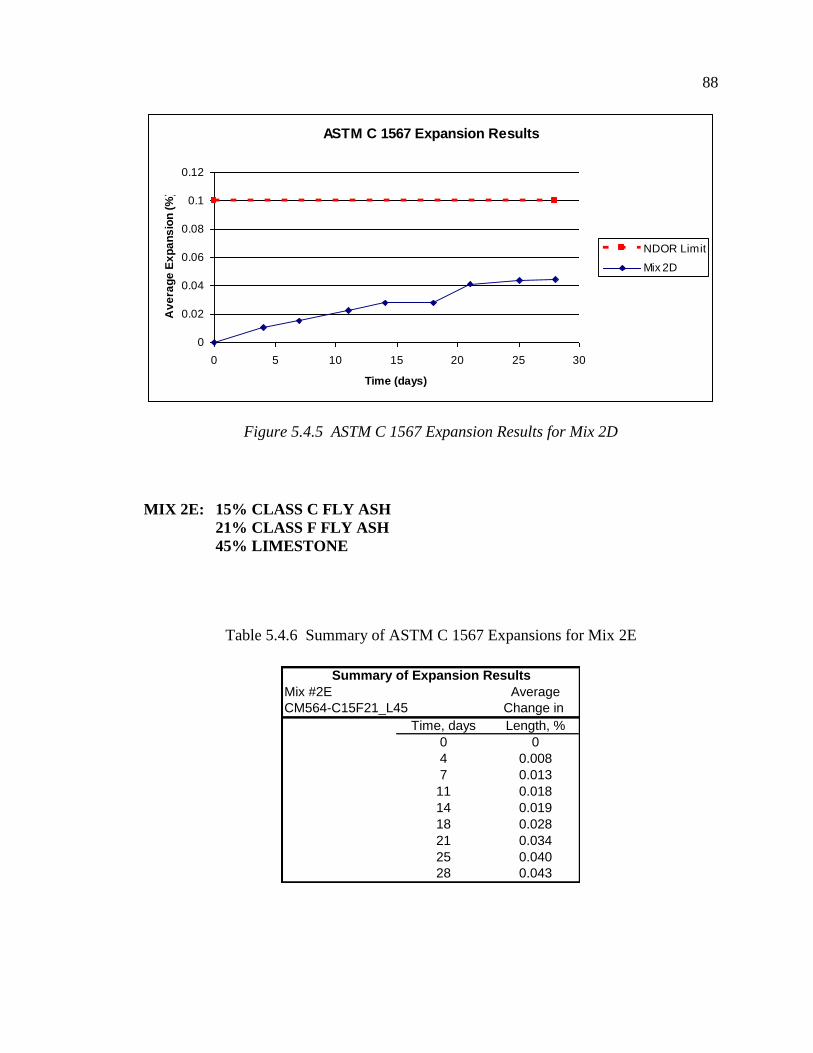
88
ASTM C 1567 Expansion Results
0
0.02
0.04
0.06
0.08
0.1
0.12
0 5 10 15 20 25 30
Time (days)
Av
era
ge
Ex
pa
ns
ion
(%
)
NDOR Limit
Mix 2D
Figure 5.4.5 ASTM C 1567 Expansion Results for Mix 2D
MIX 2E: 15% CLASS C FLY ASH
21% CLASS F FLY ASH
45% LIMESTONE
Table 5.4.6 Summary of ASTM C 1567 Expansions for Mix 2E
Mix #2E Average
CM564-C15F21_L45 Change in
Time, days Length, %
0 0
4 0.008
7 0.013
11 0.018
14 0.019
18 0.028
21 0.034
25 0.040
28 0.043
Summary of Expansion Results
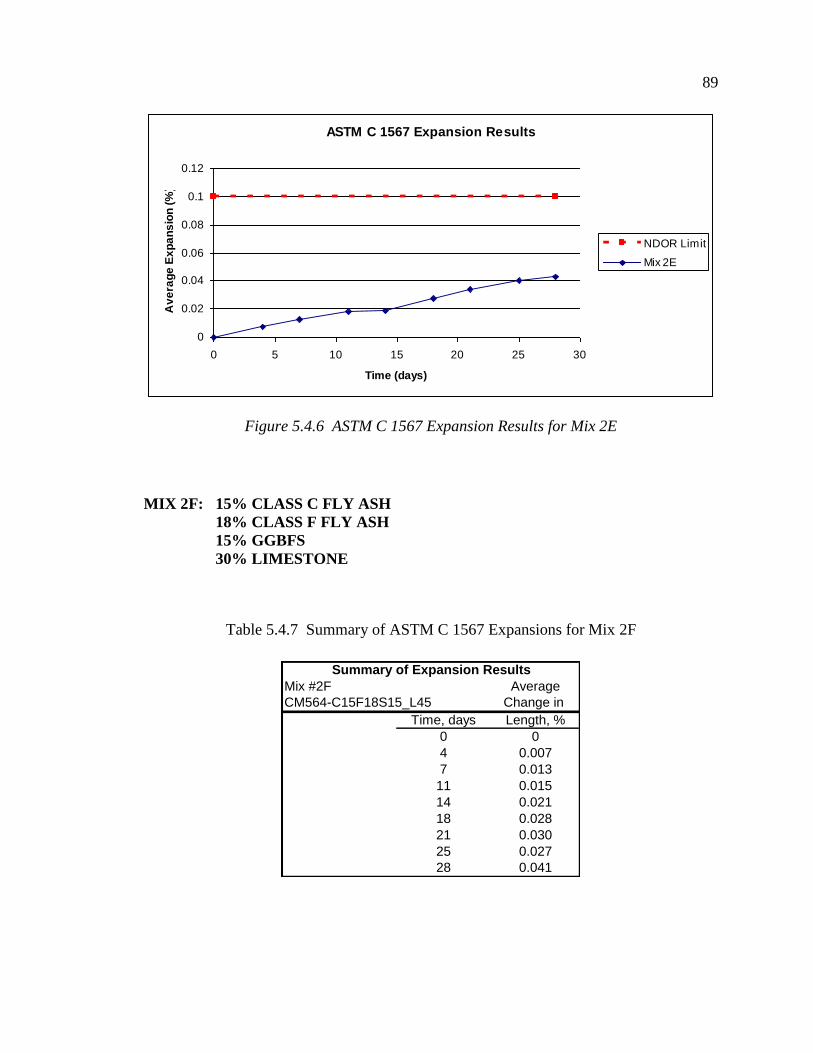
89
ASTM C 1567 Expansion Results
0
0.02
0.04
0.06
0.08
0.1
0.12
0 5 10 15 20 25 30
Time (days)
Av
era
ge
Ex
pa
ns
ion
(%
)
NDOR Limit
Mix 2E
Figure 5.4.6 ASTM C 1567 Expansion Results for Mix 2E
MIX 2F: 15% CLASS C FLY ASH
18% CLASS F FLY ASH
15% GGBFS
30% LIMESTONE
Table 5.4.7 Summary of ASTM C 1567 Expansions for Mix 2F
Mix #2F Average
CM564-C15F18S15_L45 Change in
Time, days Length, %
0 0
4 0.007
7 0.013
11 0.015
14 0.021
18 0.028
21 0.030
25 0.027
28 0.041
Summary of Expansion Results
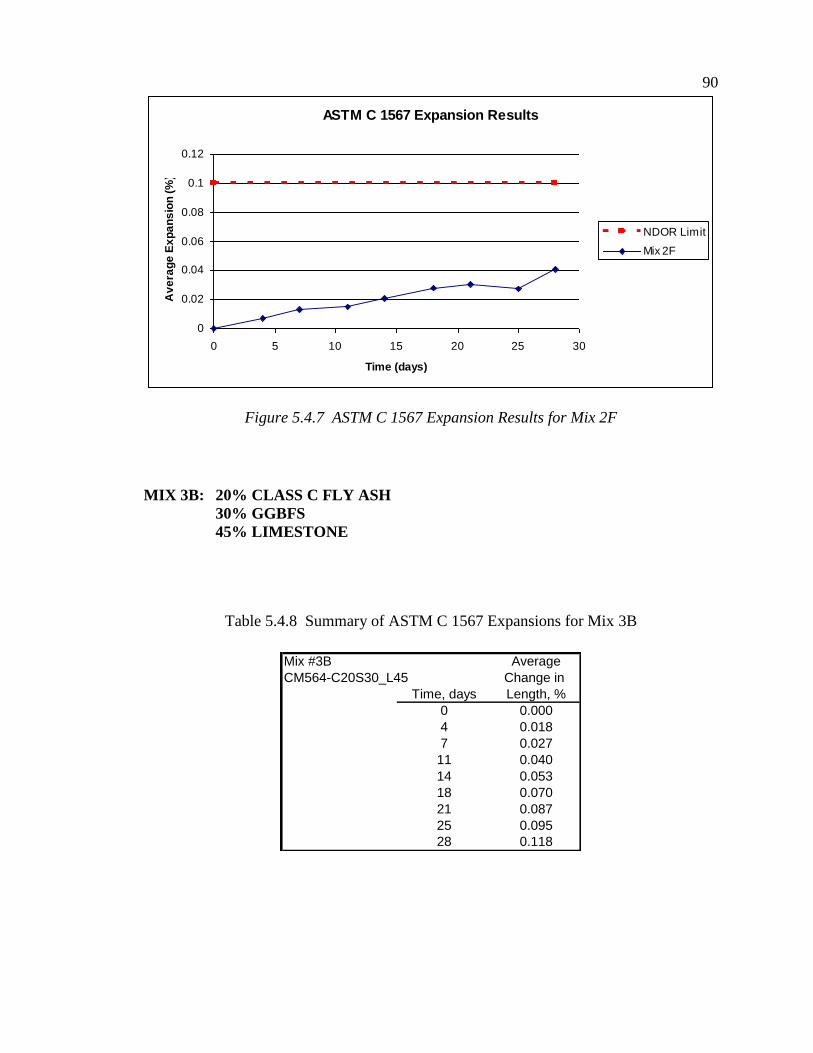
90
ASTM C 1567 Expansion Results
0
0.02
0.04
0.06
0.08
0.1
0.12
0 5 10 15 20 25 30
Time (days)
Av
era
ge
Ex
pa
ns
ion
(%
)
NDOR Limit
Mix 2F
Figure 5.4.7 ASTM C 1567 Expansion Results for Mix 2F
MIX 3B: 20% CLASS C FLY ASH
30% GGBFS
45% LIMESTONE
Table 5.4.8 Summary of ASTM C 1567 Expansions for Mix 3B
Mix #3B Average
CM564-C20S30_L45 Change in
Time, days Length, %
0 0.000
4 0.018
7 0.027
11 0.040
14 0.053
18 0.070
21 0.087
25 0.095
28 0.118
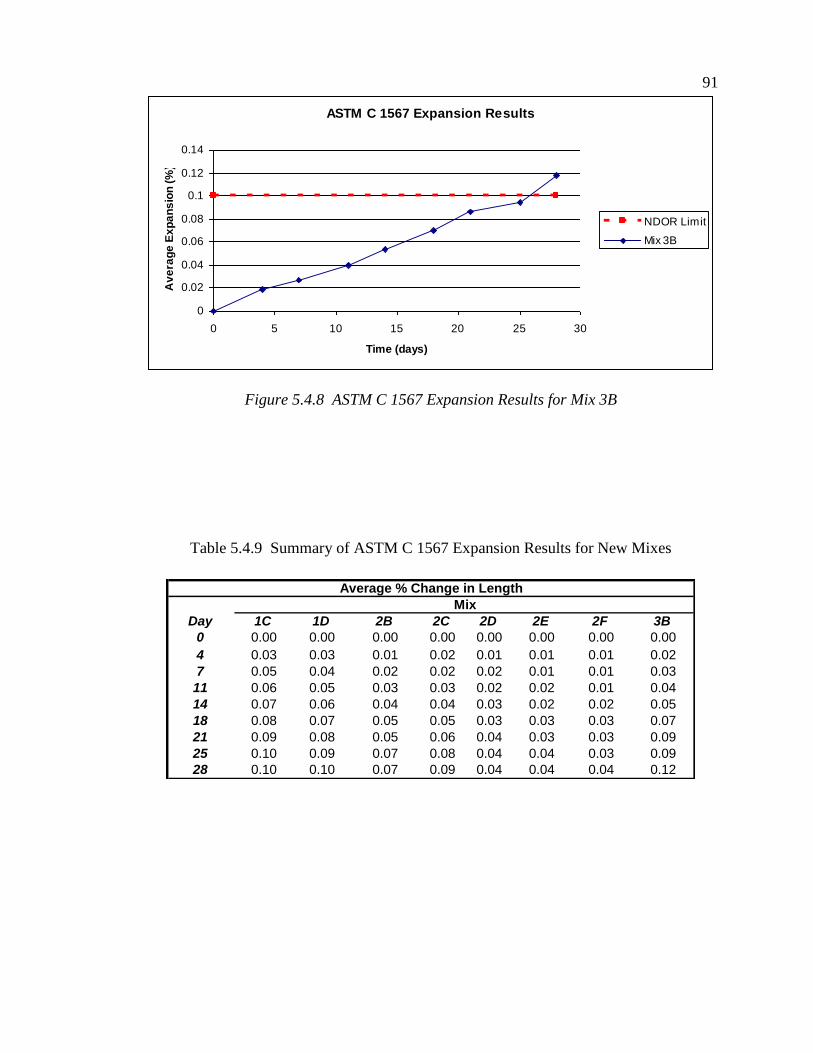
91
ASTM C 1567 Expansion Results
0
0.02
0.04
0.06
0.08
0.1
0.12
0.14
0 5 10 15 20 25 30
Time (days)
Av
era
ge
Ex
pa
ns
ion
(%
)
NDOR Limit
Mix 3B
Figure 5.4.8 ASTM C 1567 Expansion Results for Mix 3B
Table 5.4.9 Summary of ASTM C 1567 Expansion Results for New Mixes
Day 1C 1D 2B 2C 2D 2E 2F 3B
0 0.00 0.00 0.00 0.00 0.00 0.00 0.00 0.00
4 0.03 0.03 0.01 0.02 0.01 0.01 0.01 0.02
7 0.05 0.04 0.02 0.02 0.02 0.01 0.01 0.03
11 0.06 0.05 0.03 0.03 0.02 0.02 0.01 0.04
14 0.07 0.06 0.04 0.04 0.03 0.02 0.02 0.05
18 0.08 0.07 0.05 0.05 0.03 0.03 0.03 0.07
21 0.09 0.08 0.05 0.06 0.04 0.03 0.03 0.09
25 0.10 0.09 0.07 0.08 0.04 0.04 0.03 0.09
28 0.10 0.10 0.07 0.09 0.04 0.04 0.04 0.12
Average % Change in Length
Mix
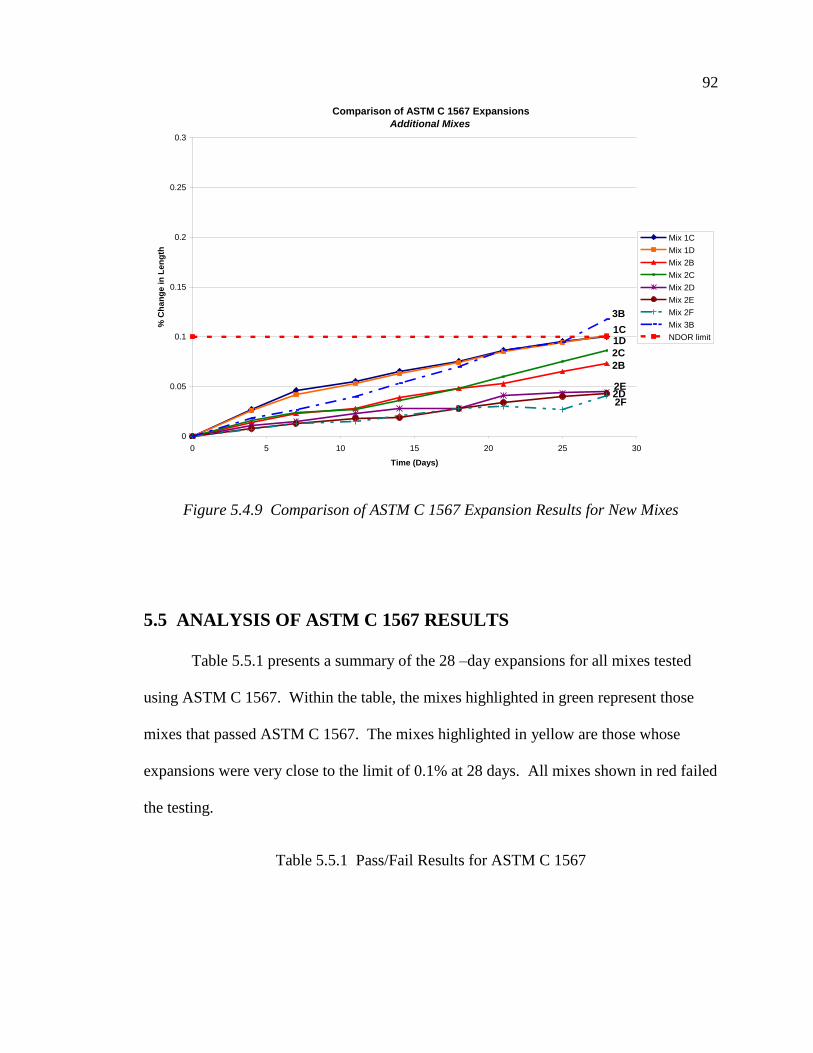
92
Comparison of ASTM C 1567 Expansions
Additional Mixes
0
0.05
0.1
0.15
0.2
0.25
0.3
0 5 10 15 20 25 30
Time (Days)
% C
ha
ng
e in
Le
ng
th
Mix 1C
Mix 1D
Mix 2B
Mix 2C
Mix 2D
Mix 2E
Mix 2F
Mix 3B
NDOR limit
2B
1D1C
2C
2D2E
3B
2F
Figure 5.4.9 Comparison of ASTM C 1567 Expansion Results for New Mixes
5.5 ANALYSIS OF ASTM C 1567 RESULTS
Table 5.5.1 presents a summary of the 28 –day expansions for all mixes tested
using ASTM C 1567. Within the table, the mixes highlighted in green represent those
mixes that passed ASTM C 1567. The mixes highlighted in yellow are those whose
expansions were very close to the limit of 0.1% at 28 days. All mixes shown in red failed
the testing.
Table 5.5.1 Pass/Fail Results for ASTM C 1567

93
Mix No.
1A
1B
1C
1D
2
2B
2C
2D
2E
2F
3
3B
4A
4B
5
6 Ref. Mix - 25% F__30%LS
0.18
0.12
0.28
0.04
35%C__45%LS
0.04
0.04
0.12
0.12
Ref. Mix - 17% C__30%LS
35%C__30% LS
20%C - 30%S__30%LS
20%C - 30%S__45%LS
0.10
0.10
0.05
0.07
0.09
0.04
DescriptionASTM C 1567
28-day
Expansion %
15%C - 21%F__45%LS
15%C-18%F-15%S__30%LS
20%C - 20%F__30%LS
20%C - 15%F__45%LS
15%C - 15%F__45%LS
45% C__30%LS
45% C__45%LS
40%C__30%LS
40%C__45%LS
15%C - 21%F__30%LS
0.12
0.10
The results of the ASTM C 1567 were as expected. The relative performance of
each mix was identical to what would be predicted. This comparison of relative
performances appears to validate the testing results. Although the relative performances
were very much in line with what would be expected, the overall ASR resistance of the
potential mixes was lower than anticipated. Out of the eight mixes tested, only 2 mixes
successfully passed the ASTM C 1567 limit set by NDOR of 0.1%. These include mixes
2 and 6.
The use of Class C fly alone, as in mixes 1A, 1B, 4A and 4B, would have
difficulties satisfying the ASTM C 1567 testing and therefore may not have adequate
ASR resistance in the field. Up to 40% replacement levels along with the use of 45%
limestone still produce 28-day expansions equal to 0.1%. This is mainly due to the
extremely high CaO content found in the Class C fly ash produced in Nebraska. Such fly
ash will behave more similarly to hydraulic cement than a pozzolan. The hydration that
occurs creates a weak and porous matrix that allows for easy mobility of the alkalies.
The pozzolanic reactions that do occur produce a C-S-H structure with high calcium to
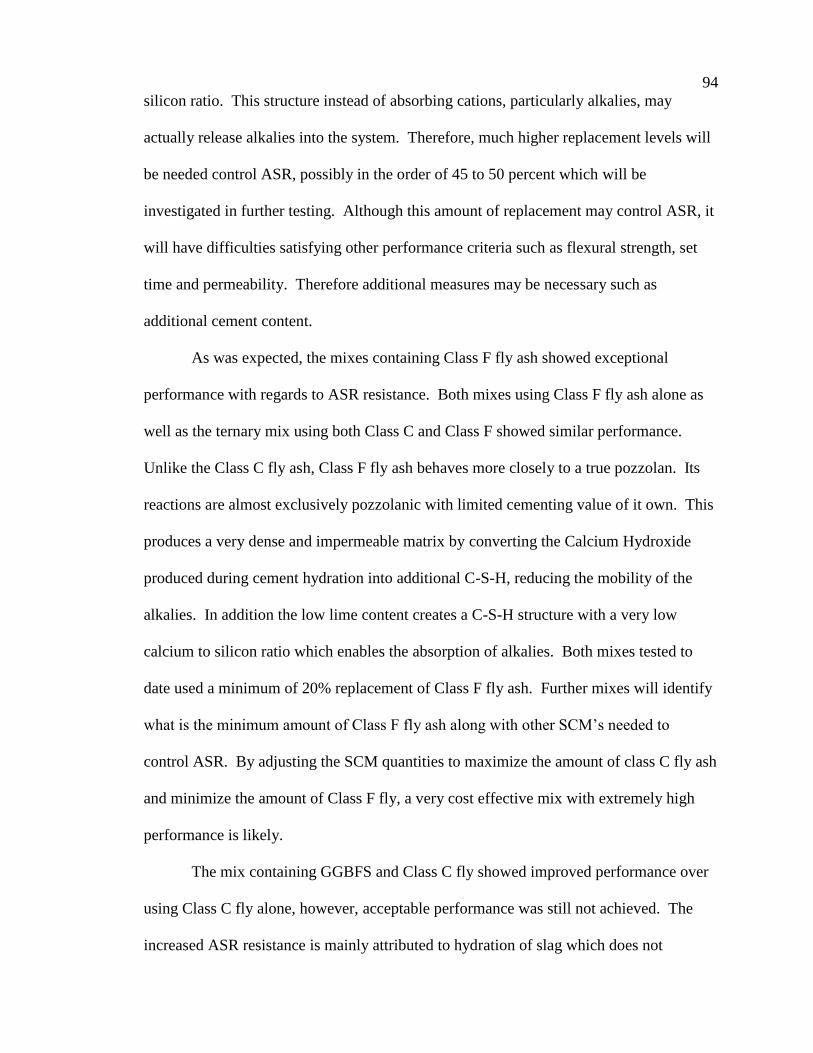
94
silicon ratio. This structure instead of absorbing cations, particularly alkalies, may
actually release alkalies into the system. Therefore, much higher replacement levels will
be needed control ASR, possibly in the order of 45 to 50 percent which will be
investigated in further testing. Although this amount of replacement may control ASR, it
will have difficulties satisfying other performance criteria such as flexural strength, set
time and permeability. Therefore additional measures may be necessary such as
additional cement content.
As was expected, the mixes containing Class F fly ash showed exceptional
performance with regards to ASR resistance. Both mixes using Class F fly ash alone as
well as the ternary mix using both Class C and Class F showed similar performance.
Unlike the Class C fly ash, Class F fly ash behaves more closely to a true pozzolan. Its
reactions are almost exclusively pozzolanic with limited cementing value of it own. This
produces a very dense and impermeable matrix by converting the Calcium Hydroxide
produced during cement hydration into additional C-S-H, reducing the mobility of the
alkalies. In addition the low lime content creates a C-S-H structure with a very low
calcium to silicon ratio which enables the absorption of alkalies. Both mixes tested to
date used a minimum of 20% replacement of Class F fly ash. Further mixes will identify
what is the minimum amount of Class F fly ash along with other SCM’s needed to
control ASR. By adjusting the SCM quantities to maximize the amount of class C fly ash
and minimize the amount of Class F fly, a very cost effective mix with extremely high
performance is likely.
The mix containing GGBFS and Class C fly showed improved performance over
using Class C fly alone, however, acceptable performance was still not achieved. The
increased ASR resistance is mainly attributed to hydration of slag which does not

95
produce the weak and porous Calcium Hydroxide phase. This reduces the mobility of the
alkalies. To produce acceptable ASR resistance using slag, a higher replacement level
may be needed. However, such a mix would mostly likely fail other performance tests.
Therefore, further testing will investigate the use of 45% limestone used along with same
replacement levels of 20% Class C fly ash and 30% slag.
As was expected, all mixes using 45% limestone and 55% sand and gravel
showed superior performance over the companion mixes using the traditional 47B
gradation of 30% limestone and 70% sand and gravel. These results are very predictable
since a portion of the reactive sand and gravel is being replaced with the non-reactive
limestone. This is a well established method of reducing ASR expansions and is known
as “limestone sweetening”.
Although the exact progression of deterioration mechanism being seen previously
in Nebraska pavements in unknown, the results from the ASTM C 1567 testing provides
excellent evidence that the deterioration was largely due to Alkali-Silica reaction. The
current standard mix using 1PF cement (25% Class F fly ash) showed the lowest
expansion results of 0.04%. The previous standard mix, which was used in the
pavements experiencing premature deterioration, had expansions nearly double that of
any other mix. This mix had expansions exceeding the limit of 0.1% after only 7 days of
testing.
5.6 SELECTION OF TOP MIXES
Following the conclusion of all ASTM C 1567 testing, a meeting was held at
NDOR. A presentation was given by the UNL team to the project sponsors. A summary
of the relevant Phase I finding as well as the results from the ASTM C 1567 testing were
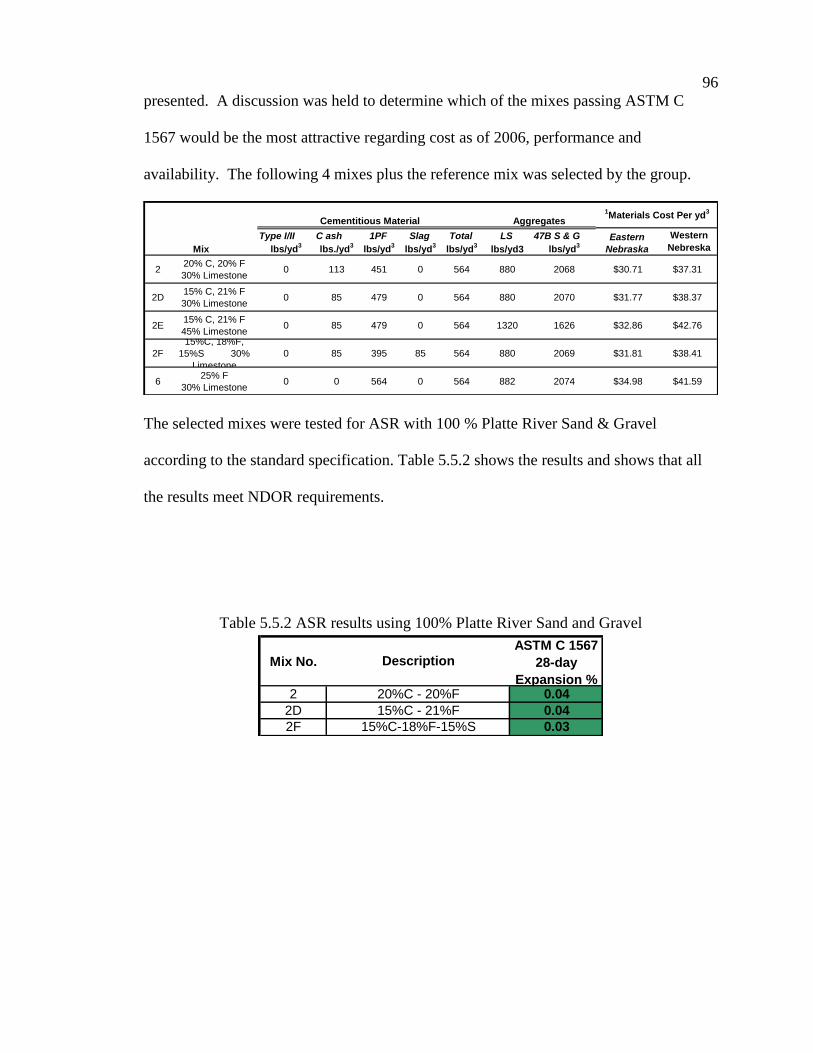
96
presented. A discussion was held to determine which of the mixes passing ASTM C
1567 would be the most attractive regarding cost as of 2006, performance and
availability. The following 4 mixes plus the reference mix was selected by the group.
Type I/II C ash 1PF Slag Total LS 47B S & G
lbs/yd3
lbs./yd3
lbs/yd3
lbs/yd3
lbs/yd3
lbs/yd3 lbs/yd3
220% C, 20% F
30% Limestone0 113 451 0 564 880 2068 $30.71 $37.31
2D15% C, 21% F
30% Limestone0 85 479 0 564 880 2070 $31.77 $38.37
2E15% C, 21% F
45% Limestone0 85 479 0 564 1320 1626 $32.86 $42.76
2F
15%C, 18%F,
15%S 30%
Limestone
0 85 395 85 564 880 2069 $31.81 $38.41
625% F
30% Limestone0 0 564 0 564 882 2074 $34.98 $41.59
1Materials Cost Per yd
3
Eastern
Nebraska
Western
NebreskaMix
AggregatesCementitious Material
The selected mixes were tested for ASR with 100 % Platte River Sand & Gravel
according to the standard specification. Table 5.5.2 shows the results and shows that all
the results meet NDOR requirements.
Table 5.5.2 ASR results using 100% Platte River Sand and Gravel
Mix No.
2
2D
2F 0.03
0.04
0.04
DescriptionASTM C 1567
28-day
Expansion %
15%C-18%F-15%S
20%C - 20%F
15%C - 21%F
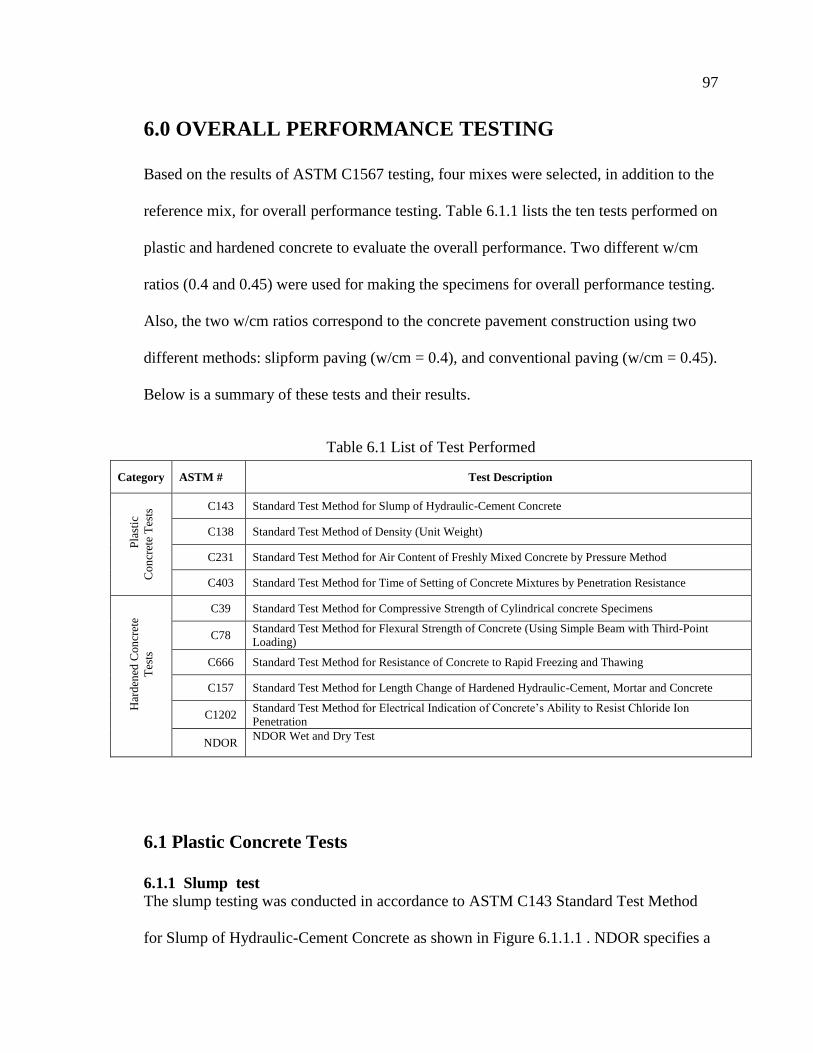
97
6.0 OVERALL PERFORMANCE TESTING
Based on the results of ASTM C1567 testing, four mixes were selected, in addition to the
reference mix, for overall performance testing. Table 6.1.1 lists the ten tests performed on
plastic and hardened concrete to evaluate the overall performance. Two different w/cm
ratios (0.4 and 0.45) were used for making the specimens for overall performance testing.
Also, the two w/cm ratios correspond to the concrete pavement construction using two
different methods: slipform paving (w/cm = 0.4), and conventional paving (w/cm = 0.45).
Below is a summary of these tests and their results.
Table 6.1 List of Test Performed
Category ASTM # Test Description
Pla
stic
Co
ncr
ete
Tes
ts C143 Standard Test Method for Slump of Hydraulic-Cement Concrete
C138 Standard Test Method of Density (Unit Weight)
C231 Standard Test Method for Air Content of Freshly Mixed Concrete by Pressure Method
C403 Standard Test Method for Time of Setting of Concrete Mixtures by Penetration Resistance
Har
den
ed C
on
cret
e
Tes
ts
C39 Standard Test Method for Compressive Strength of Cylindrical concrete Specimens
C78 Standard Test Method for Flexural Strength of Concrete (Using Simple Beam with Third-Point
Loading)
C666 Standard Test Method for Resistance of Concrete to Rapid Freezing and Thawing
C157 Standard Test Method for Length Change of Hardened Hydraulic-Cement, Mortar and Concrete
C1202 Standard Test Method for Electrical Indication of Concrete’s Ability to Resist Chloride Ion
Penetration
NDOR NDOR Wet and Dry Test
6.1 Plastic Concrete Tests
6.1.1 Slump test
The slump testing was conducted in accordance to ASTM C143 Standard Test Method
for Slump of Hydraulic-Cement Concrete as shown in Figure 6.1.1.1 . NDOR specifies a
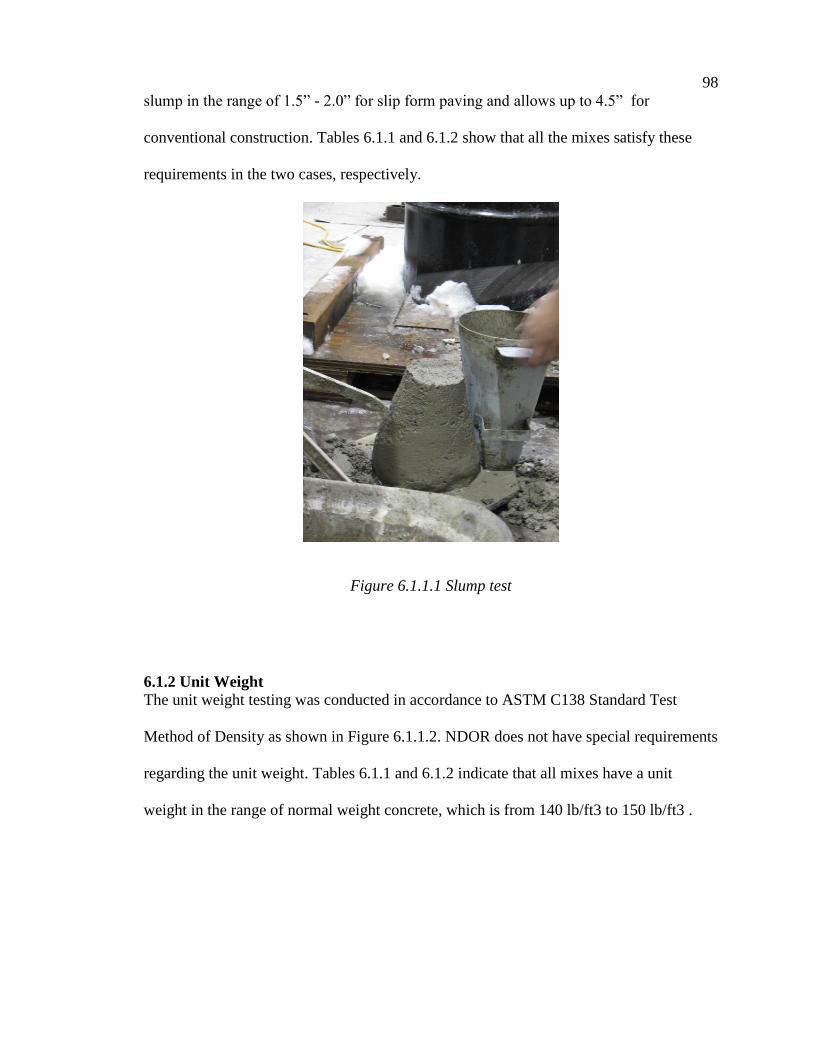
98
slump in the range of 1.5” - 2.0” for slip form paving and allows up to 4.5” for
conventional construction. Tables 6.1.1 and 6.1.2 show that all the mixes satisfy these
requirements in the two cases, respectively.
Figure 6.1.1.1 Slump test
6.1.2 Unit Weight
The unit weight testing was conducted in accordance to ASTM C138 Standard Test
Method of Density as shown in Figure 6.1.1.2. NDOR does not have special requirements
regarding the unit weight. Tables 6.1.1 and 6.1.2 indicate that all mixes have a unit
weight in the range of normal weight concrete, which is from 140 lb/ft3 to 150 lb/ft3 .
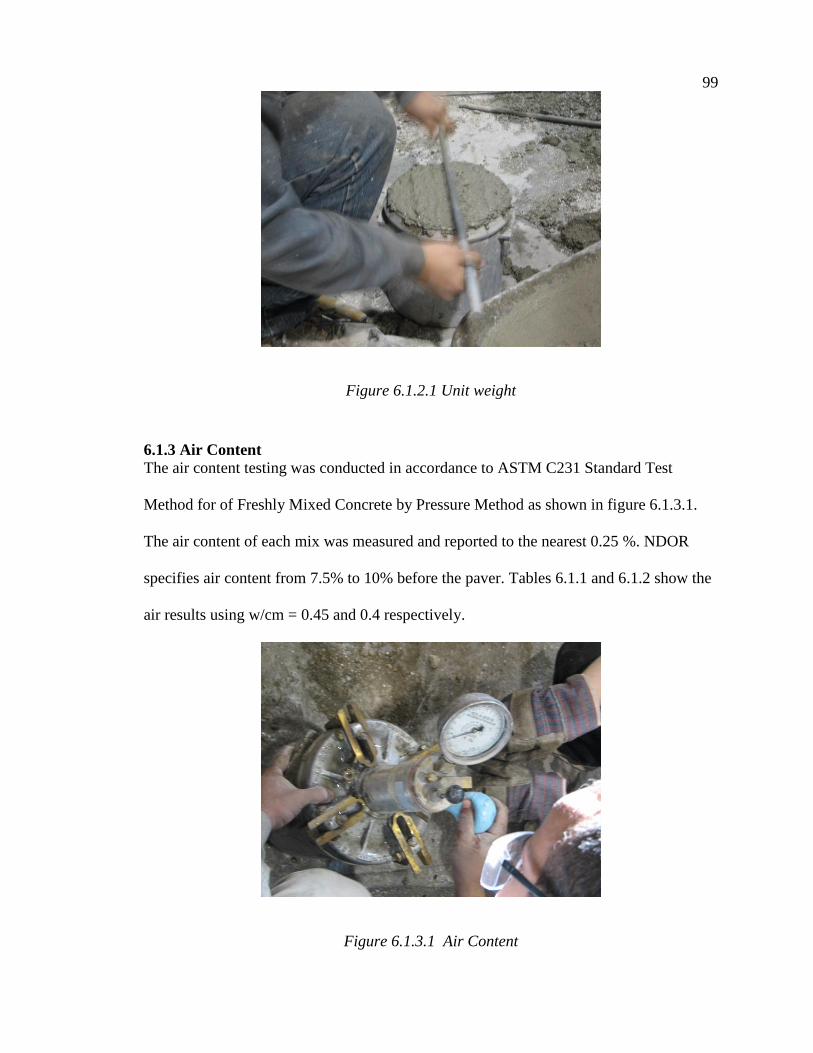
99
Figure 6.1.2.1 Unit weight
6.1.3 Air Content
The air content testing was conducted in accordance to ASTM C231 Standard Test
Method for of Freshly Mixed Concrete by Pressure Method as shown in figure 6.1.3.1.
The air content of each mix was measured and reported to the nearest 0.25 %. NDOR
specifies air content from 7.5% to 10% before the paver. Tables 6.1.1 and 6.1.2 show the
air results using w/cm = 0.45 and 0.4 respectively.
Figure 6.1.3.1 Air Content
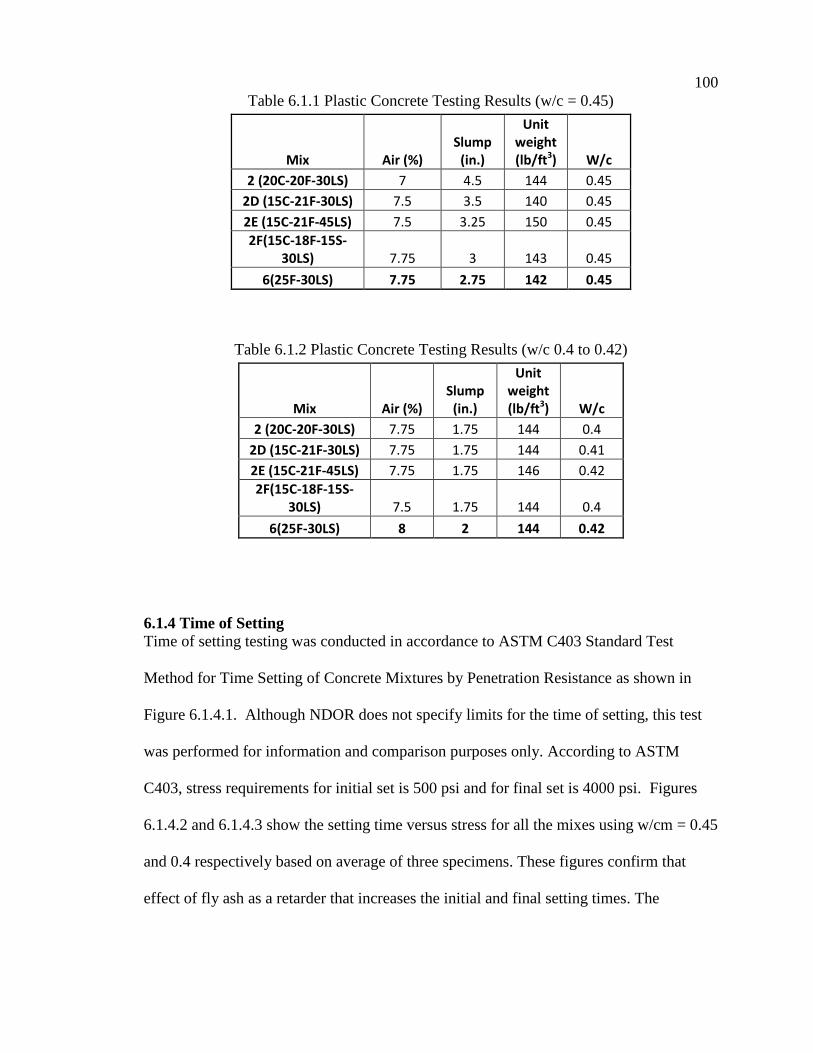
100
Table 6.1.1 Plastic Concrete Testing Results (w/c = 0.45)
Mix Air (%) Slump
(in.)
Unit weight (lb/ft3) W/c
2 (20C-20F-30LS) 7 4.5 144 0.45
2D (15C-21F-30LS) 7.5 3.5 140 0.45
2E (15C-21F-45LS) 7.5 3.25 150 0.45
2F(15C-18F-15S-30LS) 7.75 3 143 0.45
6(25F-30LS) 7.75 2.75 142 0.45
Table 6.1.2 Plastic Concrete Testing Results (w/c 0.4 to 0.42)
Mix Air (%) Slump
(in.)
Unit weight (lb/ft3) W/c
2 (20C-20F-30LS) 7.75 1.75 144 0.4
2D (15C-21F-30LS) 7.75 1.75 144 0.41
2E (15C-21F-45LS) 7.75 1.75 146 0.42
2F(15C-18F-15S-30LS) 7.5 1.75 144 0.4
6(25F-30LS) 8 2 144 0.42
6.1.4 Time of Setting
Time of setting testing was conducted in accordance to ASTM C403 Standard Test
Method for Time Setting of Concrete Mixtures by Penetration Resistance as shown in
Figure 6.1.4.1. Although NDOR does not specify limits for the time of setting, this test
was performed for information and comparison purposes only. According to ASTM
C403, stress requirements for initial set is 500 psi and for final set is 4000 psi. Figures
6.1.4.2 and 6.1.4.3 show the setting time versus stress for all the mixes using w/cm = 0.45
and 0.4 respectively based on average of three specimens. These figures confirm that
effect of fly ash as a retarder that increases the initial and final setting times. The
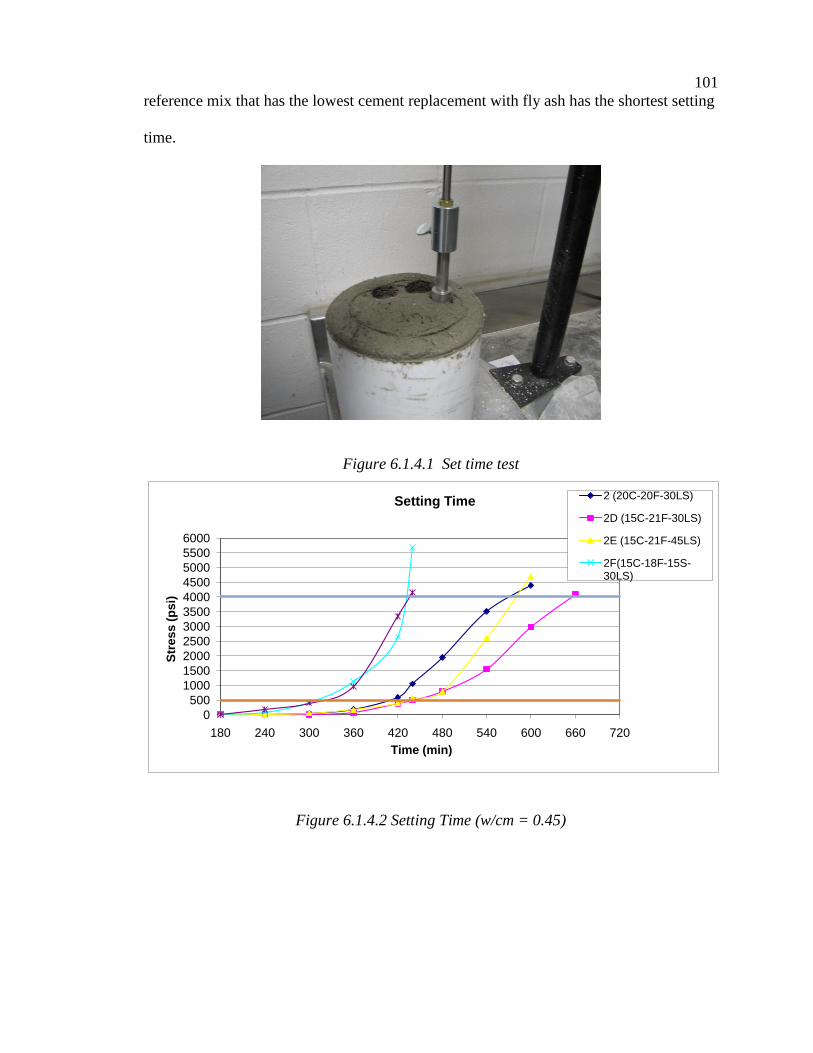
101
reference mix that has the lowest cement replacement with fly ash has the shortest setting
time.
Figure 6.1.4.1 Set time test
0
500
1000
1500
2000
2500
3000
3500
4000
4500
5000
5500
6000
180 240 300 360 420 480 540 600 660 720
Str
ess
(p
si)
Time (min)
Setting Time 2 (20C-20F-30LS)
2D (15C-21F-30LS)
2E (15C-21F-45LS)
2F(15C-18F-15S-30LS)
Figure 6.1.4.2 Setting Time (w/cm = 0.45)

102
0500
100015002000250030003500400045005000550060006500
180 240 300 360 420 480 540 600 660 720
Str
ess
(p
si)
Time (min)
Setting Time
20C-20F-30LS
15C-21F-30LS
15C-21F-45LS
15C-18F-15S-30LS
25F-30LS
Figure 6.1.4.3 Setting Time (w/cm = 0.40 to 0.42)
6.2 Hardened Concrete Strength Tests
6.2.1 Compressive Strength
Compressive strength testing was conducted in accordance to ASTM C39 Standard Test
Method for Compressive Strength of Cylindrical concrete Specimens as shown in figure
6.2.1.1. The compressive strength tests were conducted at 3, 7, 14 and 28 days using
three 4”x8” cylinders. NDOR specifies a minimum compressive strength of 3,500 psi at
14 days for PCCP projects. Tables 6.2.1.1 and 6.2.1.2 lists test results for the five mixes
with w/cm = 0.45 and 0.4 respectively. These results indicate that the chosen mixes
outperform the current NDOR standard mix (Mix 6) in terms of compressive strength.
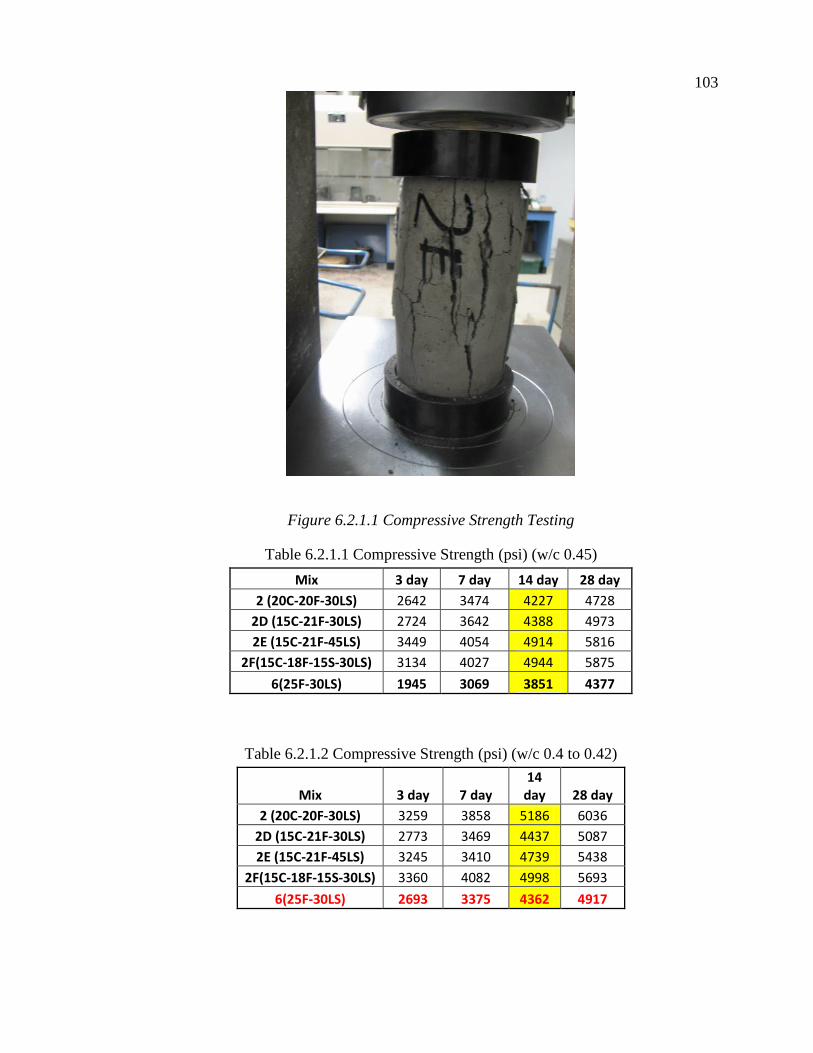
103
Figure 6.2.1.1 Compressive Strength Testing
Table 6.2.1.1 Compressive Strength (psi) (w/c 0.45)
Mix 3 day 7 day 14 day 28 day
2 (20C-20F-30LS) 2642 3474 4227 4728
2D (15C-21F-30LS) 2724 3642 4388 4973
2E (15C-21F-45LS) 3449 4054 4914 5816
2F(15C-18F-15S-30LS) 3134 4027 4944 5875
6(25F-30LS) 1945 3069 3851 4377
Table 6.2.1.2 Compressive Strength (psi) (w/c 0.4 to 0.42)
Mix 3 day 7 day 14
day 28 day
2 (20C-20F-30LS) 3259 3858 5186 6036
2D (15C-21F-30LS) 2773 3469 4437 5087
2E (15C-21F-45LS) 3245 3410 4739 5438
2F(15C-18F-15S-30LS) 3360 4082 4998 5693
6(25F-30LS) 2693 3375 4362 4917

104
6.2.2 Flexural Strength
Flexural strength testing was conducted in accordance to ASTM C 78 Standard Test
Method for Flexural Strength of Concrete (Using Simple Beam with Third-Point
Loading) as shown in Figure 6.2.2.1. The testing was conducted at, 3,7,14 and 28 days
using three prisms. NDOR specifies a minimum strength of 700 psi for PCCP projects.
Tables 6.2.2.1 and 6.2.2.2 lists test results for the five mixes with w/cm = 0.45 and 0.4
respectively. These results indicate that the chosen mixes outperform the current NDOR
standard mix (Mix 6) in terms of flexure strength.
Figure 6.2.2.1 Flexural Strength Testing
Table 6.2.2.1 Flexural Strength (psi)(w/c 0.45)
Mix 3 day 7 day 14 day 28 day
2 (20C-20F-30LS) 439 495 591 740
2D (15C-21F-30LS) 491 564 638 745
2E (15C-21F-45LS) 509 578 668 830
2F(15C-18F-15S-30LS) 507 619 667 812
6(25F-30LS) 436 518 596 687
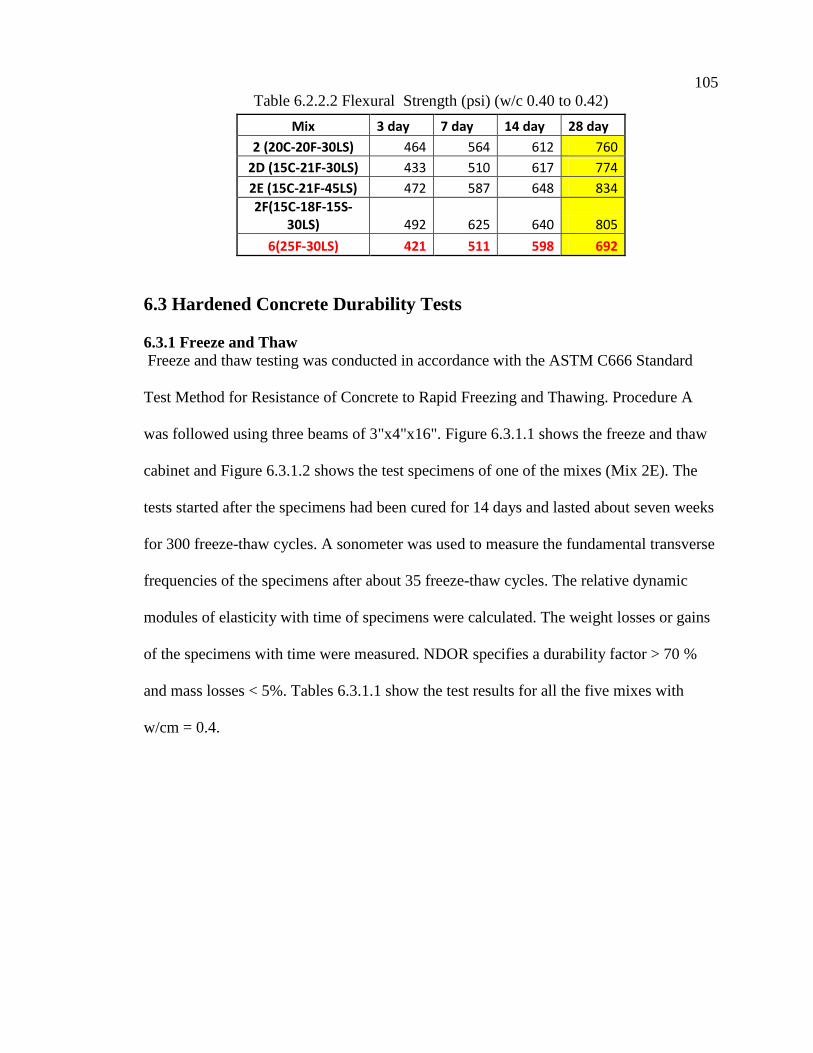
105
Table 6.2.2.2 Flexural Strength (psi) (w/c 0.40 to 0.42)
Mix 3 day 7 day 14 day 28 day
2 (20C-20F-30LS) 464 564 612 760
2D (15C-21F-30LS) 433 510 617 774
2E (15C-21F-45LS) 472 587 648 834
2F(15C-18F-15S-30LS) 492 625 640 805
6(25F-30LS) 421 511 598 692
6.3 Hardened Concrete Durability Tests
6.3.1 Freeze and Thaw
Freeze and thaw testing was conducted in accordance with the ASTM C666 Standard
Test Method for Resistance of Concrete to Rapid Freezing and Thawing. Procedure A
was followed using three beams of 3"x4"x16". Figure 6.3.1.1 shows the freeze and thaw
cabinet and Figure 6.3.1.2 shows the test specimens of one of the mixes (Mix 2E). The
tests started after the specimens had been cured for 14 days and lasted about seven weeks
for 300 freeze-thaw cycles. A sonometer was used to measure the fundamental transverse
frequencies of the specimens after about 35 freeze-thaw cycles. The relative dynamic
modules of elasticity with time of specimens were calculated. The weight losses or gains
of the specimens with time were measured. NDOR specifies a durability factor > 70 %
and mass losses < 5%. Tables 6.3.1.1 show the test results for all the five mixes with
w/cm = 0.4.
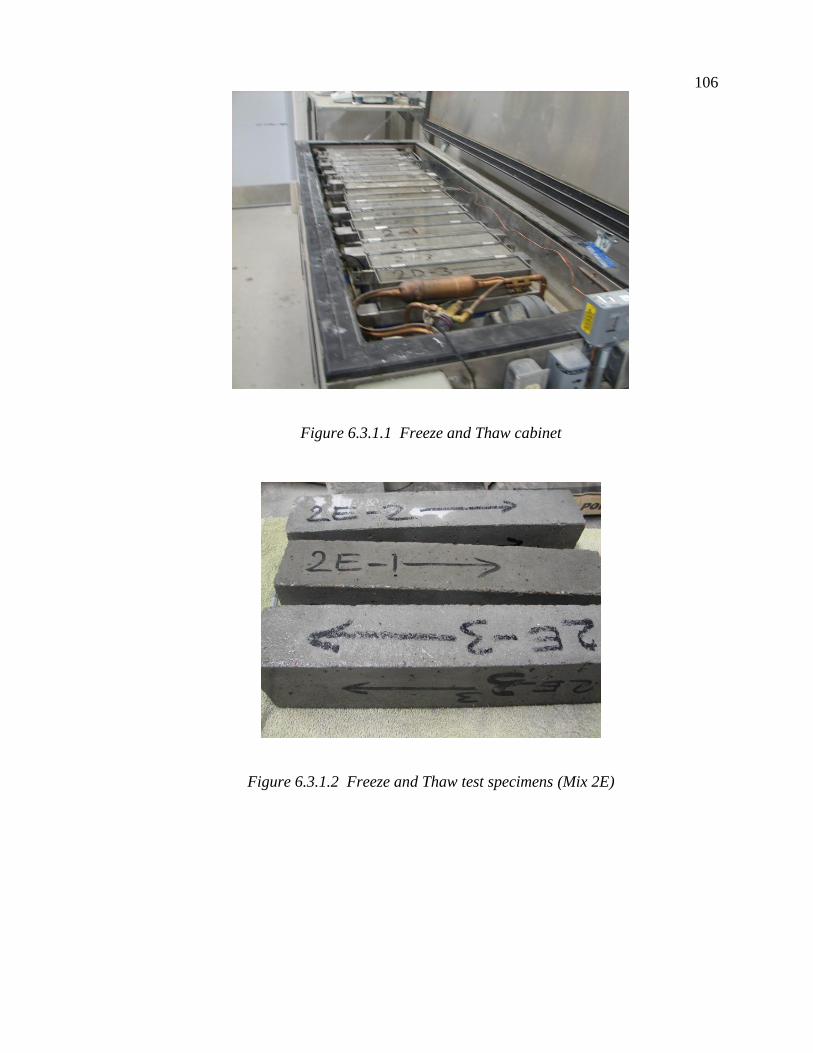
106
Figure 6.3.1.1 Freeze and Thaw cabinet
Figure 6.3.1.2 Freeze and Thaw test specimens (Mix 2E)

107
Table 6.3.1.1 Freeze and Thaw (w/c 0.40)
Mix
Durability
Factor Mass Loss
20C-20F-30LS 70% 0.93%
15C-21F-30LS 74% 0.23%
15C-21F-45LS 73% 0.54%
15C-18F-15S-30LS 70% 0.36%
25F-30L 72% 0.10%
6.3.2 Length change: Length change testing was conducted in accordance to ASTM
C157 Standard Test Method for Length Change of Hardened Hydraulic-Cement, Mortar
and Concrete. Three specimens from each mix were tested; the size of each specimens
was 3”x3”x10”. The specimens were cured in a moist cabinet for 24 hours. The initial
comparator reading was taken after placing the specimens in lime-saturated water for half
hour. Specimens were then placed in lime saturated water until they have reached the age
of 28 days and a second comparator reading was taken. Specimens were stored in
chamber with 50% humidity and 73 F, where comparator readings were taken after 4, 7,
14 and 28 days of air curing and after 8, 16, 32 and 64 weeks. Figures 6.3.2.1 and 6.3.2.2
show the comparator readings and the chamber. , Tables 6.3.2.1 and 6.3.2.2 shows the
readings for the five mixes with w/cm = 0.45 and 0.4 respectively. These results clearly
indicate that, in spite of the variation of the length change values among the five mixes at
28 days, the length change values are almost the same after 64 weeks. Also, there is no
significant difference between the values with w/cm = 0.45 and w/cm = 0.4.
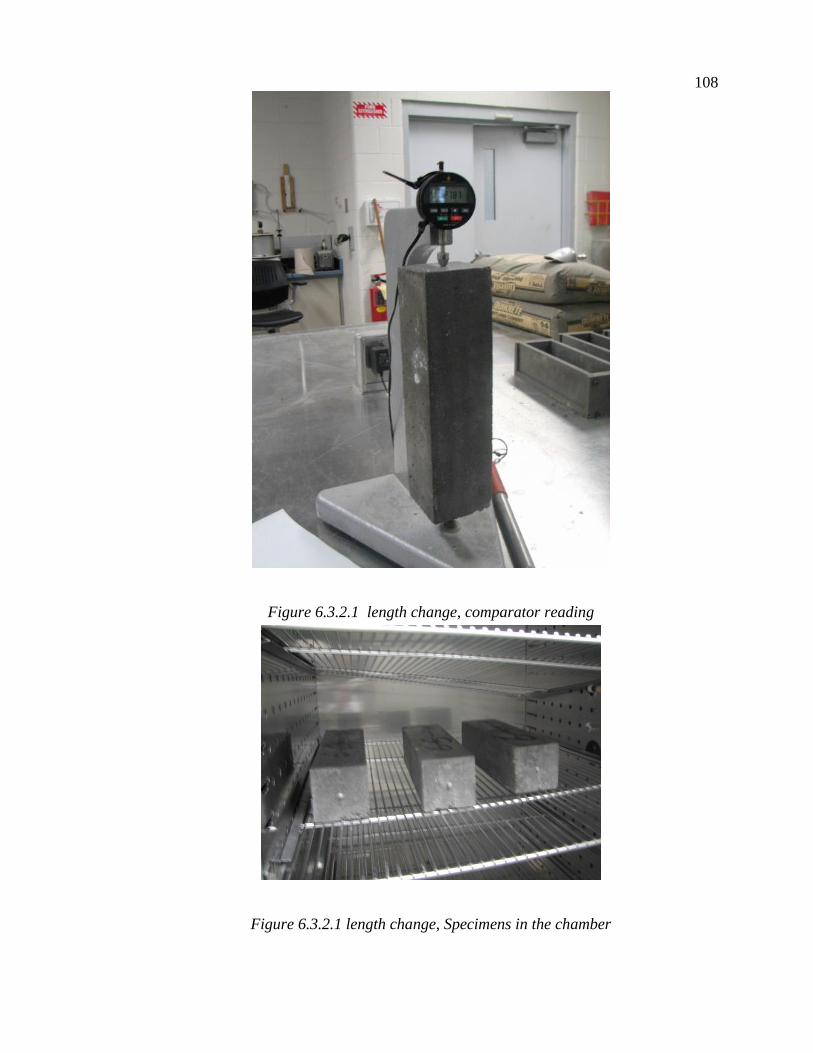
108
Figure 6.3.2.1 length change, comparator reading
Figure 6.3.2.1 length change, Specimens in the chamber
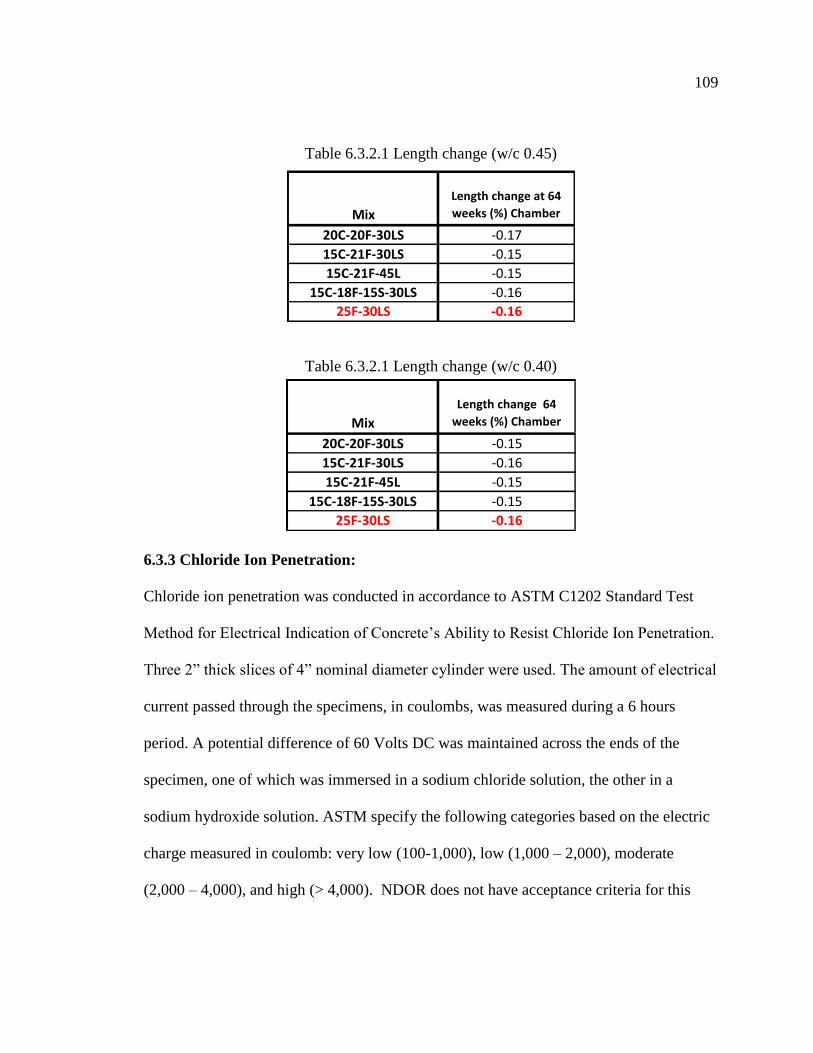
109
Table 6.3.2.1 Length change (w/c 0.45)
Mix
Length change at 64
weeks (%) Chamber
20C-20F-30LS -0.17
15C-21F-30LS -0.15
15C-21F-45L -0.15
15C-18F-15S-30LS -0.16
25F-30LS -0.16
Table 6.3.2.1 Length change (w/c 0.40)
Mix
Length change 64
weeks (%) Chamber
20C-20F-30LS -0.15
15C-21F-30LS -0.16
15C-21F-45L -0.15
15C-18F-15S-30LS -0.15
25F-30LS -0.16
6.3.3 Chloride Ion Penetration:
Chloride ion penetration was conducted in accordance to ASTM C1202 Standard Test
Method for Electrical Indication of Concrete’s Ability to Resist Chloride Ion Penetration.
Three 2” thick slices of 4” nominal diameter cylinder were used. The amount of electrical
current passed through the specimens, in coulombs, was measured during a 6 hours
period. A potential difference of 60 Volts DC was maintained across the ends of the
specimen, one of which was immersed in a sodium chloride solution, the other in a
sodium hydroxide solution. ASTM specify the following categories based on the electric
charge measured in coulomb: very low (100-1,000), low (1,000 – 2,000), moderate
(2,000 – 4,000), and high (> 4,000). NDOR does not have acceptance criteria for this

110
test, but it recommends mixes that have very low or low chloride ion penetration. Tables
6.3.3.1 and 6.3.3.2 indicate that all the mixes fall in these categories.
Figure 6.3.3.1 Chloride ion penetration, test Specimen mix 2D
Figure 6.3.3.2 preparing test specimen
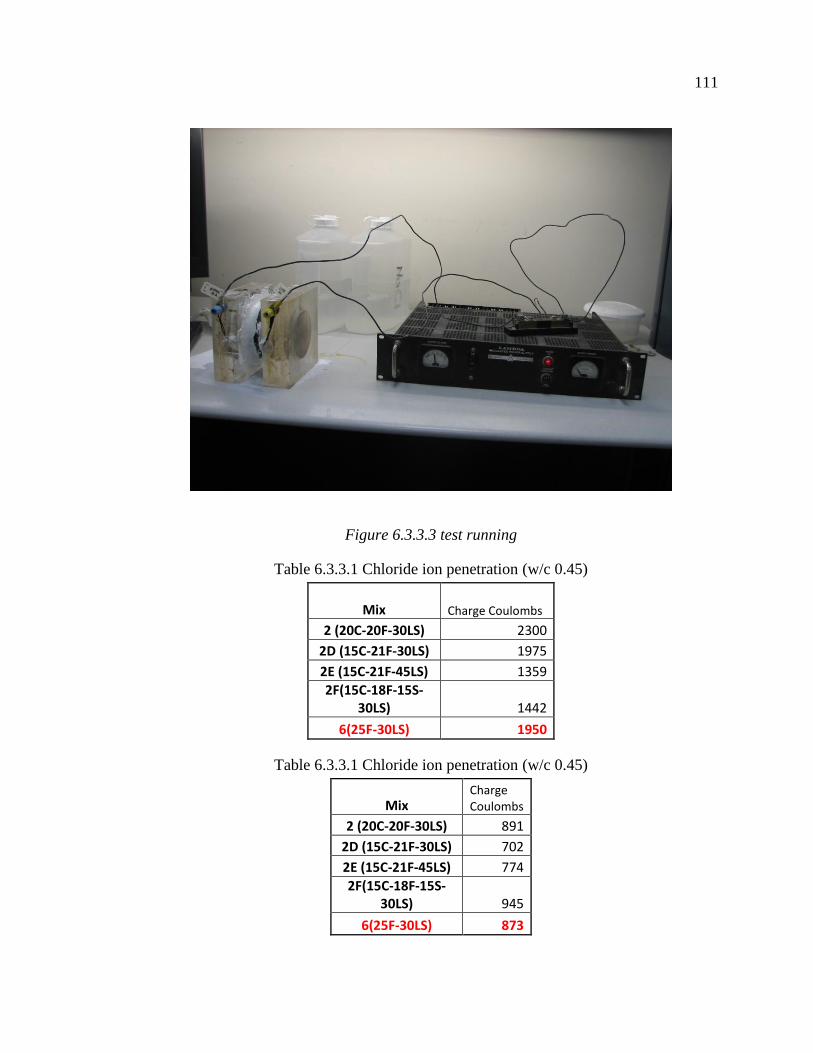
111
Figure 6.3.3.3 test running
Table 6.3.3.1 Chloride ion penetration (w/c 0.45)
Mix Charge Coulombs
2 (20C-20F-30LS) 2300
2D (15C-21F-30LS) 1975
2E (15C-21F-45LS) 1359
2F(15C-18F-15S-30LS) 1442
6(25F-30LS) 1950
Table 6.3.3.1 Chloride ion penetration (w/c 0.45)
Mix Charge Coulombs
2 (20C-20F-30LS) 891
2D (15C-21F-30LS) 702
2E (15C-21F-45LS) 774
2F(15C-18F-15S-30LS) 945
6(25F-30LS) 873

112
6.3.4 NDOR Wet and Dry Test
The NDOR Wet & Dry test evaluates the behavior of the mix under heating and cooling
environment. It evaluates/indicates the amount of deterioration that may occur in the
field, due to the reactivity of the aggregate.
The wet and dry apparatus consists of a test chamber in which test specimens are placed
and subjected to total submergence in water for a period of 8 hours and a drying in heated
air for 16 hours. The chamber temperature is maintained at 70 -75 F during the wetting
cycle and at 120 F during the dry cycle.
Heat is supplied during the drying cycle by a gas fired forced air furnace. Tap water is
used during the test and is not reused after each cycle. Racks are used to hold the
specimens in a horizontal position in the test chamber and also to prevent the test
specimens from touching each other. The racks are inserted and removed from the test
chamber by means of an overhead crane.
Six 3" x 3" x 16" beams are fabricated for this test from each mix design. Three of the
beams will be tested for flexural strength after 28 days of normal curing. The remaining
three beams are to be tested for flexure after 548 days of wet & dry cycle. Machined
stainless studs will be embedded in the ends of three of the beams during casting to
facilitate measuring during the test period.
After the beams have been removed from the molds, they are stored in the curing room for 26
days for the three beams for wet and dry testing. On the 26th
day, the beams will be removed from
the racks and placed in saturated lime water for 48 hours. This would complete the 28 days of
required cure time. The remaining three beams will be stored in the curing room for 28 days for
the flexure testing.
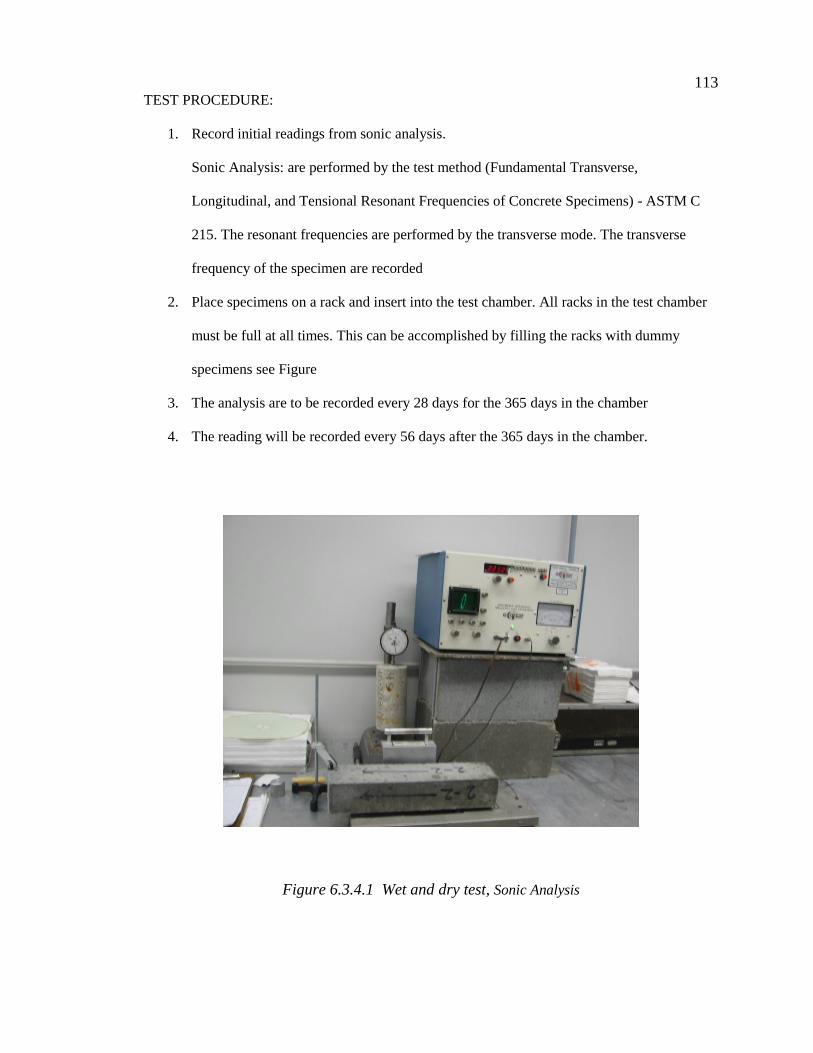
113
TEST PROCEDURE:
1. Record initial readings from sonic analysis.
Sonic Analysis: are performed by the test method (Fundamental Transverse,
Longitudinal, and Tensional Resonant Frequencies of Concrete Specimens) - ASTM C
215. The resonant frequencies are performed by the transverse mode. The transverse
frequency of the specimen are recorded
2. Place specimens on a rack and insert into the test chamber. All racks in the test chamber
must be full at all times. This can be accomplished by filling the racks with dummy
specimens see Figure
3. The analysis are to be recorded every 28 days for the 365 days in the chamber
4. The reading will be recorded every 56 days after the 365 days in the chamber.
Figure 6.3.4.1 Wet and dry test, Sonic Analysis
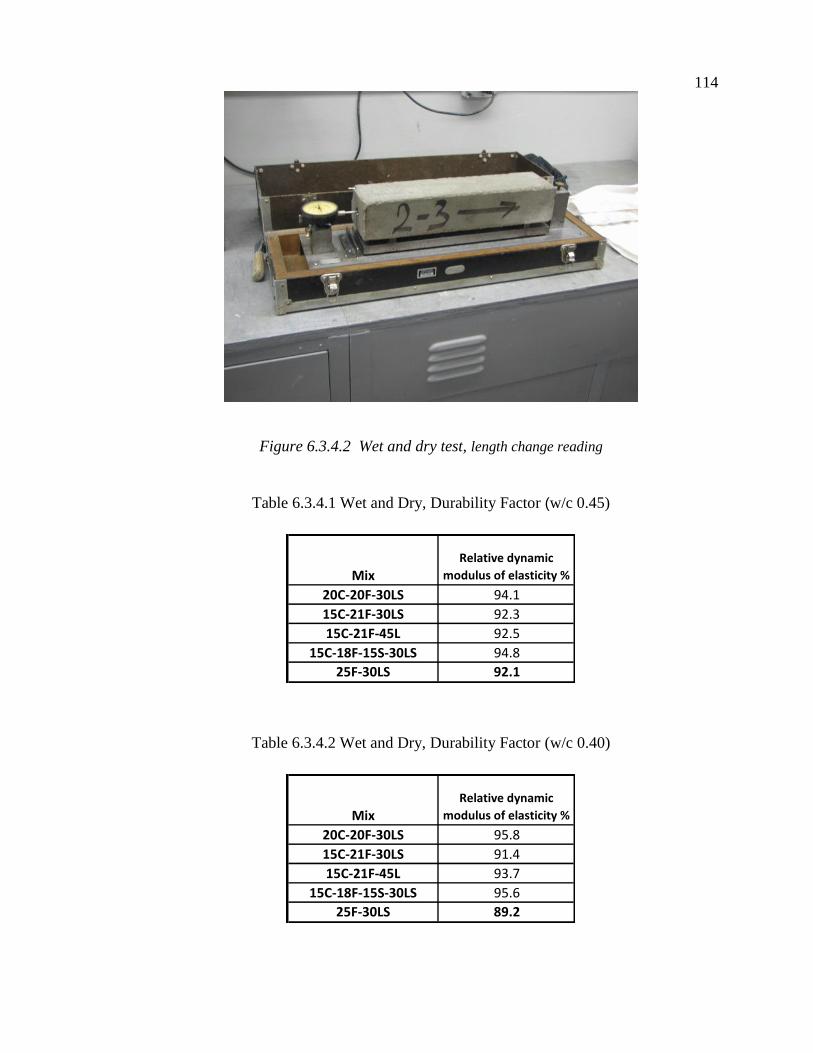
114
Figure 6.3.4.2 Wet and dry test, length change reading
Table 6.3.4.1 Wet and Dry, Durability Factor (w/c 0.45)
MixRelative dynamic
modulus of elasticity %
20C-20F-30LS 94.1
15C-21F-30LS 92.3
15C-21F-45L 92.5
15C-18F-15S-30LS 94.8
25F-30LS 92.1
Table 6.3.4.2 Wet and Dry, Durability Factor (w/c 0.40)
MixRelative dynamic
modulus of elasticity %
20C-20F-30LS 95.8
15C-21F-30LS 91.4
15C-21F-45L 93.7
15C-18F-15S-30LS 95.6
25F-30LS 89.2
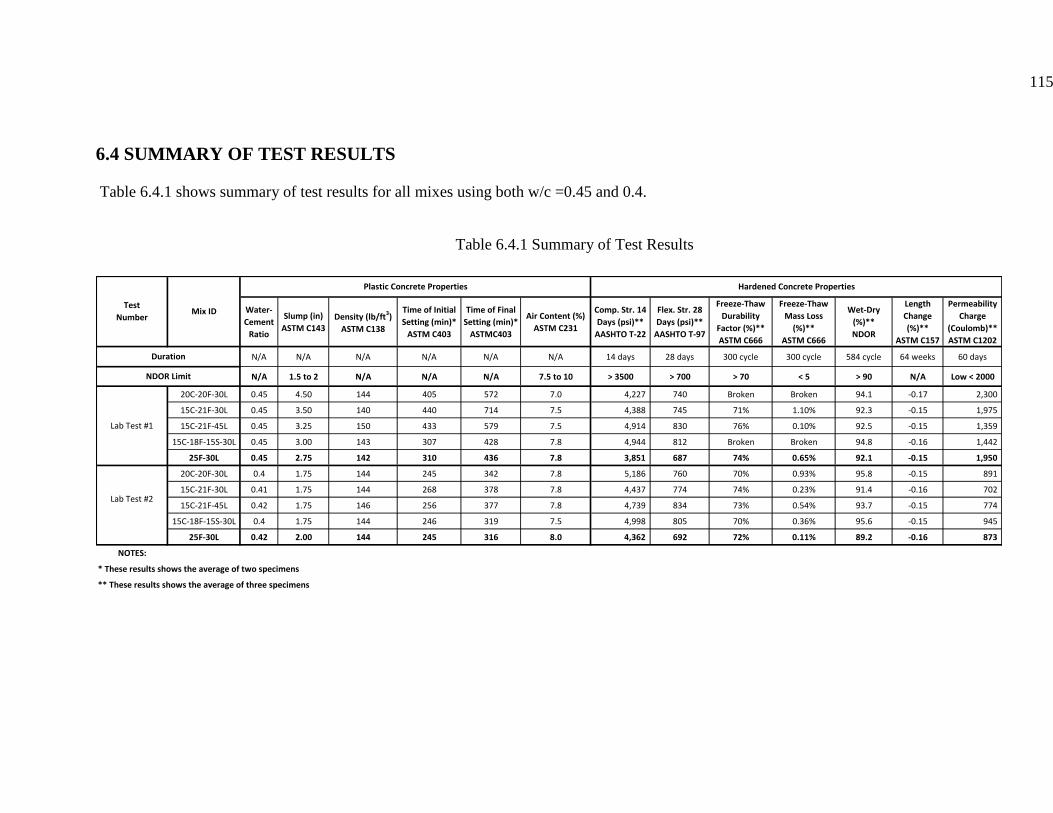
115
6.4 SUMMARY OF TEST RESULTS
Table 6.4.1 shows summary of test results for all mixes using both w/c =0.45 and 0.4.
Table 6.4.1 Summary of Test Results
Water-
Cement
Ratio
Slump (in)
ASTM C143Density (lb/ft3)
ASTM C138
Time of Initial
Setting (min)*
ASTM C403
Time of Final
Setting (min)*
ASTMC403
Air Content (%)
ASTM C231
Comp. Str. 14
Days (psi)**
AASHTO T-22
Flex. Str. 28
Days (psi)**
AASHTO T-97
Freeze-Thaw
Durability
Factor (%)**
ASTM C666
Freeze-Thaw
Mass Loss
(%)**
ASTM C666
Wet-Dry
(%)**
NDOR
Length
Change
(%)**
ASTM C157
Permeability
Charge
(Coulomb)**
ASTM C1202
N/A N/A N/A N/A N/A N/A 14 days 28 days 300 cycle 300 cycle 584 cycle 64 weeks 60 days
N/A 1.5 to 2 N/A N/A N/A 7.5 to 10 > 3500 > 700 > 70 < 5 > 90 N/A Low < 2000
20C-20F-30L 0.45 4.50 144 405 572 7.0 4,227 740 Broken Broken 94.1 -0.17 2,300
15C-21F-30L 0.45 3.50 140 440 714 7.5 4,388 745 71% 1.10% 92.3 -0.15 1,975
15C-21F-45L 0.45 3.25 150 433 579 7.5 4,914 830 76% 0.10% 92.5 -0.15 1,359
15C-18F-15S-30L 0.45 3.00 143 307 428 7.8 4,944 812 Broken Broken 94.8 -0.16 1,442
25F-30L 0.45 2.75 142 310 436 7.8 3,851 687 74% 0.65% 92.1 -0.15 1,950
20C-20F-30L 0.4 1.75 144 245 342 7.8 5,186 760 70% 0.93% 95.8 -0.15 891
15C-21F-30L 0.41 1.75 144 268 378 7.8 4,437 774 74% 0.23% 91.4 -0.16 702
15C-21F-45L 0.42 1.75 146 256 377 7.8 4,739 834 73% 0.54% 93.7 -0.15 774
15C-18F-15S-30L 0.4 1.75 144 246 319 7.5 4,998 805 70% 0.36% 95.6 -0.15 945
25F-30L 0.42 2.00 144 245 316 8.0 4,362 692 72% 0.11% 89.2 -0.16 873
NOTES:
* These results shows the average of two specimens
** These results shows the average of three specimens
Lab Test #1
Lab Test #2
Duration
Hardened Concrete Properties
NDOR Limit
Mix IDTest
Number
Plastic Concrete Properties
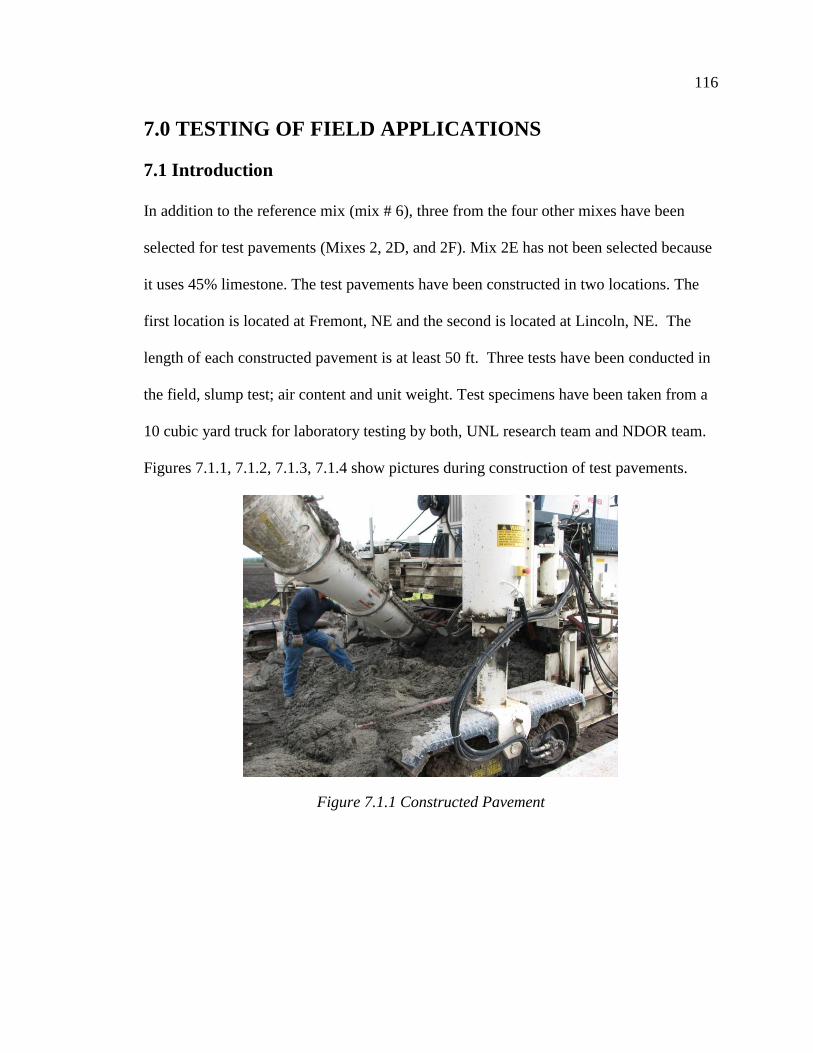
116
7.0 TESTING OF FIELD APPLICATIONS
7.1 Introduction
In addition to the reference mix (mix # 6), three from the four other mixes have been
selected for test pavements (Mixes 2, 2D, and 2F). Mix 2E has not been selected because
it uses 45% limestone. The test pavements have been constructed in two locations. The
first location is located at Fremont, NE and the second is located at Lincoln, NE. The
length of each constructed pavement is at least 50 ft. Three tests have been conducted in
the field, slump test; air content and unit weight. Test specimens have been taken from a
10 cubic yard truck for laboratory testing by both, UNL research team and NDOR team.
Figures 7.1.1, 7.1.2, 7.1.3, 7.1.4 show pictures during construction of test pavements.
Figure 7.1.1 Constructed Pavement
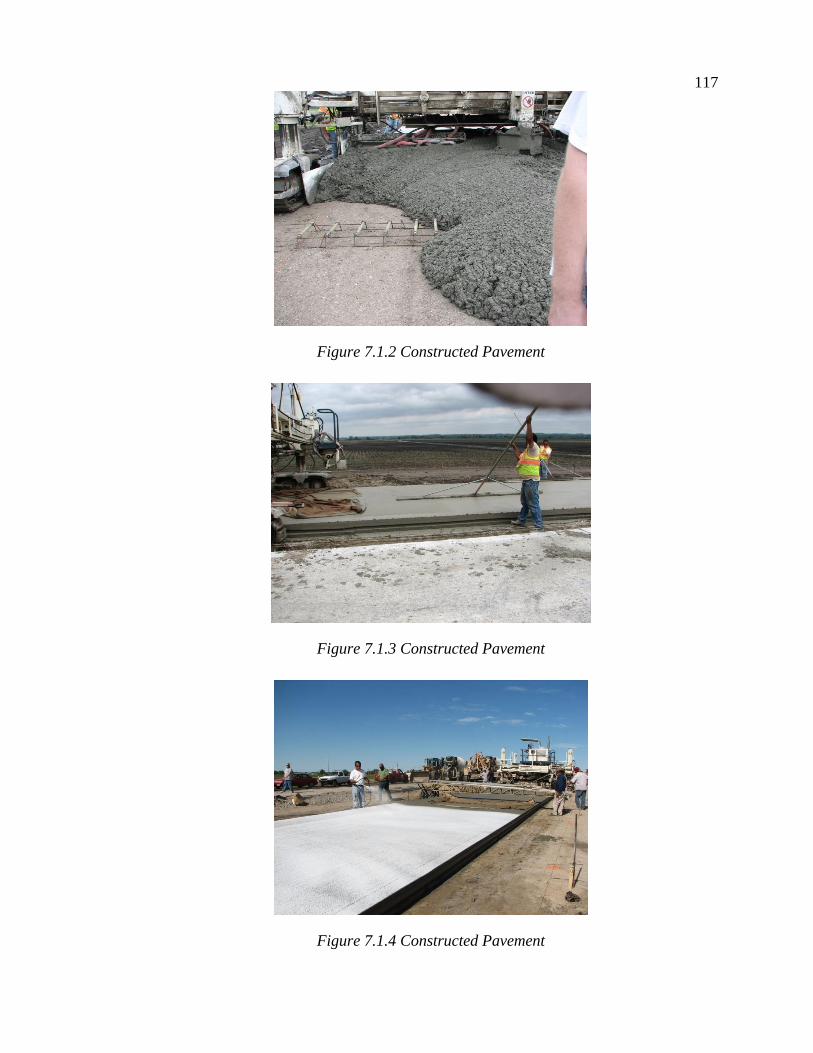
117
Figure 7.1.2 Constructed Pavement
Figure 7.1.3 Constructed Pavement
Figure 7.1.4 Constructed Pavement

118
Figure 7.1.5 Test Specimens at the field
7.2 First Location
The first location selected for test pavement was Fremont East Bypass Hwy 275 & Hwy
30. Figure 8.2.1 shows the location of the constructed pavements.
Four sections were constructed using four different mixes in two different days. Two test
pavements were constructed each day. The percentage by weight of the total cementitious
material did not meet the targeted mix designs. The mixes required for this project and
what had received on the project is stated in Table 7.2.1. The only mix that has met the
target mix is mix 6. The research team and the TAC member decided to use the mix
16C-20F-30LS as mix 15C-21F-30LS.
The locations of the two sections are:
1PF Station 36+88 to 36+65 Poured on 06/13/2008
21F-15C (Delivered to Project 20F-16C) Station 36+88 to 35+50 Poured on 06/13/2008
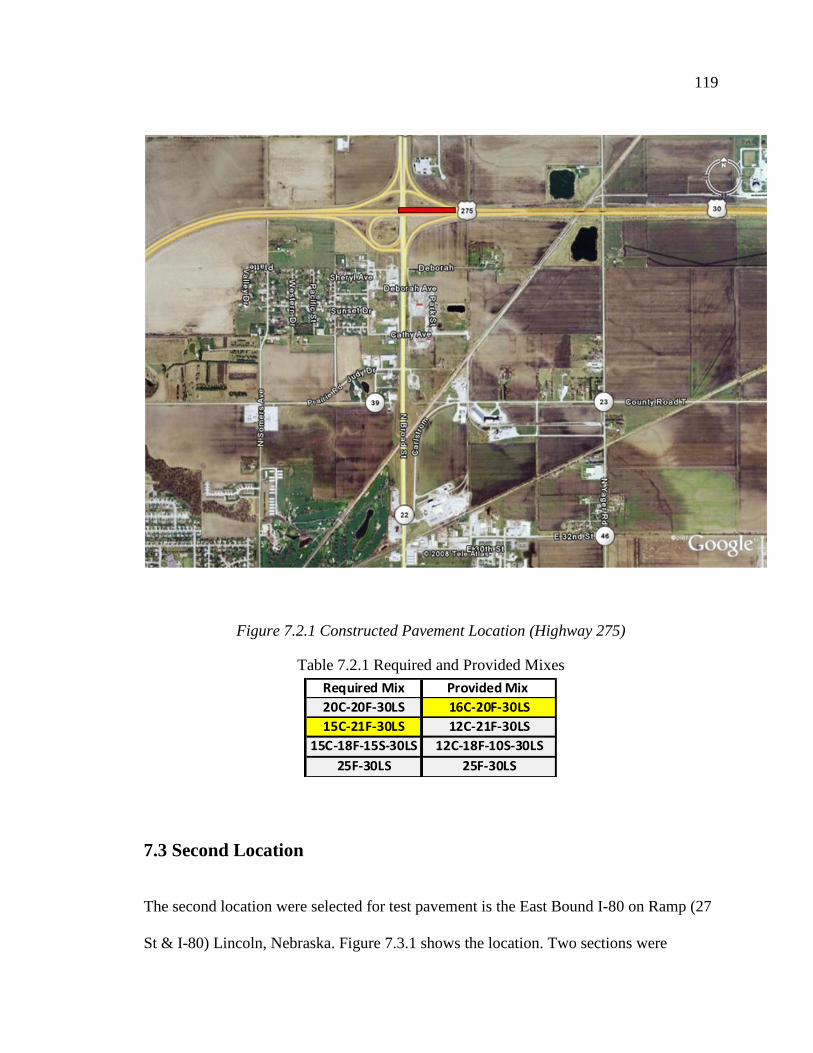
119
Figure 7.2.1 Constructed Pavement Location (Highway 275)
Table 7.2.1 Required and Provided Mixes
Required Mix Provided Mix
20C-20F-30LS 16C-20F-30LS
15C-21F-30LS 12C-21F-30LS
15C-18F-15S-30LS 12C-18F-10S-30LS
25F-30LS 25F-30LS
7.3 Second Location
The second location were selected for test pavement is the East Bound I-80 on Ramp (27
St & I-80) Lincoln, Nebraska. Figure 7.3.1 shows the location. Two sections were
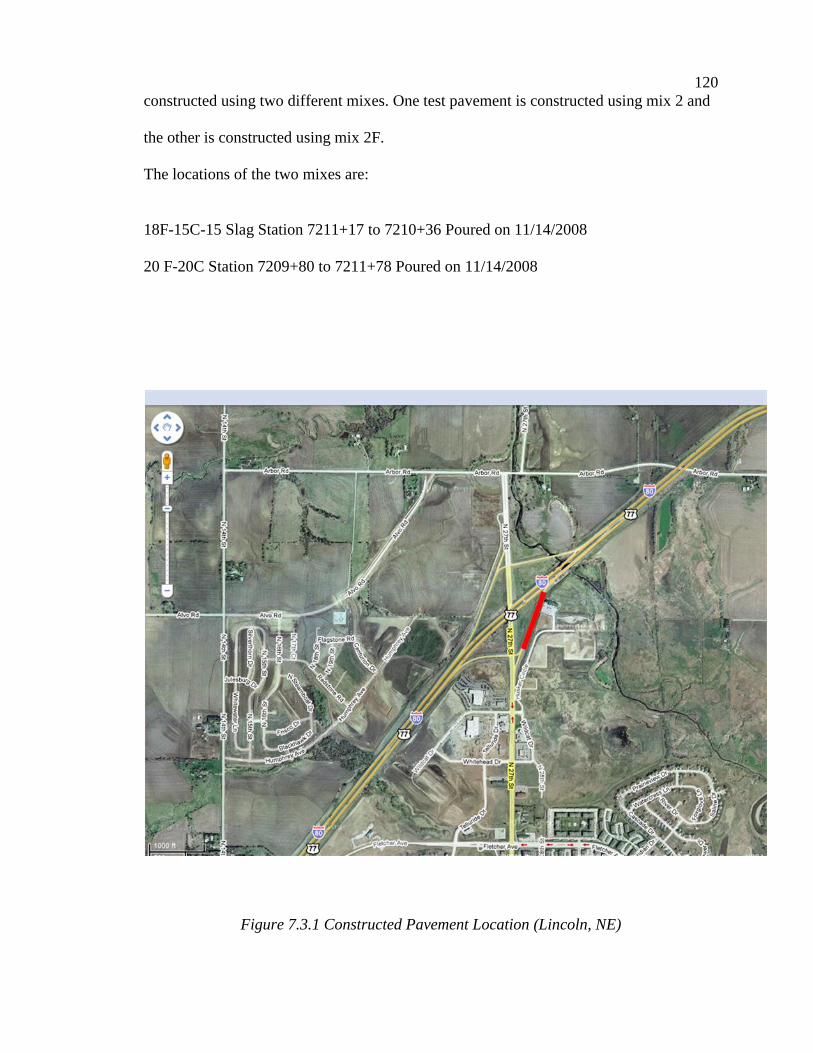
120
constructed using two different mixes. One test pavement is constructed using mix 2 and
the other is constructed using mix 2F.
The locations of the two mixes are:
18F-15C-15 Slag Station 7211+17 to 7210+36 Poured on 11/14/2008
20 F-20C Station 7209+80 to 7211+78 Poured on 11/14/2008
Figure 7.3.1 Constructed Pavement Location (Lincoln, NE)
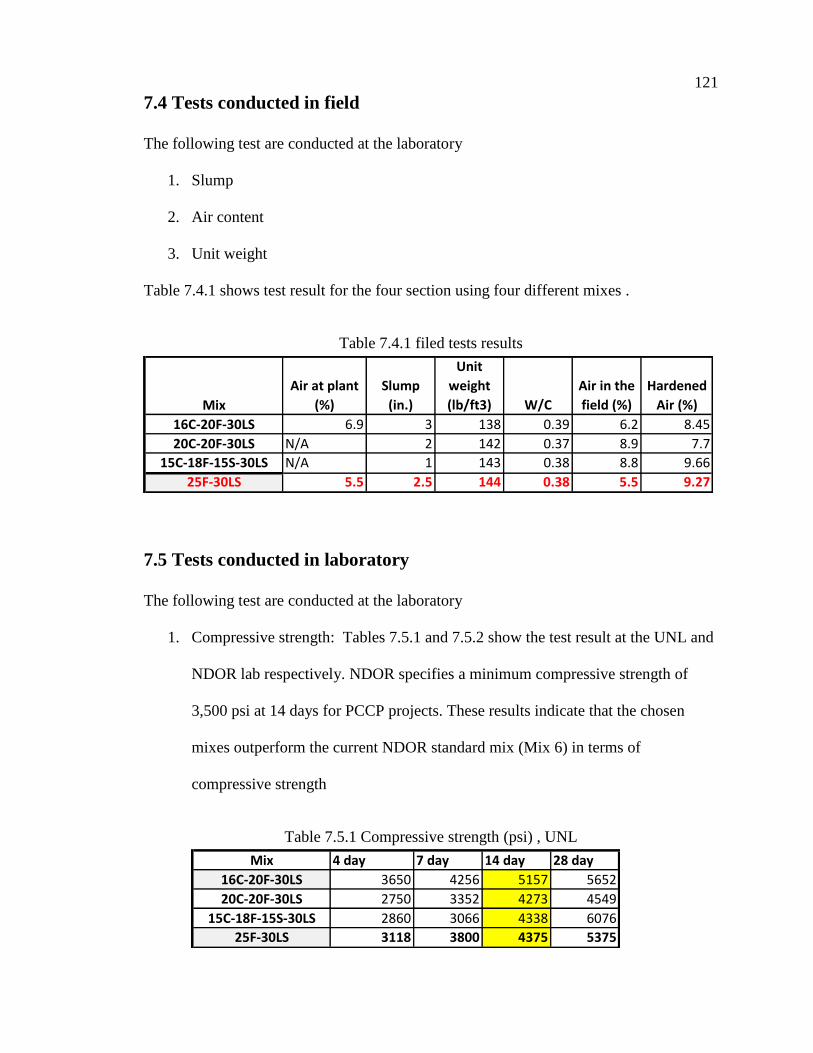
121
7.4 Tests conducted in field
The following test are conducted at the laboratory
1. Slump
2. Air content
3. Unit weight
Table 7.4.1 shows test result for the four section using four different mixes .
Table 7.4.1 filed tests results
Mix
Air at plant
(%)
Slump
(in.)
Unit
weight
(lb/ft3) W/C
Air in the
field (%)
Hardened
Air (%)
16C-20F-30LS 6.9 3 138 0.39 6.2 8.45
20C-20F-30LS N/A 2 142 0.37 8.9 7.7
15C-18F-15S-30LS N/A 1 143 0.38 8.8 9.66
25F-30LS 5.5 2.5 144 0.38 5.5 9.27
7.5 Tests conducted in laboratory
The following test are conducted at the laboratory
1. Compressive strength: Tables 7.5.1 and 7.5.2 show the test result at the UNL and
NDOR lab respectively. NDOR specifies a minimum compressive strength of
3,500 psi at 14 days for PCCP projects. These results indicate that the chosen
mixes outperform the current NDOR standard mix (Mix 6) in terms of
compressive strength
Table 7.5.1 Compressive strength (psi) , UNL
Mix 4 day 7 day 14 day 28 day
16C-20F-30LS 3650 4256 5157 5652
20C-20F-30LS 2750 3352 4273 4549
15C-18F-15S-30LS 2860 3066 4338 6076
25F-30LS 3118 3800 4375 5375
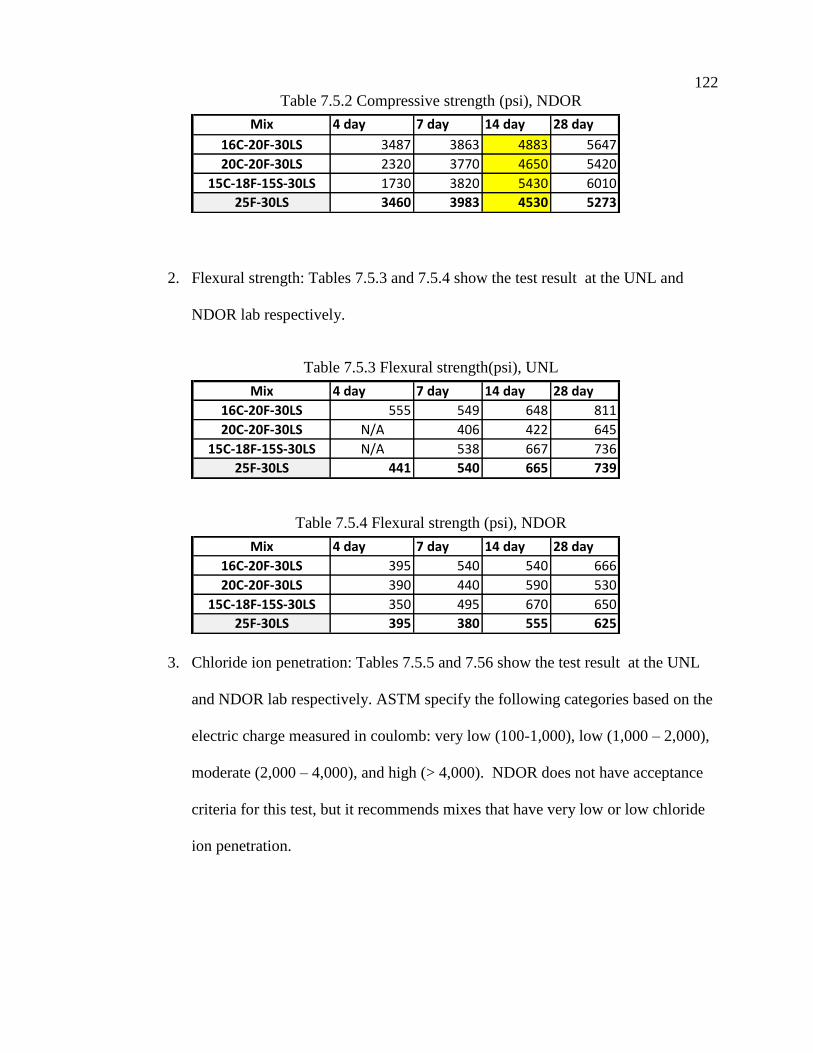
122
Table 7.5.2 Compressive strength (psi), NDOR
Mix 4 day 7 day 14 day 28 day
16C-20F-30LS 3487 3863 4883 5647
20C-20F-30LS 2320 3770 4650 5420
15C-18F-15S-30LS 1730 3820 5430 6010
25F-30LS 3460 3983 4530 5273
2. Flexural strength: Tables 7.5.3 and 7.5.4 show the test result at the UNL and
NDOR lab respectively.
Table 7.5.3 Flexural strength(psi), UNL
Mix 4 day 7 day 14 day 28 day
16C-20F-30LS 555 549 648 811
20C-20F-30LS N/A 406 422 645
15C-18F-15S-30LS N/A 538 667 736
25F-30LS 441 540 665 739
Table 7.5.4 Flexural strength (psi), NDOR
Mix 4 day 7 day 14 day 28 day
16C-20F-30LS 395 540 540 666
20C-20F-30LS 390 440 590 530
15C-18F-15S-30LS 350 495 670 650
25F-30LS 395 380 555 625
3. Chloride ion penetration: Tables 7.5.5 and 7.56 show the test result at the UNL
and NDOR lab respectively. ASTM specify the following categories based on the
electric charge measured in coulomb: very low (100-1,000), low (1,000 – 2,000),
moderate (2,000 – 4,000), and high (> 4,000). NDOR does not have acceptance
criteria for this test, but it recommends mixes that have very low or low chloride
ion penetration.
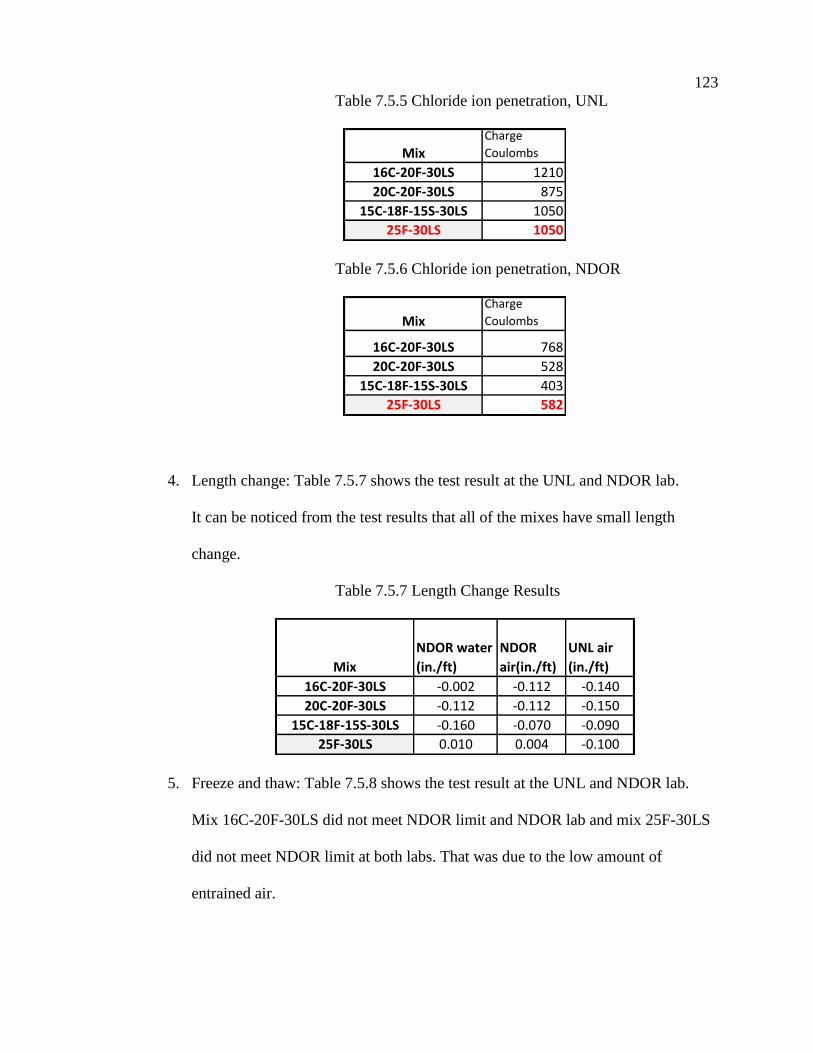
123
Table 7.5.5 Chloride ion penetration, UNL
MixCharge
Coulombs
16C-20F-30LS 1210
20C-20F-30LS 875
15C-18F-15S-30LS 1050
25F-30LS 1050
Table 7.5.6 Chloride ion penetration, NDOR
MixCharge
Coulombs
16C-20F-30LS 768
20C-20F-30LS 528
15C-18F-15S-30LS 403
25F-30LS 582
4. Length change: Table 7.5.7 shows the test result at the UNL and NDOR lab.
It can be noticed from the test results that all of the mixes have small length
change.
Table 7.5.7 Length Change Results
Mix
NDOR water
(in./ft)
NDOR
air(in./ft)
UNL air
(in./ft)
16C-20F-30LS -0.002 -0.112 -0.140
20C-20F-30LS -0.112 -0.112 -0.150
15C-18F-15S-30LS -0.160 -0.070 -0.090
25F-30LS 0.010 0.004 -0.100
5. Freeze and thaw: Table 7.5.8 shows the test result at the UNL and NDOR lab.
Mix 16C-20F-30LS did not meet NDOR limit and NDOR lab and mix 25F-30LS
did not meet NDOR limit at both labs. That was due to the low amount of
entrained air.

124
Table 7.5.8 Freeze and Thaw results
Mix NDOR UNL
16C-20F-30LS 65% 76%
20C-20F-30LS 79% 84%
15C-18F-15S-30LS 84% 81%
25F-30LS 61% 62%
6. NDOR wet and dry test: Table 7.5.9 shows the test result at the UNL and NDOR
lab. The results show that mix 16C-20F-30LS and 25F-30LS met the required
limit. However, mix 20C-20F-30LS and mix 15C-18F-15S-30LS did not meet the
limit.
Table 7.5.8 Wet and Dry test results
Mix
Durability factor
(NDOR)
Durability
factor (UNL)
16C-20F-30LS 98% 95%
20C-20F-30LS 80% 87%
15C-18F-15S-30LS 88% 94%
25F-30LS 90% 91%
7.6 Recommendation for the test sections
The TAC member and the research team recommended that NDOR will continue
monitoring these two sections to quantify how well these SCM’s mix designs performed.
125
8.0 CONCLUSIONS AND RECOMMENDATIONS
8.1 CONCLUSIONS
The objective of the project was to develop Portland cement concrete pavements PCCP
mixes containing Class C fly ash that have equal or better performance characteristics
than the current NDOR’s standard mix. It was found that Alkali Silica Reactivity (ASR)
has been the primary contributor to pavement deterioration in Nebraska due to the
widespread use of reactive aggregates. In this project, 16 mixes were identified to be
tested for ASR according to the ASTM C1567. The results of the ASTM C 1567 were as
expected. The use of Class C fly ash as the only supplementary cementitious material
(SCM) with in practical replacement quantities results in concrete mixes that do not
satisfy NDOR acceptance criteria for ASR (i.e. 28-day expansion less that 0.1% bad
English). Mixes containing Class F fly ash with 25% cement replacement showed
exceptional performance with regard to ASR resistance. The ternary mix using both
Class C and Class F showed satisfactory performance. The mixes containing ground
granulated blast furnace slag GGBFS and Class C fly showed improved performance
over using Class C fly alone, however, acceptable performance was still not achieved for
mitigating ASR. To produce acceptable ASR resistance using GGBFS, either a higher
replacement level or quaternary mixes are used. All mixes using 45% limestone and 55%
sand and gravel showed that using 45 % limestone replacement helps the ASR mitigation.
These results are very predictable since a portion of the reactive sand and gravel is being
replaced with the non-reactive limestone. This alternative aggregate gradation would not
only produce superior results with regards to ASR, but would also improve the overall
quality of the concrete. Based on the ASTM C1567 test results and material cost, four

126
mixes have been identified for overall performance testing. Overall performance testing
of these mixes has indicated that they are satisfactory in terms of slump, unit weight, air
content, setting time, compressive strength, flexural strength, freeze and thaw resistance,
length change, chloride ion penetration and wet and dry. Three of these mixes were used
in field application. Specimens were tested in the lab and confirmed acceptance of the
performance of these mixes. All three mixes had 70% Class 47B sand and gravel and
30% limestone. They had three different proportions of SCM: (1) 16% Class C fly ash +
20% Class F fly ash; (2) 20% Class C fly ash + 20% Class F fly ash; and (3) 15% Class
C fly ash + 18% Class F fly ash + 15% GGBFS.
8.2 RECOMMENDATIONS
Based on the results of the investigation carried out in this project, the following
recommendations are made:
1- Class C fly ash should not be used in relatively small quantities as the only SCM
for PCCP construction in Nebraska because it results in concrete mixes that do
not satisfy NDOR acceptance criteria for PCCP. A mix with 17% class C has
historically not performed well, and was shown in experimental work in this
project to have poor ASR performance. Mixes containing over 45% of C Ash
would have acceptable, but not exceptional, ASR. In addition they possess
properties that may not give the best overall pavement performance.
2- Aggregate composition of 45% limestone and 55% 47B sand and gravel was tried
and shown to result in mixes with better performance than those with 30%
limestone and 70% 47B sand and gravel. This is an expected finding as increased
127
limestone reduced the amount of reactive sand and gravel. The team encourages
use of larger quantities of limestone where economically feasible.
3- The two mixes recommended in this study are (1) 20C-20F-30LS (2)15C-21F-
30LS. These mixes were shown to produce pavements of equal or better quality
than the previously use 25F-30LS. Mixes that have 15% - 20% cement
replacement with Class C fly ash and a 20% -25% cement replacement with Class
F fly ash have better performance than the standard mix with 25% cement
replacement with Class F fly ash only. Mixes 1 and 2 are shown to be less
expensive than the base mix based on 2006 cost estimates.
4- The mix that had cement replacement of 15% with Class C fly ash, 18% with
Class F fly ash; and 15% with GGBFS is also recommended, as it results in the
highest compressive strength and lowest permeability. However, cost and
availability of storage silos may prohibit its use, unless a cement manufacturer
pre-blends the supplementary materials with during cement manufacturing.
128
IMPLEMENTATION
By Wally Heyen
(NDOR Material and Research)
In the late 1990’s, Nebraska Department of Roads found concrete pavement was
deteriorating years before the pavement reached its design life. Materials and Research
began an in-depth investigation of existing pavements and found extensive map cracking
(ASR), staining at the joints, low entrained air, large entrapped voids, and segregation.
The Department did a visual inspection of cores, a hardened concrete air count, ASR
Reactivity (Uranium Acetate Test) and ran Petrographic Examination. The Department
found the failure of the pavement was due to freeze-thaw, poor construction and the
possible use of a Supplement Cementitious materials (SCM) Class C Fly Ash, which did
not mitigate the ASR at 17% replacement. The Department stopped using C-Ash in 2004
and made changes to the specifications including higher air content, curing application
and consolidation of concrete. The Department also started placing new mix designs in
the field for evaluation before making any permanent changes to the specifications.
Materials and Research has monitored the three mixes (20%C-20%F, 15%C-21%F and
15%C-18%F-15%S) for approximately two years after placement of concrete in the field.
We will continue to monitor for an additional three years for a total time of five years.
Materials and Research will be looking for map cracking, staining along the cracks and
any other deterioration of the pavement. At the end of the observation, a decision will be
made whether to add the research mixes to the Department’s approved Class of Concrete
Mix Table.

129
REFERENCES
1. American Concrete Institute, “State-of-the-Art Report on Alkali-Aggregate
Reactivity”, ACI 221.1R-98,, Farmington Hills, MI.
2. American Concrete Institute, “ACI Manual of Concrete Practice, Part 2 Construction
Practices and Inspection Pavements”, 1998.
3. American Concrete Pavement Association, “Alkali-Silica Reaction (ASR): Old
Issue, New Format”, R&T Update Concrete Pavement Research and Technology,
September, 2005.
4. Ardani, A., Hussain, S., and Laforce, R., “Evaluation of Premature PCCP
Longitudinal Cracking in Colorado”, Colorado Department of Transportation, Report
No. CDOT-DTD-R-2003-1, January 2003.
5. ASTM C 1260 (2005), “Standard Test Method for Potential Alkali Reactivity of
Aggregates (Mortar-Bar Method),” American Society for Testing and Materials.
6. ASTM C 1567 (2004), “Standard Test Method for Determining the Potential Alkali-
Silica Reactivity of Combinations of Cementitious Materials and Aggregate
(Accelerated Mortar Bar Method),” American Society for Testing and Materials
7. Center for Portland Cement Concrete Pavement Technology, Iowa State University.
“Using the Air Void Analyzer for Real-Time Quality Control Adjustments in the
Field”, November 2004.
8. Copuroglu, O., Fraaij, A., and Bijen, J., “Frost Salt Scaling Resistance Improvement
of GGBFS Concrete by Na-MFP Treatment”, Proceedings, 8th
International
Conference on Concrete Pavements, Colorado Springs, CO, August 2005.
9. Donovan, R. L., “Fly Ash Usage in DOD Airfield Pavements”, REF. IPFR, Project
01-G-002-03-9 Draft 20% Report. Presented at the University of Nebraska
Roundtable Discussion on Class C Fly Ash in Pavements, July 22, 2005.
10. Farny, J. A., and Kosmatka, S. H., “Diagnosis and Control of Alkali-Aggregate
Reactions in Concrete”, Concrete Information. Portland Cement Association, 1997.
11. Federal Highway Administration, “Fly Ash Facts of Highway Engineers, 4th
ed.”,
FHWA-IF-03-019, June 2003.
12. Federal Highway Administration. “Guidelines for the Use of Lithium to Mitigate or
Prevent Alkali-Silica Reaction”, Publication No. FHWA-RD-03-047, July 2003.

130
13. Fowler, D. W. “Optimizing Aggregates in Concrete Mixtures”, Proceedings, 8th
International Conference on Concrete Pavements: PCC Mixtures and Materials
Workshop, Colorado Springs, CO, August 2005.
14. Hadley, D. W. “Field and Laboratory Studies on the Reactivity of Sand-Gravel
Aggregates”, The PCA Research and Development Laboratories, January 1968.
15. Hanson, T., Hart, J., and Schram, N., “Shilstone Gradation Using Weeping Water and
Class V, Percentage Varied”, Iowa Department of Transportation, May 2004.
16. Hanson, T., “Class V Gravel Research & Air Void System Effect on Concrete
Durability”, Iowa Department of Transportation. Presented at the University of
Nebraska Roundtable Discussion on Class C Fly Ash in Pavements, July 22, 2005.
17. Iowa Department of Transportation. “Evaluation of PCC Specification Changes
Impact of Durability: 1992 to 1997 Core Study”, Final Report for MLR-98-06, March
2005.
18. Iowa State University. Materials Analysis Research Laboratory.
http://www.marl.iastate.edu/marl/sem-eds.html
19. Iowa Department of Transportation. Materials I.M. 532.
20. Kakodkar, S., Ramakrishnan, V. and Zimmerman, L. “Addition of Class C Fly Ash
to Control Expansions due to Alkali-Silica Reaction”, Transportation Research
Record 1458, 109-117.
21. Malhotra, V.M. and Mehta, P.K., “High-Performance, High-Volume Fly Ash
Concrete: Materials, Mixture Proportioning, Properties, Construction Practice, and
Case Studies”, Supplementary Cementitious Materials for Sustainable Development
Inc., Ottawa, Canada, 2002.
22. Malvar, L.J., “TR-2195-SHR Alkali-Silica Reaction Mitigation State-of-the-Art”,.
Naval Facilities Engineering Service Center, Port Hueneme, California, October
2001.
23. Mather, B. “How to Make Concrete That Will Be Immune to the Effects of Freezing
and Thawing”, Proceedings, ACI Symposium on Performance of Concrete in
Aggressive Environment, Sand Diego, CA, October 1989.
24. Mehta, J., Olek, J., Weiss, J., and Nantung, T., “Effect of Surface Evaporation and
Slab Thickness on the Scaling Resistance of Concrete Containing Fly Ash”,
Proceedings, 8th
International Conference on Concrete Pavements, Colorado Springs,
CO, August 2005.

131
25. Naik, T. R. “What you Should Know for Achieving Durable Concrete Construction”,
Proceedings, the Cement and Concrete Institute of Mexico Symposium “World of
Concrete – Mexico”, Guadalajara, Mexico, June 1997.
26. Naik, T. R., Krause, R. N., Ramme, B. W., and Chun, Y., “Deicing Salt-Scaling
Resistance: Laboratory and Field Evaluation of Concrete Containing up to 70% Class
C and Class F Fly Ash”, Proceedings, ASTM Symposium on Concrete Durability:
Deicing Chemicals and Freezing-Thawing, Cement, Denver, CO, June 2003,.
27. Naik, T. R., Singh, S. S., and Hossain, M. M., “Permeability of High-Strength
Concrete Containing Low Cement Factor”, Journal of Energy Engineering, April
1996.
28. Rufino, D., Mallela, J., and Karter, M., “Dowel Bar and Slab Size Recommendations
Based on the Mechanistic-Empirical Pavement Design Guide”, Proceedings, 8th
International Conference on Concrete Pavements, Colorado Springs, CO, August
2005.
29. Shilstone Sr., J. M., “Portland Cement Concrete Mixtures: An Approach to
Worldwide Understanding”, Proceedings, 8th
International Conference on Concrete
Pavements, Colorado Springs, CO, August 2005.
30. Smith, G. L., “Contractor and Agency Partnership for Quality”, Proceedings, 8th
International Conference on Concrete Pavements: PCC Mixtures and Materials
Workshop, Colorado Springs, CO, August 2005.
31. Steffes, R. F., “Pavement Longitudinal Joint Construction by Joint Forming”,
Proceedings, 8th
International Conference on Concrete Pavements: Workshop on
Construction Process Control Related to PCC Pavements, Colorado Springs, CO,
August 2005.
32. Taylor, P., “CPTP Task4 Incompatibility”, Proceedings, 8th
International
Conference on Concrete Pavements: PCC Mixtures and Materials Workshop,
Colorado Springs, CO, August 2005.
33. Thomas, M.D.A. “Laboratory and Field Studies of Salt Scaling in Fly Ash Concrete”,
Frost Resistance of Concrete, Edited by M.J. Setzer and R. Auberg, RILEM
Proceedings 34, E & FN Spon, pp. 21-30.
34. Thomas, M.D.A., “The Benefits of Blended Cements in Concrete” Presentation
provided to the University of Nebraska, May 2004.
35. USACE, “Engineering and Design – Rigid Pavements for Roads, Streets, Walks and
Open Storage Areas – Mobilization Construction”, Publication No. EM 1110-3-132,
April 1984.

132
36. Wang, K. and Ge, Z., “Evaluating Properties of Blended Cements for Concrete
Pavements”, Center for Portland Cement Concrete Pavement Technology and Iowa
State University. December 2003.
37. Whiting, D.A., and Nagi, M.A., “Manual on Control of Air Content in Concrete”,
Portland Cement Association. Skokie, Illinois, 1998.
I
APPENDIX A: MEETING AT IOWA STATE UNIVERSITY
Minutes of Meeting at Iowa State University
Date: May 9, 2005
Location: Center for Transportation Research and Education (CTRE), Ames, Iowa
Attending:
Dr. Kejin Wang, assistant professor at Iowa State University, Mr. Jim Grove, PCC
Paving Engineer at CTRE, Mr. Todd Hanson, a PCC Engineer with the Iowa Department
of Transportation. Dr. Amgad Girgis, Mr. Matt Kleymann, Dr. George Morcous, Dr.
Maher Tadros, UNL.
Objective:
The objective of the meeting was to gain knowledge of research that has been
done in Iowa that could assist in the investigation of premature deterioration being
observed in Nebraska roads.
Summary of Information Presented
To begin the meeting, a brief introduction was given explaining the purpose and
scope of the research project. It was explained that a number of relatively new pavement
installations in Nebraska were experiencing premature deterioration and NDOR has
identified the use of Class C fly ash as a possible cause. Consequently, NDOR has
banned the use of Class C fly ash. The University of Nebraska is currently involved in a
research project to determine the cause(s) and possible solutions to this problem. In
addition to explaining the scope of the project, a PowerPoint presentation was also
shown. The PowerPoint was created by the Nebraska Department of Roads. It showed
examples of pavements showing premature deterioration, and of pavements not showing
II
such deterioration. The presentation also summarized NDOR’s findings which led them
to the decision to ban the use of Class C fly ash.
Research Done by Iowa
Iowa representatives discussed their knowledge on the subject. It was indicated
that Iowa had experienced similar deterioration on pavements constructed between 1984
and 1994. Just as with Nebraska roads, the deterioration started with discoloration at the
joints which is where the cracking first began. Iowa’s investigation into this problem led
them to several conclusions. It was their opinion that that there was no inherent chemical
problem with Class C fly ash. However, they found that the Class C fly ash potentially
could lead to deterioration problems such as lowered resistance to ASR attack and
ettringite formation. However, the most significant of these problems was a poor
entrained air void system which they believed was the underlying cause of the premature
deterioration. Other factors contributing to possible deterioration included paving
machine vibration, use of certain deicing chemicals, method and timing of cutting control
joints, and sealing of control joints.
The use of Class C fly ash can create a relatively stiff mix with low workability.
This is attributed to high initial water demand and cementitious properties of Class C fly
ash. Therefore, in order to place this concrete, contractors had to increase water content
and amount of vibration, negatively impacting the air void system. An analysis was done
on cores taken from poor performing pavements in Iowa. It was found they did not
possess adequate air content. The mortar air content in the cores was well below the
recommended value. In addition, the concrete air content was well below the Iowa DOT
specifications. When the spacing factor was analyzed it was observed many of the
pavements had spacing factors well above the recommended value of 0.200 mm. It was
III
also observed that the air void systems were significantly worse at the top of the core and
that the cracking was commonly confined to the top 6 inches. Since the cracking was
commonly found in the top of the core where the air content was much lower, it was
believed that the deterioration was a cause of a substandard air system.
In 1994, the Iowa DOT implemented changes in their specifications. Previously,
specifications called for a target air content of 6 ± 1 % and a minimum vibration of 7000
vpm’s with no maximum value. After 1994 a new target air content of 7 ± 1% was
specified. In addition, vibration specifications were changed to a range of 5000 to 8000
vpm’s. Since adoption of the new specifications, pavements experiencing the premature
deterioration have been greatly reduced. In addition, cores of the good performing
pavements were analyzed. These cores showed the air content in the mortar was above
the recommend value of 9% and the air content of the concrete was above the
specification of 6%. It was also observed that good performing pavements all had
spacing factors below 0.200 mm, while the poor performing pavements had spacing
factors above 0.25 mm. These results confirmed their belief that the cause of the
deterioration was an inadequate air void system.
Recently, Iowa DOT has adjusted their specification for air content to further
ensure an adequate air void system. The specifications require an air content of 6% plus
the loss from the paver, +1.5/-1 %. Therefore, once a day the air content is measured in
front of and behind the paver. The calculated loss of air is then added to the 6% and that
is the value for the target air content +1.5/-1 %. For example, if the loss of air due to
paving is 1.75%, the specifications call for air content ahead of the paver is 7 plus 1.75
plus 1.5 = 9.25 or 7 plus 1.75 minus 1 = 7.75, i.e. between 7.75 and 9.25.
IV
In addition, Iowa is using ternary mixes with 40% replacement of cement. The 40%
replacement includes 20% Class C fly ash and 20% Ground Granulated Blast Furnace
Slag. The use of slag along with the Class C fly ash creates a mix that has a higher
workability, lower permeability and higher resistance to ASR than mixes containing
Class C fly ash alone.
During further discussion, it was mentioned that fly ashes used from a plant in
Council Bluffs, during the late 1980 and early 90’s were of bad quality due to the
methods being used to burn the coal. They felt that some of the problems seen in
pavements during those years may have been partially caused by these fly ash sources.
Nebraska most likely would have experienced similar problems which could have had
some responsibility in the premature deterioration being seen. However, improvements
to the coal burning operations in recent years have greatly increased the quality of fly ash
being produced there. It was also asked if they felt there was any advantage to inter-
grinding fly ash with the cement. It was their opinion that realistically there was no real
advantage to inter-grinding the fly ash other than for convenience (This was consistent
with Dr. Mike Thomas’ position when he was in Lincoln on April 1, 2005).
There was a short discussion concerning the effectiveness of an Air Void
Analyzer. The AVA is used to evaluate the air void system of freshly placed concrete.
Even though the AVA samples only the top layer of the concrete, it is their opinion that it
still represents a reasonably accurate description of the air void system since the top layer
of the concrete typically has the worse air content. Therefore, this test can give a
reasonably accurate indication of the concrete’s ability to resist freeze thaw attack.
V
The experts at CTRE and Iowa DOT indicated that they doubted the type of the air
entraining agent used in the concrete mix would have a significant impact on the
performance of the hardened concrete pavement.
Recommendations Provided
According to the petrographic analysis done on cores taken from Nebraska
pavements and studied by CTRE experts, almost all the pavements have a poor air void
system. As was the case in Iowa, there is a significant difference between the air content
at the top and bottom of the core. Although, there was a small amount of ASR gel found
in the cores this could not have been the primary cause of the severe cracking that was
observed. In addition, the air voids were extensively filled with ettringite which further
degraded the air void system.
Several other issues were discussed regarding Nebraska’s current mix design and
specifications. It was suggested that it may be advantageous to either use a higher
replacement level of Class C fly ash or ternary mixes. CTRE personnel agreed that mixes
with about 35% (by weight) Class C fly ash, 20% Class C and 20% slag, or 20% Class C
and 20% Class F, could have promise for good results. Such mixes would have low
permeability as well as high resistance to ASR. Note that studies have demonstrated that
more Class C fly ash is needed (about 20-25%) to have the same ASR resistance as Class
F (about 15-20%). Lower values would offer little help and in some cases can even add
to the problem. The 17% Class C fly ash that has historically been used in Nebraska may
not be the most effective cement replacement value.
The current specification (2005) in Nebraska for percent air content is 5.0 to 7.5
percent. However, since this value is for concrete in front of the paver, it was suggested
that this may be too low. In addition, Nebraska currently uses Magnesium Chloride as its
VI
deicing chemical. According to CTRE and Iowa DOT experts, this can be detrimental to
Portland cement concrete.
Summary:
The meeting at Iowa State was extremely helpful to the progress of our study.
The team from Iowa was very knowledgeable and willing to help. In their opinion, the
deterioration being seen in Nebraska roads is most likely due to the same type of
problems that Iowa had been seeing. They suggested that Class C fly ash is probably not
directly responsible for the deterioration although it may be leading to some the problems
causing the deterioration. A substandard air void system could be mostly responsible for
the deterioration. Several steps were suggested to ensure an adequate air void system
such as increasing the specifications for target air content as well as putting limitations on
vibrator frequencies. A change in the mix design would also be very helpful. In
addition, other factors such as joint cutting, joint sealing and deicing chemicals need to be
evaluated.
The following references were handed out at the meeting.
1. Iowa Department of Transportation. Importance of Well Entrained Air Void System
on Concrete Durability.
2. Iowa Department of Transportation. Evaluation of PCC Specification Changes
Impact on Durability: 1992 to 1997 Core Study. Final Report for MLR-98-06.
March 2005.
3. Iowa Department of Transportation. Fly Ash Affect on Alkali-Aggregate Reactivity.
Final Report for MLR-88-7. June 1989.
VII
4. Detwiler, R.J., Taylor, P.C. and Powers, L.J. Ettringite Deposits in Air Voids.
Transportation Research Record: Journal of the Transportation Research Board, No.
1893, National Research Council, Washington, D.C., 2004.
5. Kakodkar, S., Ramakrishnan, V. and Zimmerman, L. Addition of Class C Fly Ash to
Control Expansions due to Alkali-Silica Reaction. Transportation Research Record
1458.
6. Schlorholtz, S., and Bergeson, K.L. Evaluation of the Chemical Durability of Iowa
Fly Ash Concretes. Iowa Fly Ash Affiliate Research Group, ERI 93-411, Iowa State
University, March 1993.
VIII
APPENDIX B: UNIVERSITY OF NEBRASKA WORKSHOP
Minutes of Roundtable Meeting at the University of Nebraska - Omaha
Date: July 22, 2005
Location: Peter Kiewit Institute, Omaha, NE
Attending:
Dr. Ramon L. Carrasquillo, P.E., Carrasquillo Associates
Dr. Tarun R. Naik, P.E., Professor at the University of Wisconsin Milwaukee
Mr. Todd Hanson, P.E., PCC Engineer with the Iowa DOT
Mr. William E. Cook, P.E., Material Engineer with Iowa DOT
Mr. Kevin Merrymann, P.E., PCC Field Engineer with Iowa DOT
Dr. Kejin Wang, Assistant Professor at Iowa State University
Mr. Jim Grove, P.E., PCC Paving Engineer at the Center for PCCP Technology
Mr. Richard L. Donovan, P.E., Paving Materials Expert with USACOE
Mr. Moe Jamshidi, Materials and Research Engineer with NDOR
Mrs. Amy Starr, Research Engineer with Nebraska Department of Roads
Mrs. Lieska Halsey, Research Engineer with Nebraska Department of Roads
Mr. Mick Syslo, P.E., Pavement Design Engineer with NDOR
Mr. Thomas J. Schroeder, Fossil Fuels Manager with NPPD
Mr. Billy Wendland, Assistant Unit Train & Track Coordinator with NPPD
Mr. Richard M. Kotan, P.E., Manager of Rail Operations with OPPD
Mr. Ron Boro, Manager of Fossil Fuels with Omaha Public Power District
Dr. Maher K. Tadros, P.E., Charles J. Vranek Distinguished Professor at UNL
Dr. Amgad Girgis, Research Assistant Professor at UNL
Dr. James Goedert, P.E., Dept. of Construction Systems Chair at UNL
Dr. George Morcous, P.E., Assistant Professor at UNL
Dr. Yong-Rak Kim, Assistant Professor at UNL
Dr. Joseph Benak, Professor at UNL
Mr. Matt Kleymann, Research Assistant at UNL
Objective:
Determine ways for allowing the use of Class C fly ash in pavements while still
meeting expected performance criteria.
Summary of Presentations
Moe Jamshidi - Nebraska Department of Roads
IX
The Nebraska Department of Roads gave a presentation on their research which
led to the decision to ban Class C fly ash. They began noticing that pavements less than
10 years old were displaying severe deterioration. In June 2003 they started to
investigate such pavements as well as pavements that were performing well. The scope
of the project included compiling project backgrounds, visual inspections, core
extractions as well as laboratory tests such as air void analysis, petrographic examination,
ASR reactivity tests, and mechanical properties tests. After phase I of the project it was
concluded that all pavements exhibiting premature deterioration had in common the
following variables: (1) poor air system, (2) large entrapped air voids, (3) type I/II cement
batched with Class C fly ash, (3) poor drainage, and (4) no load transfer.
The same investigation was done in phase II which examined pavements that
were performing well. It was concluded that the following variables were common to all
good performing pavements: (1) low entrained air, (2) inter-ground cements (IPN/IPF),
(3) cements batched with Class F fly ash, (4) high compressive strength, (5) poor
drainage, and (6) no load transfer. After comparing the pavements from phase I and
phase II, NDOR concluded that the only substantial difference between the good and bad
performing pavements was that the poor performing pavements all had type I/II cement
batched with 17% Class C fly ash. Therefore, Class C fly ash was banned from use in
concrete pavements.
Currently NDOR is involved in ongoing research to address some of the issues
being seen in Nebraska pavements. They are in the process of requiring additional air
content and have made improvements to the drainage design. NDOR feels that the
premature deterioration starts with ASR and is probably advanced by freezing and
thawing. They have done testing with various ternary and quaternary mixes that have

X
promising results. They have seen that ASTM C 1567 is a very reliable indicator of good
and bad performing pavement. Therefore, any potential future mixes must be able to pass
this test.
After NDOR’s presentation a brief discussion was held. Dr. Carrasquillo believed
that it was extremely important to understand the mechanism of the distress in order to
find the proper steps to mitigate it. One way to do this is to try and duplicate the
deterioration. He suggested taking cores from pavements showing premature
deterioration, but to take the cores away from the area were the distress can be seen.
Then using accelerated exposure tests, try to duplicate the deterioration.
Dr. Naik raised concerns with the potential upcoming changes to the air content
specifications. By specifying such a high percent for air content in front of the paver,
approximately 8-12%, it is difficult to determine what the final strength of the concrete
will be. Therefore, contractors need to be aware that the strength of the concrete in front
of the paver will be significantly lower than concrete behind the paver due to the change
in air content. However, NDOR as well as IDOT added that strength is not really an
issue of concern for them and that by specifying a minimum amount of cementitious
material they are confident that they will achieve adequate strength.
Dr. Ramon Carrasquillo said that anytime Class C fly ash is used as a SCM, there
is the concern of chemical reactions. He added that staining of the concrete such as what
is seen in Nebraska pavement could be an indication of the presence of a gel formed from
a chemical reaction.
The team from the IDOT noted that they have experience extremely similar
deterioration problems during approximately the same time period. However, it is
difficult to compare pavements of the two states because of the difference in aggregates.

XI
Iowa uses a far less reactive fine sand compared to Nebraska’s sand and gravel. Also,
Iowa is able to use a higher percentage of limestone. The combination of these
differences makes Iowa’s pavements far less susceptible to ASR. It was added that in
both states the deterioration, especially in its later stages, appeared to be a result of freeze
thaw failure. It could be that there is something different triggering the deterioration that
eventually leads to a similar type of distress.
Todd Hanson – Iowa Department of Transportation
Mr. Todd Hanson, a PCC engineer with the Iowa IDOT gave a presentation on
research done with Class V gravel and the importance of an adequate air void system on
concrete durability. Starting in the 1940’s a research study was done between Nebraska
and Kansas to investigate map cracking that was being seen. It was shown that the sand
and gravel aggregates used in Nebraska and Kansas are reactive, especially the portion of
the gravel that is + #4. The exact mechanism of the cracking was not determined, but it
seemed to be related to surface shrinkage caused by severe drying and Alkali-Silica
Reaction. Limestone “Sweetening” was effective in controlling the deterioration as well
as some pozzolans although it was unclear why. It was concluded that more research was
need at that time (1968).
Mr. Hanson also presented research done by Ash Grove with Type IPF cement
and Class C fly ash. The four mixes that were experimented with were a straight type I/II
mix, Duracem F, and Duracem F w/ 20% C ash. All of these mixes showed similar
strength performance. The mix using Duracem F w/ 20% C ash showed the lowest
expansion for the ASTM 1260 test. However, the study showed that such mixes may
have a significantly increased set time.
XII
Iowa has experience very similar problems in pavements constructed between
1984 and 1994. An investigation into these pavement showed that almost all contained
an inadequate air void system. Therefore, in 1995 changes were made to the
specifications requiring an increase in air content to 7 ± 1% as well as range for vibration
frequency from 5000 to 8000 vpm’s. According to the IDOT, no pavement constructed
after 1995 has shown signs of premature deterioration. A study of these pavements
showed that the pavements constructed after 1995 have greatly increased air content as
well as much smaller spacing factors.
Currently Iowa is using ternary mixes with slag and Class C fly ash. It
specification for air content is 6% (+Paver Loss) +1.5/-1%. Recent pavements have also
been constructed using 55% Class V Gravel (Platte River sand and gravel) and 45%
Limestone. The pavements have used type IP cement (type I/II blended with 17%
calcinated clay) and 15% Class C fly ash.
According to studies down in Iowa, the primary cause of the deterioration being
seen was an inadequate air void system. A study done on vibration in 1995 showed that
vibrating had a large influence on air content and vibrator trails could be seen were
pavements were over vibrated. This deterioration was not directly related to the use of
Class C fly ash. However, often when cement with dehydrated gypsum was used with a
reactive ash, the C3A would react with the gypsum creating a flash set. The contractors
would then have to over-vibrate the concrete in order to place it.
Richard Donovan – US Army Corps of Engineers
In Mr. Donovan’s presentation, a brief overview of the evolution of using fly ash
by the USACOE was given. In 1983, in response to EPA RCRA guidance, Class F or C
fly ash was allowed with selected optional requirements and replacement at 20% of

XIII
cementitious volume. In 1987, both Class C and Class F ash were required to have a
maximum LOI of 4% and 15-35% replacement of cementitious mass was used. In 1997,
the requirement for LOI was reduced to 3% for freeze thaw environments.
In 2002, in response to Public Law 106-398, ASTM C 1260 was used to identify
reactive aggregates. For non-reactive aggregates, the requirements are those set in 1997.
For concrete using reactive aggregates, Class F fly ash was required with a CaO limit of
8%. The percent replacement was determined based on the modified ASTM C 1260 or C
1567.
In 2004 new specifications were implemented. For non-ASR reactive aggregates
Class F or slag was to be used at 15-35% replacement by mass. The use of Class C fly
ash is not permitted. For ASR reactive aggregates, Class F fly ash with a CaO limit of
8% is required with the replacement percentage determined by ASTM C 1567.
Based on their study, fly ashes with higher CaO require much higher replacement
levels to effectively mitigate ASR. The replacement percentage needed to control ASR
varies with the source of aggregate. For use with some aggregates, replacement levels of
35% still won’t effectively control ASR. Using high amounts of Class C fly ash also
raises a host of other concerns such as constructability, shrinkage potential, set time and
loss of aggregate interlock. Ternary mixes are not used by the USACOE because of the
limited number of silos available during the construction of airfields.
It was also suggested that the use of deicers, particularly Potassium Acetate, when
used with a high lime fly ash, will greatly increase ASR expansion. It was found that in
some case where materials were shown to be innocuous by ASTM C 1567, the presence
of Potassium Acetate made these materials reactive.
XIV
During the presentation by Mr. Donovan it was noted by the team from Iowa that
ASTM C 1260 (or 1567) is very conservative. Some aggregates and mixes in Iowa that
have been proven to be successful, fail the test. Almost, everything that Iowa uses will
fail the test, but perform well in the field. They have also found that the test is very
dependent on the cement that is used and also seemed to correlate with the amount of
magnesium present. However, NDOR’s experience is that for Nebraska aggregates,
ASTM C 1567 is consistent regardless of cement source.
Tarun Naik – University of Wisconsin Milwaukee
Dr. Naik’s presentation was focused on using coal ash to manage ASR. He
explained that for Alkali-Silica Reaction to occur there must be three conditions present.
There must be sufficient alkali in the concrete, presence of reactive aggregates and
sufficient moisture. Therefore there are different ways to mitigate ASR. A reduction in
the total available alkali will minimize ASR, which can be accomplished by using low
alkali cement. The use of a mineral additive can be effective by consuming alkalis during
the pozzolanic reaction and effectively reduce the total available alkalis. ASR can also
be minimized by controlling the moisture in the concrete. This can be accomplished
several ways such as improving the impermeability of the concrete, reducing the gel pore
size or reducing the ingress of water into the concrete. Also, using a water reducer to
lower the necessary water demand will help.
The effectiveness of using Clean-Coal Ash or CCA was discussed. Test data was
presented using several mixtures incorporating combinations Class C, Class F and Clean-
Coal Ash. These mixes were non-air entrained. According to Dr. Naik it is easier to
manage non-air entrained concrete in the lab because it eliminates the variable of mixes
having different air content. Based on ASTM 1260, the mixes that were most effective in
XV
controlling ASR expansion were the ones using large amounts of CCA. Particularly,
20% C ash with 60 % CCA and 0% Na2SO4 or 20% F ash with 60% CCA and Na2SO
4 of
4%. Generally, Clean-Coal Ash was most effective in controlling ASR, followed by
Class F ash then Class C ash. Using coal ash creates pozzolanic reactions in the concrete
that consumes the alkali, reduces the gel pore size and mobility of the alkalis, controlling
ASR expansion.
The state of Wisconsin has relatively non-reactive aggregates and allows 35% of
either Class C or Class F fly ash. However, Class F fly ash is not readily available in
Wisconsin so most pavement projects use Class C fly ash.
Kejin Wang – Iowa State University
Dr. Wang presented common causes of deterioration and the effect of fly ash on
these types of deterioration. Some of the common causes of deterioration in pavements
are shrinkage, freezing-thawing, cement aggregate reaction (CAR), and other various
problems such as abnormal setting or poor workability.
The use of fly ash generally reduces free shrinkage in concrete. Free shrinkage is
the shrinkage of mortar samples that are not restrained from shrinking by aggregates or
other means. Typically, at a given consistency, the higher the percent fly ash the lower
the free drying shrinkage. Since the samples are kept at a given consistency, for a higher
dose of fly ash a lower amount of water is need to achieve the desired consistency.
Therefore, this confirms that a reduction in water will reduce shrinkage.
Since freeze-thaw resistance is direct function of a concrete’s air void system, the
use of fly ash has no major effect on freezing-thawing durability if the strength and air
content are kept constant. However, since some fly ashes have slow strength gains, the
concrete may not have sufficient strength at a given time. In addition, some fly ashes will

XVI
increase the dosage of AEA needed, depending on the fly ash’s LOI and fineness. It was
her recommendation to check the air content in front of and behind the paver to ensure
that proper air content is being achieved in the placed concrete. It is also important to
have an adequate spacing factor (< 0.2mm) which generally decreases as the air content
increases. It was pointed out by Dr. Carrasquillo that for a given air void system,
concrete with fly ash will generally have higher resistance to freezing and thawing
because the decrease in permeability will reduce the ingress of moisture.
Another common cause of deterioration is cement-aggregate reaction such as
ASR. The effectiveness of fly ash in reducing the expansion to such reactions is very
dependent on the fly ash being used therefore it is important to analyze the fly ashes
chemistry. It has been shown that the amount of CaO, MgO, SO3 can have an effect on
how well a given fly ash can mitigate expansion due to chemical reactions. The amount
of soluble alkali can also have an effect on the dosage of fly ash required to control
expansion. It is important to realize what type of gel in being formed during the cement-
aggregate reaction, as different gels with different compositions can cause different
degrees of expansion.
The use of fly ash in concrete pavements can cause other problems such as
abnormal setting and reduced workability. According to ACI Comm. 226 all Class F and
most Class C fly ashes will increase the time of setting. However, some C ashes with
high amounts of free lime and calcium content can have reduced set time and
workability. This can lead to other problems such as over or under consolidation.
Dr. Wang concluded that many factors such as the chemistry and reactivity of a
given fly ash can have a significant effect on concrete durability. Controlling things such

XVII
CaO, MgO, soluble alkali and sulfate content may be important steps in producing a
durable concrete.
Maher Tadros - University of Nebraska
A brief presentation was given by the University of Nebraska describing the
issues that they will investigate as well as potential mixes using Class C fly ash. The
issues included ensuring an adequate air void system, the effect of deicing salts, chemical
reactions such as ASR or sulfate attack, and cutting and sealing joints. The University
Nebraska presented three classes of mixes that looked promising. The mixes were: (1)
40% replacement of cement with Class C fly ash, (2) 40% replacement of cement with a
combination of Class C and Class F fly ash, and (3) 40% replacement of cement with
Class C fly ash and Ground Granulated Blast Furnace Slag.
General Discussion
The general consensus of the group was that Class C fly ash could be used in
Nebraska pavements although extensive research was needed to determine the processes
causing the deterioration and to develop a mix that would mitigate such problems.
Dr. Tarun Naik commented that the mix using 20% Class C and 20% Class F fly ash
would be a very good mix with respect to ASR resistance. NDOR and IDOT both agree
with this comment and said that their testing has shown this mix to be very effective in
reducing expansion as well as having extremely low permeability. In addition, Dr.
Carrasquillo suggested that with the chemical composition of Nebraska’s fly ash, 40%
Class C fly could be a very good mix. A concern was raised by Dr. Naik that higher
replacements such as 40% may raise other durability issues such as salt scaling because
of the lower cement value. His suggestion was to replace 20% of the cement with Class
XVIII
C fly ash and then add an additional 20% Class C fly ash as a replacement of the finest
particles of the fine aggregate. The total 40% Class C fly ash would greatly reduce
expansion from ASR, while the mix would still maintain a cement factor similar to that of
current NDOR mixes.
NDOR added that is would be unwise to conclude that what works in Iowa will be
guaranteed to work in Nebraska. Nebraska has different sources and availability of
materials, mainly aggregates, that makes it more difficult to produce a durable pavement.
Unlike Iowa, Nebraska is forced to use reactive sand & gravel and is limited to using
only 30% limestone because of availability. NDOR did add that Iowa is doing good
things, especially with air content and drainage which are all issues that are being
investigated. In addition, Todd Hanson mentioned that although Iowa is now using
ternary mixes, for several years after the new specifications for air content, they
successfully used type I/II cement batched with Class C fly ash.
Although there were some conflicting opinions on how reliable of an indicator
ASTM C 1260 is of a concrete resistance to ASR expansion, everyone agreed that it was
at least on the conservative side. According to NDOR, their research shows that all
mixes that fail ASTM C 1260 fail in the field and that all mixes that pass ASTM C 1260
perform well in the field. Therefore, they feel very adamant about using the test as an
indicator of a concrete’s performance in the field. The three main tests used by NDOR to
determine a concrete’s durability are ASTM C 666 freeze-thaw test, NDOR’s wet-dry
test, and modified ASTM C 1260 (1567) ASR expansion test. Dr. Carrasquillo added
that it is important to establish an appropriate baseline for analyzing the performance of
mixes during these tests. Although mixes using IPF cement have performed very well, it
XIX
may not be a fair baseline since lesser performing mixes may still be adequate in the
field.
There was also a discussion on using blended or inter-ground cements. It was
agreed upon that having fly ash blended or inter-ground by the cement manufacturer
produces a far better product then having it batched at the ready-mix plant. This is
contrary to what other experts have said, but it was agreed upon by the panel members
that cement manufacturers are better able to control the chemical composition of the fly
ash and cement and are able to produce a much better product. It was suggested that a
meeting be held with representatives from various cement manufacturers to discuss the
possibility of marketing a product that pre-blends cement with either C ash, F ash or both.
It was discussed that such a product could be very attractive for not only Nebraska, but
Kansas and Iowa as well.
There was also a short discussion on phase II of the project. It was suggested by
NDOR that UNL focus on developing a mix that has high chemical durability, especially
against Alkali-Silica Reaction. They felt that other issues such as type of deicing salt, air
content/vibration, as well as methods of cutting and sealing joints were common concerns
for all concrete pavements regardless of whether or not fly ash was used and should be
investigated in separate projects. These issues have been and are continually being
investigated by NDOR and need not be the focus of this project. It was also suggested
that only one source of aggregate be used in the mixes. The aggregate will be an eastern
Platte river sand & gravel and should provide a good representation of Nebraska’s
aggregates. Dr. Carrasquillo advised to keep as many things constant as possible and
focus on a single issue such as resistance to ASR.
Summary of Recommendations
XX
It is extremely important to understanding the mechanism of the distress so that
proper steps can be taken to mitigate it.
Although something else might be initiating the deterioration, an adequate air void
system is vital in achieving a durable concrete.
There is no “one size fits all” for replacement levels needed to control ASR and the
percent replacement with fly ash should be determined from testing, particularly
ASTM 1567.
There are several ways to control ASR in concrete such as reducing the total available
alkali, consuming alkalis with pozzolanic reactions and controlling the moisture in the
concrete.
Many factors affect the ability of a given fly ash to limit expansion due to ASR.
Controlling things such as CaO, MgO, soluble alkali and sulfate content may be
important steps in producing a durable concrete.
It was expressed by the group that all 3 proposed mixes could be successful and
should be further investigated with lab testing. A particular favor was shown towards
a ternary mix with both Class C and Class F fly ash.
Dr. Tarun Naik suggested an additional mix using 20% replacement of cement with
Class C fly ash and then add an additional 20% C ash as a replacement of the finest
particles of the aggregate.
It was suggested that for this project UNL focus on developing a mix that has a high
resistance to chemical attacks, particularly ASR. Other issues such as air content and
XXI
deicing chemicals are common concerns of all pavements regardless of the mix
design and should be addressed in a separate study.
NDOR felt that for a mix to be able to produce a durable pavement it must pass
ASTM 1567, ASTM 666 and NDOR’s Wet-Dry test. However, it was suggested that
is very important to establish a baseline in order to determine what “passes” these
tests.
Additional tests may be required since mixes with high replacement levels can have
other problems such as salt scaling and time of set.
It was agreed upon that having SCMs pre-blended or inter-ground produces a far
better product then having it batched at the ready-mix plant.
One cannot conclude that what works in Iowa will work in Nebraska. Nebraska has
more reactive aggregates and is restricted by the availability of limestone.

XXII
APPENDIX C: PICTURES OF PREMATURE DETIORATION
Signs of deterioration at 84
th and Holdrege, Lincoln, Nebraska:
Staining of Transverse and Longitudinal Joints
Staining of Transverse Joints

XXIII
Cracking Running Adjacent to Free Edges and Joints
Cracking Running Adjacent to Free Edges and Joints
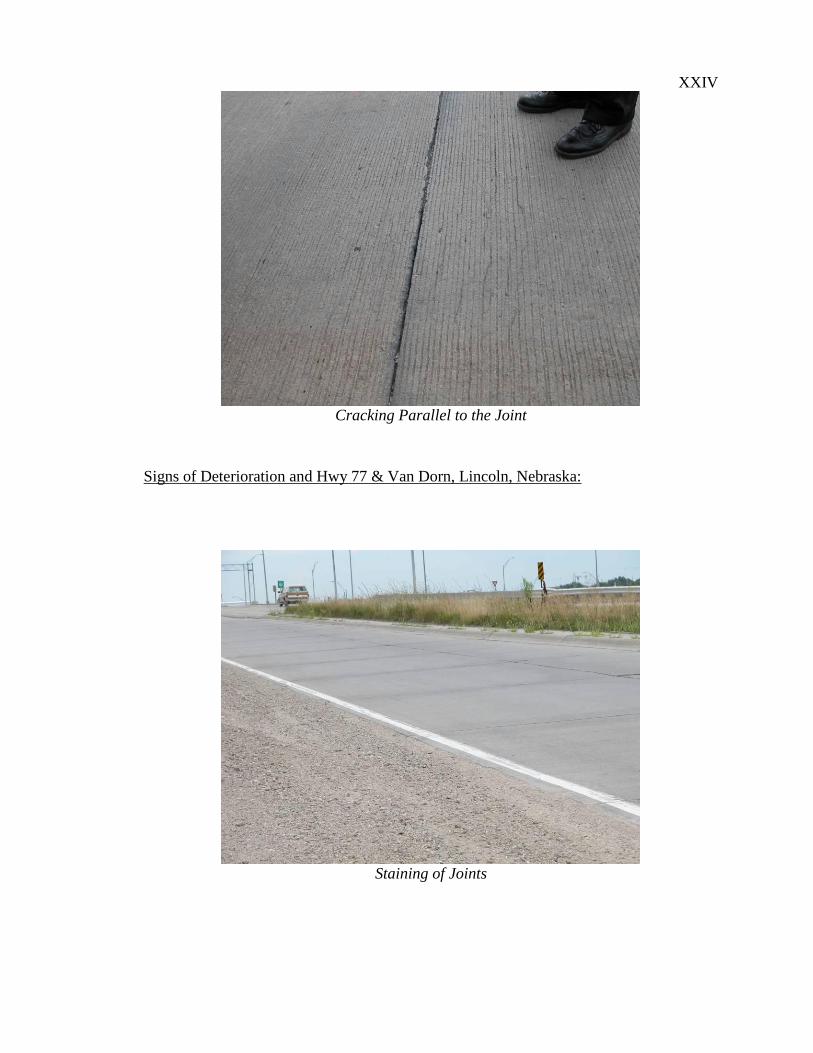
XXIV
Cracking Parallel to the Joint
Signs of Deterioration and Hwy 77 & Van Dorn, Lincoln, Nebraska:
Staining of Joints
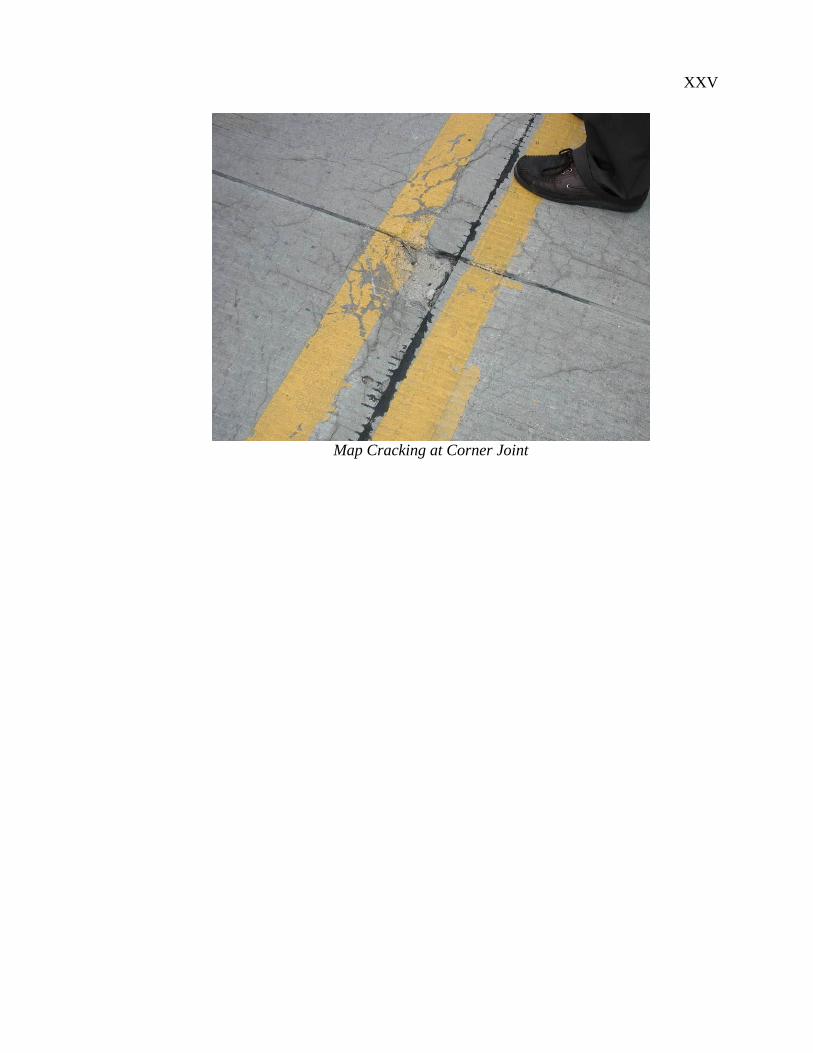
XXV
Map Cracking at Corner Joint
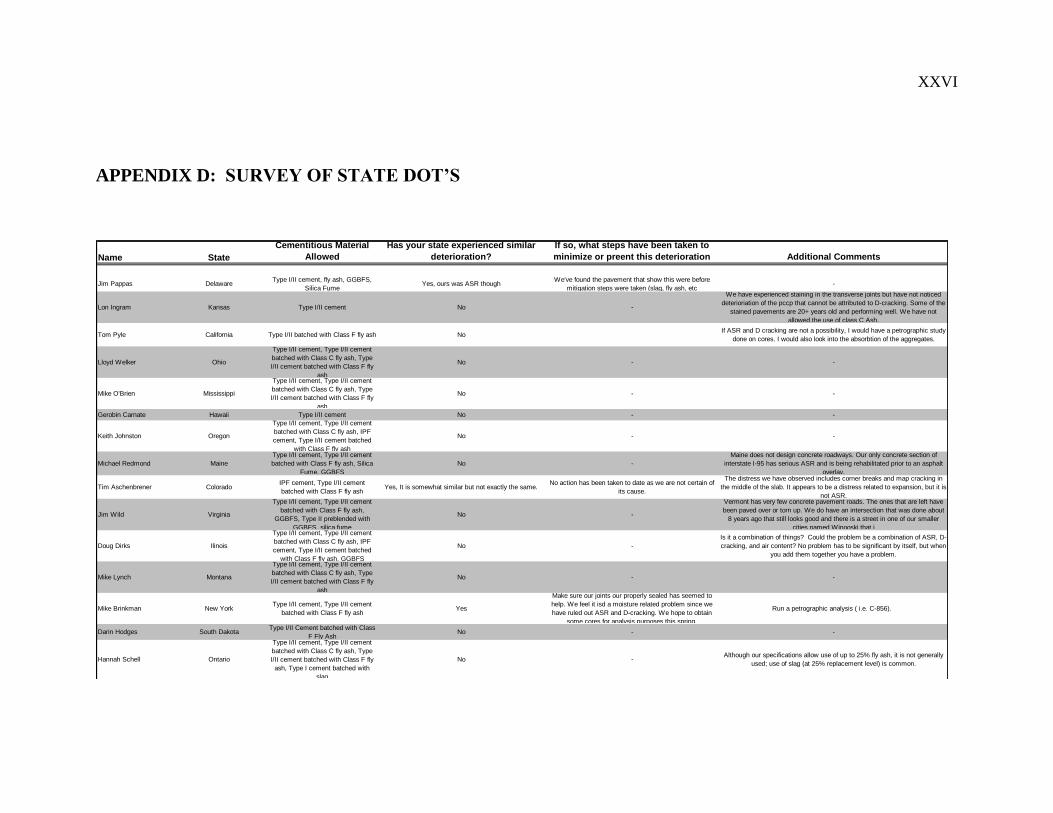
XXVI
APPENDIX D: SURVEY OF STATE DOT’S
Name State
Cementitious Material
Allowed
Has your state experienced similar
deterioration?
If so, what steps have been taken to
minimize or preent this deterioration Additional Comments
Jim Pappas DelawareType I/II cement, fly ash, GGBFS,
Silica FumeYes, ours was ASR though
We've found the pavement that show this were before
mitigation steps were taken (slag, fly ash, etc-
Lon Ingram Kansas Type I/II cement No -
We have experienced staining in the transverse joints but have not noticed
deterioriation of the pccp that cannot be attributed to D-cracking. Some of the
stained pavements are 20+ years old and performing well. We have not
allowed the use of class C Ash.
Tom Pyle California Type I/II batched with Class F fly ash NoIf ASR and D cracking are not a possibility, I would have a petrographic study
done on cores. I would also look into the absorbtion of the aggregates.
Lloyd Welker Ohio
Type I/II cement, Type I/II cement
batched with Class C fly ash, Type
I/II cement batched with Class F fly
ash
No - -
Mike O'Brien Mississippi
Type I/II cement, Type I/II cement
batched with Class C fly ash, Type
I/II cement batched with Class F fly
ash
No - -
Gerobin Carnate Hawaii Type I/II cement No - -
Keith Johnston Oregon
Type I/II cement, Type I/II cement
batched with Class C fly ash, IPF
cement, Type I/II cement batched
with Class F fly ash
No - -
Michael Redmond Maine
Type I/II cement, Type I/II cement
batched with Class F fly ash, Silica
Fume, GGBFS
No -
Maine does not design concrete roadways. Our only concrete section of
interstate I-95 has serious ASR and is being rehabilitated prior to an asphalt
overlay.
Tim Aschenbrener ColoradoIPF cement, Type I/II cement
batched with Class F fly ashYes, It is somewhat similar but not exactly the same.
No action has been taken to date as we are not certain of
its cause.
The distress we have observed includes corner breaks and map cracking in
the middle of the slab. It appears to be a distress related to expansion, but it is
not ASR.
Jim Wild Virginia
Type I/II cement, Type I/II cement
batched with Class F fly ash,
GGBFS, Type II preblended with
GGBFS, silica fume
No -
Vermont has very few concrete pavement roads. The ones that are left have
been paved over or torn up. We do have an intersection that was done about
8 years ago that still looks good and there is a street in one of our smaller
cities named Winooski that i
Doug Dirks Ilinois
Type I/II cement, Type I/II cement
batched with Class C fly ash, IPF
cement, Type I/II cement batched
with Class F fly ash, GGBFS
No -
Is it a combination of things? Could the problem be a combination of ASR, D-
cracking, and air content? No problem has to be significant by itself, but when
you add them together you have a problem.
Mike Lynch Montana
Type I/II cement, Type I/II cement
batched with Class C fly ash, Type
I/II cement batched with Class F fly
ash
No - -
Mike Brinkman New YorkType I/II cement, Type I/II cement
batched with Class F fly ashYes
Make sure our joints our properly sealed has seemed to
help. We feel it isd a moisture related problem since we
have ruled out ASR and D-cracking. We hope to obtain
some cores for analysis purposes this spring.
Run a petrographic analysis ( i.e. C-856).
Darin Hodges South DakotaType I/II Cement batched with Class
F Fly AshNo - -
Hannah Schell Ontario
Type I/II cement, Type I/II cement
batched with Class C fly ash, Type
I/II cement batched with Class F fly
ash, Type I cement batched with
slag
No -Although our specifications allow use of up to 25% fly ash, it is not generally
used; use of slag (at 25% replacement level) is common.
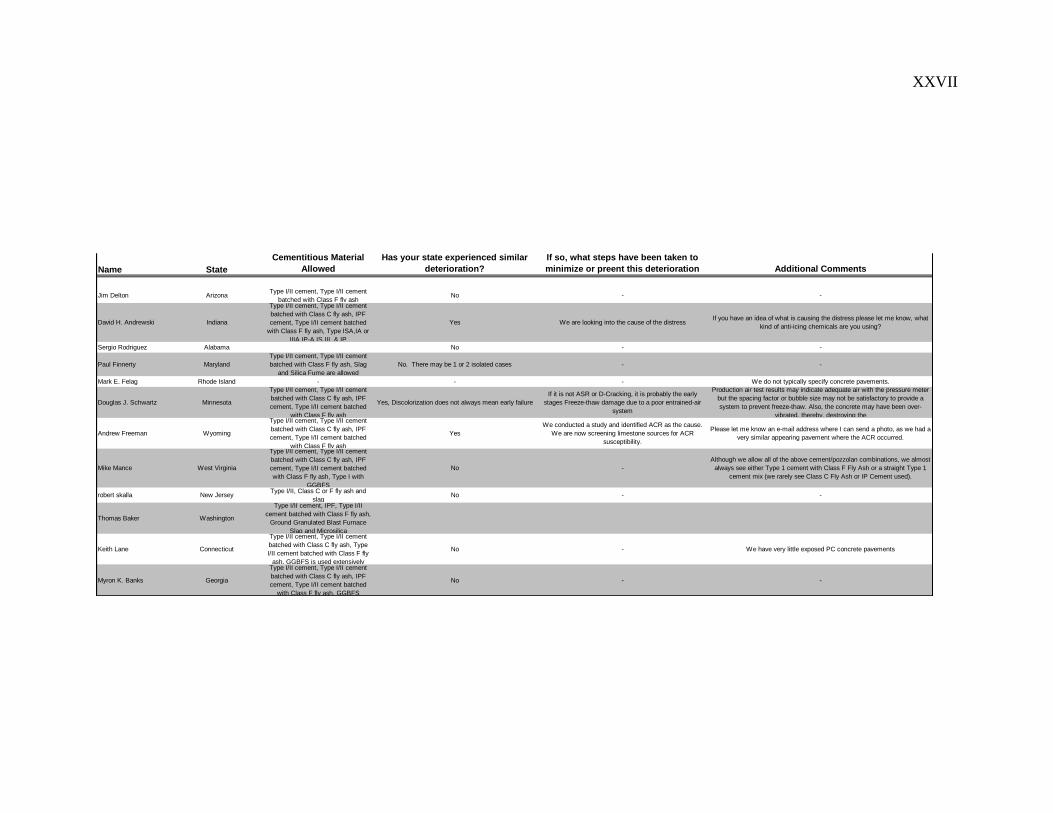
XXVII
Name State
Cementitious Material
Allowed
Has your state experienced similar
deterioration?
If so, what steps have been taken to
minimize or preent this deterioration Additional Comments
Jim Delton ArizonaType I/II cement, Type I/II cement
batched with Class F fly ashNo - -
David H. Andrewski Indiana
Type I/II cement, Type I/II cement
batched with Class C fly ash, IPF
cement, Type I/II cement batched
with Class F fly ash, Type ISA,IA or
IIIA,IP-A,IS,III, & IP
Yes We are looking into the cause of the distressIf you have an idea of what is causing the distress please let me know, what
kind of anti-icing chemicals are you using?
Sergio Rodriguez Alabama No - -
Paul Finnerty Maryland
Type I/II cement, Type I/II cement
batched with Class F fly ash, Slag
and Silica Fume are allowed
No. There may be 1 or 2 isolated cases - -
Mark E. Felag Rhode Island - - - We do not typically specify concrete pavements.
Douglas J. Schwartz Minnesota
Type I/II cement, Type I/II cement
batched with Class C fly ash, IPF
cement, Type I/II cement batched
with Class F fly ash
Yes, Discolorization does not always mean early failure
If it is not ASR or D-Cracking, it is probably the early
stages Freeze-thaw damage due to a poor entrained-air
system
Production air test results may indicate adequate air with the pressure meter
but the spacing factor or bubble size may not be satisfactory to provide a
system to prevent freeze-thaw. Also, the concrete may have been over-
vibrated, thereby, destroying the
Andrew Freeman Wyoming
Type I/II cement, Type I/II cement
batched with Class C fly ash, IPF
cement, Type I/II cement batched
with Class F fly ash
Yes
We conducted a study and identified ACR as the cause.
We are now screening limestone sources for ACR
susceptibility.
Please let me know an e-mail address where I can send a photo, as we had a
very similar appearing pavement where the ACR occurred.
Mike Mance West Virginia
Type I/II cement, Type I/II cement
batched with Class C fly ash, IPF
cement, Type I/II cement batched
with Class F fly ash, Type I with
GGBFS
No -
Although we allow all of the above cement/pozzolan combinations, we almost
always see either Type 1 cement with Class F Fly Ash or a straight Type 1
cement mix (we rarely see Class C Fly Ash or IP Cement used).
robert skalla New JerseyType I/II, Class C or F fly ash and
slagNo - -
Thomas Baker Washington
Type I/II cement, IPF, Type I/II
cement batched with Class F fly ash,
Ground Granulated Blast Furnace
Slag and Microsilica
Keith Lane Connecticut
Type I/II cement, Type I/II cement
batched with Class C fly ash, Type
I/II cement batched with Class F fly
ash, GGBFS is used extensively
No - We have very little exposed PC concrete pavements
Myron K. Banks Georgia
Type I/II cement, Type I/II cement
batched with Class C fly ash, IPF
cement, Type I/II cement batched
with Class F fly ash, GGBFS
No - -