Embed Size (px)
Citation preview

CKMHILLTECHNICAL MEMORANDUM 1 ___________
PREPARED FOR: U.S. EPA Region ffl
PREPARED BY: Don Johnson/CH2M HDLL/GLOMary Kate Dwyer/CH2M HILL/NJO
DATE: April 26, 1991 : " ."_._
SUBJECT: Surface Geophysics Investigation
PROJECT: WDC63131.FLFP
1.0 INTRODUCTION ;«1.1 PURPOSE AND SCOPE
This technical memorandum (TM) describes the geophysical investigations performedat Boarhead Farms, as part of the remedial investigation at the site. Geophysicalinvestigations were conducted to identify areas of buried metal and depth to bedrockover approximately 19 acres of the site (Figure 1). Two ponds covering about 5 acresof the survey area were investigated from a raft. Electromagnetic (EM) groundconductivity and magnetic methods were used to identify buried metal. Seismicmethods were used to determine depth to bedrock. The depth to bedrockinformation was needed to determine if the topographic high at the site reflected abedrock high or was a thicker section of soils.
Two portions of the site that were included as part of the survey (Area 3 and part ofArea 5) were covered with metal equipment and other debris at the time of thesurvey. Objects in these areas need to be removed so that geophysics surveys can beperformed. These areas will be investigated at a later time once this is accomplished.
)The investigations were performed by CH2M HILL personnel, Don Johnson/GLO,Mary Kate Dwyer/NJO, and Alan Wells/DAY. The investigation was conductedfrom March 20 to March 29, 1991. ' " ~ ~ ""
This TM is organized into six sections and 3 attachments. The remainder of thisintroduction section will present an overview of the report organization. Themethods used to conduct the survey and the theory of operation of the geophysicalinstruments will be summarized in the next section, The_ section titled FieldProcedures will describe the procedures employed in the collection of the data.

Interpretation procedures describe the methods used to interpret the data. Results ofInvestigation will present the results of the survey and the interpretation of the data.Contour maps of the geophysical data are included as part of the results and mapsshowing the location of interpreted features, such as buried metal, will be included aspart of the interpretation. The Discussion and Recommendations section will includerecommendations for use of the data, limitations of its use and additional data needs.The attachments contain profile plots of the data collected during the investigation.
2.0 METHODS USED
A test survey was performed in the beginning of the investigation to determinewhether EM conductivity methods or magnetic methods would be used to locateburied metal at the site. A magnetometer is the preferred method to determineareas of buried metal. However, the natural magnetism of the diabase bedrock thatunderlies the site may have prevented useful data collection with the magnetometer.In this case, it would be difficult to differentiate between natural magnetism andareas of buried metal and EM methods would be used for the survey.
The test survey was performed over the northeast portion of the site. The area was *first investigated with a magnetometer survey and area with magnetic anomalies wereidentified. EM conductivity data were collected over the magnetic anomalies todetermine if the anomalies were due to metal or geologic formations. Based oninterpretation of the data, it was determined that the anomalies were due to buried.metal and the magnetometer was chosen to complete the rest of the survey.
Erratic magnetometer readings were obtained in the western portion of the site.This most likely was the result of magnetic storms that were happening at this timeor it may have been due to interference from the radio transmitter located directlywest of the survey area. When this occurred, the survey over these areas wasperformed with the EM method.
Seismic refraction techniques were used to determine depth to bedrock in variousareas at the north end of the site. Seismic lines were chosen to obtain depth tobedrock at various locations in the northern and western portions of the site.
A brief description of the theory of operation of the geophysical instruments used tosurvey the site follows. .. . .
2.1 THEORY OF OPERATION
2.1.1 EM Conductivity
A Geonics Model EM31 ground conductivity meter was used to collect the EMconductivity data at the Boarhead Farms site. The EM31 consists of 2 coplanar coils,
NJR67/064R67.51 "" '~' 1-2
spaced 12 feet apart The coils are oriented with vertical axes. One coil is thetransmitter coil, and the other is the receiver. An alternating current is passedthrough the transmitter coil, causing an EM field to be transmitted which produceseddy currents that flow in the ground. The receiver coil measures the sum of thefields due to the transmitting coil (the primary field) and due to the eddy currents inthe ground (secondary field). The primary field strength at the receiver coil is knownand is subtracted from the total field measured at the receiver; the remainder is thesecondary field. The secondary field is divided into a component in phase with thetransmitted field and into an out-of-phase component. The strength of the out-of-phase component is linearly proportional to the ground conductivity over a range oftypical soil conductivities. At higher conductivities, the response is no longer linearand may result in negative measurements. The in-phase response provides anindication of buried metal, as it generally requires higher conductivities than the out-of-phase component to cause an instrument response. The effective depth ofinvestigation of the EM31 is about 15 to 20 feet.
2.1.2 Magnetics
A GEM magnetometer/gradiometer was used for the magnetic investigation. The .GEM is a proton precession magnetometer with the capability to take vertical *magnetic gradient measurements. It can store the location coordinates and magneticfield data in its internal memory.
The magnetometer sensor consists of a small container filled with an organic,hydrogen-rich fluid, such as kerosene. A current is passed through a coil wrappedaround the container, causing the molecules of the liquid to orient themselves withthe magnetic field produced by the coil. When the current to the coil is stopped, themolecules realign (precess) themselves with the earth's magnetic field. A smallelectric field, produced by the molecules as they realign themselves, is measured bythe coil around the container and amplified. The strength of this field is proportionalto the strength of the magnetic field at that location. The. electronic circuitry of themagnetometer converts the measured field to a digital display of the magnetic fieldstrength.
The magnetic field measured by the magnetometer is the sum of the earth's field,fields due to geologic formations, and nearby man-made features such as buildings,cars, and other ferrous metal. The earth's field may vary during the day due to solaractivity and-these variations are called diurnal drift.
The earth's field is uniform over a given area and can be removed from the data bysubtracting a constant. Diurnal drift is measured by periodic readings at a basestation and removed from the data if necessary. Diurnal drift is usually negligiblecompared to anomalies from buried metal. Anomalies due to geologic formationsare often negligible depending on the nature of the formations and their depth.Geologic anomalies are usually related to igneous or metamorphic rock formations.These rock types'are present near the surface at Boarhead Farms.
N.TR67/064R67.51 1-3

The vertical magnetic gradient is the difference between two simultaneous total fieldmeasurements made at different heights above the ground. The gradiometer sensorsupplied with the GEM magnetometer consists of two sensors about 2 feet apart.The vertical gradient measurement is more responsive to nearby objects than thetotal field measurement, and may provide higher resolution of anomalies. Thevertical gradient is not subject to diurnal drift.
2.1.3 Seismic Refraction
A Geometries ES-1225 Seismograph was used to collect the data from the seismicsurvey. Data was recorded on 8 hertz geophones, with a 10-foot spacing interval.Twelve gauge black powder blanks were used as a seismic source. The source waselectronically detonated with a blaster.
Refraction seismology involves electronically measuring, at known points along theground surface, the travel times of elastic seismic waves generated by an impulsiveenergy source. The data consist of records of p-wave travel times from the energysource to each of twelve receivers called geophones. The data is received andplotted on a seismograph. When arrival times are plotted against the distance of the .geophones from the energy source, the velocities and thicknesses of subsurface layers scan be calculated.
3.0 FIELD PROCEDURES
A survey grid was established over portions of the site before collection ofgeophysical data. The grid was placed to allow accurate and systematic datacollection and to locate inteq^reted results in the field. The grid was formed byplacing markers at regular intervals across the site using a compass and a measuringtape. Grid markers (pin flags) were placed at 40-foot intervals along lines 100 feetapart and labeled with the grid location. Grid north was oriented about 50 degreeswest of true north.
Data was initially collected on lines spaced 40-feet apart across the site.Measurements were made at 10-foot intervals along the survey lines. If significantanomalies were encountered on any of the survey lines, additional data werecollected along lines midway between the anomalous lines (20 feet away). Data wascollected and stored on a digital data logger or internal memory of the instrument forlater transferral to a computer. Measurements were also recorded in the fieldlogbook at the time of the collection, along with the observations of features thatmight affect the data, such as fences, or features that would aid in mapping, such asroads and ditches. Data from the digital logger were transferred to a computer on adaily basis and the data reviewed to determine if they were properly recorded, and ifit matched the data manually recorded in the logbook.
3.1 MAGNETOMETER SURVEY
NJR67/064R67.51 .... . - 1-4

A GEM magnetometer was used for the investigation. It has an internal digitalmemory that simultaneously records the total magnetic field intensity and the verticalmagnetic gradient. It also records the station coordinates and the time with eachmeasurement. At the beginning of the survey, the sensor was damaged, preventingthe collection of vertical gradient for the remainder of the survey. Total magneticfield measurements could still be made, however. The vertical gradient data was notcritical in determining the locations of buried metal at the site.
No functional checks are prescribed in the operator's manual for this equipment.Initial readings were compared against the total field intensity predicted for the area,as shown on a map of the United States that was provided with the equipment.Equipment was determined to be responsive by taking measurements at differentlocations and noting that the measurements did not remain constant.
A base station was established at the beginning of the survey. The site for the basestation was established by finding a location where the total field readings changed byless than about 10 gammas when the instrument was moved a few feet in anydirection. Base station readings were taken throughout the day: in the morning,midday, and late afternoon, unless erratic readings required more frequent base ;station checks.
Erratic readings arid occasional refusal of the instrument to take a measurement wereencountered in the western portion of the area of investigation. According to theSpace Environment Services Division of the National Oceanic and AtmosphericAdministration, there were mild to severe magnetic storms occurring at that time.Either these storms or transmissions from the nearby radio tower were preventingcollection of data. When these problems were encountered, EM conductivitymethods were used instead.
3.2 EM CONDUCTIVITY SURVEY
The procedures used for data collection with the EM31 were the same each day itwas used. A function test was performed on the Geonics EM31 at the beginning ofeach day. The functional check establishes that the instrument is operating correctly.It is not a calibration check. The instrument is calibrated at the factory or the rentalagency and no field adjustment is made. The equipment passed the functional checkson each day:.
No operational problems were encountered with the EM31. It did not experienceproblems related to the radio tower or magnetic storms and was used when themagnetometer could not.
EM data were collected at the same line and station spacing as the magnetometersurvey for the primary portion of the survey. Collection of fill-in data wereperformed differently. Data along fill-in lines were gathered by slowly walking along
NJR67/064R67.51 .. 1-5

the lines and observing the conductivity on the instrument's meter. Locations wherethe readings were negative (or anomalously low over a short distance), indicatingmetal, were recorded in the log book. No other readings were recorded as otherconductivity variations were not relevant to the location of buried metal. Thelocations of buried metal determined in this manner could be compared with metalidentified during the magnetometer survey.
3.3 SEISMIC REFRACTION SURVEY
A Geometries ES-1225 Seismograph was used to collect the data from the seismicsurvey. The seismograph was powered off of the truck battery and consisted of arecorder box, screen, and printer. Instrument functions allowed the data to bedisplayed and manipulated to make it more understandable. Seismic shots could bestacked (electronically added) to enhance the seismic signals.
Twelve geophones were laid out in 10-foot intervals, except for the interval at eachend which was 5 feet. The resulting spread length was 100 feet. The geophoneswere then attached to a seismic cable that was connected directly to the seismograph.-The charge was placed in a shallow hole located five feet from the end of each ;spread. A separate geophone was used to trigger the system when the charge was 5detonated. This geophone was typically placed 1 to 2 feet away from the charge.The charges were detonated one at a time, at each end of the spread. On Spread 3,a charge was set in the middle of the spread to measure suspected variations in thebedrock surface in this area.
Once the charge was wired to the blasting cable and placed in the shot hole, a heavymetal plate was placed on top of the shot hole. A heavy metal bar and a tree stumpwere used as a weight to prevent the plate from flying into the air. The resultingshock waves were recorded on the seismograph. The data was reviewed to determinewhether it was acceptable or if more charges would be necessary to identify thecritical arrival times needed for the interpretation. If the data were good, theamplitude of the waves recorded at each geophone was modified and the results wereplotted on the printer.
4.0 INTERPRETATION PROCEDURES
4.1 EM CONDUCTIVITY DATA
The EM data in raw form, as transferred from the datalogger to the computer,consists of data files in XYZ format. X and Y are the grid coordinates of the datapoint, and Z is the EM conductivity value. A similar data file is also created thatcontains the EM in-phase response instead of the conductivity. Several steps areperformed in the interpretation of the data:
NJR67/064R67.51 1-6

* Data are imported into a spreadsheet and rearranged into aspreadsheet format. Each spreadsheet row and column represent aneast-west and north-south grid line, respectively. Data was moved tothe appropriate spreadsheet location based on the grid location,
• Profile plots were created by the spreadsheet program. Each plotconsisted of the conductivity and in-phase value plotted against distancealong the survey line. The profile plots were used to interpret thelocation of the source of each anomaly. The interpreted locations ofthe sources of the anomalies were transferred to the base map.
• Anomalies were identified using the profile plots. Buried metal wasexpected to result in negative anomalies; however, positive anomalies(conductivity highs) may also be indicative of buried wastes.
4.2 MAGNETIC DATA
Preparation and plotting of the magnetometer data was the same as for the EM data.-The data were received in XYZ format, imported into a spreadsheet, and rearranged .into a spreadsheet format with columns representing survey lines and the rows :representing position along the line. Profile plots of magnetic intensity and verticalmagnetic gradient (where measured) were prepared and contour maps of themagnetic values were generated.
The interpretation of the magnetometer data is different from that of the EM data.A magnetic anomaly normally consists of both a magnetic high and a magnetic low.The pair of high and low values is due to the field induced into the buried metal bythe earth's field. The field induced into the buried object has both a north and southmagnetic pole resulting in a net increase and decrease, respectively, in the measuredtotal field. In the northern hemisphere, the magnetic high is on the south side of thesource and the low is on the north side. The source of the anomaly is interpreted asextending from the peak of the magnetic high to near the lowest value north of thehigh. The high/low pairs are not always well-defined because of the nearbyinterferences, and professional judgement is required in delineating magnetic sources.
4.3 SEISMIC REFRACTION DATA
The paper copy of the seismic record was used to measure the time required for thearrival of the first seismic impulse at each geophone. The arrival times were plottedagainst distance from the shot point to produce time-distance plots which are used forthe interpretation of seismic refraction data.
A program developed within the company was used to interpreted the data. Theprogram allows the user to specify the layer thickness and velocity beneath eachgeophone and shotpoint and calculate the theoretical arrival times for that model.
NJR67/064R67.51 - 1-7

The model was adjusted to match the theoretical arrival times with the measuredones. -
5.0 RESULTS OF INVESTIGATION
5.1 BURIED METAL
The extent of the magnetometer and EM surveys are shown in Figure 1. Magneticdata are presented in Attachment A and EM data are in Attachment B. Figure 2 isthe contour map of total magnetic field intensity. A contour map ot the EM datawas not prepared because the coverage was more limited.
Twenty eight areas where buried metal is present have been identified at the site(Figure 3). The areas shown on the map have been identified based on eithermagnetic anomalies, EM conductivity anomalies, or both. Anomalies due to knownsources, such as powerlines or buildings have not been shown unless other buriedmaterial is suspected. Combined use of both magnetic and EM conductivity methods-have ruled out geologic features as being the sources of the anomalies. ;•Prioritization for foliowup investigations of the interpreted areas of buried metalshould not be based only on geophysical data. Other factors, such as site history andvisual observations, should also be considered. The following are brief descriptionsof the interpreted areas of buried metal. Note that the area designations wereassigned generally west to east across the site and do not imply priority.
Area A EM anomalies indicating buried metal were seen on threeadjacent lines. A powerline crosses this area and may beaffecting the response; however, the orientation of the EMresponses is riot the same as the powerline, indicating thepowerline is not the cause of the anomalies. No magnetometerdata is available over this area.
Area B .EM anomalies on three adjacent lines define this area which issouth of and roughly parallel to Area A. No magnetometer datais available over this area.
Area'C Fill pipes to a probable UST are present next to the driveway inthe vicinity of this area. The tank and or its piping are assumedto cause the anomalies defining this area.
Area D This area is defined by both magnetic and EM anomalies. Whatappears to be a fill pipe by the side of the road suggests anunderground tank may be present at this location.
NJR67/064R67.51 - 1-8

Area E A magnetic anomaly on line 920 defines this area. Althoughnear the powerline, it is probably far enough away to beunaffected by it.
Area F This area was initially thought to be due to the powerline andfill-in lines were no run adjacent to it. It is probably far enoughaway from the powerline to be unrelated to it.
Area G Both magnetic and EM anomalies define this area. Themagnetic anomaly on line 960 is the strongest of the magneticanomalies defining this area.
Area H A strong magnetic anomaly (>1000 gammas) on line 960 and anEM anomaly on line 980 define this area. Oily liquids were seenat the surface at this location.
Area I The powerline is suspected as being the source of the anomaly atthis location, although the anomaly is present farther from the .powerline here than elsewhere along the powerline. ,
<mm
Area J A strong (1500 gamma) magnetic anomaly and an EM anomalydefine this area. Although the powerline is nearby, similaranomalies were not present where the powerline crossed othersurvey lines. Similarity of magnetic anomalies in Areas K, Mand N suggest that these areas may be related to a long, linearfeature (some kind of buried utility) that crosses the site.
Area K This area is defined by magnetic anomalies on lines 1120 and1160 and an EM anomaly on line 1140. The 3000 gammamagnetic anomaly on line 1160 is one of the strongestencountered during the investigation. Also see comments forArea J.
Area L -This area is defined by both magnetic and EM conductivityanomalies. Multiple magnetic anomalies on line 1280 and twoclosely spaced EM anomalies on line 1260 suggest this areaactually consists of several smaller ones.
Area M An EM anomaly on line 1100 and a magnetic anomaly on line1080 delineate this area. Also see comments for Area J.
Area N A strong (1000 gamma) magneticf anomaly on line 1040 and anEM anomaly on line 1060 make up this area. Also seecomments for Area J.
NJR67/064R67.51 .-. . .. 1-9
Area O Strong magnetic anomalies (>1000 gammas) were detected onlines 1200 and 1240 but there was no corresponding EManomaly on fill-in line 1220. They were interpreted as beingrelated to the same buried metal because of their similarity.
Area P The magnetic anomaly on line 1240 is weak (about 200gammas), but a distinct magnetic low on line 1280 also indicatesthe presence of buried metal. The EM conductivity data on thefill-in line confirms metal is present.
Area Q .Area Q is defined by relatively weak magnetic anomalies and aweak EM response. The anomalies indicate that some buriedmetal is present.
Area R -The eastern limit of this area is not "defined because thick brushprevented access. A strong magnetic anomaly on line 1400 andan EM anomaly on line 1380 partially define this area.
Area S A single strong magnetic anomaly on line 1400 partially define .this area. Additional data could not be collected east of this line?because of thick brush.
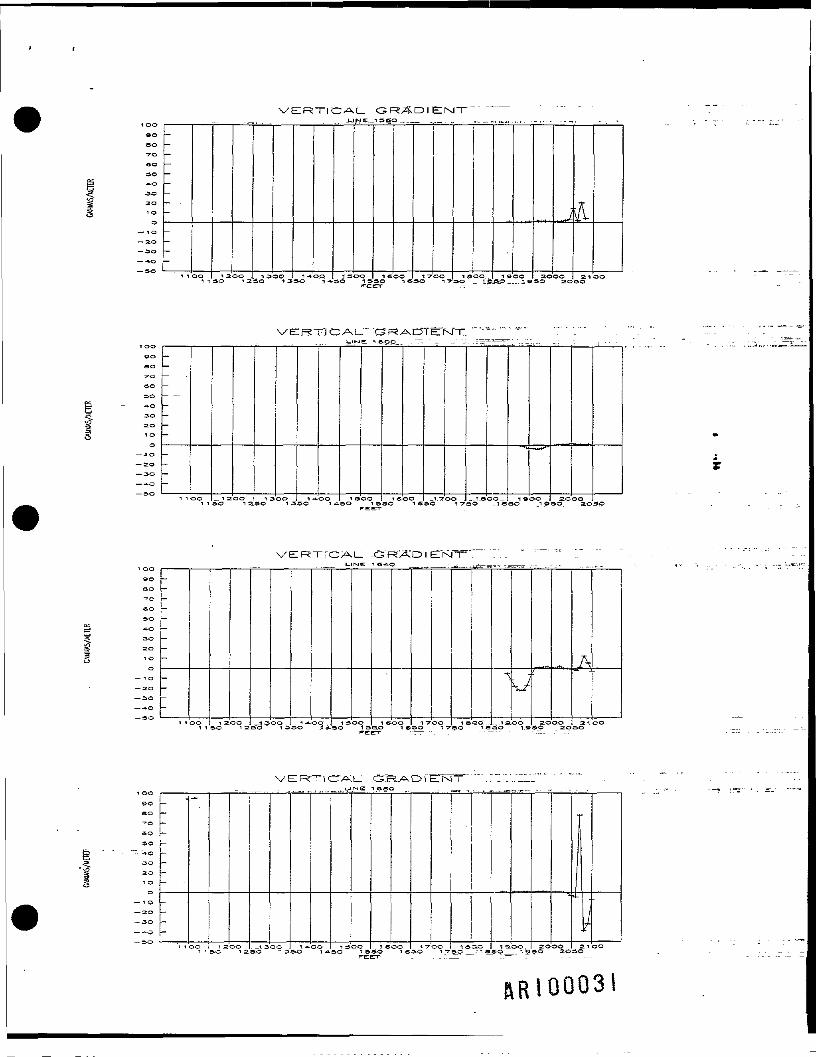
Area T This area has the largest areal extent of any interpreted at thesite. Except on line 1360, the magnetic anomalies are greaterthan 2000 gammas. EM anomalies were detected on the fill-inlines. A pipe with a diameter of about 20 inches is protrudingfrom the edge of the fill at the east end of this area, although itis not known if the pipe is related. The EM anomalies indicatea source wider than the pipe.
Area U This area is defined by both magnetic and EM anomalies. Theanomalies on the eastern half of the area are the strongest. Allanomalies were encountered along the edge of the clearingwhich is defined by a break in topography.
Area V Magnetic anomalies on two adjacent lines define this area. Bothanomalies are less than 500 gammas and may indicate less.metalthan other areas.
Area W Magnetic anomalies on three adjacent lines define this area,although the negative response on line 1640 indicates the buriedmetal is west of this line. The anomaly on line 1620 is about3000 gammas an3 is one of the strongest encountered during theinvestigation.
NJR67/064R67.51 " 1-10

Area X This area is located along the edge of the clearing. It is definedby strong magnetic anomalies on four adjacent lines.
Area Y A 200 gamma magnetic anomaly on line 800 defines this area.EM data on adjacent fill-in lines did not show any anomalies.This area is relatively small compared to the others. It is locatedin the west end of the larger pond.
Area Z "Magnetic anomalies on three lines define this area which islocated in the east portion of the larger pond. The 2500 gammaanomaly on line 1080 is one of the largest encountered duringthe investigation.
Area AA Only EM data were collected over this area. This area isdefined by elevated conductivities and a noisy appearance on theplots. The area is interpreted as fill containing scattered metal.
Area BB The western half of this area corresponds with fill containingmetal trash (eg. cans and other scrap metal). The eastern half is.not apparently over the fill and may reflect a separate area of sburied metal.
5.2 DEPTH TO BEDROCK
The seismic data were collected at locations shown inFigure 4. Estimated depths to bedrock are shown in the same figure.
Three layers were identified at the site. These are unsaturated soil, saturated soiland bedrock.
Unsaturated Soil
The unsaturated soil is generally between 5 and 10 feet thick and has a seismicvelocity of lOOQ.to 2000 feet per second.
Saturated Soil
The saturated soil was not identified in all the data, but was assumed to bepresent everywhere and was included in the interpretation. Elimination of thesaturated soiljayer from the interpretation causes the estimated bedrockdepths to be about 50 percent shallower. The saturated soil layer is identifiedby seismic velocities of about 5000 feet per second.
Bedrock
N.FR67/064R67.51 .__. __ 1-11

Bedrock was determined to be up to 20 feet deep at the locations investigated.It may be as little as 5 feet deep in some areas. Bedrock had seismicvelocities of 10,000 to 15,000 feet per second at the site.
6.0 DISCUSSION AND RECOMMENDATIONS
6.1 BURIED METAL INVESTIGATION
Buried metal has been identified in about 28 areas distributed around the site. Thenumber of burial sites exceeds what was predicted from the site history. The natureof the buried metal (whether drums are present or not) cannot be determined fromthe data and further investigations will be required to determined what is buried.Priority of the followup investigation should be based on areal extent of the buriedmetal (an indication of the volume), on other observations (oil at the surface), and *site history. ;
m
Area 3 and a portion of Area 5 (as shown in the work plan) could not be investigatedat this time because of vehicles and other metal on the surface. The metal at- theselocations will have to be moved before the investigations can be completed.
6.2 DEPTH TO BEDROCK
The objective of the depth to bedrock investigation was to determine if thetopographic high at the site was related to a bedrock high. The data indicate that thetopographic high is also a bedrock high. Bedrock depths varied from about 5 to 20feet but the greater depths were not related to the topographic highs at the site.
,.,2 "SI 000 I 2

oOJ
CO
CDCDO
cc
yffi m&$$& &&fr
I I I I I M I I I i I I 1 1 I 1 i 1 I 1 I I I I I I I I I I I I 1 +I I I l\ M I I i II II I M I 1 I I I I i I I M I I M II I 1 I I I M IV1N 1I I I I I I 1 I !••! 1 I 1 1 1 I M I 1 I I 1 I I I t M I I I It II
II I I I I /I II 1 I I I I I 1 I I I 1 I i I t t !• I I I II I I I I I I I I 1 '1
I >/V'J V _ _j- ^vvyvwyvvvyvYVV tfVV\(Y-CtLJ,_____ J.______________________i v\v\'v/v\'vvv\v\ vVv\vvvTtrr 7 — ——py>\yw</vv\>*o'y>"yr<vi ;vyv«v>'vvv/v v vyv « v>'vv vyv4 vyv\vyv» <V1VV</V/« vV/< x </< K </V x v A >"•</<>V(< >"<VvfX X X* * «X« *«/« A «/* >,«X*X«X«V*X\A .»-<-0
/xvV ' v ' ' vvvv<vvv>'vv v y > <
'XX\A\> V ^* * * *.X *X/X * >>\> >> A> * *\*\ A >^>* A Ay<\A A,< AA/vA/\*AA'i .>,AAA.<A\A/.AAA> A/.A/AAAAAAA/.A/ A> A/.A.\A/\AXA;V\f.rt/v*'V^'^>AA^/\A-^AAAJ(\/.A/vV^/^/v^AAAAAA/.A\V^A>A/v\Ay\/.AA\/\»*A/ V \**AA/V»A'%AA/VV\r A.\A. A.VW\A/»AA/\/J\ V\/*/V ATu'W\/\O\'l/

" O O " ~~~ O ™ "™ "O • ™ O , W ~ ~O — —— - ——-TT""" "'"(IJj nim—J - * f~
o o i r o h * ( 0 i O ' < r r n ( \ j
* * >„ V * AVX A A A * >.A\ A A V\AV) AAA^ V ' AAY/
1 v /vs'\r/vv vvvvv*,VVvv<vvvVv\(Wvyvvvy vi\vvyVvvvvyvyVy\<vXvK v\v>vYv>'Y vvs. vvv/v//« x / V. * « >WB «V * A* "/ V *//('.A.<AXAAAXAA *XA**XA <AXA <XX
< y v v y v (v < \'v vv >A/ v v >yv >^/ >'<A * i * v* ( */T < *y * < »y»> * Y.A * <>\<xA * */y "v < A/X,<AKAAA\AXA\A,<A > A X AA A/. A,\
£8 ®5&£'V > >A/V i\*/ V >?/Vy> } •
* \V A* V<*VA* V\V5$$ $&V\ \A/VV rf V VV if V vV>S*AA>/v\>vVtfWw\V\>>.< -
liSf»A/.AA \A.V\/\/«V*j\> .Tt'\>

$$0\$5/A x/yVsvv vVv'v v<vv « t ^</A>^cAV(\>V(>v>\<V
/vyvyvvvi'vvvvvv v>'v/v / v v V/< v\/v y\>x/itx** xYx A X X K ji xx"

oo
COI ,VVVVV
VAX#XV*y>;<XAVAy>;A ^\A A.< A < A)V A,< A y,A/.A A A A * * A/. A <, A,V A > A < A A A/ A/ A/ A/. A < A >. A A A >. A < A J. A A A . .A A A, v* * A/. A * A vXXX\<A/> <AA> O^X/AAA <>.AA,UA> 1<)V<A,(A^AAA/>.A.AA>V'\AA\<AA>VAA,C>.AA,U.AAA>)<A.Uv/V-VAA/AWvA'A/yX/^AAAW/VSAA/x'/v^A/VyA^
/'<"'I'A1 * »jl f AjT/V* ATU A V \A A..< A A V A> AX A AA > A < A A AA* -«.

I I
ATTACHMENT 1
MAGNETOMETER DATA
R 1000 17N.IR67/064R67.51 _._.. ..._:' 1-24'

33.0
ss. a
33. e
33.3
33.2
33.1
33.9
33. S
33 .«
33. S
33.3
33.2
33. 1
33-S
S3 f
33. «
33,3
33,3
33. 1
33. «
SS.V
33.3
S3. 3
33,2
33.'
3-1. B
=::
--
-
__~
-
--
--
---
-_ _
:
I
oo
oo
oo
_
oo30
»G>
iO
2.0 c
1 2
sc
2
~
00
1
J__
1
_J_3so_
i s:
rc
~c
0
oo
30.
n~/\
3O
3<?o
-4- ..
!_•*<:S3O
oo
1_
oo
1_~
I—..
rv
5?-.
t3
(V
1 3
TV
•f zt
——
30"
»oF
SOF
A-0
5O
l_IM
5OO1 3 =F
OOeen
M
y
;°
E 8
E S
i eeer
i *jr
E:~
'—V.
-'•'
oo
oo
-wa"
3OJ «
1O T
A,/s
-3O_
Q.c;
ICJ
T "7C
ioe
sc
'-,
3O1 '
5 1 s;
FIE
=v-
>o
h It
i w
*V4,
1 «so
sso
— —
=,UL
oo
toe
1 <5<
---
> _
J
n «
_*-
11 «.
- ~-—
»0___
_ : - - ;
-: =
11oo
3t
"<s
-"
_3
-— *•
3 ,
3<5
-
1 — ,
A
.-*•
2Co
*s*.
\sc
•
o
oc
'-
S.
•-
o20
«*-*-
•*v—
oo
^. — .
""I***"
2 iO
SC
7
3
O
**v-
i OOO>
%.
SO
__ __.
— ~—
qo
J""
D2 1._3_O
_a Q \

. ETI.O _
33.9
33.
ss. a
S3. 3
33. A.
33.3
S3. 2
33. 1
--
_ _
OO- i zoo i aoo
=***•"•
1-1
—— -=
oo
« v
T 3
~J
OO
u
i a.
v-*-
po i TOO i»oo . 10
/'
oo
r»1
2OOO
t
f21 OO
SS.B
33.S
33.7
- 33.S
SS-3
- 33.i
33.3
33,2
33.1
SS

f=n EIUQ
_ JVl AG. tsLETT IO FT1 E: L p".
33.a
ss.•*•
S3.*
33.3
: u D_

;M AGIN EITIc. FTE:.UD.I_IMC i i 20 • • .:"
TOTAL- .MAGMEITIC, Rn.ET'UR", , ," "," . C 1 ._ „..,"..,SB.-*-3S.230
3T, «
3 7,23-7
3<5,«
35.9
3S.2
3633. S
33. S3S.J-
33.2S3
l_irslE T 1 «O
_
-
-
1 1 OO1 I
"1 2OO
3O_. 1 2SOOQ.
t-S
——SO .1 *
•*•*!.
i sooSO 1 3
;»— —
i «oo30 i eeer
, .. i r
——— —
*%
3O 1 -?_
-•— « —Ji aoo30 i e
iP
IJK. 1 ooo
SO 1 9
- — r*
2OOO30 ao 2 1 OO30

LJf-JE 1 2»O
S3. 1 —
*OO 1 3O_O__ oo " iwoo i =00 2000 21 OO1 -"-SO " "- l"33O 1 «3O I.T-SO 1 »SO 1_9SO 3O3O 21 So
SB.-7 —
3*. 23B . 1S«
3S.933.8
SS.«S3.333,-a- —S3 3 -SS-2 -S3 1S3
s -*.e
l13

se
33.9
ss.s
ss.«
ss.s
33, -a-
SS.3
33.2
33. 1
ss
_
-
_-
OO t 3.30
ooi 2
1 S3-0 001 3SO
oo. 1 Sso oo1 3
1 «ap oo1 B
1 "7SO .
op . 1 B3O
OO.!-=»
1 0=*Q_I
oo_ ;is
^
203O
-n_?
oor O
^
213O
00
: MAGNETIC "FTEOXCTI_I«-JE: i-t..*o~ . ' -—^==—--
3«.SS6.-0-315.3SS.233. 1"~3«
33.933.3S3.V
SS.SS3.333.-i33,3ss.233.133
; MAG M Em CC:.
3S.2'ss
33.ass.e33.•&
33.233
3*..a
3*
33.9
ss. e*
33. 7
SS.B
ss.s
*S--
S3, 3
SS.3
S3. 1
SS
--
--"~
~
-1 '
.-
oo 1 2OO -SO 1 2,
1 -3OO30 1 3.s.o ..oo
1 3OO_30 .-:i..=i»o.f. .r,"1 *
ii
i •T'oo 1~ i aoo= ,. " f- ? '' kji iL
J.J\
1 SOO30; . IB
JT~~
2OOO3O

MAGJMTEIO. __F~_LE:L.D.se
S3. 9
SS.S
SS.T
S3.B
SS.S
33.3_
SS-2
SS. 1
-
-
S3 ——————— ,OO
_—•*—-
1 SO.O
—X
1 BOO OO" 10oo
J
i e oo_.
I-•— V
2.OOO
sj
33.9
ss, a
ss,?
ss ,e
3S.S
SS.J-
33.3
S3. 2
33, 1
S3
--~
---
1 1oo 1 2OCL ._SO 1_2
1 3OO3_O 1 3
1 -l-OOSO . . 1 A
i s'oo'F-eefr'
1 «QO 1 TOO.3O . „„,„•' T
i wooso ra i a
-
i sooSO 1 9
*e — •
2OOOSO
,-? f
s«
ss.s
ss.e
33. T
SS.S
ss.s
S3. 3
33.2
33.1
SS
- --
--
-
—
1 '
-TOTALS
oo i 2OO i 3OOSO 1 230 1 3s"o "
VIAGISJETJC _JT(EU.f1_ ME 1 3«O
oo" i soo1, 30 1 3
1 «oo30 '1 «
1 TOO
P - -„.. ,, ;;.
1 SOOso ._. i a
-i "-——
1 9OO59. ,1 a
r- ~J
200030 2O
.\
2 Ioo
ss.s
ss.s
ss.e-
SaS.S
S3.-1
33.3
33.2
33. 1
ss
— :
_-----
—
1 i ooSO "1,2
1 3OO3C — 1 3
'-
i_ir-je i sao . ._ _ _i ,
i
.1 j-oo
—————
1 SOO .SO " " " 1 3F-EET
..1 BOOSO — Jl B
1 TOOso •) ~yi soo
sq. ., _ vs
•vX-
1 «ooSO .1 9SO
ftRiGGQ2-*

3«
ss. o
33. T
SS.B
33.*-
93. Z
S3. 1
-
--
-
--
oo1 1 1 2so 00 .1 2
._ 1 3SO
oo13SO
oo. 1 *
1 Sso oo1 S
F-EE1
1 «SO 00,« 1 -7
soooO
1 Os*
00i<?
-?•
1 930
Voo
1 9
X
20SO
•—•— K
OO20SQ
i_ir-je i a20
3».S
3S
ST.S
37
se.s
ss
33,3
33
-
~
-
1 1 OO 1 2OO30 1 2 ' 3OO
SO 13
————1 *OOso i * •t sooso i s
f=-E1 SOOgp 1(S 1 TOOso i T
———i soo__
I\1 OOOso is
r20sp oo20
- — «
21SO
oo
MAG..M;E:TIG. "j
33. S
33.7
ss.e
33.3
SS.-*
33.3
SS.2
SS. 1
S3
S-a-.S
-
~
-
-
-
~
oo" 1 2.OO.JSO 1 2
__ 130OSO 1 3
1 »OO . Jso :>•-•1 SOO30 " 1 S1_.-SOO _1.70Qso ^t~r*9°
A
°. ° « 3"<3.
1
1
Veo-«-
r------
3QOOSO" 20
A• \
21SO
oo
JVLAGJN ezmo iiEri ETUOl_l«-JE 1 BSO . . . _ . . _ .
SO.T
SS.S
ss.s3S.-1
3S.3
3S.23S, 13S
SS.9
SS.S
33.7
SS.S
33.3
SS.-a.
S3. 3
I
]
-
33. 2 —————— ioo i 200SO 1 2
. 1 3OOSO 1 3SO "
op; i soo3O 1 S
PG.1 «.OOsjo. iserr
1 TOO»<? , '7
1 SOQSOj ^ S
=--—--
19OOso. , i e
X"--X
*-f°
I,2 1 OO
3O

"tVlAGPsJ ETTIC:•IE t CBO
373S.S3C.S
SS.S3B.S
3B.23B. 1SS
33,9s 3. aSS.T
«:Sss.-«.33,333,2S3. 133
3-*.. 9s-*.a
_-I~
_——
I
_~
-
1 1oo 1 23O 1 2.so' OO
1 3soo.p ISso oo
1 3
—i aso oo
i e1 ~7
SOoo1.T
i a3O .
oo
— •»
—— —i Oso oo
19
*——
20so
,11."
eo20
———— I
SOoo
3S.2
SS. 1
ss
S3. 9
ss.a
ss.s
SS.3
33. -t
33.3
S«
33, «
ss.a
33,7
33. S
3S.-»
33.3
S3. 2
33.1
33 _
3S
3.3.9
ss.s
ss.-?
ss.s
ss.s
33,-a-
33.3
33,2
33 1
SS
TOT/ L.
-
-
-
-
-
-
VMAGl_IMB
ISETT; i 700
i i oo 1 i 200 i a'oo 1 i 4.00 i s'oo1 i so i 23:0 T 3so i -*so iF
CVF:.I.E:
1 BOO 1 TOOSSO. 1 S3O 17EET .. ' '__
> ———-.---
—1
9&~.~.~ . i~&~*Q~r~\&
- -'
J™'" J
T
IL2OOO 2 1 OO
37P _ 2030
t-ir-JE T.720" ~ " - --- -^- --- ..-.-- _ . -_ ...
-
-
-
-
-
_
-
1 1 OO 1 2"OO " L 1 300 1 -*OpSO 1 2 SO 1 33O 1 -4
1 SOO 1 SOO 1 "7OOSO 1-SSO 1 SSO . 1.7
IS30
op
-s— t-f *r~*t— ' -~~.~v_
1 SOO 2OOOSSO , 1 9SO 2O3O
TOTX OMETJfi eUQ-... -.; :, •, ...........
-
-
~
-
,-
i ^ oo————— i ————— 1 ————— 1 ————— ————— i
i 2.0.01 __ 3OO . i -a-?°i
1 SOO'3O •" »3J3
1 SOQo is* TV?. i .aop .
..*•-
1 900
- — ...
200 o=>o

S3. 9
SS.S
33.7
•3§
33.3
33,2
SS. 1
33
-
-
_
- --1 1OOi i 1 2PO
SO 1 2 1 3OO30 . 1 31 -4.OO
so :•> J- i SOOSO IS
1 SOOSO 1 S.
1 7OO3O _ 1 7
—
n soo3Q . 1_JS
•*•*•! ». ••••••--1
1 SOOSQ_. ._ IS
~*v- .
20 ooso _ zs>so
TOTAL "M'AGJMEITIO FTECD. " .7," '. ' .".ss
ss.s
ss. e
SS.T
ss.s
33.3
33.4
S3. 3
33.2
SS-1
S3
l_!r-JE TSOO " -. . ".I..
-
-
- -
-
-
-
- '
1 1OO . 1 2OO3O_ 1 .2
1 3OOS.O 13SO
oo . 1 SOOSO 1 3
fE
1 SOO3Q 1 aET
. 7QQSO 1 -7
X.
i aooso" i s
i, fc. *- --
1 SOOs<5 is
— *~- -v
„ 20.0030 20
—s
2 nSO
oo
:M.AGfxj ETTIO . FTLJ M e is --o
SS
SS.S
ss.s
SS.T
SS.B
SS.S
33.-*
SS.3
SS.2
SS, 1
33
-
_
_
-
--
1 "oo 1 2OOSO 1 2
1 3OOSO i 33O 1. •*
1 SOOSO 1 SF-ee
1 SOOso- i srri v'po
SO 1 7
-i.
1 SQO", .SO" 1 S
.1 9OOSO 1 9
! -£_
2O.OOSO 2O
— — -
SO
je i SQO
L -33 9 j —
SS.S [— -
SS.T j—
-ss.s
33.3
33.-*
SS-3
SS.2
S3. 1
SS
-_-
1 1
-
oo 1 2OOS.O 1 2
I
'
__1 3Q0...1 .1 *SO 1 3 SO
OO 1 3OO30 1 S
re-I BOO
so i s1 TOO
-
n soo.so. _. i.e
•v-r-
.. 1 9.OO
— *-*,"V
2OOOS-0.., , . J2.O
J*~
21so QO
flRl00027

MAG-EITiCl-.FrLEILp
ss.s
ss.s
33. 7
SS.S
33,3
S3,*
33,3
33,2
SB. 1
_-----_--
S3 ——————— , ————— i1 1 OO . .1 2oo ——— ——— ii 300 oo 1 Soo 1 i soo ——— ——— i1 TOO
-• — «fc.«—
iaoo . | 1 soo
— tV*,?•-•
2OOO
, .-.i—-
" HTI ET..UGL3O
33.9
33. S
33.7
SS.S
SS.S
3-S.-*
33.3
33.2
33. 1
33
---
-1 1 OO 1 2OO :
SO 1 2SO 1 3
———— — -1 -VO.P ,
SO 1 4-1 SOO
SO " 1 3fC
1 SOOSO "1 Serr - - -
i PP.SO 17
i a'oo 1 1 900so" "faao is50 oo 2 1so oo
ftR!00028

i ooDO
so70
soso•*O
3O
2O
— i O— 2.0——3O
— -o— 3O
-
-
oo i 2so oo1 2
1 3so oo1 3so oo: 1 Sso oo
. 1 S1 Sso oo
1 S
J1 7
SO-
ur001 T
-H.fi1 •
i aso__ po__, _1S:
11 Bso
,PQ 2Oso oo
121
S.OOP21so
ORAD.! EMT;1 OO_
soa.o
CO
3O
1 3O
O— 1O— 2O— 3O
— SO
_---
---- - ---
oo 1 2so oo -3 2
i 3SO
\
OP13so ' '
=?:Ti
<_
oo
L.
jr-je
1 S3P._.
F-C
rJE
1 2SC
OO13
27T
OF132O
1 Sso
?AC
••••'-t
00
^IE:
w
1 7
INJT
oo
- ..-=.
1 Sso ...
_.
* -I**-
oo ="..'.a
Vi O
C r
oo so ____
soso
so30.*o3O20
10
: :_---__
30 i1 'oo 1 2QO—
SO -1 21 300
SO n 3so ooF-6
1 SOOSO . 1 S:er - so ; _ .-I"1" S
/vn-r\lV.
XA
w-
1 7OO 1 1 SOO30 . ., i so i "a
./Vv
1 BOOSO ;
-IE 1 3SO
soso
3O
J.O30-iO
1"po
,_-
:t-_._
i>1 O j—
30 --0 f-SO ' ——————
1 1 OO - i 200-3P -. -1 3
i
1 3OOso : i s 1 -1OOSO ' •*
i sooso . .13
A=—i
I
/J/ 1J. -I
^ 1 SOO -as.... -, .™i«
-, — \
~ \T " " "
|1
j!
-v .u -i
i
1 TOO J_ •> soos_o_ s.=- i Ts j. . i . ie
——— ri
'
1 OOOso
flHi00029

oososoTO
soso."*O
3O2"O"
TO
1O
2O
3O.
_
-
-
-
-
-
-
1 1OO 1 2OO 13OO " n *oo 1 SOO ... 1«
X
oo
-+.ft
I- y
*1 T
ffT———^
oo
yIS
1oo
I
IE: KIT
I
oo
so
eoso
3O2010
1 O
ao30_
---
u—
-
-1 'OO - 1 1.SO 1.2oo: -T2.SO" 1 3O.O 1 3
f30 1 •«-
-EEToo i *SO 1 3OO....1 33P 1 «
\OO i «
J*S.O
V ER Tl O^X\I _ ..G? F^ A.D fE rs! Tl_lrvE i ASOOO " ——— - - - - - - - - - - —._ ——————— -. ——— .- —— ——— _. . - - . —— -_ -— --
so7O
SO
3O201-O-o
1 O
203.OAO
----—
_—_—
"** rt\oo9Oso
soso1.O
3O
1O
1 O
3O10
- --
--—
-
1OOsoso
BO
SO
302O1 Oo
— 10
— 30
X/E:RTIOAL...GR/^DIEMT.. . . L.IME 1 SSO . „.„«.„. „ , -.., ™~ ™ «...,,. ,-.---- ..... - -., - - - --
-
~
-
-
- -
-
-
-
oo i 20030 1 2
1 3OOSO 13
1 AOOSO .1 *.
i sooso i s
i s'ooSP 1 B
17OO30 ..IT i »ooso ... i_e 1 BOO
00 ___. 2 S
4
2OOOso 20
•fyV
21 OO3O
ooooso7O
sosoAO
3O201 O
o-1 O
203O
AO
SO
_-
-- —-- -
—-
n i PO 1 2OPSO 1 2.
1 3OO .SO 1 33O
OO 1300SO 1 S
i sooSO 1 S
_1 700SO 1 7
....1-SOO —so . -i sSP.
-N— -*-
-1 *2OOO
so ao*P
jS RA=D I
100 !so p-so }—-o f-soso
3O
201Oo
— 10
— 3O—— AO
_
~
——
-
OO n 2OOSO 1 2
J 3OO3~O ~ 13
i AOO ,SO _1 J(.
130Pso 1 s
—— ——1 BOO
30 1 0—— —— i1 7OOSO 1 "7
i S'QO ..so i s
•;
—— ——
/
20003O 20
J\
21so oo
1 OO
9OSO
soso
~- AC
3O
_ -
~
-
F20. j-10
-,=— 2O
""o—— AO
— so
— .
:—
-
' 1 OO i aoo . _1.3QO 1 AOO 1 3OO 1 BOO 1 7OO iscis i a'oo , 2OOO
I
•v21 00

eoso
30
TO
o1O20
30
AO
so
-
—
-
i i oo1 -I 1 XOO30 12
1 3OOSO 13
1 AOOSO 1 A
1 SOOso i sfEE
1 eooso t sT
1 TOP..3O 1 "7
i sooso 1 a i sooso •> s 2OOO3O 203O
oosooO•7O
SO
30
AO
3020i o-o
1 O
20
30
AO
SO
_---_----
—-_—
1 •>oo 1 2OOSO 1 Z
1 3POSO 1 3
1 AO.Q. ..SO 1 A
1SOO30 IS
i esooSO 1 S
1 TOOSO 1 T
. 1 SOOso is i aooso. . i « 2OOOSO 20
213O
OO
oososoTO
sosoAO3O
201 Oo
1 O20
AOso
t_iME i aOO ,.,, . .
_—_————--_-
-1 I OO i 2OO"~ _ 1300 1 -"-OO. 1 SPO 1 SOO 1 TOO i soo 1 SOO 2.OOO
PO9OSOTO
«oso
3O
1Oo
1 O
20
^
"
-_--
AO
SO -
_•
i 1 OO 1 20O3O 1 2
1
___ 3.3OO-333 1 3so oo
1 A1 SOO
30. . . ISF-EE
1 BOOso isIT
1 TOOso 1 v 1 SOOSO 1 8
Ck— .
i «QP .SO 1 9
20.0:03O 2Oso

oososo7O
sosoAO3O201 Oo
1 O
203OAOso
_-_-_---
-
1 1oo . 1 20Q .3O 12
3 3OO30 1 3
1 AOOSO 1 A
i sooSO ... 1 S
F-GE1 BOP
SO 1 «rr1 TOO
SO 1 Vi aooso ia
--"*.
.1 SOOSO 1 9.
— >— .—•%_,_
200OSO 2P
.•=•1 ————
so
10&
so
TO
SO
so
3O
2O
1 O
o— 10— 20— 3O
— AO
— so
VERTICAL. GTRAOl ElN'T'." :" ' • ••• _ " - •t_ir-iE i B2O , . -, , • - t,
-
_
-
-
_
— -
.„_
i 1 oo 1 20P30 1 2
1 3OPSO 1 3
1 AOO,SO '1 A
i soo -so . i sp-ee
ti «oo3O . 1 Srr -
1 TOO30 1 -7
i aoo.so .is 1«OO*°. .. -1 *
20OOso . 2,03.0
1 00 ————so j—so-•ososoAO
3O
201 O
o— 10— 20
I!"
_
__-—-_-
1 1 OO i 2OOSO 1 3
1
i
1 3OOSO 1 3
1 AOQ ,SO 1 A
1 SOOso i sp-ee
i sooso i «rr1 7OOso i y 1 SOO Jso i s30" oo
1 Saooo
SO ._2Oso

ELECTROMAGNETIC DATA
NJR67/064R67.51 1-25

AP
3O
2O
1 p
O
1O
20
--
-
-
1 3SO
——
1 ASO-oo -is 1S30
OP - 1 6
—————
1 BSOOp. 1 T
1 TSOOP 1 8
——
1 OSOPO . 1 S
———
I
1 »3Ooo 20
riri
——
-~* _
20 SOPOT ._ 21
GP
5 J
— -v
fX3
*-+-
21 3,0OO - 22
229OOO
1 ASO . 1 SSO ... ...1.B3O 1,,T"i SCO i soo" ": i TOtr
- _ _ ^ _ _ ,.___.iso'o - ia.ao" SovSo . 2100 2200
IRiO

3SO 1 ASO 1 SSO 1 BSO . 1 TSO 1 aSO I SSO . 2030 2.1 SO 22SO
— 1 O —
~sx-iA.se
— 10 —
— 10 —
EM." OOMDOOTTVITVI_IC>JC 72O -—-———--
A
COP5OOCTIVITV-

— 10 —
^ Ci U C T j VI TV
EIV1 OOfxJso
AO
3O
2O
1O
1 O
-
_
I 3 SO
3
oo
<f*~
SO.—I1 3
fa
_ 1 S3Ooro - i soo : i 7 1 TSOoo • i a 1 S3O JOO .1 S
is so I apsooo 20:00 2 1 21o_oso 22SO
— 1O —
LJ1-4E 82P
| '-
3C. |-
•4'°
-4OCg
1 33O_
W P
OO is
ZB-,-JP
1 SSOoo _ i S
1 B3O00 . . " I T
1 73O .CO 1 S
is'soOP " 19
1i
is'so ! aosooo " 20 oo .." ~zioo
so.22
223OOO
COKTDoCTiviTr

E ivi " o o M i
Ss
AO
2O
' O
_ 1 o
-
-
-
1 •*•oo 1 Sso oo 1 <Soo1 O
1 TSO
ooF-e
1 Sso:er
oo1 S
———1 9
so
-
<f
————QO
——^
C
2Oso-
1~> —— ——
ooao
"% —
21so. . oo2.1so———oo
_ 1 O —
_
1 AOO. . 1 3OOSO ._J1_S
1 BOO J 1 7-PO.SO 1 BS.O 1 7
i aoo .3P i a
1341. 1 »OO ,
SO -1 S
cct i ~ ~|
~ _
->»»g.
2O OPso - . _gto 21 OO
SO 212200
so
— 10 —
_
1 A oo 1 3so
OO '1 3
1 S30
ooi S
1 7so' oo
1 "71 Ssooo
i SIS
so .
^^
oo. .19
S——— %
=w*«
. 20so
"% ——
oo j-2.Q
r?•NS-
2 13.O
oo.2,1
— 2.2,SO
oo:
_
k
I -1OO 1 SOOSO 1 S
1 SOOSO 1 0
1, 7QOSO 1 7
PE
— N,
,-I.SOPSO 1 BZET
- ~-p+— i-
1 SOOSO 1 S
200.0 ,so . 20so oo21
2200SO
SR10

ATTACHMENT 3
SEISMIC REFRACTION DATA
NJR67/064R67.51 - .,: . - -^-1-26 " f| R t Q

BOARHEAD FARMSSPREAD 1
t/1QZOo
30
20
10
0
- 10
-20
-30
-40
-5O
-5O
-70
-80
-90 -
-100
100
FEET- - -_-_-- --.7... ..." .__.... "1 _..".." T.::OBSERVED A OBSERVED" " " ""r
BOARHEAD FARMSSPREAD 1
TO 30 50: :,;:/7o :~-.l"_. : .gd ': . ".._..'i 10FEET_._" "" . ----•---—— - - - - - -=- —- -
o OBSERVED " " ~" """" - - - - - -

BOARHEAD FARMSSPREAD 2
TOO
FEETo OBSERVED A " OBSERVED"
BOAR HEAD "FARMSTSPREAD 2 -
J>U
20
10
0
-1.0
-20
-3O
-4Q
-50
-60
-70
-ao-90"
100
_
—————— B— E
O —— «
_
-
— "
,-
i
J — e- - —— S ——— -Q —— ——Eh ———— B —— : — S ———— S -D' .:•! !•' O: — • —— &—B — e —— '• ————
i i i r i i -, —— i ——— | — , — H
-1O 10 .30.,- -. —50. - ' -70 % 90 - 110
FEET " ."" V -"• ". "' ^ . .
flRlO

BOAR HEAD "FARMSPREAD 3
inQzo
FEET " ..D_ . MODELED _.-*-.. MODELED o MOO.EL.EtT" " A .OBSERVED " x OBSERVED '. .V OBSERVED
BOAR HEAD FARMSSPREAD 3- ~ '" M
30
2.0
10
0
- 10
-20
-30
-40
-50
-60
-70
-80
-90
-inn
-
T-
-
-
-
~ ,~
!
3D" — B-^ — a — r-e- — '"D- a "fl —— -e ——— o " " D '. ' a n '£3 —————— H —————— I —————— 1 —————— 1 —————— H | | , ---,-. ———— , —————— h__f__H -
1 . [ I 1 1 1 1 S I I
-10 10 3-0 50 " 70 ' - - -90" " . 110

BOARHEAD FARMSSPREAD 4
OO
100
FEET" "
o OBSERVED . 4 OBSERVED
BOARHEAD.'FABMS":SPREAD 4
20
10
0
-10
-20
-30
-40
-50
-60
-70
-30
-90'
mo.
———— a— i
-
-
- _
i
s — n _ = • -•• B — - — a — - — n. .:. — a.. , — a. l_ — B ——— B ——— B — : — B — e — s ————
i t i i i i i i i i i10 30 "50 - - _-:^.7Q' '- 90 . :."".. .110
FEET . - . . ...

BDARHEAD FARM'S"SPREAD 5 ""
oo
SO TOO
FEET" " "" """"o OBSERVED" " A OBSERVED
BOAR HEAD "SPREAD" 5"
JU
20
10
0
-10
-20
-30
-40
-50
-60
-7O
-SO
-90
100
-
H ———
-
-
,- "
i
j — D '-_: — B — : — 'B "' '" ' ET — '~-e-- —— a " ' ''D"" — !, a" " "^b "' "•" a — ta-'-g ————————————— 1 —————— 1 —————— 1 ————— ;= ———— i —————— H ————— 1 ————— rrh-r —— rH — H —— =F
i . i i t t i i < i i
to " o so".". ::... ..TO"" :".::::.-:.— 90:= • noFEET "." _: " " : . " "" """"" """~: .. r" -

BOARHEAD FARMS
Ozoo
TOO
FEET _ _ :_.:::.."...;."~i.:. ~~~~ ~o OBSERVED .._. A " OBSERVED" ~r"~" ''" " "~
BOARHEAD FARMS"SPREAD 5
30
20
10
0
-10
-20
-30
-40
-50
-60
-70
-SO
-90
100
—— a— — rt
__
——— I -_
,, - - ljlm „„. *1-'"11-' ^ ^ u-J._»_ .,,,.rn, , , - . . , .... ....„ ... , .
3 — B ———— B ———— B — : —— H —— -^— g —— U-B- —— -g-- -^ -j -— £. • " ._-":iJ '« '—f ————— i ————— i ————— i ——— -H ————— i —— j —— (.
——— — J ————— i ————— 1 ————— 1 _____ 1 _____ 1 _____ i _____ i ____ i_. . i i•10 1JD 30 50 • . 70 -."-' 90 110
FEEr " ' ." - . . . . _ : .

Oo
26
BOARHEAD FARMSSPREAD. 7. . . •
100
FEET " \ ~- " V'~o OBSERVED A OBSERVED
20
1.0
0
-10
-20
-30
-50
-60
-70
-80
-go"inn
-
-I ——o — .
-
-
-
-
"
BOAR HEAD FARMSSPREAD 7 - .;_..';_'" ". _____._L. ..-._-
i i t i i i . t .. r : t i i
231""
-10 • 1"0" 30 - 50 - 70" ' 90 " HOFEET - - - , - - - - = - - - - _ _ - - -——_--

BOARHEAD FARMSSPREAD 8 . ; --"--
moFEET - - - ; - "™ '- -" " -^- " -
o OBSERVED A OBSERVED"' " " -----"' —— '-L- --' -: =
BOARHEAD": FARMS"SPREAD" 8.
30
20
10
0
-10
-20"
-30
-40
-50
-60
-70
-80"
-90
mn . ________ ,
_____ - - : : _
-
-
_
O ——— i
-~
"-i- :_. r ~- •:-, _ . .. n~ -,,--'-- ,7-;.., • -.- -. - __.-,
i ?-"--- g ——— B^ —— D •-;-n".---:"a:--" -n- -a"J" Q" .:~5"n rn "i" —— i ——— * ——— i ——— t ——— i ——— i ——— i ——— i —— II?n Q 0 _.^ _____ A —— ft —— O
~10 10 3D . .50_ . -70--,. ~^" - =.-90 11O
FEET;; " 7 ..

BOARHEAD FARMSSPREAD 9
100
FETET .- . .- •: ._ — "" ,"o OBSERVED A OBSERVED' '
BQARKEAD. FARMS .::. TSPREAD 9 ' " : _. " " ~~ \.~~
J>U
20
1O
O
-10
-20
30
-4-0
-5O
-60
-70
-80
-90
-inn
-
———— a— E
o — »
-
-
_^__
-
,
3 — a_':-- g — : — B—. — 3 ——— B-1 —— a ——— ef — —§-•'••"• "a — • — £3 — e — H —— • ——, ^H ________ | ________ | ________ 1 ———————— 1 ———————— ! ———————— t ———————— 1 ——————— —— T —— T*
1 _ __ 1 1 1 1 1 t 1 < 1 1
-10 10 30 50 . _ .' ';70' ~~ " "90"-""*" " 110
FEET

BOAR HEAD FARMS:SPREAD. 10 _ . ._" .
40 60 """"""BO . -iooFEET -.:::." :_.: i
o OBSERVED A OBSERVED"
BOAR HEAD"" FARM'Sou
20
10
0
-10
-20
-30
-4O
-5O
-60
-70
-SO
-90
100
———— e— fH ———
_
-
-
-
-
- —— •
-
-
————— 1 ——— __
3 — D '""~: ' Q ———— a-~ — B— ——— B- ——— D" V ./-D' ' " .-Q - — '" 'ti '" L-"' D" 5 — a ———— : ——
__— «- —— ' "'''' "":"' T***- Ul N*J1 !'[.._'"T" ..-i 'i- '• '*'•- '•
1 : . . r t 1 1 1 i i t

i. (., *
oo
BOARHEAD FARMSSPREAD 11
30' 100
FE"ET - - -
o OBSERVED A OBSERVED
BOAR HEAD.. FARMSSPREAD 11 .
J>U
2.0
10
0
-10
-20-
-30
-40
-50
-6O
-70
•-30
-90
- i no
-
a •
-
-
-
~ " ^-
-
.
j — &-=--- Q • —— B — = — a ——— a'--- ' d —— "-B —— :.n".."":'"rr T _o — a " a — '• ———1
-~—— —— — - __ Sr - I?"*'"' Ij JX- ^ " " " "-'--- ->'•',
'
t \ , 1 1 1 I 1 1 1 1
-10 :ro . .-.30 -. soFEET

*• O f
OO
BOAR HEAD .FARMSSPREAD 12
100
FEET ... . .._. ... :. __.__.'. ._._.. .. ..o OBSERVED A J .OSS'EWETT '•-• - • - ; -
BOARHEAD'TARWS*"SPREAD "12 . . J_._L.
ou
20
10
0
-10
-20
-30
-40
-50
-60
-70
- SO
-90
-?00
-
H ———
0 —— *
-
-
-
_
•
3 — a — = — B ——— 3 — '--a ——— a' "" a."" — 'a """"VET"' "' "5" ' 'r'a "a" a ——— -— i ——— i ——— i ——— i ——— i ——— i ——— i ——— f ——— i ——— i — i — Ht —— ————— y ————— 6 —— 0 0 : ~ -- - •- - -- ----- - ..--.-. -- --
-
——— ——4 ——— ^-i —————— 1 —————— 1 —————— 1 ______ 1 ______ | ______ i ______ i i i
~10 10 30"- 50" "70 """"TTT 90 """ 110'
FEET" _ —-—— "" - --——.
flRlOOOSi

![Actin Reorganization Underlies Phototropin-Dependent · Actin Reorganization Underlies Phototropin-Dependent Positioning of Nuclei in Arabidopsis Leaf Cells1[W][OA] Kosei Iwabuchi*,](https://img.pdfslide.us/doc/110x75/5ead633633898c619e33c7a6/actin-reorganization-underlies-phototropin-actin-reorganization-underlies-phototropin-dependent.jpg)