Embed Size (px)
Citation preview
Prepared For:
City of BentonvilleJanuary 2, 2014
City Wide Traffic StudyVolume 4 – Future Corridors
Bentonville City Wide Traffic StudyFuture Corridors
Garver Project No. 12017630 Page i
Table of Contents
Table of Contents ........................................................................................................................................... i List of Figures ................................................................................................................................................ iii List of Tables ................................................................................................................................................ iv 1.0 Introduction ........................................................................................................................................ 2 2.0 Functional Classification ................................................................................................................... 3
2.1 Major Arterial ..................................................................................................................................... 3 2.2 Minor Arterial ..................................................................................................................................... 3 2.3 Collector ............................................................................................................................................ 4
3.0 Previous Traffic Studies/Projects ...................................................................................................... 7 3.1 2002 City of Bentonville Streets Capital Improvements Plan ........................................................... 7 3.2 Bentonville Public Schools Study ...................................................................................................... 7 3.3 North Walton Boulevard Corridor Enhancement Plan ...................................................................... 8 3.4 SE/SW 8th Street Improvement Project ............................................................................................. 8 3.5 NW 5th Street Extension Project ........................................................................................................ 8 3.6 SW Regional Airport Boulevard Widening Project ............................................................................ 8 3.7 Final Analysis Study .......................................................................................................................... 9
3.7.1 SW 2nd Street ............................................................................................................................ 9 3.7.2 NW 5th Street ............................................................................................................................. 9 3.7.3 SW 10th Street ........................................................................................................................... 9 3.7.4 SE/SW 14th Street ..................................................................................................................... 9 3.7.5 SE/SW 28th Street ................................................................................................................... 10 3.7.6 NE/SE J Street ........................................................................................................................ 10 3.7.7 E/W Central Avenue ................................................................................................................ 10 3.7.8 N/S Walton Boulevard ............................................................................................................. 11
4.0 Growth Corridors ............................................................................................................................. 12 5.0 Travel Time Runs ............................................................................................................................ 15
5.1 SE/SW 8th Street Corridor ............................................................................................................... 17 5.2 SE/SW 14th Street (Hwy 102) Corridor .......................................................................................... 17 5.3 SE 28th Street Corridor .................................................................................................................... 18 5.4 SW A Street Corridor ...................................................................................................................... 19
Bentonville City Wide Traffic StudyFuture Corridors
Garver Project No. 12017630 Page ii
5.5 SW H Street/SW I Street Corridor ................................................................................................... 19 5.6 NE/SE J Street Corridor .................................................................................................................. 20 5.7 E/W Central Avenue/SW 2nd Street Corridor .................................................................................. 20 5.8 SE Moberly Lane Corridor ............................................................................................................... 21 5.9 SW Regional Airport Boulevard (Hwy 12) Corridor ......................................................................... 22 5.10 Tiger Boulevard Corridor ............................................................................................................. 22 5.11 N/S Walton Boulevard (Hwy 71B) Corridor ................................................................................. 23
6.0 Observations ................................................................................................................................... 24 6.1 Field Observations .......................................................................................................................... 24
6.1.1 SW 8th Street ........................................................................................................................... 24 6.1.2 SW A Street ............................................................................................................................. 24 6.1.3 NE/SE J Street ........................................................................................................................ 24 6.1.4 Tiger Boulevard ....................................................................................................................... 25 6.1.5 N/S Walton Boulevard ............................................................................................................. 25
6.2 SimTraffic Simulations .................................................................................................................... 26 6.2.1 SW 8th Street ........................................................................................................................... 26 6.2.2 SE/SW 14th Street ................................................................................................................... 26 6.2.3 SW A Street ............................................................................................................................. 26 6.2.4 Moberly Lane ........................................................................................................................... 26
7.0 Level of Service ............................................................................................................................... 27 7.1 Northwest Arkansas Regional Planning Commission (NWARPC) Travel Demand Model............. 27 7.2 Two-Lane Highway Analysis ........................................................................................................... 31 7.3 Arterial Analysis .............................................................................................................................. 31
7.3.1 SE/SW 14th Street ................................................................................................................... 33 7.3.2 SW Regional Airport Boulevard .............................................................................................. 33 7.3.3 S Walton Boulevard ................................................................................................................ 33
8.0 Recommendations .......................................................................................................................... 34 8.1 Mid-Term Projects (5-10 Years) ...................................................................................................... 34
8.1.1 SW 2nd Street – western city limits to W Central Avenue........................................................ 35 8.1.2 NW 5th Street – Extension to N Walton Boulevard .................................................................. 34 8.1.3 SW 10th Street – Connection to Redbud Street ...................................................................... 36 8.1.4 SE/SW 14th Street ................................................................................................................... 36
Bentonville City Wide Traffic StudyFuture Corridors
Garver Project No. 12017630 Page iii
8.1.5 SE/SW 28th Street ................................................................................................................... 38 8.1.6 NE J Street – E Central Avenue to John DeShields Boulevard/Museum Way ....................... 39 8.1.7 E Central Avenue – I-540 to Eastern City Limits ..................................................................... 40 8.1.8 W Central Avenue – SW 2nd Street to N/S Walton Boulevard ................................................ 40 8.1.9 N/S Walton Boulevard ............................................................................................................. 41
8.2 Long-Term Projects (10-15 Years) ................................................................................................. 42 8.2.1 SE/SW 14th Street ................................................................................................................... 42 8.2.2 N/S Walton Boulevard ............................................................................................................. 43
8.3 Future Projects (15-20 Years) ......................................................................................................... 43
List of Figures
Figure 1: Functional Classification ................................................................................................................ 6 Figure 2: Existing Annual Growth Rates ..................................................................................................... 14 Figure 3: Travel Time Runs ......................................................................................................................... 16 Figure 4: Volume-to-capacity LOS Results-2010 ....................................................................................... 29 Figure 5: Volume-to-capacity LOS Results-2035 ....................................................................................... 30 Figure 6: NW 5th Street – Mid-Term Improvements .................................................................................... 34 Figure 7: NW 5th Street Extension – Conceptual Plan ................................................................................ 35 Figure 8: SW 2nd Street – Mid-Term Improvements ................................................................................... 35 Figure 9: SW 10th Street – Mid-Term Improvements .................................................................................. 36 Figure 10: SE/SW 14th Street – Mid-Term Improvements .......................................................................... 38 Figure 11: SE 28th Street – Mid-Term Improvements ................................................................................. 39 Figure 12: NE J Street – Mid-Term Improvements ..................................................................................... 39 Figure 13: E Central Avenue –Mid-Term Improvements ............................................................................ 40 Figure 14: W Central Avenue –Mid-Term Improvements ........................................................................... 41 Figure 15: SE Walton Boulevard – Mid- Term Improvements .................................................................... 42 Figure 16: SE/SW 14th Street – Long-Term Improvements ........................................................................ 42 Figure 17: N/S Walton Boulevard – Long-Term Improvements .................................................................. 43
Bentonville City Wide Traffic StudyFuture Corridors
Garver Project No. 12017630 Page iv
List of Tables
Table 1: Existing AGR (Over 7%) .............................................................................................................. 12 Table 2: Existing AGR (5% - 7%) ............................................................................................................... 13 Table 3: Travel Time Run Average Speeds – SE/SW 8th Street ................................................................ 17 Table 4: Travel Time Run Average Speeds – SE/SW 14th St (Hwy 102) ................................................... 18 Table 5: Travel Time Run Average Speeds – SE/SW 28th Street .............................................................. 18 Table 6: Travel Time Run Average Speeds – NW/SW A St ....................................................................... 19 Table 7: Travel Time Run Average Speeds – SW H St/SW I St ................................................................. 19 Table 8: Travel Time Run Average Speeds – NE/SE J St .......................................................................... 20 Table 9: Travel Time Run Average Speeds – E/W Central Avenue/SW 2nd Street .................................... 21 Table 10: Travel Time Run Average Speeds – Moberly Ln ........................................................................ 21 Table 11: Travel Time Run Average Speeds – SW Regional Airport Blvd (Hwy 12) ................................. 22 Table 12: Travel Time Run Average Speeds – Tiger Blvd ......................................................................... 22 Table 13: Travel Time Run Average Speeds – Walton Blvd (Hwy 71B) .................................................... 23 Table 14: 2013 HIGHPLAN Results ............................................................................................................ 31 Table 15: State Signalized Arterials ............................................................................................................ 31 Table 16: 2012 Arterial Analysis ................................................................................................................. 32 Table 17: 2012 Arterial Analysis (Cont.) ..................................................................................................... 33
Bentonville City Wide Traffic StudyFuture Corridors
Garver Project No. 12017630 Page 2
1.0 Introduction
In 2011, Arkansas Business named Bentonville as a 2011 City of Distinction in the categories of Main Street Preservation and Quality of Life. With the level of planning and improvements already invested in revitalizing downtown Bentonville, this is no surprise. Conscious efforts to transform Bentonville into a unique destination began in 2007. With the development of the Crystal Bridges Museum, city council members saw the need to accommodate increased traffic in order to draw tourists from the museum into downtown. Therefore, a $110 million capital-improvement bond was passed which focused on improving the downtown infrastructure including widening roads, installing traffic signals, and rebuilding sidewalks. As local residents saw the revitalization of their downtown taking shape, they joined in the efforts to restore their property and to open a number of unique shops and diners in the downtown area. With the museum opening and the myriad of businesses flourishing, the number of people traveling through Bentonville has multiplied far beyond what was initially anticipated. In order to continue to accommodate this rapid growth within the city, the infrastructure must be evaluated to maximize the benefit of future infrastructure improvements. Moving forward, the city has already planned improvements which are either currently under construction or are planned for the near future. These improvements include extending SE/SW 8th Street to intersect with I-540, interchange improvements at Highway 62/102, and widening SW Regional Airport Boulevard (Highway 12). Additionally, AHTD has plans to widen I-540 from four lanes to six lanes from Fayetteville north. This widening includes improvements to the interchanges at Highway 72 (Central Avenue) and Highway 71 B (SE Walton Boulevard), including the intersection of SE Walton Boulevard at Moberly Lane. At the request of the City of Bentonville, Garver conducted this study of the corridors. The goal of the Future Projects Study was to identify future (2020, 2025, 2030, and 2035) corridor projects. In developing the list of recommended projects, the following parameters were considered.
• Functional Classification – Major/minor arterials as well as collector roads were evaluated • Previous Traffic Studies/Projects – Studies completed within the past ten years were reviewed • Growth Corridors – Existing growth rates throughout the city were developed • Travel Time Runs – Travel time runs were conducted along a number of major corridors • Observations – Observations (field and simulated) were made of the existing system • Level of Service – Existing and future level of service was determined along the corridors
Bentonville City Wide Traffic StudyFuture Corridors
Garver Project No. 12017630 Page 3
2.0 Functional Classification
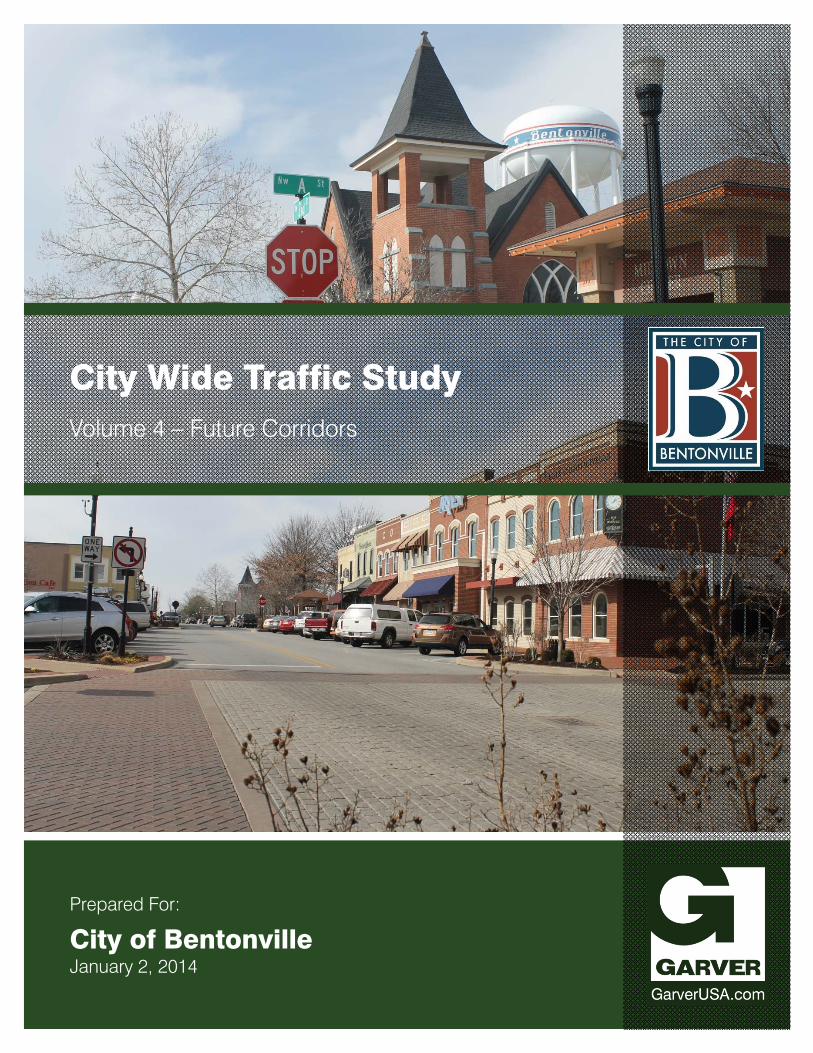
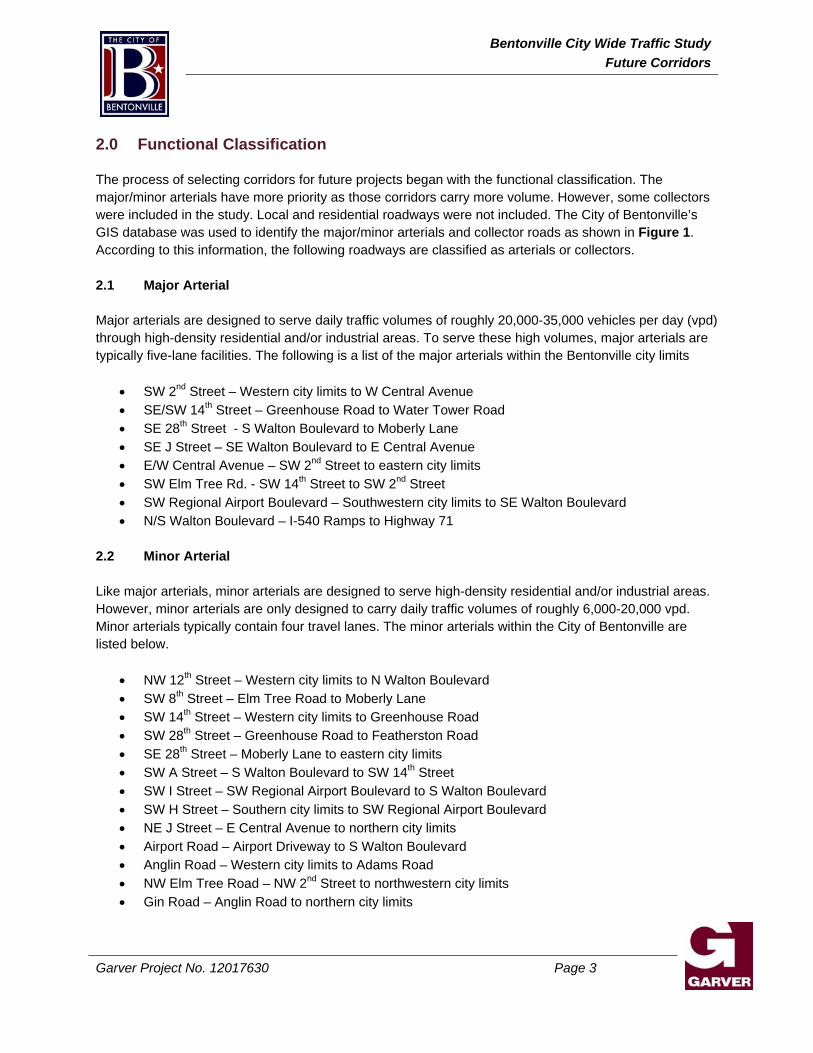
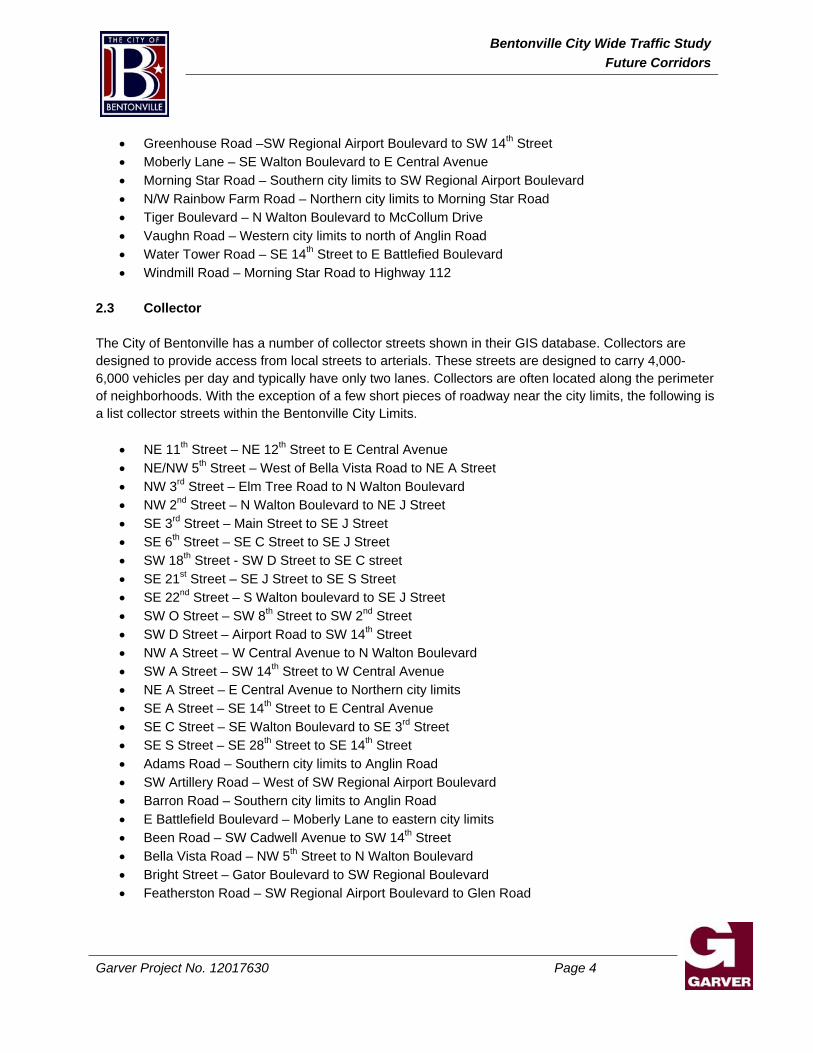
The process of selecting corridors for future projects began with the functional classification. The major/minor arterials have more priority as those corridors carry more volume. However, some collectors were included in the study. Local and residential roadways were not included. The City of Bentonville’s GIS database was used to identify the major/minor arterials and collector roads as shown in Figure 1. According to this information, the following roadways are classified as arterials or collectors. 2.1 Major Arterial Major arterials are designed to serve daily traffic volumes of roughly 20,000-35,000 vehicles per day (vpd) through high-density residential and/or industrial areas. To serve these high volumes, major arterials are typically five-lane facilities. The following is a list of the major arterials within the Bentonville city limits
• SW 2nd Street – Western city limits to W Central Avenue • SE/SW 14th Street – Greenhouse Road to Water Tower Road • SE 28th Street - S Walton Boulevard to Moberly Lane • SE J Street – SE Walton Boulevard to E Central Avenue • E/W Central Avenue – SW 2nd Street to eastern city limits • SW Elm Tree Rd. - SW 14th Street to SW 2nd Street • SW Regional Airport Boulevard – Southwestern city limits to SE Walton Boulevard • N/S Walton Boulevard – I-540 Ramps to Highway 71
2.2 Minor Arterial Like major arterials, minor arterials are designed to serve high-density residential and/or industrial areas. However, minor arterials are only designed to carry daily traffic volumes of roughly 6,000-20,000 vpd. Minor arterials typically contain four travel lanes. The minor arterials within the City of Bentonville are listed below.
• NW 12th Street – Western city limits to N Walton Boulevard • SW 8th Street – Elm Tree Road to Moberly Lane • SW 14th Street – Western city limits to Greenhouse Road • SW 28th Street – Greenhouse Road to Featherston Road • SE 28th Street – Moberly Lane to eastern city limits • SW A Street – S Walton Boulevard to SW 14th Street • SW I Street – SW Regional Airport Boulevard to S Walton Boulevard • SW H Street – Southern city limits to SW Regional Airport Boulevard • NE J Street – E Central Avenue to northern city limits • Airport Road – Airport Driveway to S Walton Boulevard • Anglin Road – Western city limits to Adams Road • NW Elm Tree Road – NW 2nd Street to northwestern city limits • Gin Road – Anglin Road to northern city limits
Bentonville City Wide Traffic StudyFuture Corridors
Garver Project No. 12017630 Page 4
• Greenhouse Road –SW Regional Airport Boulevard to SW 14th Street • Moberly Lane – SE Walton Boulevard to E Central Avenue • Morning Star Road – Southern city limits to SW Regional Airport Boulevard • N/W Rainbow Farm Road – Northern city limits to Morning Star Road • Tiger Boulevard – N Walton Boulevard to McCollum Drive • Vaughn Road – Western city limits to north of Anglin Road • Water Tower Road – SE 14th Street to E Battlefied Boulevard • Windmill Road – Morning Star Road to Highway 112
2.3 Collector The City of Bentonville has a number of collector streets shown in their GIS database. Collectors are designed to provide access from local streets to arterials. These streets are designed to carry 4,000-6,000 vehicles per day and typically have only two lanes. Collectors are often located along the perimeter of neighborhoods. With the exception of a few short pieces of roadway near the city limits, the following is a list collector streets within the Bentonville City Limits.
• NE 11th Street – NE 12th Street to E Central Avenue • NE/NW 5th Street – West of Bella Vista Road to NE A Street • NW 3rd Street – Elm Tree Road to N Walton Boulevard • NW 2nd Street – N Walton Boulevard to NE J Street • SE 3rd Street – Main Street to SE J Street • SE 6th Street – SE C Street to SE J Street • SW 18th Street - SW D Street to SE C street • SE 21st Street – SE J Street to SE S Street • SE 22nd Street – S Walton boulevard to SE J Street • SW O Street – SW 8th Street to SW 2nd Street • SW D Street – Airport Road to SW 14th Street • NW A Street – W Central Avenue to N Walton Boulevard • SW A Street – SW 14th Street to W Central Avenue • NE A Street – E Central Avenue to Northern city limits • SE A Street – SE 14th Street to E Central Avenue • SE C Street – SE Walton Boulevard to SE 3rd Street • SE S Street – SE 28th Street to SE 14th Street • Adams Road – Southern city limits to Anglin Road • SW Artillery Road – West of SW Regional Airport Boulevard • Barron Road – Southern city limits to Anglin Road • E Battlefield Boulevard – Moberly Lane to eastern city limits • Been Road – SW Cadwell Avenue to SW 14th Street • Bella Vista Road – NW 5th Street to N Walton Boulevard • Bright Street – Gator Boulevard to SW Regional Boulevard • Featherston Road – SW Regional Airport Boulevard to Glen Road
Bentonville City Wide Traffic StudyFuture Corridors
Garver Project No. 12017630 Page 5
• Gator Boulevard – Bright Road to Highway 112 • Glen Road – Greenhouse Road to Been Road • Hugh Tator Black Road – SW 14th Street to SW 2nd Street • NE John DeShields Boulevard – NE J Street to E Central Avenue • Main Street – SW 14th Street to W Central Avenue • McCollum Drive – E Central Avenue to northern city limits • Medical Center Parkway – Southern city limits to SW 28th Street • Moberly lane – E Central Avenue to NE John DeShields Boulevard • Nomad Road – SW Regional Airport Boulevard to southern city limits • Oakwood Avenue – Bella Vista Road to N Walton Boulevard • Open/Lenda Road – Barron Road to W Rainbow Farm Road • Piercy Road – Barron Road to Adams Road • SE Regional Medical Center Parkway – SE Walton Boulevard to SE 28th Street • Rice Road – North end to Taylor Road • Shell Road – N Rainbow Farm Road to SW Regional Airport Boulevard • Scroggins Road – Morning Star Road to eastern city limits • Taylor Road – Rice Road to north Price Coffee Road • Town Vu Road – Western city limits to Hugh Tator Black Road • Tunbridge Drive – SW 14th Street to SW 2nd Street • NE Woods Creek Road – E Battlefield Boulevard to E Central Avenue
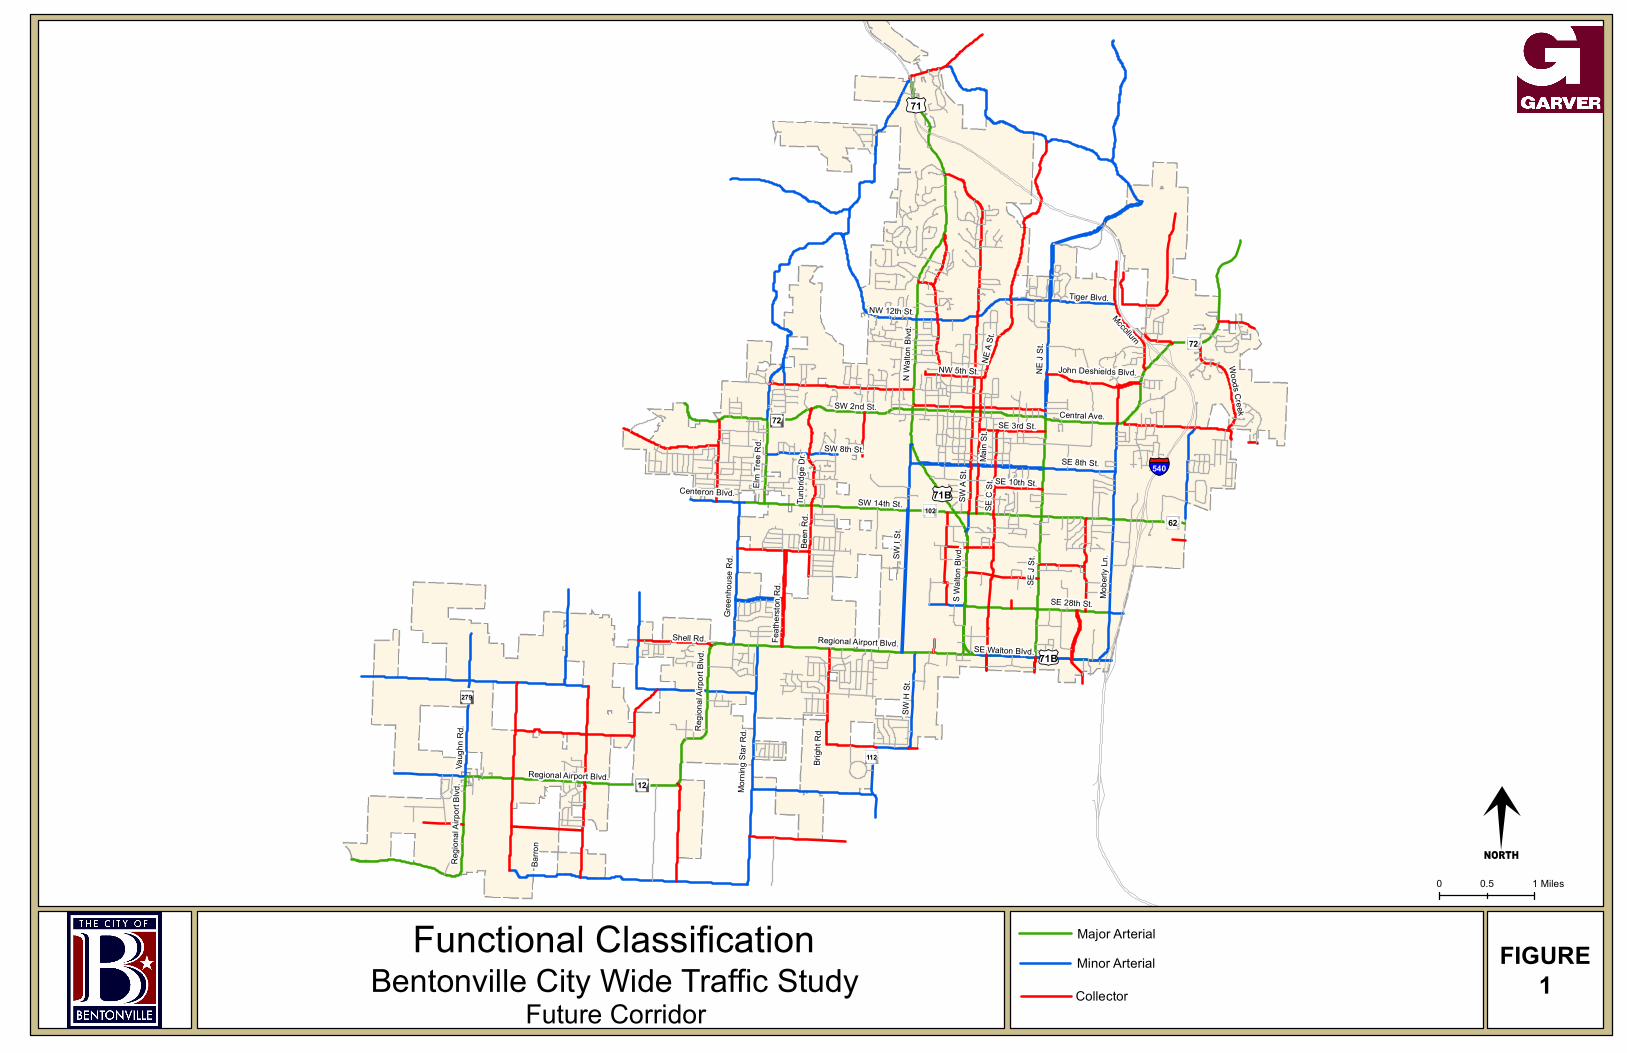
FIGURE 1
SW A
St.
SE J
St.
SE 8th St.
SW 14th St.
N Wa
lton B
lvd.
SW H
St.
SE C
St.
SE 28th St.
Tiger Blvd.
Mobe
rly Ln
.
Main
St.
SE 3rd St.
Brigh
t Rd.
Barro
n
Shell Rd.
SW I S
t.
Regio
nal A
irport
Blvd
.
Regio
nal A
irport
Blvd
. ¬12
£¤71
Vaug
hn R
d.
NE A
St.
NW 5th St.
NW 12th St. Mccollum
Regional Airport Blvd.
NE J
St.
Feath
erston
Rd.
Gree
nhou
se R
d.
Woods Creek
Been
Rd.
Tunb
ridge
Dr.
¬112
¬72
John Deshields Blvd.
Centeron Blvd.
S Walt
on Bl
vd.
§̈¦540
¬72
Morni
ng St
ar Rd
.
SE 10th St.
Regional Airport Blvd.
SW 2nd St. Central Ave.
SW 8th St.
Elm Tr
ee R
d.
SE Walton Blvd.
£¤71B¬102
¬279
£¤71B
¬62
M0 10.5 Miles
Functional ClassificationFuture Corridor
Major Arterial
CollectorBentonville City Wide Traffic Study Minor Arterial
Bentonville City Wide Traffic StudyFuture Corridors
Garver Project No. 12017630 Page 7
3.0 Previous Traffic Studies/Projects
Garver gathered available studies that have been performed in the city in the past ten years. In particular, we reviewed the 2002 City of Bentonville Streets Capital Improvements Plan, the North Walton Boulevard Corridor Enhancement Plan, the Bentonville Public Schools Study, the 8th Street Improvement Project, and the NW 5th Street extension concept. Finally, we revisited a study performed by Garver in 2009 as part of the SW Regional Airport Boulevard (Hwy 12) widening project from Shell Road to S Walton Boulevard (Hwy 71B). 3.1 2002 City of Bentonville Streets Capital Improvements Plan The 2002 City of Bentonville Streets Capital Improvements Plan (2002 CIP) performed by Peters & Associates evaluated existing and future traffic operations in the City of Bentonville. Most applicable for this study were the recommendations for the future corridor. From that list of recommendations, the following non-intersection projects have not been completed and could be candidates for recommendation in this study.
• NW 5th Street from Bella Vista Road to NW A Street – Widen to a 3-lane collector • SE 8th Street from SE J Street to SW A Street – Construct to minor arterial • SE 8th Street from SW A Street to SW D Street – Construct to minor arterial • SE 8th Street from Moberly Lane to SE J Street – Construct minor arterial • SE 18th Street from S Walton Boulevard (Hwy 71B) to Signature Drive – Widen to a 3-lane
collector • NW A Street from Tiger Boulevard to N Walton Boulevard – Construct to a 3-lane minor arterial • NW A Street from W Central Avenue to Tiger Boulevard – Construct 3-lane minor arterial • SW A Street from SE Walton Boulevard to SE 14th Street – Construct 3-lane minor arterial • SW A Street from SE 14th Street to SE 8th Street – Construct 3-lane minor arterial • SW A Street from SE 8th Street to W Central Avenue – Construct 3-lane minor arterial • Bella Vista Road from N Walton Boulevard to NW 5th Street – Widen to a 3-lane collector • E Central Avenue from Highway 72 to eastern city limits – Widen to a 3-lane collector • Moberly Lane from E Central Avenue to John DeShields Boulevard – Construct to a 3-lane
collector • Tiger Boulevard from N Walton Boulevard to NW A Street – Widen to a 3-lane collector • Water Tower Road from SE 14th Street to E Central Avenue – Widen to a 3-lane collector
3.2 Bentonville Public Schools Study The 2010 Peters & Associates study addressed the corridor issues around a new multiple-school site in southwest Bentonville. The study area was bound by Morning Star Road on the west, SW I Street/SW H Street (Hwy 112) on the east, SW Regional Airport Boulevard (Hwy 12) on the north, and Windmill Road on the south. Corridor improvement projects mentioned in this document that have not been completed are as follows:
Bentonville City Wide Traffic StudyFuture Corridors
Garver Project No. 12017630 Page 8
• Bright Street – Extend from SW Regional Airport Boulevard to SW 28th Street • Bright Road – Widen to a 3-lane roadway • Gator Road – Widen to a 3-lane roadway • SW Regional Airport Boulevard – Complete the widening to five lanes throughout the study area.
3.3 North Walton Boulevard Corridor Enhancement Plan The North Walton Boulevard Corridor Enhancement Plan (February 2013) was developed by the City of Bentonville to provide recommendations for access, aesthetics, and activity. The limits of this 1.37 mile corridor study were from W Central Avenue on the south to Ridgefield Street on the north. Concerns from the public were noted about the lack of east/west connectivety between NW 2nd Street on the south and Tiger Boulevard/NW 12th Street on the north. One such opportunity for better connectivity along this nearly one mile section of N Walton Boulevard is the extension of NW 5th Street from its dead end near Bella Vista Road to N Walton Boulevard at the Wal-Mart Drive intersection. An extension of NW 15th Street to N Walton Boulevard was also mentioned in this document. Currently, there is a dirt road from the end of NW 15th Street that leads to N Walton Boulevard. Finally, access management along this corridor to improve ingress/egress to businesses was mentioned. 3.4 SE/SW 8th Street Improvement Project The SE/SW 8th Street Improvement Project designed by Burns & McDonnell is an ongoing project which will include the reconstruction/widening of 8th Street between SW I Street and Moberly Lane and the extension of 8th Street from Moberly Lane to I-540 including a new interchange. Information provided by the City of Bentonville included a summary of the project, a project schedule, and 2010 turning movement data. Because of this improvement project, no additional improvements are recommended for SE/SW 8th Street between SW I Street and I-540. 3.5 NW 5th Street Extension Project Conceptual plans were developed by Morrison-Shipley Engineers for the extension of NW 5th Street from its dead end west of its intersection with Bella Vista Road to N Walton Boulevard across from Wal-Mart Drive. This project includes modification to the intersection at Bella Vista Road to include a westbound channelized right turn lane and better alignment to the south with Dickson Street. (Note: The Final Analysis study recommends a roundabout instead.) At the new intersection on N Walton Boulevard, a dedicated left turn lane would be added to the two lane road. 3.6 SW Regional Airport Boulevard Widening Project The limits of SW Regional Airport Boulevard widening project are from Shell Road on the west to the intersection at S Walton Boulevard on the east. This project includes the completion of the widening to five lanes along this section of the corridor. No additional corridor improvements are recommended for this portion of SW Regional Airport Boulevard.
Bentonville City Wide Traffic StudyFuture Corridors
Garver Project No. 12017630 Page 9
3.7 Final Analysis Study As part of Garver’s current Final Analysis study, the following corridors were identified as either needing improvement or as having additional capacity to alleviate adjacent corridors. Those corridors having additional capacity included NW 5th Street and SW 10th Street. The corridors in need of widening are listed below.
• SW 2nd Street • SE/SW 14th Street • SE/SW 28th Street • NE/SE J Street • E/W Central Avenue • Tiger Boulevard • N/S Walton Boulevard
3.7.1 NW 5th Street The NWARPC travel demand model indicated approximately 2500 vpd could be diverted from other busy corridors to NW 5th Street if this roadway is extended to N Walton Boulevard. The intersection of N Walton Boulevard at Wal-Mart Drive/NW 5th Street extension and the intersection of NW 5th Street at Bella Vista Road were evaluated to determine if the extension would have a negative impact. Based on the analysis of these intersections, the extension of NW 5th Street would not have a negative impact. 3.7.2 SW 2nd Street Results from the analysis of SW 2nd Street at Elm Tree Road indicated the need to widen SW 2nd Street to provide two thru lanes in each direction. 3.7.3 SW 10th Street Information provided by the NWARPC travel demand model indicated that only approximately 500 vpd would be diverted to SW 10th Street if this roadway is extended from its existing dead-end to connect with Redbud Street. The intersection of S Walton Boulevard at Redbud Street extension and the intersection of SW 10th Street at SW A Street were evaluated to determine if the extension would have a negative impact. Based on the analysis of these intersections, the extension of SW 10th Street would not have a negative impact. 3.7.4 SE/SW 14th Street Although only one intersection along this corridor was studied, results from other study intersections indicate that issues along SE/SW 14th Street are impacting the surrounding transportation system with long queues backing into adjacent intersections. At the intersection of SE/SW 14th Street at Phyllis Street, right-in/right-out access management strategies are recommended. An access management study should
Bentonville City Wide Traffic StudyFuture Corridors
Garver Project No. 12017630 Page 10
be performed along this corridor to determine what additional measures can be taken. With the use of access management techniques such as raised medians and consolidated driveways along a corridor, fewer conflict points occur thus increasing the flow of traffic and reducing the potential for crashes. Currently, SE/SW 14th Street is coordinated from SW I Street to Water Tower Road. The timings are updated on an annual basis. It is recommended that this continue. For longer term solutions, the city should consider some type of adaptive signal system which updates timings on a continual basis throughout the day. 3.7.5 SE/SW 28th Street Two intersections along SE 28th Street were studied –SE J Street and SE Medical Center Parkway. For both intersections, widening of SE 28th Street is needed within 5-10 years in order to provide adequate level of service (LOS). It is recommended that the widening occur from S Walton Boulevard to Moberly Lane. 3.7.6 NE/SE J Street Several intersections along NE/SE J Street were studied. These included John DeShields Boulevard/Museum Way, E Central Avenue, and SE 28th Street. The results indicate the need to widen NE J Street to a four/five-lane facility from John DeShields Boulevard/Museum Way to E Central Avenue. Additionally, the signalized intersections along SE J Street between SE 28th Street and E Central Avenue should be coordinated. 3.7.7 E/W Central Avenue Results from the study of the intersections of N/S Walton Boulevard at W Central Avenue and SE J Street at E Central Avenue indicate widening is needed along E/W Central Avenue. W Central Avenue should be widened from its tie-in with SW 2nd Street to N/S Walton Boulevard. To the east of this intersection, the corridor needs to taper back to a two-lane roadway because of the neighborhood/downtown zone. The improvements at the intersection of E Central Avenue and SE J Street were developed to prevent widening the west leg of E Central Avenue heading towards downtown. The E Central Avenue intersections at Martin Luther King Jr. Parkway, Moberly Lane, and the I-540 Ramps are currently running coordinated timings. These timings should be updated every 3-5 years and should include the entire corridor of E/W Central Avenue. An adaptive signal system should be considered. 3.7.8 Tiger Boulevard The analysis of N Walton Boulevard at Tiger Boulevard/NW 12th Street indicated the need for a very long left turn lane on the east approach of Tiger Boulevard. In lieu of a left turn lane, Tiger Boulevard could be widened to accommodate a TWLTL.
Bentonville City Wide Traffic StudyFuture Corridors
Garver Project No. 12017630 Page 11
3.7.9 N/S Walton Boulevard The Final Analysis study included five intersections along N/S Walton Boulevard. These intersections were at Tiger Boulevard, Wal-Mart Drive, Central Avenue, Redbud Street, and SE Medical Center Parkway. For the majority of the route, widening of N/S Walton Boulevard is not needed. However, the results from the intersection of SE Walton Boulevard at SE Medical Center Parkway indicate that widening is indeed needed. At this location, the 2015 improvements would fail by the year 2020, and the additional improvements would yield LOS E by 2035. Although the study did not include the intersection of S Walton Boulevard at SE 14th Street, this intersection’s impact on the surrounding intersections demonstrates the need for improvements such as widening. Therefore, as a minimum, the limits of the recommended widening are from S Walton Boulevard at SE 14th Street through the I-540 interchange. Currently, the signals along N/S Walton Boulevard are coordinated from Tiger Boulevard/NW 12th Street to SE 14th Street. The timings for these are updated on an annual basis. In addition, the intersections at SE J Street and SE Medical Center Parkway are also coordinated. It is recommended that the entire corridor be coordinated with updates to the timings at least every 3-5 years. In addition, the installation of Flashing Yellow Arrow (FYA) signals is recommended to provide for better coordination. Also, an adaptive signal system should be considered along this corridor. Finally, access management studies should be performed along this corridor to determine what measures can be taken to improve traffic flow.
Bentonville City Wide Traffic StudyFuture Corridors
Garver Project No. 12017630 Page 12
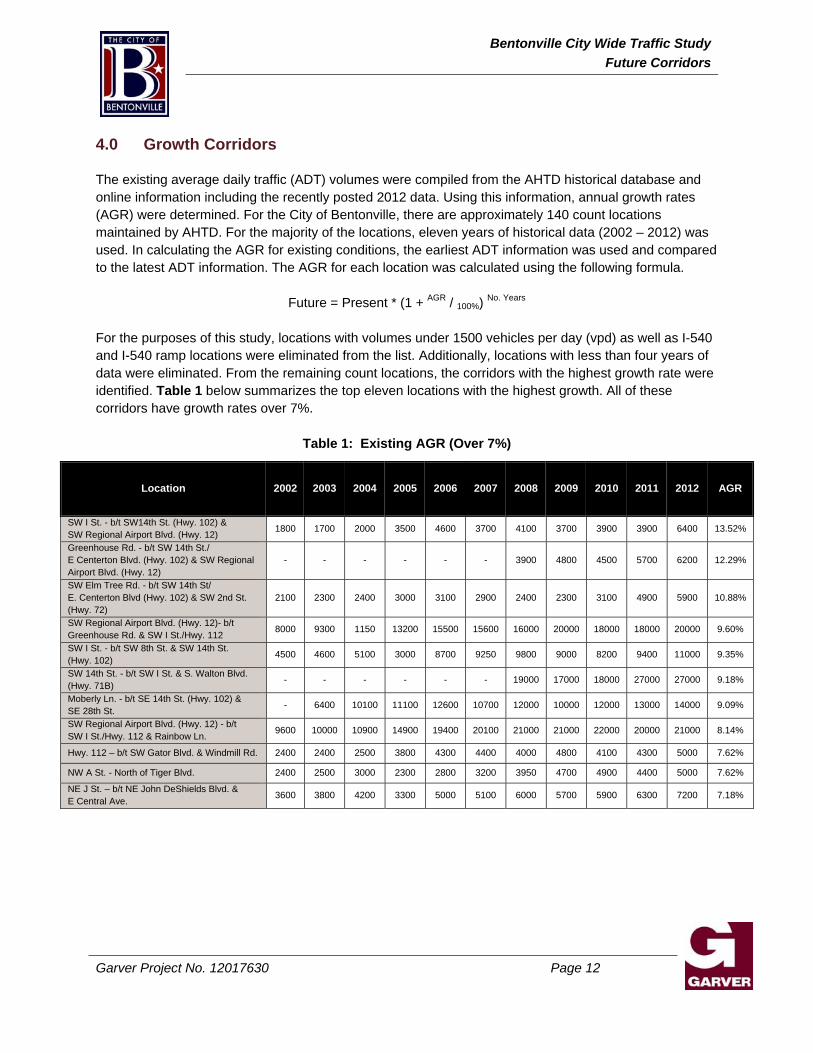
4.0 Growth Corridors
The existing average daily traffic (ADT) volumes were compiled from the AHTD historical database and online information including the recently posted 2012 data. Using this information, annual growth rates (AGR) were determined. For the City of Bentonville, there are approximately 140 count locations maintained by AHTD. For the majority of the locations, eleven years of historical data (2002 – 2012) was used. In calculating the AGR for existing conditions, the earliest ADT information was used and compared to the latest ADT information. The AGR for each location was calculated using the following formula.
Future = Present * (1 + AGR / 100%) No. Years
For the purposes of this study, locations with volumes under 1500 vehicles per day (vpd) as well as I-540 and I-540 ramp locations were eliminated from the list. Additionally, locations with less than four years of data were eliminated. From the remaining count locations, the corridors with the highest growth rate were identified. Table 1 below summarizes the top eleven locations with the highest growth. All of these corridors have growth rates over 7%.
Table 1: Existing AGR (Over 7%)
Location 2002 2003 2004 2005 2006 2007 2008 2009 2010 2011 2012 AGR
SW I St. - b/t SW14th St. (Hwy. 102) & SW Regional Airport Blvd. (Hwy. 12) 1800 1700 2000 3500 4600 3700 4100 3700 3900 3900 6400 13.52%
Greenhouse Rd. - b/t SW 14th St./ E Centerton Blvd. (Hwy. 102) & SW Regional Airport Blvd. (Hwy. 12)
- - - - - - 3900 4800 4500 5700 6200 12.29%
SW Elm Tree Rd. - b/t SW 14th St/ E. Centerton Blvd (Hwy. 102) & SW 2nd St. (Hwy. 72)
2100 2300 2400 3000 3100 2900 2400 2300 3100 4900 5900 10.88%
SW Regional Airport Blvd. (Hwy. 12)- b/t Greenhouse Rd. & SW I St./Hwy. 112 8000 9300 1150 13200 15500 15600 16000 20000 18000 18000 20000 9.60%
SW I St. - b/t SW 8th St. & SW 14th St. (Hwy. 102) 4500 4600 5100 3000 8700 9250 9800 9000 8200 9400 11000 9.35%
SW 14th St. - b/t SW I St. & S. Walton Blvd. (Hwy. 71B) - - - - - - 19000 17000 18000 27000 27000 9.18%
Moberly Ln. - b/t SE 14th St. (Hwy. 102) & SE 28th St. - 6400 10100 11100 12600 10700 12000 10000 12000 13000 14000 9.09%
SW Regional Airport Blvd. (Hwy. 12) - b/t SW I St./Hwy. 112 & Rainbow Ln. 9600 10000 10900 14900 19400 20100 21000 21000 22000 20000 21000 8.14%
Hwy. 112 – b/t SW Gator Blvd. & Windmill Rd. 2400 2400 2500 3800 4300 4400 4000 4800 4100 4300 5000 7.62%
NW A St. - North of Tiger Blvd. 2400 2500 3000 2300 2800 3200 3950 4700 4900 4400 5000 7.62%
NE J St. – b/t NE John DeShields Blvd. & E Central Ave. 3600 3800 4200 3300 5000 5100 6000 5700 5900 6300 7200 7.18%
Bentonville City Wide Traffic StudyFuture Corridors
Garver Project No. 12017630 Page 13
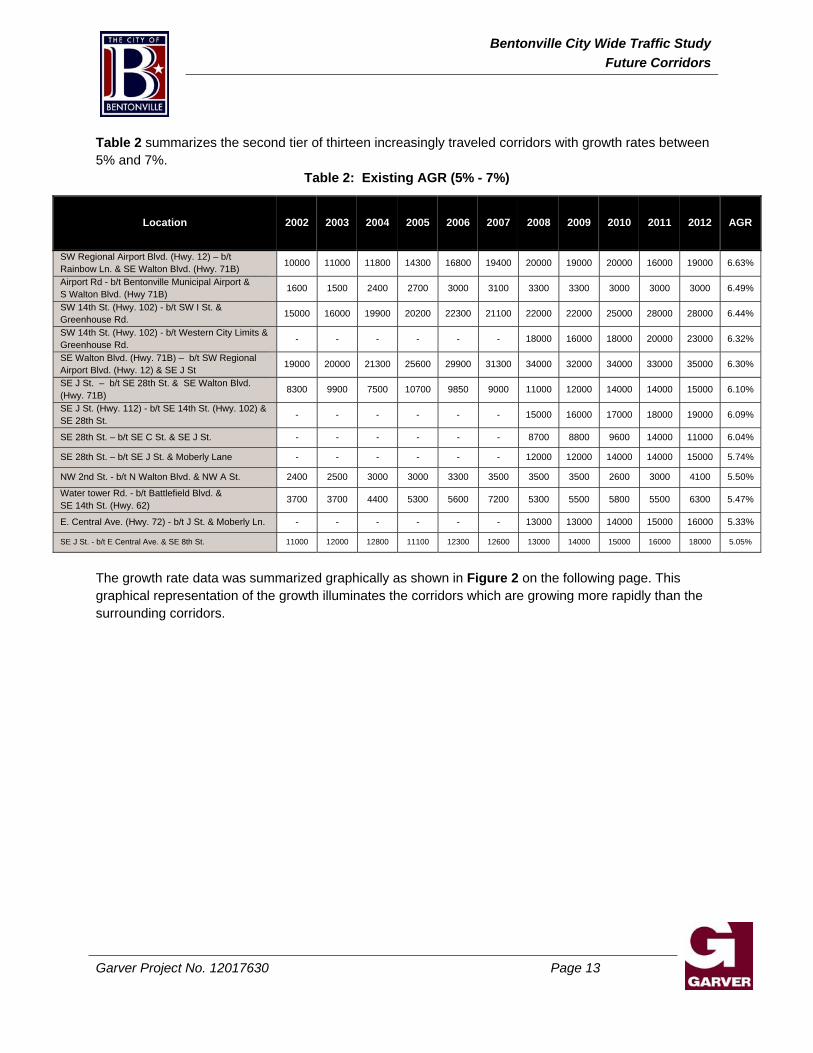
Table 2 summarizes the second tier of thirteen increasingly traveled corridors with growth rates between 5% and 7%.
Table 2: Existing AGR (5% - 7%)
Location 2002 2003 2004 2005 2006 2007 2008 2009 2010 2011 2012 AGR
SW Regional Airport Blvd. (Hwy. 12) – b/t Rainbow Ln. & SE Walton Blvd. (Hwy. 71B) 10000 11000 11800 14300 16800 19400 20000 19000 20000 16000 19000 6.63%
Airport Rd - b/t Bentonville Municipal Airport & S Walton Blvd. (Hwy 71B) 1600 1500 2400 2700 3000 3100 3300 3300 3000 3000 3000 6.49%
SW 14th St. (Hwy. 102) - b/t SW I St. & Greenhouse Rd. 15000 16000 19900 20200 22300 21100 22000 22000 25000 28000 28000 6.44%
SW 14th St. (Hwy. 102) - b/t Western City Limits & Greenhouse Rd. - - - - - - 18000 16000 18000 20000 23000 6.32%
SE Walton Blvd. (Hwy. 71B) – b/t SW Regional Airport Blvd. (Hwy. 12) & SE J St 19000 20000 21300 25600 29900 31300 34000 32000 34000 33000 35000 6.30%
SE J St. – b/t SE 28th St. & SE Walton Blvd. (Hwy. 71B) 8300 9900 7500 10700 9850 9000 11000 12000 14000 14000 15000 6.10%
SE J St. (Hwy. 112) - b/t SE 14th St. (Hwy. 102) & SE 28th St. - - - - - - 15000 16000 17000 18000 19000 6.09%
SE 28th St. – b/t SE C St. & SE J St. - - - - - - 8700 8800 9600 14000 11000 6.04%
SE 28th St. – b/t SE J St. & Moberly Lane - - - - - - 12000 12000 14000 14000 15000 5.74%
NW 2nd St. - b/t N Walton Blvd. & NW A St. 2400 2500 3000 3000 3300 3500 3500 3500 2600 3000 4100 5.50%
Water tower Rd. - b/t Battlefield Blvd. & SE 14th St. (Hwy. 62)
3700 3700 4400 5300 5600 7200 5300 5500 5800 5500 6300 5.47%
E. Central Ave. (Hwy. 72) - b/t J St. & Moberly Ln. - - - - - - 13000 13000 14000 15000 16000 5.33%
SE J St. - b/t E Central Ave. & SE 8th St. 11000 12000 12800 11100 12300 12600 13000 14000 15000 16000 18000 5.05%
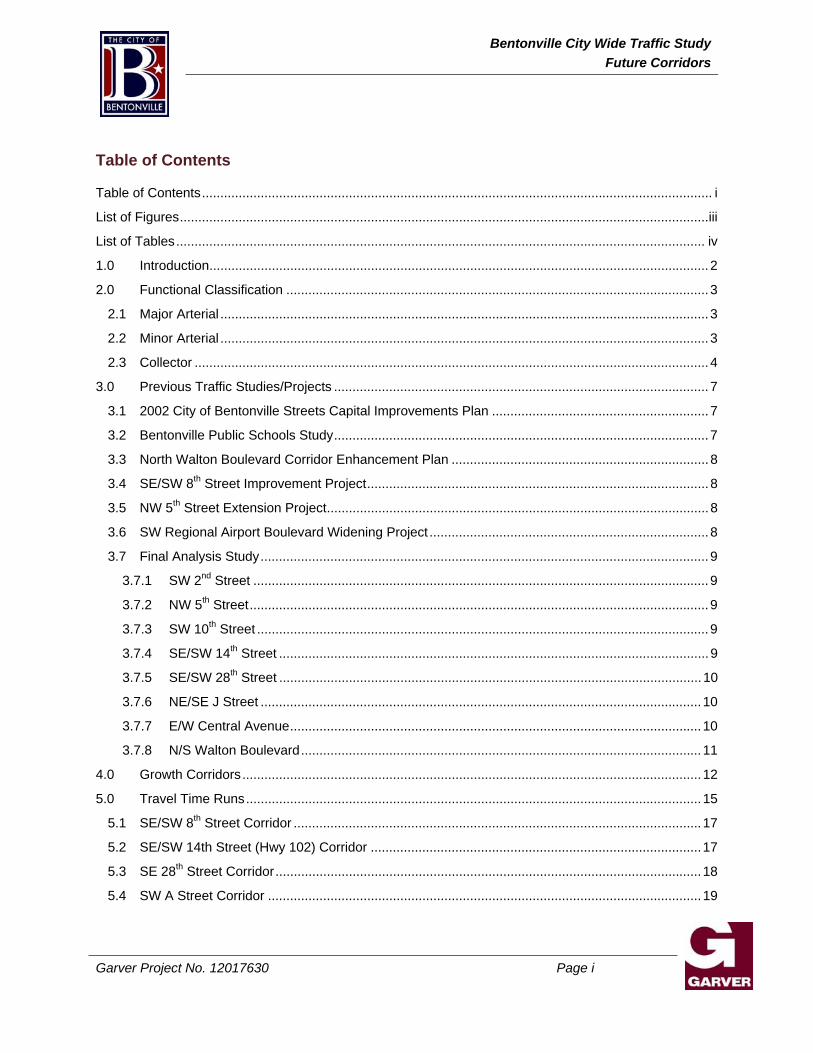
The growth rate data was summarized graphically as shown in Figure 2 on the following page. This graphical representation of the growth illuminates the corridors which are growing more rapidly than the surrounding corridors.
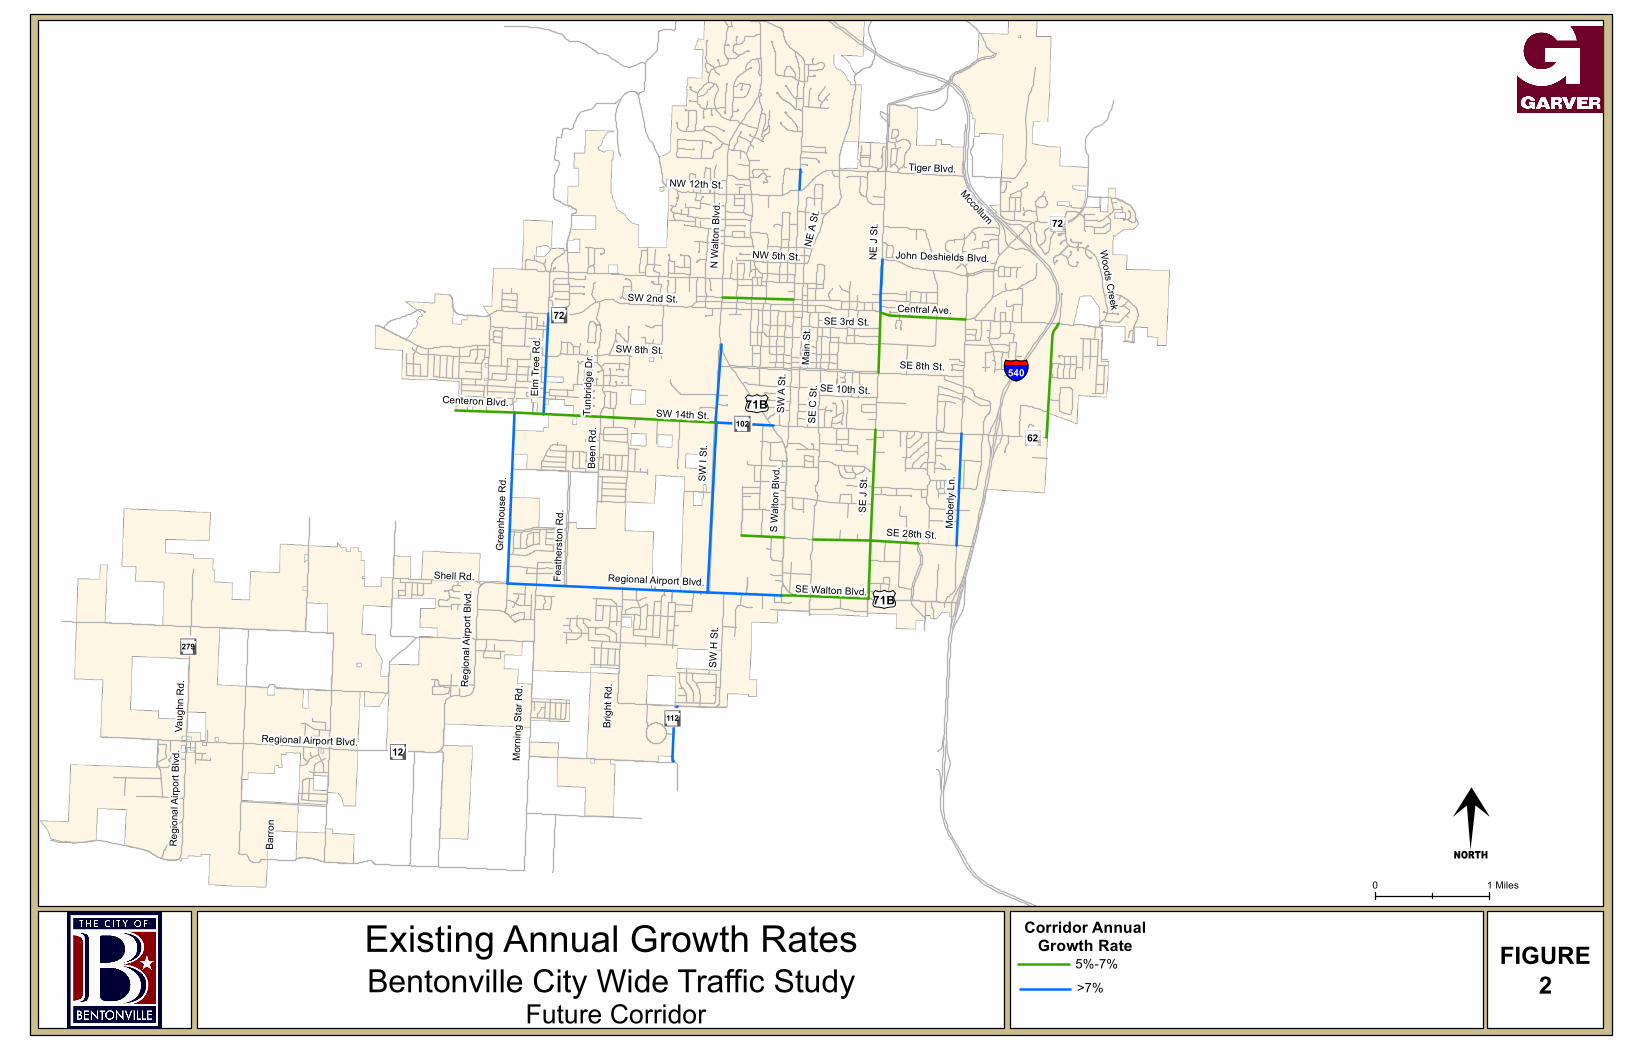
FIGURE 2
SW A
St.
SE J
St.
SE 8th St.
SW 14th St.
N Wa
lton B
lvd.
SW H
St.
SE C
St.
SE 28th St.
Tiger Blvd.
Mobe
rly Ln
.
Main
St.
SE 3rd St.
Brigh
t Rd.
Barro
n
Shell Rd.
SW I S
t.
Regio
nal A
irport
Blvd
.
Regio
nal A
irport
Blvd
. ¬12
Vaug
hn R
d.
NE A
St.
NW 5th St.
NW 12th St. Mccollum
Regional Airport Blvd.
NE J
St.
Feath
erston
Rd.
Gree
nhou
se R
d.Woods Creek
Been
Rd.
Tunb
ridge
Dr.
¬112
¬72
John Deshields Blvd.
Centeron Blvd.
S Walt
on B
lvd.
§̈¦540
¬72
Morni
ng S
tar R
d.
SE 10th St.
Regional Airport Blvd.
SW 2nd St. Central Ave.
SW 8th St.
Elm Tr
ee R
d.
SE Walton Blvd.
£¤71B¬102
¬279
£¤71B
¬62
M0 1 Miles
Existing Annual Growth RatesFuture Corridor
Corridor AnnualGrowth Rate
>7%5%-7%Bentonville City Wide Traffic Study
Bentonville City Wide Traffic StudyFuture Corridors
Garver Project No. 12017630 Page 15
5.0 Travel Time Runs
Garver conducted travel time runs along the major corridors in Bentonville during the AM and PM peak hours. The travel time runs were conducted using the “floating car” method – driving with the flow of traffic and passing only the same number of vehicles that pass the pilot car. Using PC-Travel software, average speed was documented at each intersection along the corridors. As shown in Figure 3 on the following page, eleven corridors were selected for travel time runs. Multiple travel runs in each direction were completed for both the AM Peak and PM Peak periods. The average speeds are shown in Tables 3 - 13. Areas highlighted in yellow indicate speeds between 10 mph and 20 mph. Areas highlighted in red indicate locations where speeds are below 10 mph. The following is a list of the corridors selected for the travel time runs.
• SE/SW 8th Street Corridor • SE/SW 14th Street (Hwy 102) Corridor • SE 28th Street Corridor • SW A St Corridor • SW H/SW I St Corridor • SE J St Corridor • Central Avenue/SW 2nd Street Corridor • SE Moberly Ln Corridor • SW Regional Airport Rd (Hwy 12) Corridor • Tiger Boulevard Corridor • Walton Boulevard (Hwy 71B) Corridor
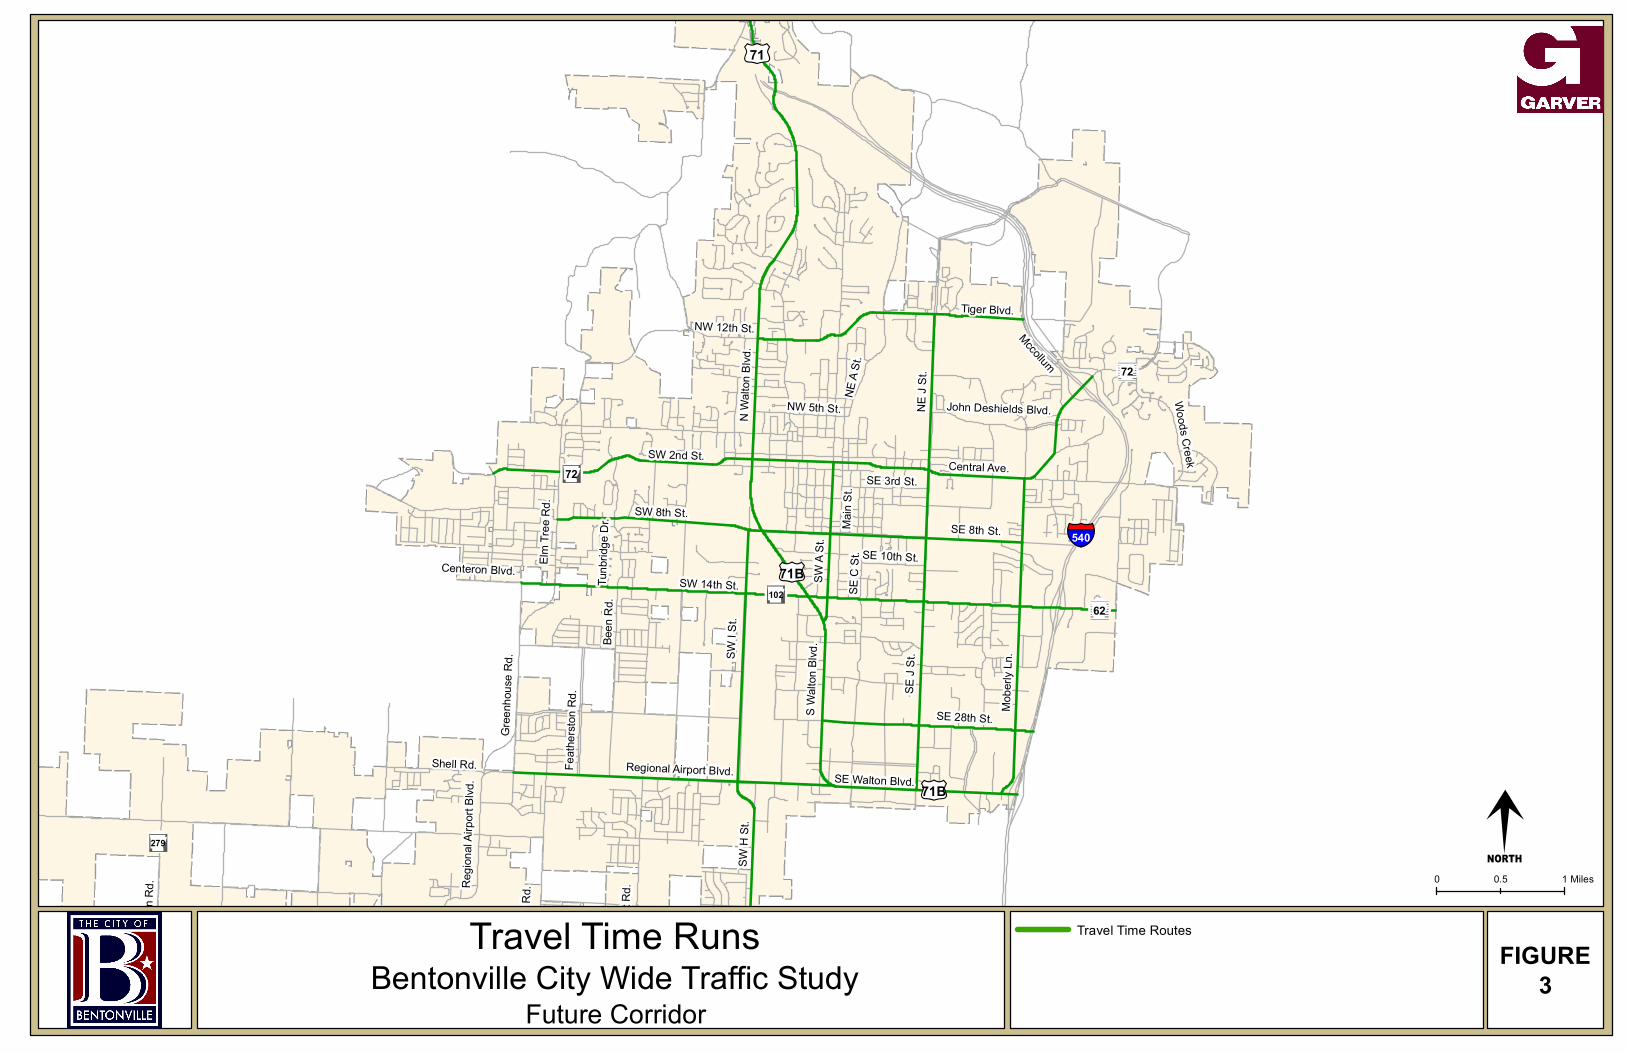
FIGURE 3
SW A
St.
SE J
St.
SE 8th St.
SW 14th St.
N Wa
lton B
lvd.
SW H
St.
SE C
St.
SE 28th St.
Tiger Blvd.
Mobe
rly Ln
.
Main
St. SE 3rd St.
Brigh
t Rd.
Shell Rd.
SW I S
t.
Regio
nal A
irport
Blvd
.
£¤71
Vaug
hn R
d.
NE A
St.
NW 5th St.
NW 12th St. Mccollum
NE J
St.
Feath
erston
Rd.
Gree
nhou
se R
d.
Woods Creek
Been
Rd.
Tunb
ridge
Dr.
¬112
¬72
John Deshields Blvd.
Centeron Blvd.
S Walt
on Bl
vd.
§̈¦540
¬72
Morni
ng S
tar R
d.
SE 10th St.
Regional Airport Blvd.
SW 2nd St. Central Ave.
SW 8th St.
Elm Tr
ee R
d.
SE Walton Blvd.
£¤71B¬102
¬279
£¤71B
¬62
M0 10.5 Miles
Travel Time RunsFuture Corridor
Bentonville City Wide Traffic StudyTravel Time Routes
Bentonville City Wide Traffic StudyFuture Corridors
Garver Project No. 12017630 Page 17
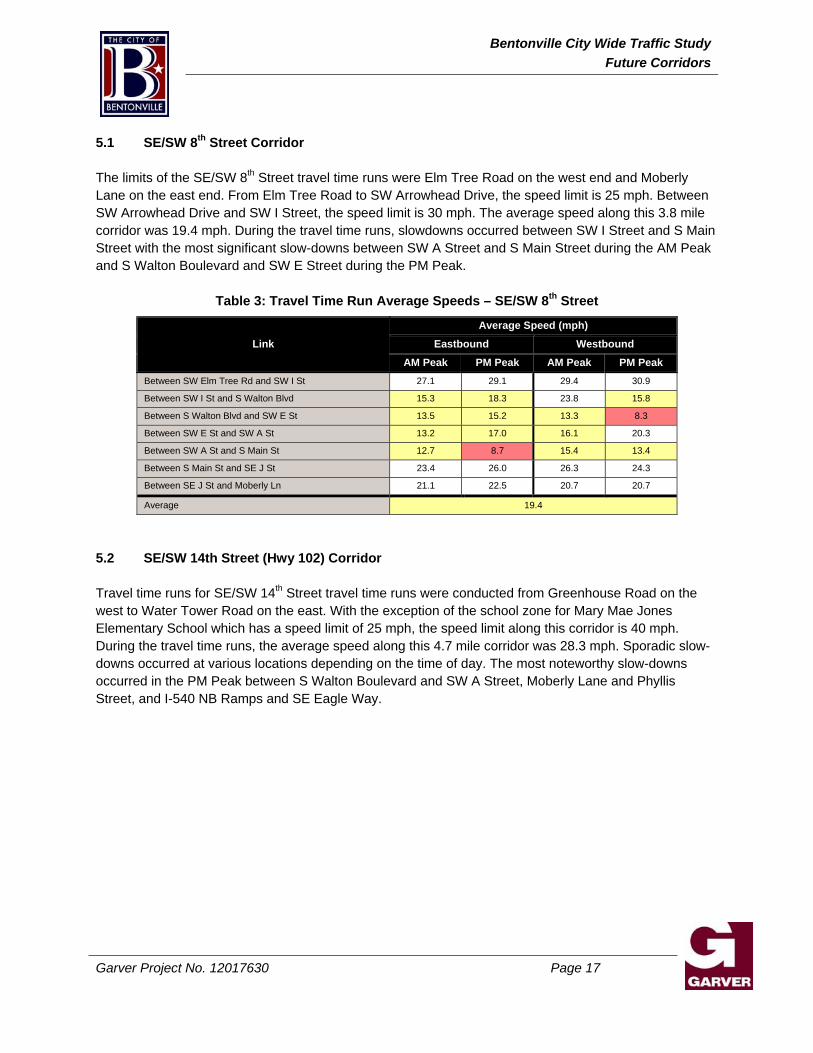
5.1 SE/SW 8th Street Corridor The limits of the SE/SW 8th Street travel time runs were Elm Tree Road on the west end and Moberly Lane on the east end. From Elm Tree Road to SW Arrowhead Drive, the speed limit is 25 mph. Between SW Arrowhead Drive and SW I Street, the speed limit is 30 mph. The average speed along this 3.8 mile corridor was 19.4 mph. During the travel time runs, slowdowns occurred between SW I Street and S Main Street with the most significant slow-downs between SW A Street and S Main Street during the AM Peak and S Walton Boulevard and SW E Street during the PM Peak.
Table 3: Travel Time Run Average Speeds – SE/SW 8th Street
Link
Average Speed (mph)
Eastbound Westbound
AM Peak PM Peak AM Peak PM Peak Between SW Elm Tree Rd and SW I St 27.1 29.1 29.4 30.9
Between SW I St and S Walton Blvd 15.3 18.3 23.8 15.8
Between S Walton Blvd and SW E St 13.5 15.2 13.3 8.3
Between SW E St and SW A St 13.2 17.0 16.1 20.3
Between SW A St and S Main St 12.7 8.7 15.4 13.4
Between S Main St and SE J St 23.4 26.0 26.3 24.3
Between SE J St and Moberly Ln 21.1 22.5 20.7 20.7
Average 19.4
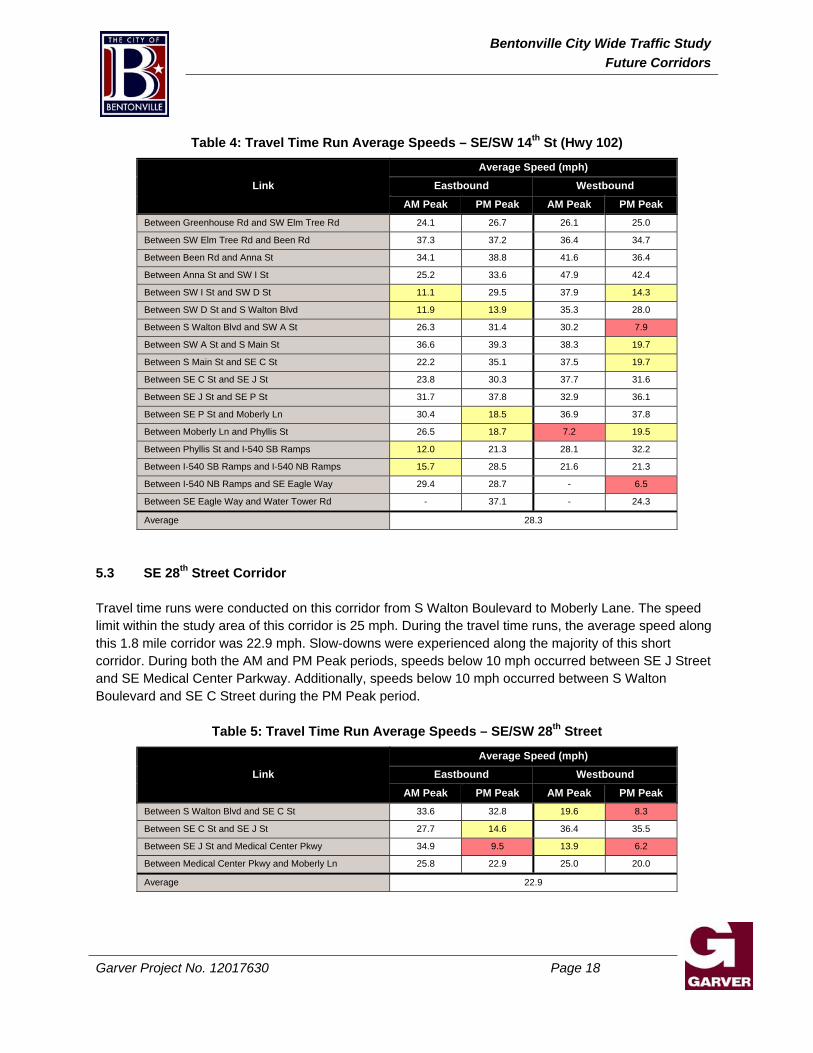
5.2 SE/SW 14th Street (Hwy 102) Corridor Travel time runs for SE/SW 14th Street travel time runs were conducted from Greenhouse Road on the west to Water Tower Road on the east. With the exception of the school zone for Mary Mae Jones Elementary School which has a speed limit of 25 mph, the speed limit along this corridor is 40 mph. During the travel time runs, the average speed along this 4.7 mile corridor was 28.3 mph. Sporadic slow-downs occurred at various locations depending on the time of day. The most noteworthy slow-downs occurred in the PM Peak between S Walton Boulevard and SW A Street, Moberly Lane and Phyllis Street, and I-540 NB Ramps and SE Eagle Way.
Bentonville City Wide Traffic StudyFuture Corridors
Garver Project No. 12017630 Page 18
Table 4: Travel Time Run Average Speeds – SE/SW 14th St (Hwy 102)
Link
Average Speed (mph)
Eastbound Westbound
AM Peak PM Peak AM Peak PM Peak Between Greenhouse Rd and SW Elm Tree Rd 24.1 26.7 26.1 25.0
Between SW Elm Tree Rd and Been Rd 37.3 37.2 36.4 34.7
Between Been Rd and Anna St 34.1 38.8 41.6 36.4
Between Anna St and SW I St 25.2 33.6 47.9 42.4
Between SW I St and SW D St 11.1 29.5 37.9 14.3
Between SW D St and S Walton Blvd 11.9 13.9 35.3 28.0
Between S Walton Blvd and SW A St 26.3 31.4 30.2 7.9
Between SW A St and S Main St 36.6 39.3 38.3 19.7
Between S Main St and SE C St 22.2 35.1 37.5 19.7
Between SE C St and SE J St 23.8 30.3 37.7 31.6
Between SE J St and SE P St 31.7 37.8 32.9 36.1
Between SE P St and Moberly Ln 30.4 18.5 36.9 37.8
Between Moberly Ln and Phyllis St 26.5 18.7 7.2 19.5
Between Phyllis St and I-540 SB Ramps 12.0 21.3 28.1 32.2
Between I-540 SB Ramps and I-540 NB Ramps 15.7 28.5 21.6 21.3
Between I-540 NB Ramps and SE Eagle Way 29.4 28.7 - 6.5
Between SE Eagle Way and Water Tower Rd - 37.1 - 24.3
Average 28.3
5.3 SE 28th Street Corridor Travel time runs were conducted on this corridor from S Walton Boulevard to Moberly Lane. The speed limit within the study area of this corridor is 25 mph. During the travel time runs, the average speed along this 1.8 mile corridor was 22.9 mph. Slow-downs were experienced along the majority of this short corridor. During both the AM and PM Peak periods, speeds below 10 mph occurred between SE J Street and SE Medical Center Parkway. Additionally, speeds below 10 mph occurred between S Walton Boulevard and SE C Street during the PM Peak period.
Table 5: Travel Time Run Average Speeds – SE/SW 28th Street
Link
Average Speed (mph)
Eastbound Westbound
AM Peak PM Peak AM Peak PM Peak Between S Walton Blvd and SE C St 33.6 32.8 19.6 8.3
Between SE C St and SE J St 27.7 14.6 36.4 35.5
Between SE J St and Medical Center Pkwy 34.9 9.5 13.9 6.2
Between Medical Center Pkwy and Moberly Ln 25.8 22.9 25.0 20.0
Average 22.9
Bentonville City Wide Traffic StudyFuture Corridors
Garver Project No. 12017630 Page 19
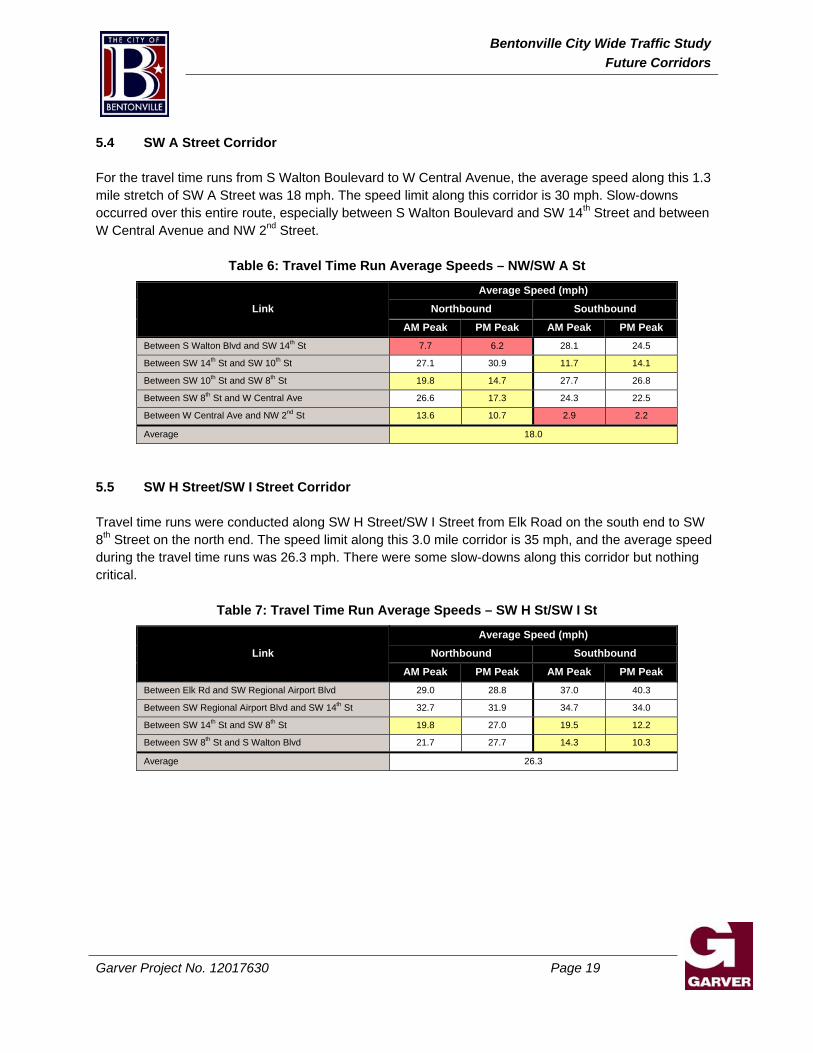
5.4 SW A Street Corridor For the travel time runs from S Walton Boulevard to W Central Avenue, the average speed along this 1.3 mile stretch of SW A Street was 18 mph. The speed limit along this corridor is 30 mph. Slow-downs occurred over this entire route, especially between S Walton Boulevard and SW 14th Street and between W Central Avenue and NW 2nd Street.
Table 6: Travel Time Run Average Speeds – NW/SW A St
Link
Average Speed (mph)
Northbound Southbound
AM Peak PM Peak AM Peak PM Peak Between S Walton Blvd and SW 14th St 7.7 6.2 28.1 24.5
Between SW 14th St and SW 10th St 27.1 30.9 11.7 14.1
Between SW 10th St and SW 8th St 19.8 14.7 27.7 26.8
Between SW 8th St and W Central Ave 26.6 17.3 24.3 22.5
Between W Central Ave and NW 2nd St 13.6 10.7 2.9 2.2
Average 18.0
5.5 SW H Street/SW I Street Corridor Travel time runs were conducted along SW H Street/SW I Street from Elk Road on the south end to SW 8th Street on the north end. The speed limit along this 3.0 mile corridor is 35 mph, and the average speed during the travel time runs was 26.3 mph. There were some slow-downs along this corridor but nothing critical.
Table 7: Travel Time Run Average Speeds – SW H St/SW I St
Link
Average Speed (mph)
Northbound Southbound
AM Peak PM Peak AM Peak PM Peak Between Elk Rd and SW Regional Airport Blvd 29.0 28.8 37.0 40.3
Between SW Regional Airport Blvd and SW 14th St 32.7 31.9 34.7 34.0
Between SW 14th St and SW 8th St 19.8 27.0 19.5 12.2
Between SW 8th St and S Walton Blvd 21.7 27.7 14.3 10.3
Average 26.3
Bentonville City Wide Traffic StudyFuture Corridors
Garver Project No. 12017630 Page 20
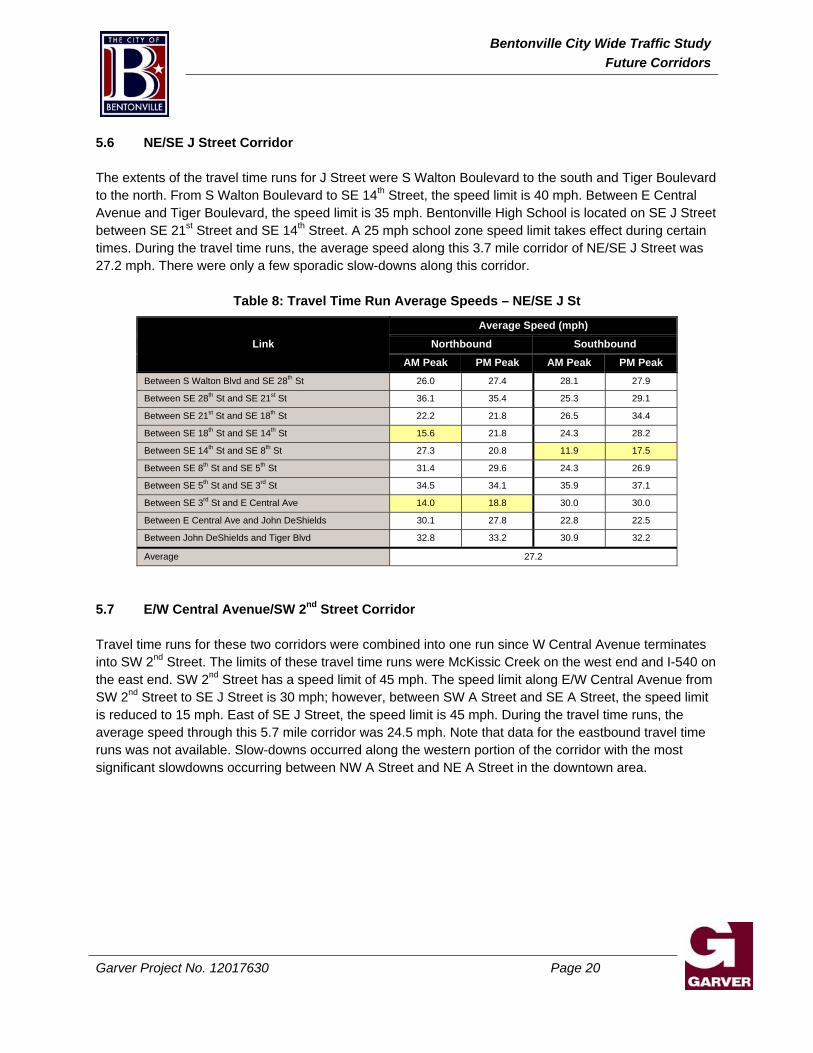
5.6 NE/SE J Street Corridor The extents of the travel time runs for J Street were S Walton Boulevard to the south and Tiger Boulevard to the north. From S Walton Boulevard to SE 14th Street, the speed limit is 40 mph. Between E Central Avenue and Tiger Boulevard, the speed limit is 35 mph. Bentonville High School is located on SE J Street between SE 21st Street and SE 14th Street. A 25 mph school zone speed limit takes effect during certain times. During the travel time runs, the average speed along this 3.7 mile corridor of NE/SE J Street was 27.2 mph. There were only a few sporadic slow-downs along this corridor.
Table 8: Travel Time Run Average Speeds – NE/SE J St
Link
Average Speed (mph)
Northbound Southbound
AM Peak PM Peak AM Peak PM Peak Between S Walton Blvd and SE 28th St 26.0 27.4 28.1 27.9
Between SE 28th St and SE 21st St 36.1 35.4 25.3 29.1
Between SE 21st St and SE 18th St 22.2 21.8 26.5 34.4
Between SE 18th St and SE 14th St 15.6 21.8 24.3 28.2
Between SE 14th St and SE 8th St 27.3 20.8 11.9 17.5
Between SE 8th St and SE 5th St 31.4 29.6 24.3 26.9
Between SE 5th St and SE 3rd St 34.5 34.1 35.9 37.1
Between SE 3rd St and E Central Ave 14.0 18.8 30.0 30.0
Between E Central Ave and John DeShields 30.1 27.8 22.8 22.5
Between John DeShields and Tiger Blvd 32.8 33.2 30.9 32.2
Average 27.2
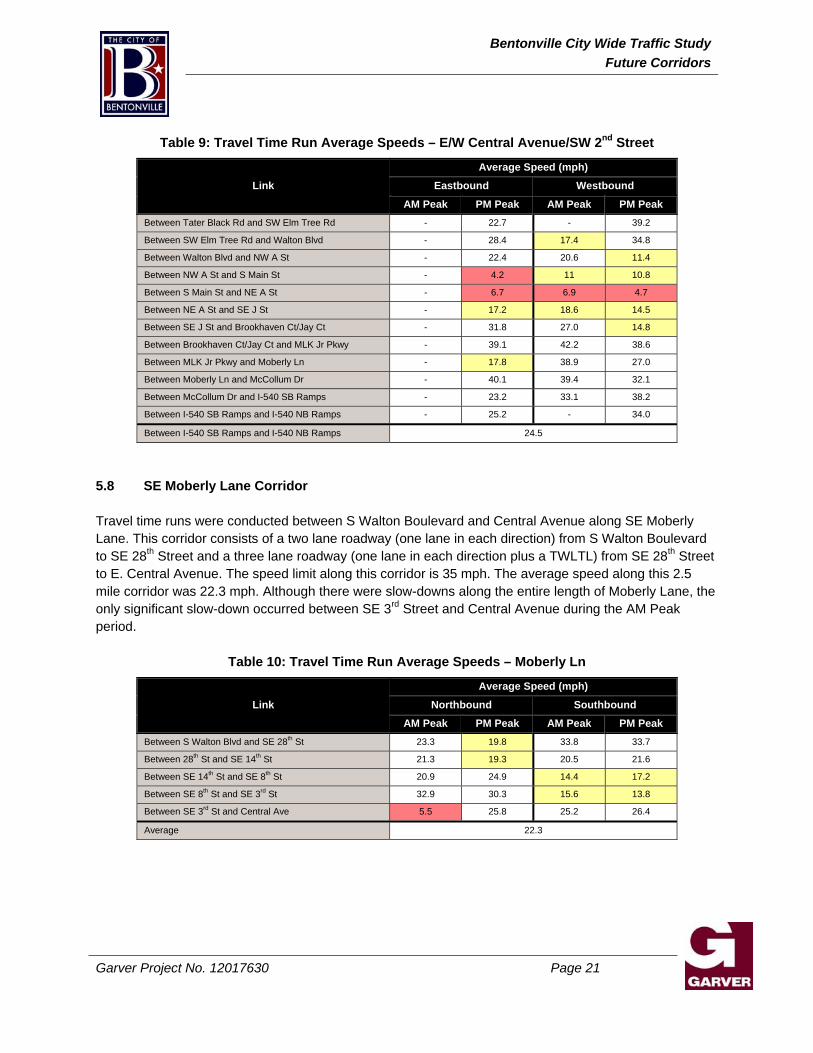
5.7 E/W Central Avenue/SW 2nd Street Corridor Travel time runs for these two corridors were combined into one run since W Central Avenue terminates into SW 2nd Street. The limits of these travel time runs were McKissic Creek on the west end and I-540 on the east end. SW 2nd Street has a speed limit of 45 mph. The speed limit along E/W Central Avenue from SW 2nd Street to SE J Street is 30 mph; however, between SW A Street and SE A Street, the speed limit is reduced to 15 mph. East of SE J Street, the speed limit is 45 mph. During the travel time runs, the average speed through this 5.7 mile corridor was 24.5 mph. Note that data for the eastbound travel time runs was not available. Slow-downs occurred along the western portion of the corridor with the most significant slowdowns occurring between NW A Street and NE A Street in the downtown area.
Bentonville City Wide Traffic StudyFuture Corridors
Garver Project No. 12017630 Page 21
Table 9: Travel Time Run Average Speeds – E/W Central Avenue/SW 2nd Street
Link
Average Speed (mph)
Eastbound Westbound
AM Peak PM Peak AM Peak PM Peak Between Tater Black Rd and SW Elm Tree Rd - 22.7 - 39.2
Between SW Elm Tree Rd and Walton Blvd - 28.4 17.4 34.8
Between Walton Blvd and NW A St - 22.4 20.6 11.4
Between NW A St and S Main St - 4.2 11 10.8
Between S Main St and NE A St - 6.7 6.9 4.7
Between NE A St and SE J St - 17.2 18.6 14.5
Between SE J St and Brookhaven Ct/Jay Ct - 31.8 27.0 14.8
Between Brookhaven Ct/Jay Ct and MLK Jr Pkwy - 39.1 42.2 38.6
Between MLK Jr Pkwy and Moberly Ln - 17.8 38.9 27.0
Between Moberly Ln and McCollum Dr - 40.1 39.4 32.1
Between McCollum Dr and I-540 SB Ramps - 23.2 33.1 38.2
Between I-540 SB Ramps and I-540 NB Ramps - 25.2 - 34.0
Between I-540 SB Ramps and I-540 NB Ramps 24.5
5.8 SE Moberly Lane Corridor Travel time runs were conducted between S Walton Boulevard and Central Avenue along SE Moberly Lane. This corridor consists of a two lane roadway (one lane in each direction) from S Walton Boulevard to SE 28th Street and a three lane roadway (one lane in each direction plus a TWLTL) from SE 28th Street to E. Central Avenue. The speed limit along this corridor is 35 mph. The average speed along this 2.5 mile corridor was 22.3 mph. Although there were slow-downs along the entire length of Moberly Lane, the only significant slow-down occurred between SE 3rd Street and Central Avenue during the AM Peak period.
Table 10: Travel Time Run Average Speeds – Moberly Ln
Link
Average Speed (mph)
Northbound Southbound
AM Peak PM Peak AM Peak PM Peak Between S Walton Blvd and SE 28th St 23.3 19.8 33.8 33.7
Between 28th St and SE 14th St 21.3 19.3 20.5 21.6
Between SE 14th St and SE 8th St 20.9 24.9 14.4 17.2
Between SE 8th St and SE 3rd St 32.9 30.3 15.6 13.8
Between SE 3rd St and Central Ave 5.5 25.8 25.2 26.4
Average 22.3
Bentonville City Wide Traffic StudyFuture Corridors
Garver Project No. 12017630 Page 22
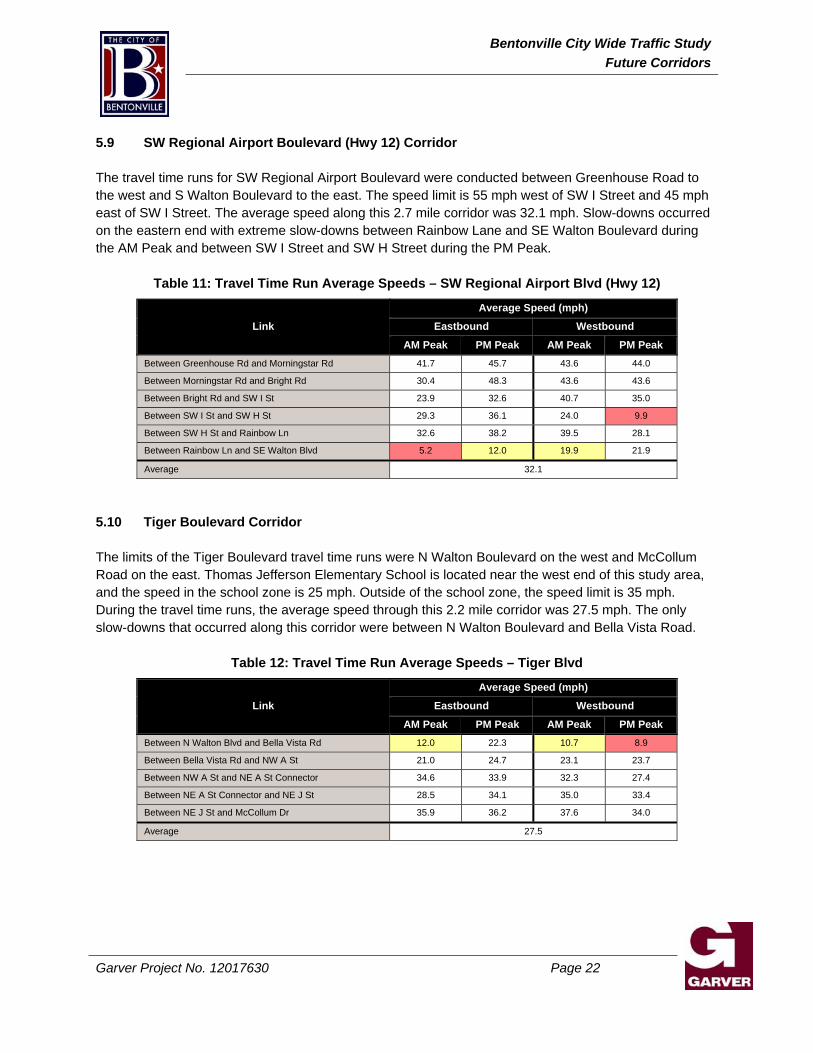
5.9 SW Regional Airport Boulevard (Hwy 12) Corridor The travel time runs for SW Regional Airport Boulevard were conducted between Greenhouse Road to the west and S Walton Boulevard to the east. The speed limit is 55 mph west of SW I Street and 45 mph east of SW I Street. The average speed along this 2.7 mile corridor was 32.1 mph. Slow-downs occurred on the eastern end with extreme slow-downs between Rainbow Lane and SE Walton Boulevard during the AM Peak and between SW I Street and SW H Street during the PM Peak.
Table 11: Travel Time Run Average Speeds – SW Regional Airport Blvd (Hwy 12)
Link
Average Speed (mph)
Eastbound Westbound
AM Peak PM Peak AM Peak PM Peak Between Greenhouse Rd and Morningstar Rd 41.7 45.7 43.6 44.0
Between Morningstar Rd and Bright Rd 30.4 48.3 43.6 43.6
Between Bright Rd and SW I St 23.9 32.6 40.7 35.0
Between SW I St and SW H St 29.3 36.1 24.0 9.9
Between SW H St and Rainbow Ln 32.6 38.2 39.5 28.1
Between Rainbow Ln and SE Walton Blvd 5.2 12.0 19.9 21.9
Average 32.1
5.10 Tiger Boulevard Corridor The limits of the Tiger Boulevard travel time runs were N Walton Boulevard on the west and McCollum Road on the east. Thomas Jefferson Elementary School is located near the west end of this study area, and the speed in the school zone is 25 mph. Outside of the school zone, the speed limit is 35 mph. During the travel time runs, the average speed through this 2.2 mile corridor was 27.5 mph. The only slow-downs that occurred along this corridor were between N Walton Boulevard and Bella Vista Road.
Table 12: Travel Time Run Average Speeds – Tiger Blvd
Link
Average Speed (mph)
Eastbound Westbound
AM Peak PM Peak AM Peak PM Peak Between N Walton Blvd and Bella Vista Rd 12.0 22.3 10.7 8.9
Between Bella Vista Rd and NW A St 21.0 24.7 23.1 23.7
Between NW A St and NE A St Connector 34.6 33.9 32.3 27.4
Between NE A St Connector and NE J St 28.5 34.1 35.0 33.4
Between NE J St and McCollum Dr 35.9 36.2 37.6 34.0
Average 27.5
Bentonville City Wide Traffic StudyFuture Corridors
Garver Project No. 12017630 Page 23
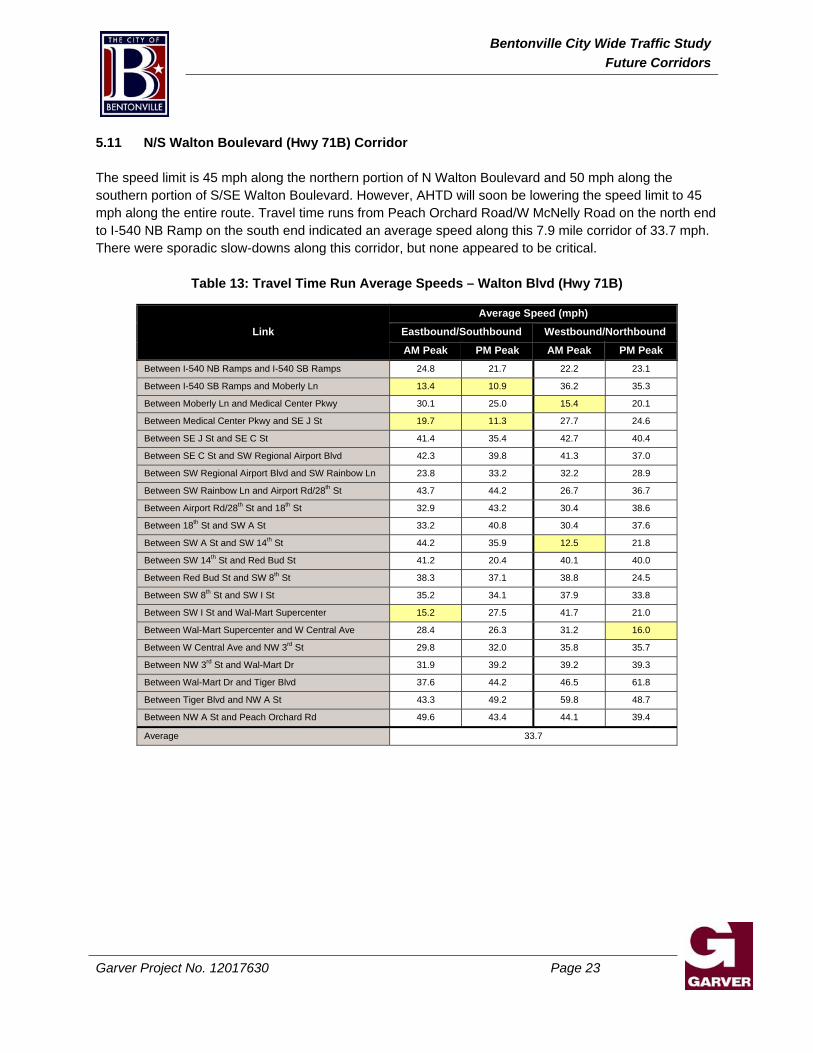
5.11 N/S Walton Boulevard (Hwy 71B) Corridor The speed limit is 45 mph along the northern portion of N Walton Boulevard and 50 mph along the southern portion of S/SE Walton Boulevard. However, AHTD will soon be lowering the speed limit to 45 mph along the entire route. Travel time runs from Peach Orchard Road/W McNelly Road on the north end to I-540 NB Ramp on the south end indicated an average speed along this 7.9 mile corridor of 33.7 mph. There were sporadic slow-downs along this corridor, but none appeared to be critical.
Table 13: Travel Time Run Average Speeds – Walton Blvd (Hwy 71B)
Link
Average Speed (mph)
Eastbound/Southbound Westbound/Northbound
AM Peak PM Peak AM Peak PM Peak Between I-540 NB Ramps and I-540 SB Ramps 24.8 21.7 22.2 23.1
Between I-540 SB Ramps and Moberly Ln 13.4 10.9 36.2 35.3
Between Moberly Ln and Medical Center Pkwy 30.1 25.0 15.4 20.1
Between Medical Center Pkwy and SE J St 19.7 11.3 27.7 24.6
Between SE J St and SE C St 41.4 35.4 42.7 40.4
Between SE C St and SW Regional Airport Blvd 42.3 39.8 41.3 37.0
Between SW Regional Airport Blvd and SW Rainbow Ln 23.8 33.2 32.2 28.9
Between SW Rainbow Ln and Airport Rd/28th St 43.7 44.2 26.7 36.7
Between Airport Rd/28th St and 18th St 32.9 43.2 30.4 38.6
Between 18th St and SW A St 33.2 40.8 30.4 37.6
Between SW A St and SW 14th St 44.2 35.9 12.5 21.8
Between SW 14th St and Red Bud St 41.2 20.4 40.1 40.0
Between Red Bud St and SW 8th St 38.3 37.1 38.8 24.5
Between SW 8th St and SW I St 35.2 34.1 37.9 33.8
Between SW I St and Wal-Mart Supercenter 15.2 27.5 41.7 21.0
Between Wal-Mart Supercenter and W Central Ave 28.4 26.3 31.2 16.0
Between W Central Ave and NW 3rd St 29.8 32.0 35.8 35.7
Between NW 3rd St and Wal-Mart Dr 31.9 39.2 39.2 39.3
Between Wal-Mart Dr and Tiger Blvd 37.6 44.2 46.5 61.8
Between Tiger Blvd and NW A St 43.3 49.2 59.8 48.7
Between NW A St and Peach Orchard Rd 49.6 43.4 44.1 39.4
Average 33.7
Bentonville City Wide Traffic StudyFuture Corridors
Garver Project No. 12017630 Page 24
6.0 Observations
Another method of evaluating the corridors was through observations. Garver personnel conducted both field observations and simulation observations along many of the corridors within the City of Bentonville. 6.1 Field Observations Garver personnel conducted field observations along various corridors within the City of Bentonville to assess the local peaking characteristics and observe the extent and duration of vehicle delay and queuing along the corridors. While observations were not exclusive to the following corridors, these five corridors demonstrated the most prevalent congestion. 6.1.1 SW 8th Street Several issues were noted along this corridor. Obstruction of view due to landscaping was seen at the intersection of SW 8th Street at Elm Tree Road. Heavy congestion was observed on SW 8th Street between SW I Street and S Walton Boulevard. Delays were observed at the mid-block pedestrian crossings between S Walton Boulevard and SW E Street. The offset alignment at the intersection of SW 8th Street at SW A Street caused some hesitation and confusion. Finally, the roadway is in poor condition between Moberly Lane and SE P Street. 6.1.2 SW A Street Several issues were noted during the observations along this corridor. At the intersection of SW 14th Street at SW A Street, lengthy queues were observed with the southbound left turn queue extending all the way to SW 12th Street. It was also noted that the intersection of W Central Avenue at SW A Street impacted the unsignalized intersection of NW 2nd Street at NW A Street which is located approximately 225 feet to the north. The southbound queues from the intersection of W Central Avenue at SW A Street extended through this adjacent intersection causing a grid-lock effect at the intersection of 2nd Street and NW A Street. 6.1.3 NE/SE J Street Significant delays and lengthy queues at the S Walton Boulevard intersection were noted during the field observations. During both AM and PM peaks, traffic on the northbound approach had to wait through three light cycles to get through the intersection. During the PM peak, the southbound left turn lane experienced notable queues as a result of traffic upstream of the signal along S Walton Boulevard exceeding the available storage space.
Bentonville High School is located between SE 21st Street and SE 14th Street and has three access driveways along SE J Street. School bus traffic was observed to be heavy near the school. During the morning and evening peak periods, the northbound and southbound center lanes backed up on SE J Street at the north entrance to the high school.
Bentonville City Wide Traffic StudyFuture Corridors
Garver Project No. 12017630 Page 25
6.1.4 Tiger Boulevard Congestion was observed at the intersection of N Walton Boulevard and Tiger Boulevard/12th Avenue NW. At this location, westbound traffic wanting to turn left caused a back-up along Tiger Boulevard to NW H Street. 6.1.5 N/S Walton Boulevard During the field observations, an accident was observed at the intersection of N Walton Boulevard (Hwy 71B) at NW 12th Street/Tiger Boulevard. Due to the geometry at this intersection, the driver of a northbound truck had to use the inside lane to make a right turn. A car in the outside lane was passing at the same time and collided with the trailer. Issues were also noted at the intersection of S Walton Boulevard at SW 14th Street. At this location, eastbound traffic wanting to turn right backed up for more than half of a mile. Additionally, the northbound left turn traffic backed up for approximately one quarter of a mile.
Bentonville City Wide Traffic StudyFuture Corridors
Garver Project No. 12017630 Page 26
6.2 SimTraffic Simulations SimTraffic software is a micro-simulation companion software to Synchro software. Using the traffic model that was created for the entire network in Bentonville, SimTraffic was used to simulate traffic conditions and make observations of existing conditions during the peak hours. Issues were noted along the following corridors. 6.2.1 SW 8th Street The simulation along SW 8th Street indicated that eastbound traffic backs up from S Walton Boulevard to west of SW I Street. 6.2.2 SE/SW 14th Street Excessive westbound queuing was noted between Moberly Lane and I-540 NB Ramps. Also, westbound queues at S Walton Boulevard extend through SW A Street all the way to SE C Street. 6.2.3 SW A Street High volumes were noted between SW 8th Street and SW 14th Street. The southbound queue was excessive. Per the simulation, the left turns were blocked from entering the left turn lane due to the high volume of thru traffic. 6.2.4 Moberly Lane Long queues were observed for the northbound and southbound traffic at the SE 8th Street intersection. In addition, the northbound traffic queued excessively at the E Central Avenue intersection.
Bentonville City Wide Traffic StudyFuture Corridors
Garver Project No. 12017630 Page 27
7.0 Level of Service
For the selection of future projects, the level of service (LOS) analysis carries the most weight. LOS is a concept defined by the Highway Capacity Manual (HCM) to qualitatively describe operating conditions within a traffic stream. LOS is typically stratified into six categories (A through F). These range from LOS A indicating free-flow, low density, or nearly negligible delay conditions to LOS F where demand exceeds capacity and large queues are experienced. 7.1 Northwest Arkansas Regional Planning Commission (NWARPC) Travel Demand Model Information received from the NWARPC included level of service along the roadway segments throughout the City of Bentonville. The LOS in the 2010 and 2035 models is based on volume to capacity ratios. Although the NWARPC no longer uses this methodology, it was used in this study as a means of differentiating the corridors and determining locations for more detailed analysis. As shown in Figure 4, several corridors are currently experiencing an unacceptable LOS E/F.
• SW 2nd Street – Turnbridge Drive to SW O Street • SE/SW 14th Street – western city limits to Greenhouse Road, SE G Street to SE J Street, Moberly
Lane to the I-540 interchange ramps • SE 28th Street – SE J Street to Moberly Lane • NW A Street – W Central Avenue to NW 3rd Street • E/W Central Avenue – N/S Walton Boulevard to near NW/SW F Street, NW/SW A Street to
SE/SW B Street, I-540 NB Ramps to the eastern city limits • SW Regional Airport Boulevard – SW Banbury Drive to SW I Street and SW H Street to S Walton
Boulevard • N/S Walton Boulevard – NW 7th Street to W Central Avenue, Redbud to SW 14th Street, and
Moberly Lane through the I-540 interchange The following list indicates corridors that are expected to perform at an unacceptable LOS E/F in 2035. These corridors are highlighted in Figure 5.
• SW 2nd Street – Hugh Tater Black Memorial Road to W Central Avenue • SE/SW 14th Street – entire length • SE 21st Street – SE J Street to SE N Street • SE 28th Street – SE J Street to the eastern city limits • SW 8th Street – Elm Tree Road to SW Sims Drive, SW I Street to S Walton Boulevard, SW A
Street to S Main Street • NW A Street – W Central Avenue to NE Park Street • E Battlefield Boulevard – Moberly Lane to Woods Creek • Been Road – SW 20th Street to SW 14th Street • Bright Road – SW Fir Avenue to SW Regional Airport Boulevard • E/W Central Avenue SW 2nd Street to near NW/SW F Street, N/S Main Street to NE/SE J Street,
I-540 NB Ramps to the eastern city limits
Bentonville City Wide Traffic StudyFuture Corridors
Garver Project No. 12017630 Page 28
• Moberly Lane – SE 28th Street and north of SE 14th Street • SW Regional Airport Boulevard – Vaughn Road to Barron Road, Norman Road to SW Vendor
Boulevard, SW Osage Street to Lee Harris Road, Bright Road to SW Maple Road, and SW Maple Road to SE Walton Boulevard
• N/S Walton Boulevard – NW 7th Street to SW 2nd Street, Redbud Street to SE 22nd Street, and SW Regional Airport Boulevard through the I-540 interchange
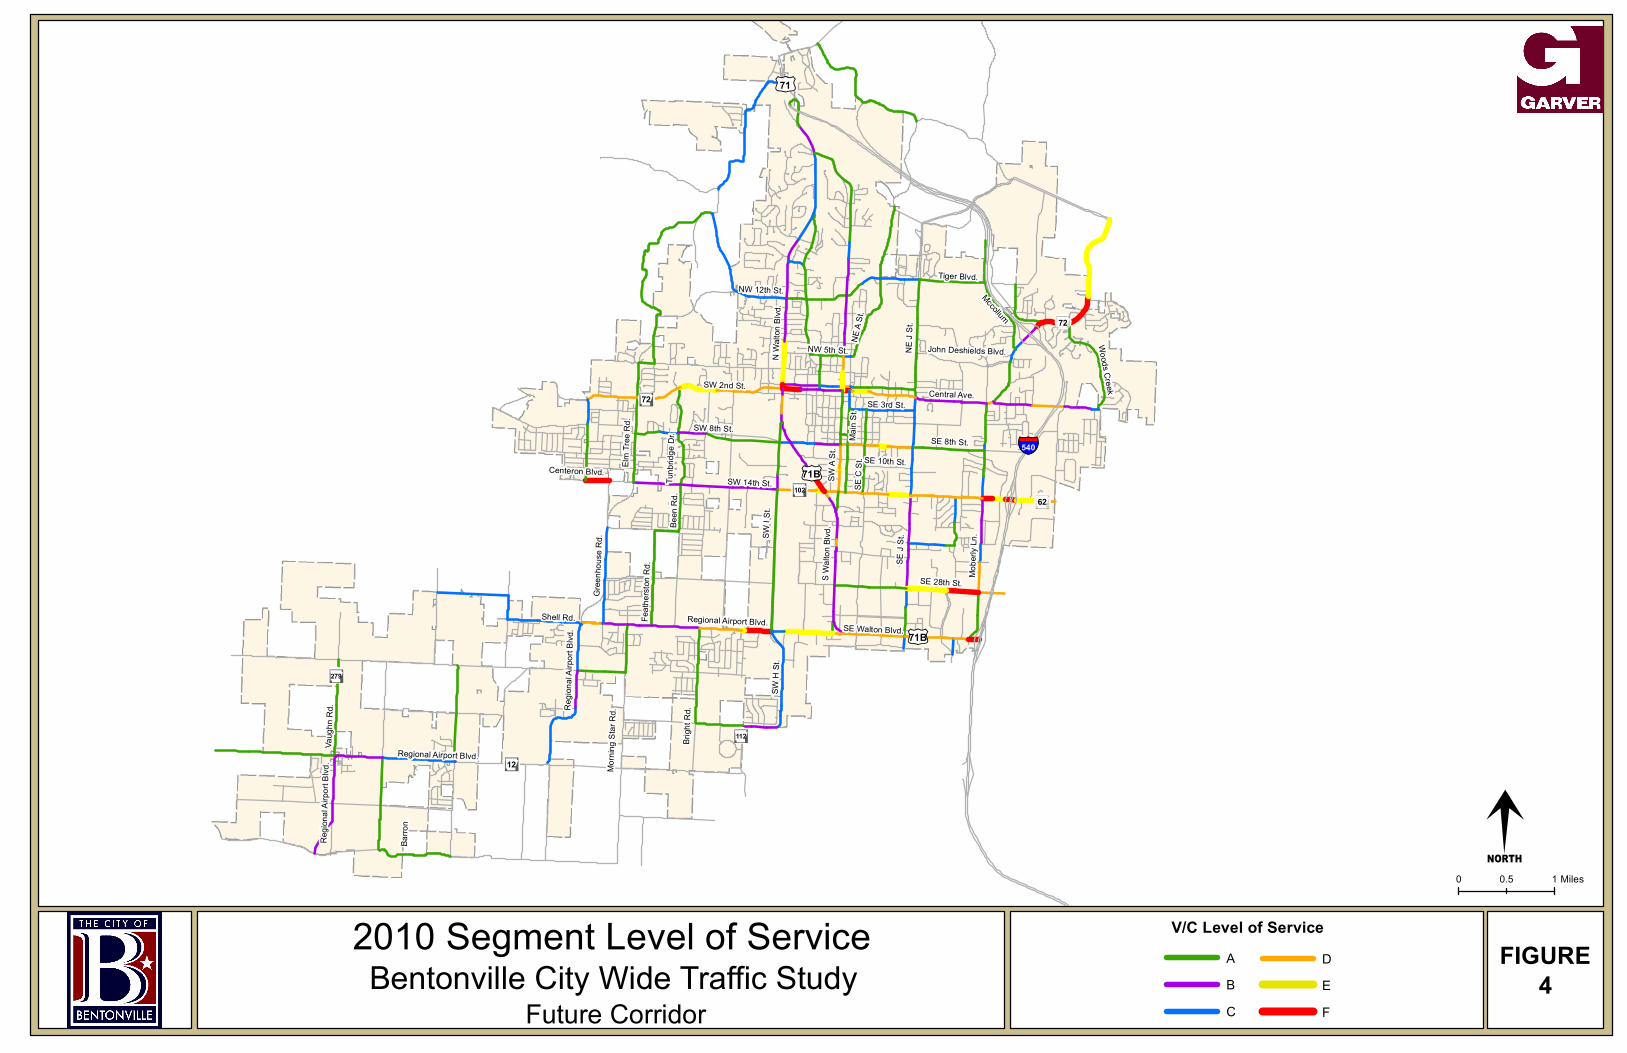
FIGURE 4
SW A
St.
SE J
St.
SE 8th St.
SW 14th St.
N Wa
lton B
lvd.
SW H
St.
SE C
St.
SE 28th St.
Tiger Blvd.
Mobe
rly Ln
.
Main
St.
SE 3rd St.
Brigh
t Rd.
Barro
n
Shell Rd.
SW I S
t.
Regio
nal A
irport
Blvd
.
Regio
nal A
irport
Blvd
. ¬12
£¤71
Vaug
hn R
d.
NE A
St.
NW 5th St.
NW 12th St. Mccollum
Regional Airport Blvd.
NE J
St.
Feath
erston
Rd.
Gree
nhou
se R
d.
Woods Creek
Been
Rd.
Tunb
ridge
Dr.
¬112
¬72
John Deshields Blvd.
Centeron Blvd.
S Walt
on Bl
vd.
§̈¦540
¬72
Morni
ng St
ar Rd
.
SE 10th St.
Regional Airport Blvd.
SW 2nd St. Central Ave.
SW 8th St.
Elm Tr
ee R
d.SE Walton Blvd.
£¤71B¬102
¬279
£¤71B
¬62
M0 10.5 Miles
2010 Segment Level of ServiceFuture Corridor
V/C Level of ServiceABC
DEF
Bentonville City Wide Traffic Study
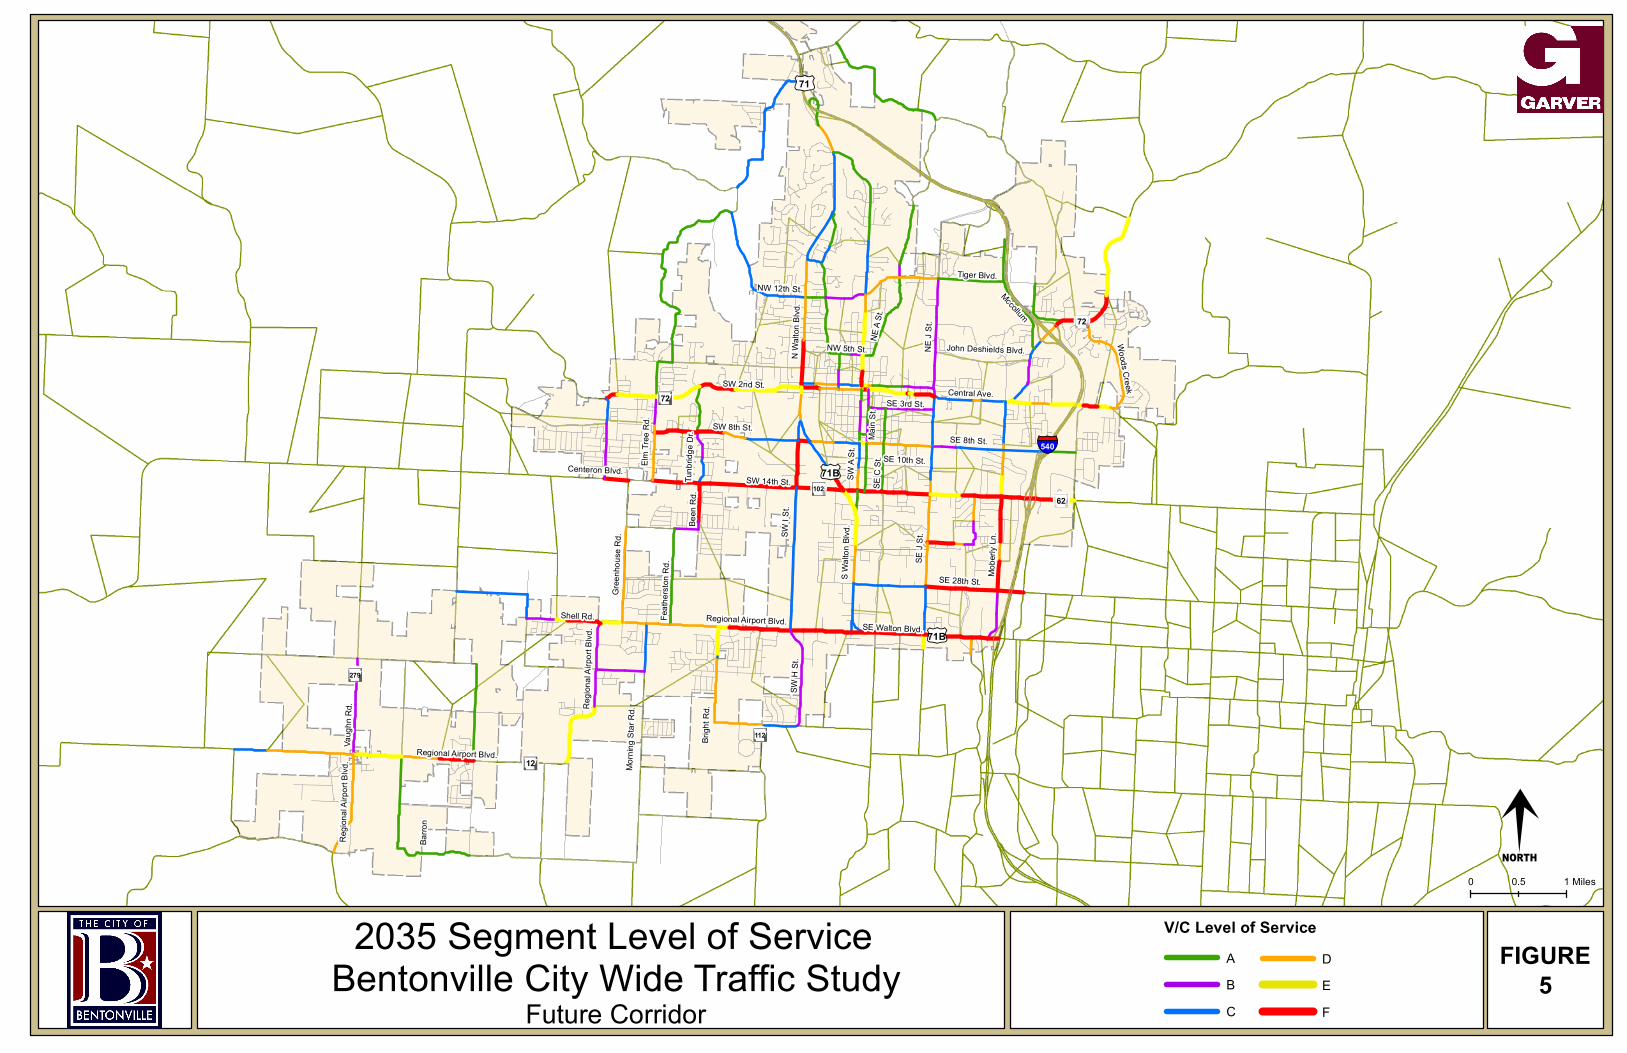
FIGURE 5
SW A
St.
SE J
St.
SE 8th St.
SW 14th St.
N Wa
lton B
lvd.
SW H
St.
SE C
St.
SE 28th St.
Tiger Blvd.
Mobe
rly Ln
.
Main
St.
SE 3rd St.
Brigh
t Rd.
Barro
n
Shell Rd.
SW I S
t.
Regio
nal A
irport
Blvd
.
Regio
nal A
irport
Blvd
. ¬12
£¤71
Vaug
hn R
d.
NE A
St.
NW 5th St.
NW 12th St. Mccollum
Regional Airport Blvd.
NE J
St.
Feath
erston
Rd.
Gree
nhou
se R
d.
Woods Creek
Been
Rd.
Tunb
ridge
Dr.
¬112
¬72
John Deshields Blvd.
Centeron Blvd.
S Walt
on Bl
vd.
§̈¦540
¬72
Morni
ng St
ar Rd
.
SE 10th St.
Regional Airport Blvd.
SW 2nd St. Central Ave.
SW 8th St.
Elm Tr
ee R
d.SE Walton Blvd.
£¤71B¬102
¬279
£¤71B
¬62
M0 10.5 Miles
2035 Segment Level of ServiceFuture Corridor
V/C Level of ServiceABC
DEF
Bentonville City Wide Traffic Study
Bentonville City Wide Traffic StudyFuture Corridors
Garver Project No. 12017630 Page 31
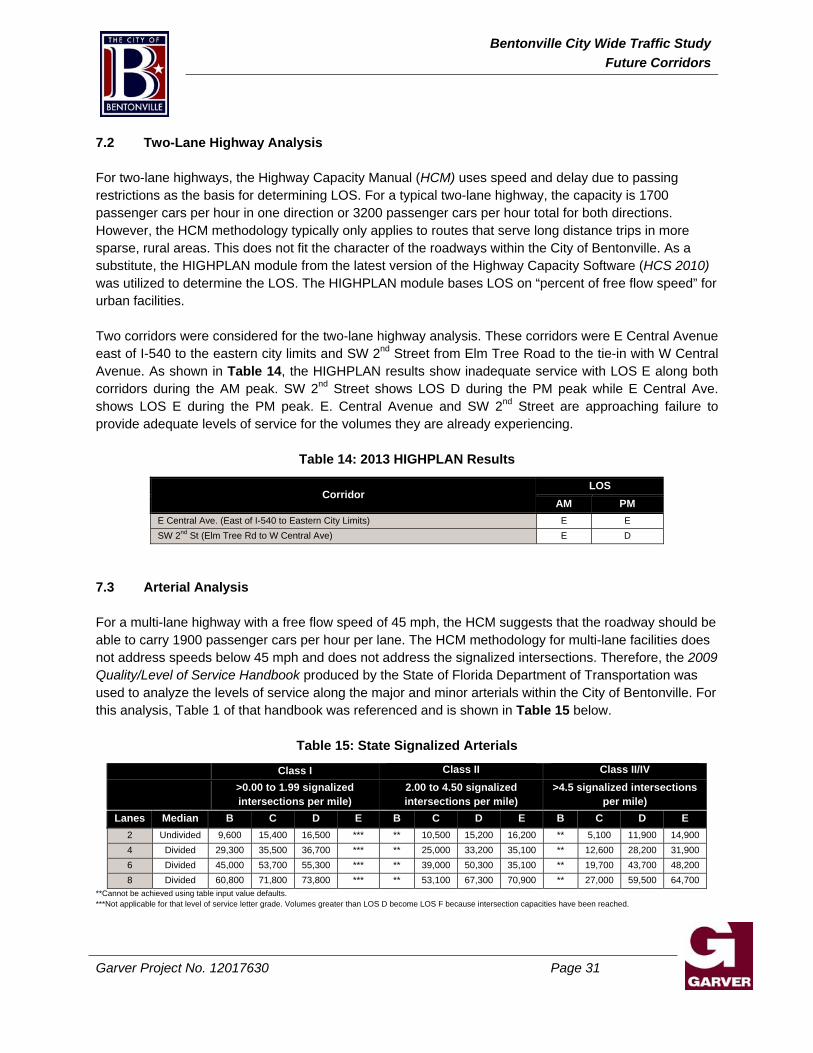
7.2 Two-Lane Highway Analysis For two-lane highways, the Highway Capacity Manual (HCM) uses speed and delay due to passing restrictions as the basis for determining LOS. For a typical two-lane highway, the capacity is 1700 passenger cars per hour in one direction or 3200 passenger cars per hour total for both directions. However, the HCM methodology typically only applies to routes that serve long distance trips in more sparse, rural areas. This does not fit the character of the roadways within the City of Bentonville. As a substitute, the HIGHPLAN module from the latest version of the Highway Capacity Software (HCS 2010) was utilized to determine the LOS. The HIGHPLAN module bases LOS on “percent of free flow speed” for urban facilities. Two corridors were considered for the two-lane highway analysis. These corridors were E Central Avenue east of I-540 to the eastern city limits and SW 2nd Street from Elm Tree Road to the tie-in with W Central Avenue. As shown in Table 14, the HIGHPLAN results show inadequate service with LOS E along both corridors during the AM peak. SW 2nd Street shows LOS D during the PM peak while E Central Ave. shows LOS E during the PM peak. E. Central Avenue and SW 2nd Street are approaching failure to provide adequate levels of service for the volumes they are already experiencing.
Table 14: 2013 HIGHPLAN Results
Corridor LOS
AM PM E Central Ave. (East of I-540 to Eastern City Limits) E E SW 2nd St (Elm Tree Rd to W Central Ave) E D
7.3 Arterial Analysis For a multi-lane highway with a free flow speed of 45 mph, the HCM suggests that the roadway should be able to carry 1900 passenger cars per hour per lane. The HCM methodology for multi-lane facilities does not address speeds below 45 mph and does not address the signalized intersections. Therefore, the 2009 Quality/Level of Service Handbook produced by the State of Florida Department of Transportation was used to analyze the levels of service along the major and minor arterials within the City of Bentonville. For this analysis, Table 1 of that handbook was referenced and is shown in Table 15 below.
Table 15: State Signalized Arterials
Class I Class II Class II/IV
>0.00 to 1.99 signalized intersections per mile)
2.00 to 4.50 signalized intersections per mile)
>4.5 signalized intersections per mile)
Lanes Median B C D E B C D E B C D E 2 Undivided 9,600 15,400 16,500 *** ** 10,500 15,200 16,200 ** 5,100 11,900 14,900 4 Divided 29,300 35,500 36,700 *** ** 25,000 33,200 35,100 ** 12,600 28,200 31,900 6 Divided 45,000 53,700 55,300 *** ** 39,000 50,300 35,100 ** 19,700 43,700 48,200 8 Divided 60,800 71,800 73,800 *** ** 53,100 67,300 70,900 ** 27,000 59,500 64,700
**Cannot be achieved using table input value defaults. ***Not applicable for that level of service letter grade. Volumes greater than LOS D become LOS F because intersection capacities have been reached.
Bentonville City Wide Traffic StudyFuture Corridors
Garver Project No. 12017630 Page 32
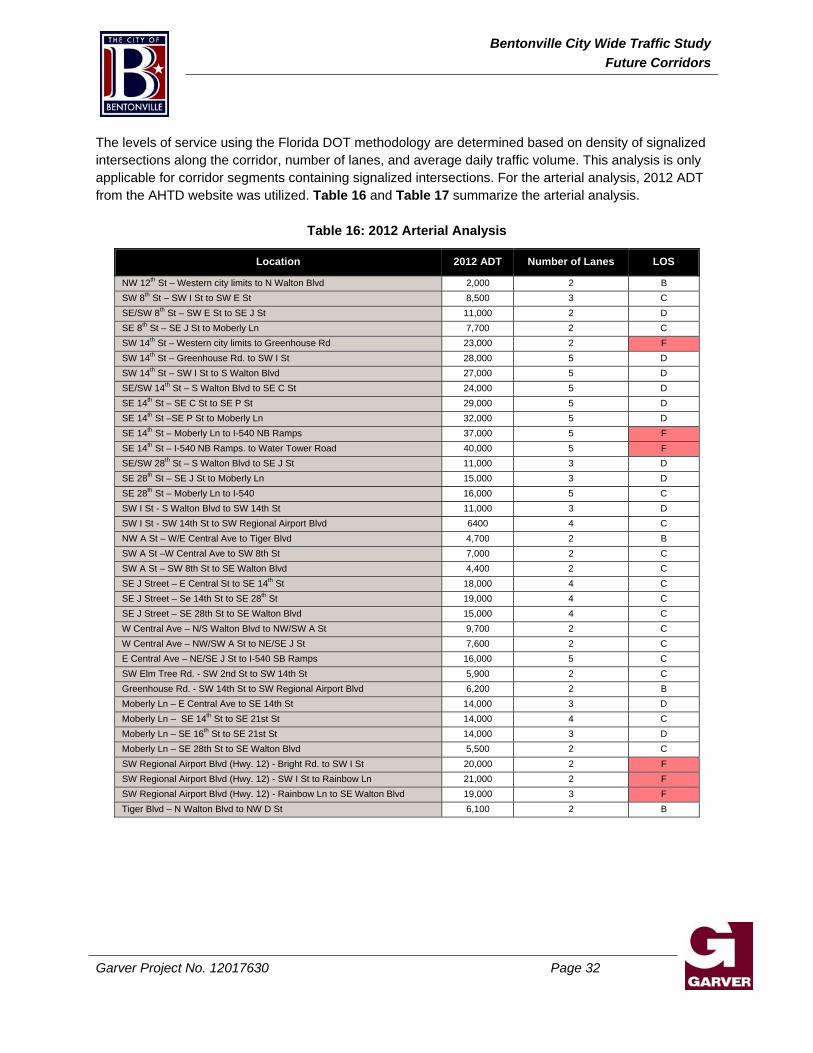
The levels of service using the Florida DOT methodology are determined based on density of signalized intersections along the corridor, number of lanes, and average daily traffic volume. This analysis is only applicable for corridor segments containing signalized intersections. For the arterial analysis, 2012 ADT from the AHTD website was utilized. Table 16 and Table 17 summarize the arterial analysis.
Table 16: 2012 Arterial Analysis
Location 2012 ADT Number of Lanes LOS
NW 12th St – Western city limits to N Walton Blvd 2,000 2 B SW 8th St – SW I St to SW E St 8,500 3 C SE/SW 8th St – SW E St to SE J St 11,000 2 D SE 8th St – SE J St to Moberly Ln 7,700 2 C SW 14th St – Western city limits to Greenhouse Rd 23,000 2 F SW 14th St – Greenhouse Rd. to SW I St 28,000 5 D SW 14th St – SW I St to S Walton Blvd 27,000 5 D SE/SW 14th St – S Walton Blvd to SE C St 24,000 5 D SE 14th St – SE C St to SE P St 29,000 5 D SE 14th St –SE P St to Moberly Ln 32,000 5 D SE 14th St – Moberly Ln to I-540 NB Ramps 37,000 5 F SE 14th St – I-540 NB Ramps. to Water Tower Road 40,000 5 F SE/SW 28th St – S Walton Blvd to SE J St 11,000 3 D SE 28th St – SE J St to Moberly Ln 15,000 3 D SE 28th St – Moberly Ln to I-540 16,000 5 C SW I St - S Walton Blvd to SW 14th St 11,000 3 D SW I St - SW 14th St to SW Regional Airport Blvd 6400 4 C NW A St – W/E Central Ave to Tiger Blvd 4,700 2 B SW A St –W Central Ave to SW 8th St 7,000 2 C SW A St – SW 8th St to SE Walton Blvd 4,400 2 C SE J Street – E Central St to SE 14th St 18,000 4 C SE J Street – Se 14th St to SE 28th St 19,000 4 C SE J Street – SE 28th St to SE Walton Blvd 15,000 4 C W Central Ave – N/S Walton Blvd to NW/SW A St 9,700 2 C W Central Ave – NW/SW A St to NE/SE J St 7,600 2 C E Central Ave – NE/SE J St to I-540 SB Ramps 16,000 5 C SW Elm Tree Rd. - SW 2nd St to SW 14th St 5,900 2 C Greenhouse Rd. - SW 14th St to SW Regional Airport Blvd 6,200 2 B Moberly Ln – E Central Ave to SE 14th St 14,000 3 D Moberly Ln – SE 14th St to SE 21st St 14,000 4 C Moberly Ln – SE 16th St to SE 21st St 14,000 3 D Moberly Ln – SE 28th St to SE Walton Blvd 5,500 2 C SW Regional Airport Blvd (Hwy. 12) - Bright Rd. to SW I St 20,000 2 F SW Regional Airport Blvd (Hwy. 12) - SW I St to Rainbow Ln 21,000 2 F SW Regional Airport Blvd (Hwy. 12) - Rainbow Ln to SE Walton Blvd 19,000 3 F Tiger Blvd – N Walton Blvd to NW D St 6,100 2 B
Bentonville City Wide Traffic StudyFuture Corridors
Garver Project No. 12017630 Page 33
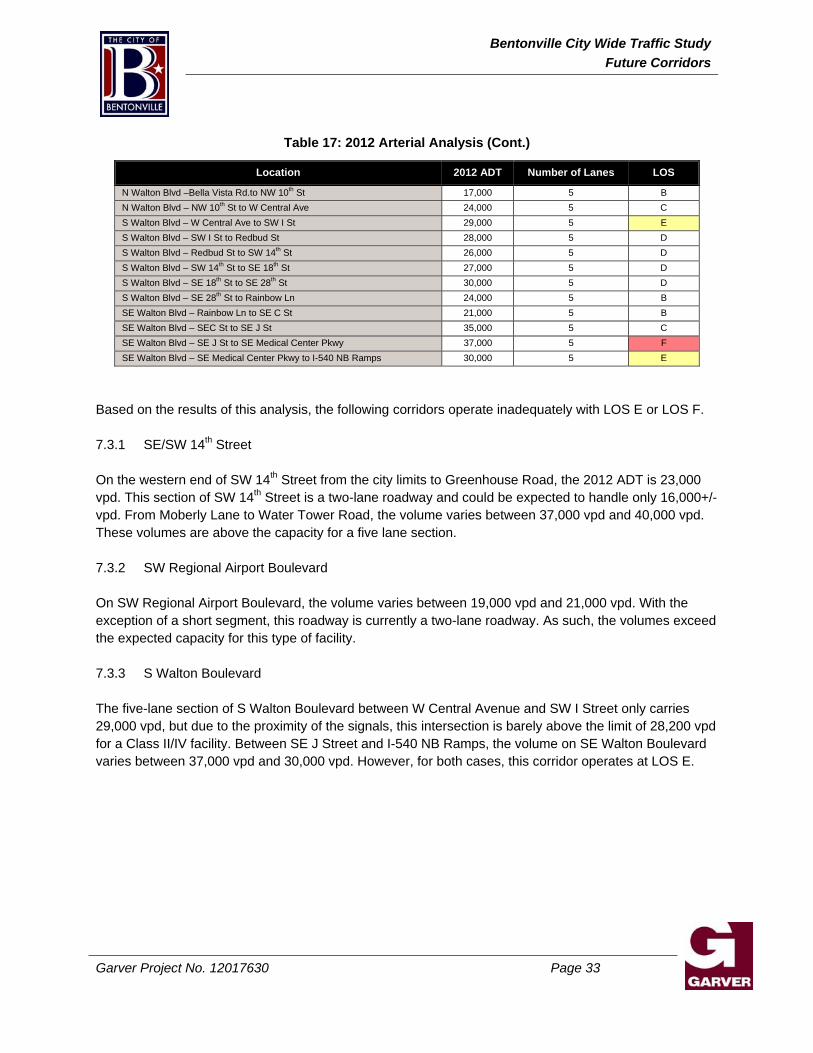
Table 17: 2012 Arterial Analysis (Cont.)
Location 2012 ADT Number of Lanes LOS
N Walton Blvd –Bella Vista Rd.to NW 10th St 17,000 5 B N Walton Blvd – NW 10th St to W Central Ave 24,000 5 C S Walton Blvd – W Central Ave to SW I St 29,000 5 E S Walton Blvd – SW I St to Redbud St 28,000 5 D S Walton Blvd – Redbud St to SW 14th St 26,000 5 D S Walton Blvd – SW 14th St to SE 18th St 27,000 5 D S Walton Blvd – SE 18th St to SE 28th St 30,000 5 D S Walton Blvd – SE 28th St to Rainbow Ln 24,000 5 B SE Walton Blvd – Rainbow Ln to SE C St 21,000 5 B SE Walton Blvd – SEC St to SE J St 35,000 5 C SE Walton Blvd – SE J St to SE Medical Center Pkwy 37,000 5 F SE Walton Blvd – SE Medical Center Pkwy to I-540 NB Ramps 30,000 5 E
Based on the results of this analysis, the following corridors operate inadequately with LOS E or LOS F. 7.3.1 SE/SW 14th Street On the western end of SW 14th Street from the city limits to Greenhouse Road, the 2012 ADT is 23,000 vpd. This section of SW 14th Street is a two-lane roadway and could be expected to handle only 16,000+/- vpd. From Moberly Lane to Water Tower Road, the volume varies between 37,000 vpd and 40,000 vpd. These volumes are above the capacity for a five lane section. 7.3.2 SW Regional Airport Boulevard On SW Regional Airport Boulevard, the volume varies between 19,000 vpd and 21,000 vpd. With the exception of a short segment, this roadway is currently a two-lane roadway. As such, the volumes exceed the expected capacity for this type of facility. 7.3.3 S Walton Boulevard The five-lane section of S Walton Boulevard between W Central Avenue and SW I Street only carries 29,000 vpd, but due to the proximity of the signals, this intersection is barely above the limit of 28,200 vpd for a Class II/IV facility. Between SE J Street and I-540 NB Ramps, the volume on SE Walton Boulevard varies between 37,000 vpd and 30,000 vpd. However, for both cases, this corridor operates at LOS E.
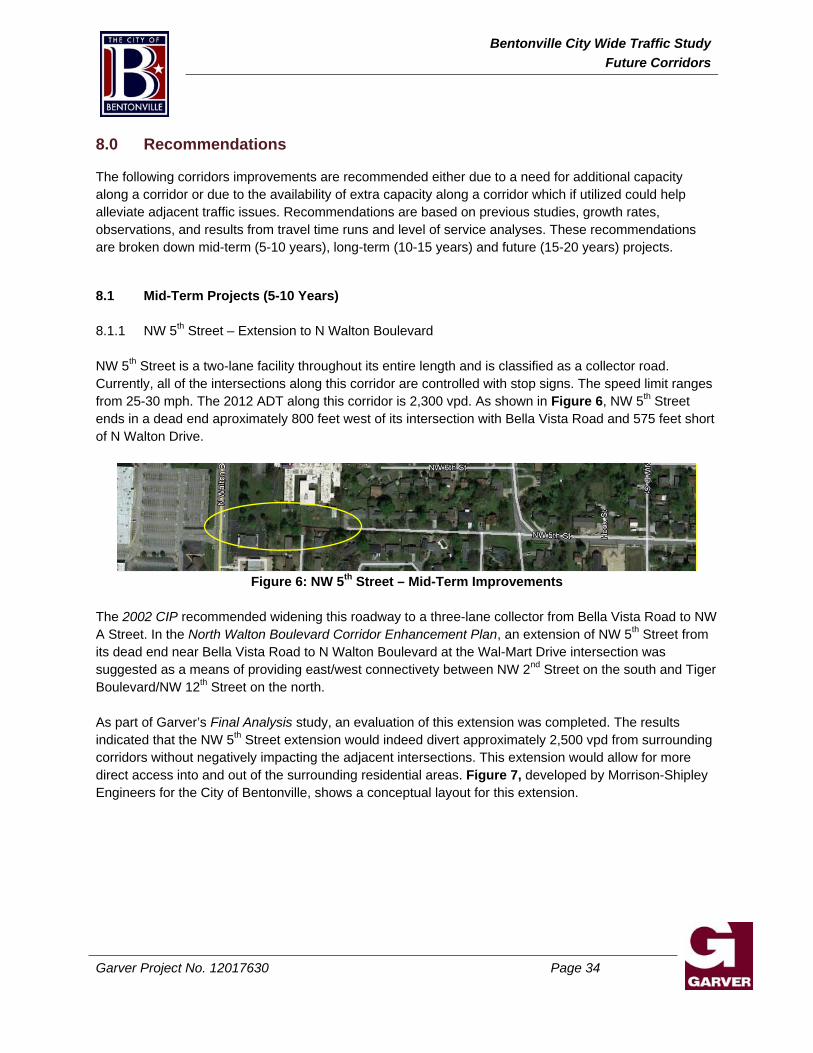
Bentonville City Wide Traffic StudyFuture Corridors
Garver Project No. 12017630 Page 34
8.0 Recommendations
The following corridors improvements are recommended either due to a need for additional capacity along a corridor or due to the availability of extra capacity along a corridor which if utilized could help alleviate adjacent traffic issues. Recommendations are based on previous studies, growth rates, observations, and results from travel time runs and level of service analyses. These recommendations are broken down mid-term (5-10 years), long-term (10-15 years) and future (15-20 years) projects.
8.1 Mid-Term Projects (5-10 Years) 8.1.1 NW 5th Street – Extension to N Walton Boulevard NW 5th Street is a two-lane facility throughout its entire length and is classified as a collector road. Currently, all of the intersections along this corridor are controlled with stop signs. The speed limit ranges from 25-30 mph. The 2012 ADT along this corridor is 2,300 vpd. As shown in Figure 6, NW 5th Street ends in a dead end aproximately 800 feet west of its intersection with Bella Vista Road and 575 feet short of N Walton Drive.
Figure 6: NW 5th Street – Mid-Term Improvements
The 2002 CIP recommended widening this roadway to a three-lane collector from Bella Vista Road to NW A Street. In the North Walton Boulevard Corridor Enhancement Plan, an extension of NW 5th Street from its dead end near Bella Vista Road to N Walton Boulevard at the Wal-Mart Drive intersection was suggested as a means of providing east/west connectivety between NW 2nd Street on the south and Tiger Boulevard/NW 12th Street on the north. As part of Garver’s Final Analysis study, an evaluation of this extension was completed. The results indicated that the NW 5th Street extension would indeed divert approximately 2,500 vpd from surrounding corridors without negatively impacting the adjacent intersections. This extension would allow for more direct access into and out of the surrounding residential areas. Figure 7, developed by Morrison-Shipley Engineers for the City of Bentonville, shows a conceptual layout for this extension.
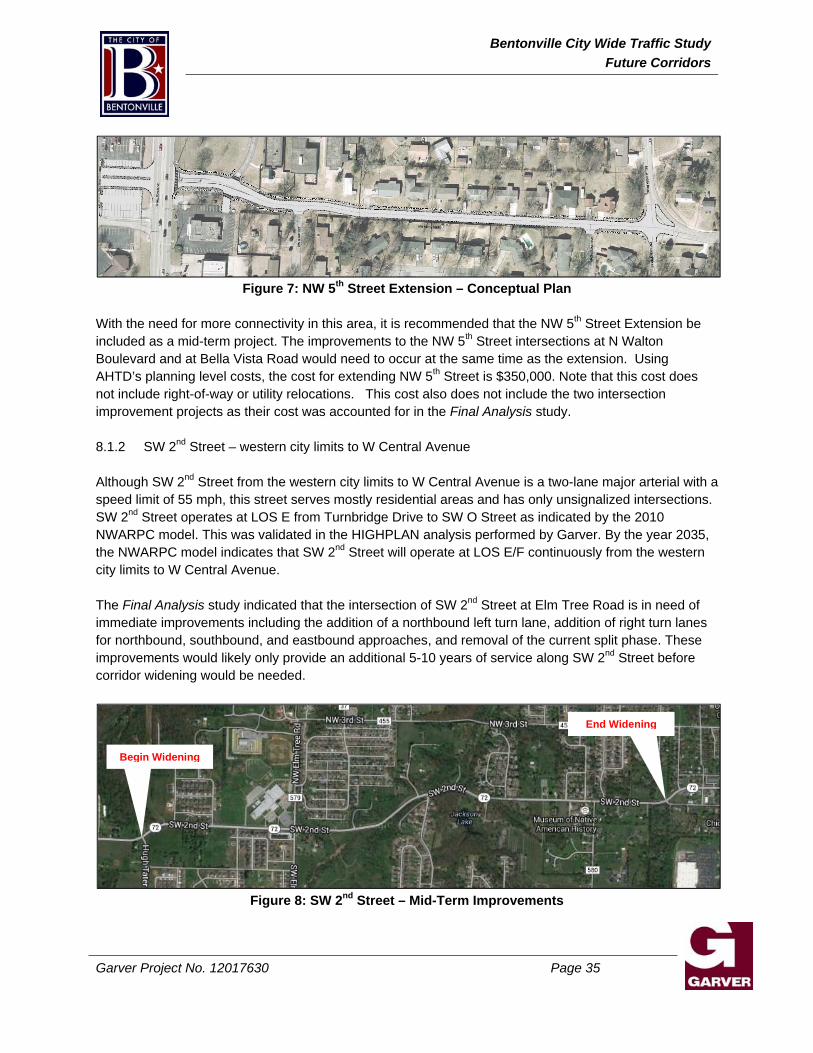
Bentonville City Wide Traffic StudyFuture Corridors
Garver Project No. 12017630 Page 35
Figure 7: NW 5th Street Extension – Conceptual Plan
With the need for more connectivity in this area, it is recommended that the NW 5th Street Extension be included as a mid-term project. The improvements to the NW 5th Street intersections at N Walton Boulevard and at Bella Vista Road would need to occur at the same time as the extension. Using AHTD’s planning level costs, the cost for extending NW 5th Street is $350,000. Note that this cost does not include right-of-way or utility relocations. This cost also does not include the two intersection improvement projects as their cost was accounted for in the Final Analysis study. 8.1.2 SW 2nd Street – western city limits to W Central Avenue Although SW 2nd Street from the western city limits to W Central Avenue is a two-lane major arterial with a speed limit of 55 mph, this street serves mostly residential areas and has only unsignalized intersections. SW 2nd Street operates at LOS E from Turnbridge Drive to SW O Street as indicated by the 2010 NWARPC model. This was validated in the HIGHPLAN analysis performed by Garver. By the year 2035, the NWARPC model indicates that SW 2nd Street will operate at LOS E/F continuously from the western city limits to W Central Avenue. The Final Analysis study indicated that the intersection of SW 2nd Street at Elm Tree Road is in need of immediate improvements including the addition of a northbound left turn lane, addition of right turn lanes for northbound, southbound, and eastbound approaches, and removal of the current split phase. These improvements would likely only provide an additional 5-10 years of service along SW 2nd Street before corridor widening would be needed.
Figure 8: SW 2nd Street – Mid-Term Improvements
Begin Widening
End Widening
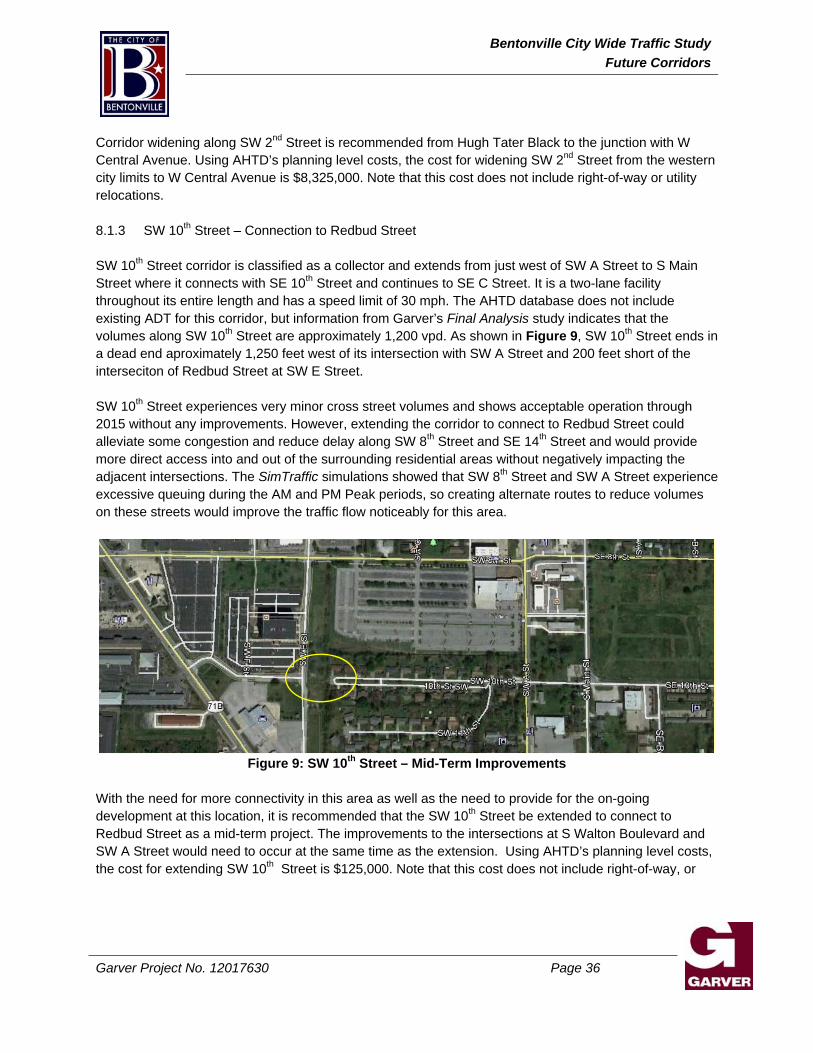
Bentonville City Wide Traffic StudyFuture Corridors
Garver Project No. 12017630 Page 36
Corridor widening along SW 2nd Street is recommended from Hugh Tater Black to the junction with W Central Avenue. Using AHTD’s planning level costs, the cost for widening SW 2nd Street from the western city limits to W Central Avenue is $8,325,000. Note that this cost does not include right-of-way or utility relocations. 8.1.3 SW 10th Street – Connection to Redbud Street SW 10th Street corridor is classified as a collector and extends from just west of SW A Street to S Main Street where it connects with SE 10th Street and continues to SE C Street. It is a two-lane facility throughout its entire length and has a speed limit of 30 mph. The AHTD database does not include existing ADT for this corridor, but information from Garver’s Final Analysis study indicates that the volumes along SW 10th Street are approximately 1,200 vpd. As shown in Figure 9, SW 10th Street ends in a dead end aproximately 1,250 feet west of its intersection with SW A Street and 200 feet short of the interseciton of Redbud Street at SW E Street. SW 10th Street experiences very minor cross street volumes and shows acceptable operation through 2015 without any improvements. However, extending the corridor to connect to Redbud Street could alleviate some congestion and reduce delay along SW 8th Street and SE 14th Street and would provide more direct access into and out of the surrounding residential areas without negatively impacting the adjacent intersections. The SimTraffic simulations showed that SW 8th Street and SW A Street experience excessive queuing during the AM and PM Peak periods, so creating alternate routes to reduce volumes on these streets would improve the traffic flow noticeably for this area.
Figure 9: SW 10th Street – Mid-Term Improvements
With the need for more connectivity in this area as well as the need to provide for the on-going development at this location, it is recommended that the SW 10th Street be extended to connect to Redbud Street as a mid-term project. The improvements to the intersections at S Walton Boulevard and SW A Street would need to occur at the same time as the extension. Using AHTD’s planning level costs, the cost for extending SW 10th Street is $125,000. Note that this cost does not include right-of-way, or
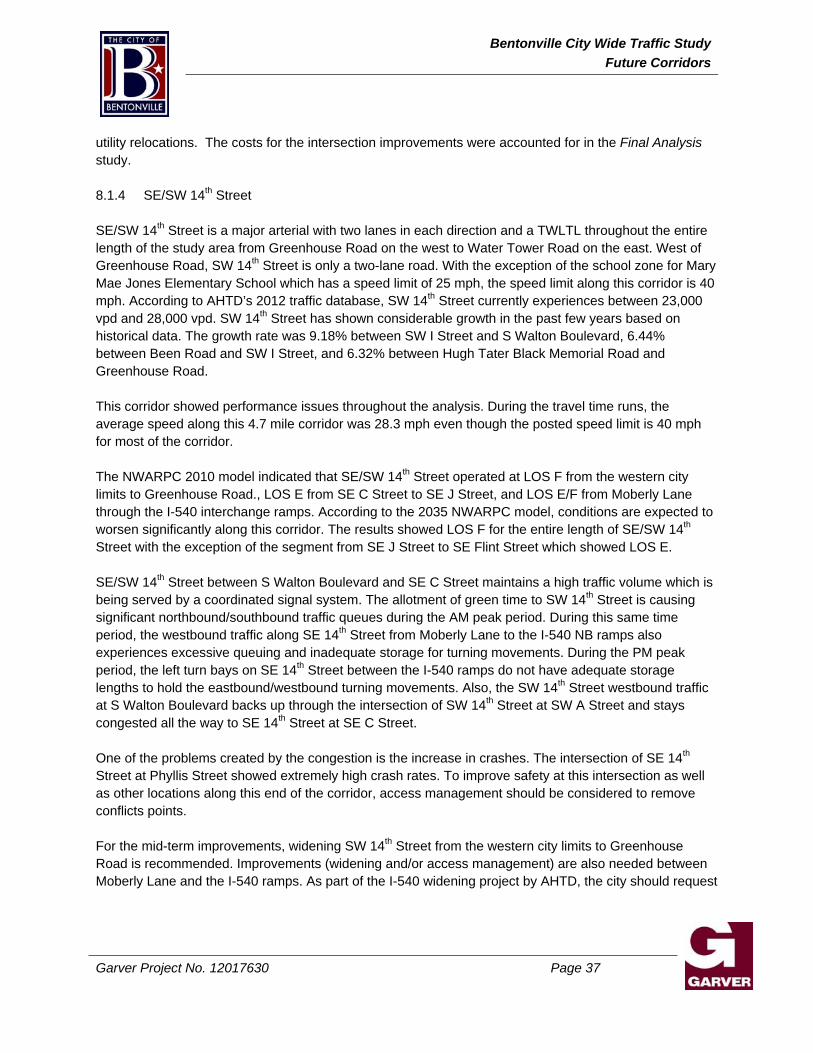
Bentonville City Wide Traffic StudyFuture Corridors
Garver Project No. 12017630 Page 37
utility relocations. The costs for the intersection improvements were accounted for in the Final Analysis study. 8.1.4 SE/SW 14th Street SE/SW 14th Street is a major arterial with two lanes in each direction and a TWLTL throughout the entire length of the study area from Greenhouse Road on the west to Water Tower Road on the east. West of Greenhouse Road, SW 14th Street is only a two-lane road. With the exception of the school zone for Mary Mae Jones Elementary School which has a speed limit of 25 mph, the speed limit along this corridor is 40 mph. According to AHTD’s 2012 traffic database, SW 14th Street currently experiences between 23,000 vpd and 28,000 vpd. SW 14th Street has shown considerable growth in the past few years based on historical data. The growth rate was 9.18% between SW I Street and S Walton Boulevard, 6.44% between Been Road and SW I Street, and 6.32% between Hugh Tater Black Memorial Road and Greenhouse Road. This corridor showed performance issues throughout the analysis. During the travel time runs, the average speed along this 4.7 mile corridor was 28.3 mph even though the posted speed limit is 40 mph for most of the corridor. The NWARPC 2010 model indicated that SE/SW 14th Street operated at LOS F from the western city limits to Greenhouse Road., LOS E from SE C Street to SE J Street, and LOS E/F from Moberly Lane through the I-540 interchange ramps. According to the 2035 NWARPC model, conditions are expected to worsen significantly along this corridor. The results showed LOS F for the entire length of SE/SW 14th Street with the exception of the segment from SE J Street to SE Flint Street which showed LOS E. SE/SW 14th Street between S Walton Boulevard and SE C Street maintains a high traffic volume which is being served by a coordinated signal system. The allotment of green time to SW 14th Street is causing significant northbound/southbound traffic queues during the AM peak period. During this same time period, the westbound traffic along SE 14th Street from Moberly Lane to the I-540 NB ramps also experiences excessive queuing and inadequate storage for turning movements. During the PM peak period, the left turn bays on SE 14th Street between the I-540 ramps do not have adequate storage lengths to hold the eastbound/westbound turning movements. Also, the SW 14th Street westbound traffic at S Walton Boulevard backs up through the intersection of SW 14th Street at SW A Street and stays congested all the way to SE 14th Street at SE C Street. One of the problems created by the congestion is the increase in crashes. The intersection of SE 14th Street at Phyllis Street showed extremely high crash rates. To improve safety at this intersection as well as other locations along this end of the corridor, access management should be considered to remove conflicts points. For the mid-term improvements, widening SW 14th Street from the western city limits to Greenhouse Road is recommended. Improvements (widening and/or access management) are also needed between Moberly Lane and the I-540 ramps. As part of the I-540 widening project by AHTD, the city should request
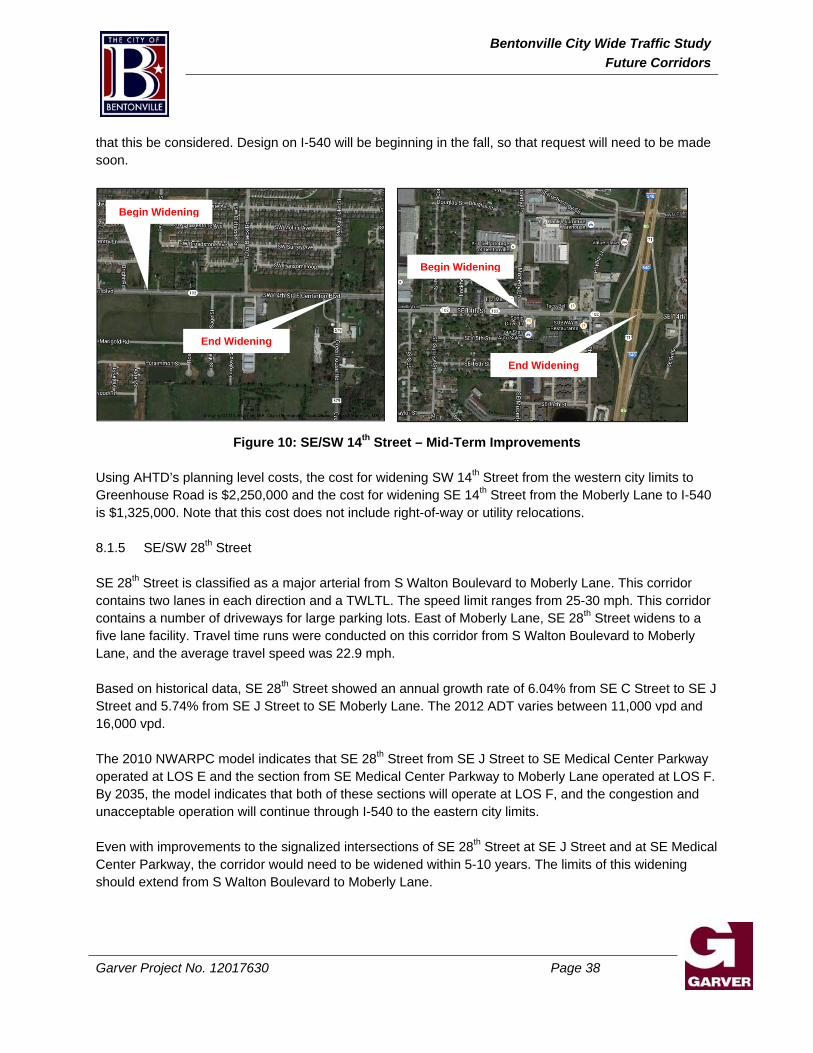
Bentonville City Wide Traffic StudyFuture Corridors
Garver Project No. 12017630 Page 38
that this be considered. Design on I-540 will be beginning in the fall, so that request will need to be made soon.
Figure 10: SE/SW 14th Street – Mid-Term Improvements Using AHTD’s planning level costs, the cost for widening SW 14th Street from the western city limits to Greenhouse Road is $2,250,000 and the cost for widening SE 14th Street from the Moberly Lane to I-540 is $1,325,000. Note that this cost does not include right-of-way or utility relocations. 8.1.5 SE/SW 28th Street SE 28th Street is classified as a major arterial from S Walton Boulevard to Moberly Lane. This corridor contains two lanes in each direction and a TWLTL. The speed limit ranges from 25-30 mph. This corridor contains a number of driveways for large parking lots. East of Moberly Lane, SE 28th Street widens to a five lane facility. Travel time runs were conducted on this corridor from S Walton Boulevard to Moberly Lane, and the average travel speed was 22.9 mph. Based on historical data, SE 28th Street showed an annual growth rate of 6.04% from SE C Street to SE J Street and 5.74% from SE J Street to SE Moberly Lane. The 2012 ADT varies between 11,000 vpd and 16,000 vpd.
The 2010 NWARPC model indicates that SE 28th Street from SE J Street to SE Medical Center Parkway operated at LOS E and the section from SE Medical Center Parkway to Moberly Lane operated at LOS F. By 2035, the model indicates that both of these sections will operate at LOS F, and the congestion and unacceptable operation will continue through I-540 to the eastern city limits. Even with improvements to the signalized intersections of SE 28th Street at SE J Street and at SE Medical Center Parkway, the corridor would need to be widened within 5-10 years. The limits of this widening should extend from S Walton Boulevard to Moberly Lane.
Begin Widening
End Widening
End Widening
Begin Widening
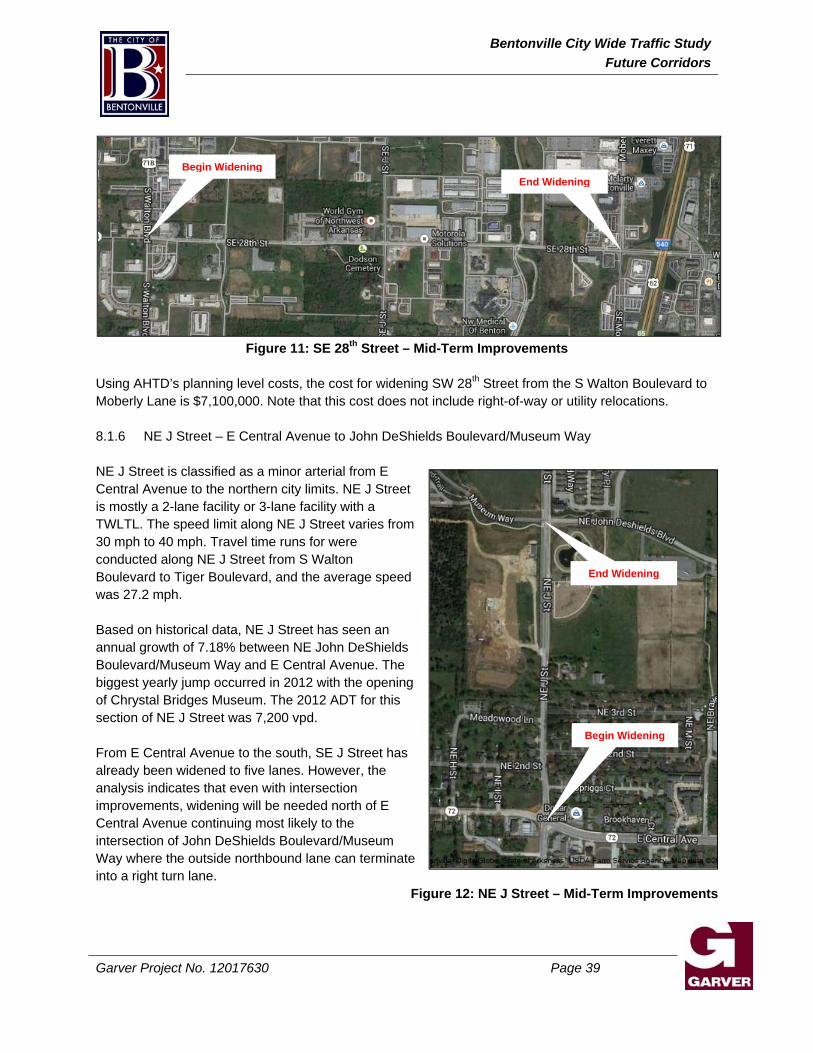
Bentonville City Wide Traffic StudyFuture Corridors
Garver Project No. 12017630 Page 39
Figure 11: SE 28th Street – Mid-Term Improvements
Using AHTD’s planning level costs, the cost for widening SW 28th Street from the S Walton Boulevard to Moberly Lane is $7,100,000. Note that this cost does not include right-of-way or utility relocations. 8.1.6 NE J Street – E Central Avenue to John DeShields Boulevard/Museum Way NE J Street is classified as a minor arterial from E Central Avenue to the northern city limits. NE J Street is mostly a 2-lane facility or 3-lane facility with a TWLTL. The speed limit along NE J Street varies from 30 mph to 40 mph. Travel time runs for were conducted along NE J Street from S Walton Boulevard to Tiger Boulevard, and the average speed was 27.2 mph. Based on historical data, NE J Street has seen an annual growth of 7.18% between NE John DeShields Boulevard/Museum Way and E Central Avenue. The biggest yearly jump occurred in 2012 with the opening of Chrystal Bridges Museum. The 2012 ADT for this section of NE J Street was 7,200 vpd. From E Central Avenue to the south, SE J Street has already been widened to five lanes. However, the analysis indicates that even with intersection improvements, widening will be needed north of E Central Avenue continuing most likely to the intersection of John DeShields Boulevard/Museum Way where the outside northbound lane can terminate into a right turn lane.
Figure 12: NE J Street – Mid-Term Improvements
End Widening Begin Widening
End Widening
Begin Widening
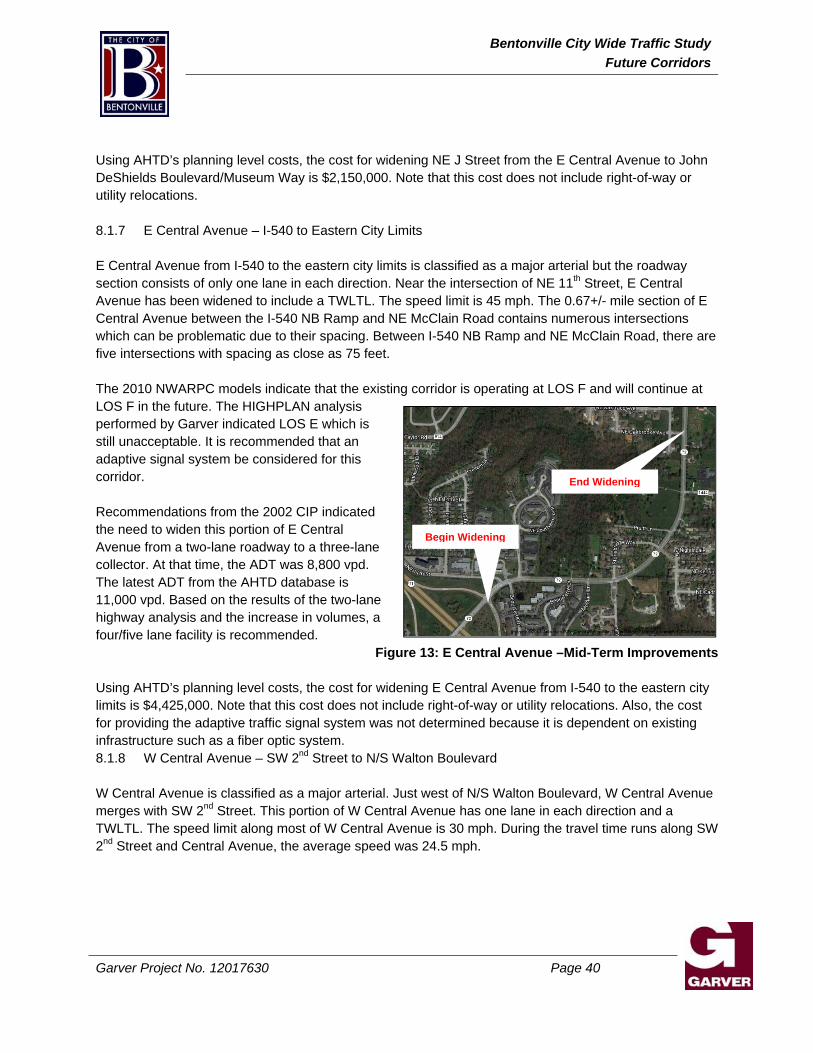
Bentonville City Wide Traffic StudyFuture Corridors
Garver Project No. 12017630 Page 40
Using AHTD’s planning level costs, the cost for widening NE J Street from the E Central Avenue to John DeShields Boulevard/Museum Way is $2,150,000. Note that this cost does not include right-of-way or utility relocations. 8.1.7 E Central Avenue – I-540 to Eastern City Limits E Central Avenue from I-540 to the eastern city limits is classified as a major arterial but the roadway section consists of only one lane in each direction. Near the intersection of NE 11th Street, E Central Avenue has been widened to include a TWLTL. The speed limit is 45 mph. The 0.67+/- mile section of E Central Avenue between the I-540 NB Ramp and NE McClain Road contains numerous intersections which can be problematic due to their spacing. Between I-540 NB Ramp and NE McClain Road, there are five intersections with spacing as close as 75 feet. The 2010 NWARPC models indicate that the existing corridor is operating at LOS F and will continue at LOS F in the future. The HIGHPLAN analysis performed by Garver indicated LOS E which is still unacceptable. It is recommended that an adaptive signal system be considered for this corridor. Recommendations from the 2002 CIP indicated the need to widen this portion of E Central Avenue from a two-lane roadway to a three-lane collector. At that time, the ADT was 8,800 vpd. The latest ADT from the AHTD database is 11,000 vpd. Based on the results of the two-lane highway analysis and the increase in volumes, a four/five lane facility is recommended.
Figure 13: E Central Avenue –Mid-Term Improvements Using AHTD’s planning level costs, the cost for widening E Central Avenue from I-540 to the eastern city limits is $4,425,000. Note that this cost does not include right-of-way or utility relocations. Also, the cost for providing the adaptive traffic signal system was not determined because it is dependent on existing infrastructure such as a fiber optic system. 8.1.8 W Central Avenue – SW 2nd Street to N/S Walton Boulevard W Central Avenue is classified as a major arterial. Just west of N/S Walton Boulevard, W Central Avenue merges with SW 2nd Street. This portion of W Central Avenue has one lane in each direction and a TWLTL. The speed limit along most of W Central Avenue is 30 mph. During the travel time runs along SW 2nd Street and Central Avenue, the average speed was 24.5 mph.
Begin Widening
End Widening
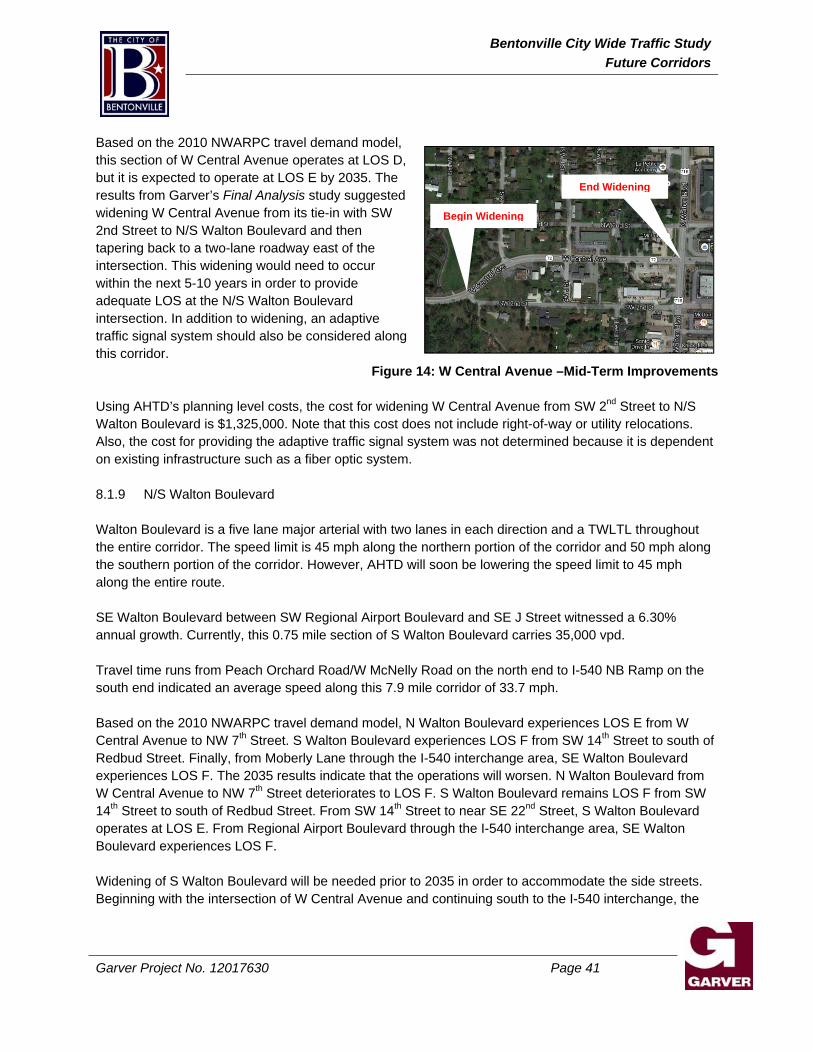
Bentonville City Wide Traffic StudyFuture Corridors
Garver Project No. 12017630 Page 41
Based on the 2010 NWARPC travel demand model, this section of W Central Avenue operates at LOS D, but it is expected to operate at LOS E by 2035. The results from Garver’s Final Analysis study suggested widening W Central Avenue from its tie-in with SW 2nd Street to N/S Walton Boulevard and then tapering back to a two-lane roadway east of the intersection. This widening would need to occur within the next 5-10 years in order to provide adequate LOS at the N/S Walton Boulevard intersection. In addition to widening, an adaptive traffic signal system should also be considered along this corridor.
Figure 14: W Central Avenue –Mid-Term Improvements Using AHTD’s planning level costs, the cost for widening W Central Avenue from SW 2nd Street to N/S Walton Boulevard is $1,325,000. Note that this cost does not include right-of-way or utility relocations. Also, the cost for providing the adaptive traffic signal system was not determined because it is dependent on existing infrastructure such as a fiber optic system. 8.1.9 N/S Walton Boulevard Walton Boulevard is a five lane major arterial with two lanes in each direction and a TWLTL throughout the entire corridor. The speed limit is 45 mph along the northern portion of the corridor and 50 mph along the southern portion of the corridor. However, AHTD will soon be lowering the speed limit to 45 mph along the entire route. SE Walton Boulevard between SW Regional Airport Boulevard and SE J Street witnessed a 6.30% annual growth. Currently, this 0.75 mile section of S Walton Boulevard carries 35,000 vpd. Travel time runs from Peach Orchard Road/W McNelly Road on the north end to I-540 NB Ramp on the south end indicated an average speed along this 7.9 mile corridor of 33.7 mph.
Based on the 2010 NWARPC travel demand model, N Walton Boulevard experiences LOS E from W Central Avenue to NW 7th Street. S Walton Boulevard experiences LOS F from SW 14th Street to south of Redbud Street. Finally, from Moberly Lane through the I-540 interchange area, SE Walton Boulevard experiences LOS F. The 2035 results indicate that the operations will worsen. N Walton Boulevard from W Central Avenue to NW 7th Street deteriorates to LOS F. S Walton Boulevard remains LOS F from SW 14th Street to south of Redbud Street. From SW 14th Street to near SE 22nd Street, S Walton Boulevard operates at LOS E. From Regional Airport Boulevard through the I-540 interchange area, SE Walton Boulevard experiences LOS F. Widening of S Walton Boulevard will be needed prior to 2035 in order to accommodate the side streets. Beginning with the intersection of W Central Avenue and continuing south to the I-540 interchange, the
Begin Widening
End Widening
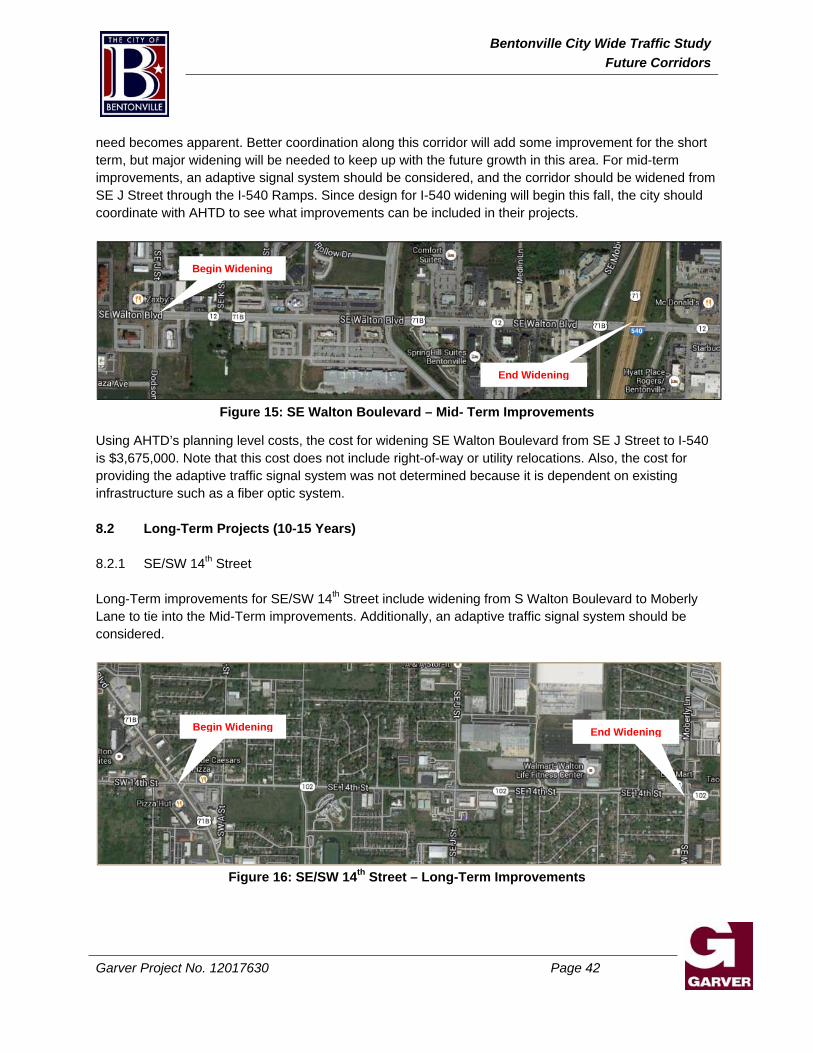
Bentonville City Wide Traffic StudyFuture Corridors
Garver Project No. 12017630 Page 42
need becomes apparent. Better coordination along this corridor will add some improvement for the short term, but major widening will be needed to keep up with the future growth in this area. For mid-term improvements, an adaptive signal system should be considered, and the corridor should be widened from SE J Street through the I-540 Ramps. Since design for I-540 widening will begin this fall, the city should coordinate with AHTD to see what improvements can be included in their projects.
Figure 15: SE Walton Boulevard – Mid- Term Improvements
Using AHTD’s planning level costs, the cost for widening SE Walton Boulevard from SE J Street to I-540 is $3,675,000. Note that this cost does not include right-of-way or utility relocations. Also, the cost for providing the adaptive traffic signal system was not determined because it is dependent on existing infrastructure such as a fiber optic system. 8.2 Long-Term Projects (10-15 Years) 8.2.1 SE/SW 14th Street Long-Term improvements for SE/SW 14th Street include widening from S Walton Boulevard to Moberly Lane to tie into the Mid-Term improvements. Additionally, an adaptive traffic signal system should be considered.
Figure 16: SE/SW 14th Street – Long-Term Improvements
Begin Widening End Widening
Begin Widening
End Widening
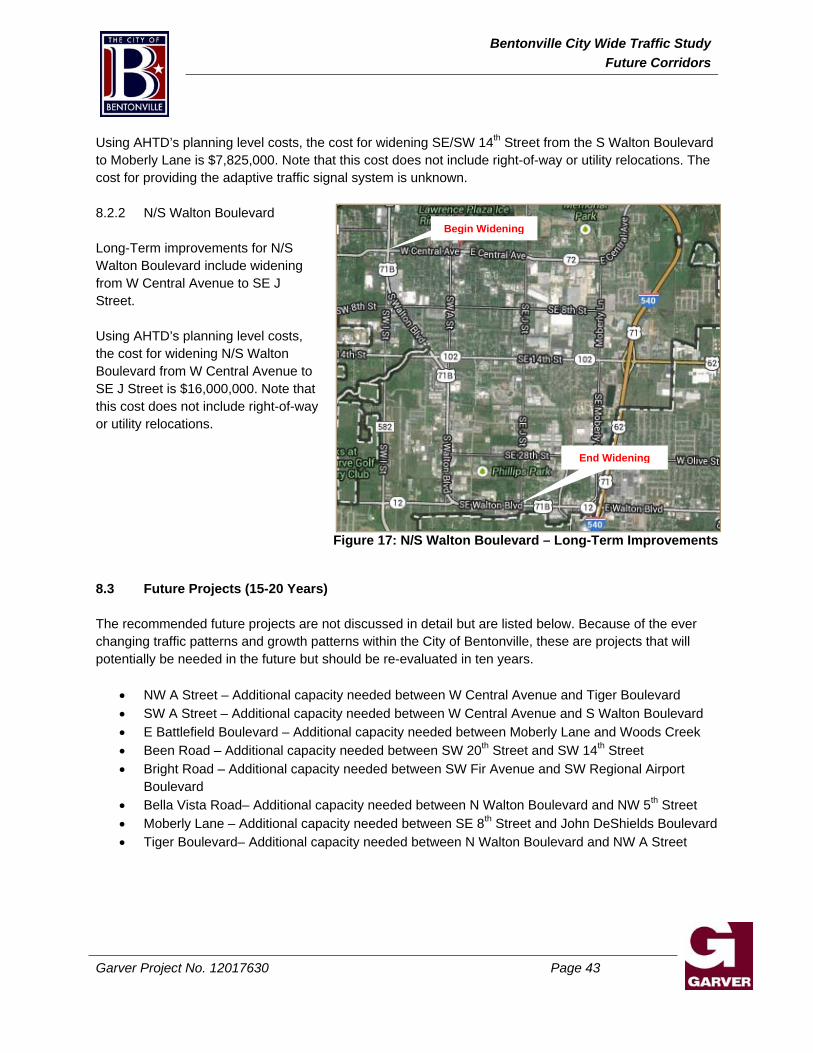
Bentonville City Wide Traffic StudyFuture Corridors
Garver Project No. 12017630 Page 43
Begin Widening
End Widening
Using AHTD’s planning level costs, the cost for widening SE/SW 14th Street from the S Walton Boulevard to Moberly Lane is $7,825,000. Note that this cost does not include right-of-way or utility relocations. The cost for providing the adaptive traffic signal system is unknown. 8.2.2 N/S Walton Boulevard Long-Term improvements for N/S Walton Boulevard include widening from W Central Avenue to SE J Street. Using AHTD’s planning level costs, the cost for widening N/S Walton Boulevard from W Central Avenue to SE J Street is $16,000,000. Note that this cost does not include right-of-way or utility relocations.
Figure 17: N/S Walton Boulevard – Long-Term Improvements
8.3 Future Projects (15-20 Years) The recommended future projects are not discussed in detail but are listed below. Because of the ever changing traffic patterns and growth patterns within the City of Bentonville, these are projects that will potentially be needed in the future but should be re-evaluated in ten years.
• NW A Street – Additional capacity needed between W Central Avenue and Tiger Boulevard • SW A Street – Additional capacity needed between W Central Avenue and S Walton Boulevard • E Battlefield Boulevard – Additional capacity needed between Moberly Lane and Woods Creek • Been Road – Additional capacity needed between SW 20th Street and SW 14th Street • Bright Road – Additional capacity needed between SW Fir Avenue and SW Regional Airport
Boulevard • Bella Vista Road– Additional capacity needed between N Walton Boulevard and NW 5th Street • Moberly Lane – Additional capacity needed between SE 8th Street and John DeShields Boulevard • Tiger Boulevard– Additional capacity needed between N Walton Boulevard and NW A Street
![Vegetable oil-derived epoxy monomers and polymer · PDF filepetitiveness in many market applications [5]. How- ... with DGEBA for glass fiber composites ... Mart, Bentonville, AR,](https://img.pdfslide.us/doc/110x75/5ab0537a7f8b9a190d8e7e08/vegetable-oil-derived-epoxy-monomers-and-polymer-in-many-market-applications.jpg)