Embed Size (px)
Citation preview

CITY OF NORWICH, CONNECTICUT
COMPREHENSIVE ANNUAL FINANCIAL REPORT
FISCAL YEAR ENDED JUNE 30, 2012 DEPARTMENT OF FINANCE
UNION SQUARE NORWICH, CONNECTICUT

Comprehensive Annual Financial Report
of the
City of Norwich,
Connecticut
Fiscal Year Ended June 30, 2012
Prepared By:
City of Norwich Finance Department
Joseph A. Ruffo, CPA Comptroller
Joshua A. Pothier, CPA
Deputy Comptroller
Anthony Madeira Accountant

CITY OF NORWICH, CONNECTICUT
TABLE OF CONTENTS Page INTRODUCTORY SECTION Comptroller’s Letter of Transmittal i-vii Certificate of Achievement for Excellence in Financial Reporting viii Organizational Chart of the City ix Organizational Chart of the Finance Department x Directory of Elected City Officials and NPU Commissioners xi Directory of Appointed City Officials xii FINANCIAL SECTION Independent Auditors’ Report 1-2 Management’s Discussion and Analysis 3-10 Exhibit Basic Financial Statements: Government-Wide Financial Statements: I Statement of Net Assets 11 II Statement of Activities 12 Fund Financial Statements: Governmental Funds: III Balance Sheet 13-14 IV Statement of Revenues, Expenditures and Changes in Fund Balances 15-16 Proprietary Funds: V Statement of Net Assets 17 VI Statement of Revenues, Expenses and Changes in Fund Net Assets 18 VII Statement of Cash Flows 19 Fiduciary Funds: VIII Statement of Fiduciary Net Assets 20 IX Statement of Changes in Plan Net Assets - Fiduciary Funds 21 Notes to Financial Statements 22-56 Required Supplementary Information: General Fund: RSI-1 Schedule of Revenues and Other Financing Sources - Budget and Actual 57-58 RSI-2 Schedule of Expenditures and Other Financing Uses - Budget and Actual 59-60 Combining and Individual Fund Statements and Schedules: General Fund: A-1 Comparative Balance Sheet 61 A-2 Report of Tax Collector 62 Nonmajor Governmental Funds: B-1 Combining Balance Sheet 63-66 B-2 Combining Statement of Revenues, Expenditures and Changes in Fund Balances 67-70 B-3 Fire Districts Fund Revenues - Budgetary Basis - Budget and Actual 71 B-4 Fire Districts Fund Expenditures - Budgetary Basis - Budget and Actual 72 B-5 Schedule of Fire District Taxes 73

Exhibit Page Combining and Individual Fund Statements and Schedules (continued): Nonmajor Enterprise Funds: C-1 Combining Statement of Net Assets 74 C-2 Combining Statement of Revenues, Expenses and Changes in Fund Net Assets 75 C-3 Combining Statement of Cash Flows 76 Internal Service Funds: D-1 Combining Statement of Net Assets 77 D-2 Combining Statement of Revenues, Expenses and Changes in Fund Net Assets 78 D-3 Combining Statement of Cash Flows 79 Fiduciary Funds: Agency Funds: E-1 Combining Balance Sheet 80 E-2 Combining Statement of Changes in Assets and Liabilities 81 Schedule Supplemental Schedules: 1 Schedule of Bonds and Serial Notes Payable 82 2 Bond and Serial Notes Payable: Schedule of Annual Debt Service Requirements 83 STATISTICAL SECTION Table Financial Trends: 1 Net Assets by Component - Last Ten Fiscal Years 84 2 Changes in Net Assets - Last Ten Fiscal Years 85-86 3 Fund Balances, Governmental Funds - Last Ten Fiscal Years 87 4 Changes in Fund Balances, Governmental Funds - Last Ten Fiscal Years 88 Revenue Capacity: 5 Assessed and Estimated Actual Value of Taxable Property - Last Ten Fiscal Years 89 6 Principal Property Taxpayers - October 1, 2010 and October 1, 2001 90 7 Property Tax Levies and Collections - Last Ten Fiscal Years 91 Debt Capacity: 8 Ratios of Outstanding Debt by Type - Last Ten Fiscal Years 92 9 Statement of Debt Limitation - June 30, 2012 93 10 Legal Debt Margin Information - Last Ten Fiscal Years 94 Demographic and Economic Statistics: 11 Demographic and Employment Statistics - Last Ten Fiscal Years 95 12 Principal Employers Current Year and 2003 96 Operating Information: 13 Budgeted Full-Time Equivalent City Government Employees by Function/Program Last Ten Fiscal Years 97 14 Operating Indicators by Function/Program - Last Ten Fiscal Years 98-99 15 Capital Asset Statistics by Function - Last Ten Fiscal Years 100-101

Introductory Section

CITY OF NORWICH CONNECTICUT
JOSEPH A. RUFFO, C.P.A. 100 Broadway Room 105 COMPTROLLER Norwich, CT 06360-4431 (860) 823-3730 Fax (860) 823-3812
i
December 26, 2012 To the Honorable Mayor and Members of the City Council City of Norwich Norwich, Connecticut
I am pleased to submit the Comprehensive Annual Financial Report (CAFR) of the City of Norwich (the “City”) for the fiscal year ended June 30, 2012. Responsibility for both the accuracy of the data and the completeness and fairness of the presentation, including all disclosures, rests with the City. To the best of our knowledge and belief, the enclosed data are accurate in all material respects and are reported in a manner to present fairly the financial position and results of operations of the City. All disclosures necessary to enable the reader to gain an understanding of the City’s financial activities have been included.
The City’s management is responsible for establishing and maintaining an internal control structure designed to ensure that its assets are protected from loss, theft or misuse, and to ensure that adequate accounting data is compiled to manage spending within prescribed budget limitations and for the preparation of financial statements in conformity with generally accepted accounting principles. The internal control structure is designed to provide reasonable, but not absolute, assurance that these objectives are met. The concept of reasonable assurance recognizes that: (l) the cost of a control should not exceed the benefits likely to be derived; and (2) the valuation of costs and benefits requires estimates and judgments by management.
State Statute and the City Charter require an annual audit by an independent certified public accountant. The statute further prescribes that each municipality’s annual report shall be prepared in accordance with accounting principles generally accepted in the United States of America. This report has been prepared according to these standards. The auditors’ unqualified opinion is included in this report.
The City is required to undergo an annual single audit in conformity with the provisions of the Federal Single Audit Act and U.S. Office of Management and Budget Circular A-133, “Audits of States, Local Governments and Non-Profit Organizations.” Information related to this single audit, including the schedule of expenditures of federal awards, findings and recommendations, and auditors’ reports on the internal control over financial reporting and compliance with applicable laws and regulations, are issued

ii
under separate cover and are not included in this report. The City is also required to undergo a State single audit. Information related to this State single audit will be issued separately.
Generally accepted accounting principles require that management provide a narrative introduction, overview and analysis to accompany the basic financial statements in the MD&A. This letter of transmittal is designed to complement the MD&A and should be read in conjunction with it. The City’s MD&A can be found immediately following the report of the independent auditors.
Profile of Government
Norwich, founded in 1659, is Connecticut’s 24th largest city by population. The City was incorporated in May 1784. The Town and City were consolidated on January 1, 1952. Norwich covers an area of 27.1 square miles located 40 miles southeast of Hartford surrounded by Montville, Preston, Lisbon, Sprague, Franklin and Bozrah.
The City is approximately three hours from New York City by rail or highway transportation. Providence, Rhode Island is approximately an hour from the City and Boston is approximately two hours away. The City is served by interstate, intrastate and local bus lines. The City is served by Interstate 395 from north to south connecting Norwich with 1-95 and 1-90 to Boston and New York. Route 2 links the City with Hartford and 1-91. State Route 82 connects downtown Norwich with 1-395. Rail transportation and freight service is available to major points including New York, Boston, Providence and Montreal. Air services are available at Groton-New London Airport to the south, Green Airport (Providence) to the east and Bradley Airport to the north. Norwich Harbor provides a 600-foot turning basin connecting with the Thames River and Long Island Sound.
The City operates under a Charter adopted in 1952, which was revised April 4, 1995. During fiscal year 2000, a City Charter Revision Committee was appointed for the purpose of reviewing the existing Charter and proposing any changes. A referendum was held on March 13, 2001 for the purpose of voting on the nine recommendations made by the Charter Revision Committee. The significant changes passed by voters were the reduction of City Council members from eleven to six elected at large, and the replacement of the City Council President by a Mayor. The City operates under a Council/Manager form of government. The City Manager is appointed by the Council and serves as the Chief Executive Officer. The City Council consists of six members and one Mayor, all elected at large. Elections are held during odd calendar years as provided by state statute.
This report includes all funds of the City. The City provides a full range of services to its citizens. These services include: public safety, street maintenance and sanitation, health and human services, public parks and recreation, library, education, public improvements, planning, zoning, water, gas, electric, sewer and general administrative services.
The City Council is required to adopt a final budget no later than the second Monday in June for the following fiscal year. This annual budget serves as the foundation for the City of Norwich’s financial planning and control. The budget sets the annual spending limits for each department and the property tax mill rate. After the budget is set, departments may transfer resources within their department with the approval of the City Manager. Additional appropriations or transfers between departments require approval by the City Council.

iii
Local Economy
The City aggressively pursues economic and physical stabilization and revitalization. The City has maintained the quality of services to its citizens while having one of the lowest per capita tax burdens in the State at $1,359 for fiscal year 2010, the 7th lowest in the State. Through the direction of the Mayor and the assistance of the Norwich Community Development Corporation, the City attempts to attract and retain the best combination of business and industry to meet the needs of the City and its citizens. Consequently, the City is involved with projects which will improve both the tax base and quality of life in Norwich.
Commercial/Industrial Activity
Marina at American Wharf. Last year the Marina facility was purchased by Joyal Capital Group and has undergone extensive infrastructure renovations and repairs. Joyal also constructed a new Ice Cream Stand at Howard Brown Park. Future plans are multi-phased and improvements are expected to continue over the next few years.
Route 82 CVS Drug Store. A brand new CVS facility was constructed on the site of the former Olympic Pizza. The former owner/operator of Olympic Pizza opened a new restaurant called Fat Cats across the street in the Surplus Unlimited Center.
The former Norwichtown Mall was purchased by Winstanley Corporation and has been renamed Norwichtown Commons. The mall portion of the building will be completely redesigned and repurposed to meet today’s trends in retail sales.
Ponemah Mill Adaptive Reuse Project. This $51 million project will convert a 19th century Taftville mill into 237 residential apartment units. This project is expected to be finished in 2017.
Five Guys Burgers purchased the prior Tim Hortons on Route 82 and renovated the building to meet their customers’ needs.
Konover Corporation purchased the former Friendly’s Restaurant next to Marcus Plaza and will make improvements to better facilitate vehicle access to the site. They are also planning a major facelift for the existing center.
Housing Market
Despite economic conditions, two major residential projects that had stalled were purchased and have been successfully put back on track. The Hills at Riverview in Taftville and The Villas at River Heights are moving towards completion over the next few years. Residential building permits are at higher level than the last two years and are primarily for renovation work.
State of Connecticut Building & Infrastructure Projects
Route 82/I-395 Interchange. The Connecticut Department of Transportation started construction in April 2008 to widen the lanes, add sidewalks, and improve the safety and traffic flow in this area of Route 82. This $8.3 million project was completed in fall 2009.
Three Rivers Community College. Three Rivers Community College was consolidated into its New London Turnpike location in an $85.6 million, 295,644 square-foot project which was completed in 2009.
Norwich Technical High School. The State of Connecticut finished construction on this $46.2 million addition and renovation project in fall 2008.

iv
Major City Initiatives
Downtown Revitalization Initiative. The residents of the City of Norwich passed a bond referendum item in November 2010 for $3.38 million for downtown revitalization. Comprised strictly of business incentives including programs for building code correction assistance, commercial lease rebates, and revolving loan fund. The City’s designated development agency- Norwich Community Development Corporation is designing and administering the five-year plan. The three programs are designed to both prepare long time vacant spaces for occupancy as well as stimulate the growth of business activity in the downtown area. The programs launched in August 2011 and have had much traffic checking out the programs. To date there have been 45 inquires, 25 active applications, two applications approved for a total of $29,850 in loans and rebates. As of this writing, there are three active development projects totaling 121,000 square feet that are depending on these programs to make the project economics work.
Gas Line Extensions. Norwich Public Utilities has completed the $3.0 million natural gas line extension that voters approved in the 2010 November election. Thus far, NPU has extended the gas line by more than 6 miles and has installed over 2 miles of services. The initial program has been so successful that voters approved an additional $8.0 million for gas line extensions in the November 2012 election.
Road Improvements. The residents of the City of Norwich passed a bond referendum item in November 2009 for $5 million of road improvements. The City spent a total of $1,372,300 of combined bond funds and capital funds during fiscal year 2012 to repave or reconstruct 4.8 miles of City roads. In addition, the City also expended $67,600 in preventative maintenance measures such as crack sealing and chip sealing to extend the expected life of an additional 3.0 miles of moderately deteriorated City roads.
Thomas J. Dodd Memorial Stadium. City officials negotiated a lease with the Single-A Oneonta Tigers to replace the Connecticut Defenders, who terminated their lease with the City in September 2009. The Connecticut Tigers (a feeder team to the Detroit Tigers) opened in June of 2010 and are in their third season in Norwich. In addition, Dodd Stadium has been selected to as the site for such events as an NCAA regional baseball tournament a three-day Bluegrass Festival, an auto show and numerous other programs at this beautiful venue.
School Demolition Projects. The City of Norwich recently completed demolition projects at the abandoned Buckingham School and Greeneville School. The combined cost for both projects was $665,000. Funding for the projects was through City bonding. The removal of these abandoned schools serves to reduce overall City liability, prevent the deterioration of surrounding property values, and protect the general public, City maintenance staff, and emergency responders from the many hazards that inevitably arise at such abandoned structures.
Clean Water Infrastructure. Norwich Public Utilities has embarked on a water infrastructure improvement program. The upgrades will be partially paid for through state grants and low interest loans from the Drinking Water Revolving Fund (DWRF).
Clean Rivers, Clean Harbor, Sound Norwich. Norwich Public Utilities has continued the design of a $100 million project which is expected to take 15-20 years to complete. The digester phase of the project has been completed. The project involves expansion and improvement to the wastewater treatment facilities, elimination of the 15 remaining combined sewer overflows (points at which the storm drain network combines with sewer mains), and upgrading the pumping stations. The project will be partially funded with state and federal grants and low-interest loan programs. These infrastructure improvements will:
o Bring Norwich current with state and federal environmental mandates o Upgrade the city’s aging wastewater infrastructure to reduce treatment plant odors o Eliminate the discharge of untreated waste into local rivers during wet weather

v
o Reduce nitrogen from sewage discharge, making our rivers, harbor and Long Island Sound cleaner
o Power the sewer plant using recaptured methane gas, reducing Norwich’s energy costs o Prepare Norwich to meet current growth and future business development needs.
In April 2010, the Norwich City Council approved $13.4 million in bond ordinances to rehabilitate one of the wastewater treatment plant’s digesters and pay for the design costs for other wastewater treatment facility improvements. The financing of this project is expected to be composed of: $2.6 million of State of Connecticut Clean Water Fund grants, $9.5 million of State of Connecticut Clean Water Fund loans bearing an interest rate of 2%, $1 million of General Obligation bonds and $300,000 of revenue bonds.
Newton Street Area and Flyers Drive Area Sewer Extension Projects. Norwich Public Utilities completed work on the extension of the sanitary sewer system in the Newton Street and Flyers Drive areas.
Municipal Area Network. Norwich Public Utilities continued to build upon their Municipal Area Network. The network consists of 32 miles of 144 strand fiber optic cabling around the city in two “loops.” The cable will provide high-speed data, video and communications connectivity that is 600 times faster than any other data network available in Norwich. Some of the benefits include: the ability of NPU to quickly detect issues with its electric, water, natural gas and sewer infrastructure through its Supervisory Control and Data Acquisition (SCADA) system and the ability to link all city departments with unprecedented speed and reliability. This network currently provides high speed connectivity to over various NPU and City of Norwich sites. Some private sector organizations have begun to utilize this city asset as well.
Automated Metering Infrastructure (AMI) DOE Grant. Norwich Public Utilities continued to implement the $4.0 DOE Automated Metering Infrastructure (AMI) project administered through the Connecticut Municipal Electric Energy Cooperative (CMEEC). Norwich Public Utilities obtained a $4.0 million DOE award for an AMI pilot program to design and install over 8,000 smart electric meters and associated network infrastructure. This system will provide enhanced customer service, improved system reliability and troubleshooting, improved outage response time and reduced customer cost once fully implemented. In addition, Norwich Public Utilities has commenced a pilot program to install 2,000 smart gas and water meters to leverage the smart technology. Thus far, NPU has installed 3000 of these new meters though out Norwich.
Kelly Middle School Renovations. On November 6, 2007, Norwich voters approved $40.2 million renovations and improvements to Kelly Middle School on Mahan Drive. Over 70% of the project was funded by State of Connecticut school construction grants. The project has been finalized and included additional classrooms, updated utilities, asbestos abatement and the addition of an 800 seat auditorium.
City Hall Exterior Stairway Rehabilitation. The Public Works Department recently secured a 50% matching grant, up to a maximum of $200,000, from the State Historic Preservation Office for the rehabilitation of the two exterior stairways at City Hall. The project is currently under construction and was awarded at a cost of approximately $350,000. This project will help preserve City Hall for many future decades.
Intermodal Transportation Center. This $22 million project was conceived in the mid-1990’s. Construction began in July 2010 with the ribbon cutting ceremony on June 9, 2012. The project is supported by Federal, State and City funds. The transportation center is located on the corner of West Main Street and Falls Avenue and has 167 space parking garage; provides a small indoor retail and ticketing services for SEAT bus riders. It provides year round protection from the weather for the citizens that make use of the transit system. The facility is located to

vi
accommodate future passenger ferry traffic and passenger rail on the New England Central Corridor rail line. Taxis, trolleys and inter-regional private busses are also accommodated in this new facility.
Sherman Street Bridge and Sunnyside Street Bridge Rehabilitations. The Public Works Department previously secured approximately $5 million in Federal and State grant money to pursue rehabilitation projects to both the Sherman Street bridges and the Sunnyside Street bridge. Design is underway with the Sunnyside Street bridge project, while the more complicated Sherman Street bridges project is still in design development with City Engineers, CTDOT Engineers and the design consultant. Both structures are critical passageways over the Yantic River. In the case of the Sherman Street bridges, it serves as a regional access portal to the William W. Backus Hospital.
Long-Term Financial Planning
The City of Norwich has the following policies with regard to long-term financial planning:
Fund balance - The General Fund undesignated fund balance shall not fall below 8% of annual operating expenditures.
Capital Improvements - City departments submit a five-year capital improvement plan each year. The City Manager and City Council weigh the needs of the City and either include the most crucial projects in the capital budget or introduce bond ordinances to finance the projects. Norwich’s Charter requires that the City budget at least the value of 1 mill in capital projects each year.
Debt Management - in addition to statutory debt limitations, the City further restricts debt by 1) not allowing debt service expenditures to grow at a rate greater than all other General Fund expenditures and, 2) limiting net indebtedness to 5% of the City’s taxable assessed value.
Pension Funding - the City has committed to funding 100% of the annual required contribution (ARC) for both the City Employee Pension Trust Fund and Volunteer Firefighters Relief Fund.
Other Post-Employment Benefits - the City has committed to increase its contribution to the OPEB fund over six years at which time it will be funding 100% of the ARC.
Relevant Financial Policies
Fund Balance - the City included the use of $700,000 of General Fund unrestricted fund balance in the City’s 2011-12 adopted budget. No unrestricted fund balance was used in the 2012-13 adopted budget.
Awards and Acknowledgements
The Government Finance Officers Association of the United States and Canada (GFOA) awarded a Certificate of Achievement for Excellence in Financial Reporting to the City of Norwich, Connecticut, for its comprehensive annual financial report for the year ended June 30, 2011. This was the 19th consecutive year that the City has received this prestigious award. In order to be awarded a Certificate of Achievement, a governmental unit must publish an easily readable and efficiently organized comprehensive annual financial report. The CAFR must satisfy both accounting principles generally accepted in the United States of America and applicable legal requirements.

vii
A Certificate of Achievement is valid for a period of one year only. I believe that our current comprehensive annual financial report continues to conform to the Certificate of Achievement Program’s requirements and we are submitting it to the GFOA to determine its eligibility for another certificate.
For fiscal years beginning July 1, 2000 through 2012, the GFOA awarded the City a “Distinguished Budget Presentation Award” for its adopted budget. The budgets submitted had to satisfy four different criteria: the budget as a Policy Document, the budget as a Financial Plan, the budget as an Operations Guide and the budget as a Communications Device. The award earned by the City is the highest form of recognition in the area of budgeting.
For fiscal year ended June 30, 2005, the GFOA awarded the City for its first Popular Annual Financial Report (PAFR). The PAFR is intended to be a condensed and simplified presentation of the highlights of the CAFR. Upon receiving the PAFR award, Norwich became only the second Connecticut municipality to achieve all three GFOA awards.
The preparation of this report on a timely basis could not have been accomplished without the efficient and dedicated services of the entire Finance Department staff and members of other departments who assisted in its compilation. I would like to express my appreciation to all members of the City who assisted in its preparation. The combined support of you, the City Manager and the City Council, who remain committed to fiscal integrity and financial leadership, is also appreciated.
Respectfully submitted,
Joseph A. Ruffo, CPA Comptroller


City of NorwichOrganization Chart
VOTERS
Treasurer
City ClerkNorwich Public UtilitiesCommissioners
City Manager
Registrar Mayor & City Council
Assistant City Manager
Public Works-Streets & Parks
-Engineering-Solid Waste
-Building Maintenance-Fleet Maintenance
Operations
Recreation
Public Safety Development
Human Resources
Tax Assessor
Finance
Corporation Counsel
Board of Education
Planning-Zoning
-Site development-Wetlands
Police
Fire
Emergency Management
Inspections-Building-Housing
Administrative Services
Economic Development (under
direction of Mayor)
Recreation
Human Services-Adult Services-Job Readiness-Senior Center
-Youth & Family Services-Community Development
Finance-Purchasing-Accounting
-Tax Collection-Information Technology
City Historian
Boards, Commissions, Agencies and AuthoritiesSome are appointed by the City Council and some are appointed by the City Manager. Fora complete listing, please visit: http://www.norwichct.org/content/43/280/644/default.aspx

City of NorwichFinance DepartmentOrganization Chart
Comptroller
Deputy Comptroller
Accounting, Payroll & Control
PurchasingRevenue
Collection
Accountant Purchasing Agent
Tax Collector
2 Accounting Generalists
Collector of Delinquent
Taxes
2 Revenue Collection
Clerks
Information Technology
LAN Supervisor
LAN Technician
x

xi
DIRECTORY OF ELECTED CITY OFFICIALS AND NPU COMMISSIONERS CITY COUNCIL Term Length Term Expires Peter Nystrom, Mayor (R) 4 Years 12/3/13 Peter Desaulniers, President Pro Tempore (D) 2 Years 12/3/13 Mark Bettencourt (D) 2 Years 12/3/13 H. Tucker Braddock, Jr. (D) 2 Years 12/3/13 Deberey Hinchey (D) 2 Years 12/3/13 Charles A. Jaskiewicz III (D) 2 Years 12/3/13 Sofee Noblick (R) 2 Years 12/3/13 BOARD OF EDUCATION Term Length Term Expires Dr. Yvette C. Jacaruso, Chairperson (D) 2 Years 11/12/13 John P. LeVangie, Vice Chairperson (D) 2 Years 11/12/13 Cora Lee Boulware, Secretary (D) 2 Years 11/12/13 Keleigh Arian (D) 2 Years 11/12/13 Jesshua Ballaro-Pina (D) 2 Years 11/12/13 Aaron Daniels (R) 2 Years 11/12/13 Lynn Norris (R) 2 Years 11/12/13 Dennis Slopak (R) 2 Years 11/12/13 Joyce C. Werden (D) 2 Years 11/12/13 TREASURER Term Length Term Expires Brian Curtin (D) 2 Years 12/3/13 REGISTRAR OF VOTERS Term Length Term Expires Joann Merolla-Martin (D) 2 Years 1/9/13 Diane Slopak (R) 2 Years 1/9/13 APPOINTED NPU COMMISSIONERS Term Length Term Expires James M. Sullivan, Chair (D) 5 Years 3/01/14 Diana Boisclair, Vice Chair (R) 5 Years 3/01/15 Alan M. Remondi, Secretary (D) 5 Years 2/28/16 Larry Goldman (D) 5 Years 3/01/17 Robert Groner, (D)** 5 Years 3/01/13
** Robert Groner was appointed by the Norwich City Council on May 7, 2012 to fill the vacancy on the Board of Public Utilities Commissioners and Sewer Authority created when Frank Demicco left.
xii
CITY OF NORWICH 100 BROADWAY
NORWICH, CT 06360-4431 PHONE: (860) 823-3700
FAX: (860) 823-3790 WEBSITE: www.norwichct.org
DIRECTORY OF CITY ADMINISTRATIVE
OFFICIALS
Title Name Phone City Manager Alan H. Bergren 860-823-3750 Assessor Donna Ralston 860-823-3722 Building Inspector James Troeger 860-823-3775 City Clerk Betsy Barrett 860-823-3734 Comptroller Joseph A. Ruffo 860-823-3730 Deputy Comptroller Joshua A. Pothier 860-823-3720 Corporation Counsel Michael E. Driscoll 860-889-3321 Emergency Management Director Gene M. Arters 860-887-1018 Engineer Patrick McLaughlin 860-823-3798 Fire Chief, Norwich (CCD) Ken Scandariato 860-892-6080 Fire Chief, East Great Plain VFD Patrick Daley 860-886-0392 Fire Chief, Laurel Hill VFD Aaron Westervelt 860-892-1973 Fire Chief, Occum VFD Robert Patton 860-822-8285 Fire Chief, Taftville VFD Timothy Jencks 860-887-6676 Fire Chief, Yantic VFD Frank Blanchard 860-887-2221 Health Director Patrick McCormack, MPH 860-823-1189 Housing Authority Director Charles Whitty 860-887-1605 Human Resources Director Brigid Marks 860-823-3786 Human Services Director Beverly Goulet 860-823-3778 LAN Supervisor Leon Barnowski 860-859-4404 Parking Administrator Judy Rizzuto 860-889-5586 Planning & Development Director Peter Davis 860-823-3766 Police Chief Louis J. Fusaro 860-886-5561 Public Utilities Manager John Bilda 860-887-2555 Public Works Director Barry Ellison 860-823-3789 Purchasing Agent William R. Block 860-823-3706 Recreation Director C. Roger Moss 860-823-3791 Senior Center Director Michael Wolak 860-889-5960 Superintendent of Schools Abby I. Dolliver 860-823-6284 Tax Collector Kathy Daley 860-823-3760 Zoning Enforcement Officer Tianne Curtis 860-823-3752

Financial Section

29 South Main StreetP.O. Box 272000West Hartford, CT 06127-2000
Tel 860.561.4000Fax 860.521.9241blumshapiro.com
2 Enterprise DriveP.O. Box 2488Shelton, CT 06484-1488
Tel 203.944.2100Fax 203.944.2111blumshapiro.com
An Independent Member of Baker Tilly International
1
Independent Auditors’ Report
To the Honorable Mayor and Members of the City Council City of Norwich, Connecticut We have audited the accompanying financial statements of the governmental activities, the business-type activities, each major fund and the aggregate remaining fund information of the City of Norwich, Connecticut, as of and for the year ended June 30, 2012, which collectively comprise the City of Norwich, Connecticut’s basic financial statements as listed in the table of contents. These financial statements are the responsibility of the City of Norwich, Connecticut’s management. Our responsibility is to express opinions on these financial statements based on our audit. We conducted our audit in accordance with auditing standards generally accepted in the United States of America and the standards applicable to financial audits contained in Government Auditing Standards issued by the Comptroller General of the United States. Those standards require that we plan and perform the audit to obtain reasonable assurance about whether the financial statements are free of material misstatement. An audit includes consideration of internal control over financial reporting as a basis for designing audit procedures that are appropriate in the circumstances, but not for the purpose of expressing an opinion on the effectiveness of the City of Norwich, Connecticut’s internal control over financial reporting. Accordingly, we express no such opinion. An audit also includes examining, on a test basis, evidence supporting the amounts and disclosures in the financial statements, assessing the accounting principles used and the significant estimates made by management, as well as evaluating the overall financial statement presentation. We believe that our audit provides a reasonable basis for our opinions. In our opinion, the financial statements referred to above present fairly, in all material respects, the respective financial position of the governmental activities, the business-type activities, each major fund and the aggregate remaining fund information of the City of Norwich, Connecticut, as of June 30, 2012 and the respective changes in financial position and, where applicable, cash flows thereof, for the year then ended, in conformity with accounting principles generally accepted in the United States of America.
2
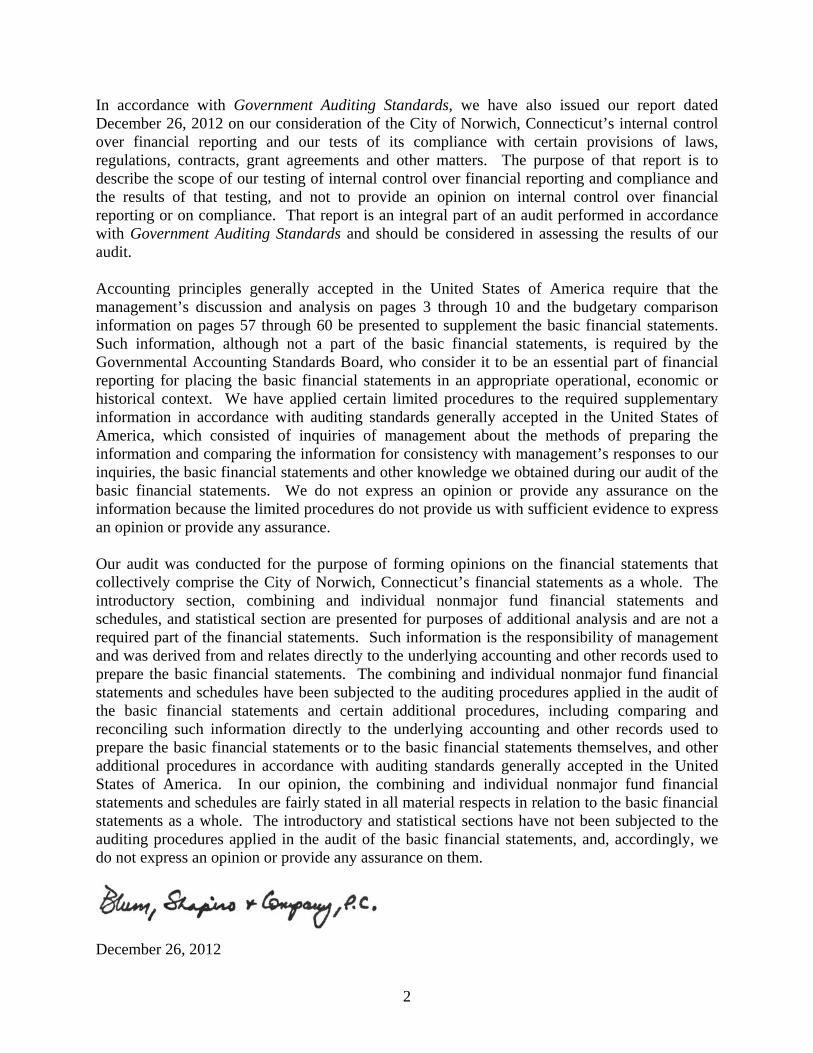
In accordance with Government Auditing Standards, we have also issued our report dated December 26, 2012 on our consideration of the City of Norwich, Connecticut’s internal control over financial reporting and our tests of its compliance with certain provisions of laws, regulations, contracts, grant agreements and other matters. The purpose of that report is to describe the scope of our testing of internal control over financial reporting and compliance and the results of that testing, and not to provide an opinion on internal control over financial reporting or on compliance. That report is an integral part of an audit performed in accordance with Government Auditing Standards and should be considered in assessing the results of our audit. Accounting principles generally accepted in the United States of America require that the management’s discussion and analysis on pages 3 through 10 and the budgetary comparison information on pages 57 through 60 be presented to supplement the basic financial statements. Such information, although not a part of the basic financial statements, is required by the Governmental Accounting Standards Board, who consider it to be an essential part of financial reporting for placing the basic financial statements in an appropriate operational, economic or historical context. We have applied certain limited procedures to the required supplementary information in accordance with auditing standards generally accepted in the United States of America, which consisted of inquiries of management about the methods of preparing the information and comparing the information for consistency with management’s responses to our inquiries, the basic financial statements and other knowledge we obtained during our audit of the basic financial statements. We do not express an opinion or provide any assurance on the information because the limited procedures do not provide us with sufficient evidence to express an opinion or provide any assurance. Our audit was conducted for the purpose of forming opinions on the financial statements that collectively comprise the City of Norwich, Connecticut’s financial statements as a whole. The introductory section, combining and individual nonmajor fund financial statements and schedules, and statistical section are presented for purposes of additional analysis and are not a required part of the financial statements. Such information is the responsibility of management and was derived from and relates directly to the underlying accounting and other records used to prepare the basic financial statements. The combining and individual nonmajor fund financial statements and schedules have been subjected to the auditing procedures applied in the audit of the basic financial statements and certain additional procedures, including comparing and reconciling such information directly to the underlying accounting and other records used to prepare the basic financial statements or to the basic financial statements themselves, and other additional procedures in accordance with auditing standards generally accepted in the United States of America. In our opinion, the combining and individual nonmajor fund financial statements and schedules are fairly stated in all material respects in relation to the basic financial statements as a whole. The introductory and statistical sections have not been subjected to the auditing procedures applied in the audit of the basic financial statements, and, accordingly, we do not express an opinion or provide any assurance on them. December 26, 2012

3
CITY OF NORWICH, CONNECTICUT
MANAGEMENT’S DISCUSSION AND ANALYSIS
JUNE 30, 2012 This discussion and analysis of the City of Norwich, Connecticut’s (the City) financial performance is offered by management to provide an overview of the City’s financial activities for the fiscal year ended June 30, 2012. Please read this MD&A in conjunction with the transmittal letter and the City’s financial statements, Exhibits I to IX. FINANCIAL HIGHLIGHTS
On a government-wide basis, the assets of the City exceeded its liabilities, resulting in total net assets at the close of the fiscal year of $238.0 million. Total net assets for governmental activities at fiscal year-end were $107.9 million, and total net assets for business-type activities were $130.1 million. Total unrestricted net assets at June 30, 2012 were $36.6 million.
On a government-wide basis, during the year, the City’s net assets increased by $19.1 million from $218.9 million to $238.0 million. Governmental activities net assets increased by $27.2 million, and net assets increased by $3.8 million for business-type activities. Governmental activities expenses were $136.4 million, while total revenues including transfers were $145.2 million.
At the close of the year, the City’s governmental funds reported, on a current financial resource basis, combined ending fund balances of $16.7 million, an increase of $5.7 million from the prior fiscal year. Of the total fund balance as of June 30, 2012, $12.0 million represents the combined unrestricted fund balance in the General Fund, Special Revenue Funds and Capital Projects Funds.
At the end of the current fiscal year, the total fund balance for the General Fund was $10.6 million, a decrease of $0.2 million from the prior fiscal year. As of June 30, 2012, $10.6 million of the total fund balance is unrestricted representing 9.74% of total General Fund actual expenditures and operating transfers on a budgetary basis.
The City’s governmental activities total bonded debt increased by $5.9 million during the current fiscal year.
OVERVIEW OF THE FINANCIAL STATEMENTS This annual report consists of a series of financial statements. The statement of net assets and the statement of activities (Exhibits I and II, respectively) provide information about the activities of the City as a whole and present a longer-term view of the City’s finances. Fund financial statements are presented in Exhibits III to IX. For governmental activities, these statements tell how these services were financed in the short term as well as what remains for future spending. Fund financial statements also report the City’s operations in more detail than the government-wide statements by providing information about the City’s most significant funds. The remaining statements provide financial information about activities for which the City acts solely as a trustee or agent for the benefit of those outside of the government. Government-Wide Financial Statements The analysis of the City as a whole begins with Exhibits I and II. The statement of net assets and the statement of activities report information about the City as a whole and about its activities for the current period. These statements include all assets and liabilities using the accrual basis of accounting, which is similar to the accounting used by most private-sector companies. All of the current year’s revenues and expenses are taken into account regardless of when cash is received or paid.

4
These two statements report the City’s net assets and changes in them. The City’s net assets, the difference between assets and liabilities, is one way to measure the City’s financial health, or financial position. Over time, increases or decreases in the City’s net assets are one indicator of whether its financial health is improving or deteriorating. The reader needs to consider other nonfinancial factors, however, such as changes in the City’s property tax base and the condition of the City’s capital assets, to assess the overall health of the City. In the statement of net assets and the statement of activities, the City is divided into two types of activities:
Governmental Activities - Most of the City’s basic services are reported here, including education, public safety, sanitation, social services, public works and general administration. Property taxes, charges for services and state and federal grants finance most of these activities.
Business-Type Activities - The City charges a fee to customers to help it cover all or most of the cost of
certain services it provides. The City’s Department of Public Utilities, Golf Course Authority, Stadium Authority and Ice Rink Authority are reported here.
Fund Financial Statements The fund financial statements begin with Exhibit III and provide detailed information about the most significant funds - not the City as a whole. Some funds are required to be established by Charter. However, the City establishes many other funds to help control and manage financial activities for particular purposes (like the capital projects funds) or to show that it is meeting legal responsibilities for using grants and other money (like grants received from the State of Connecticut’s Department of Education). The City’s funds are divided into three categories: governmental, proprietary and fiduciary.
Governmental Funds (Exhibits III and IV) - Most of the City’s basic services are reported in governmental funds, which focus on how money flows into and out of those funds and the balances left at year end that are available for spending. These funds are reported using an accounting method called modified accrual accounting, which measures cash and all other financial assets that can readily be converted to cash. The governmental fund statements provide a detailed short-term view of the City’s general government operations and the basic services it provides. Governmental fund information helps you determine whether there are more or fewer financial resources that can be spent in the near future to finance the City’s programs. The relationship (or differences) between governmental activities (reported in the statement of net assets and the statement of activities) and governmental funds is described in a reconciliation included with the fund financial statements.
Proprietary Funds (Exhibits V, VI and VII) - When the City charges customers for the services it
provides, whether to outside customers or to other units of the City, these services are generally reported in proprietary funds. Proprietary funds are reported in the same way that all activities are reported in the statement of net assets and the statement of activities. In fact, the City’s enterprise funds (a component of proprietary funds) are the same as the business-type activities reported in the government-wide statements, but provide more detail and additional information, such as cash flows, for proprietary funds.
Fiduciary Funds (Exhibits VIII and IX) - The City is the trustee, or fiduciary, for its employees’ pension
and other benefit plans. It is also responsible for other assets that, because of a trust arrangement, can be used only for the trust beneficiaries. All of the City’s fiduciary activities are reported in separate statements of fiduciary net assets and changes in fiduciary net assets. These activities are excluded from the City’s other financial statements because the City cannot use these assets to finance its operations. The City is responsible for ensuring that the assets reported in these funds are used for their intended purposes.

5
GOVERNMENT-WIDE FINANCIAL ANALYSIS The City’s combined net assets increased from a year ago from $218.9 million to $238.0 million. The analysis below focuses on the net assets (Table 1) and changes in net assets (Table 2) of the City’s governmental and business-type activities.
Table 1 NET ASSETS (In Thousands)
Governmental Business-TypeActivities Activities Total
2012 2011 2012 2011 2012 2011
Current and other assets $ 44,944 $ 47,599 $ 35,940 $ 34,043 $ 80,884 $ 81,642 Capital assets 129,710 119,045 120,243 107,529 249,953 226,574 Total assets 174,654 166,644 156,183 141,572 330,837 308,216
Long-term debt outstanding 55,289 48,634 16,288 11,621 71,577 60,255 Unearned revenue 1,621 7,542 509 534 2,130 8,076 Other liabilities 9,883 11,376 9,289 9,628 19,172 21,004 Total liabilities 66,793 67,552 26,086 21,783 92,879 89,335
Net Assets: Invested in capital assets, net of debt 92,031 87,252 107,495 99,326 199,526 186,578 Restricted 1,457 1,544 361 334 1,818 1,878 Unrestricted 14,373 10,296 22,241 20,129 36,614 30,425
Total Net Assets $ 107,861 $ 99,092 $ 130,097 $ 119,789 $ 237,958 $ 218,881
Net assets of the City’s governmental activities increased by $8.8 million ($107.9 million compared to $99.1 million). Unrestricted net assets - the part of net assets that can be used to finance day-to-day operations without constraints established by debt covenants, enabling legislation or other legal requirements - changed from $10.3 million at June 30, 2011 to $14.4 million at the end of this year. The net assets of business-type activities increased by 8.6% ($130.1 million compared to $119.8 million) during 2012.

6
Table 2 CHANGES IN NET ASSETS
(In Thousands)
Governmental Business-TypeActivities Activities Total
2012 2011 2012 2011 2012 2011Revenues: Program revenues: Charges for services $ 5,377 $ 5,756 $ 89,107 $ 90,625 $ 94,484 $ 96,381 Operating grants and contributions 53,139 54,051 53,139 54,051 Capital grants and contributions 10,749 22,962 6,798 6,704 17,547 29,666 General revenues: Property taxes 63,198 61,307 63,198 61,307 Grants and contributions not restricted to specific purposes 4,315 4,391 4,315 4,391 Unrestricted investment earnings 51 283 11 14 62 297 Other general revenues 890 1,414 890 1,414 Total revenues 137,719 150,164 95,916 97,343 233,635 247,507
Program expenses: General government 10,300 10,760 10,300 10,760 Public safety 20,571 20,336 20,571 20,336 Social services 4,201 4,664 4,201 4,664 Public works 13,444 9,133 13,444 9,133 Education 86,764 84,263 86,764 84,263 Interest on long-term debt 1,109 2,008 1,109 2,008 Department of Public Utilities 75,620 80,977 75,620 80,977 Other enterprise funds 2,495 2,425 2,495 2,425 Total program expenses 136,389 131,164 78,115 83,402 214,504 214,566
Excess before transfers 1,330 19,000 17,801 13,941 19,131 32,941 Transfers 7,439 8,277 (7,493) (8,277) (54) -
Increase in Net Assets $ 8,769 $ 27,277 $ 10,308 $ 5,664 $ 19,077 $ 32,941
The City’s total revenues were $233.6 million. The total cost of all programs and services was $214.5 million. Our analysis below separately considers the operations of governmental and business-type activities. Governmental Activities Governmental activities increased the City’s assets by $8.8 million during the year compared with an increase of $27.2 million last year. Total revenues of $137.7 million and $7.4 million in transfers from the City’s business-type activities provided funding for the City’s $136.4 million of governmental program expenses incurred during the year. The City’s revenues decreased $12.4 million ($137.7 million compared to $150.2 million). Included in this year’s total revenue was the recognition of capital grants for the Kelly Middle School renovation project and Intermodal Transportation Center of $3.1 million and $6.8 million, respectively, compared with $14.1 million and $8.4 million, respectively, in 2011. Total program expenses were $136.4 million as compared with $131.2 million reported last year. The expenses of the Education and Public Works functions experienced increased primarily attributable to increased pension, OPEB and health insurance.

7
Property tax revenues increased $1.9 million. Changes in program expenses are mostly tied to increases in budgeted actual expenditures in the City’s General Fund for the cost of current services during 2012 compared with 2011. Table 3 presents the cost of each of the City’s five largest programs - general government, public safety, social services, public works and education - as well as each program’s net cost (total cost less revenues generated by the activities). The net cost shows the financial burden that was placed on the City’s taxpayers by each of these functions.
Table 3 GOVERNMENTAL ACTIVITIES
(In Thousands)
Total Cost of Services Net Cost of Services2012 2011 2012 2011
General government $ 10,300 $ 10,760 $ 899 $ 353 Public safety 20,571 20,336 19,881 19,079 Social services 4,201 4,664 1,383 1,688 Public works 13,444 9,133 11,707 7,166 Education 86,764 84,263 32,145 18,101 All others 1,109 2,008 1,109 2,008
Totals $ 136,389 $ 131,164 $ 67,124 $ 48,395
Business-Type Activities Revenues of the City’s business-type activities (see Table 2) decreased by $1.4 million during the year ($95.9 million in 2012 compared to $97.3 million in 2011) and expenses decreased by $5.3 million. Overall net assets increased $10.3 million in 2012 compared with an increase of $5.7 million in 2011. The primary cause of the change in net assets for business-type activities was the capital grants for sewer plant improvements, sewer line extensions, and smart electric meters. Because of these grants, the assets of the Department of Public Utilities Sewer Division increased $10.7 million. CITY FUNDS FINANCIAL ANALYSIS Governmental Funds As the City completed the year, its governmental funds (as presented in the balance sheet - Exhibit III) reported a combined fund balance of $16.6 million, which is an increase of $5.7 million from last year’s total of $10.9 million. Included in this year’s total change in fund balance is a decrease of $0.2 million in the City’s General Fund. The primary reasons for the General Fund’s increase mirror the general fund activities analysis highlighted in RSI-1 and RSI-2. The Bond Expenditure Fund reported a fund deficit of $2.7 million at June 30, 2012. The fund balance increased by $4.3 million during the year. The City will issue bonds during 2013 to replenish the fund. The Intermodal Transportation Center Fund reported a fund balance of $707 at June 30, 2012. The fund balance increased by $707 thousand during the year. The School Projects Fund reported a deficit fund balance of $808 at June 30, 2012.

8
The other governmental funds have a total fund balance of $7.2 million - roughly the same balance as last year. Proprietary Funds Net assets of the proprietary funds consisting of the Department of Public Utilities were $120.2 million, as compared to $109.5 million in the prior year, and City’s other nonmajor enterprise funds net assets decreased $390 thousand to $9.9 million from $10.3 million. Unrestricted net assets of the Department of Public Utilities was $22.1 million, and $121 thousand for the other nonmajor enterprise funds. The Department of Public Utilities had operating revenues of $87.1 million from user fees, and other enterprise funds had $2.1 million. The total increase in net assets for the fiscal year ended June 30, 2012 was $10.3 million. General Fund Budgetary Highlights While there were some interdepartmental budget transfers, the General Fund did not have any supplemental appropriations during 2012. During the year, actual revenues and other financing sources on a budgetary basis were $108.9 million, which was $265 thousand higher than budgetary estimates. The variance was caused primarily by greater than anticipated State of Connecticut Special Education Excess Cost and PILOT grants (See RSI-1 for additional detail). Actual expenditures on a budgetary basis and other financing uses totaled $109.2 million, which were higher than actual revenues and other financing sources on a budgetary basis by $278 thousand. Actual expenditures on a budgetary basis were $157 thousand less than budgeted. Lower than budgeted expenditures were experienced in the General Government, Public Safety, Public Works, and Social Services as a result of a concerted effort to contain spending. CAPITAL ASSET AND DEBT ADMINISTRATION Capital Assets At June 30, 2012, the City had $250.0 million invested in a broad range of capital assets, including land, building and system improvements, machinery and equipment, park facilities, roads, sewers and bridges - Table 4. This amount represents a net increase (including additions, deductions and depreciation) of $23.4 million, or 10.3%, over last year.
Table 4 CAPITAL ASSETS AT YEAR-END (Net of Depreciation)
(In Thousands)
Governmental Business-TypeActivities Activities Total
2012 2011 2012 2011 2012 2011
Land $ 24,244 $ 23,124 $ 2,922 $ 2,922 $ 27,166 $ 26,046 Buildings and improvements 17,812 18,977 34,193 35,157 52,005 54,134 Vehicles, machinery, equipment, pumping and distributions systems 6,596 6,912 61,220 56,983 67,816 63,895 Technology upgrade and road infrastructure 18,767 18,629 18,767 18,629 Construction in progress 62,291 51,403 21,908 12,467 84,199 63,870
Totals $ 129,710 $ 119,045 $ 120,243 $ 107,529 $ 249,953 $ 226,574

9
This year’s major capital asset additions included the following (in thousands):
Intermodal Transportation Center $ 6,650 Wastewater Treatment Plant 5,571 Kelly Middle School Renovation 3,580 SmartGrid 2,016 Road Overlays 1,997 Newton Street Area Sewers 1,066 Utilities Phone & IVR System 544 Total $ 21,424
The City’s fiscal-year 2012-3 capital budget calls for spending $2.4 million for road overlays, public works vehicles, police vehicles, fire equipment and other projects. More detailed information about the City’s capital assets is presented in Note 6 to the financial statements. Long-Term Debt At June 30, 2012, the City had total bonds and notes outstanding of $48.1 million. All of this debt is backed by the full faith and credit of the City. The City’s outstanding net debt increased by $10.6 million during fiscal 2012.
Table 5 OUTSTANDING DEBT, AT YEAR-END
(In Thousands)
Governmental Business-TypeActivities Activities Total
2012 2011 2012 2011 2012 2011
General obligation bonds $ 36,935 $ 30,989 $ 394 $ 458 $ 37,329 $ 31,447 Serial notes payable 10,768 6,029 10,768 6,029
Total $ 36,935 $ 30,989 $ 11,162 $ 6,487 $ 48,097 $ 37,476
In November 2009, Standard & Poor’s affirmed its AA- ratings with a stable outlook. On September 22, 2011, Fitch Ratings affirmed its AA rating with a stable outlook. On January 20, 2012, Moody’s assigned an Aa2 rating to Norwich’s 2012 $2.7 million General Obligation refunding bond issue and affirmed its Aa2 rating on the Norwich’s debt outstanding as of that date. State statutes limit the amount of general obligation debt a governmental entity may issue to up to seven times its annual receipts from taxation. The current debt limitation for the City of Norwich is $443 million. The City’s outstanding general obligation debt is at 12.07% of this limitation. Other obligations include accrued vacation pay and sick leave. More detailed information about the City’s long-term liabilities is presented in Note 7 to the financial statements.

10
ECONOMIC FACTORS AND NEXT YEAR’S BUDGETS AND RATES As of June 2012, the unemployment rate for the Norwich Labor Market Area was 9.2%, down from 10.1% in the prior year. Connecticut’s overall unemployment rate stood at 8.4%, compared with 9.0% for the same time last year. The State of Connecticut’s education and non-education formula grants have not kept pace with inflation. This, coupled with increased employee benefit costs, creates a challenge for Norwich. The City, however, is poised to overcome such challenges with its commitments to economic development, cost reduction and funding its long-term liabilities. The effects of these efforts are exemplified in the initiatives noted in the transmittal letter. The fiscal year 2013 General Fund budget calls for $114.7 million in revenues and expenditures, an approximate 4.9% increase in expenditures over fiscal year 2012. On the revenue side, the fiscal year 2012 budgeted tax levy increased 8.9% and the mill rate increased 1.78 mills from 24.76 to 26.54, a 7.19% increase. The City has increased its community policing program, which accounts for a large portion of the increase. In the City’s business-type activities, the Norwich Public Utilities projects an 0.23% increase in revenues from fiscal year 2012 from $91.7 million to $91.9 million. This increase is largely due to increasing water and sewer rates offsetting decreases in gas and electric rates. Norwich Public Utilities budgeted $10.0 million in capital improvements to bolster its infrastructure and operational efficiency. CONTACTING THE CITY’S FINANCIAL MANAGEMENT This financial report is designed to provide citizens, taxpayers, customers, investors and creditors with a general overview of the City’s finances and to show the City’s accountability for the money it receives. If you have questions about this report or need additional financial information, contact the Office of the Comptroller, 100 Broadway, Norwich, Connecticut 06360-4431.

Basic Financial Statements

EXHIBIT ICITY OF NORWICH, CONNECTICUT
STATEMENT OF NET ASSETS
JUNE 30, 2012(In Thousands)
Governmental Business-Type Activities Activities Total
Assets:Cash and cash equivalents $ 19,080 $ 16,928 $ 36,008Investments 3,272 3,272Receivables, net 22,619 15,546 38,165Internal balances (363) 363 - Inventories 1,722 1,722Other assets 336 1,381 1,717Capital assets:
Assets not being depreciated 86,535 24,830 111,365Assets being depreciated, net 43,175 95,413 138,588
Total assets 174,654 156,183 330,837
Liabilities:Accounts and other payables 8,424 9,289 17,713Due to Fiduciary Funds 1,459 1,459Unearned revenue 1,621 509 2,130Noncurrent liabilities:
Due within one year 7,260 6,651 13,911Due in more than one year 48,029 9,637 57,666
Total liabilities 66,793 26,086 92,879
Net Assets:Invested in capital assets, net of related debt 92,031 107,495 199,526Restricted for trust purposes:
Expendable 42 42Permanent 1,415 1,415
Restricted for energy conservation 361 361Unrestricted 14,373 22,241 36,614
Total Net Assets $ 107,861 $ 130,097 $ 237,958
The accompanying notes are an integral part of the financial statements
11

EXHIBIT IICITY OF NORWICH, CONNECTICUT
STATEMENT OF ACTIVITIES
FOR THE YEAR ENDED JUNE 30, 2012(In Thousands)
Operating Capital Changes in Net AssetsCharges for Grants and Grants and Governmental Business-Type
Expenses Services Contributions Contributions Activities Activities Total
Governmental activities: General government $ 10,300 $ 1,866 $ 201 $ 7,334 $ (899) $ $ (899) Public safety 20,571 458 232 (19,881) (19,881) Social services 4,201 574 2,244 (1,383) (1,383) Public works 13,444 771 715 251 (11,707) (11,707) Education 86,764 1,708 49,747 3,164 (32,145) (32,145) Interest on long-term debt 1,109 (1,109) (1,109)
Total governmental activities 136,389 5,377 53,139 10,749 (67,124) - (67,124)
Business-type activities: Department of Public Utilities:
Gas 11,851 13,370 1,861 3,380 3,380Electric 51,299 60,151 2,046 10,898 10,898Water 6,546 6,656 184 294 294Sewer 5,924 6,876 2,653 3,605 3,605
Nonmajor Enterprise Funds: Golf Course Authority 1,222 1,236 14 14Stadium Authority 326 152 (174) (174) Ice Rink Authority 947 666 54 (227) (227)
Total business-type activities 78,115 89,107 - 6,798 - 17,790 17,790
Total $ 214,504 $ 94,484 $ 53,139 $ 17,547 (67,124) 17,790 (49,334)
General revenues: Property taxes 63,198 63,198Grants and contributions not restricted to specific programs 4,315 4,315Unrestricted investment earnings 51 11 62Miscellaneous 890 890
Total general revenues 68,454 11 68,465
Transfers 7,439 (7,493) (54)
Change in Net Assets 8,769 10,308 19,077
Net Assets at Beginning of Year, as Restated 99,092 119,789 218,881
Net Assets at End of Year $ 107,861 $ 130,097 $ 237,958
Net Revenue (Expense) and
12
The accompanying notes are an integral part of the financial statements

EXHIBIT III
Intermodal Nonmajor TotalBond Transportation School Governmental Governmental
General Expenditure Center Projects Funds Funds
ASSETS
Cash and cash equivalents $ 18,368 $ $ $ $ 712 $ 19,080Investments 1,952 1,320 3,272Receivables, net 8,991 3,505 5,270 4,853 22,619Due from other funds 9,199 5,806 15,005Other assets 56 56
Total Assets $ 38,510 $ - $ 3,505 $ 5,270 $ 12,747 $ 60,032
LIABILITIES AND FUND BALANCES
Liabilities:Accounts and other payables $ 5,275 $ 394 $ 502 $ 625 $ 1,422 $ 8,218Due to other funds 14,835 2,338 2,234 3,837 525 23,769Deferred revenue 7,765 62 3,568 11,395
Total liabilities 27,875 2,732 2,798 4,462 5,515 43,382
Fund balances:Nonspendable 1,443 1,443Restricted 707 808 1,664 3,179Committed 4,271 4,271A i d 264 264
CITY OF NORWICH, CONNECTICUT
BALANCE SHEET - GOVERNMENTAL FUNDS
JUNE 30, 2012(In Thousands)
(Continued on next page)
13
Assigned 264 264Unassigned 10,371 (2,732) (146) 7,493
Total fund balances 10,635 (2,732) 707 808 7,232 16,650
Total Liabilities and Fund Balances $ 38,510 $ - $ 3,505 $ 5,270 $ 12,747 $ 60,032

EXHIBIT III
(In Thousands)
Reconciliation of the Balance Sheet - Governmental Funds to the Statement of Net Assets:
Amounts reported for governmental activities in the statement of net assets (Exhibit I) are different because of the following:
Fund balances - total governmental funds $ 16,650
Capital assets used in governmental activities are not financial resources and, therefore, are not reported in the funds:
Governmental capital assets $ 186,764Less accumulated depreciation (57,054) Net capital assets 129,710
Other long-term assets are not available to pay for current-period expenditures and, therefore, are not recorded in the funds:
Property tax receivables greater than 60 days 3,334Interest receivable on property taxes 1,092Housing rehabilitation loans 1,925Receivable from the state for school construction projects 198Accounts and other receivables 3,225Net pension asset 206Deferred bond issuance costs 74
Internal service funds are used by management to charge the costs of risk management to individual funds. The assets and liabilities of the internal service funds are reported with governmental activities in the statement of net assets. (1,112)
Long-term liabilities, including bonds payable, are not due and payable in the current period and, therefore, are not reported in the funds:
Bonds and notes payable (36,996) Deferred charges on refunding 256Unamortized bond premium (195) Interest payable on bonds and notes (202) Compensated absences (3,330) Landfill closure (1,647) Capital lease (744) Net pension obligation (93) Net OPEB obligation (4,490)
Net Assets of Governmental Activities (Exhibit I) $ 107,861
CITY OF NORWICH, CONNECTICUT
BALANCE SHEET - GOVERNMENTAL FUNDS (CONTINUED)
JUNE 30, 2012
The accompanying notes are an integral part of the financial statements
14

EXHIBIT IVCITY OF NORWICH, CONNECTICUT
STATEMENT OF REVENUES, EXPENDITURES AND CHANGES IN FUND BALANCES - GOVERNMENTAL FUNDS
FOR THE YEAR ENDED JUNE 30, 2012
Intermodal Nonmajor TotalBond Transportation School Governmental Governmental
General Expenditure Center Projects Funds FundsRevenues:
Property taxes, interest and liens $ 59,244 $ $ $ $ 4,042 $ 63,286Intergovernmental revenues 42,703 7,334 3,360 14,740 68,137Charges for services 2,012 2,709 4,721Licenses, permits and fees 495 495Investment income 7 43 50Other 1,135 465 1,600
Total revenues 105,596 - 7,334 3,360 21,999 138,289
Expenditures: Current:
General government 4,493 515 5,008Public safety 13,278 6,407 19,685Social services 1,858 2,267 4,125Public works 8,955 1,232 10,187Education 72,021 12,046 84,067Other 4,795 4,795
Capital outlay 4,153 6,651 3,752 2,398 16,954Debt service 4,908 82 4,990
Total expenditures 110,308 4,235 6,651 3,752 24,865 149,811
Excess (Deficiency) of Revenues over Expenditures (4,712) (4,235) 683 (392) (2,866) (11,522)
Other Financing Sources (Uses): Transfers in 7,222 24 1,200 3,255 11,701Transfers out (2,702) (1,222) (338) (4,262) Issuance of general obligation bonds 9,680 9,680Issuance of refunding bonds 2,725 2,725Payment to refunded escrow agent (2,760) (2,760) Bond premium 181 181
Total other financing sources 4,520 8,604 24 1,200 2,917 17,265
Net Change in Fund Balances (192) 4,369 707 808 51 5,743
Fund Balances at Beginning of Year 10,827 (7,101) - - 7,181 10,907
Fund Balances at End of Year $ 10,635 $ (2,732) $ 707 $ 808 $ 7,232 $ 16,650
(In Thousands)
(Continued on next page)
15

EXHIBIT IV CITY OF NORWICH, CONNECTICUT
STATEMENT OF REVENUES, EXPENDITURES AND CHANGES INFUND BALANCES - GOVERNMENTAL FUNDS (CONTINUED)
FOR THE YEAR ENDED JUNE 30, 2012(In Thousands)
Reconciliation of the Statement of Revenues, Expenditures and Changes in Fund Balances of Governmental Funds to the Statement of Activities:
Amounts reported for governmental activities in the statement of activities (Exhibit II) are different because:
Net change in fund balances - total governmental funds (Exhibit IV) $ 5,743 Governmental funds report capital outlays as expenditures. In the statement of activities, the cost of those assets is allocated over their estimated useful lives and reported as depreciation expense:
Capital outlay 14,647Depreciation expense (3,894)
In the statement of activities, only the gain on the sale of capital assets is reported. However, in the governmental funds, the proceeds from the sale increase financial resources. Thus the change in net assets differs from the change in fund balance by the cost of the assets sold. (88)
Revenues in the statement of activities that do not provide current financial resources are not reported as revenues in the funds, and revenues recognized in the funds are not reported in the statement of activities:
Property tax receivable - accrual basis change (58) Property tax interest and lien revenue - accrual basis change (30) School building grant receipts (102) Housing loan repayments 159Accounts and other receivables - accrual basis change (389) Net pension asset (307)
The issuance of long-term debt (e.g., bonds, leases) provides current financial resources to governmental funds, while the repayment of the principal of long-term debt consumes the current financial resources of governmental funds. Neither transaction has any effect on net assets. Also, governmental funds report the effect of issuance costs, premiums, discounts and similar items when debt is first issued, whereas these amounts are amortized and deferred in the statement of activities. The details of these differences in the treatment of long-term debt and related items are as follows:
Issuance of bonds (9,680) Premium on bonds (64) Bond principal payments 3,915Issuance of refunding bonds 2,725Payment to refunded escrow agent (2,760) Premium on refunded bonds 117Issuance costs on refunding (82) Amortization of deferred charge on refunding (84) Amortization of premiums 49Amortization of deferred bond issuance costs (8) Capital lease issuancesCapital lease payments 60
Some expenses reported in the statement of activities do not require the use of current financial resources and, therefore, are not reported as expenditures in the governmental funds:
Compensated absences 94Accrued interest (73) Net pension expense 27Net OPEB expense (60) Landfill postclosure care 106
Internal service funds are used by management to charge costs to individual funds. The net revenue of certain activities of internal services funds is reported with governmental activities. (1,194)
Change in Net Assets of Governmental Activities (Exhibit II) $ 8,769
The accompanying notes are an integral part of the financial statements
16

EXHIBIT VCITY OF NORWICH, CONNECTICUT
STATEMENT OF NET ASSETS - PROPRIETARY FUNDS
JUNE 30, 2012(In Thousands)
GovernmentalActivities
Department Nonmajor Internalof Public Enterprise ServiceUtilities Funds Total Funds
Assets: Current assets:
Cash and cash equivalents $ 16,923 $ 5 $ 16,928 $Receivables, net:
User charges 14,893 33 14,926Other 620 620
Due from other funds 628 628 6,942Inventories 1,663 59 1,722Other assets 1,381 1,381 Total current assets 35,480 725 36,205 6,942
Capital assets, net 110,197 10,046 120,243
Total assets 145,677 10,771 156,448 6,942
Liabilities: Current liabilities:
Accounts payable and accrued liabilities 8,181 148 8,329 4Due to other funds 265 265Unearned revenue 318 191 509Notes payable - current 5,825 5,825Bonds payable - current 41 25 66Capital leases payable - current 312 312Compensated absences - current 286 286Risk management claims - current 162 162 1,823
Total current liabilities 15,125 629 15,754 1,827
Noncurrent liabilities: Customer deposits 960 960Notes payable 4,943 4,943Bonds payable 113 215 328Capital leases payable 1,308 1,308Compensated absences 2,570 2,570Risk management claims 488 488 6,227
Total noncurrent liabilities 10,382 215 10,597 6,227
Total liabilities 25,507 844 26,351 8,054
Net Assets: Invested in capital assets, net of related debt 97,689 9,806 107,495Restricted for energy conservation 361 361Unrestricted 22,120 121 22,241 (1,112)
Total Net Assets $ 120,170 $ 9,927 $ 130,097 $ (1,112)
Business-Type Activities
The accompanying notes are an integral part of the financial statements
17

EXHIBIT VICITY OF NORWICH, CONNECTICUT
STATEMENT OF REVENUES, EXPENSES AND CHANGESIN FUND NET ASSETS - PROPRIETARY FUNDS
FOR THE YEAR ENDED JUNE 30, 2012(In Thousands)
GovernmentalActivities
Department Nonmajor Internalof Public Enterprise ServiceUtilities Funds Total Funds
Operating Revenues:Charges for services $ 83,823 $ 2,054 $ 85,877 $ 15,046Use of property 2,619 2,619Other services 610 610
Total operating revenues 87,052 2,054 89,106 15,046
Operating Expenses:Purchased gas and electric 39,194 39,194General and administrative 14,460 14,460Depreciation 6,279 399 6,678Operations and maintenance 11,401 2,096 13,497Customer accounts 1,659 1,659Gross revenue and property taxes 2,009 2,009Claims 15,185Premiums and administrative charges 1,055
Total operating expenses 75,002 2,495 77,497 16,240
Operating Income (Loss) 12,050 (441) 11,609 (1,194)
Nonoperating Income (Expense):Interest income 9 2 11 Interest expense (235) (235) Loss on disposal of capital assets (377) (5) (382)
Total nonoperating expense (603) (3) (606) -
Income (Loss) Before Contributions and Transfers 11,447 (444) 11,003 (1,194)
Capital contributions 6,744 6,744Transfers in 54 54Transfers out (7,493) (7,493)
Change in Net Assets 10,698 (390) 10,308 (1,194)
Total Net Assets at Beginning of Year, as Restated* 109,472 * 10,317 119,789 82
Total Net Assets at End of Year $ 120,170 $ 9,927 $ 130,097 $ (1,112)
Business-Type Activities
The accompanying notes are an integral part of the financial statements
18

EXHIBIT VII CITY OF NORWICH, CONNECTICUT
STATEMENT OF CASH FLOWS - PROPRIETARY FUNDS
FOR THE YEAR ENDED JUNE 30, 2012(In Thousands)
GovernmentalActivities
Department Nonmajor Internalof Public Enterprise ServiceUtilities Funds Total Funds
Cash Flows from Operating Activities: Cash received from charges for services $ 86,127 $ 2,145 $ 88,272 $ 2,413Cash receipts for interfund services provided 12,887Cash paid to vendors (55,889) (1,191) (57,080) (15,300) Cash paid to employees for services (13,556) (884) (14,440)
Net cash provided by operating activities 16,682 70 16,752 -
Cash Flows from Noncapital and Related Financing Activities: Transfers to other funds (7,493) (7,493) Customer deposits 58 58Advances from other funds 9 9
Net cash provided by (used in) noncapital and related financing activities (7,435) 9 (7,426) -
Cash Flows from Capital and Related Financing Activities: Capital contributions 6,744 6,744Purchase of capital assets (19,114) (66) (19,180) Proceeds from long-term debt 5,264 5,264Principal payment on bonds and notes (565) (25) (590) Principal payment on capital leases (315) (315) Interest payment on debt (236) (236) Loss on the disposal of property and equipment (377) 5 (372)
Net cash used in capital and related financing activities (8,599) (86) (8,685) -
Cash Flows from Investing Activities: Income on investments 9 2 11
Net Increase (Decrease) in Cash and Cash Equivalents 657 (5) 652 -
Cash and Cash Equivalents at Beginning of Year 16,266 10 16,276 -
Cash and Cash Equivalents at End of Year $ 16,923 $ 5 $ 16,928 $ -
Reconciliation of Operating Income (Loss) to Net Cash Provided by Operating Activities:
Operating income (loss) $ 12,050 $ (441) $ 11,609 $ (1,194) Adjustments to reconcile operating income (loss) to net cash provided by operating activities:
Depreciation expense 6,279 399 6,678Provision for uncollectible accounts 834 834(Increase) decrease in receivables (1,479) 99 (1,380) 42(Increase) decrease in inventories and other assets (315) 10 (305) Increase in due from other funds (59) (59) 212Decrease in unearned revenues (17) (8) (25) Increase (decrease) in accounts payable and accrued liabilities (670) 70 (600) 940
Total adjustments 4,632 511 5,143 1,194
Net Cash Provided by Operating Activities $ 16,682 $ 70 $ 16,752 $ -
Business-Type Activities
The accompanying notes are an integral part of the financial statements
19

EXHIBIT VIIICITY OF NORWICH, CONNECTICUT
STATEMENT OF FIDUCIARY NET ASSETS - FIDUCIARY FUNDS
JUNE 30, 2012(In Thousands)
Other PostPension EmploymentTrust Benefit Trust AgencyFunds Fund Funds
Assets: Cash and cash equivalents $ 870 $ $ 385Investments:
Mutual funds 119,816 5,670Common stock 16,578
Other receivables 47 103Due from other funds 49 1,410
Total assets 137,313 7,127 $ 488
Liabilities:Accounts and other payables 32 $Due to other fundsDue to student groups and agencies 488
Total liabilities 32 $ 488
Net Assets:Held in Trust for Pension and Other Benefits $ 137,281 $ 7,127
The accompanying notes are an integral part of the financial statements
20

EXHIBIT IXCITY OF NORWICH, CONNECTICUT
STATEMENT OF CHANGES IN PLAN NET ASSETS - FIDUCIARY FUNDS
FOR THE YEAR ENDED JUNE 30, 2012(In Thousands)
Other PostEmployment
Pension Benefit TrustTrust Funds Fund
Additions:Contributions:
Employer $ 4,688 $ 6,114Plan members 2,948 1,468
Total contributions 7,636 7,582
Investment income:Net depreciation in fair value of investments (1,933) (29) Interest and dividends 314 161
Total investment income (loss) (1,619) 132
Less investment expense (866) (29) Net investment income (loss) (2,485) 103
Total additions 5,151 7,685
Deductions:Benefits 12,392 4,654Administration 32 309Lump sum distributions and withdrawals 403
Total deductions 12,827 4,963
Net Increase (Decrease) (7,676) 2,722
Net Assets Held in Trust for Pension Benefits at Beginning of Year 144,957 4,405
Net Assets Held in Trust for Pension and Other Post-Employment Benefits at End of Year $ 137,281 $ 7,127
The accompanying notes are an integral part of the financial statements
21

22
CITY OF NORWICH, CONNECTICUT
NOTES TO FINANCIAL STATEMENTS
(In Thousands)
1. SUMMARY OF SIGNIFICANT ACCOUNTING POLICIES The financial statements of the City of Norwich, Connecticut (the City) have been prepared in conformity
with accounting principles generally accepted in the United States of America (GAAP) as applied to government units. The Governmental Accounting Standards Board (GASB) is the accepted standard setting body for establishing governmental accounting and financial reporting principles. The more significant policies of the City are described below.
A. Reporting Entity
The City was incorporated in May 1784. The City and Town consolidated on January 1, 1952. The City
covers an area of 27.1 square miles, and is located 40 miles southeast of Hartford. The City operates under a Council/Manager form of government. The City Manager is appointed by the Council and serves as the Chief Executive Officer.
B. Government-Wide and Fund Financial Statements
The government-wide financial statements (i.e., the statement of net assets and the statement of activities)
report information on all of the nonfiduciary activities of the City. For the most part, the effect of interfund activity has been removed from these statements. Governmental activities, which normally are supported by taxes and intergovernmental revenues, are reported separately from business-type activities, which rely to a significant extent on fees and charges for support.
The statement of activities demonstrates the degree to which the direct expenses of a given function or
segment are offset by program revenues. Direct expenses are those that are clearly identifiable with a specific function or segment. Program revenues include 1) charges to customers or applicants who purchase, use or directly benefit from goods, services or privileges provided by a given function or segment, and 2) grants and contributions that are restricted to meeting the operational or capital requirements of a particular function or segment. Taxes and other items not properly included among program revenues are reported instead as general revenues.
Separate financial statements are provided for governmental funds, proprietary funds and fiduciary funds, even
though the latter are excluded from the government-wide financial statements. Major individual governmental funds and major individual enterprise funds are reported as separate columns in the fund financial statements.
C. Measurement Focus, Basis of Accounting and Financial Statement Presentation
The government-wide financial statements are reported using the economic resources measurement focus
and the accrual basis of accounting, as are the proprietary fund and fiduciary fund financial statements (except for agency funds, which have no measurement focus). Revenues are recorded when earned and expenses are recorded when a liability is incurred, regardless of the timing of related cash flows. Property taxes are recognized as revenues in the year for which they are levied. Grants and similar items are recognized as revenue as soon as all eligibility requirements imposed by the provider have been met.
23
Governmental fund financial statements are reported using the current financial resources measurement focus and the modified accrual basis of accounting. Revenues are recognized as soon as they are both measurable and available. Revenues are considered to be available when they are collectible within the current period or soon enough thereafter to pay liabilities of the current period. For this purpose, the City considers revenues to be available if they are collected within 60 days of the end of the current fiscal period. Expenditures generally are recorded when a liability is incurred, as under accrual accounting. However, debt service expenditures, as well as expenditures related to compensated absences and claims and judgments, are recorded only when payment is due.
Property taxes, charges for services, licenses and interest associated with the current fiscal period are all
considered to be susceptible to accrual and so have been recognized as revenues of the current fiscal period. Only the portion of special assessments receivable due within the current fiscal period is considered to be susceptible to accrual as revenue of the current period. All other revenue items are considered to be measurable and available only when cash is received.
The City reports the following major governmental funds:
The General Fund is the City’s primary operating fund. It accounts for all financial resources of the
City, except those required to be accounted for in another fund.
The Bond Expenditure Fund accounts for the City’s capital projects established pursuant to project bond authorizations. Financial resources include intergovernmental grants, bond proceeds and transfers from the City’s General Fund.
The Intermodal Transportation Center Fund accounts for the City’s capital project established to
account for activity associated with the building of a transportation center. Financial resources include intergovernmental grants, bond proceeds and transfers from the City’s General Fund.
The School Projects Fund accounts for the City’s capital projects established to account for activity
associated with the building of new schools and/or renovations to existing schools. Financial resources include intergovernmental grants, bond proceeds and transfers from the City’s General Fund.
The City reports the following major proprietary fund:
The Department of Public Utilities accounts for the operation of the City’s water, sewer, electric and gas divisions. It is independent in terms of its relationship to other City functions. Its operations are financed from direct charges to the users of the service for operations that are financed in a manner similar to private business enterprises, where the intent is that costs of providing goods or services to the general public on a continuing basis be financed or recovered primarily through user charges.
Additionally, the City reports the following fund types:
The Internal Service Fund accounts for employee health insurance provided to other departments of the
City and the City’s self-insured workers’ compensation program.
The Pension Trust Funds account for the activities of the City’s two defined benefit pension plans, which accumulate resources for pension benefit payments to qualified retired employees.
The OPEB Trust Fund accounts for the activities of the City’s other post employment benefit plan,
which accumulate resources for medical and life insurance benefits provided to qualified retired employees.

24
The Agency Funds account for monies held as a custodian for outside groups and agencies and are used for senior activities, performance bonds and pass-through grants.
Private-sector standards of accounting and financial reporting issued prior to December 1, 1989 generally are followed in both the government-wide and proprietary fund financial statements to the extent that those standards do not conflict with or contradict guidance of the Governmental Accounting Standards Board. Governments also have the option of following subsequent private-sector guidance for their business-type activities and enterprise funds, subject to this same limitation. The City has elected not to follow subsequent private-sector guidance.
As a general rule, the effect of interfund activity has been eliminated from the government-wide financial
statements. Exceptions to this general rule are payments in lieu of taxes and other charges between certain City functions because the elimination of these charges would distort the direct costs and program revenues reported for the various functions concerned.
Amounts reported as program revenues include 1) charges to customers or applicants for goods, services or
privileges provided, 2) operating grants and contributions, and 3) capital grants and contributions, including special assessments. Internally dedicated resources are reported as general revenues rather than as program revenues. Likewise, general revenues include property taxes.
Proprietary funds distinguish operating revenues and expenses from nonoperating items. Operating
revenues and expenses generally result from providing services and producing and delivering goods in connection with a proprietary fund’s principal ongoing operations. The principal operating revenues of the enterprise fund are charges to customers for sales and services. Operating expenses for enterprise funds include the cost of sales and services, administrative expenses and depreciation on capital assets. All revenues and expenses not meeting this definition are reported as nonoperating revenues and expenses.
When both restricted and unrestricted resources are available for use, it is the City’s policy to use restricted
resources first, then unrestricted resources as they are needed. Unrestricted resources are used in the following order: committed, assigned then unassigned.
D. Deposits and Investments
The City’s cash and cash equivalents are considered to be cash on hand, demand deposits and short-term
investments with original maturities of three months or less from the date of acquisition. State statutes authorize the City to invest in obligations of the U.S. Treasury, commercial paper, corporate
bonds, repurchase agreements and certain other investments as described in Note 3. Investments for the City are reported at fair value.
E. Receivables and Payables
Activity between funds that are representative of lending/borrowing arrangements outstanding at the end of
the fiscal year are referred to as either “due to/from other funds” (i.e., the current portion of interfund loans) or “advances to/from other funds” (i.e., the noncurrent portion of interfund loans). All other outstanding balances between funds are reported as “due to/from other funds.” Any residual balances outstanding between the governmental activities and business-type activities are reported in the government-wide financial statements as “internal balances.” All trade and property tax receivables are shown net of an allowance for uncollectibles.

25
Property taxes on all property are assessed as of October 1 prior to the beginning of the fiscal year and become legally due and payable on the following July 1 and January 1. If taxes are unpaid as of June 30 following the payable date, a lien is placed on the real property. Property assessments are made at 70% of the market value. Property taxes receivable are recorded on the due date. Taxes not paid within 30 days of the due date are subject to an interest charge of one and one-half percent per month. The City is not a part of any overlapping government which assesses separate property taxes. An amount of $555 has been established as an allowance for uncollected taxes. At June 30, 2012, this represents 13.7% of property taxes receivable.
F. Inventories and Prepaid Items
All inventories are valued at cost using the first-in/first-out (FIFO) method. Inventories of governmental
funds are recorded as expenditures when consumed rather than when purchased. Certain payments to vendors reflect costs applicable to future accounting periods and are recorded as
prepaid items in both government-wide and fund financial statements. G. Capital Assets Capital assets, which include property, plant, equipment and infrastructure, assets (e.g., roads, bridges,
sidewalks and similar items), are reported in the applicable governmental or business-type activities columns in the government-wide financial statements. Capital assets are defined by the government as assets with an initial, individual cost of more than $5,000 (amount not rounded) and an estimated useful life in excess of two years. Such assets are recorded at historical cost or estimated historical cost if purchased or constructed. Donated capital assets are recorded at estimated fair market value at the date of donation.
The costs of normal maintenance and repairs that do not add to the value of the asset or materially extend
assets lives are not capitalized. Major outlays for capital assets and improvements are capitalized as projects are constructed. Interest incurred during the construction phase of capital assets of business-type activities is included as part of the capitalized value of the assets constructed.
Property, plant and equipment of the primary government is depreciated using the straight-line method over
the following estimated useful lives:
Assets Years Buildings 40-50 Building improvements 20 Infrastructure, public domain infrastructure and distribution and collection systems 20-50 Machinery and equipment 5-20
H. Compensated Absences Employees are paid by a prescribed formula for absences due to vacation or sickness. The obligation for
vacation pay vests when earned. Unused sick leave may be accumulated for future absences in accordance with employee contracts and employment policies. Upon retirement, vested sick leave is payable to employees subject to union contract payment provisions. Sick leave and vacation leave expenditures are recognized in the governmental fund financial statements in the current year to the extent they are due (matured). The liability for the remainder of the accrued vacation earned and not due is reported in the government-wide and proprietary fund financial statements.

26
I. Long-Term Obligations
In the government-wide financial statements, and proprietary fund types in the fund financial statements, long-term debt and other long-term obligations are reported as liabilities in the applicable governmental activities, business-type activities or proprietary fund type statement of net assets. Bond premiums and discounts, as well as issuance costs, are deferred and amortized over the life of the bonds using the effective interest method. Bonds payable are reported net of any significant applicable bond premium or discount. Significant bond issuance costs are reported as deferred charges and amortized over the term of the related debt.
In the fund financial statements, governmental fund types recognize bond premiums and discounts, as well
as bond issuance costs, during the current period. The face amount of debt issued is reported as other financing sources. Premiums received on debt issuances are reported as other financing sources while discounts on debt issuances are reported as other financing uses. Issuance costs, whether or not withheld from the actual debt proceeds received, are reported as debt service expenditures.
J. Fund Equity and Net Assets
In the government-wide financial statements and in proprietary fund types, net assets are classified in the
following categories: Invested in Capital Assets, Net of Related Debt and Accumulated Depreciation - This category groups
all capital assets, including infrastructure, into one component of net assets. Accumulated depreciation and the outstanding balances of debt that are attributable to the acquisition, construction or improvement of these assets reduces this category.
Restricted Net Assets - This category represents the net assets of the City which are restricted by
externally imposed constraints placed on the net assets by grantors, contributors or laws and regulations of other governments.
Unrestricted Net Assets - This category represents the net assets of the City which are not restricted for
any project or other purpose. In the fund financial statements, fund balances of governmental funds are classified in five separate
categories. The five categories, and their general meanings, are as follows: Nonspendable Fund Balance - This represents amounts that cannot be spent due to form (e.g.,
inventories and prepaid amounts).
Restricted Fund Balance - This represents amounts constrained for a specific purpose by external parties, such as grantors, creditors, contributors or laws and regulations of their governments.
Committed Fund Balance - This represents amounts constrained for a specific purpose by a government using its highest level of decision-making authority (City Council). A fund balance commitment is established, modified, and/or rescinded by ordinance.
Assigned Fund Balance - For all governmental funds other than the General Fund, this represents any remaining positive amounts not classified as nonspendable, restricted or committed. For the General Fund, this includes amounts constrained for the intent to be used for a specific purpose by a governing board or a body or official that has been delegated authority to assign amounts by the City Charter.
Unassigned Fund Balance - This represents fund balance in the General Fund in excess of nonspendable, restricted, committed and assigned fund balance. If another governmental fund has a fund balance deficit, it is reported as a negative amount in unassigned fund balance.

27
The City does not have a minimum fund balance policy regarding unassigned fund balance. The City is assumed to use restricted resources first if both restricted and unrestricted resources are to be used for the same purpose. In addition, when committed, assigned and unassigned resources are available it is assumed that committed resources are used first, then assigned, and lastly, unassigned.
2. STEWARDSHIP, COMPLIANCE AND ACCOUNTABILITY
A. Budgetary Information In October, the City Manager, through the Comptroller’s Office, distributes budget instructions to
department heads. On or before a date set by the City Manager, the head of every department, office or agency must submit a written proposed budget for the following year to the City Manager. The City Manager and Comptroller review these proposals and may revise them as deemed advisable, except in the case of the Department of Education where the City Manager has the authority to revise only the total estimated expenditures. The City Manager and Comptroller compare proposed expenditures to expected revenues and prepare a proposed budget for presentation to the City Council.
As required by City Charter, on or before the first Monday in April, the City Manager submits a balanced
annual budget, as well as appropriation and tax levy ordinances to the City Council. Between the presentation of the budget and the first public hearing, department heads are given the opportunity to make presentations in support of their proposed budget. The City Council holds a first public hearing on the budget prior to the third Monday in April, but not sooner than one week after the submission of the budget. This hearing is to listen to citizens’ comments on the budget. The Council meets by the second Monday in May to take initial action on the budget. A second public hearing is then held regarding the Council’s proposed changes, prior to the third Monday in May.
After the second public hearing, the Council may revise expenditures, except that it may not reduce
appropriations for debt service and may revise only the total estimated expenditures for the Department of Education. The Council adopts the budget, appropriation and tax levy ordinances by the second Monday of June; if it fails to do so, the budget as submitted by the City Manager stands.
The General Fund and the Fire Districts nonmajor governmental fund have legally adopted budgets. The City Manager may transfer unexpended balances within a department, office or agency; the Council
may transfer unexpended balances between departments at the City Manager’s request within the last three months of the fiscal year. The Comptroller oversees revenues and expenditures according to the budget established by the City Council. The Board of Education may transfer unexpended balances between accounts within its total line appropriation. Additional appropriations may be made upon the City Manager’s recommendation, provided the Comptroller certifies the availability of a sufficient General Fund surplus.
Encumbrances are recognized as a valid and proper charge against a budget appropriation in the year in
which the purchase order, contract or other commitment is issued and, accordingly, encumbrances outstanding at year-end are reflected in budgetary reports as expenditures of the current year. If an appropriation is not encumbered, it lapses at year-end and may not be used by the department.

28
B. Deficit Fund Equity
Certain individual funds had fund balance/net asset deficits at June 30, 2011 as follows:
Bond Expenditure Fund $ 2,732* Nonmajor Governmental Funds: Parking Commission Property Rehabilitation Dog License
77** 53*** 16****
Internal Service Funds: Workers’ Compensation 3,603**
* Deficit will be reduced by future transfers from bond issuances. ** Deficit will be reduced by future contributions from the General Fund adopted as part of the
budget process. *** Deficit will be reduced by future Community Development Fund transfers and property rehab
loan payment receipts. **** Deficit will be reduced by future operating surpluses or, if necessary, future contributions from
the General Fund adopted as part of the budget process. 3. CASH, CASH EQUIVALENTS AND INVESTMENTS The deposit of public funds is controlled by the Connecticut General Statutes (Section 7-402). Deposits
may be made in a “qualified public depository” as defined by Statute or in amounts not exceeding the Federal Deposit Insurance Corporation insurance limit in an “out of state bank,” as defined by the Statutes, which is not a “qualified public depository.”
The Connecticut General Statutes (Section 7-400) permit municipalities to invest in: 1) obligations of the
United States and its agencies, 2) highly rated obligations of any state of the United States or of any political subdivision, authority or agency thereof, and 3) shares or other interests in custodial arrangements or pools maintaining constant net asset values and in highly rated no-load open end money market and mutual funds (with constant or fluctuating net asset values) whose portfolios are limited to obligations of the United States and its agencies, and repurchase agreements fully collateralized by such obligations. Other provisions of the Statutes cover specific municipal funds with particular investment authority. The provisions of the Statutes regarding the investment of municipal pension funds does not specify permitted investments. Therefore, investment of such funds is generally controlled by the laws applicable to fiduciaries and the provisions of the applicable plan.
The Statutes (Sections 3-24f and 3-27f) also provide for investment in shares of the State Short-Term
Investment Fund (STIF) and the State Tax Exempt Proceeds Fund (TEPF). These investment pools are under the control of the State Treasurer, with oversight provided by the Treasurer’s Cash Management Advisory Board, and are regulated under the State Statutes and subject to annual audit by the Auditors of Public Accounts. Investment yields are accounted for on an amortized-cost basis with an investment portfolio that is designed to attain a market-average rate of return throughout budgetary and economic cycles. Investors accrue interest daily based on actual earnings, less expenses and transfers to the designated surplus reserve, and the fair value of the position in the pool is the same as the value of the pool shares.

29
Deposits Deposit Custodial Credit Risk - Custodial credit risk is the risk that, in the event of a bank failure, the City’s
deposit will not be returned. The City has a formal investment policy. Under this policy, the Treasurer shall mitigate concentration of credit risk on deposits by spreading deposits among different financial institutions. Because the benefits of lower fees and higher rates of return often outweigh the attendant risks of carrying large balances with a few financial institutions, the Treasurer will use their judgment rather than target percentages to guide their deposit strategy. For other investments, no more than 10% of the funds covered under this policy may be invested in securities from any one federal, state or local political subdivision or agency. Deposits may be placed with any qualified public depository that has its main place of business in the State of Connecticut. Connecticut General Statutes require that each depository maintain segregated collateral (not required to be based on a security agreement between the depository and the municipality and, therefore, not perfected in accordance with federal law) in an amount equal to a defined percentage of its public deposits based upon the depository’s risk based capital ratio. Based on the criteria described in GASB Statement No. 40, Deposits and Investment Risk Disclosures, $36,704 of the City’s bank balance of $39,073 was exposed to custodial credit risk as follows:
Uninsured and uncollateralized $ 32,838 Uninsured and collateral held by the pledging bank’s trust department, not in the City’s name 3,866 Total Amount Subject to Custodial Credit Risk $ 36,704
Cash Equivalents
At June 30, 2012, the City’s cash equivalents amounted to $8,877. The following table provides a summary
of the City’s cash equivalents (excluding U.S. government guaranteed obligations) as rated by nationally recognized statistical rating organizations. The pools all have maturities of less than one year.
Standard & Poor’s
State Short-Term Investment Fund (STIF) AAA/m Investments
As of June 30, 2012, the City had the following investments:
Investment Maturities (Years) Credit Fair Less More
Investment Type Rating Value Than 1 1 - 10 Than 10 Interest-bearing investments: Certificates of deposit* N/A $ 1,952 $ 317 $ 1,635 $ Other investments: Common stock 17,451 Mutual funds 125,933 Total Investments $ 145,336
*Subject to coverage by Federal Depository Insurance and collateralization.
N/A Not applicable
30
Interest Rate Risk - The Employees’ Pension Plan formal investment policy states that for fixed income investments, no issues may be purchased with a maturity that exceeds the maximum maturity in the applicable benchmark index. Maturity duration is managed to remain within plus or minus 25% of the applicable benchmark index. The City does not further limit its other investment maturities as a means of managing its exposure to fair value losses arising from increasing rates.
Credit Risk - Investments - As indicated above, State Statutes limit the investment options of cities and towns. The Employees’ Pension Plan formal investment policy does not allow for investment in any company that has filed for bankruptcy without prior Personnel and Pension Board approval. For domestic equities, investments must be with companies that meet a specified minimum capitalization threshold at the date of purchase. For fixed income instruments, the average quality of the portfolio must exceed minimum rating levels at all times as defined in the investment policy. Equity securities that meet or exceed a credit rating of BBB-/Baa3 may be purchased. The City’s investment policy governing other investments limits holdings to highly rated fixed income instruments, mutual funds and government investment pools. Concentration of Credit Risk - The Employees’ Pension Plan formal investment policy includes provisions for domestic equities stating that the cost of an individual security in a portfolio at the date of purchase may not exceed 5% of the total market value of that portfolio. Fixed income instruments with a single issuer (excluding U.S. government and government agencies) may not exceed 5% of the market value of that portfolio. The City’s investment policy governing other investments does not permit direct equity or fixed income investments in private-sector companies.
Custodial Credit Risk - Custodial credit risk for an investment is the risk that, in the event of the failure of the counterparty (the institution that pledges collateral or repurchase agreement securities to the City or that sells investments to or buys them for the City), the City will not be able to recover the value of its investments or collateral securities that are in the possession of an outside party. The City has a formal investment policy. Under this policy, the Treasurer shall mitigate concentration of credit risk on deposits by spreading deposits among different financial institutions. Because the benefits of lower fees and higher rates of return often outweigh the attendant risks of carrying large balances with a few financial institutions, the Treasurer will use their judgment rather than target percentages to guide their deposit strategy. For other investments, no more than 10% of the funds covered under this policy may be invested in securities from any one federal, state or local political subdivision or agency. The City’s individual investments in U.S. government obligations, equities and corporate bonds are uninsured and unregistered securities held by a counterparty, or by its trust department or agent that are not in the City’s name. The City’s investments held in open-end mutual funds which, because they are pooled investments rather than separate identifiable securities, are not subject to custodial risk determination. The City will only deposit funds in institutions rated within one of the top three rating categories of any nationally recognized rating service. Financial institutions in which the City deposits funds shall be accepted by City Council resolution. For financial institutions which have not been ranked by a nationally recognized rating service, the Treasurer shall assess the financial capacity and creditworthiness of the institution before recommending it to the City Council for approval.

31
4. RECEIVABLES
Receivables as of year end for the City’s individual major funds and nonmajor, internal service and fiduciary funds in the aggregate, including the applicable allowances for uncollectible accounts, are as follows:
Intermodal Department NonmajorTransportation School of Public and Other
General Center Projects Utilities Funds Total
Receivables: Taxes $ 4,046 $ $ $ $ 361 $ 4,407 Accrued interest on taxes 1,365 1,365 Intergovernmental 993 3,505 5,270 1,708 11,476 User charges 16,825 33 16,858 Assessments 3,066 3,066 Housing and rehabilitation loans 2,670 2,670 Accounts and other 349 620 312 1,281
Gross receivables 9,819 3,505 5,270 17,445 5,084 41,123
Less allowance for uncollectibles:
Taxes (555) (48) (603) Accrued interest on taxes (273) (273) User charges (1,932) (1,932)
Total allowance (828) - - (1,932) (48) (2,808)
Net Total Receivables $ 8,991 $ 3,505 $ 5,270 $ 15,513 $ 5,036 $ 38,315
Governmental funds report deferred revenue in connection with receivables for revenues that are not
considered to be available to liquidate liabilities of the current period. Governmental funds also defer revenue recognition in connection with resources that have been received, but not yet earned. At the end of the current fiscal year, the various components of deferred revenue and unearned revenue reported in the governmental funds were as follows:
Unavailable Unearned Total
General Fund:Property taxes $ 3,064 $ $ 3,064Accrued interest on property taxes 1,092 1,092Assessments 3,066 3,066School building construction grant receivables 198 198Other deferred revenues 345 345
Intermodal Transportation Center Fund:Grant drawdowns prior to meeting all
eligibility requirements 62 62Nonmajor funds:
Taxes and accrued interest on delinquentproperty taxes 270 270
Housing loans and interest 1,925 1,925Lead abatement - unamortized loans 745 745Grant drawdowns prior to meeting all
eligibility requirements 460 460Other receivables and deferred revenues 159 9 168
Total Deferred/Unearned Revenue for Governmental Funds $ 9,774 $ 1,621 $ 11,395

32
5. INTERFUND RECEIVABLES, PAYABLES AND TRANSFERS
During the course of operations, transactions are processed through a fund on behalf of another fund. Additionally, revenues received in one fund are transferred to another fund. The City also operates a cash pool in the general fund as well as there are bonded projects in a fund that benefit another fund. A summary of interfund balances as of June 30, 2012 is presented below.
Receivable Fund Payable Fund Amount
General Fund Bond Expenditure Fund $ 2,338 Intermodal Transportation Center 2,234 School Projects 3,837 Nonmajor Governmental 525 Nonmajor Enterprise 265
Nonmajor Governmental General Fund 5,806 Nonmajor Enterprise General Fund 628 Internal Service Funds General Fund 6,942 Pension Trust General Fund 49 Other Post Employment Benefit Trust General Fund 1,410
Total $ 24,034
A summary of interfund transfers is presented below:
Intermodal School Nonmajor Nonmajor
General Transportation Projects Enterprise Governmental Total
Transfers out:
General Fund $ $ $ 37 $ 54 $ 2,611 $ 2,702 Bond Expenditure 1,163 59 1,222 Department of Public Utilities 6,908 585 7,493 Nonmajor Governmental 314 24 338
Total Transfers Out $ 7,222 $ 24 $ 1,200 $ 54 $ 3,255 $ 11,755
Transfers In
Transfers from the General Fund to other nonmajor governmental funds are in support of the City’s capital
improvement program, fire services and other special revenue programs accounted for outside of the General Fund. Transfers from nonmajor governmental funds to the General Fund are derived primarily from net income generated from parking services and landfill operations accounted for outside of the General Fund. The Department of Public Utilities annually transfers 10% of gross revenues derived from gas, electric and water sales to the General Fund and the Fire Districts Fund.

33
6. CAPITAL ASSETS
Capital asset activity for the year ended June 30, 2012 was as follows:
Beginning EndingBalance Increases Decreases Balance
Governmental activities: Capital assets not being depreciated:
Land $ 23,124 $ 1,120 $ $ 24,244 Construction in progress 51,403 10,960 (72) 62,291
Total capital assets not being depreciated 74,527 12,080 (72) 86,535
Capital assets being depreciated: Buildings and improvements 43,424 232 43,656 Vehicles, machinery and equipment 18,717 763 (45) 19,435 Technology upgrade and infrastructure 35,707 1,572 (141) 37,138
Total capital assets being depreciated 97,848 2,567 (186) 100,229
Less accumulated depreciation for: Buildings and improvements (24,447) (1,397) (25,844) Vehicles, machinery and equipment (11,805) (1,063) 29 (12,839) Technology upgrade and infrastructure (17,078) (1,434) 141 (18,371)
Total accumulated depreciation (53,330) (3,894) 170 (57,054)
Total capital assets being depreciated, net 44,518 (1,327) (16) 43,175
Governmental Activities Capital Assets, Net $ 119,045 $ 10,753 $ (88) $ 129,710
Beginning EndingBalance Increases Decreases Balance
Business-type activities: Capital assets not being depreciated:
Land $ 2,922 $ $ $ 2,922 Construction in progress 12,467 18,180 (8,739) 21,908
Total capital assets not being depreciated 15,389 18,180 (8,739) 24,830
Capital assets being depreciated: Structures and improvements 75,377 2,479 (555) 77,301 Machinery, equipment, pumping and distribution systems 143,382 7,854 (1,011) 150,225
Total capital assets being depreciated 218,759 10,333 (1,566) 227,526
Less accumulated depreciation for: Structures and improvements (40,220) (2,888) (43,108) Machinery, equipment, pumping and distribution systems (86,399) (3,790) 1,184 (89,005)
Total accumulated depreciation (126,619) (6,678) 1,184 (132,113)
Total capital assets being depreciated, net 92,140 3,655 (382) 95,413
Business-Type Activities Capital Assets, Net $ 107,529 $ 21,835 $ (9,121) $ 120,243

34
Depreciation expense was charged to functions/programs of the primary government as follows:
Governmental activities:General government $ 138 Public safety 831 Social services 53 Public works 1,690 Education 1,182
Total Depreciation Expense - Governmental Activities $ 3,894
Business-type activities:Department of Public Utilities $ 6,279 Golf Course Authority 56 Stadium Authority 182 Ice Rink Authority 161
Total Depreciation Expense - Business-Type Activities $ 6,678
Construction Commitments
The City has active construction projects as of June 30, 2012. At year end, the City’s commitments with
contractors on active authorizations are as follows:
Cumulative Current Cumulative Balance
Project Authorization Expenditures Expenditures June 30, 2012
Kelly Middle School Renovation $ 40,250 $ 3,530 $ 39,879 $ 371
Intermodal Transportation Center 21,965 6,651 21,211 754
New London Turnpike/Pleasant Bridge 530 305 225
Dodd Stadium Capital Improvements 610 1 582 28
Dog Pound 761 761
Fire Department Equipment
and Improvements 795 783 12
Flyers Drive Sewer Line Extension 1,800 4 1,800 -
Brown Park City Pier 2,020 1,998 22
Newton Street Area Sewer Line
Extension 1,600 1,066 1,402 198
Road Improvements - 2010 bonds 5,000 332 1,457 3,543
Gas Line Extensions 3,000 1,995 2,051 949
Total $ 78,331 $ 13,579 $ 72,229 $ 6,102
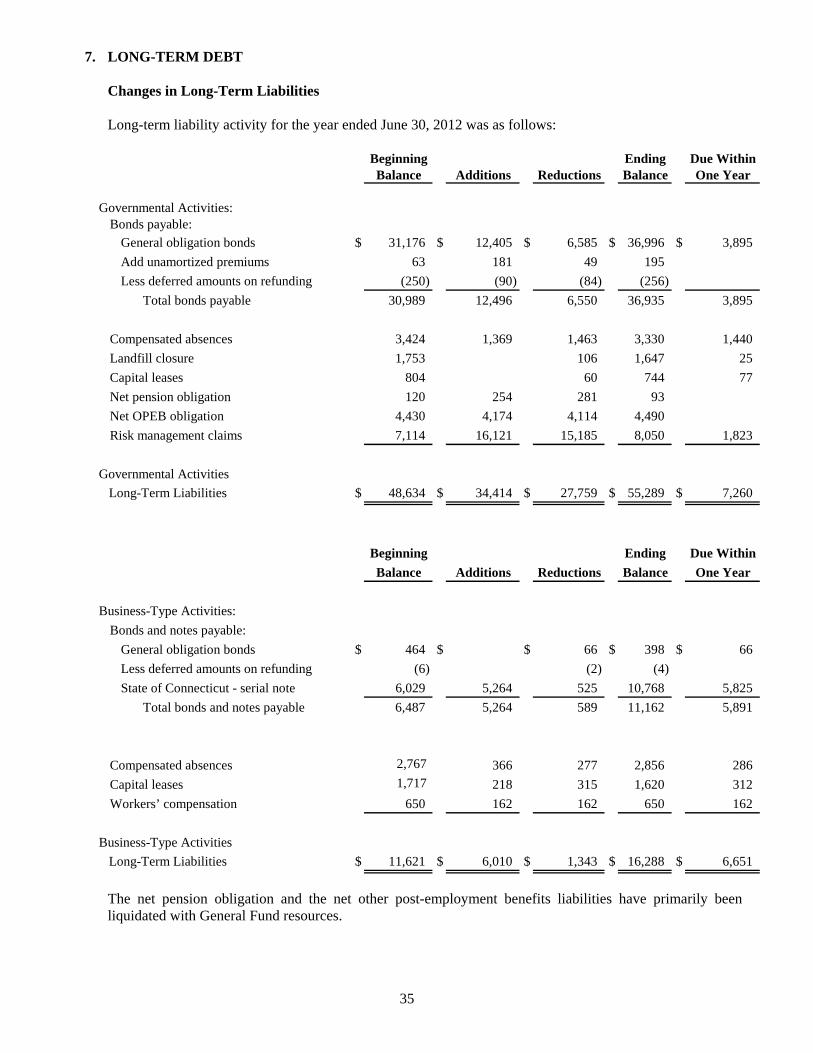
35
7. LONG-TERM DEBT Changes in Long-Term Liabilities
Long-term liability activity for the year ended June 30, 2012 was as follows:
Beginning Ending Due WithinBalance Additions Reductions Balance One Year
Governmental Activities: Bonds payable:
General obligation bonds $ 31,176 $ 12,405 $ 6,585 $ 36,996 $ 3,895
Add unamortized premiums 63 181 49 195
Less deferred amounts on refunding (250) (90) (84) (256)
Total bonds payable 30,989 12,496 6,550 36,935 3,895
Compensated absences 3,424 1,369 1,463 3,330 1,440
Landfill closure 1,753 106 1,647 25
Capital leases 804 60 744 77
Net pension obligation 120 254 281 93
Net OPEB obligation 4,430 4,174 4,114 4,490
Risk management claims 7,114 16,121 15,185 8,050 1,823
Governmental Activities
Long-Term Liabilities $ 48,634 $ 34,414 $ 27,759 $ 55,289 $ 7,260
Beginning Ending Due Within
Balance Additions Reductions Balance One Year
Business-Type Activities:
Bonds and notes payable:
General obligation bonds $ 464 $ $ 66 $ 398 $ 66
Less deferred amounts on refunding (6) (2) (4)
State of Connecticut - serial note 6,029 5,264 525 10,768 5,825
Total bonds and notes payable 6,487 5,264 589 11,162 5,891
Compensated absences 2,767 366 277 2,856 286
Capital leases 1,717 218 315 1,620 312
Workers’ compensation 650 162 162 650 162
Business-Type Activities
Long-Term Liabilities $ 11,621 $ 6,010 $ 1,343 $ 16,288 $ 6,651
The net pension obligation and the net other post-employment benefits liabilities have primarily been liquidated with General Fund resources.

36
A schedule of bonds outstanding at June 30, 2012 is presented below:
Amount of BalanceDate of Date of Interest Original Outstanding
Description Issue Maturity Rate (%) Issue June 30, 2012
Governmental Activities: General purpose bonds payable:
General purpose - Wauregan Hotel 04/01/2001 04/01/2017 5.50-6.75 $ 400 $ 125 General purpose 04/15/2002 04/15/2022 4.0-5.0 6,020 - General purpose 04/15/2004 04/15/2015 2.00-3.55 3,120 700 Refunding - (11/15/1997 and 11/01/1999) bonds 04/15/2004 04/15/2019 2.0-4.0 4,520 2,225 General purpose and water main 03/15/2005 09/15/2015 3.0-5.0 3,520 1,400 Refunding - (02/01/1996 and 04/01/2001) bonds 03/15/2005 09/15/2019 3.0-4.0 8,570 5,322 Schools 12/30/2008 12/30/2020 2,940 2,205 Refunding - (04/01/2001) bonds 12/02/2009 04/01/2014 2.0-3.0 4,235 2,060 General purpose 12/02/2009 12/01/2029 3.0-4.0 9,145 8,659 Schools 12/02/2009 12/01/2029 3.0-4.0 2,000 1,895 General Purpose 12/13/2011 12/1/2022 2.0-4.0 4,680 4,680 Schools 12/13/2011 12/1/2022 2.0-4.0 5,000 5,000 Refunding - (4/15/02) bonds 2/15/2012 4/15/2022 2.0 2,725 2,725
Total $ 36,996
Business-Type Activities:
General purpose bonds payable:
Refunding - (02/01/1996) Stony Brook Reservoir 03/15/2005 09/15/2015 3.0-4.0 368 $ 158 Golf course 12/02/2009 12/01/2029 3.0-4.0 265 240
State of Connecticut serial notes payable:
Clean Water Act 106-C 10/31/1997 10/31/2016 2.00 3,410 852 Clean Water Act 298-C 06/30/2000 06/30/2019 2.00 1,508 530 Clean Water Act 349-C 12/31/2002 12/31/2021 2.00 881 458 Clean Water Act 9714-C 12/31/2002 12/31/2021 2.77 1,899 1,019 Clean Water Act 200801-C 07/01/2009 07/01/2029 2.27 450 380 Clean Water Act 625-D 12/31/2012 12/31/1931 2.00 1,865 1,864 Clean Water Act 495-C* * * * * 5,156 Economic Development 07/01/1995 07/01/2012 6.00 1,000 88 Drinking Water State Revolving Fund 2010-8005 03/31/2010 12/31/2029 2.06 145 127 Drinking Water State Revolving Fund 2010-8006 03/31/2010 06/30/2030 2.06 326 294
Total $ 11,166
* Loans are not permanently financed at this time.

37
The annual debt service requirements of the governmental activities bonded indebtedness is as follows:
Year Ending June 30, Principal Interest Total
2013 $ 3,895 $ 1,190 $ 5,0852014 4,355 951 5,3062015 3,316 835 4,1512016 3,072 737 3,8092017 2,555 655 3,2102018-2022 10,924 2,294 13,2182023-2027 5,575 1,251 6,8262028-2032 3,304 314 3,618
Total $ 36,996 $ 8,227 $ 45,223
The State of Connecticut reimburses the City for eligible principal and interest costs of the portion of the capital improvement bond issue used for school construction. The amount of principal and interest reimbursements for the year ended June 30, 2011 was $102. Additional principal payments aggregating $198 are expected to be received through the bonds maturity dates.
The annual debt service requirements of the City’s bond and notes payable of business-type activities are as
follows:
Year Ending June 30, Principal Interest Total
2013 $ 5,891 $ 130 $ 6,0212014 591 110 7012015 609 100 7092016 618 84 7022017 452 71 5232018-2022 1,693 225 1,9182023-2027 717 99 8162028-2031 595 26 621
Total $ 11,166 $ 845 $ 12,011
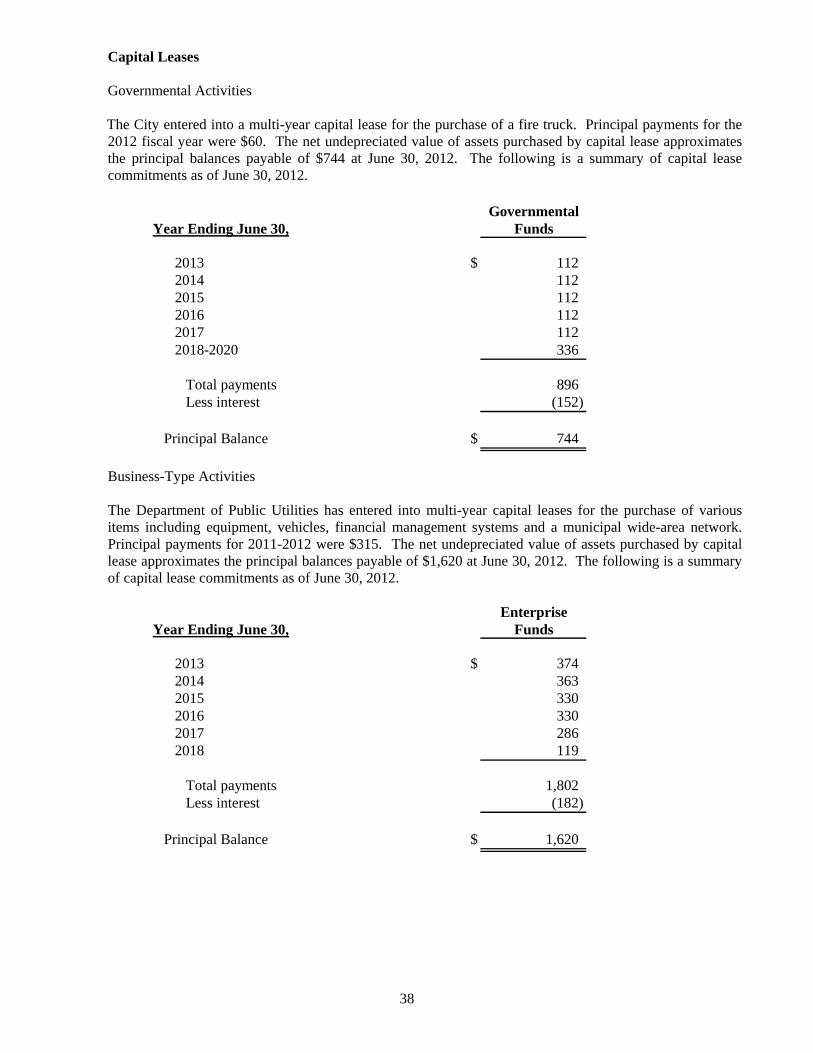
38
Capital Leases
Governmental Activities The City entered into a multi-year capital lease for the purchase of a fire truck. Principal payments for the
2012 fiscal year were $60. The net undepreciated value of assets purchased by capital lease approximates the principal balances payable of $744 at June 30, 2012. The following is a summary of capital lease commitments as of June 30, 2012.
Governmental
Year Ending June 30, Funds
2013 $ 1122014 1122015 1122016 1122017 1122018-2020 336
Total payments 896Less interest (152)
Principal Balance $ 744
Business-Type Activities The Department of Public Utilities has entered into multi-year capital leases for the purchase of various
items including equipment, vehicles, financial management systems and a municipal wide-area network. Principal payments for 2011-2012 were $315. The net undepreciated value of assets purchased by capital lease approximates the principal balances payable of $1,620 at June 30, 2012. The following is a summary of capital lease commitments as of June 30, 2012.
Enterprise
Year Ending June 30, Funds
2013 $ 374 2014 363 2015 330 2016 330 2017 286 2018 119
Total payments 1,802 Less interest (182)
Principal Balance $ 1,620

39
Compensated Absences - Governmental Activity Employees can accumulate additional amounts of unused vacation and sick leave (as determined by
individual union contracts) payable upon termination of their employment. Compensated absences’ liabilities are generally liquidated by the General Fund. The following vested and nonvested estimated liabilities are summarized as follows:
Vested: Sick $ 1,010 Vacation 646 Other 246 Nonvested: Sick 1,398 * Other 30 * Total $ 3,330
*Based on estimated percentage of total nonvested obligation that potentially will vest in future years
Landfill Closure and Postclosure Care Cost - Governmental Activity
State and federal laws and regulations require that the City place a final cover on its closed landfill and
perform certain maintenance and monitoring functions at the landfill site for 30 years after closure. The current estimated total cost of the landfill closure and post closure care of $1,647 is based on the amount estimated to be paid for all equipment, facilities and services required to close, monitor and maintain the complete landfill site as of June 30, 2012. However, the actual cost of closure and postclosure care may be higher due to inflation, changes in technology or changes in landfill laws and regulations. The City is eligible for approximately $3,300 in State grants of which $1,902 has been drawn down.
Bonds Authorized/Unissued
Bonds authorized/unissued with outstanding debt at June 30, 2012 are as follows:
AuthorizedDescription Authorized Bonded Grants Unissued
Kelly Middle School Renovation* $ 40,250 $ 9,940 $ 29,250 $ 1,060 Road Improvements 5,000 1,300 3,700 Sewer Line Extensions 2,600 2,000 600 Gas Line Extensions 3,000 1,000 2,000 Demolition 300 100 200 Dodd Stadium 610 580 30
Total $ 51,760 $ 14,920 $ 29,250 $ 7,590
* The City expects to receive approximately 77.14% of eligible project costs from the State in the form of progress payments.

40
Debt Limitations
The City’s indebtedness does not exceed the legal debt limitation as required by the Connecticut General Statutes as reflected in the following schedule:
Debt Net
Category Limit Indebtedness Balance General purpose $ 142,412 $ 30,451 $ 111,961 Schools 284,823 9,962 274,861 Sewers 237,353 13,086 224,267 Urban renewal 205,706 205,706 Pension deficit 189,882 189,882
The total of the City’s net statutory indebtedness of $53.5 million does not exceed the legal debt limitation of $443 million (seven times the base for debt limitation computation).
8. FUND EQUITY
A. Fund Balance The components of fund balance at June 30, 2012 are as follows:
Bond Intermodal Nonmajor
General Expenditure Transportation School GovernmentalFund Fund Center Projects Funds Total
Fund balances: Nonspendable: Inventory $ $ $ $ $ 56 $ 56 Trust 1,387 1,387 Restricted for: Trust 70 70 Grants 707 808 187 1,702 Fire districts 1,407 1,407 Committed to: Public safety 19 19 Public works 1,974 1,974 Social services 238 238 General government 464 464 Education 1,417 1,417 Assigned to: General government 36 36 Public works 28 28 Public safety 34 34 Education 163 163 Other 3 3 Unassigned 10,371 (2,732) (146) 7,493
Total Fund Balances $ 10,635 $ (2,732) $ 707 $ 808 $ 7,232 $ 16,650

41
B. Department of Public Utilities - Restricted Net Assets Connecticut Municipal Electric Energy Cooperative (CMEEC) administers a Municipal Energy and Load
Conservation Fund (the Fund) on behalf of its cooperative members, including the Department. The Fund was established to comply with provisions of House Bill 7501, Public Act No. 05-1 requiring CMEEC to establish and administer the Fund. CMEEC includes a charge of 1.5 mills per kilowatt hour in the monthly purchase power costs of wholesale electricity sold to the Department. Disbursements from the Fund are required to be made pursuant to a comprehensive electric conservation and load management plan. Funds held by CMEEC as of June 30, 2012 on behalf of the Department were $360. Investment income that is earned on the Department’s deposits along with the Fund’s authorized expenses is recorded in the Department’s statement of activities. The funds held by CMEEC on behalf of the Department are recorded as an asset on the Department’s statement of net assets and have been restricted.
9. RISK MANAGEMENT
The City is exposed to various risks of loss related to public official liability, police professional liability, theft or impairment of assets, errors and omissions, injury to employees, natural disasters and owners and contractors protective liability.
It is the policy of the City to self insure for employee health insurance programs. To this end, the City
created an internal service fund to which the various City funds “pay premiums” and from which employee medical claims are paid. Claims are accrued as incurred. The City also purchased “stop loss” insurance to limit its losses to $175 per person in 2012 for hospitalization with a maximum aggregate for all claims of approximately $15,971.
The City self insures for workers’ compensation benefits. The City purchases commercial insurance for
claims in excess of coverage provided by the workers’ compensation account with an individual claim maximum of $500 and a $10,000 aggregate maximum per year.
The workers’ compensation costs are funded by the General Fund. Liabilities are reported when it is
probable that a loss has occurred and the amount of the loss can be reasonably estimated. Claim liabilities are calculated considering the effects of inflation, recent claim settlement trends including frequency and amount of pay-outs and other economic and social factors.
Changes in the balances of claim liabilities during the past two years are as follows:
Current Year Beginning of Claims and Balance at Fiscal Year Changes in Claim Fiscal Liability Estimates Payments Year EndMedical: 2011-2012 $ 1,027 $ 12,489 $ 12,339 $ 1,177 2010-2011 1,170 11,047 11,190 1,027 Workers’ Compensation:
2011-2012 6,087 3,632 2,846 6,873 2010-2011 3,753 7,092 4,758 6,087
The City purchases commercial insurance for all other risks of loss, including blanket and umbrella policies.
Settled claims have not exceeded coverage in any of the past three years.

42
The Department of Public Utilities accounts for the self-insured component of workers’ compensation benefits for the Department’s employees within the Department of Public Utilities Enterprise Fund. The Department has accrued $650 for estimated unpaid accrued losses on reported claims as of June 30, 2012.
10. EMPLOYEE RETIREMENT SYSTEMS AND PENSION PLANS City of Norwich Retirement System
A. Plan Description The City of Norwich is the administrator of the City’s Consolidated Pension Plan, a single-employer
contributory defined benefit public employee retirement system (PERS) established and administered by the City to provide pension benefits to all full-time noncertified employees. The Plan is considered to be part of the City of Norwich’s financial reporting entity and is included in the City’s financial reports as a pension trust fund. The plan does not issue a stand-alone report.
The City provides all retirement, death and disability benefits through a single employer, contributory defined
benefit plan. Under the plan, all full-time salaried City employees, noncertified employees of the Board of Education and all full-time uniformed and investigatory employees classified as Police Officers and Firefighters are eligible after a probationary period. General City employees are 100% vested in a pension to begin at age 60 if they terminate employment after 10 years of continuous service or after 25 years of service and attainment of age 55 or after 34 years of service regardless of age. Also, any employee terminating employment after age 50 with 25 years of service is eligible for a pension. City employees receive a retirement benefit of 2.2% of average final earnings during the highest 3 years out of the last 10 consecutive year period with a maximum of 74.8% of average earnings. Police who retire at normal retirement (after 20 years of service) receive 48% of average annual pay (highest 3 years out of last 10 consecutive years) for the first 20 years of service plus 2.2% of pay in excess of 20 years with a maximum benefit of 70% of average annual pay. Firefighters who retire at normal retirement after 20 years of service regardless of age will receive 48% of average earnings plus 2.2% of average earnings for each year over 20 with a maximum of 70% of pay. Average earnings for firefighters is defined as the average of the highest 3-year period out of the last consecutive 10-year period prior to retirement. If an employee leaves employment or dies before meeting the vesting requirements, accumulated contributions and interest are refunded. Effective benefits and contributions are established by the City as negotiated with the various unions. The General Fund and the Fire Districts Fund are used to liquidate net pension obligations.
At July 1, 2011, the plan members consisted of:
Retirees and beneficiaries currently receiving benefits 497 Terminated employees not yet receiving benefits 43 Active plan members 561 Total 1,101
B. Summary of Significant Accounting Policies, Plan Changes and Plan Asset Matters
There were no plan changes reflected in the last actuarial valuation.
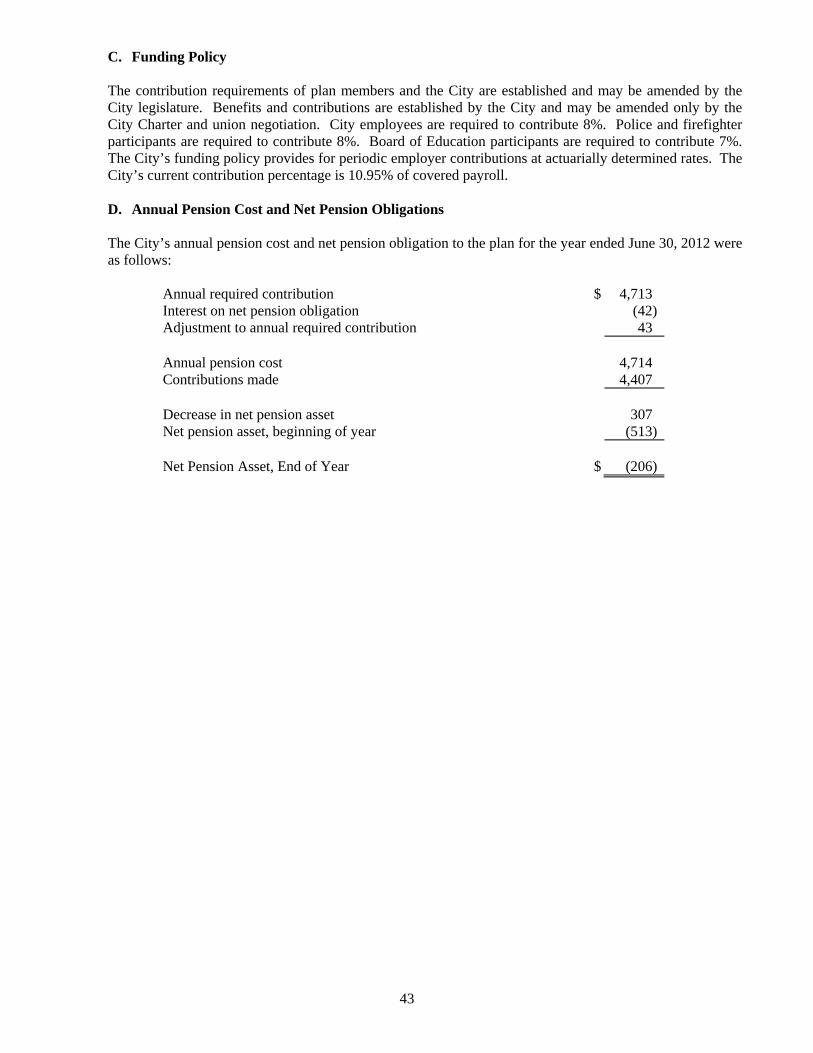
43
C. Funding Policy The contribution requirements of plan members and the City are established and may be amended by the
City legislature. Benefits and contributions are established by the City and may be amended only by the City Charter and union negotiation. City employees are required to contribute 8%. Police and firefighter participants are required to contribute 8%. Board of Education participants are required to contribute 7%. The City’s funding policy provides for periodic employer contributions at actuarially determined rates. The City’s current contribution percentage is 10.95% of covered payroll.
D. Annual Pension Cost and Net Pension Obligations The City’s annual pension cost and net pension obligation to the plan for the year ended June 30, 2012 were
as follows:
Annual required contribution $ 4,713 Interest on net pension obligation (42)Adjustment to annual required contribution 43 Annual pension cost 4,714 Contributions made 4,407 Decrease in net pension asset 307 Net pension asset, beginning of year (513) Net Pension Asset, End of Year $ (206)

44
The following is a summary of certain significant actuarial assumptions and other plan information:
Actuarial valuation date July 1, 2011 Actuarial cost method Entry Age Normal Amortization method Level Dollar, open Remaining amortization period 30 years Asset valuation method Actuarial Value Actuarial assumptions: Investment rate of return* 8.25% Projected salary increases* See graded table below:
General City Police and Fire Age Rate Age Rate 25 10.5% 25 10.5% 35 7.5% 35 7.0% 45 4.0% 45 3.5% 55 4.0% 55 2.5% 65 2.5% 65 2.5%
Contribution rates: City Determined by valuation Plan member General City 8%; Police 8%; Fire 8%; BOE 7% Turnover assumption: Age 20: 5% males, 7.5% females; Age 30: 3.75% males, 5% females; Age 35: 2.75% males, 3.75% females;
Age 40: 1.5% males, 2.5% females; Age 45: .75% males, 1.25% females;
Age 50: None Mortality table: Actives: 1994 Uninsured Pensioners Mortality Table Projected to 2019 Police and Fire Disabled: RP2000 Healthy Annuitant
Mortality Table projected to 2019 General Retirees: RP2000 Healthy Annuitant Mortality
Table projected to 2019 Term Vested: RP2000 Healthy Annuitant Mortality Table
projected to 2019 Retirement age: Age 55 with 25 years of service; age 60 with 5 years
service, or 34 years of service. Death benefits: Liabilities for police and fire employees are included in recognition of in-service death benefits Disability assumptions: Age 20: .029% males, .03% females Age 30: .048% males, .08% females Age 40: .12% males, .21% females Age 50: .36% males, .53% females Expenses: Estimate based on the prior year’s actual expenses *Inflation rate included 2%

45
E. Trend Information
Annual Net Fiscal Pension Percentage Pension Year Cost of APC Obligation Actual
Ended (APC) Contributed (Asset) Contribution
6/30/10 6/30/11 6/30/12
$ 2,397 3,645 4,714
116% 103% 94%
$ (406) (513) (206)
$ 2,771 3,752 4,407
F. Pension Plan Required Supplemental Information
Schedule of Employer Contributions
Fiscal Annual Year Required Percentage
Ended Contribution Contributed
2007 $ 2,662 106% 2008 2009 2010 2011 2012
2,921 3,037 2,397 3,644 4,713
106 106 116 103
94
Schedule of Funding Progress Unfunded Actuarial Frozen UFAL as a
Actuarial Accrued Actuarial % of Actuarial Value of Liability (AAL) Liability Funded Covered Covered
Valuation Assets Entry Age (UFAL) Ratio Payroll Payroll Date (a) (b) (b-a) (a/b) (c) ((b-a)/c)
7-1-11 $ 148,332 $ 195,652 $ 47,321 75.8% $ 33,523 141.2% 1-1-10 149,304 184,161 34,857 81.1 32,509 107.2 1-1-09 153,090 175,726 22,636 87.1 31,690 71.4 1-1-08 157,020 165,406 8,386 94.9 30,696 27.3 1-1-07 145,881 167,259 21,378 87.2 24,248 88.2 1-1-06 136,011 156,516 20,505 86.9 24,540 83.6
City of Norwich Volunteer Firefighters’ Relief Plan
A. Plan Description
The City of Norwich is the administrator of a Volunteer Firefighters Relief Plan (“Plan”), a single-employer benefit plan established and administered by the City to provide pension benefits to volunteers. The Plan is considered to be a part of the City’s financial reporting entity and is included in the financial reports as a Pension Trust Fund. Stand-alone reports are not available for this plan. The City provides benefits to Volunteer Firefighters who are at least 55 years old and have at least 20 years of credited service. Credited service is defined as a member who has responded to at least 20% of all emergency calls and 20% of all training sessions and drills. “Retirees” from the plan receive a monthly benefit of $18 multiplied by the years of credited service (to a maximum of 40 years).

46
The contribution requirements of plan members and the City are established and may be amended by the City legislature. Members are required to contribute $216 for each calendar year of credited service.
At January 1, 2012, the plan members consisted of:
Retirees and beneficiaries receiving benefits 52 Active plan members 143 Total 195
B. Summary of Significant Accounting Policies, Plan Changes and Plan Asset Matters
Basis of Accounting: The Plan uses the accrual method of accounting where revenues are recognized when earned and expenses when the liability is incurred. Plan Changes and Changes in Actuarial Assumptions: In January 2011, there was an ordinance which enhanced the benefits of the plan. The monthly benefits were increased for retirees retiring after January 1, 2011 to $18 per month per year of credited service. The maximum years of credited service was increased from 35 to 40 years. The contributions from members were increased from $180 per year to $216 per year. Method Used to Value Investments: The plan reports investments at fair value. Investment income is recognized as earned. Plan Expenses: Expenses of administering the plan are paid for by the City’s annual contribution to the plan.
C. Funding Policy
The contribution requirements of plan members and the City are established and may be amended by the City legislature. Members are required to contribute $216 for each calendar year of credited service.
D. Annual Pension Cost and Net Pension Obligations
The City’s annual pension cost and net pension obligation to the Plan for the year ended June 30, 2012 were as follows:
Annual required contribution $ 255 Interest on net pension obligation 8 Adjustment to annual required contribution (9) Annual pension cost 254 Contributions made 281 Decrease in net pension obligation (27) Net pension obligation, beginning of year 120 Net Pension Obligation, End of Year $ 93
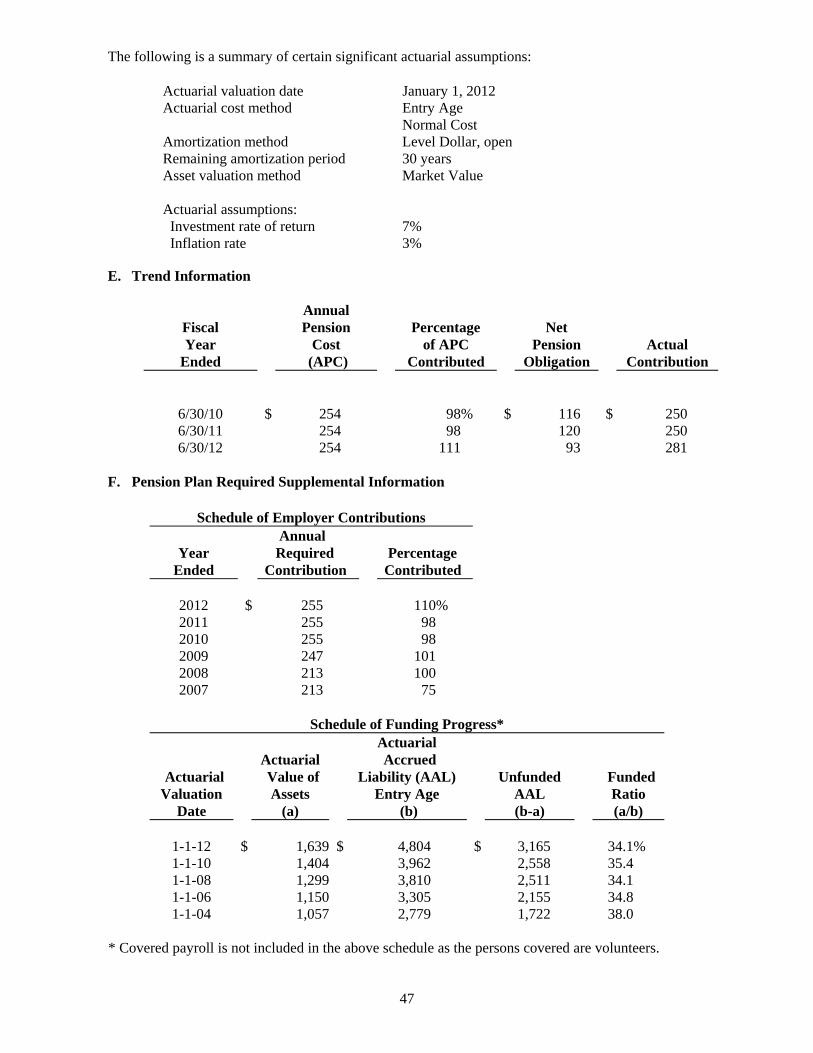
47
The following is a summary of certain significant actuarial assumptions:
Actuarial valuation date January 1, 2012 Actuarial cost method Entry Age Normal Cost Amortization method Level Dollar, open Remaining amortization period 30 years Asset valuation method Market Value Actuarial assumptions: Investment rate of return Inflation rate
7% 3%
E. Trend Information
Annual
Fiscal Pension Percentage Net Year Cost of APC Pension Actual
Ended (APC) Contributed Obligation Contribution
6/30/10
$
254
98%
$
116
$
250
6/30/11 6/30/12
254 254
98 111
120 93
250 281
F. Pension Plan Required Supplemental Information
Schedule of Employer Contributions Annual
Year Required Percentage Ended Contribution Contributed
2012 2011
$ 255 255
110% 98
2010 255 98 2009 247 101 2008 213 100 2007 213 75
Schedule of Funding Progress*
Actuarial Actuarial Accrued
Actuarial Value of Liability (AAL) Unfunded Funded Valuation Assets Entry Age AAL Ratio
Date (a) (b) (b-a) (a/b)
1-1-12 1-1-10
$ 1,6391,404
$ 4,804 3,962
$ 3,165 2,558
34.1% 35.4
1-1-08 1,299 3,810 2,511 34.1 1-1-06 1,150 3,305 2,155 34.8 1-1-04 1,057 2,779 1,722 38.0
* Covered payroll is not included in the above schedule as the persons covered are volunteers.

48
Pension Trust Funds The City maintains two pension trust funds (City and Volunteer Fire) to account for its fiduciary
responsibility. The following schedules present the net assets held in trust for pension benefits at June 30, 2012 and the changes in net assets for the year then ended.
Combining Schedule of Plan Net Assets
City Volunteer Employees Fire Total
Assets: Cash and cash equivalents $ 854 $ 16 $ 870Investments:
Mutual funds 118,235 1,581 119,816Common Stock 16,578 16,578
Due from other funds 48 1 49 Total assets 135,715 1,598 137,313
Liabilities:Accounts and other payables 26 6 32
Net Assets: Held in Trust for Pension Benefits $ 135,689 $ 1,592 $ 137,281
Combining Schedule of Changes in Plan Net Assets
City VolunteerEmployees Fire Total
Additions: Contributions:
Employer $ 4,407 $ 281 $ 4,688Plan members 2,933 15 2,948
Total contributions 7,340 296 7,636
Investment income: Net depreciation in fair value of investments (1,899) (34) (1,933) Interest and dividends 273 41 314
Total (1,626) 7 (1,619) Less investment expense (859) (7) (866)
Net investment loss (2,485) - (2,485)
Total additions 4,855 296 5,151
Deductions: Benefits 12,164 228 12,392Administrative expense 26 6 32Lump-sum distributions and withdrawals 399 4 403
Total deductions 12,589 238 12,827
Net increase (decrease) (7,734) 58 (7,676)
Net assets held in trust for pension benefits, beginning of year 143,423 1,534 144,957
Net Assets Held in Trust for Pension Benefits, End of Year $ 135,689 $ 1,592 $ 137,281

49
Teacher Retirement
The faculty and professional personnel of the Board of Education participate in the State of Connecticut Teachers’ Retirement System, a cost-sharing plan with a special funding situation, under Section 10.183 of the General Statutes of the State of Connecticut. This is a multiple employer PERS. A teacher is eligible to receive a normal retirement benefit if he or she has: 1) attained age 60 and has accumulated 20 years of credited service in the public schools of Connecticut, or 2) attained any age and has accumulated 35 years of credited service, at least 25 years of which are service in the public schools of Connecticut.
The Board of Education withholds 7.25% of all teachers’ annual salaries and transmits the funds to the State
Teachers’ Retirement Board. Certified payroll subject to retirement amounted to $20,019 or 78.5% of the total Board of Education payroll of $25,494.
The retirement system for teachers is funded by the State based upon the recommendation of the Teachers’
Retirement Board. Such contribution includes amortization of the actuarially computed unfunded liability. These obligations are established under the authority of the Connecticut General Statutes. The City does not have any liability for teacher pensions. For the year ended June 30, 2012, the City has recorded in the General Fund (Exhibit IV), intergovernmental revenue and education expenditures in the amount of $3,961 as payments made by the State of Connecticut on behalf of the City.
The State of Connecticut Teacher Retirement System is considered to be a part of the State of Connecticut
financial reporting entity and is included in the State’s financial reports as a pension trust fund. Those reports may be obtained by writing to the State of Connecticut, Office of the State Comptroller, 55 Elm Street, Hartford, Connecticut 06106.
11. OTHER POST EMPLOYMENT BENEFITS
City of Norwich, Retiree Health Plan Plan Description The City, in accordance with various collective bargaining agreements, is committed to provide health and other benefits to eligible retirees and their spouses. The Retiree Health Plan (RHP) is considered to be part of the City’s financial reporting entity and is included in the City’s financial report as the Other Post Employment Benefits Trust Fund. The plan does not issue a stand-alone financial report. The RHP is a single-employer defined benefit healthcare plan administered by the City of Norwich. The RHP provides medical, dental and life insurance benefits to eligible retirees and their spouses. All employees of the City are eligible to participate in the plan. Benefit provisions are established through negotiations between the City and the various unions representing the employees. The general fund and the Fire Districts fund are used to liquidate net other postemployment benefit obligations. At July 1, 2011, plan membership consisted of the following:
Active plan members 823 Retired plan members 377 Total Participants 1,200

50
Summary of Significant Accounting Policies Basis of Accounting - The financial statements of the Retiree Health Plan (RHP) are prepared using the accrual basis of accounting. Plan member contributions are recognized in the period in which the contributions are due. Employer contributions are recognized when due and the employer has made a formal commitment to provide the contributions. Benefits and refunds are recognized when due and payable in accordance with the terms of the plan. Administrative costs of the plan are paid by the City. Investments are reported at fair value. Investment income is recognized as earned.
Plan Expenses: Expenses of administering the plan are paid for by the plan from contributions.
Funding Policy The City has established a funding plan to incrementally increase the City’s annual contribution to full funding of the annual required contribution within six years. The City pays the full cost of life insurance premiums. The percentage contribution of plan members and the City for medical benefits are negotiated with the various unions representing the employees. Retired plan members and beneficiaries currently receiving benefits are required to contribute specified percentages towards the cost of receiving benefits under the City’s self-insured medical benefits program as follows:
City Retirees The City funds full cost of insurance for the retiree up to age 67. The retiree must pay 50% of the cost for a participating spouse. Participation in the plan ends at age 67 for both the retiree and the retiree’s spouse. Police Retirees The City funds full cost of insurance for the retiree up to age 67. The retiree must pay 50% of the cost for a participating spouse. Participation in the plan ends at age 67 for both the retiree and the retiree’s spouse. Fire Retirees Retiree annually contributes 1% of final compensation up to age 65 for retiree and spousal coverage. Participation in the plan ends at age 65 for both the retiree and the retiree’s spouse. Retired Board of Education Administrators The City funds full cost of insurance for the retiree and spouse hired before 1998 and 50% of the cost if retiree was hired between 1998 and 2004. City funds full cost for post-65 coverage. Spouse coverage continues on after the death of the retiree up to age 70. Retired Teachers The City funds full cost of insurance for the retiree and spouse hired before September 1, 1995 and 50% of the cost if hired between September 1, 1995 and July 1, 2004. Participation in the plan ends at age 70 for both the retiree and the retiree’s spouse. Retired Board of Education Custodians The City funds full cost of insurance for the retiree and spouse hired before 1998 and 50% of the cost if retiree was hired between 1998 and 2004. Spouse coverage ends upon death of the retiree.

51
Retired Board of Education Nurses The City funds 50% of the cost depending on the plan selected. Coverage ends at age 65. Retired Board of Education Secretaries The City funds full cost of insurance for the retiree and spouse hired before September 1, 1995 and 50% of the cost if hired between September 1, 1995 and July 1, 2004. City funds full cost for post-65 coverage. Participation in the plan ends at age 70 for both the retiree and the retiree’s spouse. Retired Board of Education Teamsters The City funds full cost of insurance for the retiree and spouse hired before July 1, 2006 and 50% of the cost if hired after July 1, 2006. Participation in the plan ends at age 65 for both the retiree and the retiree’s spouse.
For the year ended June 30, 2012, plan members contributed $1,444. The City is required to contribute the balance of the current premium cost and may contribute an additional amount as determined by the City in order to prefund benefits. Employer contributions to the plan for the year ended June 30, 2012 totaled $4,114. Annual OPEB Cost and Net OPEB Obligations The City of Norwich’s annual other postemployment benefit (OPEB) cost is calculated based on the annual required contribution (ARC), an amount actuarially determined in accordance with the parameters of GASB Statement 45. The ARC represents a level of funding that, if paid on an ongoing basis, is projected to cover normal cost each year and amortize any unfunded actuarial liabilities (or funding excess) over a period not to exceed 30 years. The following table shows the components of the City’s annual OPEB cost for the year, the amount actually contributed to the plan, and changes in the City’s net OPEB obligation (asset):
Retiree Health Plan Annual required contribution (ARC) $ 6,184 Interest on net OPEB obligation 354 Adjustment to annual required contribution (364) Annual OPEB cost 6,174 Contributions made 6,114 Increase in net OPEB obligation 60 Net OPEB obligation, beginning of year 4,430 Net OPEB Obligation, End of Year $ 4,490

52
The City’s annual OPEB cost, the percentage of annual OPEB cost contributed to the plan, and the net OPEB obligation is presented below.
Annual Percentage Year OPEB Actual of AOC OPEB
Ended Cost (AOC) Contribution Contributed Obligation
6/30/10 6/30/11 6/30/12
$ 5,347 6,057 6,174
$ 3,690 5,251 6,114
69.0% 87.0 99.0
$ 3,624 4,430 4,490
Actuarial valuations of an ongoing plan involve estimates of the value of reported amounts and Assumptions about the probability of occurrence of events far into the future. Examples include assumptions about future employment, mortality and the healthcare cost trend. Amounts determined regarding the funded status of the plan and the annual required contributions of the employer are subject to continual revision as accrual results are compared with past expectations and new estimates are made about the future. The schedule of funding progress, presented below, presents multi-year trend information about whether the actuarial value of plan assets is increasing or decreasing over time relative to the actuarial accrued liabilities for benefits. Data is only presented for July 1, 2007 and July 1, 2009 because they are the only valuations done since implementing the standard.
Schedule of Funding Progress
Actuarial UFAL as a Actuarial Accrued % of
Actuarial Value of Liability (AAL) Funded Covered Covered Valuation Assets Entry Age Ratio Payroll Payroll
Date (a) (b) (a/b) (c) ((b-a)/c)
7-1-07 7-1-09 7-1-11
$ - 2,594 4,405
$ 46,595 58,239 57,618
0% 4.7 7.6
$ 44,92150,37450,093
103.7% 110.5 106.2
Schedule of Employer Contributions
Annual Year Required Percentage
Ended Contribution Contributed 6/30/2008 $ 5,352 98.8% 6/30/2009 5,352 63.5 6/30/2010 5,352 63.4 6/30/2011 6,065 87.0 6/30/2012 6,184 99.0
Projections for benefits for financial reporting purposes are based on the substantive plan (the plan as understood by the employer and plan members) and include the types of benefits provided at the time of each valuation and the historical pattern of sharing benefit costs between the employer and plan members to that point. The actuarial methods and assumptions used include techniques that are designed to reduce the effects of short-term volatility in actuarial accrued liabilities and the actuarial value of assets, consistent with the long-term perspective of the calculations.

53
In the July 1, 2011 actuarial valuation, the projected unit credit actuarial cost method was used. The actuarial assumptions include an 8.0% investment rate of return, which is the rate of the expected long-term investment returns of plan assets calculated based on the funding policy of the plan at the valuation date. The annual healthcare cost trend rate is 10% initially, decreasing 1% per year to an ultimate rate of 5% for 2016 and later. The dental inflation rate is 5%. The general inflation assumption is 3.0%. The UAAL is being amortized as a level dollar basis. The amortization period at July 1, 2011 was 30 years.
12. JOINTLY GOVERNED AND RELATED ORGANIZATIONS
Connecticut Municipal Electric Energy Cooperative (CMEEC)
CMEEC is a public corporation organized in 1976 under Connecticut Public Act 75-634, subsequently enacted as Title 7-233, Chapter 101a of the General Statutes of Connecticut, as amended. It is empowered to undertake the planning, financing, acquisition, construction and operation of facilities for the generation and transmission of electric power and energy for its member utilities, including the City of Norwich, Department of Public Utilities and others. CMEEC may issue bonds in its own name. Under the bylaws of CMEEC, a Board of Directors comprised of representatives from the participating members was established. The bylaws were amended in 1995 to allow for participation of representation from the Town of Wallingford on the Board of Directors. CMEEC’s Board is comprised of nineteen (19) representatives and officers. The governing board consists of representatives appointed by each of the participating members and assumes all the management decisions. Two representatives from the City of Norwich, Department of Public Utilities serve on the Board. The CMEEC Board acts as a regulatory body in that it reviews and approves recovery of costs in rates on an annual basis. CMEEC has entered into power sales contracts with each of the members including the City of Norwich Department of Public Utilities. Under the contracts, each of the member utilities have agreed to purchase essentially all of its electric power required for resale from CMEEC, with CMEEC’s electric revenues to consist of billings for resale of power. The contracts obligate each member uitility to pay for their share of CMEEC’s fixed costs, which consist primarily of debt service and CMEEC administrative and general costs on a take or pay basis. The member utilities maintain this fixed cost obligation whether or not they take any power from CMEEC. The amount of power purchased from CMEEC for the fiscal year ended June 30, 2012 was $34.0 million. On July 1, 2006, the City of Norwich, Department of Public Utilities entered into a contract for the sale of Pierce Project Electric Power & Energy (the Pierce Contract). Under the terms of the Pierce Contract, the City of Norwich, Department of Public Utilities receives its allocable share of all electric products and benefits and pays its share of all costs associated with the project.
During the 2012 fiscal year, CMEEC and its members became participants in the Regional Greenhouse Gas Initiative Fund (RGGI), which is an initiative that implements the carbon dioxide (CO2) cap and trading program as proposed by the RGGI in Connecticut. During the 2012 fiscal year, the Department’s contributions to the fund totaled $56 and drawdowns were 67. The balance of the Department’s funds held by CMEEC for the RGGI was $5 for the year ended June 30, 2012.
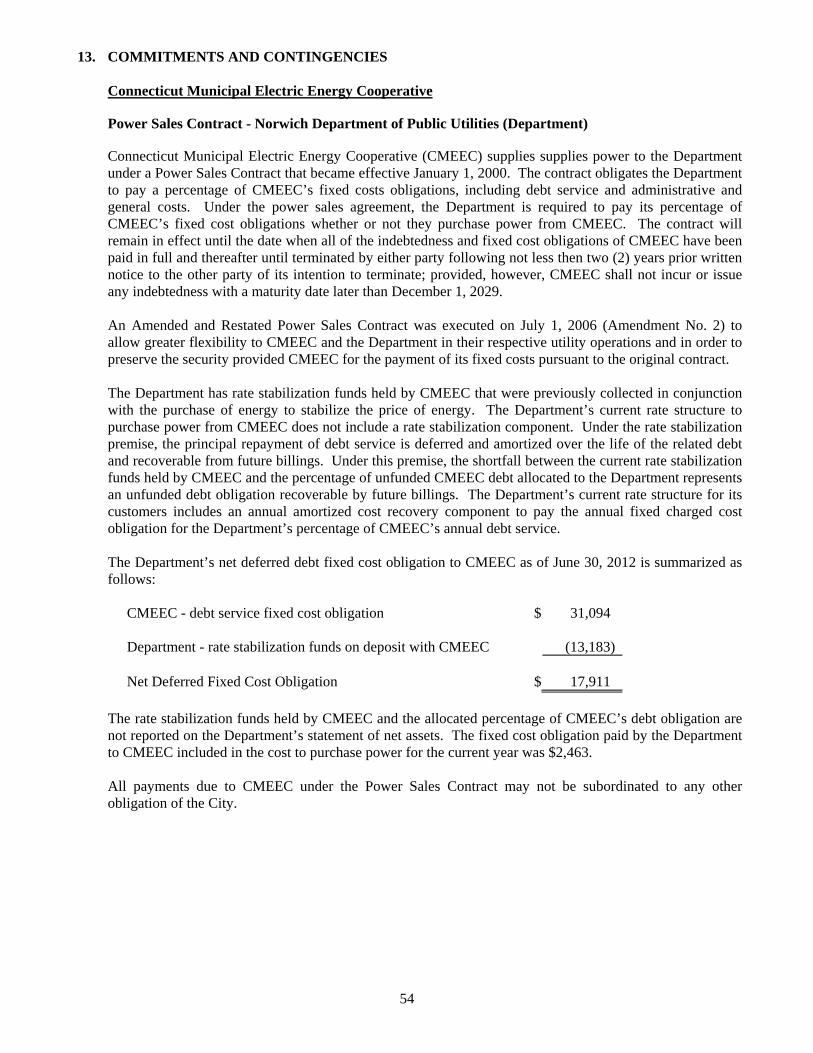
54
13. COMMITMENTS AND CONTINGENCIES Connecticut Municipal Electric Energy Cooperative
Power Sales Contract - Norwich Department of Public Utilities (Department) Connecticut Municipal Electric Energy Cooperative (CMEEC) supplies supplies power to the Department
under a Power Sales Contract that became effective January 1, 2000. The contract obligates the Department to pay a percentage of CMEEC’s fixed costs obligations, including debt service and administrative and general costs. Under the power sales agreement, the Department is required to pay its percentage of CMEEC’s fixed cost obligations whether or not they purchase power from CMEEC. The contract will remain in effect until the date when all of the indebtedness and fixed cost obligations of CMEEC have been paid in full and thereafter until terminated by either party following not less then two (2) years prior written notice to the other party of its intention to terminate; provided, however, CMEEC shall not incur or issue any indebtedness with a maturity date later than December 1, 2029.
An Amended and Restated Power Sales Contract was executed on July 1, 2006 (Amendment No. 2) to
allow greater flexibility to CMEEC and the Department in their respective utility operations and in order to preserve the security provided CMEEC for the payment of its fixed costs pursuant to the original contract.
The Department has rate stabilization funds held by CMEEC that were previously collected in conjunction
with the purchase of energy to stabilize the price of energy. The Department’s current rate structure to purchase power from CMEEC does not include a rate stabilization component. Under the rate stabilization premise, the principal repayment of debt service is deferred and amortized over the life of the related debt and recoverable from future billings. Under this premise, the shortfall between the current rate stabilization funds held by CMEEC and the percentage of unfunded CMEEC debt allocated to the Department represents an unfunded debt obligation recoverable by future billings. The Department’s current rate structure for its customers includes an annual amortized cost recovery component to pay the annual fixed charged cost obligation for the Department’s percentage of CMEEC’s annual debt service.
The Department’s net deferred debt fixed cost obligation to CMEEC as of June 30, 2012 is summarized as follows:
CMEEC - debt service fixed cost obligation $ 31,094
Department - rate stabilization funds on deposit with CMEEC (13,183)
Net Deferred Fixed Cost Obligation $ 17,911
The rate stabilization funds held by CMEEC and the allocated percentage of CMEEC’s debt obligation are not reported on the Department’s statement of net assets. The fixed cost obligation paid by the Department to CMEEC included in the cost to purchase power for the current year was $2,463.
All payments due to CMEEC under the Power Sales Contract may not be subordinated to any other
obligation of the City.

55
Pierce Plant Special Project - Connecticut Municipal Electric Energy Cooperative (CMEEC) Pursuant to Section 5 “New Projects” of the Amended and Restated Power Sales Contract, dated July 1,
2006, the Department authorized CMEEC to include the Department’s entitlement allocation in a project to construct a peaking electric generating facility. The Pierce Repowering Project is a considered a “New Project” under terms of the Power Sales Contract, for which the Department is obligated to a new fixed cost obligation. CMEEC issued $42.5 million of revenue bonds to finance the project. The Department’s entitlement allocation was authorized to be no less than 18.65% and no more than 21.67%. In January 2008, the Pierce Plant became operational and a monthly net benefit for the Department’s estimated annual entitlement allocation was set by CMEEC. The initial benefit rate was established at 1.48 per MWH of electric power purchased by the Department from CMEEC. For the fiscal year ended June 30, 2012, the Department realized a net loss of $927 from the Pierce Plant Project recognized as credit to the Department’s purchase power expense.
Municipal Solid Waste Management Services Contract The City has entered into the municipal solid waste management services contract, as amended (the service
contract) with the Southeastern Connecticut Regional Resources Recovery Authority (the Authority) pursuant to which it participates with ten other Connecticut Municipalities (the eleven constituting the Contracting Municipalities), in the Southeastern Connecticut System (the System). The System consists of a mass-burn solid waste disposal and electric generation facility located in the Town of Preston (the Facility) and various improvements and facilities related thereto, including landfills. The Facility is complete and presently receiving waste from Contracting Municipalities.
Under the service contract, the City is required to deliver, or cause to be delivered, to the System solid waste generated within its boundaries up to its minimum commitment of 23 thousand tons per year and to pay a uniform per ton disposal service payment (the service payment). The aggregate minimum commitment of the eleven Contracting Municipalities is approximately 154 thousand tons per year.
The service payment applicable in any contract year is calculated by estimating the net cost of operation,
which is the cost of operation less revenues other than service payments, as such terms are defined in the service contract. The sum of all service payments and other payments from the Contracting Municipalities are required to be sufficient to pay or provide for the net cost of operations.
Service payments shall be payable so long as the system is accepting solid waste delivered by or on behalf
of the City, whether or not such solid waste is processed at the facility. The City has pledged its full faith and credit to the payment of service payments and has also agreed to enforce or levy and collect all taxes, cost sharing or other assessments or charges and take all such other action as may be necessary to provide for the payment of the service payments.
14. LITIGATION There are several lawsuits pending against the City. The outcome and eventual liability of the City, if
any, in these cases is not known at this time. Based upon consultation with legal counsel, the City’s management estimates that potential claims against the City, not covered by insurance, resulting from such litigation would not have a material adverse effect on the financial position of the City.

56
15. PRIOR PERIOD ADJUSTMENT - RESTATEMENT OF NET ASSETS The Department of Public Utilities Fund had historically recorded the bonds payable for the 1997 and
1999 general obligation bonds. In 2012, it was determined that this debt should be accounted for in the Governmental Activities opinion unit. The balance of the bonds payable as of June 30, 2011 was $4,436. The Department of Public Utilities Fund received $1,756 in clean water loan funds from the state of Connecticut in 2011 which were recorded as capital contributions. In 2012 the beginning balance of notes payable was adjusted to account for these loan proceeds. In the current year it was determined that there was an asset acquired several years prior in the Department of Public Utilities Fund which was not reflected in the financial statements. The value of the asset is $2,904 with accumulated depreciation of $1,452 resulting in a net increase to net assets of $1,452.
The following represents the effects of these restatements:
Net assets as reported in 2011 financial statements $ 103,528 $ 115,657 $ 105,340 $ 324,525
Prior period adjustment - reclassification of general obligation debt (4,436) 4,436 4,436
Prior period adjustment - recognition of clean water loan proceeds as debt (1,756) (1,756)
Prior period adjustment - recognition of capital asset acquisition acquired in a previous period 1,452 1,452
Net Assets, Beginning of the Year, as Restated $ 99,092 $ 119,789 $ 109,472 $ 324,525
Department of Public Utilities
Governmental Activities
Business-Type Activities Total
Opinion Unit

Required Supplementary Information

RSI-1CITY OF NORWICH, CONNECTICUT
GENERAL FUND
SCHEDULE OF REVENUES AND OTHER FINANCING SOURCESBUDGET AND ACTUAL (NON-GAAP BUDGETARY BASIS)
FOR THE YEAR ENDED JUNE 30, 2012
(In Thousands)
VarianceFavorable
Original Final Actual (Unfavorable)
General property taxes: Current tax levy $ 56,517 $ 56,517 $ 56,617 $ 100Motor vehicle supplement 500 500 474 (26) Prior years levy 1,375 1,375 1,378 3Interest and liens 750 750 775 25
Total 59,142 59,142 59,244 102
Licenses, permits and fees: Miscellaneous permits and fees 500 500 495 (5)
Intergovernmental revenues: Building maintenance 245 245 317 72City housing 83 83 87 4Municipal revenue sharing 272 272 113 (159) Pequot funds 581 581 607 26Total disability 3 3 3 - Payment in lieu of taxes 1,459 1,459 1,457 (2) Elderly taxes 154 154 154 - Youth Services 88 88 88 - School bond interest 117 117 117 - Veterans exemptions 10 10 10 - Federal DCPA match funds 19 19 18 (1) Health services 165 165 123 (42) LOCIP 295 295 317 22Transportation 687 687 727 40Special education 2,100 2,100 2,241 141Education cost sharing 32,317 32,317 32,111 (206) Town aid road 237 237 238 1Services to Blind 14 14
Total 38,832 38,832 38,742 (90)
Charges for services: Town Clerk - recording fees 350 350 351 1Town Clerk - conveyance tax 263 263 363 100Land recording capital improvement fee 25 25 15 (10) Probate court 22 22 22 - Landfill 1,085 1,085 1,026 (59) City property - relocation 70 70 109 39Police outside services 120 120 167 47Senior Citizens Center 22 22 17 (5) Parking commission 90 90 90 - Tuition 75 75 109 34
Total 2,122 2,122 2,269 147
Use of money: Interest from investments 80 80 7 (73)
(Continued on next page)
Budgeted Amounts
57

RSI-1CITY OF NORWICH, CONNECTICUT
GENERAL FUND
SCHEDULE OF REVENUES AND OTHER FINANCING SOURCESBUDGET AND ACTUAL (NON-GAAP BUDGETARY BASIS) (CONTINUED)
FOR THE YEAR ENDED JUNE 30, 2012
(In Thousands)
VarianceFavorable
Original Final Actual (Unfavorable)
Other revenue:Sewer assessments $ 500 $ 500 $ 529 $ 29In lieu of taxes/telephone 10 10 140 130NGCA debt service 33 33 33 - Public utilities 10% 6,908 6,908 6,908 - DPU - City service 88 88 88 - Bond and note payments 92 92 92 - Traffic violations 12 12 7 (5) Miscellaneous 233 233 263 30
Total 7,876 7,876 8,060 184
Total revenues 108,552 108,552 108,817 265
Other financing sources:Transfers in:
Cemetery Trust 57 57 57 -
Total $ 108,609 $ 108,609 108,874 $ 265
Budgetary revenues are different than GAAP revenues because: State of Connecticut on-behalf contributions to the Connecticut State Teachers’
Retirement System for City teachers are not budgeted. 3,961Under liquidation of prior year encumbrances is recorded as miscellaneous revenue for
budgetary reporting. This amount is excluded for financial reporting purposes. (17)
Total Revenues and Other Financing Sources as Reported on the Statement of Revenues, Expenditures and Changes in Fund Balances - Governmental Funds - Exhibit IV $ 112,818
Budgeted Amounts
58

RSI-2CITY OF NORWICH, CONNECTICUT
GENERAL FUND
SCHEDULE OF EXPENDITURES AND OTHER FINANCING USESBUDGET AND ACTUAL (NON-GAAP BUDGETARY BASIS)
FOR THE YEAR ENDED JUNE 30, 2012(In Thousands)
VarianceFavorable
Original Final Actual (Unfavorable)
General government: City Manager $ 264 $ 264 $ 261 $ 3Finance 1,270 1,270 1,266 4City Treasurer 204 204 203 1Assessment 361 361 356 5Personnel 370 370 367 3Law 420 420 413 7City Clerk 341 364 360 4City Council 347 392 366 26Election 110 109 107 2Planning and Neighborhood Services 895 896 889 7Emergency Management 51 56 55 1
Total general government 4,633 4,706 4,643 63
Public safety: Police 11,040 11,249 11,224 25Fire:
East Great Plain 110 110 90 20Laurel Hill 46 47 46 1Occum 63 63 54 9Taftville 115 121 115 6Yantic 114 122 121 1Fire Central 1,827 1,827 1,814 13
Total public safety 13,315 13,539 13,464 75
Social Services: Recreation 551 604 594 10Human services 601 601 598 3Senior Citizens Center 503 506 498 8Youth and Family Services 178 178 170 8
Total social services 1,833 1,889 1,860 29
Public works: Engineering and administration 515 521 501 20Fleet maintenance 1,170 1,194 1,171 23Solid waste 2,687 2,707 2,698 9Maintenance and cleaning 3,571 3,381 3,392 (11) Building maintenance 991 1,083 1,080 3Parking maintenance 117 119 125 (6)
Total public works 9,051 9,005 8,967 38
Board of Education 68,163 68,163 68,163 -
(Continued on next page)
Budgeted Amounts
59

RSI-2CITY OF NORWICH, CONNECTICUT
GENERAL FUND
SCHEDULE OF EXPENDITURES AND OTHER FINANCING USESBUDGET AND ACTUAL (NON-GAAP BUDGETARY BASIS) (CONTINUED)
FOR THE YEAR ENDED JUNE 30, 2012(In Thousands)
VarianceFavorable
Original Final Actual (Unfavorable)
Other $ 7,343 $ 7,099 $ 7,147 $ (48)
Debt Service: Principal 3,970 3,970 3,970 - Interest 1,001 938 938 -
Total debt service 4,971 4,908 4,908 -
Total $ 109,309 $ 109,309 109,152 $ 157
Budgetary expenditures are different than GAAP expenditures because: State of Connecticut on-behalf payments to the Connecticut State Teachers’
Retirement System for City teachers are not budgeted. 3,961Encumbrances for purchases and commitments ordered but not received are
reported in the year the order is placed for budgetary purposes, but in the year received for financial reporting purposes. (256)
Encumbrances for purchases and commitments ordered in the previous year that were received and liquidated in the current year are reported for financial statement reporting purposes. 153
Total Expenditures and Other Financing Uses as Reported on the Statement of Revenues, Expenditures, and Changes in Fund Balances - Governmental Funds - Exhibit IV $ 113,010
Budgeted Amounts
60

Combining and Individual Fund Statements and Schedules

General Fund

GENERAL FUND
The General Fund is used to account for resources traditionally associated with government
which are not required legally or by sound financial management to be accounted for in
another fund.

CITY OF NORWICH, CONNECTICUT
GENERAL FUND
COMPARATIVE BALANCE SHEET
JUNE 30, 2012 AND 2011(In Thousands)
2012 2011
ASSETS
Cash and cash equivalents $ 18,368 $ 11,292Investments 1,952 3,193Receivables:
Property taxes receivable, net 3,490 3,600Property taxes accrued interest receivable, net 1,092 1,122Intergovernmental receivable:
School building grants receivable 198 300Other grants receivable 795 13
Assessment receivable 3,067 3,451Accounts receivable, net 349 357
Due from other funds 9,199 15,507
Total Assets $ 38,510 $ 38,835
LIABILITIES AND FUND BALANCE
Liabilities:Accounts payable and accrued expenses $ 5,275 $ 4,639Due to other funds 14,835 15,255Deferred revenue 7,765 8,114
Total liabilities 27,875 28,008
Fund balance:Assigned 264 178Unassigned 10,371 10,649
Total fund balance 10,635 10,827
Total Liabilities and Fund Balance $ 38,510 $ 38,835
EXHIBIT A-1
61
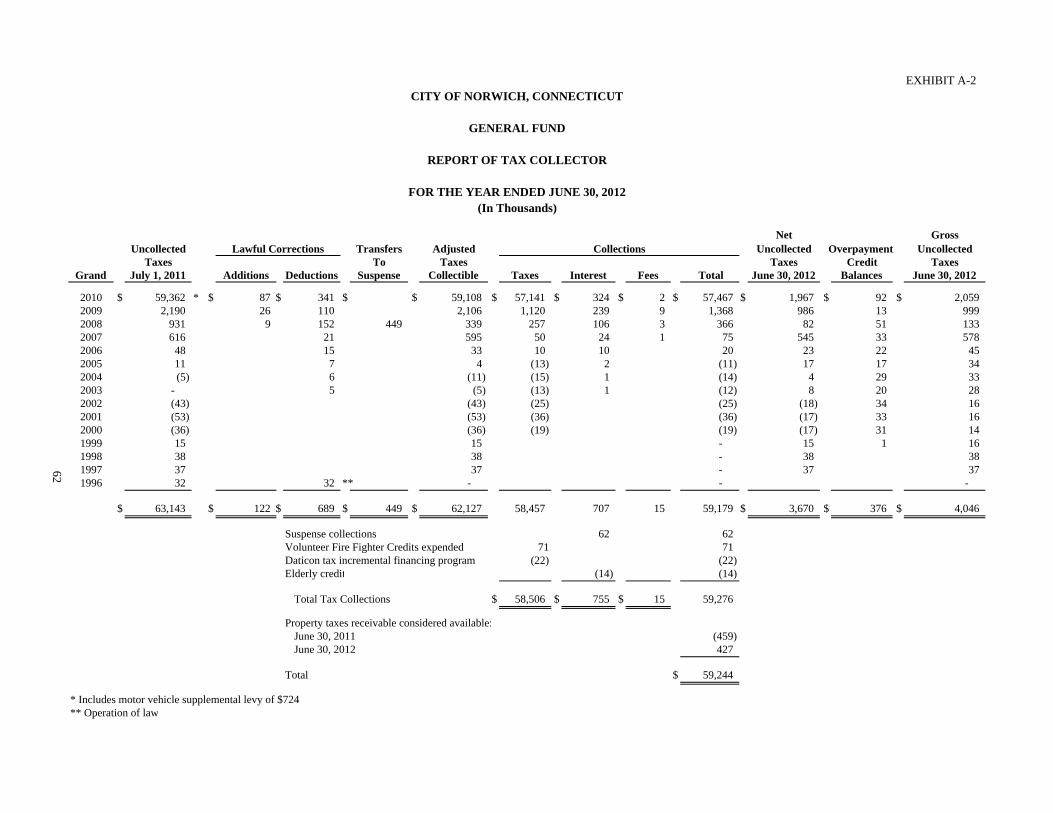
EXHIBIT A-2CITY OF NORWICH, CONNECTICUT
Net GrossUncollected Lawful Corrections Transfers Adjusted Collections Uncollected Overpayment Uncollected
Taxes To Taxes Taxes Credit TaxesGrand July 1, 2011 Additions Deductions Suspense Collectible Taxes Interest Fees Total June 30, 2012 Balances June 30, 2012
2010 $ 59,362 * $ 87 $ 341 $ $ 59,108 $ 57,141 $ 324 $ 2 $ 57,467 $ 1,967 $ 92 $ 2,059 2009 2,190 26 110 2,106 1,120 239 9 1,368 986 13 999 2008 931 9 152 449 339 257 106 3 366 82 51 133 2007 616 21 595 50 24 1 75 545 33 578 2006 48 15 33 10 10 20 23 22 45 2005 11 7 4 (13) 2 (11) 17 17 34 2004 (5) 6 (11) (15) 1 (14) 4 29 33 2003 - 5 (5) (13) 1 (12) 8 20 28 2002 (43) (43) (25) (25) (18) 34 16 2001 (53) (53) (36) (36) (17) 33 16 2000 (36) (36) (19) (19) (17) 31 14 1999 15 15 - 15 1 16 1998 38 38 - 38 38 1997 37 37 - 37 37 1996 32 32 ** - - -
$ 63,143 $ 122 $ 689 $ 449 $ 62,127 58,457 707 15 59,179 $ 3,670 $ 376 $ 4,046
Suspense collections 62 62 Volunteer Fire Fighter Credits expended 71 71 Daticon tax incremental financing program (22) (22) Elderly credit (14) (14)
Total Tax Collections $ 58,506 $ 755 $ 15 59,276
Property taxes receivable considered available:June 30, 2011 (459) June 30, 2012 427
Total $ 59,244
* Includes motor vehicle supplemental levy of $724** Operation of law
62
GENERAL FUND
REPORT OF TAX COLLECTOR
FOR THE YEAR ENDED JUNE 30, 2012(In Thousands)

Nonmajor Governmental Funds

NONMAJOR GOVERNMENTAL FUNDS
Special Revenue Funds Special Revenue Funds are used to account for the proceeds of specific revenue sources that are designated or legally restricted to expenditures for specific purposes. The nature and purpose of each special revenue fund is as follows:
Fund Funding Source Function Dog License License fees Operation of dog pound School Lunch Program State and Federal grants, program income Operations of the school lunch
program Sidewalk Charges for service and City appropriation Sidewalk replacement Fire Districts Taxes, charges for service and State grants Fire and refuse services Education Grants Federal and State grants Specific education programs Adult Education Federal and State grants Adult Education programs Emergency Management Grants Federal grants Emergency management activities Parking Commission Charges for service and fees City parking authority Youth Services Federal and State grants, contributions and
charges for service Youth Service Bureau
C.O.P.S. Grant Federal grant Public safety Lead Paint Abatement Federal grant and program income Removal and disposal of lead paint Other Grants and Programs Various Miscellaneous activities Economic Development Contributions Economic development Community Development Federal grant and program income Social services Education Programs State grants and contributions Miscellaneous education activities Fire Grants and Programs Federal grants Fire equipment and supplies Police Asset Forfeiture Federal and State grants Drug enforcement and education Police Grants and Programs Federal and State grants and contributions Police equipment and enforcement Recreation Grants and Programs Charges for service Recreational programs and activities Social Services Grants and Programs Federal and State grants and contributions Health and welfare assistance Senior Citizens Programs Charges for service and contributions Senior Citizens functions and
activities Mohegan Park Charges for service, state grant and
investment income Mohegan Park improvements and programs
Sachem Fund Transfers in from other funds and donations Economic and cultural improvement Property Rehabilitation Transfers in from other funds and program
income Housing assistance
Brown Park Trust and investment income Maintenance and improvement of Brown Park
Capital Projects Funds
Capital Projects Funds are established in the City of Norwich pursuant to local resolutions authorizing specific capital projects. Funding sources are generally comprised of City appropriated transfers from the General Fund, the receipt of intergovernmental grants and proceeds from the sale of bonds. Expenditures relate to the expansion, improvement or replacement of the City’s capital assets.
Permanent Funds Permanent funds are used to report resources that are legally restricted to the extent that only earnings, not principal, may be used for purposes that support the reporting government’s programs.
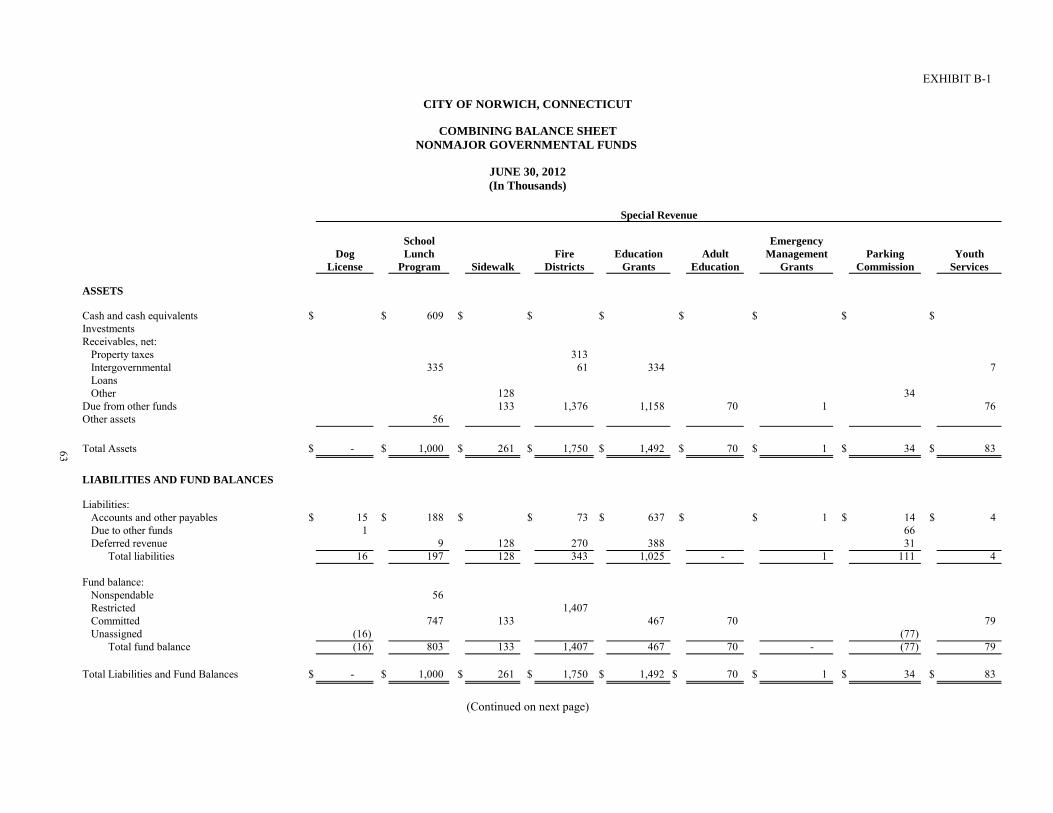
EXHIBIT B-1
CITY OF NORWICH, CONNECTICUT
COMBINING BALANCE SHEETNONMAJOR GOVERNMENTAL FUNDS
JUNE 30, 2012(In Thousands)
School EmergencyDog Lunch Fire Education Adult Management Parking Youth
License Program Sidewalk Districts Grants Education Grants Commission Services
ASSETS
Cash and cash equivalents $ $ 609 $ $ $ $ $ $ $Investments Receivables, net:
Property taxes 313Intergovernmental 335 61 334 7Loans Other 128 34
Due from other funds 133 1,376 1,158 70 1 76Other assets 56
Total Assets $ - $ 1,000 $ 261 $ 1,750 $ 1,492 $ 70 $ 1 $ 34 $ 836
Special Revenue
ota ssets $ $ ,000 $ 6 $ ,750 $ , 9 $ 70 $ $ 3 $ 83
LIABILITIES AND FUND BALANCES
Liabilities: Accounts and other payables $ 15 $ 188 $ $ 73 $ 637 $ $ 1 $ 14 $ 4Due to other funds 1 66 Deferred revenue 9 128 270 388 31
Total liabilities 16 197 128 343 1,025 - 1 111 4
Fund balance: Nonspendable 56Restricted 1,407Committed 747 133 467 70 79Unassigned (16) (77)
Total fund balance (16) 803 133 1,407 467 70 - (77) 79
Total Liabilities and Fund Balances $ - $ 1,000 $ 261 $ 1,750 $ 1,492 $ 70 $ 1 $ 34 $ 83
(Continued on next page)
63
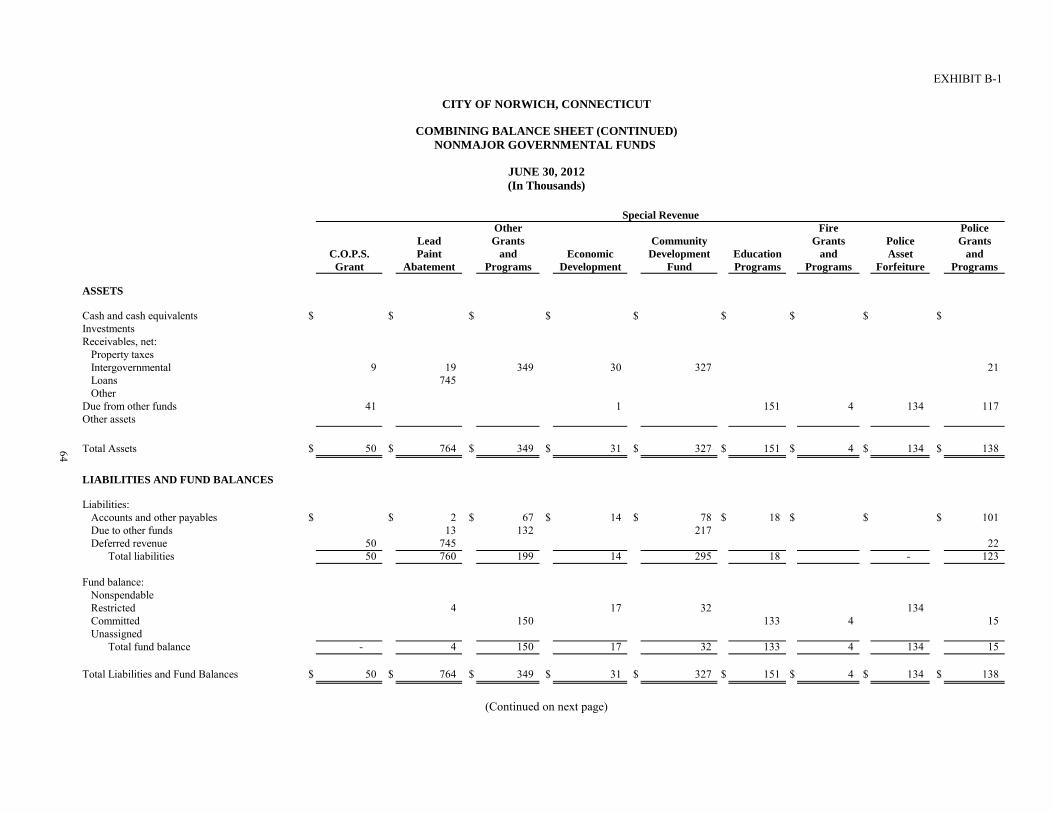
ASSETS
Cash and cash equivalents Investments Receivables, net:
Property taxes Intergovernmental Loans Other
Due from other funds Other assets
Total Assets
EXHIBIT B-1
CITY OF NORWICH, CONNECTICUT
COMBINING BALANCE SHEET (CONTINUED)NONMAJOR GOVERNMENTAL FUNDS
JUNE 30, 2012(In Thousands)
Other Fire PoliceLead Grants Community Grants Police Grants
C.O.P.S. Paint and Economic Development Education and Asset andGrant Abatement Programs Development Fund Programs Programs Forfeiture Programs
$ $ $ $ $ $ $ $ $
9 19 349 30 327 21745
41 1 151 4 134 117
$ 50 $ 764 $ 349 $ 31 $ 327 $ 151 $ 4 $ 134 $ 138
Special Revenue
ota ssets
LIABILITIES AND FUND BALANCES
Liabilities: Accounts and other payables Due to other funds Deferred revenue
Total liabilities
Fund balance: NonspendableRestrictedCommittedUnassigned
Total fund balance
Total Liabilities and Fund Balances
64 $ 50 $ 76 $ 3 9 $ 3 $ 3 7 $ 5 $ $ 3 $ 38
$ $ 2 $ 67 $ 14 $ 78 $ 18 $ $ $ 10113 132 217
50 745 2250 760 199 14 295 18 - 123
4 17 32 134150 133 4 15
- 4 150 17 32 133 4 134 15
$ 50 $ 764 $ 349 $ 31 $ 327 $ 151 $ 4 $ 134 $ 138
(Continued on next page)

ASSETS
Cash and cash equivalents Investments Receivables, net:
Property taxes Intergovernmental Loans Other
Due from other funds Other assets
Total Assets 6
EXHIBIT B-1
CITY OF NORWICH, CONNECTICUT
COMBINING BALANCE SHEET (CONTINUED)NONMAJOR GOVERNMENTAL FUNDS
JUNE 30, 2012(In Thousands)
Recreation SocialGrants Services Senior
and Grants and Citizens Mohegan Sachem Property BrownPrograms Programs Programs Park Fund Rehabilitation Park Total
$ $ $ $ $ $ $ $ 609-
3131,492
1,925 2,670 162
167 62 99 122 192 26 42 3,97256
$ 167 $ 62 $ 99 $ 122 $ 192 $ 1,951 $ 42 $ 9,274
Special Revenue
ota ssets
LIABILITIES AND FUND BALANCES
Liabilities: Accounts and other payables Due to other funds Deferred revenue
Total liabilities
Fund balance: NonspendableRestrictedCommittedUnassigned
Total fund balance
Total Liabilities and Fund Balances
65 $ 67 $ 6 $ 99 $ $ 9 $ ,95 $ $ 9, 7
$ 8 $ $ 2 $ $ $ 36 $ $ 1,25843 472
1,925 3,5688 - 2 - - 2,004 - 5,298
5642 1,636
159 62 97 122 192 2,430(53) (146)
159 62 97 122 192 (53) 42 3,976
$ 167 $ 62 $ 99 $ 122 $ 192 $ 1,951 $ 42 $ 9,274
(Continued on next page)

ASSETS
Cash and cash equivalents Investments Receivables, net:
Property taxes Intergovernmental Loans Other
Due from other funds Other assets
Total Assets 66
EXHIBIT B-1
CITY OF NORWICH, CONNECTICUT
COMBINING BALANCE SHEET (CONTINUED)NONMAJOR GOVERNMENTAL FUNDS
JUNE 30, 2012(In Thousands)
Capital Projects Permanent Total
NonmajorCapital Landfill Public Parks Fred Abbot Cemetery Governmental
Improvement Closure Total & Gardens Summer Concert Trust Total Funds
$ $ $ - $ $ $ 103 $ 103 $ 712- 1,320 1,320 1,320
- - 31313 203 216 - 1,708
- - 2,670- - 162
1,733 56 1,789 40 5 45 5,806- - 56
$ 1,746 $ 259 $ 2,005 $ 40 $ 5 $ 1,423 $ 1,468 $ 12,747ota ssets
LIABILITIES AND FUND BALANCES
Liabilities: Accounts and other payables Due to other funds Deferred revenue
Total liabilities
Fund balance: NonspendableRestrictedCommittedUnassigned
Total fund balance
Total Liabilities and Fund Balances
$ ,7 6 $ 59 $ ,005 $ 0 $ 5 $ , 3 $ , 68 $ ,7 7
$ 164 $ $ 164 $ $ $ $ - $ 1,422 - 53 53 525
- - 3,568164 - 164 - - 53 53 5,515
- 12 5 1,370 1,387 1,443- 28 28 1,664
1,582 259 1,841 - 4,271- - (146)
1,582 259 1,841 40 5 1,370 1,415 7,232
$ 1,746 $ 259 $ 2,005 $ 40 $ 5 $ 1,423 $ 1,468 $ 12,747
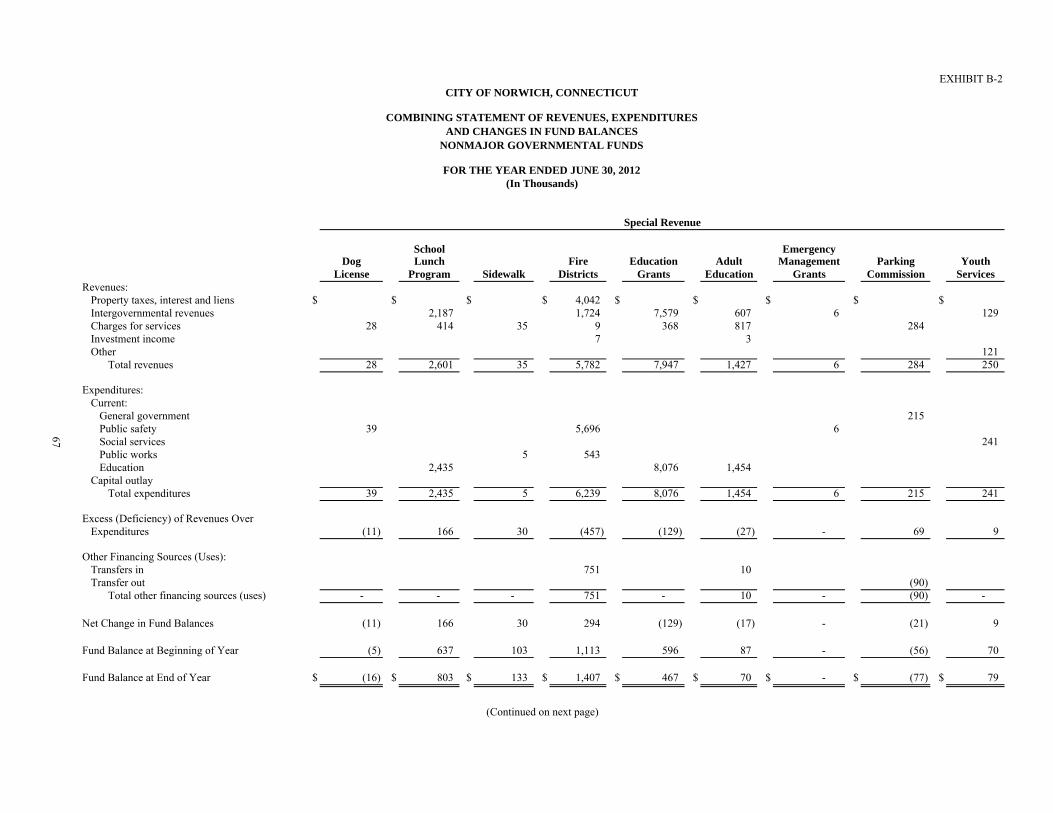
EXHIBIT B-2CITY OF NORWICH, CONNECTICUT
COMBINING STATEMENT OF REVENUES, EXPENDITURESAND CHANGES IN FUND BALANCES
NONMAJOR GOVERNMENTAL FUNDS
FOR THE YEAR ENDED JUNE 30, 2012(In Thousands)
Special Revenue
School EmergencyDog Lunch Fire Education Adult Management Parking Youth
License Program Sidewalk Districts Grants Education Grants Commission ServicesRevenues:
Property taxes, interest and liens $ $ $ $ 4,042 $ $ $ $ $Intergovernmental revenues 2,187 1,724 7,579 607 6 129Charges for services 28 414 35 9 368 817 284Investment income 7 3Other 121
Total revenues 28 2,601 35 5,782 7,947 1,427 6 284 250
Expenditures: Current:
General government 215Public safety 39 5,696 6Social services 241Public works 5 543Education 2,435 8,076 1,454
Capital outlay Total expenditures 39 2,435 5 6,239 8,076 1,454 6 215 241
Excess (Deficiency) of Revenues Over Expenditures (11) 166 30 (457) (129) (27) - 69 9
Other Financing Sources (Uses): Transfers in 751 10Transfer out (90)
Total other financing sources (uses) - - - 751 - 10 - (90) -
Net Change in Fund Balances (11) 166 30 294 (129) (17) - (21) 9
Fund Balance at Beginning of Year (5) 637 103 1,113 596 87 - (56) 70
Fund Balance at End of Year $ (16) $ 803 $ 133 $ 1,407 $ 467 $ 70 $ - $ (77) $ 79
(Continued on next page)
67

Revenues: Property taxes, interest and liens Intergovernmental revenues Charges for services Investment income Other
Total revenues
Expenditures: Current:
General government Public safety Social services Public works Education
Capital outlay Total expenditures
Excess (Deficiency) of Revenues Over Expenditures
Other Financing Sources (Uses): Transfers in Transfer out
Total other financing sources (uses)
Net Change in Fund Balances
Fund Balance at Beginning of Year
Fund Balance at End of Year
68
EXHIBIT B-2CITY OF NORWICH, CONNECTICUT
COMBINING STATEMENT OF REVENUES, EXPENDITURESAND CHANGES IN FUND BALANCES (CONTINUED)
NONMAJOR GOVERNMENTAL FUNDS
FOR THE YEAR ENDED JUNE 30, 2012(In Thousands)
Special RevenueOther Fire Police
Lead Grants Community Grants Police GrantsC.O.P.S. Paint and Economic Development Education and Asset and
Grant Abatement Programs Development Fund Programs Programs Forfeiture Programs
$ $ $ $ $ $ $ $ $44 505 447 84 1,093 53 19 21 126
429 1
88 54 18 444 505 535 84 1,093 108 37 21 559
126 11344 144 36 24 418
532 70 450425 226
81
44 532 621 113 820 81 36 24 418
- (27) (86) (29) 273 27 1 (3) 141
92 27 (292) (167)
- - 92 27 (292) - - - (167)
- (27) 6 (2) (19) 27 1 (3) (26)
- 31 144 19 51 106 3 137 41
$ - $ 4 $ 150 $ 17 $ 32 $ 133 $ 4 $ 134 $ 15
(Continued on next page)

Revenues: Property taxes, interest and liens Intergovernmental revenues Charges for services Investment income Other
Total revenues
Expenditures: Current:
General government Public safety Social services Public works Education
Capital outlay Total expenditures
Excess (Deficiency) of Revenues Over Expenditures
Other Financing Sources (Uses): Transfers in Transfer out
Total other financing sources (uses)
Net Change in Fund Balances
Fund Balance at Beginning of Year
Fund Balance at End of Year
69
EXHIBIT B-2CITY OF NORWICH, CONNECTICUT
COMBINING STATEMENT OF REVENUES, EXPENDITURESAND CHANGES IN FUND BALANCES (CONTINUED)
NONMAJOR GOVERNMENTAL FUNDS
FOR THE YEAR ENDED JUNE 30, 2012(In Thousands)
Special RevenueRecreation Social
Grants Services Seniorand Grants and Citizens Mohegan Sachem Property Brown
Programs Programs Programs Park Fund Rehabilitation Park Total
$ $ $ $ $ $ $ $ 4,04263 9 14,696
149 100 76 2,7091 12
21 85 24 50 465170 148 133 - 51 76 - 21,924
4546,407
164 139 111 3 153 404 2,2671,199
12,046-
164 139 111 3 153 404 - 22,373
6 9 22 (3) (102) (328) - (449)
20 5 50 321 1,276 (18) (567)
20 5 - - 32 321 - 709
26 14 22 (3) (70) (7) - 260
133 48 75 125 262 (46) 42 3,716
$ 159 $ 62 $ 97 $ 122 $ 192 $ (53) $ 42 $ 3,976
(Continued on next page)

Revenues: Property taxes, interest and liens Intergovernmental revenues Charges for services Investment income Other
Total revenues
Expenditures: Current:
General government Public safety Social services Public works Education
Capital outlay Total expenditures
Excess (Deficiency) of Revenues Over Expenditures
Other Financing Sources (Uses): Transfers in Transfer out
Total other financing sources (uses)
Net Change in Fund Balances
Fund Balance at Beginning of Year
Fund Balance at End of Year
70
EXHIBIT B-2CITY OF NORWICH, CONNECTICUT
COMBINING STATEMENT OF REVENUES, EXPENDITURESAND CHANGES IN FUND BALANCES
NONMAJOR GOVERNMENTAL FUNDS
FOR THE YEAR ENDED JUNE 30, 2012(In Thousands)
Capital Projects PermanentTotal
Fred Abbot NonmajorCapital Landfill Public Parks Summer Cemetery Interfund Governmental
Improvement Closure Total & Gardens Concert Trust Total Eliminations Funds
$ $ $ - $ $ $ $ - $ $ 4,04212 32 44 - 14,740
- - 2,709- 1 30 31 43- - - 465
12 32 44 1 - 30 31 - 21,999
- 61 61 515- - 6,407- - 2,267
33 33 - 1,232- - 12,046
2,398 2,398 - 2,3982,398 33 2,431 - - 61 61 - 24,865
(2,386) (1) (2,387) 1 - (31) (30) - (2,866)
2,373 2,373 - (394) 3,255(108) (108) (57) (57) 394 (338)
2,265 - 2,265 - - (57) (57) - 2,917
(121) (1) (122) 1 - (88) (87) - 51
1,703 260 1,963 39 5 1,458 1,502 - 7,181
$ 1,582 $ 259 $ 1,841 $ 40 $ 5 $ 1,370 $ 1,415 $ - $ 7,232

EXHIBIT B-3CITY OF NORWICH, CONNECTICUT
FIRE DISTRICTS FUND REVENUESBUDGETARY BASIS - BUDGET AND ACTUAL
FOR THE YEAR ENDED JUNE 30, 2012(In Thousands)
VarianceBudgeted Amounts Favorable
Original Final Actual (Unfavorable)
Taxes, interest and lien fees:Fire $ 3,470 $ 3,470 $ 3,482 $ 12Volunteer fire 536 536 560 24
Total taxes, interest and lien fees 4,006 4,006 4,042 36
Intergovernmental:City Housing 202 202 202 - In lieu of taxes - fire 50 50 50 - Elderly reimbursement 75 75 75 - Mashantucket Pequot 1,397 1,397 1,397 -
Total intergovernmental 1,724 1,724 1,724 -
Charges for services:Conveyance fees 12 12 9 (3)
Other:Other fund transfers 701 701 751 50
Investment income 4 4 7 3
Total $ 6,447 $ 6,447 $ 6,533 $ 86
71
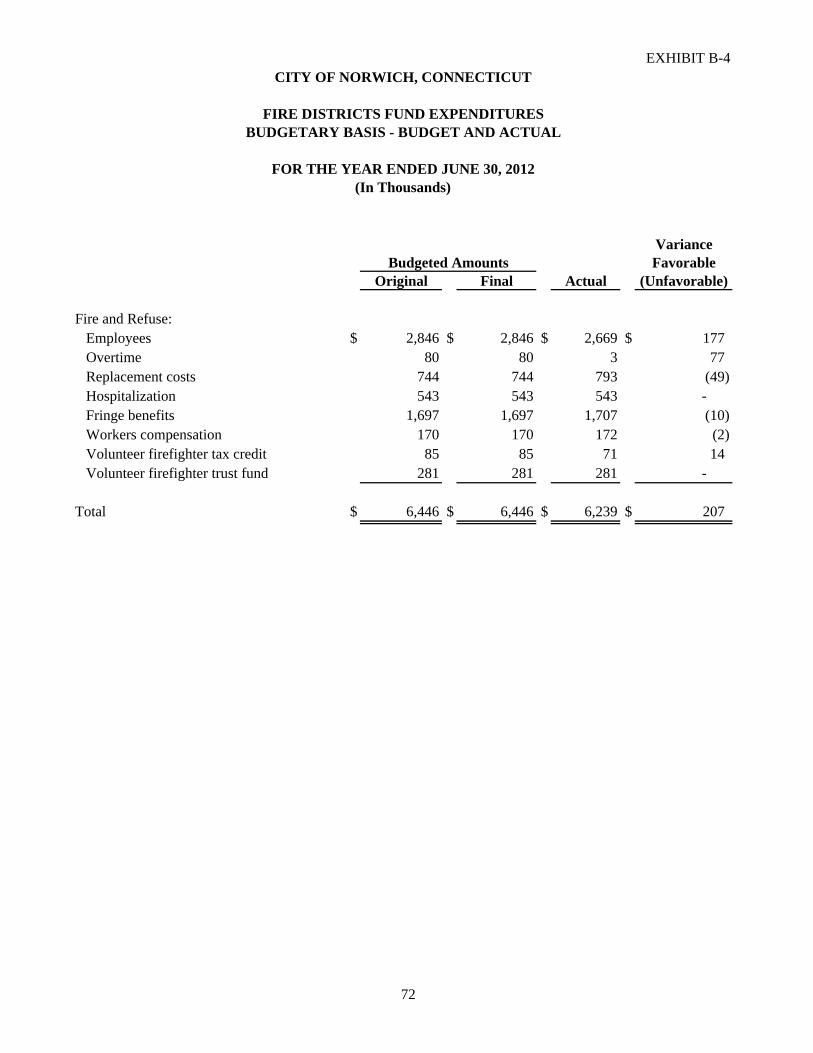
EXHIBIT B-4CITY OF NORWICH, CONNECTICUT
FIRE DISTRICTS FUND EXPENDITURESBUDGETARY BASIS - BUDGET AND ACTUAL
FOR THE YEAR ENDED JUNE 30, 2012(In Thousands)
VarianceBudgeted Amounts Favorable
Original Final Actual (Unfavorable)
Fire and Refuse:Employees $ 2,846 $ 2,846 $ 2,669 $ 177Overtime 80 80 3 77Replacement costs 744 744 793 (49) Hospitalization 543 543 543 - Fringe benefits 1,697 1,697 1,707 (10) Workers compensation 170 170 172 (2) Volunteer firefighter tax credit 85 85 71 14Volunteer firefighter trust fund 281 281 281 -
Total $ 6,446 $ 6,446 $ 6,239 $ 207
72

EXHIBIT B-5CITY OF NORWICH, CONNECTICUT
SCHEDULE OF FIRE DISTRICT TAXES
FOR THE YEAR ENDED JUNE 30, 2012(In Thousands)
Uncollected Lawful Corrections Transfers Adjusted Collections UncollectedGrand Taxes to Taxes Taxes
List July 1, 2011 Additions Deductions Suspense Collectible Taxes Interest Fees Total June 30, 2012**
2010 $ 4,076 $ 7 $ 31 $ $ 4,052 $ 3,873 $ 24 $ $ 3,897 $ 179 2009 189 1 13 177 81 20 101 96 2008 72 20 52 12 8 20 40 2007 47 1 34 12 3 2 5 9 2006 3 3 - 3 2005 3 3 - 3 2004 3 3 - 3 2003 4 4 - 4 2002 1 1 - 1 2001 3 3 - 3 2000 1 1 - 1 1999 2 2 - 2 1998 5 5 - 5 1997 5 5 - 5 1996 4 4 * - - -
$ 4,418 $ 8 $ 69 $ 34 $ 4,323 3,969 54 4,023 $ 354
Suspense collections 7 7
Total Tax Collections $ 3,969 $ 61 $ - 4,030
Property taxes receivable considered available: June 30, 2011 (43) June 30, 2012 53
Total $ 4,040 *Operation of law**Represents gross receivable of $361 net of overpayments of $7 recorded as a liability
73

Nonmajor Enterprise Funds

NONMAJOR ENTERPRISE FUNDS
Enterprise Funds are used to account for ongoing organizations and activities which are similar to those
found in the private sector.
Golf Course Authority - is used to account for the operations of the City’s public golf course.
Stadium Authority - is used to account for the operations of Senator Thomas Dodd Stadium.
Ice Rink Authority - is used to account for the operations of the City’s ice skating facility.

EXHIBIT C-1CITY OF NORWICH, CONNECTICUT
COMBINING STATEMENT OF NET ASSETSNONMAJOR ENTERPRISE FUNDS
(In Thousands)
Business-Type Activities
Golf Course Stadium Ice Rink Authority Authority Authority Totals
Assets:Current assets:
Cash and cash equivalents $ $ $ 5 $ 5Receivables, net:
User charges 22 11 33Due from other funds 344 284 628Inventories 59 59
Total current assets 344 306 75 725
Capital assets, net 2,342 7,242 462 10,046
Total assets 2,686 7,548 537 10,771
Liabilities:Current liabilities:
Accounts payable and accrued liabilities 97 21 30 148Bonds payable 25 25Due to other funds 265 265Unearned revenue 191 191
Total current liabilities 313 21 295 629
Noncurrent liabilities:Bonds payable 215 215
Total liabilities 528 21 295 844
Net Assets:Invested in capital assets, net of related debt 2,102 7,242 462 9,806Unrestricted 56 285 (220) 121
Total Net Assets $ 2,158 $ 7,527 $ 242 $ 9,927
JUNE 30, 2012
74

EXHIBIT C-2CITY OF NORWICH, CONNECTICUT
COMBINING STATEMENT OF REVENUES, EXPENSES AND CHANGES IN FUND NET ASSETS - NONMAJOR ENTERPRISE FUNDS
FOR THE YEAR ENDED JUNE 30, 2012(In Thousands)
Business-Type Activities
Golf Course Stadium Ice Rink Authority Authority Authority Totals
Operating Revenues:Charges for services $ 1,236 $ 152 $ 666 $ 2,054
Operating Expenses:Operations and maintenance 1,166 144 786 2,096Depreciation 56 182 161 399
Total operating expenses 1,222 326 947 2,495
Operating Income (Loss) 14 (174) (281) (441)
Nonoperating income (expense):Interest income 1 1 2Loss on disposal of capital assets (5) (5)
Net income (loss) before transfers 15 (173) (286) (444)
Transfers in 54 54
Change in Net Assets 15 (173) (232) (390)
Net Assets at Beginning of Year 2,143 7,700 474 10,317
Net Assets at End of Year $ 2,158 $ 7,527 $ 242 $ 9,927
75

EXHIBIT C-3CITY OF NORWICH, CONNECTICUT
COMBINING STATEMENT OF CASH FLOWSNONMAJOR ENTERPRISE FUNDS
FOR THE YEAR ENDED JUNE 30, 2012(In Thousands)
Business-Type ActivitiesGolf Course Stadium Ice RinkAuthority Authority Authority Totals
Cash Flows from Operating Activities: Cash received from charges for services $ 1,228 $ 196 $ 721 $ 2,145Cash paid to vendors (585) (197) (409) (1,191) Cash paid to employees for services (527) (357) (884)
Net cash provided by (used in) operating activities 116 (1) (45) 70
Cash Flows from Noncapital Financing Activities: Advances to (from) other funds (35) 44 9
Cash Flows from Capital and Related Financing Activities: Principal payments on long-term debt (25) (25) Loss on disposal of property and equipment 5 5Purchase of capital assets (58) (8) (66)
Net cash used in capital and related financing activities (83) - (3) (86)
Cash Flows from Investing Activities: Income on investments 1 1 2
Net Decrease in Cash and Cash Equivalents (1) - (4) (5)
Cash and Cash Equivalents at Beginning of Year 1 - 9 10
Cash and Cash Equivalents at End of Year $ - $ - $ 5 $ 5
Reconciliation of Operating Income (Loss) to Net Cash Provided by Operating Activities:
Operating income (loss) $ 14 $ (174) $ (281) $ (441) Adjustments to reconcile operating income (loss) to net cash provided by operating activities:
Depreciation expense 56 182 161 399Decrease in receivables 44 55 99Decrease in inventories and other assets 10 10Increase in due from other funds (59) (59) Decrease in unearned revenues (8) (8) Increase in accounts payable and accrued liabilities 54 6 10 70
Total adjustments 102 173 236 511
Net Cash Provided by (used in) Operating Activities $ 116 $ (1) $ (45) $ 70
76

Internal Service Funds

INTERNAL SERVICE FUNDS
Internal Service Funds are used to account for and finance the City’s uninsured risks of loss for Medical Benefits
and Workers’ Compensation (including heart and hypertension).
Medical Benefits Fund - is used to pay health insurance claims and to purchase administrative services
and stop loss insurance for the City’s health care plans. The City, Board of Education and Department of
Public Utilities contribute into this fund for health insurance.
Workers’ Compensation Fund - accounts for General Fund funding reserves and accrued loss liabilities
on incurred claims for workers’ compensation and heart and hypertension open claims.

EXHIBIT D-1
COMBINING STATEMENT OF NET ASSETSINTERNAL SERVICE FUNDS
JUNE 30, 2012(In Thousands)
Medical Workers’Benefits Compensation Total
Assets:Current:
Accounts receivable $ $ $ - Due from other funds 3,668 3,274 6,942
Total assets 3,668 3,274 6,942
Liabilities:Current:
Accounts payable 4 4Risk management claims 1,177 646 1,823
Total current liabilities 1,177 650 1,827
Noncurrent:Risk management claims 6,227 6,227
Total liabilities 1,177 6,877 8,054
Net Assets:Unrestricted $ 2,491 $ (3,603) $ (1,112)
CITY OF NORWICH, CONNECTICUT
77

EXHIBIT D-2CITY OF NORWICH, CONNECTICUT
COMBINING STATEMENT OF REVENUES, EXPENSES AND CHANGES IN FUND NET ASSETS
INTERNAL SERVICE FUNDS
FOR THE YEAR ENDED JUNE 30, 2012(In Thousands)
Medical Workers’Benefits Compensation Total
Operating Revenues:Charges for services $ 11,335 $ 3,711 $ 15,046
Operating Expenses:Claims expense 12,339 2,846 15,185Premiums and administrative expenses 816 239 1,055
Total operating expenses 13,155 3,085 16,240
Operating Income (Loss) (1,820) 626 (1,194)
Net Assets at Beginning of Year 4,311 (4,229) 82
Net Assets at End of Year $ 2,491 $ (3,603) $ (1,112)
78

EXHIBIT D-3CITY OF NORWICH, CONNECTICUT
COMBINING STATEMENT OF CASH FLOWS
FOR THE YEAR ENDED JUNE 30, 2012(In Thousands)
Medical Workers’Benefits Compensation Total
Cash Flows from Operating Activities:Cash received from charges for services $ 2,152 $ 261 $ 2,413Cash receipts for interfund services provided 10,853 2,034 12,887Cash paid to vendors (13,005) (2,295) (15,300) Net cash provided by operating activities - - -
Net Increase in Cash and Cash Equivalents - - -
Cash and Cash Equivalents at Beginning of Year - - -
Cash and Cash Equivalents at End of Year $ - $ - $ -
Reconciliation of Operating Income (Loss) to Net Cash Provided by Operating Activities:
Operating income (loss) $ (1,820) $ 626 $ (1,194) Adjustments to reconcile operating income (loss) to net cash provided by operating activities:
Decrease in receivables 42 42Increase in due from other funds 1,628 (1,416) 212Increase (decrease) in accounts payable and accrued liabilities 150 790 940
Total adjustments 1,820 (626) 1,194
Net Cash Provided by Operating Activities $ - $ - $ -
INTERNAL SERVICE FUNDS
79

Fiduciary Funds

FIDUCIARY FUNDS Fiduciary Funds are used to account for assets held in a trustee capacity for others and include Agency Funds. Agency Funds - utilize the accrual basis of accounting. Agency funds are custodial in nature (assets equal liabilities) and are used to account for student activities and performance/bid bonds. The City’s Agency Funds are listed below: Student Activities Rehabilitation Deposits Bid Deposit Performance Bonds

EXHIBIT E-1CITY OF NORWICH, CONNECTICUT
AGENCY FUNDS
COMBINING BALANCE SHEET
JUNE 30, 2012(In Thousands)
Student Rehabilitation Bid PerformanceActivities Deposits Deposit Bonds Totals
Assets:Cash and cash equivalents $ 49 $ $ $ 336 $ 385Other 1 102 103
80
Total Assets $ 49 $ 1 $ 102 $ 336 $ 488
Liabilities:Due to student groups and agencies $ 49 $ 1 $ 102 $ 336 $ 488

EXHIBIT E-2CITY OF NORWICH, CONNECTICUT
AGENCY FUNDS
COMBINING STATEMENT OF CHANGES IN ASSETS AND LIABILITIES
FOR THE YEAR ENDED JUNE 30, 2012(In Thousands)
Balance BalanceJuly 1, 2011 Additions Deductions June 30, 2012
Student Activities
Assets:Cash and cash equivalents $ 64 $ 122 $ 137 $ 49
Liabilities:Due to student groups and agencies $ 64 $ 122 $ 137 $ 49
Rehabilitation Deposits
Assets:Other $ 1 $ 7 $ 7 $ 1
Liabilities:Due to student groups and agencies $ 1 $ 7 $ 7 $ 1
Bid Deposit
Assets:Other $ 62 $ 285 $ 245 $ 102
Liabilities:Due to student groups and agencies $ 62 $ 285 $ 245 $ 102
Performance Bonds
Assets:Cash and cash equivalents $ 316 $ 123 $ 103 $ 336
Liabilities:Due to student groups and agencies $ 316 $ 123 $ 103 $ 336
Total - All Funds
Assets:Cash and cash equivalents $ 380 $ 245 $ 240 $ 385Other 63 292 252 103
Total $ 443 $ 537 $ 492 $ 488
Liabilities:Due to student groups and agencies $ 443 $ 537 $ 492 $ 488
81

Supplemental Schedules

SCHEDULE 1CITY OF NORWICH, CONNECTICUT
SCHEDULE OF BONDS AND SERIAL NOTES PAYABLE
FOR THE YEAR ENDED JUNE 30, 2012(In Thousands)
Original Balance Issued Paid BalanceInterest Issue Maturity Amount Beginning During During End of
Description Rate (%) Date Date Issued of Year Year Year Year
Governmental Activities: General purpose bonds payable:
General purpose - Wauregan Hotel 5.50-6.75 04/01/2001 04/01/2017 $ 400 $ 150 $ $ 25 $ 125 General purpose 4.0-5.0 04/15/2002 04/15/2022 6,020 2,940 2,940 - General purpose 2.00-3.55 04/15/2004 04/15/2015 3,120 935 235 700 Refunding - (11/15/1997 and 11/01/1999) bonds 2.0-4.0 04/15/2004 04/15/2019 4,520 2,575 350 2,225 General purpose and water main 3.0-5.0 03/15/2005 09/15/2015 3,520 1,750 350 1,400 Refunding - (02/01/1996 and 04/01/2001) bonds 3.0-4.0 03/15/2005 09/15/2019 8,570 6,091 769 5,322 Schools - 12/30/2008 12/30/2020 2,940 2,450 245 2,205 Refunding - (04/01/2001) bonds 2.0-3.0 12/02/2009 04/01/2014 4,235 3,140 1,080 2,060 General purpose 3.0-4.0 12/02/2009 12/01/2029 9,145 9,145 486 8,659 Schools 3.0-4.0 12/02/2009 12/01/2029 2,000 2,000 105 1,895 General Purpose 2.0-4.0 12/13/2011 12/1/2022 4,680 4,680 4,680 Schools 2.0-4.0 12/13/2011 12/1/2022 5,000 5,000 5,000 Refunding - (4/15/02) bonds 2.0 2/15/2012 4/15/2022 2,725 2,725 2,725
Total 56,875 31,176 12,405 6,585 36,996
82
Business-Type Activities: General purpose bonds payable:
Refunding - (02/01/1996) Stony Brook Reservoir 3.0-4.0 03/15/2005 09/15/2015 368 199 41 158 Golf course 3.0-4.0 12/02/2009 12/01/2029 265 265 25 240
State of Connecticut serial notes payable: Clean Water Act 106-C 2.00 10/31/1997 10/31/2016 3,410 1,038 186 852 Clean Water Act 298-C 2.00 06/30/2000 06/30/2019 1,508 605 75 530 Clean Water Act 349-C 2.00 12/31/2002 12/31/2021 881 501 43 458 Clean Water Act 9714-C 2.77 12/31/2002 12/31/2021 1,899 1,112 93 1,019 Clean Water Act 200801-C 2.27 07/01/2009 07/01/2029 450 403 23 380 Clean Water Act 625-D 2.00 12/31/2012 12/31/1931 1,865 499 1,365 1,864 Clean Water Act 495-C* * * * * 1,257 3,899 5,156 Economic Development 6.00 07/01/1995 07/01/2012 1,000 170 82 88 Drinking Water State Revolving Fund 2010-8005 2.06 03/31/2010 12/31/2029 145 134 7 127 Drinking Water State Revolving Fund 2010-8006 2.06 03/31/2010 06/30/2030 326 310 16 294
Total 12,117 6,493 5,264 591 11,166
Total $ 68,992 $ 37,669 $ 17,669 $ 7,176 $ 48,162
* Loans are not permanently financed at this time.

SCHEDULE 2CITY OF NORWICH, CONNECTICUT
BOND AND SERIAL NOTES PAYABLESCHEDULE OF ANNUAL DEBT SERVICE REQUIREMENTS
(In Thousands)
Total PrimaryGovernmental Activities Business-Type Activities Government
FiscalYear General Obligation Bonds
Ending General Obligation Bonds And Serial NotesJune 30, Principal Interest Principal Interest Principal Interest
2013 $ 3,895 $ 1,190 $ 5,891 $ 130 $ 9,786 $ 1,320 2014 4,355 951 591 110 4,946 1,061 2015 3,316 835 609 100 3,925 935 2016 3,072 737 618 84 3,690 821 2017 2,555 655 452 71 3,007 726 2018 2,465 580 389 62 2,854 642 2019 2,340 508 400 52 2,740 560 2020 2,130 444 331 45 2,461 489 2021 1,560 399 337 37 1,897 436 2022 1,329 363 236 29 1,565 392 2023 1,100 324 140 25 1,240 349 2024 1,100 289 142 23 1,242 312 2025 1,100 252 143 20 1,243 272 2026 1,125 213 145 17 1,270 230 2027 1,125 173 147 14 1,272 187 2028 1,125 133 150 11 1,275 144 2029 1,125 93 150 8 1,275 101 2030 1,125 54 128 5 1,253 59 2031 525 25 109 2 634 27 2032 529 9 58 587 9
Total $ 36,996 $ 8,227 $ 11,166 $ 845 $ 48,162 $ 9,072
FOR THE YEAR ENDED JUNE 30, 2012
83

Statistical Section
Statistical Section Information
The objectives of statistical section information are to provide financial statement users with additional historical perspective, context and detail to assist in using the information in the financial statements, notes to financial statements and required supplementary information to understand and assess economic condition.
Statistical section information is presented in the following categories:
Financial trends information is intended to assist users in understanding and assessing how financial position has changed over time.
Revenue capacity information is intended to assist users in understanding and assessing the factors affecting the ability to generate own-source revenues (property taxes, charges for services, etc.).
Debt capacity information is intended to assist users in understanding and assessing debt burden and the ability to issue additional debt.
Demographic and economic information is intended 1) to assist users in understanding the socioeconomic environment and 2) to provide information that facilitates comparisons of financial statement information over time and among governments.
Operating information is intended to provide contextual information about operations and resources to assist readers in using financial statement information to understand and assess economic condition.
The accompanying tables are presented in the above order. Refer to the Table of Contents for applicable page number locations.
Sources: Unless otherwise noted, the information in the tables is derived from the comprehensive annual financial reports for the relevant year.

TABLE 1CITY OF NORWICH, CONNECTICUT
NET ASSETS BY COMPONENT
LAST TEN FISCAL YEARS(In Thousands)
FISCAL YEAR
2012 2011 2010 2009 2008 2007 2006 2005 2004 2003Governmental activities:
Invested in capital assets, net of related debt $ 92,031 $ 87,252 * $ 60,432 $ 53,165 $ 50,696 $ 44,114 $ 38,680 $ 34,514 $ 24,968 $ 25,716 Restricted 1,457 1,544 1,405 1,351 1,608 1,725 1,590 1,610 Unrestricted 14,373 10,296 14,414 6,088 9,884 13,808 16,460 15,074 18,077 10,412
Total governmental activities net assets 107,861 99,092 76,251 60,604 62,188 59,647 56,730 51,198 43,045 36,128
Business-type activities:Invested in capital assets, net of related debt 107,495 97,874 * 88,174 87,763 84,439 83,363 83,151 81,679 79,147 80,094 Restricted 361 334 287 758 758 876 643 279 Unrestricted 22,241 20,129 23,441 22,903 21,159 24,307 19,927 17,083 11,119 8,272
Total business-type activities net assets 130,097 118,337 111,902 111,424 106,356 108,546 103,721 99,041 90,266 88,366
Primary government:Invested in capital assets, net of related debt 199,526 185,126 148,606 140,928 135,135 127,477 121,831 116,193 104,115 105,810 Restricted 1,818 1,878 1,692 2,109 2,366 2,601 2,233 1,889 Unrestricted 36,614 30,425 37,855 28,991 31,043 38,115 36,387 32,157 29,196 18,684
Total Primary Government Net Assets $ 237,958 $ 217,429 $ 188,153 $ 172,028 $ 168,544 $ 168,193 $ 160,451 $ 150,239 $ 133,311 $ 124,494
Notes:(1) Schedule prepared on the accrual basis of accounting.
* as restated
84

TABLE 2CITY OF NORWICH, CONNECTICUT
CHANGES IN NET ASSETS
LAST TEN FISCAL YEARS(In Thousands)
FISCAL YEAR2012 2011 2010 2009 2008 2007 2006 2005 2004 2003
Expenses:Governmental activities:
General government $ 10,300 $ 10,760 $ 9,114 $ 10,473 $ 12,116 $ 11,926 $ 9,638 $ 8,958 $ 10,414 $ 11,597 Public safety 20,571 20,336 18,063 20,326 18,271 16,108 15,754 14,105 13,032 14,109 Social services 4,201 4,664 5,602 4,954 4,852 3,984 4,048 3,037 1,880 2,432 Public works 13,444 9,133 9,449 15,819 11,617 11,504 11,109 13,781 10,271 6,752 Education 86,764 84,263 84,898 85,661 91,664 75,171 71,268 64,819 61,478 61,797 Interest on long-term debt 1,109 2,008 1,323 1,444 1,380 1,454 1,476 1,646 1,948 2,222
Total governmental activities expenses 136,389 131,164 128,449 138,677 139,900 120,147 113,293 106,346 99,023 98,909 Business-type activities:
Department of Public Utilities 75,620 80,977 74,716 77,192 74,114 66,885 67,275 57,133 56,062 53,171 Other enterprise funds 2,495 2,425 2,413 2,529 2,568 2,373 2,583 2,505 2,526 2,636
Total business-type activities expenses 78,115 83,402 77,129 79,721 76,682 69,258 69,858 59,638 58,588 55,807 Total primary government expenses 214,504 214,566 205,578 218,398 216,582 189,405 183,151 165,984 157,611 154,716
Program Revenues:Governmental activities:
Charges for services:General government 1,866 1,860 1,778 1,602 2,078 2,861 3,097 2,682 2,892 5,690 Public works 771 1,250 819 2,962 3,017 2,994 2,730 2,988 2,866 1,813 Education 1,708 1,570 2,051 2,184 1,864 1,935 1,674 1,447 900 1,120 Other 1,032 1,076 1,012 1,171 970 694 747 717 4,649 1,270
Operating grants and contributions 53,139 54,051 54,424 52,034 62,359 47,469 47,561 41,727 36,509 35,923 Capital grants and contributions 10,749 22,962 11,163 5,810 1,635 934 1,736 1,907 4,459 2,903
Total governmental activities program revenues 69,265 82,769 71,247 65,763 71,923 56,887 57,545 51,468 52,275 48,719 Business-type activities:
Charges for services: Gas 13,370 16,282 16,508 21,596 16,961 16,612 18,999 15,099 12,911 12,724 Electric 60,151 58,283 52,303 55,152 49,265 49,607 46,158 38,706 36,089 32,142 Water 6,656 6,794 6,117 6,027 5,790 5,115 5,099 4,970 4,854 4,971 Sewer 6,876 7,185 7,580 5,536 5,641 5,340 5,384 4,077 4,030 3,826 Other nonmajor enterprise funds 2,054 2,081 2,081 2,188 2,245 2,168 2,269 2,299 2,166 2,275
Capital grants and contributions 6,798 6,704 200 1,315 1,216 1,037 1,696 2,115 141 75 Total business-type activities program revenues 95,905 97,329 84,789 91,814 81,118 79,879 79,605 67,266 60,191 56,013 Total primary government program revenues 165,170 180,098 156,036 157,577 153,041 136,766 137,150 118,734 112,466 104,732
Net (expense) revenue:
Governmental activities (67,124) (48,395) (57,202) (72,914) (67,977) (63,260) (55,748) (54,878) (46,748) (50,190) Business-type activities 17,790 13,927 7,660 12,093 4,436 10,621 9,747 7,628 1,603 206
Total Primary Government Net Expense $ (49,334) $ (34,468) $ (49,542) $ (60,821) $ (63,541) $ (52,639) $ (46,001) $ (47,250) $ (45,145) $ (49,984)
(Continued on next page)
85
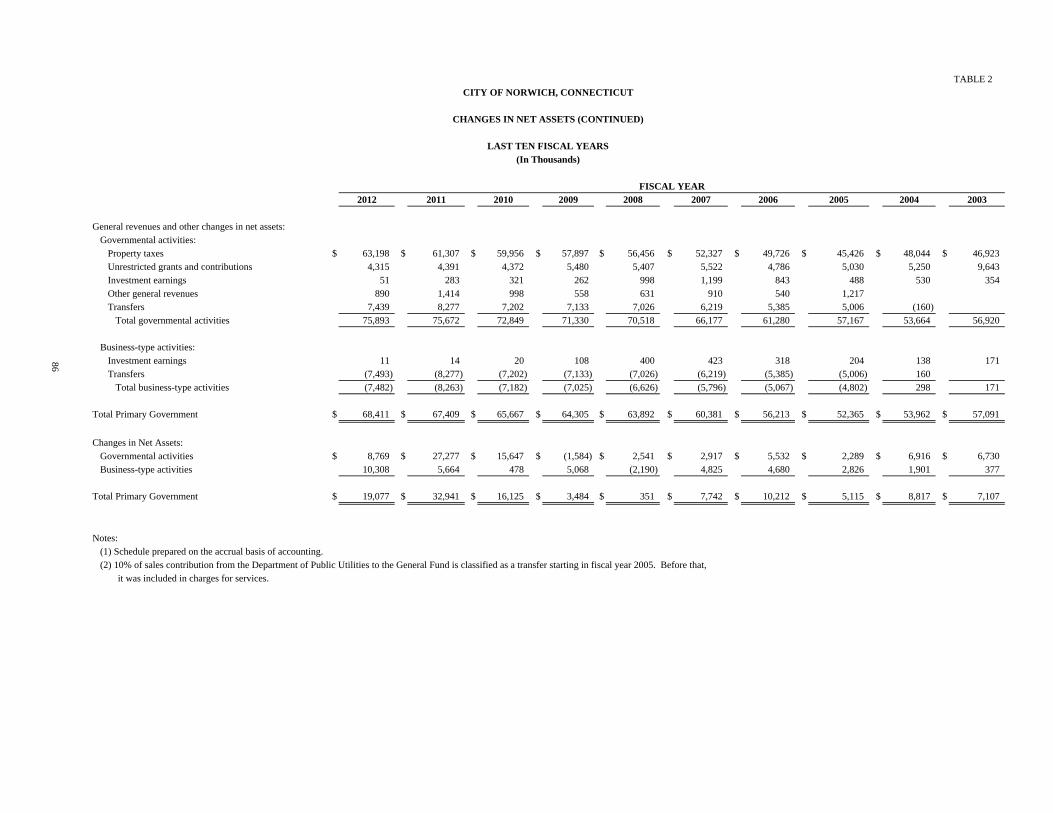
TABLE 2CITY OF NORWICH, CONNECTICUT
CHANGES IN NET ASSETS (CONTINUED)
LAST TEN FISCAL YEARS(In Thousands)
FISCAL YEAR2012 2011 2010 2009 2008 2007 2006 2005 2004 2003
General revenues and other changes in net assets:Governmental activities:
Property taxes $ 63,198 $ 61,307 $ 59,956 $ 57,897 $ 56,456 $ 52,327 $ 49,726 $ 45,426 $ 48,044 $ 46,923 Unrestricted grants and contributions 4,315 4,391 4,372 5,480 5,407 5,522 4,786 5,030 5,250 9,643 Investment earnings 51 283 321 262 998 1,199 843 488 530 354 Other general revenues 890 1,414 998 558 631 910 540 1,217 Transfers 7,439 8,277 7,202 7,133 7,026 6,219 5,385 5,006 (160)
Total governmental activities 75,893 75,672 72,849 71,330 70,518 66,177 61,280 57,167 53,664 56,920
Business-type activities:Investment earnings 11 14 20 108 400 423 318 204 138 171 Transfers (7,493) (8,277) (7,202) (7,133) (7,026) (6,219) (5,385) (5,006) 160
Total business-type activities (7,482) (8,263) (7,182) (7,025) (6,626) (5,796) (5,067) (4,802) 298 171
Total Primary Government $ 68,411 $ 67,409 $ 65,667 $ 64,305 $ 63,892 $ 60,381 $ 56,213 $ 52,365 $ 53,962 $ 57,091
Changes in Net Assets:Governmental activities $ 8,769 $ 27,277 $ 15,647 $ (1,584) $ 2,541 $ 2,917 $ 5,532 $ 2,289 $ 6,916 $ 6,730 Business-type activities 10,308 5,664 478 5,068 (2,190) 4,825 4,680 2,826 1,901 377
Total Primary Government $ 19,077 $ 32,941 $ 16,125 $ 3,484 $ 351 $ 7,742 $ 10,212 $ 5,115 $ 8,817 $ 7,107
Notes:(1) Schedule prepared on the accrual basis of accounting.(2) 10% of sales contribution from the Department of Public Utilities to the General Fund is classified as a transfer starting in fiscal year 2005. Before that,
it was included in charges for services.
86

TABLE 3CITY OF NORWICH, CONNECTICUT
FUND BALANCES, GOVERNMENTAL FUNDS
LAST TEN FISCAL YEARS(In Thousands)
FISCAL YEAR2012 2011 2010 2009 2008 2007 2006 2005 2004 2003
General Fund:Reserved $ $ $ 268 $ 283 $ 308 $ 425 $ 259 $ 398 $ 415 $ 305 Unreserved 9,834 9,616 10,676 11,651 11,030 10,573 9,302 8,771 Assigned 264 178 Unassigned 10,371 10,649
Total General Fund $ 10,635 $ 10,827 $ 10,102 $ 9,899 $ 10,984 $ 12,076 $ 11,289 $ 10,971 $ 9,717 $ 9,076
All other governmental funds:Reserved $ $ $ 1,776 $ 1,729 $ 2,095 $ 3,170 $ 3,077 $ 2,475 $ 2,051 $ 2,679 Unreserved, reported in:
Special revenue funds 2,915 2,183 2,487 2,746 2,577 2,532 3,617 514 Capital projects funds 3,911 (1,898) (1,493) (541) 2,460 3,265 1,610 622
Nonspendable 1,443 1,523 Restricted 3,179 1,421 Committed 4,271 4,344 Unassigned (2,878) (7,208)
Total All Other Governmental Funds $ 6,015 $ 80 $ 8,602 $ 2,014 $ 3,089 $ 5,375 $ 8,114 $ 8,272 $ 7,278 $ 3,815
Notes:(1) Schedule prepared on the modified accrual basis of accounting.(2) Fund balance classifications were modified beginning in year 2011 with the adoption of GASB Statement 54.
87

TABLE 4CITY OF NORWICH, CONNECTICUT
CHANGES IN FUND BALANCES, GOVERNMENTAL FUNDS
LAST TEN FISCAL YEARS(In Thousands)
FISCAL YEAR2012 2011 2010 2009 2008 2007 2006 2005 2004 2003
Revenues:Property taxes, interest and liens $ 63,286 $ 60,817 $ 59,214 $ 57,623 $ 55,893 $ 52,976 $ 49,704 $ 47,652 $ 47,815 $ 45,326 Intergovernmental 68,137 81,439 69,937 63,116 69,880 53,909 53,572 48,159 46,929 49,490 Charges for services, licenses, permits, fees and other 6,816 7,292 7,353 8,508 9,135 10,097 9,283 10,296 11,041 10,321 Investment income 50 283 321 260 991 1,171 813 462 517 379
Total revenues 138,289 149,831 136,825 129,507 135,899 118,153 113,372 106,569 106,302 105,516
Expenditures:General government 5,008 5,822 6,466 6,716 7,339 5,782 5,290 5,262 6,665 8,651 Public safety 19,685 19,447 17,832 18,606 17,348 16,163 15,634 13,736 12,725 12,646 Social services 4,125 4,029 4,261 4,640 4,313 4,272 4,273 3,782 3,094 2,319 Public works 10,187 9,633 9,421 10,359 10,944 10,412 9,964 10,095 9,178 7,399 Education 84,067 84,690 83,893 82,866 91,194 74,223 70,592 65,363 61,880 60,521 Other 4,795 3,411 3,461 3,693 4,365 4,286 3,531 3,529 2,832 1,720 Capital outlay 16,954 34,905 18,274 10,826 6,102 6,337 3,707 3,929 2,679 5,508 Debt service:
Principal 3,915 3,475 3,530 2,835 3,356 3,616 3,975 3,928 4,180 4,135 Interest 1,075 1,297 713 1,199 1,342 1,425 1,631 1,759 1,998 2,517
Total expenditures 149,811 166,709 147,851 141,740 146,303 126,516 118,597 111,383 105,231 105,416
Excess of revenues over (under) expenditures (11,522) (16,878) (11,026) (12,233) (10,404) (8,363) (5,225) (4,814) 1,071 100
Other financing sources (uses):Transfers in 11,701 18,424 12,404 10,686 10,505 9,885 8,760 8,246 3,997 3,498 Transfers out (4,262) (10,147) (5,202) (3,553) (3,479) (3,666) (3,375) (3,240) (4,157) (3,498) Issuance of capital leases 804 192Bonds issued 9,680 10,545 2,940 2,810 3,120 Bond premium 181 125Refunding bonds issued 2,725 4,240 8,202 4,575 Payment to refunding bond escrow agent (2,760) (4,295) (8,128) (4,502)
Total other financing sources 17,265 9,081 17,817 10,073 7,026 6,411 5,385 7,890 3,033 -
Net change in fund balances 5,743 (7,797) 6,791 (2,160) (3,378) (1,952) 160 3,076 4,104 100
Fund Balances at Beginning of Year 10,907 18,704 11,913 14,073 17,451 19,403 19,243 16,167 * 12,891 12,791
Fund Balances at End of Year $ 16,650 $ 10,907 $ 18,704 $ 11,913 $ 14,073 $ 17,451 $ 19,403 $ 19,243 $ 16,995 $ 12,891
Debt Service as a Percentage of Noncapital Expenditures 3.69% 3.57% 3.32% 2.98% 3.36% 4.20% 4.91% 5.27% 5.99% 6.66%
* as restated
Notes:(1) Schedule prepared on the modified accrual basis of accounting.
88

TABLE 5CITY OF NORWICH, CONNECTICUT
ASSESSED AND ESTIMATED ACTUAL VALUE OF TAXABLE PROPERTY
LAST TEN FISCAL YEARS(In Thousands)
Total Adjusted TaxableTax Levy Assessed
Real Property (General Fund, Estimated Value as a StateGrand Industrial Gross Less Net CCD Fire Average Actual Percentage of Equalized
Fiscal List and Motor Personal Taxable Tax Exempt Taxable Taxes and Direct Rate Taxable Actual Taxable Net GrandYear Year Commercial Residential Vehicle Property Grand List Property Grand List TCD Taxes) (In Mills) Value Value List
2012 2010 $ 453,611 $ 1,663,064 $ 186,880 $ 132,490 $ 2,436,045 $ 41,816 $ 2,394,229 $ 63,162 $ 26.38 $ 3,420,327 70.00 % $ 2,942,694 2011 2009 467,731 1,656,685 202,209 118,062 2,444,687 36,522 2,408,165 60,982 25.32 3,440,236 70.00 3,147,981 2010 2008 433,291 1,666,402 194,403 114,906 2,409,002 30,891 2,378,111 58,839 24.74 3,397,301 70.00 3,400,922 2009 2007 344,640 1,235,104 208,756 112,575 1,901,075 24,841 1,876,234 57,972 30.90 2,680,334 70.00 3,615,569 2008 2006 341,360 1,225,489 183,186 92,878 1,842,913 23,384 1,819,529 55,469 30.49 2,599,327 70.00 3,559,366 2007 2005 326,636 1,213,923 177,323 93,706 1,811,588 19,898 1,791,690 53,057 29.61 2,559,557 70.00 3,592,741 2006 2004 326,235 1,190,123 165,690 90,463 1,772,511 27,325 1,745,186 49,389 28.30 2,493,123 70.00 3,276,807 2005 2003 408,784 1,095,366 153,492 100,570 1,758,212 24,916 1,733,296 46,563 26.86 2,476,137 70.00 2,502,936 2004 2002 273,991 679,020 154,864 83,388 1,191,263 25,168 1,166,095 45,234 38.79 1,665,850 70.00 2,512,264 2003 2001 270,108 669,398 152,670 82,207 1,174,383 28,500 1,145,883 43,449 37.92 1,636,976 70.00 2,155,512
Source: City of Norwich, Assessor’s Office, Connecticut Office of Policy and Management
Notes:(1) 2008 and 2003 Real property grand list is adjusted to reflect statutory revaluation.(2) Assessed Value is 70% of Estimated Actual Value.
89

TABLE 6
CITY OF NORWICH, CONNECTICUT
PRINCIPAL PROPERTY TAXPAYERS
OCTOBER 1, 2010 AND OCTOBER 1, 2001
October 1, 2010 October 1, 2001Taxable Percentage of Taxable Percentage ofAssessed Total Taxable Assessed Total Taxable
Business Name Nature of Business Value Rank Assessed Value Value Rank Assessed Value
Computer Science Corporation Computer Products & Services $ 32,494 1 1.36% $ 12,547 2 1.09%Bob’s Discount Furniture Retail Store & Distribution Warehouse 25,397 2 1.06% 4,837 8 0.42%Plaza Enterprises Shopping Center 14,782 3 0.62%Freeport-McMoran (fka Phelps Dodge) Manufacturing - Copper 14,064 4 0.59% 13,790 1 1.20%Mashantucket Pequot Tribe Real Estate 10,045 5 0.42% 7,639 3 0.67%Wal-Mart Stores, Inc. Department Store 10,010 6 0.42% 4,482 9 0.39%Dime Savings Bank Bank 9,506 7 0.40%SEA Norwich LLC Shopping Center 9,164 8 0.38%Algonquin Gas Transmissions LLC Natural Gas Pipeline 9,007 9 0.38%Norwich Community Development Corporation Office Building 8,870 10 0.37%Norwich Mall Realty Associates Shopping Center 7,255 4 0.63%Hamilton Park Wequonnoc Village Apartments 6,151 5 0.54%Kalimian Elias as Trustee Apartments 5,189 6 0.45%Norwich Realty Associates LP Real Estate 4,902 7 0.43%US Foodservice Food Distributors 4,138 10 0.36%
Total $ 143,339 5.99% $ 70,930 6.19%
Source: City of Norwich Assessor’s Office
Note:(1) The October 1, 2010 grand list was the base grand list utilized for the tax bills issued July 1, 2011 for the 2012 fiscal year.
90

TABLE 7CITY OF NORWICH, CONNECTICUT
PROPERTY TAX LEVIES AND COLLECTIONS
LAST TEN FISCAL YEARS(In Thousands)
Collections Within the FiscalFiscal Year of Levy Tax Tax Collections To DateYear Net Collections City Town
Ended Taxable Mill Adjusted Percentage In Subsequent Percentage Consolidated ConsolidatedJune 30, Grand List Rate Tax Levy Amount of Levy Years Amount of Levy District District
General Fund
2012 $ 2,394,228 24.76 $ 59,110 $ 57,141 96.67% $ - $ 57,141 96.67% 28.83 25.122011 2,408,165 24.04 57,006 54,816 96.16% 1,192 56,008 98.25% 28.02 24.402010 2,378,111 23.48 55,162 53,056 96.18% 1,524 54,580 98.94% 27.11 23.842009 1,876,234 29.24 54,309 52,081 95.90% 2,100 54,181 99.76% 34.10 29.662008 1,819,529 28.57 51,980 50,213 96.60% 1,722 51,935 99.91% 33.32 28.932007 1,791,750 27.77 49,971 48,324 96.70% 1,615 49,939 99.94% 32.02 28.082006 1,745,186 26.72 46,541 44,977 96.64% 1,530 46,507 99.93% 30.75 27.022005 1,733,296 25.69 43,999 42,681 97.00% 1,290 43,971 99.94% 29.53 25.902004 1,166,095 36.47 42,774 41,136 96.17% 1,621 42,757 99.96% 42.11 36.772003 1,145,883 35.62 41,064 39,438 96.04% 1,610 41,048 99.96% 41.11 35.92
City Consolidated District (CCD) Fire Tax
2012 $ 870,134 4.07 $ 3,496 $ 3,329 95.22% $ - $ 3,329 95.22%2011 870,134 3.98 3,426 3,251 94.89% 85 3,336 97.37%2010 870,088 3.63 3,136 2,991 95.38% 106 3,097 98.76%2009 650,100 4.86 3,154 2,981 94.51% 165 3,146 99.75%2008 641,583 4.75 3,064 2,930 95.63% 130 3,060 99.87%2007 633,603 4.25 2,724 2,595 95.26% 126 2,721 99.89%2006 620,505 4.03 2,511 2,399 95.54% 110 2,509 99.92%2005 614,657 3.84 2,332 2,233 95.75% 96 2,329 99.87%2004 392,560 5.64 2,227 2,142 96.18% 83 2,225 99.91%2003 390,492 5.49 2,157 2,072 96.06% 83 2,155 99.91%
Town Consolidated District (TCD) Volunteer Fire Relief Tax
2012 $ 1,524,094 0.36 $ 556 $ 544 97.84% $ - $ 544 97.84%2011 1,538,031 0.36 545 537 98.53% 8 545 100.00%2010 1,508,023 0.36 536 525 97.95% 11 536 100.00%2009 1,226,134 0.42 510 491 96.27% 18 509 99.80%2008 1,177,946 0.36 424 411 96.93% 13 424 100.00%2007 1,158,147 0.31 361 351 97.23% 10 361 100.00%2006 1,124,681 0.30 337 326 96.74% 11 337 100.00%2005 1,118,639 0.21 232 226 97.41% 6 232 100.00%2004 773,535 0.30 233 225 96.57% 9 234 100.43%2003 755,391 0.30 228 219 96.05% 9 228 100.00%
91
Total Direct Rates

TABLE 8CITY OF NORWICH, CONNECTICUT
RATIOS OF OUTSTANDING DEBT BY TYPE
LAST TEN FISCAL YEARS(In Thousands)
Ratio of Ratio ofGovernmental Activities Business-Type Activities Debt to Debt to
General General Total Taxable TotalFiscal Obligation Capital Obligation Capital Primary Assessed Personal Debt PerYear Bonds Leases Bonds Notes Leases Government Value Income Capita
2012 $ 29,951 $ 730 $ 7,454 $ 3,744 $ 1,621 $ 43,500 1.82% 4.12% $ 1,074 2011 26,736 804 4,904 4,269 1,717 38,430 1.60% 4.00% 949 2010 29,582 42 5,264 4,481 2,020 34,355 1.44% 4.75% 1,127 2009 21,936 80 5,624 4,027 2,688 34,355 1.83% 3.58% 944 2008 21,596 115 5,937 4,995 3,174 35,817 1.97% 4.78% 983 2007 24,952 146 6,576 5,430 1,402 38,506 2.15% 5.14% 1,058 2006 28,568 7,217 5,854 1,617 43,256 2.48% 5.76% 1,176 2005 32,700 * 7,795 * 6,269 2,222 48,986 2.83% 6.54% 1,352 2004 40,325 555 6,619 1,641 49,140 4.21% 6.56% 1,357 2003 40,945 630 7,019 1,806 50,400 4.40% 6.73% 1,415
* Sewer extension bonds converted to business-type activity
Notes:(1) 2008 and 2003 Real property taxable assessed value adjusted to reflect statutory revaluation.(2) Details regarding the City’s outstanding debt can be found in the notes to the financial statements.
92
Total Debt

TABLE 9CITY OF NORWICH, CONNECTICUT
STATEMENT OF DEBT LIMITATION
JUNE 30, 2012(In Thousands)
Total Tax Collections, Including Interest and Lien Fees $ 59,244 Total Tax Collections, Norwich Fire District 4,040 Reimbursement for Loss on:
Tax relief for elderly - freeze 10
Base $ 63,294
General Urban PensionPurpose Schools Sewers Renewal Deficit
Debt Limitation:2-1/4 times base $ 142,412 $ $ $ $4-1/2 times base 284,823 3-3/4 times base 237,353 3-1/4 times base 205,706 3 times base 189,882
Total debt limitation 142,412 284,823 237,353 205,706 189,882
Indebtedness:Bonds and serial notes payable 24,521 9,100 12,486 Bonds authorized and unissued 5,930 1,060 600 Grants receivable (198)
Total indebtedness 30,451 9,962 13,086 - -
Debt Limitation in Excess of Outstandingand Authorized Debt $ 111,961 $ 274,861 $ 224,267 $ 205,706 $ 189,882
Note 1: In no event shall total debt exceed seven times annual receipts from taxation. The maximum amount permitted would be $443 million.
Note 2: Bonds authorized and unissued represent bond authorizations for which bonds have been issued to partially finance the project or interim financing has been issued.
Note 3: Bonds and serial notes payable do not include Water bonds of $158 and State of Connecticut serial notes payable of $1,908.
Note 4: School Building Grants totaling $198 are applicable to outstanding bond issues.
93

TABLE 10
CITY OF NORWICH, CONNECTICUT
LEGAL DEBT MARGIN INFORMATION
LAST TEN FISCAL YEARS(In Thousands)
FISCAL YEAR2012 2011 2010 2009 2008 2007 2006 2005 2004 2003
Legal Debt Limit:Seven times taxable base $ 443,058 $ 427,106 $ 416,010 $ 416,010 $ 391,216 $ 369,635 $ 348,698 $ 333,578 $ 329,433 $ 320,343
Indebtedness:Bonds and serial notes payable 48,173 35,909 39,596 39,631 32,528 36,958 41,639 46,764 47,499 50,400 Bonds authorized and unissued 7,590 18,265 17,290 15,990 7,240 2,705 2,705 2,705 4,640 4,455
Total indebtedness 55,763 54,174 56,886 55,621 39,768 39,663 44,344 49,469 52,139 54,855
Less:Water bonds and serial notes payable (2,066) (3,151) (3,964) (3,968) (4,350) (4,729) (3,045) (3,357) (1,044) (1,139) School building grants (198) (300) (402) (507) (612) (722) (988) (1,262) (1,842) (1,943)
Net indebtedness applicable to legal debt limit (1) 53,499 50,723 52,520 51,146 34,806 34,212 40,311 44,850 49,253 51,773
Debt Limitation in Excess of Outstanding and Authorized Debt (1) $ 389,559 $ 376,383 $ 363,490 $ 364,864 $ 356,410 $ 335,423 $ 308,387 $ 288,728 $ 280,180 $ 268,570
Total net debt applicable to the limitas a percentage of debt limit 12.07% 11.88% 12.62% 12.29% 8.90% 9.26% 11.56% 13.45% 14.95% 16.16%
Total indebtedness as a percentage ofnet taxable assessed value (1) 2.23% 2.11% 2.21% 2.726% 1.913% 1.909% 2.310% 2.588% 4.224% 4.518%
Total indebtedness per capita (1) $ 1,321 $ 1,253 $ 1,433 $ 1,406 $ 956 $ 940 $ 1,099 $ 1,238 $ 1,360 $ 1,453
Calculation of Continuing Disclosure Agreement Ratios:Total indebtedness per legal debt limit calculation $ 55,763 $ 54,174 $ 56,886 $ 55,621 $ 39,768 $ 39,663 $ 44,344 $ 49,469 $ 52,139 $ 54,855 Less authorized and unissued debt (7,590) (18,265) (17,290) (15,990) (7,240) (2,705) (2,705) (2,705) (4,640) (4,455)
Total direct debt 48,173 35,909 39,596 39,631 32,528 36,958 41,639 46,764 47,499 50,400 Less water and sewer indirect self-funding debt (10,926) (9,650) (9,745) (9,650) (10,932) (12,006) (13,071) (14,064) (7,089) (6,079) Less school building grants (198) (300) (402) (507) (612) (722) (988) (1,262) (1,842) (1,943)
Total Net Direct Debt $ 37,049 $ 25,959 $ 29,449 $ 29,474 $ 20,984 $ 24,230 $ 27,580 $ 31,438 $ 38,568 $ 42,378
Total direct debt as a percentage of State Equalizedgrand list 1.637% 1.141% 1.164% 1.096% 0.914% 1.029% 1.271% 1.868% 1.891% 2.338%
Total direct debt per capita $ 1,190 $ 887 $ 1,081 $ 1,089 $ 893 $ 1,015 $ 1,135 $ 1,291 $ 1,311 $ 1,415
Total net debt as a percentage of State Equalizedgrand list 1.259% 0.825% 0.866% 0.815% 0.590% 0.674% 0.842% 1.256% 1.535% 1.966%
Total net debt per capita $ 915 $ 641 $ 804 $ 810 $ 576 $ 666 $ 752 $ 868 $ 1,065 $ 1,189
(1) Total and net indebtedness calculated in accordance with Connecticut General Statutes.(2) The City has no overlapping debt.(3) The Equalized Net Grand List is calculated annually by the State of Connecticut Office of Policy & Management. The latest available figures are for grant list 10/1/2008.
94

TABLE 11CITY OF NORWICH, CONNECTICUT
DEMOGRAPHIC AND EMPLOYMENT STATISTICS
LAST TEN FISCAL YEARS
Percentage Unemployed (3)(in thousands) New
Total Median London/Fiscal Personal School Household City of Norwich State of UnitedYear Population (1) Income (6) Enrollment (2) Employed (3) Unemployed (3) Income (5) Norwich (3) Market (3) Connecticut (3) States (4)
2012 40,493 $ 1,055,463 5,330 20,719 2,110 $ 52,186 9.2% 8.6% 8.4% 8.2%2011 40,493 960,133 5,356 19,386 2,177 N/A 10.1% 8.7% 9.0% 9.1%2010 36,639 960,133 5,449 19,315 2,090 47,851 9.8% 8.6% 8.9% 9.6%2009 36,388 960,133 5,519 19,231 1,858 48,505 8.8% 7.6% 7.9% 9.5%2008 36,408 749,139 5,544 19,706 1,448 48,064 6.8% 5.9% 5.9% 6.0%2007 36,408 749,139 5,531 20,083 1,033 46,907 4.9% 4.2% 4.4% 4.6%2006 36,693 749,139 5,645 20,284 1,044 43,608 4.9% 4.2% 4.4% 4.6%2005 36,218 749,139 5,425 20,033 1,248 42,656 5.9% 4.9% 5.3% 4.9%2004 36,218 749,139 5,507 19,745 1,207 42,075 5.8% 4.3% 4.8% 5.8%2003 35,628 749,139 5,491 19,561 1,239 42,113 6.0% 4.6% 5.2% 6.5%
Sources:(1) State of Connecticut Department of Public Health, US Census Bureau(2) U.S. Census Bureau, 2000 Census and 2006-2010 American Community Survey(3) School enrollment includes Norwich students attending the quasi-private high school, Norwich Free Academy.(4) Labor Department, State of Connecticut.(5) U.S. Department of Labor Bureau of Labor Statistics(6) Connecticut Economic Resource Center, Inc. and 2006-2010 American Community Survey
95

TABLE 12CITY OF NORWICH, CONNECTICUT
PRINCIPAL EMPLOYERS
CURRENT YEAR AND 2003
2003Percentage Percentage
of Total City of Total CityBusiness Name Nature of Business Employees Rank Employment Employees Rank Employment
William W. Backus Hospital Medical Center 1,687 1 8.14% 1,537 1 7.86%
City of Norwich (incl. NPU & BOE) Municipality 991 2 4.78% 944 2 4.83%
State of Connecticut All State agencies 966 3 4.66% 166 7 0.85%
Bob’s Discount Furniture Retail Store & Warehouse 530 4 2.56%
Electric Boat Engineering for submarines 485 5 2.34%
Interim Healthcare of Eastern CT Healthcare 400 6 1.93%
The American Group Ambulance Service and other operations 303 7 1.46% 200 5 1.02%
ShopRite Grocery Store 268 8 1.29%
Norwich Free Academy Quasi-private high school 264 9 1.27%
Computer Science Corporation Computer Products & Services 250 10 1.21% 476 3 2.43%
US Foodservice Food Distributors 250 4 1.28%
Phelps Dodge Manufacturing - Copper 177 6 0.90%
Ortronics Communication Technology 160 8 0.82%
Gunther International Light Machinery Assembly 150 9 0.77%
Total 6,144 29.65% 4,060 20.76%
Source: Norwich Community Development Corporation
96
2012

TABLE 13CITY OF NORWICH, CONNECTICUT
BUDGETED FULL-TIME EQUIVALENT CITY GOVERNMENT EMPLOYEES BY FUNCTION/PROGRAM
LAST TEN FISCAL YEARS
2012 2011 2010 2009 2008 2007 2006 2005 2004 2003General City: City Manager 2.0 2.0 3.0 3.0 3.0 3.0 3.0 3.0 3.0 3.0 Finance 12.0 12.0 12.0 14.0 15.0 14.0 14.0 14.0 14.0 15.0 Treasurer 3.0 3.0 3.0 3.0 3.0 3.0 3.0 3.0 3.0 3.0 Assessment 4.0 4.0 4.0 4.0 4.0 4.0 3.5 3.5 3.5 4.0 Personnel 3.6 4.5 4.5 4.5 4.5 4.5 4.5 4.5 4.5 5.5 City Clerk 4.0 5.0 5.0 6.0 6.0 5.0 5.0 5.0 5.0 5.0 City Council 2.0 2.0 2.0 2.0 2.0 2.0 2.0 2.0 2.0 2.0 Police 100.0 94.0 96.0 98.0 98.0 100.0 100.0 101.0 100.5 102.5 Fire 59.6 59.5 59.5 59.5 59.5 55.5 55.5 55.5 55.0 55.5 Recreation 5.5 6.0 6.0 7.0 7.0 7.0 7.0 7.0 6.0 9.0 Human Services 7.0 8.5 8.5 8.5 8.5 8.5 8.5 8.5 8.5 10.5 Senior Citizens Center 6.5 6.5 6.5 7.0 7.0 6.0 6.0 6.0 6.0 7.0 Youth Service Bureau 2.0 2.0 2.0 3.0 3.0 3.0 3.0 3.0 3.0 5.0 PW Engineering and Administration 5.0 6.0 6.0 6.0 6.0 6.0 7.0 7.0 6.5 8.0 PW Fleet Maintenance 7.0 7.0 7.0 9.0 9.0 9.0 9.0 9.0 9.0 10.0 PW Solid Waste 3.0 3.0 3.0 3.0 3.0 2.0 2.0 3.0 3.0 3.0 PW Street Maintenance 36.0 38.0 39.0 41.0 41.0 32.0 32.0 33.0 33.0 35.0 PW Parks & Cemeteries 0.0 0.0 0.0 0.0 0.0 9.0 9.0 10.0 11.0 12.0 PW Building Maintenance 8.0 8.0 9.0 9.0 9.0 7.0 6.0 7.0 7.0 8.0 PW Parking Maintenance 1.0 1.0 1.0 2.0 2.0 2.0 2.0 2.0 2.0 2.0 Election 2.0 2.0 2.0 2.5 2.5 2.5 2.5 2.5 2.5 3.0 Planning and Neighborhood Services 10.0 12.0 13.0 14.5 14.5 13.0 13.0 12.0 11.0 12.5 Economic Development 0.0 0.0 0.0 0.0 0.0 0.0 0.0 0.0 0.0 0.0 Emergency Management 1.0 1.0 1.0 1.0 1.0 1.0 1.0 1.0 1.0 1.0 Tourism 0.0 0.0 0.0 0.5 0.5 0.5 0.5 0.5 0.5 0.5 Total General City 284.2 287.0 293.0 308.0 309.0 299.5 299.0 303.0 300.5 322.0
Board of Education: General Fund - funded positions 342.5 286.4 392.1 406.4 387.5 384.2 373.8 386.3 375.9 392.1 State and federal grant - funded positions 65.7 193.0 125.3 125.3 111.3 117.1 114.1 99.8 86.6 74.7 School Lunch (state and federal grant) 37.5 46.0 30.0 30.0 39.0 39.0 39.0 39.0 40.0 42.0 Adult Education (state and federal grant) 12.0 12.0 12.0 12.0 12.0 13.0 13.0 13.0 12.0 11.0 Family Resource Center (state grant) 24.5 24.5 24.5 24.5 25.5 22.0 24.0 10.0 10.0 10.0 Total Board of Education 482.2 561.9 583.9 598.2 575.3 575.3 563.9 548.0 524.5 529.8
Norwich Public Utilities 152.0 142.5 139.5 139.5 137.0 137.0 137.0 137.0 136.5 138.0
Total 918.4 991.4 1,016.4 1,045.7 1,021.3 1,011.8 999.9 988.0 961.5 989.8
Source: City Adopted Budget documents
FISCAL YEAR
97

TABLE 14CITY OF NORWICH, CONNECTICUT
OPERATING INDICATORS BY FUNCTION/PROGRAM
LAST TEN FISCAL YEARS
Function 2012 2011 2010 2009 2008 2007 2006 2005 2004 2003
General Government:Finance:Number of tax and refuse bills mailed 50,175 49,950 50,000 68,000 68,000 68,144 68,182 67,225 66,048 65,643 Number of internal control reviews performed 2 2 3 3 3 7 2 7 4 -
Assessor:Number of deeds processed 982 1,132 1,500 2,550 1,500 1,310 2,100 1,800 1,600 998 Personal property declarations 1,795 1,856 1,650 1,130 1,200 1,234 1,400 N/A N/A N/ABoard of assessment appeals adjustments 37 77 147 100 230 240 150 225 425 249
Human Resources:Number of applications processed 1,475 476 960 1,067 2,339 1,149 1,518 1,850 1,221 1,801 Vacancies filled through promotion 14 4 6 11 35 15 24 12 28 20 Vacancies filled through new hires 19 2 8 21 39 28 23 33 33 22
Employee turnover rate 7.0% 6.0% 5.6% 2.0% 4.6% 6.0% 4.2% 5.4% 7.1% 3.7%City Clerk:Land records recorded 6,154 5,753 6,364 6,486 7,891 9,532 11,124 11,397 11,401 9,882 Marriage licenses issued 301 270 323 326 305 331 357 353 372 265 Death certificates recorded 509 520 472 508 458 550 561 638 542 579 Birth certificates recorded 940 884 978 960 1,070 1,037 998 1,210 1,594 1,220
Management Information Systems:Help desk calls 1,995 2,360 1,900 1,600 1,380 1,800 1,700 1,700 1,800 1,250 Website visits 200,043 170,527 165,923 149,317 130,000 256,817 94,797 27,500 27,500 12,000
Election:Voters added 667 1,060 438 3,289 1,202 580 567 1,200 1,096 1,273 Voters removed 683 1,235 1,001 813 964 651 87 800 1,058 1,249 Voter changes 2,021 3,049 2,376 2,303 1,139 1,425 1,648 650 927 1,324 Total voters 20,474 20,951 21,126 21,689 18,129 17,891 18,346 19,000 17,987 17,863
Planning and Neighborhood Services:Site development plans 4 15 7 16 31 27 19 18 21 8 Zoning permit applications 672 398 327 370 446 482 503 471 456 137 Zoning complaints 351 185 167 240 248 170 130 142 138 57 Code violations 572 1,975 1,285 1,361 1,633 250 1,170 475 465 169 Citations issued 375 225 287 240 180 229 165 119 208 94
Education:Average Class Size - Kindergarten 18.5 18.4 18.3 18.3 17.5 17.7 18.0 16.4 17.8 N/AAverage Class Size - Grade 2 19.4 18.1 17.9 18.8 18.9 20.0 18.6 19.5 18.2 N/AAverage Class Size - Grade 5 20.3 21.2 21.0 19.1 18.9 19.1 20.0 20.5 20.4 N/AAverage Class Size - Grade 7 19.8 17.1 20.1 21.1 19.0 23.7 22.0 21.9 21.2 N/ATotal expenditure per student N/A $ N/A $ 13,398 $ 13,142 $ 12,616 $ 11,594 $ 10,771 $ 9,816 $ 9,450 $ 9,219
(Continued on next page)
98
FISCAL YEAR

TABLE 14CITY OF NORWICH, CONNECTICUT
OPERATING INDICATORS BY FUNCTION/PROGRAM (CONTINUED)
LAST TEN FISCAL YEARS
Function 2012 2011 2010 2009 2008 2007 2006 2005 2004 2003
Public Safety:Police:911 calls* 23,064 21,825 20,548 20,291 21,330 19,212 19,160 19,575 N/A N/ANon-emergency calls* 32,499 36,078 35,815 38,846 30,329 33,740 35,664 20,932 N/A N/ADWI arrests* 207 241 212 252 158 155 150 188 N/A N/A
Fire:Central Fire Department Service Calls 2,422 2,330 2,659 2,442 2,627 2,629 2,942 2,503 3,088 2,571 East Great Plain VFD Service Calls 936 961 855 912 1,015 864 866 800 688 688 Laurel Hill VFD Service Calls 106 121 85 117 102 75 105 126 93 102 Occum VFD Service Calls N/A 191 182 199 192 202 232 238 325 207 Taftville VFD Service Calls 713 706 717 614 698 631 539 538 450 495 Yantic VFD Service Calls 621 643 658 544 604 593 580 568 595 530
Emergency Management:Hours of emergency training N/A 1,075 775 725 875 715 870 1,250 920 70 Shelters maintained N/A 19 19 19 19 19 19 19 19 18 Flood assistance calls N/A 217 176 74 74 122 73 41 62 N/A
Social Services:Recreation:Number of youth registrations 3,671 4,500 4,600 4,618 3,870 4,510 4,750 4,732 4,821 4,235 Number of youth program hours 3,530 1,900 1,900 1,980 2,045 2,205 2,000 1,970 1,971 N/AAdults & Seniors registrations 86 N/R N/R N/R N/R N/R N/R N/R N/R N/RAdults & Seniors program hours 401 N/R N/R N/R N/R N/R N/R N/R N/R N/R
Human Services:General Human Services: Job placements 251 185 206 190 190 243 153 119 133 989 Individuals relocated due to condemnation 50 78 49 77 72 36 30 85 55 74 Rent and housing assistance cases 107 92 117 139 94 83 79 80 49 139
Senior Center:Preventative health clinic services 10,059 8,560 2,500 2,550 2,500 3,450 3,206 4,500 4,900 4,260 Outreach services 627 890 970 978 753 976 836 200 280 490
Youth and Family Services:Counseling cases 95 97 126 130 142 143 117 168 175 135 Young parent cases 37 18 40 35 78 98 92 107 97 68 Youth employment 121 152 148 94 N/A N/A N/A N/A N/A N/AJuvenile justice / diversion 33 37 31 44 N/A N/A N/A N/A N/A N/A
Public Works:Engineering and Administration: Road miles paved 4.8 6.4 4.8 6.4 4.7 5.3 4.2 3.0 6.6 6.0Road miles chip sealed or crack sealed 3.0 N/R N/R N/R N/R N/R N/R N/R N/R N/R
Department of Public Utilities: Gas service calls 3,989 4,131 4,229 5,004 4,967 6,136 5,552 6,294 4,740 5,328 Electric service calls 3,570 1,771 1,640 1,830 1,508 3,125 2,406 3,010 2,672 1,606 Water service calls 1,910 3,053 2,988 3,653 3,440 3,434 4,717 4,542 3,580 3,125 Sewer service calls 120 80 78 164 402 423 341 250 237 -
N/A - not available* Statistics are reported on a calendar year basis. For example, in the fiscal year 2006 column, these are the statistics for calendar year 2005.
Source: The respective City DepartmentsN/A - not availableN/R - Not reported previously
99
FISCAL YEAR

TABLE 15CITY OF NORWICH, CONNECTICUT
CAPITAL ASSET STATISTICS BY FUNCTION
LAST TEN FISCAL YEARS
2012 2011 2010 2009 2008 2007 2006 2005 2004 2003
Education:School buildings 13 13 13 15 15 15 15 15 14 14 Administrative buildings 1 1 1 1 1 1 1 1 1 1
Public Safety:Police:Stations 1 1 1 1 1 1 1 1 1 1 Vehicles 39 39 39 39 39 39 39 39 39 39
Fire:Firefighting/rescue vehicles 27 27 27 27 26 26 26 26 26 26 Other vehicles 11 11 11 11 11 11 11 11 11 11 Fire stations 7 7 7 7 7 7 7 7 7 7
Social Services:Recreation:Number of basketball courts 16 16 16 16 16 16 16 16 15 15 Number of football fields 1 1 1 1 1 1 1 1 1 1 Number of multi-use fields 15 15 15 15 15 15 15 15 15 15 Number of playgrounds 14 14 14 14 14 14 14 14 13 13 Number of soccer fields 4 4 4 4 4 4 4 4 4 4 Number of softball fields 5 5 5 5 5 5 5 5 5 5 Number of tennis courts 10 10 10 10 10 10 10 10 10 10 Mowers 5 5 5 5 5 5 5 5 5 5 Other vehicles 5 5 5 5 4 4 4 4 4 4
Public Works:Street Maintenance:
Dump trucks 23 23 23 23 23 25 25 25 25 25 Sweepers 3 4 4 4 4 4 4 4 4 4
Parks and Cemeteries:Parks 7 7 7 7 7 7 7 7 7 7 Cemeteries 8 8 8 8 8 8 8 8 8 8 Mowers 11 10 10 10 10 8 8 7 6 -
(Continued on next page)
100
FISCAL YEAR

TABLE 15CITY OF NORWICH, CONNECTICUT
CAPITAL ASSET STATISTICS BY FUNCTION (CONTINUED)
LAST TEN FISCAL YEARS
2012 2011 2010 2009 2008 2007 2006 2005 2004 2003
Building Maintenance:Parking lots 12 12 12 12 12 9 9 9 9 9 Parking garages 4 3 3 3 3 3 3 3 3 3
Utilities:Gas:
Gas distribution main (miles) 141 133 133 131 130 129 127 126 122 122 Electric:
Distribution lines 229 231 230 229 228 228 228 250 250 250 Street lights 4290 4290 4,103 4,109 4,109 4,099 4,291 4,291 4,291 4,291
Water:Water distribution system (miles) 190 194 188 188 187 187 164 150 150 150
Sewer:Sewer distribution system (miles) 121 124 117 119 118 118 118 118 118 118
Fiber Optic:Fiber optic cable (miles) 65 65 68 67
Source: The respective City Departments
101
FISCAL YEAR