Embed Size (px)
Citation preview
Connecticut Department ofEnergy and Environmental Protection
Connecticut Department of Energy and Environmental Protection
Leading By Example Update: Improving Energy Management at Connecticut State Facilities
Office of Energy DemandBureau of Energy and Technology Policy
May 31, 2018

Connecticut Department of Energy and Environmental ProtectionConnecticut Department of Energy and Environmental Protection
2017 Highlights
Achieved key progress in energy analytics
Established electronic data flow from utilities to state platform for analyzing energy
Purchased competitive electricity supply for all agencies at pricing below standard offer
Progress installing upgrades at CT Valley Hospital campus;
Bond funding for major efficiency upgrades fully expended in 2017;
Multiple agencies successfully completed minor efficiency upgrades

Connecticut Department of Energy and Environmental Protection
Many State Facilities = Many Opportunities to Improve Energy Use
Per CGS 16a-37u:(a)The Commissioner of Energy and Environmental Protection
shall be responsible for planning and managing energy use in state-owned and leased buildings

Connecticut Department of Energy and Environmental ProtectionConnecticut Department of Energy and Environmental Protection
State Owned Structures
(3822)66.9 million total
square feet
33 agencies/districts owning structures
(i.e., unique agency code numbers)
State Leased Buildings (189 ) 2.9 million total
square feet
~70 million square feet of state structures
Source: CT Office of Policy and Management, JESTIR database 2017

Connecticut Department of Energy and Environmental ProtectionConnecticut Department of Energy and Environmental Protection
Context: CT Government buildings are 11-15% of Commercial & Industrial sector electricity consumption
Source: Eversource Data and Graphic, 2015

Connecticut Department of Energy and Environmental ProtectionConnecticut Department of Energy and Environmental Protection
Advantages of Energy Planning
Tracks energy cost and consumption down to the building level for
all state agencies.
Allows agencies to track energy and
greenhouse gas data.
Creates target goals for reducing energy
consumption.
Ensures the ability to measure energy
savings.
Can identify savings opportunities related
to energy billing.
CT DEEP plans and implements actions to improve energy management in state buildings consistent with CGS 16a-35k and 22a-1a, pursuant to CGS 16a-6, CGS 16a-37t, 16a-37u,16a-37x, 16a-38a, 16a-38b, 16a-38i, 16a-38l, and 16a-39b.

Connecticut Department of Energy and Environmental ProtectionConnecticut Department of Energy and Environmental Protection
Agency Analyses
Connecticut Department of Energy and Environmental ProtectionConnecticut Department of Energy and Environmental Protection
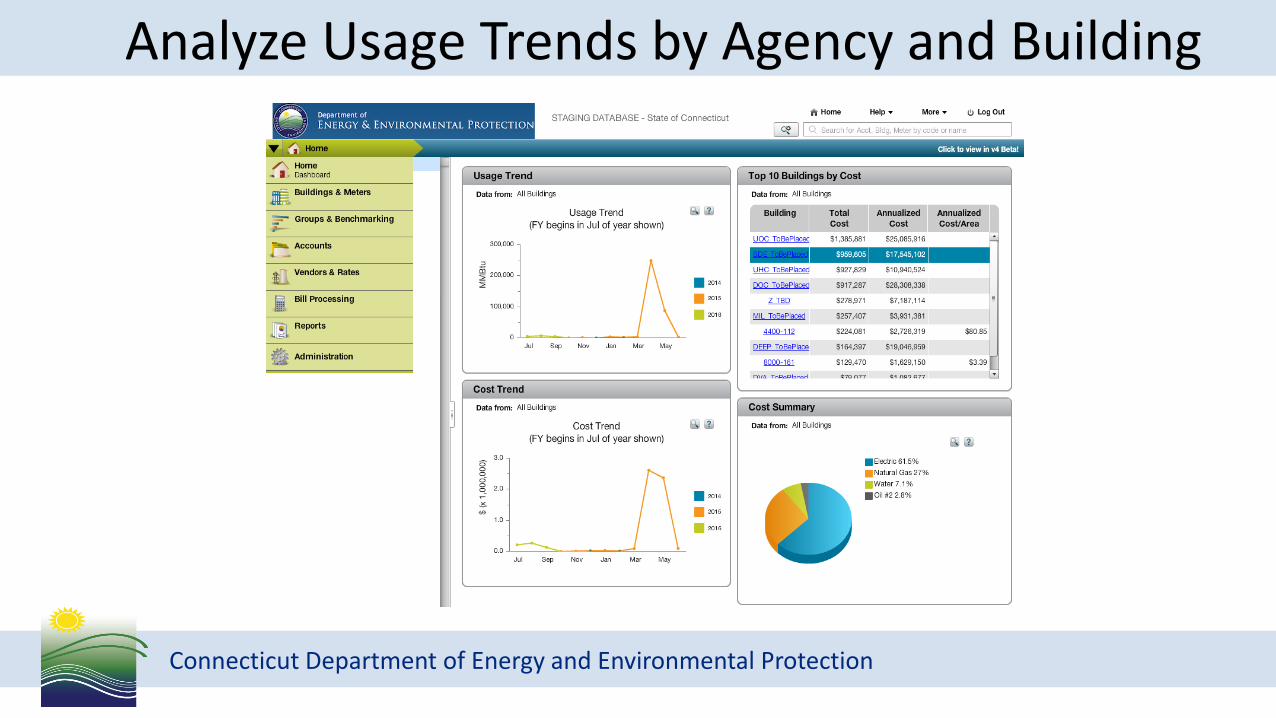
Analyze Usage Trends by Agency and Building
Connecticut Department of Energy and Environmental ProtectionConnecticut Department of Energy and Environmental Protection
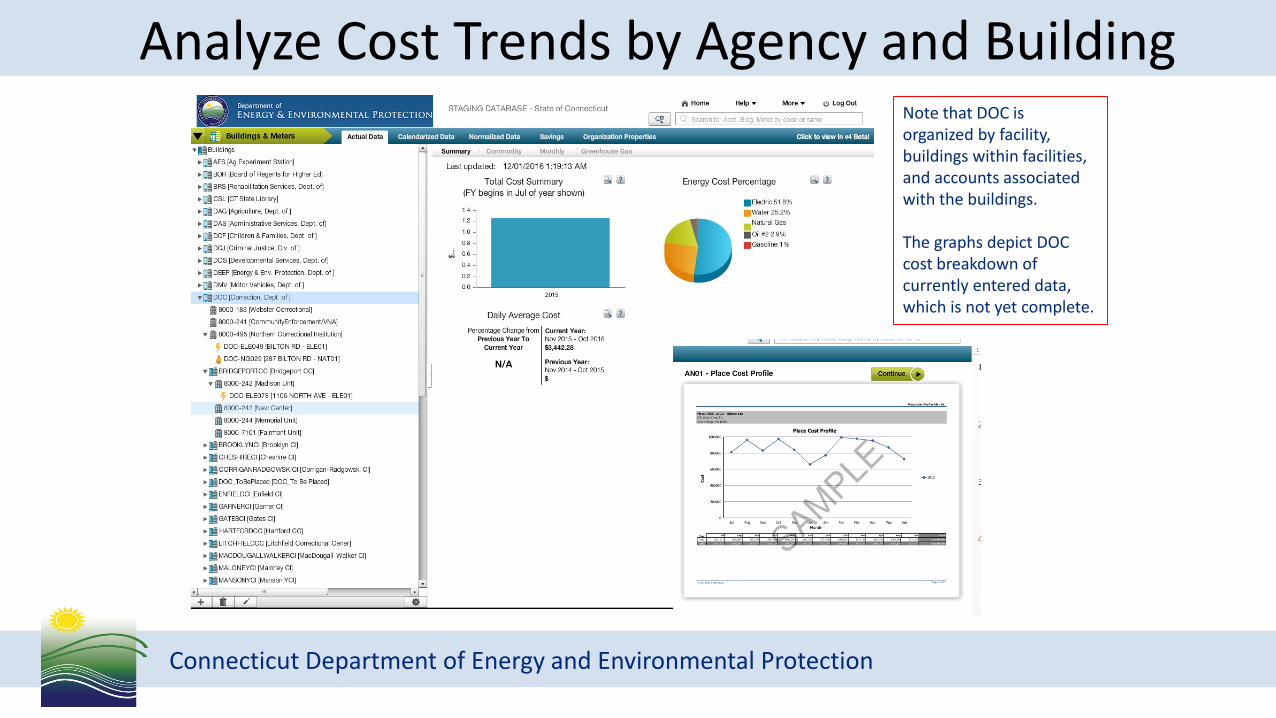
Analyze Cost Trends by Agency and BuildingNote that DOC is organized by facility, buildings within facilities, and accounts associated with the buildings.
The graphs depict DOC cost breakdown of currently entered data, which is not yet complete.

Connecticut Department of Energy and Environmental ProtectionConnecticut Department of Energy and Environmental Protection
State Energy Accounts by Commodity*
Estimated 611 million Annual total kWh | 2.5 million DTh Natural Gas*Based on Best Estimates from CT DEEP data from state fiscal year 2017; data not complete
3816
1032
360
1006
198
0
500
1000
1500
2000
2500
3000
3500
4000
4500
Electric Natural Gas Deliverable Fuels Water Other
Electric|Natural Gas|Fuel|Water|Other Accounts
Connecticut Department of ENERGY & ENVIRONMENTAL PROTECTION
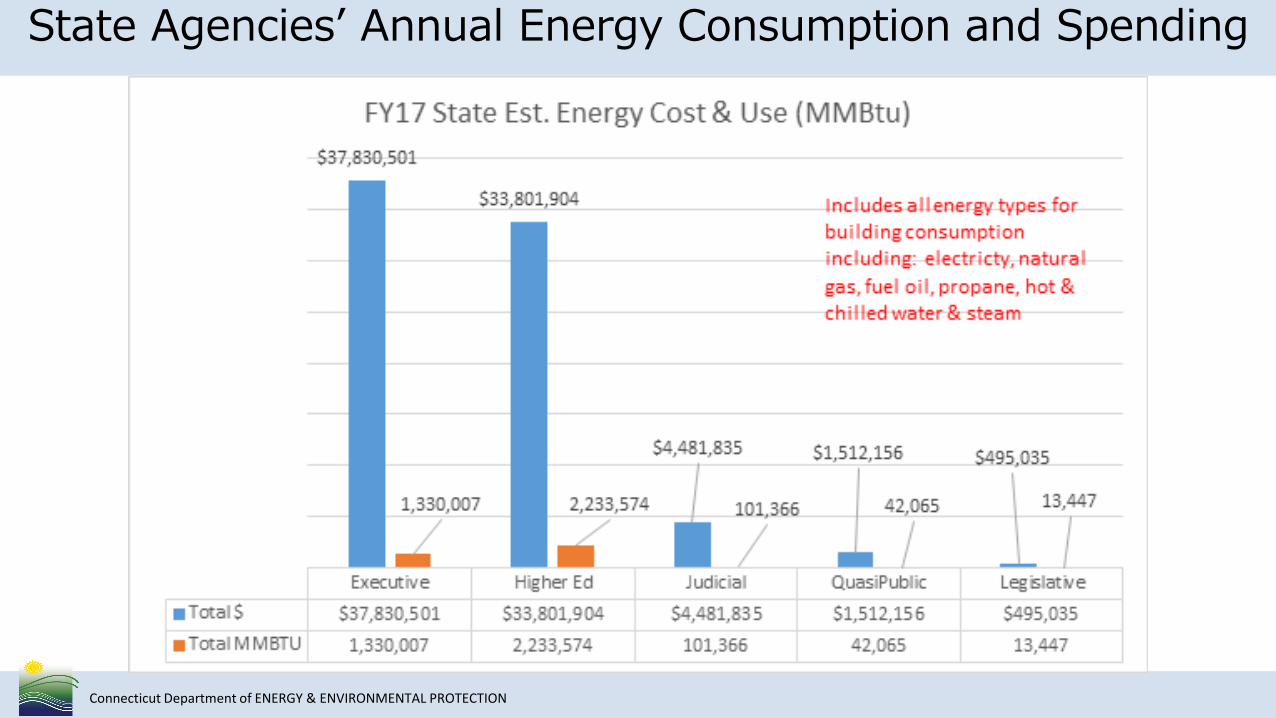
State Agencies’ Annual Energy Consumption and Spending

Connecticut Department of ENERGY & ENVIRONMENTAL PROTECTION
Connecticut’s State Government Real Estate [square feet]
– Approximately 70 million square feet
– Roughly 3800 buildings
– Nearly ½ are educational facilities [UCONN, CSCU, CT Technical High School System]
CSCU, 22%
DAS, 10%
DCF, 1%DOC, 8%
DDS, 2%
DEEP, 2%DMHAS, 4%DPS, 1%
DOT, 10%DVA, 1%
Joint Committee On Legislative Management, 1%
JUD, 4%
MIL, 3%OPM, 1%
SDE, 5%
UCONN, 18%
UCH, 6%
Gross Square Feet of Floor Space by Agency
Source: CT Office of Policy and Management, JESTIR database 2017
Connecticut Department of ENERGY & ENVIRONMENTAL PROTECTION
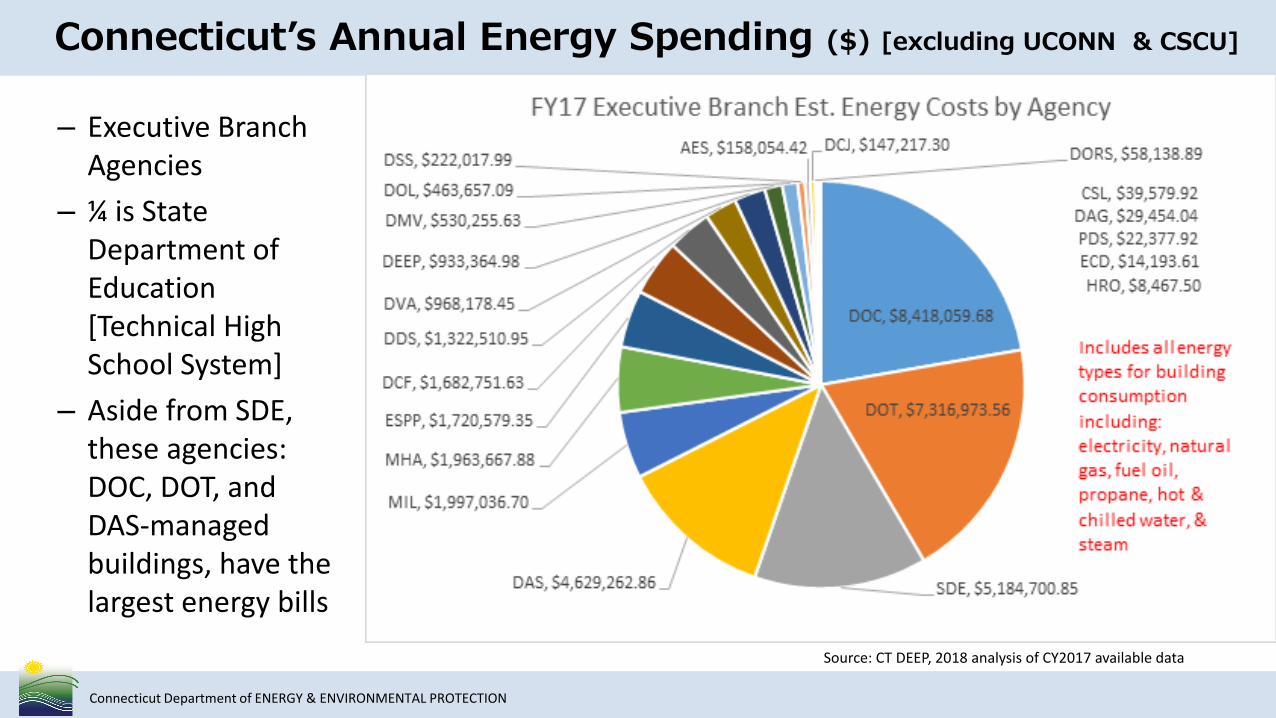
Connecticut’s Annual Energy Spending ($) [excluding UCONN & CSCU]
– Executive Branch Agencies
– ¼ is State Department of Education [Technical High School System]
– Aside from SDE, these agencies: DOC, DOT, and DAS-managed buildings, have the largest energy bills
Source: CT DEEP, 2018 analysis of CY2017 available data
Connecticut Department of ENERGY & ENVIRONMENTAL PROTECTION
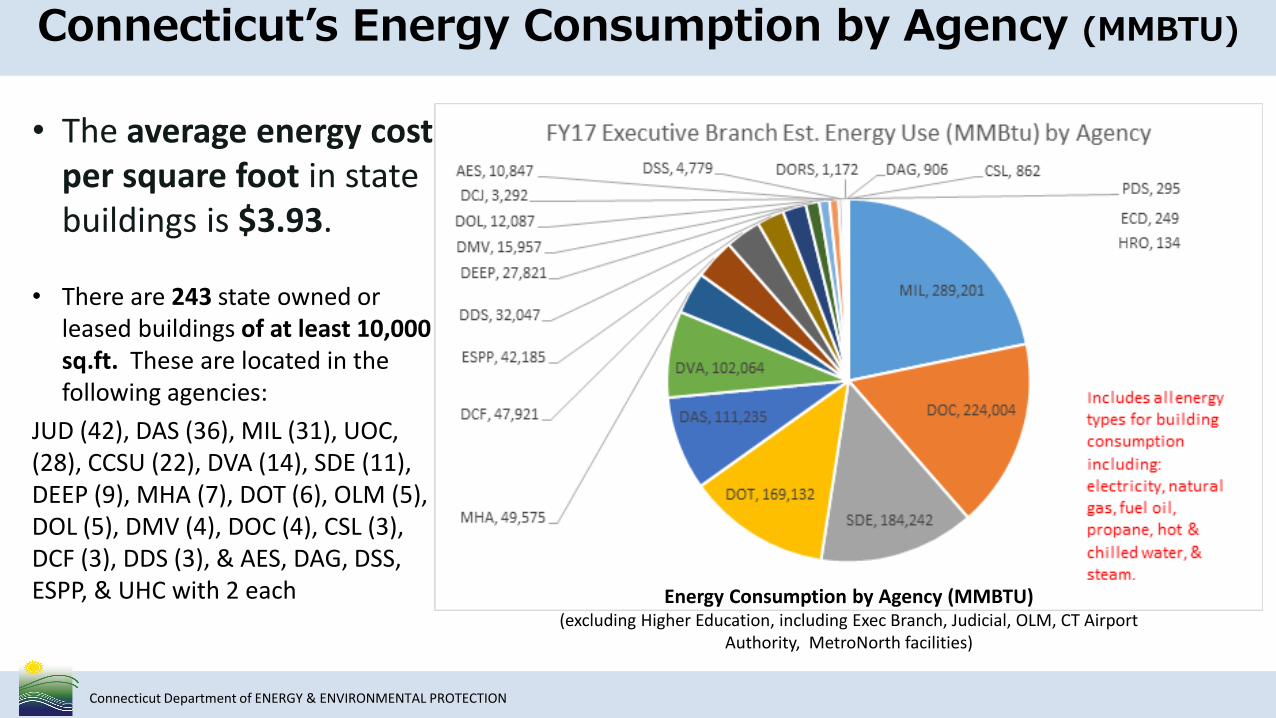
Connecticut’s Energy Consumption by Agency (MMBTU)
• The average energy cost per square foot in state buildings is $3.93.
• There are 243 state owned or leased buildings of at least 10,000 sq.ft. These are located in the following agencies:
JUD (42), DAS (36), MIL (31), UOC, (28), CCSU (22), DVA (14), SDE (11), DEEP (9), MHA (7), DOT (6), OLM (5), DOL (5), DMV (4), DOC (4), CSL (3), DCF (3), DDS (3), & AES, DAG, DSS, ESPP, & UHC with 2 each Energy Consumption by Agency (MMBTU)
(excluding Higher Education, including Exec Branch, Judicial, OLM, CT Airport Authority, MetroNorth facilities)
Connecticut Department of ENERGY & ENVIRONMENTAL PROTECTION
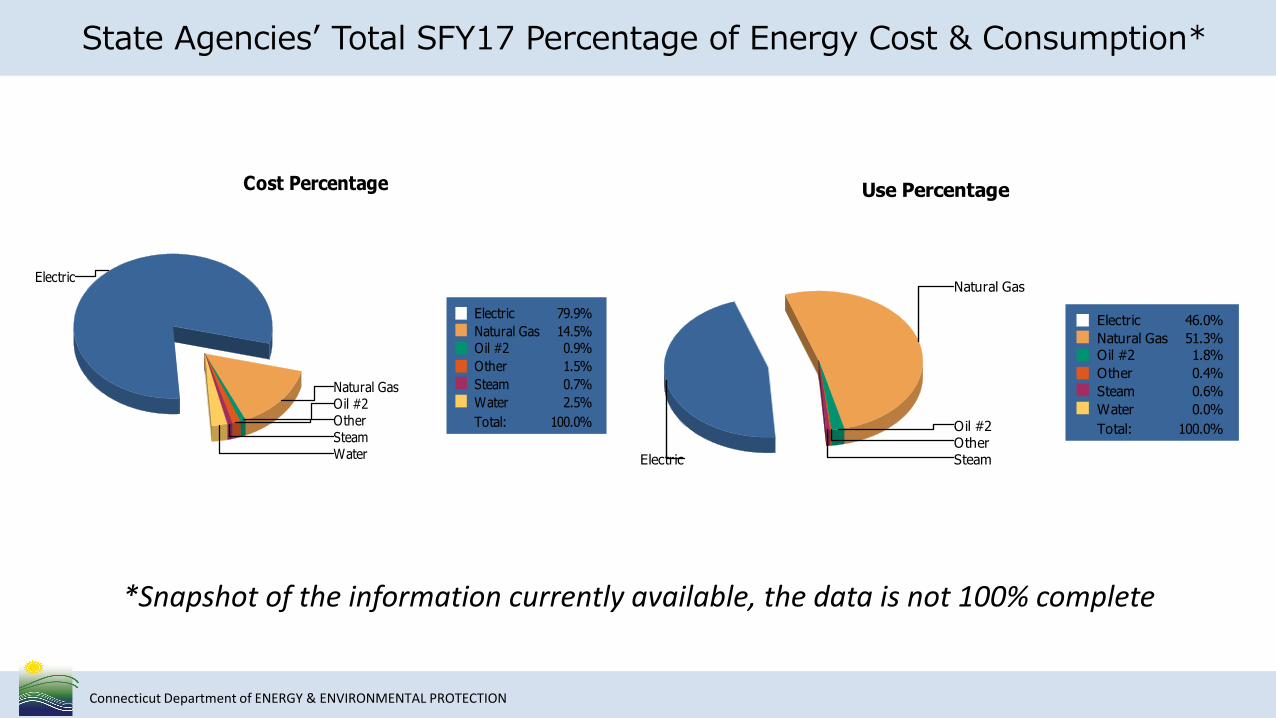
State Agencies’ Total SFY17 Percentage of Energy Cost & Consumption*
Electric
Natural GasOil #2OtherSteamWater
Electric 79.9%
Natural Gas 14.5%Oil #2 0.9%
Other 1.5%
Steam 0.7%
Water 2.5%
Total: 100.0%
Cost Percentage
Natural Gas
Oil #2OtherSteamElectric
Electric 46.0%
Natural Gas 51.3%Oil #2 1.8%
Other 0.4%
Steam 0.6%
Water 0.0%
Total: 100.0%
Use Percentage
*Snapshot of the information currently available, the data is not 100% complete

Connecticut Department of Energy and Environmental ProtectionConnecticut Department of Energy and Environmental Protection
State Facilities Analyses: Examples of Buildings with High Energy Costs
Top 25 Buildings by Estimated Annualized Cost (less Higher Education)
Building Name Location ID Agency Sq. Ft. Est. Annualized Cost
Hangar - TASMG CTNG - TASMG Groton 2201-46 MIL Owned 126,841 $3,231,078.89
MacDougall Correctional Institution MacDougall CI, Suffield 8000-161 DOC Owned 480,680 $1,565,736.96
State Armory Westbrook Westbrook Armory 2201-73 MIL Owned 13,929 $1,557,647.01
State Armory Vernon/Rockville CTNG Vernon-Rockville 2201-71 MIL Owned 13,999 $1,094,918.80
470 Capitol Ave Hartford 1326-486 DAS Owned 31,735 $1,026,704.86
Connecticut River Plaza Hartford 1326-8240 DAS Owned 914,457 $941,034.48
Barracks - 803 CTNG Camp Nianic E Lyme 2201-206 MIL Owned 19,191 $916,104.98
505 Hudson St Hartford 1326-481 DAS Owned 155,264 $910,134.92
GA20 Courthouse Norwalk Norwalk 9001-20 JUD Owned 33,000 $865,377.58
Barracks - 802 CTNG Camp Nianic E Lyme 2201-205 MIL Owned 19,191 $856,293.65
Dept of Insurance 960 Main, Hartford 064-12 DAS Leased 41,887 $800,084.02
Administration Building - HQ Newington 5000-4252 DOT Owned 363,719 $700,455.56
Office Building 55 Farmington Hartford 1326-8239 DAS Owned 384,808 $590,945.95
79 Elm St Hartford 1326-32 DAS Owned 280,300 $582,914.23
Southeastern Mental Health Uncas On Thames, Norwich 1303-530 DAS Owned 55,264 $541,323.76
Norwich Branch Norwich 2101-9 DMV Owned 5,014 $535,117.08
25 Sigourney St Hartford 1326-480 DAS Owned 467,000 $516,258.89
Rowland State Government Center 55 W Main, Waterbury 1326-7101 DAS Owned 99,691 $424,581.50
Platt Regional Vocational Technical School Platt RVTS, Milford 7001-16 SDE Owned 221,320 $420,069.50
Eli Whitney Regional Vocational Technical School Whitney THS Hamden 7001-8 SDE Owned 178,763 $418,545.36
State Capitol Building Hartford 1001-14 OLM Owned 181,000 $415,499.63
Norwich Regional Vocational Technical School Norwich RVTS 7001-14 SDE Owned 99,626 $403,698.37
Power Plant Rocky Hill 1312-6 DVA Owned 29,115 $401,584.69
DOC HQ - 24 Wolcott Hill Rd Wethersfield 1326-6 DAS Owned 115,000 $377,212.45
61 Woodland Street Hartford 1326-8532 DAS Owned 213,421 $372,935.27
Source: CT DEEP, 2017
Connecticut Department of Energy and Environmental ProtectionConnecticut Department of Energy and Environmental Protection
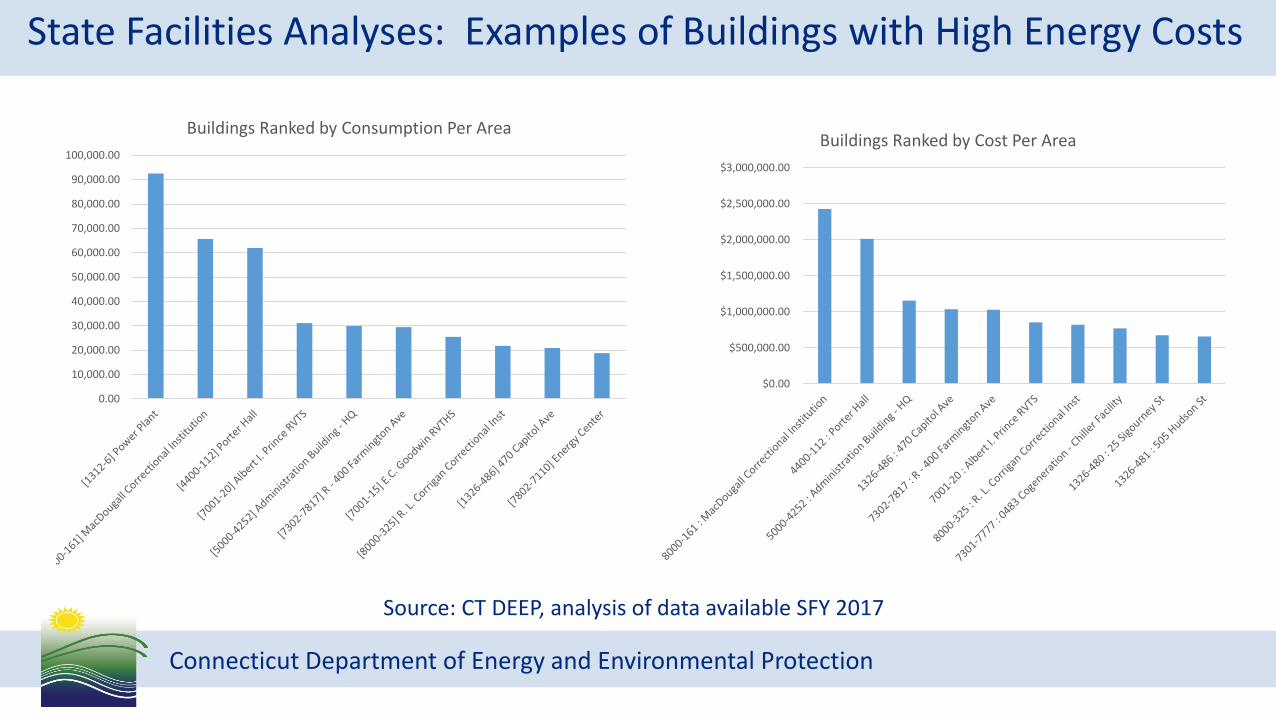
State Facilities Analyses: Examples of Buildings with High Energy Costs
0.00
10,000.00
20,000.00
30,000.00
40,000.00
50,000.00
60,000.00
70,000.00
80,000.00
90,000.00
100,000.00
Buildings Ranked by Consumption Per Area
$0.00
$500,000.00
$1,000,000.00
$1,500,000.00
$2,000,000.00
$2,500,000.00
$3,000,000.00
Buildings Ranked by Cost Per Area
Source: CT DEEP, analysis of data available SFY 2017

Connecticut Department of Energy and Environmental ProtectionConnecticut Department of Energy and Environmental Protection
State Facilities Analyses: Examples of Diverse Buildings with High Energy Costs
Selected Building at least 10,000 sq. ft. LocationAgency Sq. Ft. Est. Annualized Cost $/Sq. Ft.
4400-112 : Porter Hall (Power Plant) CT Valley Hospital, Middletown MHA 33,722 $1,293,904.44 $38.37
1326-486 : 470 Capitol AveHartford DAS
31,735 $1,026,704.86 $32.35
7301-7777 : 0483 Cogeneration - Chiller Facility UCONN, Storrs Mansfield
UOC31,943 $997,447.45 $31.23
8000-44 : H Building Gymnasium Enfield Correctional Institution
DOC
13,312 $321,416.79 $24.14
7701-7 : West Campus BuildingNorwalk Comm College
CSCU 51,242 $875,784.49 $17.09
1326-530 : Southeastern Mental Health Uncas On Thames, Norwich DAS 55,264 $541,323.76 $9.80
1326-481 : 505 Hudson St Hartford
DAS155,264 $910,134.92 $5.86
DEEP441 : Intermediate Fish Production Bldg Quinebaug Fish Hatchery, Plainfield DEEP 27,300 $158,829.29 $5.82
1326-7101 : Rowland State Government Center 55 W Main, Waterbury DAS 99,691 $424,581.50 $4.26
7001-14 : Norwich Regional Vocational Technical School Norwich SDE 99,626 $403,698.37 $4.05
First 3 are Power Plants
State agencies have a variety of different building uses

Connecticut Department of Energy and Environmental ProtectionConnecticut Department of Energy and Environmental Protection
Benchmarked 27 million s.f. at 276 state buildings

Connecticut Department of Energy and Environmental ProtectionConnecticut Department of Energy and Environmental Protection
Lead by Example Results
Established master agreements with Connecticut’s utilities to unlock the ability of state agencies to use utility administered programs to complete small-scale energy efficiency investments in facilities.
Continued to install medium-scale energy equipment retrofits in state facilities using general obligation bond funded allocations.
Initiated a standardized guaranteed Energy Savings Performance Contracting Program to plan for and implement large-scale, comprehensive projects with multiple energy savings measures at state facilities.
Connecticut Department of Energy and Environmental ProtectionConnecticut Department of Energy and Environmental Protection
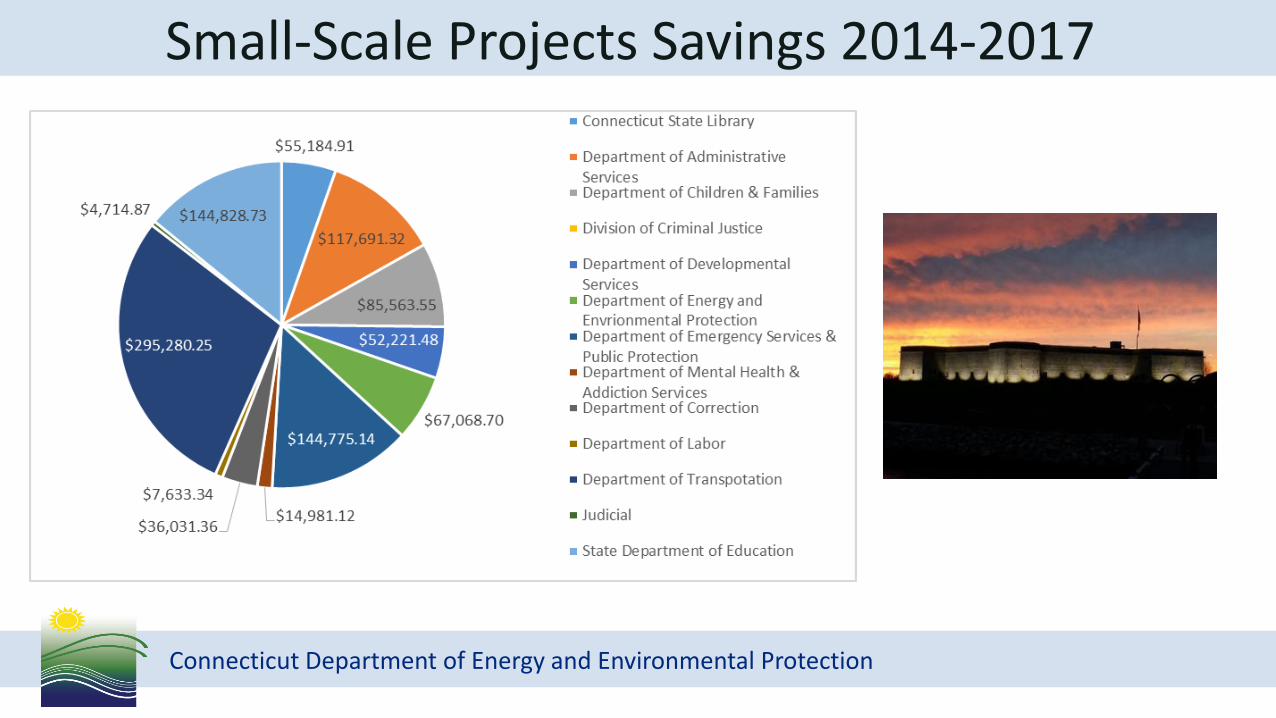
Small-Scale Projects Savings 2014-2017

Connecticut Department of Energy and Environmental ProtectionConnecticut Department of Energy and Environmental Protection
Medium-Scale Projects 2012-2017
72 Projects approved, resulting in estimated 89.3 billion BTUs reduced and $2.91M savings annually. Average 5.9 year payback.
Bond funding fully expended as of January 2017

Connecticut Department of Energy and Environmental ProtectionConnecticut Department of Energy and Environmental Protection
Energy Reduction from 44 Upgrades 2012-2017
Out of the 60 projects completed, 44 projects have a years’ worth of data to see what type of savings there was. Figure X shows the before and after energy cost and usage in BTUs for the 44 projects. These projects have saved $2.6 million, 31.5 billion BTUs, and reduced GHG emissions by about 71K tons to date.
$16,331,851.81
$13,685,363.92
$12,000,000.00
$12,500,000.00
$13,000,000.00
$13,500,000.00
$14,000,000.00
$14,500,000.00
$15,000,000.00
$15,500,000.00
$16,000,000.00
$16,500,000.00
$17,000,000.00
Before Costs After Costs
Annual Energy Costs Before & After ($)
494,500,690,089
450,400,307,715
420,000,000,000
430,000,000,000
440,000,000,000
450,000,000,000
460,000,000,000
470,000,000,000
480,000,000,000
490,000,000,000
500,000,000,000
Before Usage After Usage
Annual Energy Usage Before & After (BTUs)
Connecticut Department of Energy and Environmental ProtectionConnecticut Department of Energy and Environmental Protection
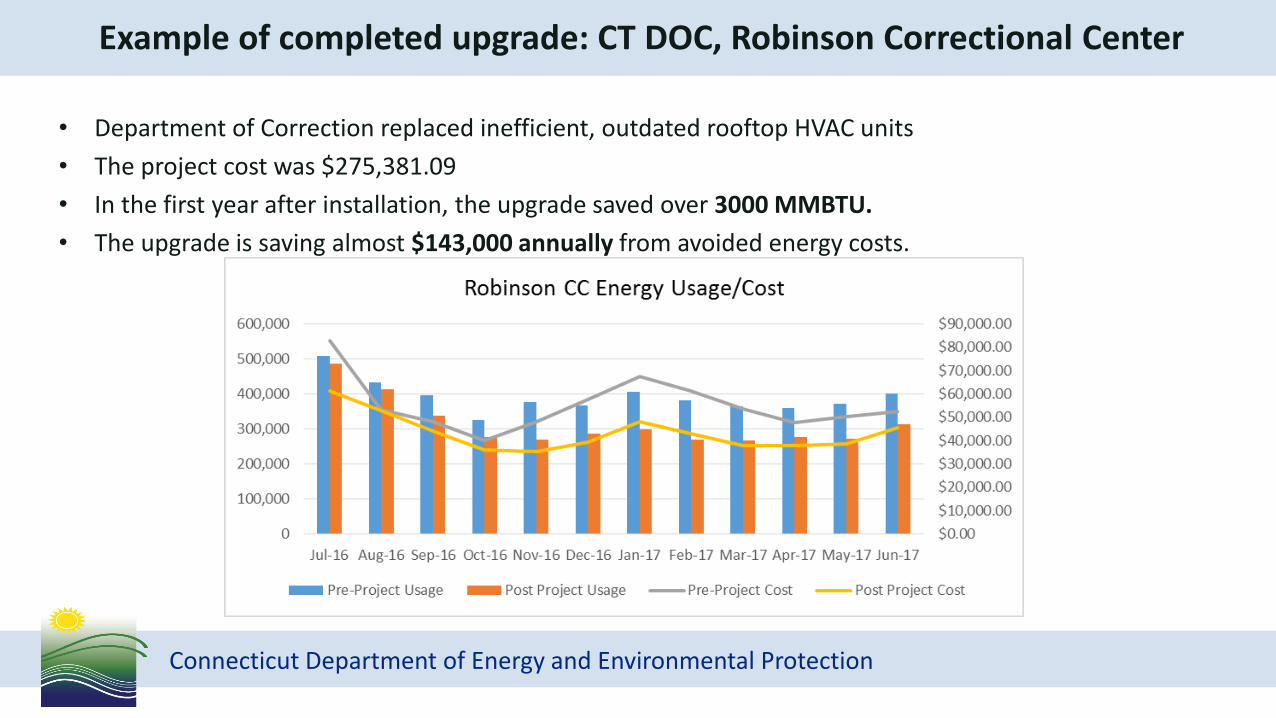
Example of completed upgrade: CT DOC, Robinson Correctional Center
• Department of Correction replaced inefficient, outdated rooftop HVAC units
• The project cost was $275,381.09
• In the first year after installation, the upgrade saved over 3000 MMBTU.
• The upgrade is saving almost $143,000 annually from avoided energy costs.

Connecticut Department of Energy and Environmental ProtectionConnecticut Department of Energy and Environmental Protection
Example: Energy Savings as Financing = Jobs
$31.9M in guaranteed energy and maintenance savings
35% reduction in energy use
Reduced GHG emissions of estimated 10,000 metric tons of CO2
2 miles of new steam and condensate pipes
1.5 megawatt Cogen System
Solar-Powered electric vehicle charging station
CT Valley Hospital, ESPC project webpage
Connecticut Department of Energy and Environmental ProtectionConnecticut Department of Energy and Environmental Protection
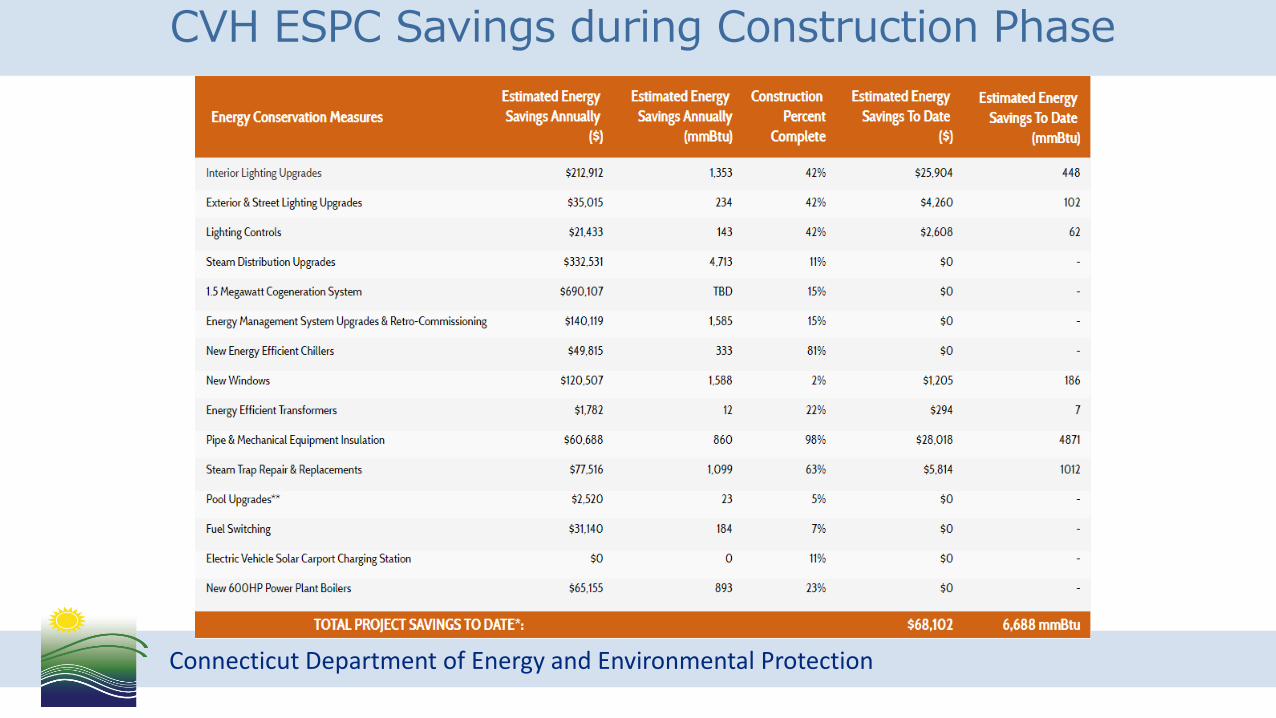
CVH ESPC Savings during Construction Phase

Connecticut Department of Energy and Environmental ProtectionConnecticut Department of Energy and Environmental Protection
Competitive Purchase of Aggregated Electricity Supply
Procurement conducted through RFP process in 2017 resulted in a contract from July 2017 through June 30, 2018. Contract extended through SFY19.
• The rate for state agencies: The price is 7.533 cents per kWh.– That pricing is better than the Standard Service pricing through December 2017, which for Eversource is
8.01 cents, and for UI is 7.60 cents.
– Similar competitive pricing achieved through contract extension for SFY19
• Effective dates for that price: July 2017 through June 30, 2018.
• The percent of Class 1 Renewable 16.31% [15.5% in 2017 and 17% in 2018].
• The supplier is Direct Energy Business, LLC.
Connecticut Department of Energy and Environmental ProtectionConnecticut Department of Energy and Environmental Protection
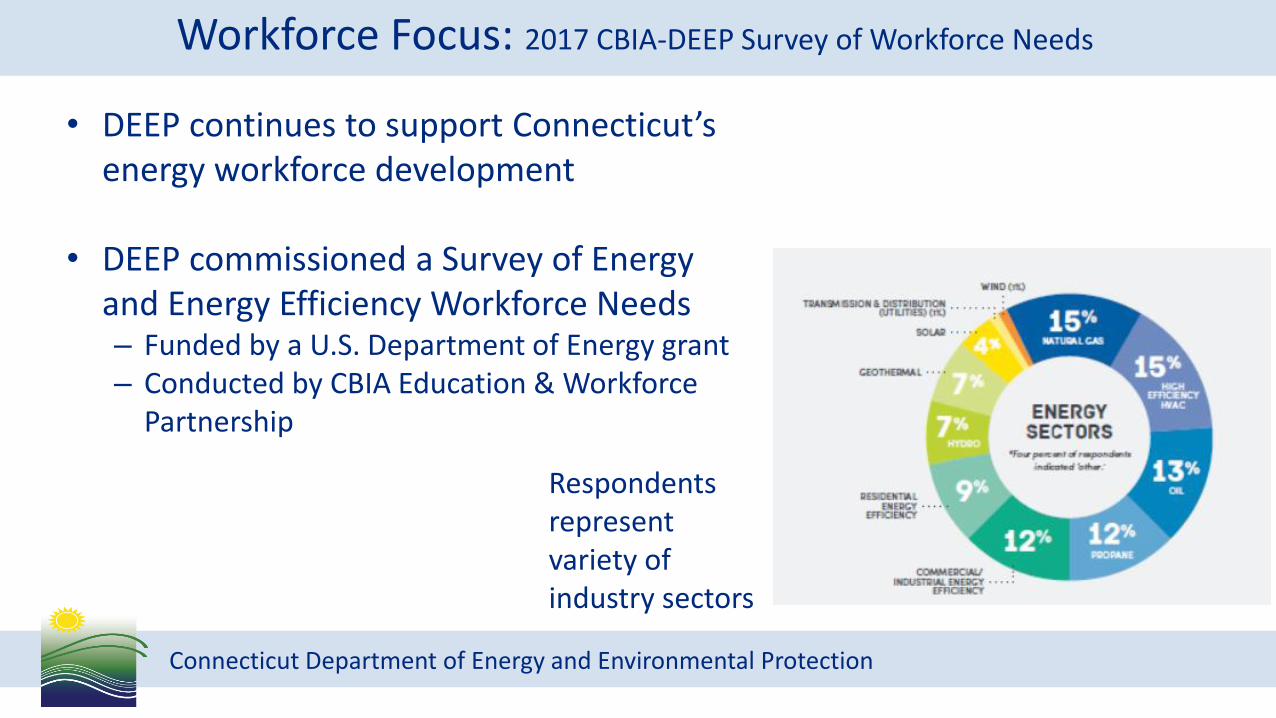
Workforce Focus: 2017 CBIA-DEEP Survey of Workforce Needs
• DEEP continues to support Connecticut’s energy workforce development
• DEEP commissioned a Survey of Energy and Energy Efficiency Workforce Needs– Funded by a U.S. Department of Energy grant– Conducted by CBIA Education & Workforce
Partnership
Respondents represent variety of industry sectors

Connecticut Department of Energy and Environmental ProtectionConnecticut Department of Energy and Environmental Protection
Tunxis Community College stackable certificates and A.A.S. Degree
https://www.tunxis.edu/completion/energy-management

Connecticut Department of Energy and Environmental ProtectionConnecticut Department of Energy and Environmental Protection
Preparing for the future
https://www.tunxis.edu/completion/energy-management

Connecticut Department of Energy and Environmental ProtectionConnecticut Department of Energy and Environmental Protection
Looking Ahead• DEEP received authorization of $20 million in General Obligation (GO) Bonds in the new budget
that was passed in the fall of 2017 for energy management upgrades
• DEEP, in collaboration with the CT Dept. of Administrative Services, the Attorney General’s Office, other agencies, and the CT Green Bank, has been developing standardized documents to allow the Executive Branch State Agencies to install renewable energy at their facilities.
• The Connecticut State Colleges and Universities have been installing solar PV systems at various Community Colleges and State Universities
Manchester Community College, Manchester, CT

Strategic Plan for Better State Buildings
33
Inventory Facilities Universe
[data collection and
correlation]
Benchmarking and Procurement
[compare energy use to prioritize; update
documents, contracts, and processes; identify financing mechanisms]
Screening
[for potential opportunities; conduct feasibility analyses for
renewables generation; consider
consistency with state and local plans]
Energy Assessments
[various audit levels, depending on purpose
and funding source]
Measure Progress
Efficiency measures and renewable energy generation financed, installed, and remain
effective into the
future
Connecticut Department of Energy and Environmental ProtectionConnecticut Department of Energy and Environmental Protection
Thank you!
Diane W. Duva, Director, Office of Energy Demand
[email protected] 860-827-2756
Ryan C. Ensling, Research Analyst, Office of Energy Demand
Bureau of Energy and Technology Policy


![ELEMENTAL TELEOLOGY IN ARISTOTLE’SPHYSICSin Aristotle’s Physics [Nature] (Oxford, 1982), 80. Created on 9 February 2008 at 17.09 hours page 148. Elemental Teleology in Aristotle’s](https://img.pdfslide.us/doc/110x75/5ecb09a3246606720027ddfa/elemental-teleology-in-aristotleasphysics-in-aristotleas-physics-nature-oxford.jpg)