Embed Size (px)
Citation preview
Kristin Finney-Cooke, CAIA, Senior Consultant Doug Moseley PartnerWill Forde, CAIA, Senior Analyst
City of Hartford Municipal
Employees’ Retirement Fund August 2014 Net of Fee Flash Report
August 31, 2014
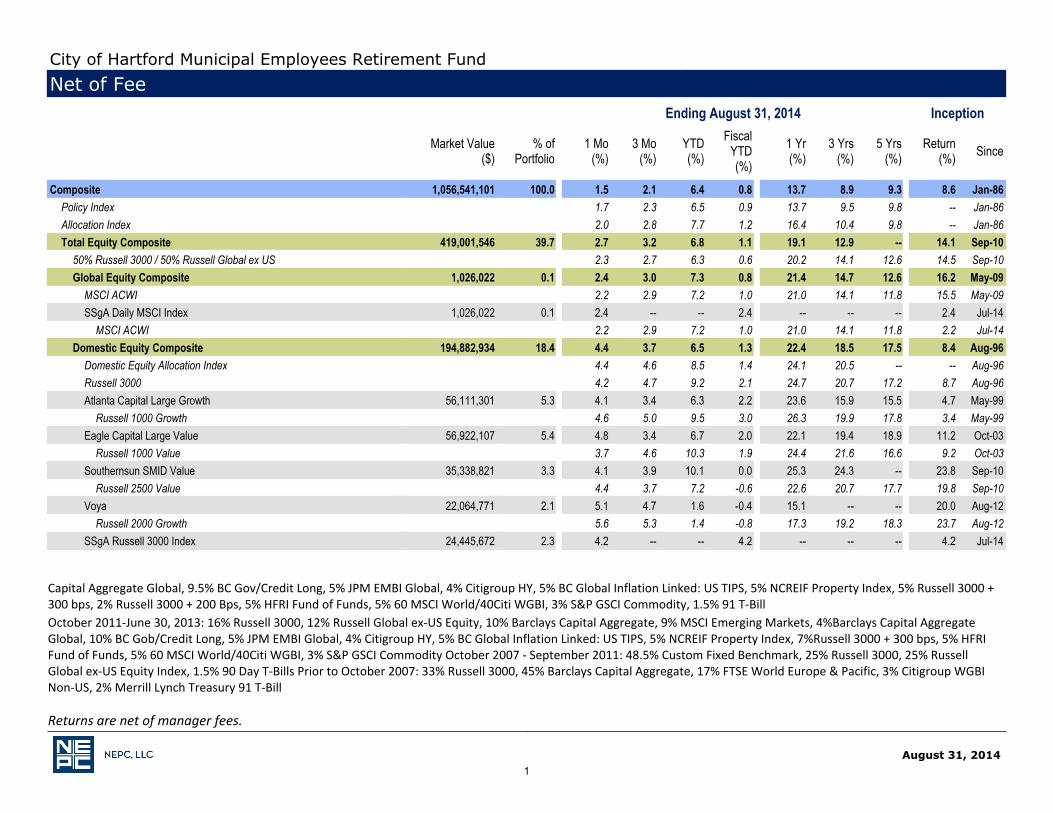
Allocation Index: Weighted average calculation using actual asset allocation percentages and benchmark index returns.
Policy Index: NEPC Allocation effective July 1, 2013: 16% Russell 3000, 12% Russell Global ex-US Equity, 10% Barclays Capital Aggregate, 9% MSCI Emerging Markets, 3% BarclaysCapital Aggregate Global, 9.5% BC Gov/Credit Long, 5% JPM EMBI Global, 4% Citigroup HY, 5% BC Global Inflation Linked: US TIPS, 5% NCREIF Property Index, 5% Russell 3000 +300 bps, 2% Russell 3000 + 200 Bps, 5% HFRI Fund of Funds, 5% 60 MSCI World/40Citi WGBI, 3% S&P GSCI Commodity, 1.5% 91 T-Bill
October 2011-June 30, 2013: 16% Russell 3000, 12% Russell Global ex-US Equity, 10% Barclays Capital Aggregate, 9% MSCI Emerging Markets, 4%Barclays Capital AggregateGlobal, 10% BC Gob/Credit Long, 5% JPM EMBI Global, 4% Citigroup HY, 5% BC Global Inflation Linked: US TIPS, 5% NCREIF Property Index, 7%Russell 3000 + 300 bps, 5% HFRIFund of Funds, 5% 60 MSCI World/40Citi WGBI, 3% S&P GSCI Commodity October 2007 - September 2011: 48.5% Custom Fixed Benchmark, 25% Russell 3000, 25% RussellGlobal ex-US Equity Index, 1.5% 90 Day T-Bills Prior to October 2007: 33% Russell 3000, 45% Barclays Capital Aggregate, 17% FTSE World Europe & Pacific, 3% Citigroup WGBINon-US, 2% Merrill Lynch Treasury 91 T-Bill
Returns are net of manager fees.
City of Hartford Municipal Employees Retirement FundNet of Fee
Ending August 31, 2014 Inception
Market Value($)
% ofPortfolio
1 Mo(%)
3 Mo(%)
YTD(%)
FiscalYTD(%)
1 Yr(%)
3 Yrs(%)
5 Yrs(%)
Return(%) Since
_
Composite 1,056,541,101 100.0 1.5 2.1 6.4 0.8 13.7 8.9 9.3 8.6 Jan-86Policy Index 1.7 2.3 6.5 0.9 13.7 9.5 9.8 -- Jan-86Allocation Index 2.0 2.8 7.7 1.2 16.4 10.4 9.8 -- Jan-86Total Equity Composite 419,001,546 39.7 2.7 3.2 6.8 1.1 19.1 12.9 -- 14.1 Sep-10
50% Russell 3000 / 50% Russell Global ex US 2.3 2.7 6.3 0.6 20.2 14.1 12.6 14.5 Sep-10Global Equity Composite 1,026,022 0.1 2.4 3.0 7.3 0.8 21.4 14.7 12.6 16.2 May-09
MSCI ACWI 2.2 2.9 7.2 1.0 21.0 14.1 11.8 15.5 May-09SSgA Daily MSCI Index 1,026,022 0.1 2.4 -- -- 2.4 -- -- -- 2.4 Jul-14
MSCI ACWI 2.2 2.9 7.2 1.0 21.0 14.1 11.8 2.2 Jul-14Domestic Equity Composite 194,882,934 18.4 4.4 3.7 6.5 1.3 22.4 18.5 17.5 8.4 Aug-96
Domestic Equity Allocation Index 4.4 4.6 8.5 1.4 24.1 20.5 -- -- Aug-96Russell 3000 4.2 4.7 9.2 2.1 24.7 20.7 17.2 8.7 Aug-96Atlanta Capital Large Growth 56,111,301 5.3 4.1 3.4 6.3 2.2 23.6 15.9 15.5 4.7 May-99
Russell 1000 Growth 4.6 5.0 9.5 3.0 26.3 19.9 17.8 3.4 May-99Eagle Capital Large Value 56,922,107 5.4 4.8 3.4 6.7 2.0 22.1 19.4 18.9 11.2 Oct-03
Russell 1000 Value 3.7 4.6 10.3 1.9 24.4 21.6 16.6 9.2 Oct-03Southernsun SMID Value 35,338,821 3.3 4.1 3.9 10.1 0.0 25.3 24.3 -- 23.8 Sep-10
Russell 2500 Value 4.4 3.7 7.2 -0.6 22.6 20.7 17.7 19.8 Sep-10Voya 22,064,771 2.1 5.1 4.7 1.6 -0.4 15.1 -- -- 20.0 Aug-12
Russell 2000 Growth 5.6 5.3 1.4 -0.8 17.3 19.2 18.3 23.7 Aug-12SSgA Russell 3000 Index 24,445,672 2.3 4.2 -- -- 4.2 -- -- -- 4.2 Jul-14
1
August 31, 2014
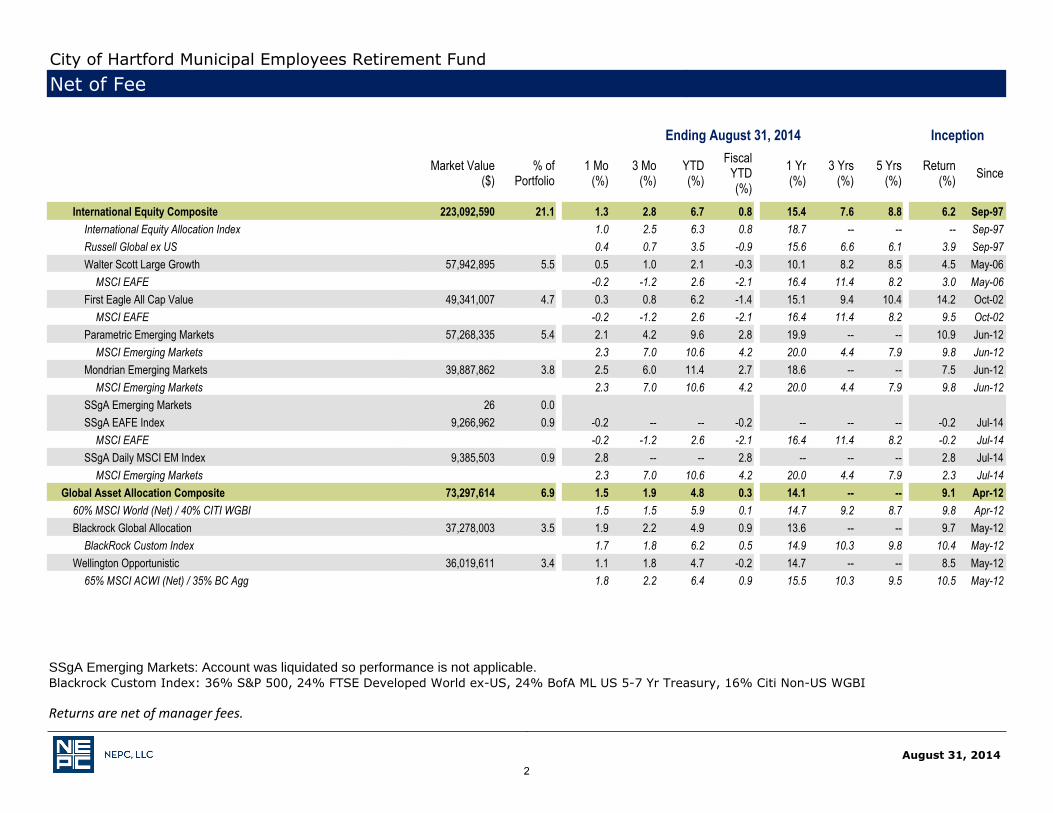
SSgA Emerging Markets: Account was liquidated so performance is not applicable.Blackrock Custom Index: 36% S&P 500, 24% FTSE Developed World ex-US, 24% BofA ML US 5-7 Yr Treasury, 16% Citi Non-US WGBI
Returns are net of manager fees.
City of Hartford Municipal Employees Retirement FundNet of Fee
Ending August 31, 2014 Inception
Market Value($)
% ofPortfolio
1 Mo(%)
3 Mo(%)
YTD(%)
FiscalYTD(%)
1 Yr(%)
3 Yrs(%)
5 Yrs(%)
Return(%) Since
_
International Equity Composite 223,092,590 21.1 1.3 2.8 6.7 0.8 15.4 7.6 8.8 6.2 Sep-97International Equity Allocation Index 1.0 2.5 6.3 0.8 18.7 -- -- -- Sep-97Russell Global ex US 0.4 0.7 3.5 -0.9 15.6 6.6 6.1 3.9 Sep-97Walter Scott Large Growth 57,942,895 5.5 0.5 1.0 2.1 -0.3 10.1 8.2 8.5 4.5 May-06
MSCI EAFE -0.2 -1.2 2.6 -2.1 16.4 11.4 8.2 3.0 May-06First Eagle All Cap Value 49,341,007 4.7 0.3 0.8 6.2 -1.4 15.1 9.4 10.4 14.2 Oct-02
MSCI EAFE -0.2 -1.2 2.6 -2.1 16.4 11.4 8.2 9.5 Oct-02Parametric Emerging Markets 57,268,335 5.4 2.1 4.2 9.6 2.8 19.9 -- -- 10.9 Jun-12
MSCI Emerging Markets 2.3 7.0 10.6 4.2 20.0 4.4 7.9 9.8 Jun-12Mondrian Emerging Markets 39,887,862 3.8 2.5 6.0 11.4 2.7 18.6 -- -- 7.5 Jun-12
MSCI Emerging Markets 2.3 7.0 10.6 4.2 20.0 4.4 7.9 9.8 Jun-12SSgA Emerging Markets 26 0.0 SSgA EAFE Index 9,266,962 0.9 -0.2 -- -- -0.2 -- -- -- -0.2 Jul-14
MSCI EAFE -0.2 -1.2 2.6 -2.1 16.4 11.4 8.2 -0.2 Jul-14SSgA Daily MSCI EM Index 9,385,503 0.9 2.8 -- -- 2.8 -- -- -- 2.8 Jul-14
MSCI Emerging Markets 2.3 7.0 10.6 4.2 20.0 4.4 7.9 2.3 Jul-14Global Asset Allocation Composite 73,297,614 6.9 1.5 1.9 4.8 0.3 14.1 -- -- 9.1 Apr-12
60% MSCI World (Net) / 40% CITI WGBI 1.5 1.5 5.9 0.1 14.7 9.2 8.7 9.8 Apr-12Blackrock Global Allocation 37,278,003 3.5 1.9 2.2 4.9 0.9 13.6 -- -- 9.7 May-12
BlackRock Custom Index 1.7 1.8 6.2 0.5 14.9 10.3 9.8 10.4 May-12Wellington Opportunistic 36,019,611 3.4 1.1 1.8 4.7 -0.2 14.7 -- -- 8.5 May-12
65% MSCI ACWI (Net) / 35% BC Agg 1.8 2.2 6.4 0.9 15.5 10.3 9.5 10.5 May-12
2
August 31, 2014
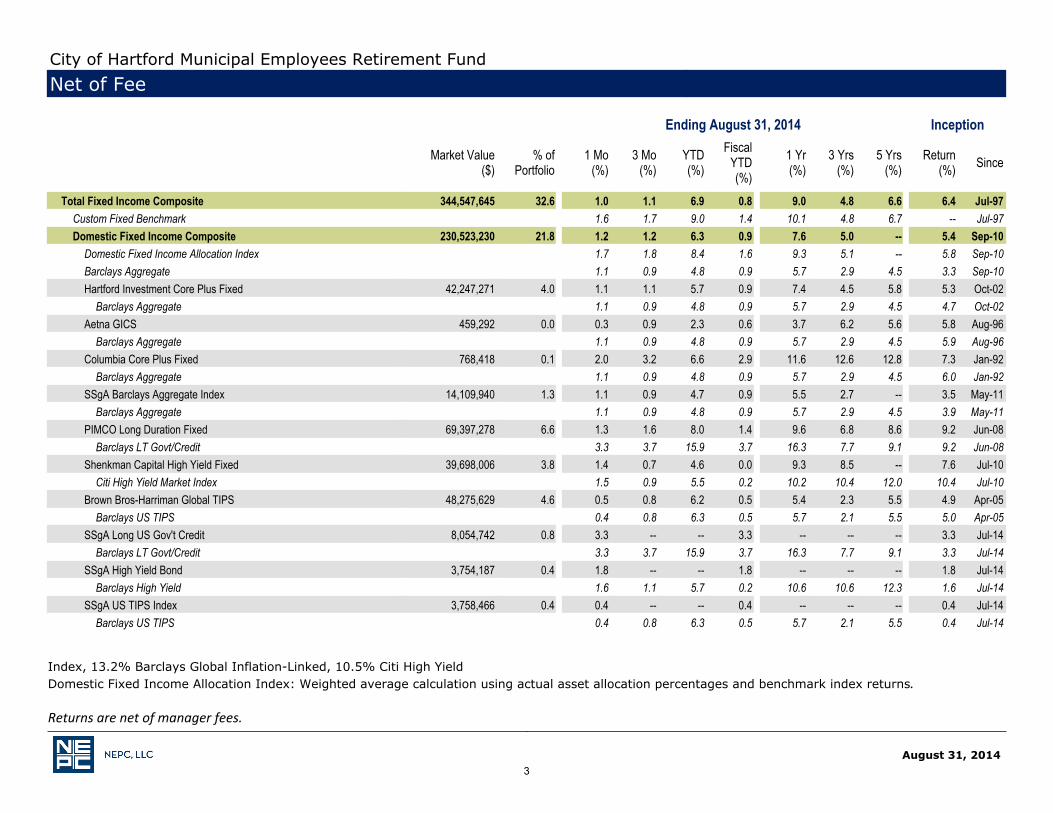
Custom Fixed Benchmark: 26.3% Barclays Gov/Credit Long, 26.3% Barclays Aggregate Bond, 10.5% Barclays Global Aggregate, 13.2% JPM EMBI GlobalIndex, 13.2% Barclays Global Inflation-Linked, 10.5% Citi High YieldDomestic Fixed Income Allocation Index: Weighted average calculation using actual asset allocation percentages and benchmark index returns.
Returns are net of manager fees.
City of Hartford Municipal Employees Retirement FundNet of Fee
Ending August 31, 2014 Inception
Market Value($)
% ofPortfolio
1 Mo(%)
3 Mo(%)
YTD(%)
FiscalYTD(%)
1 Yr(%)
3 Yrs(%)
5 Yrs(%)
Return(%) Since
_
Total Fixed Income Composite 344,547,645 32.6 1.0 1.1 6.9 0.8 9.0 4.8 6.6 6.4 Jul-97Custom Fixed Benchmark 1.6 1.7 9.0 1.4 10.1 4.8 6.7 -- Jul-97Domestic Fixed Income Composite 230,523,230 21.8 1.2 1.2 6.3 0.9 7.6 5.0 -- 5.4 Sep-10
Domestic Fixed Income Allocation Index 1.7 1.8 8.4 1.6 9.3 5.1 -- 5.8 Sep-10Barclays Aggregate 1.1 0.9 4.8 0.9 5.7 2.9 4.5 3.3 Sep-10Hartford Investment Core Plus Fixed 42,247,271 4.0 1.1 1.1 5.7 0.9 7.4 4.5 5.8 5.3 Oct-02
Barclays Aggregate 1.1 0.9 4.8 0.9 5.7 2.9 4.5 4.7 Oct-02Aetna GICS 459,292 0.0 0.3 0.9 2.3 0.6 3.7 6.2 5.6 5.8 Aug-96
Barclays Aggregate 1.1 0.9 4.8 0.9 5.7 2.9 4.5 5.9 Aug-96Columbia Core Plus Fixed 768,418 0.1 2.0 3.2 6.6 2.9 11.6 12.6 12.8 7.3 Jan-92
Barclays Aggregate 1.1 0.9 4.8 0.9 5.7 2.9 4.5 6.0 Jan-92SSgA Barclays Aggregate Index 14,109,940 1.3 1.1 0.9 4.7 0.9 5.5 2.7 -- 3.5 May-11
Barclays Aggregate 1.1 0.9 4.8 0.9 5.7 2.9 4.5 3.9 May-11PIMCO Long Duration Fixed 69,397,278 6.6 1.3 1.6 8.0 1.4 9.6 6.8 8.6 9.2 Jun-08
Barclays LT Govt/Credit 3.3 3.7 15.9 3.7 16.3 7.7 9.1 9.2 Jun-08Shenkman Capital High Yield Fixed 39,698,006 3.8 1.4 0.7 4.6 0.0 9.3 8.5 -- 7.6 Jul-10
Citi High Yield Market Index 1.5 0.9 5.5 0.2 10.2 10.4 12.0 10.4 Jul-10Brown Bros-Harriman Global TIPS 48,275,629 4.6 0.5 0.8 6.2 0.5 5.4 2.3 5.5 4.9 Apr-05
Barclays US TIPS 0.4 0.8 6.3 0.5 5.7 2.1 5.5 5.0 Apr-05SSgA Long US Gov't Credit 8,054,742 0.8 3.3 -- -- 3.3 -- -- -- 3.3 Jul-14
Barclays LT Govt/Credit 3.3 3.7 15.9 3.7 16.3 7.7 9.1 3.3 Jul-14SSgA High Yield Bond 3,754,187 0.4 1.8 -- -- 1.8 -- -- -- 1.8 Jul-14
Barclays High Yield 1.6 1.1 5.7 0.2 10.6 10.6 12.3 1.6 Jul-14SSgA US TIPS Index 3,758,466 0.4 0.4 -- -- 0.4 -- -- -- 0.4 Jul-14
Barclays US TIPS 0.4 0.8 6.3 0.5 5.7 2.1 5.5 0.4 Jul-14
3
August 31, 2014
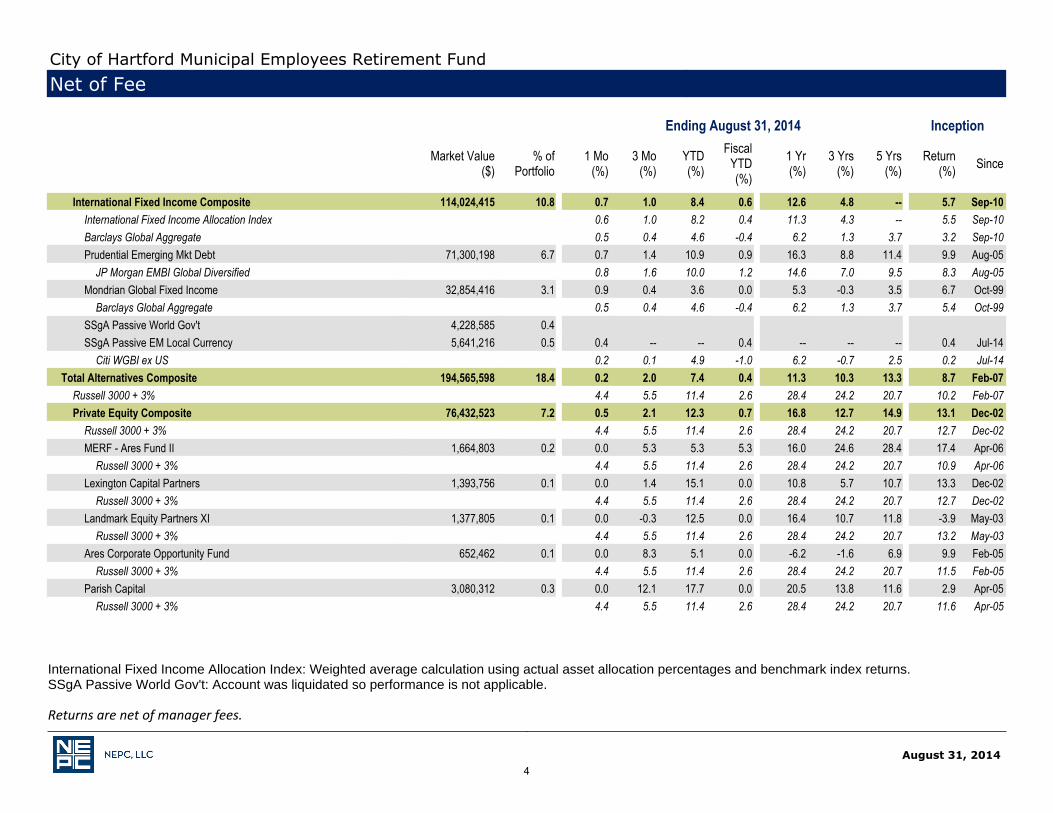
International Fixed Income Allocation Index: Weighted average calculation using actual asset allocation percentages and benchmark index returns.SSgA Passive World Gov't: Account was liquidated so performance is not applicable.
Returns are net of manager fees.
City of Hartford Municipal Employees Retirement FundNet of Fee
Ending August 31, 2014 Inception
Market Value($)
% ofPortfolio
1 Mo(%)
3 Mo(%)
YTD(%)
FiscalYTD(%)
1 Yr(%)
3 Yrs(%)
5 Yrs(%)
Return(%) Since
_
International Fixed Income Composite 114,024,415 10.8 0.7 1.0 8.4 0.6 12.6 4.8 -- 5.7 Sep-10International Fixed Income Allocation Index 0.6 1.0 8.2 0.4 11.3 4.3 -- 5.5 Sep-10Barclays Global Aggregate 0.5 0.4 4.6 -0.4 6.2 1.3 3.7 3.2 Sep-10Prudential Emerging Mkt Debt 71,300,198 6.7 0.7 1.4 10.9 0.9 16.3 8.8 11.4 9.9 Aug-05
JP Morgan EMBI Global Diversified 0.8 1.6 10.0 1.2 14.6 7.0 9.5 8.3 Aug-05Mondrian Global Fixed Income 32,854,416 3.1 0.9 0.4 3.6 0.0 5.3 -0.3 3.5 6.7 Oct-99
Barclays Global Aggregate 0.5 0.4 4.6 -0.4 6.2 1.3 3.7 5.4 Oct-99SSgA Passive World Gov't 4,228,585 0.4 SSgA Passive EM Local Currency 5,641,216 0.5 0.4 -- -- 0.4 -- -- -- 0.4 Jul-14
Citi WGBI ex US 0.2 0.1 4.9 -1.0 6.2 -0.7 2.5 0.2 Jul-14Total Alternatives Composite 194,565,598 18.4 0.2 2.0 7.4 0.4 11.3 10.3 13.3 8.7 Feb-07
Russell 3000 + 3% 4.4 5.5 11.4 2.6 28.4 24.2 20.7 10.2 Feb-07Private Equity Composite 76,432,523 7.2 0.5 2.1 12.3 0.7 16.8 12.7 14.9 13.1 Dec-02
Russell 3000 + 3% 4.4 5.5 11.4 2.6 28.4 24.2 20.7 12.7 Dec-02MERF - Ares Fund II 1,664,803 0.2 0.0 5.3 5.3 5.3 16.0 24.6 28.4 17.4 Apr-06
Russell 3000 + 3% 4.4 5.5 11.4 2.6 28.4 24.2 20.7 10.9 Apr-06Lexington Capital Partners 1,393,756 0.1 0.0 1.4 15.1 0.0 10.8 5.7 10.7 13.3 Dec-02
Russell 3000 + 3% 4.4 5.5 11.4 2.6 28.4 24.2 20.7 12.7 Dec-02Landmark Equity Partners XI 1,377,805 0.1 0.0 -0.3 12.5 0.0 16.4 10.7 11.8 -3.9 May-03
Russell 3000 + 3% 4.4 5.5 11.4 2.6 28.4 24.2 20.7 13.2 May-03Ares Corporate Opportunity Fund 652,462 0.1 0.0 8.3 5.1 0.0 -6.2 -1.6 6.9 9.9 Feb-05
Russell 3000 + 3% 4.4 5.5 11.4 2.6 28.4 24.2 20.7 11.5 Feb-05Parish Capital 3,080,312 0.3 0.0 12.1 17.7 0.0 20.5 13.8 11.6 2.9 Apr-05
Russell 3000 + 3% 4.4 5.5 11.4 2.6 28.4 24.2 20.7 11.6 Apr-05
4
August 31, 2014
Returns are net of manager fees.
City of Hartford Municipal Employees Retirement FundNet of Fee
Ending August 31, 2014 Inception
Market Value($)
% ofPortfolio
1 Mo(%)
3 Mo(%)
YTD(%)
FiscalYTD(%)
1 Yr(%)
3 Yrs(%)
5 Yrs(%)
Return(%) Since
_
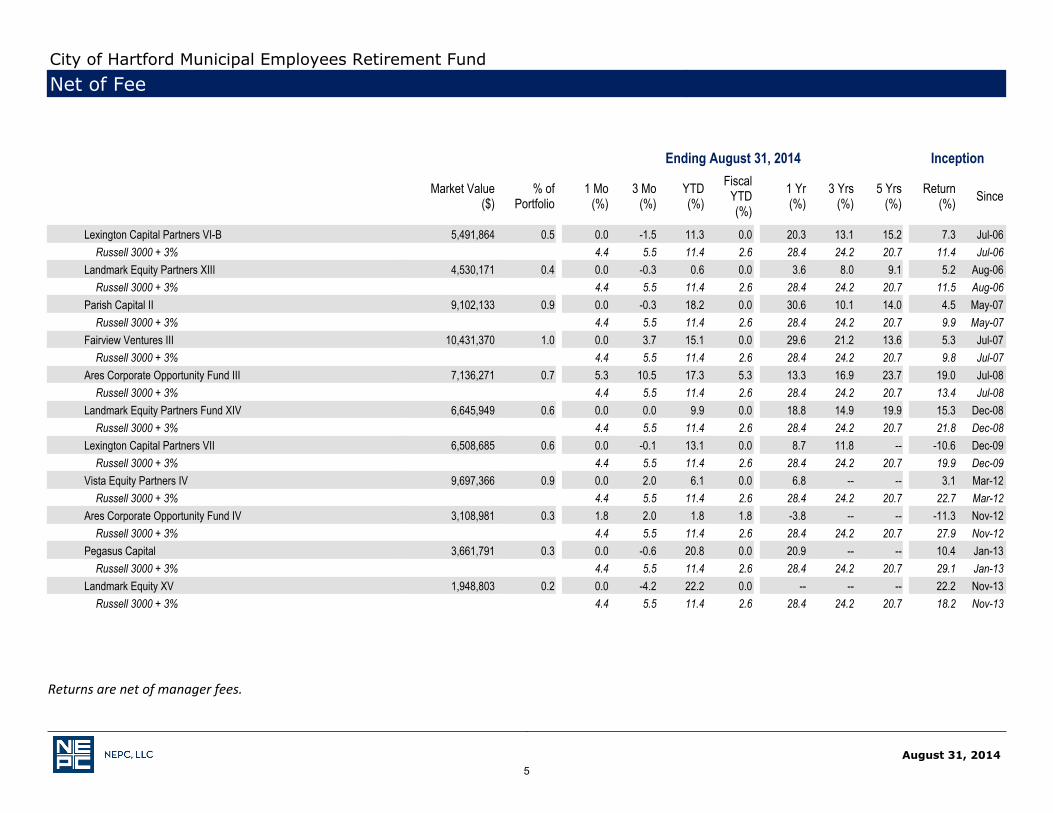
Lexington Capital Partners VI-B 5,491,864 0.5 0.0 -1.5 11.3 0.0 20.3 13.1 15.2 7.3 Jul-06Russell 3000 + 3% 4.4 5.5 11.4 2.6 28.4 24.2 20.7 11.4 Jul-06
Landmark Equity Partners XIII 4,530,171 0.4 0.0 -0.3 0.6 0.0 3.6 8.0 9.1 5.2 Aug-06Russell 3000 + 3% 4.4 5.5 11.4 2.6 28.4 24.2 20.7 11.5 Aug-06
Parish Capital II 9,102,133 0.9 0.0 -0.3 18.2 0.0 30.6 10.1 14.0 4.5 May-07Russell 3000 + 3% 4.4 5.5 11.4 2.6 28.4 24.2 20.7 9.9 May-07
Fairview Ventures III 10,431,370 1.0 0.0 3.7 15.1 0.0 29.6 21.2 13.6 5.3 Jul-07Russell 3000 + 3% 4.4 5.5 11.4 2.6 28.4 24.2 20.7 9.8 Jul-07
Ares Corporate Opportunity Fund III 7,136,271 0.7 5.3 10.5 17.3 5.3 13.3 16.9 23.7 19.0 Jul-08Russell 3000 + 3% 4.4 5.5 11.4 2.6 28.4 24.2 20.7 13.4 Jul-08
Landmark Equity Partners Fund XIV 6,645,949 0.6 0.0 0.0 9.9 0.0 18.8 14.9 19.9 15.3 Dec-08Russell 3000 + 3% 4.4 5.5 11.4 2.6 28.4 24.2 20.7 21.8 Dec-08
Lexington Capital Partners VII 6,508,685 0.6 0.0 -0.1 13.1 0.0 8.7 11.8 -- -10.6 Dec-09Russell 3000 + 3% 4.4 5.5 11.4 2.6 28.4 24.2 20.7 19.9 Dec-09
Vista Equity Partners IV 9,697,366 0.9 0.0 2.0 6.1 0.0 6.8 -- -- 3.1 Mar-12Russell 3000 + 3% 4.4 5.5 11.4 2.6 28.4 24.2 20.7 22.7 Mar-12
Ares Corporate Opportunity Fund IV 3,108,981 0.3 1.8 2.0 1.8 1.8 -3.8 -- -- -11.3 Nov-12Russell 3000 + 3% 4.4 5.5 11.4 2.6 28.4 24.2 20.7 27.9 Nov-12
Pegasus Capital 3,661,791 0.3 0.0 -0.6 20.8 0.0 20.9 -- -- 10.4 Jan-13Russell 3000 + 3% 4.4 5.5 11.4 2.6 28.4 24.2 20.7 29.1 Jan-13
Landmark Equity XV 1,948,803 0.2 0.0 -4.2 22.2 0.0 -- -- -- 22.2 Nov-13Russell 3000 + 3% 4.4 5.5 11.4 2.6 28.4 24.2 20.7 18.2 Nov-13
5
August 31, 2014
Returns are net of manager fees.
City of Hartford Municipal Employees Retirement FundNet of Fee
Ending August 31, 2014 Inception
Market Value($)
% ofPortfolio
1 Mo(%)
3 Mo(%)
YTD(%)
FiscalYTD(%)
1 Yr(%)
3 Yrs(%)
5 Yrs(%)
Return(%) Since
_
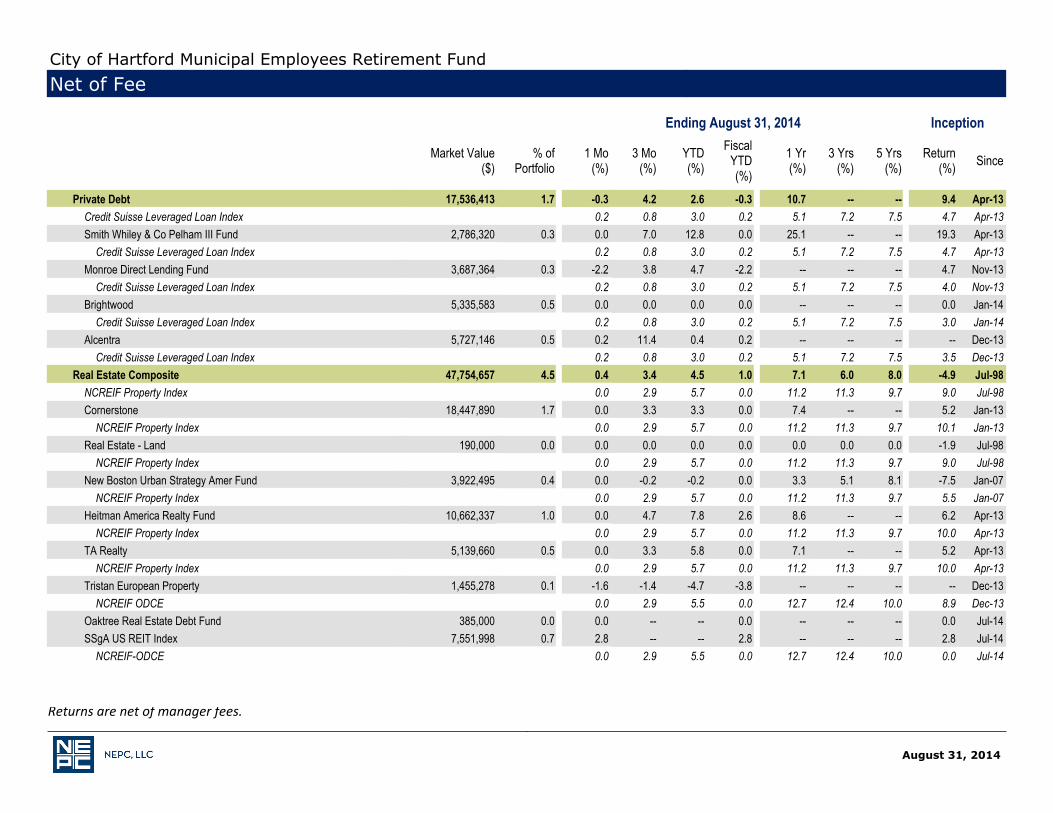
Private Debt 17,536,413 1.7 -0.3 4.2 2.6 -0.3 10.7 -- -- 9.4 Apr-13Credit Suisse Leveraged Loan Index 0.2 0.8 3.0 0.2 5.1 7.2 7.5 4.7 Apr-13Smith Whiley & Co Pelham III Fund 2,786,320 0.3 0.0 7.0 12.8 0.0 25.1 -- -- 19.3 Apr-13
Credit Suisse Leveraged Loan Index 0.2 0.8 3.0 0.2 5.1 7.2 7.5 4.7 Apr-13Monroe Direct Lending Fund 3,687,364 0.3 -2.2 3.8 4.7 -2.2 -- -- -- 4.7 Nov-13
Credit Suisse Leveraged Loan Index 0.2 0.8 3.0 0.2 5.1 7.2 7.5 4.0 Nov-13Brightwood 5,335,583 0.5 0.0 0.0 0.0 0.0 -- -- -- 0.0 Jan-14
Credit Suisse Leveraged Loan Index 0.2 0.8 3.0 0.2 5.1 7.2 7.5 3.0 Jan-14Alcentra 5,727,146 0.5 0.2 11.4 0.4 0.2 -- -- -- -- Dec-13
Credit Suisse Leveraged Loan Index 0.2 0.8 3.0 0.2 5.1 7.2 7.5 3.5 Dec-13Real Estate Composite 47,754,657 4.5 0.4 3.4 4.5 1.0 7.1 6.0 8.0 -4.9 Jul-98
NCREIF Property Index 0.0 2.9 5.7 0.0 11.2 11.3 9.7 9.0 Jul-98Cornerstone 18,447,890 1.7 0.0 3.3 3.3 0.0 7.4 -- -- 5.2 Jan-13
NCREIF Property Index 0.0 2.9 5.7 0.0 11.2 11.3 9.7 10.1 Jan-13Real Estate - Land 190,000 0.0 0.0 0.0 0.0 0.0 0.0 0.0 0.0 -1.9 Jul-98
NCREIF Property Index 0.0 2.9 5.7 0.0 11.2 11.3 9.7 9.0 Jul-98New Boston Urban Strategy Amer Fund 3,922,495 0.4 0.0 -0.2 -0.2 0.0 3.3 5.1 8.1 -7.5 Jan-07
NCREIF Property Index 0.0 2.9 5.7 0.0 11.2 11.3 9.7 5.5 Jan-07Heitman America Realty Fund 10,662,337 1.0 0.0 4.7 7.8 2.6 8.6 -- -- 6.2 Apr-13
NCREIF Property Index 0.0 2.9 5.7 0.0 11.2 11.3 9.7 10.0 Apr-13TA Realty 5,139,660 0.5 0.0 3.3 5.8 0.0 7.1 -- -- 5.2 Apr-13
NCREIF Property Index 0.0 2.9 5.7 0.0 11.2 11.3 9.7 10.0 Apr-13Tristan European Property 1,455,278 0.1 -1.6 -1.4 -4.7 -3.8 -- -- -- -- Dec-13
NCREIF ODCE 0.0 2.9 5.5 0.0 12.7 12.4 10.0 8.9 Dec-13Oaktree Real Estate Debt Fund 385,000 0.0 0.0 -- -- 0.0 -- -- -- 0.0 Jul-14SSgA US REIT Index 7,551,998 0.7 2.8 -- -- 2.8 -- -- -- 2.8 Jul-14
NCREIF-ODCE 0.0 2.9 5.5 0.0 12.7 12.4 10.0 0.0 Jul-14
August 31, 2014
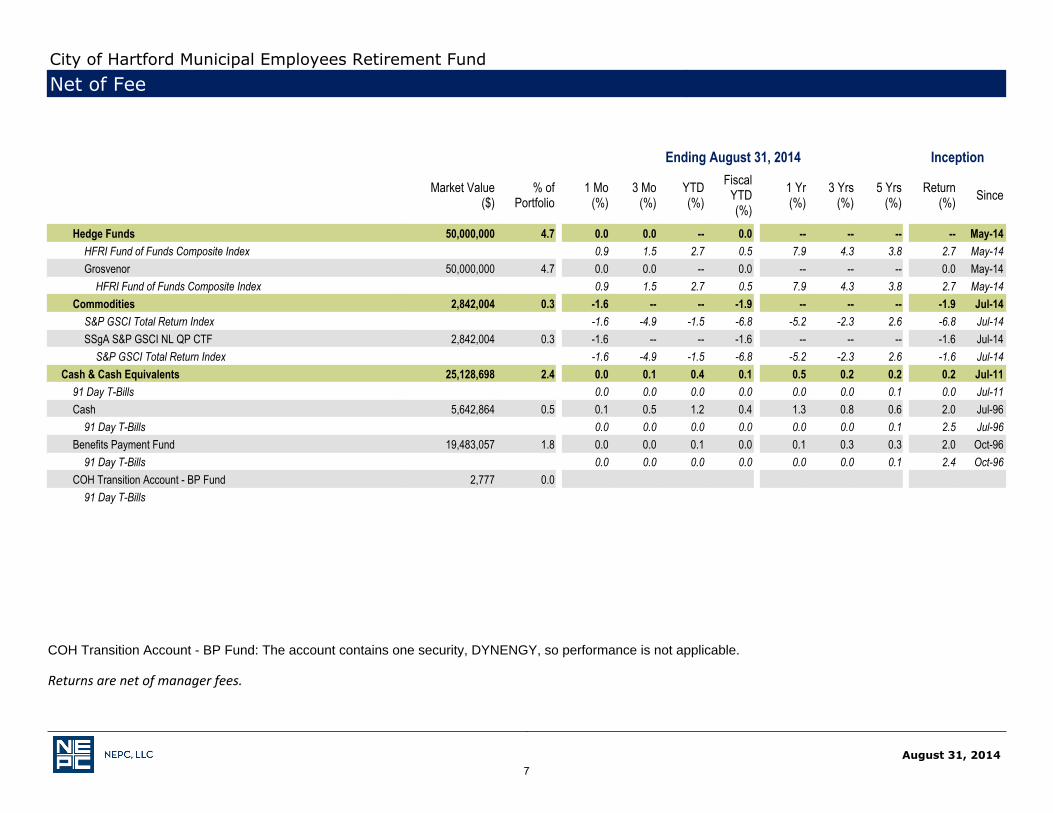
COH Transition Account - BP Fund: The account contains one security, DYNENGY, so performance is not applicable.
Returns are net of manager fees.
City of Hartford Municipal Employees Retirement FundNet of Fee
Ending August 31, 2014 Inception
Market Value($)
% ofPortfolio
1 Mo(%)
3 Mo(%)
YTD(%)
FiscalYTD(%)
1 Yr(%)
3 Yrs(%)
5 Yrs(%)
Return(%) Since
_
Hedge Funds 50,000,000 4.7 0.0 0.0 -- 0.0 -- -- -- -- May-14HFRI Fund of Funds Composite Index 0.9 1.5 2.7 0.5 7.9 4.3 3.8 2.7 May-14Grosvenor 50,000,000 4.7 0.0 0.0 -- 0.0 -- -- -- 0.0 May-14
HFRI Fund of Funds Composite Index 0.9 1.5 2.7 0.5 7.9 4.3 3.8 2.7 May-14Commodities 2,842,004 0.3 -1.6 -- -- -1.9 -- -- -- -1.9 Jul-14
S&P GSCI Total Return Index -1.6 -4.9 -1.5 -6.8 -5.2 -2.3 2.6 -6.8 Jul-14SSgA S&P GSCI NL QP CTF 2,842,004 0.3 -1.6 -- -- -1.6 -- -- -- -1.6 Jul-14
S&P GSCI Total Return Index -1.6 -4.9 -1.5 -6.8 -5.2 -2.3 2.6 -1.6 Jul-14Cash & Cash Equivalents 25,128,698 2.4 0.0 0.1 0.4 0.1 0.5 0.2 0.2 0.2 Jul-11
91 Day T-Bills 0.0 0.0 0.0 0.0 0.0 0.0 0.1 0.0 Jul-11Cash 5,642,864 0.5 0.1 0.5 1.2 0.4 1.3 0.8 0.6 2.0 Jul-96
91 Day T-Bills 0.0 0.0 0.0 0.0 0.0 0.0 0.1 2.5 Jul-96Benefits Payment Fund 19,483,057 1.8 0.0 0.0 0.1 0.0 0.1 0.3 0.3 2.0 Oct-96
91 Day T-Bills 0.0 0.0 0.0 0.0 0.0 0.0 0.1 2.4 Oct-96COH Transition Account - BP Fund 2,777 0.0
91 Day T-Bills
7
• The client’s custodian bank is NEPC’s preferred data source unless otherwise directed. NEPC reconciles custodian data to manager data. If the custodian cannot provide accurate data, manager data may be used.
• Trailing time period returns are determined by geometrically linking the holding period returns, from the first full month after inception to the report date. Rates of Return are annualized when the time period is longer than a year. Performance is presented gross and/or net of fees as indicated on each page.
• For managers funded in the middle of a month, the “since inception” return will start with the first full month, although actual inception dates and cash flows are taken into account in all Composite calculations.
• This report may contain forward-looking statements that are based on NEPC’s estimates, opinions and beliefs, but NEPC cannot guarantee that any plan will achieve its targeted return or meet other goals.
Reporting Methodology
8
• Past performance is no guarantee of future results.
• All investments carry some level of risk. Diversification and other asset allocation techniques are not guaranteed to ensure profit or protect against losses.
• Some index returns displayed in this report or used in calculation of a policy, allocation or custom benchmark may not be available from the source or may be preliminary and subject to change.
• NEPC’s source for portfolio pricing, calculation of accruals, and transaction information is the plan’s custodial bank. Information on market indices and security characteristics is received from other sources external to NEPC. While NEPC has exercised reasonable professional care in preparing this report, we cannot guarantee the accuracy of all source information contained within.
• This report is provided as a management aid for the client’s internal use only. Performance contained in this report does not constitute a recommendation by NEPC.
• This report may contain confidential or proprietary information and may not be copied or redistributed to any party not legally entitled to receive it.
Information Disclaimer
9