Embed Size (px)
Citation preview
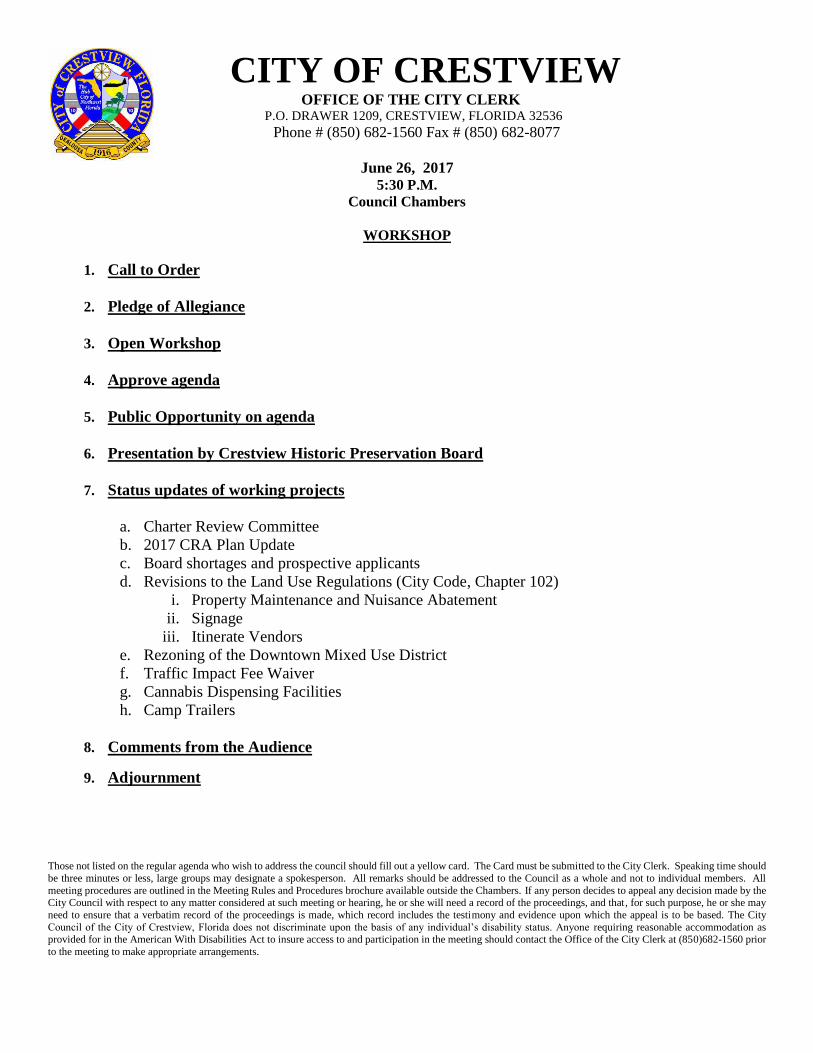
CITY OF CRESTVIEW OFFICE OF THE CITY CLERK
P.O. DRAWER 1209, CRESTVIEW, FLORIDA 32536
Phone # (850) 682-1560 Fax # (850) 682-8077
June 26, 2017
5:30 P.M.
Council Chambers
WORKSHOP
1. Call to Order
2. Pledge of Allegiance
3. Open Workshop
4. Approve agenda
5. Public Opportunity on agenda
6. Presentation by Crestview Historic Preservation Board
7. Status updates of working projects
a. Charter Review Committee
b. 2017 CRA Plan Update
c. Board shortages and prospective applicants
d. Revisions to the Land Use Regulations (City Code, Chapter 102)
i. Property Maintenance and Nuisance Abatement
ii. Signage
iii. Itinerate Vendors
e. Rezoning of the Downtown Mixed Use District
f. Traffic Impact Fee Waiver
g. Cannabis Dispensing Facilities
h. Camp Trailers
8. Comments from the Audience
9. Adjournment
Those not listed on the regular agenda who wish to address the council should fill out a yellow card. The Card must be submitted to the City Clerk. Speaking time should
be three minutes or less, large groups may designate a spokesperson. All remarks should be addressed to the Council as a whole and not to individual members. All
meeting procedures are outlined in the Meeting Rules and Procedures brochure available outside the Chambers. If any person decides to appeal any decision made by the City Council with respect to any matter considered at such meeting or hearing, he or she will need a record of the proceedings, and that, for such purpose, he or she may
need to ensure that a verbatim record of the proceedings is made, which record includes the testimony and evidence upon which the appeal is to be based. The City
Council of the City of Crestview, Florida does not discriminate upon the basis of any individual’s disability status. Anyone requiring reasonable accommodation as provided for in the American With Disabilities Act to insure access to and participation in the meeting should contact the Office of the City Clerk at (850)682-1560 prior
to the meeting to make appropriate arrangements.
CITY OF CRESTVIEW OFFICE OF THE CITY CLERK
P.O. DRAWER 1209, CRESTVIEW, FLORIDA 32536
Phone # (850) 682-1560 Fax # (850) 682-8077
June 26, 2017
5:30 P.M.
Council Chambers
WORKSHOP
1. Call to Order
2. Pledge of Allegiance
3. Open Workshop
4. Approve agenda
5. Public Opportunity on agenda
6. Presentation by Crestview Historic Preservation Board
7. Status updates of working projects
a. Charter Review Committee
The Crestview Charter Review Committee (CCRC) met on June 13th at 6 pm for an
Orientation Meeting in the Council Chambers of City Hall.
They have approved the following dates for the first six meetings:
Thursday
June 29, 2017 6: 00 pm
Thursday
July 13, 2017 6: 00 pm
Thursday
August 3, 2017 6: 00 pm
Thursday
August 17, 2017 6: 00 pm
Thursday
August 31, 2017 6: 00 pm
Thursday
September 7, 2017 6: 00 pm
All meetings are open to the public and are held in the Council Chambers at City Hall
198 Wilson Street North.
b. 2017 CRA Plan Update
Reflecting on Our History – Planning for Our Future
The City of Crestview’s “2017 Community Redevelopment Agency Comprehensive
Master Plan”, which updates the Programs and Projects and includes the Area Masterplan
for development within the CRA District, was approved for conformity with the
Comprehensive Plan for the City of Crestview 2020, by the Local Planning Agency. The
Board recommends the approval and adoption of the Plan by the City of Crestview.
At the upcoming July 10, 2017 Meeting of the City Council, Ordinance 1623, for
adoption of the updated 2017 CRA Plan, shall be presented to the City Council for first
reading. A complete copy of the Plan for review shall be provided by July 3rd.
c. Board shortages and prospective applicants
Board of Adjustment - Mr. Whitten -- Harry LeBoeuf -- Dec. 8, 2016
Mr. Faircloth – open position – we do have a candidate that
has volunteered to service.
Code Enforcement Board -- Mr. Faircloth, Mayor, and Mr. Hayes have open
positions -- Mr Cox has an option of reappointment of the present Boardmember,
Landrum E. Edwards, if he is willing to service or the selection of new appointee.
The last meeting of the Code Enforcement Board was November 12, 2013.
Planning and Zoning Board -- Local Planning Agency – Mr. Whitten – will have an
open position due to the expected resignation of Eric Davis. Mr. Davis stated in the
June 20th LPA meeting that he shall be resigning his position the first week in July.
We also have an open position with appointment by the Council, with the resignation
of Robert Carroll. Mr. Carroll’s out of town travel has greatly increased in
conjunction of his assignment here and therefore can’t attend the meeting on a regular
schedule. We do have a candidate that has volunteered to service.
d. Revisions to the Land Use Regulations (City Code, Chapter 102)
i. Property Maintenance and Nuisance Abatement
ii. Signage
iii. Itinerate Vendors
Status briefing in meeting – prime concern is scheduling review meetings.
e. Rezoning of the Downtown Mixed Use District
The proposed schedule for the rezoning of the Downtown Mixed Use District shall be
as follows:
June 30, 2017 Certified letters to the property owners shall be mailed.
July 10, 2017 Public Notice Signs shall be posted within the District.
July 21, 2017 Two Open Forum Public Information Meetings shall be held in the
Council Chamber of City Hall.
#1) 11:00 am to 1:30 pm and #2) 5:00 pm to 7:00 pm
July 25, 2017 Technical Review Committee meeting at 10:00 am
August 15, 2017 Local Planning Agency Meeting at 6:00 pm
August 28, 2017 City Council Workshop at 5:30 pm
Sept. 11, 2017 City Council Meeting at 6:00 pm for first reading of Ordinance, if
approved, a request for special meeting for September 25, at 5:00 pm
for the adoption of the Ordinance.
This schedule will complete the Rezoning Process in this Budget year with the funds
approved by Council previously.
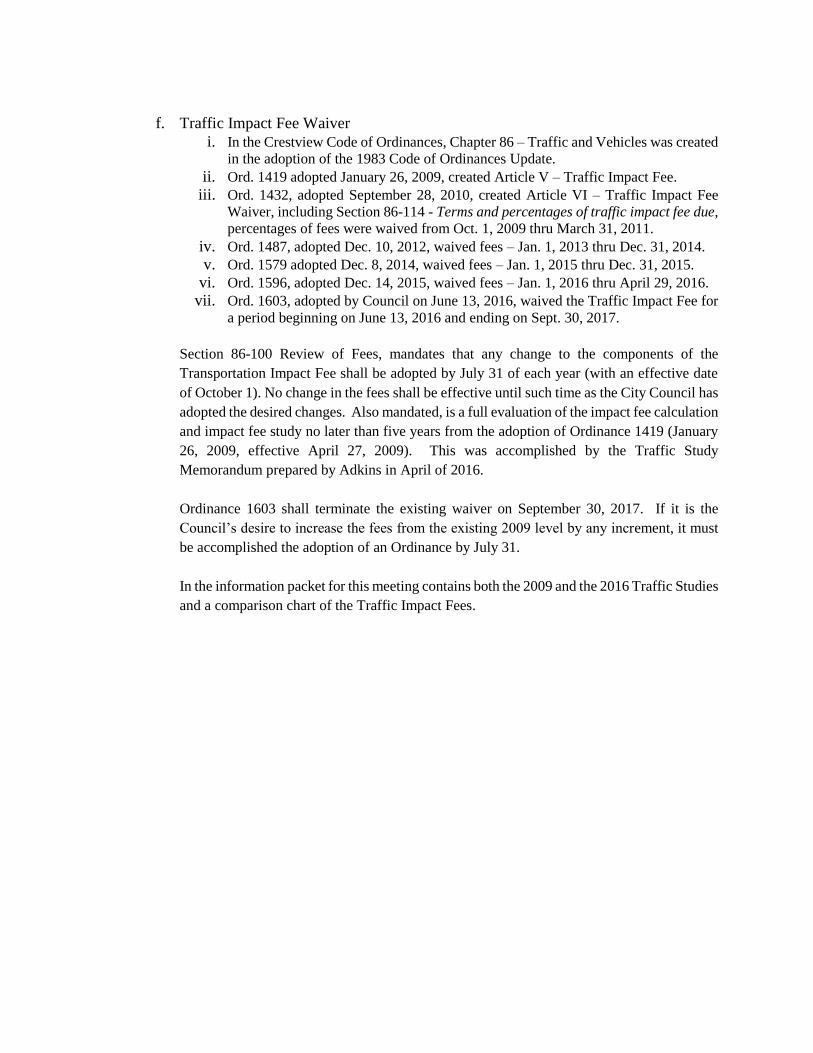
f. Traffic Impact Fee Waiver
i. In the Crestview Code of Ordinances, Chapter 86 – Traffic and Vehicles was created
in the adoption of the 1983 Code of Ordinances Update.
ii. Ord. 1419 adopted January 26, 2009, created Article V – Traffic Impact Fee. iii. Ord. 1432, adopted September 28, 2010, created Article VI – Traffic Impact Fee
Waiver, including Section 86-114 - Terms and percentages of traffic impact fee due,
percentages of fees were waived from Oct. 1, 2009 thru March 31, 2011.
iv. Ord. 1487, adopted Dec. 10, 2012, waived fees – Jan. 1, 2013 thru Dec. 31, 2014. v. Ord. 1579 adopted Dec. 8, 2014, waived fees – Jan. 1, 2015 thru Dec. 31, 2015.
vi. Ord. 1596, adopted Dec. 14, 2015, waived fees – Jan. 1, 2016 thru April 29, 2016. vii. Ord. 1603, adopted by Council on June 13, 2016, waived the Traffic Impact Fee for
a period beginning on June 13, 2016 and ending on Sept. 30, 2017.
Section 86-100 Review of Fees, mandates that any change to the components of the
Transportation Impact Fee shall be adopted by July 31 of each year (with an effective date
of October 1). No change in the fees shall be effective until such time as the City Council has
adopted the desired changes. Also mandated, is a full evaluation of the impact fee calculation
and impact fee study no later than five years from the adoption of Ordinance 1419 (January
26, 2009, effective April 27, 2009). This was accomplished by the Traffic Study
Memorandum prepared by Adkins in April of 2016.
Ordinance 1603 shall terminate the existing waiver on September 30, 2017. If it is the
Council’s desire to increase the fees from the existing 2009 level by any increment, it must
be accomplished the adoption of an Ordinance by July 31.
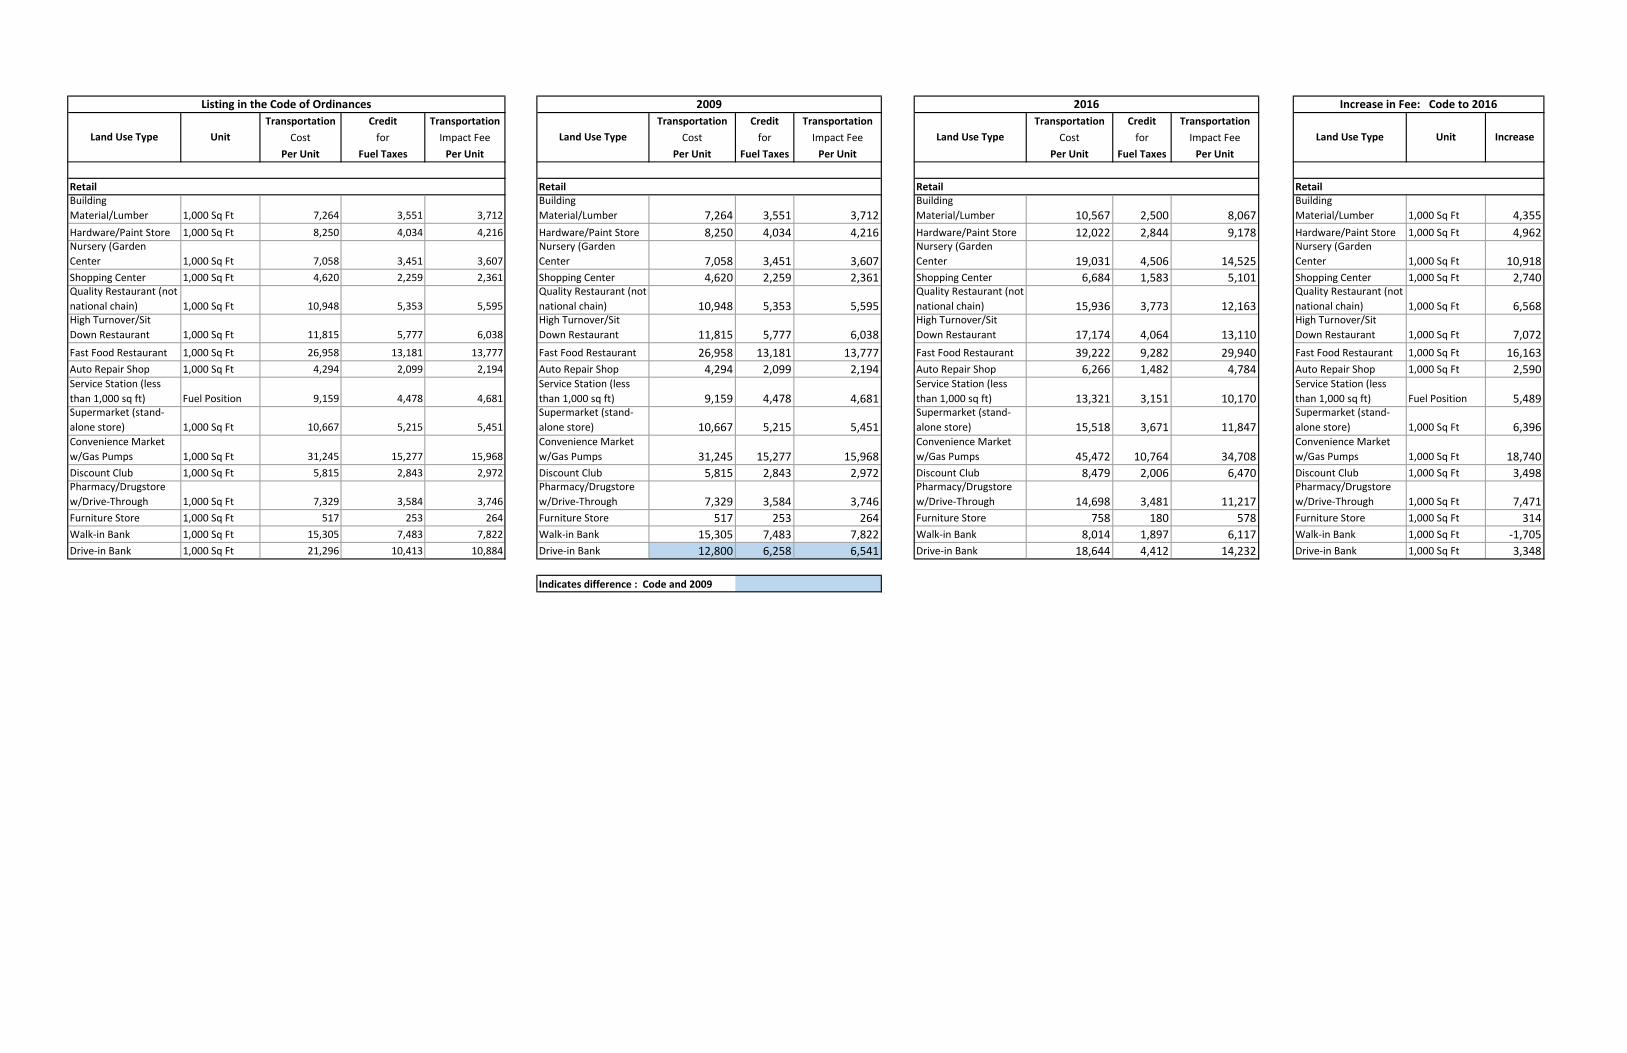
In the information packet for this meeting contains both the 2009 and the 2016 Traffic Studies
and a comparison chart of the Traffic Impact Fees.
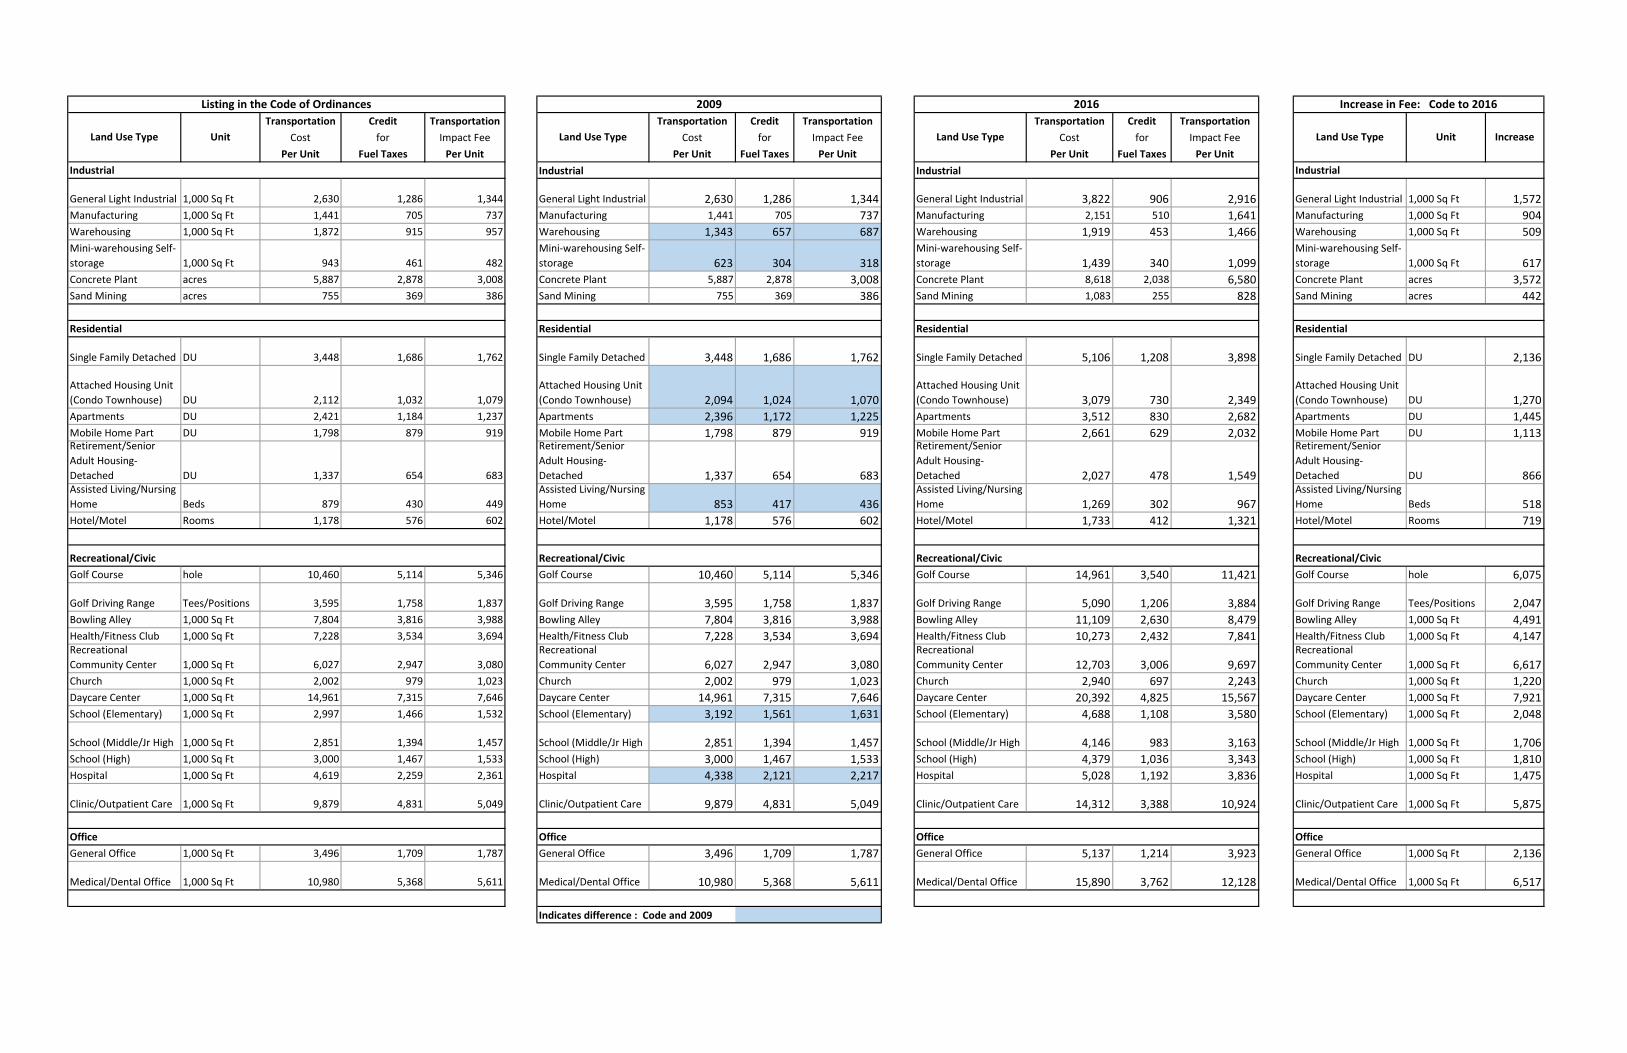
Transportation Credit Transportation Transportation Credit Transportation Transportation Credit Transportation
Cost for Impact Fee Cost for Impact Fee Cost for Impact Fee
Per Unit Fuel Taxes Per Unit Per Unit Fuel Taxes Per Unit Per Unit Fuel Taxes Per Unit
Industrial Industrial
General Light Industrial 1,000 Sq Ft 2,630 1,286 1,344 General Light Industrial 2,630 1,286 1,344 General Light Industrial 3,822 906 2,916 General Light Industrial 1,000 Sq Ft 1,572
Manufacturing 1,000 Sq Ft 1,441 705 737 Manufacturing 1,441 705 737 Manufacturing 2,151 510 1,641 Manufacturing 1,000 Sq Ft 904
Warehousing 1,000 Sq Ft 1,872 915 957 Warehousing 1,343 657 687 Warehousing 1,919 453 1,466 Warehousing 1,000 Sq Ft 509
Mini-warehousing Self-
storage 1,000 Sq Ft 943 461 482
Mini-warehousing Self-
storage 623 304 318Mini-warehousing Self-
storage 1,439 340 1,099Mini-warehousing Self-
storage 1,000 Sq Ft 617
Concrete Plant acres 5,887 2,878 3,008 Concrete Plant 5,887 2,878 3,008 Concrete Plant 8,618 2,038 6,580 Concrete Plant acres 3,572
Sand Mining acres 755 369 386 Sand Mining 755 369 386 Sand Mining 1,083 255 828 Sand Mining acres 442
Residential Residential Residential Residential
Single Family Detached DU 3,448 1,686 1,762 Single Family Detached 3,448 1,686 1,762 Single Family Detached 5,106 1,208 3,898 Single Family Detached DU 2,136
Attached Housing Unit
(Condo Townhouse) DU 2,112 1,032 1,079
Attached Housing Unit
(Condo Townhouse) 2,094 1,024 1,070Attached Housing Unit
(Condo Townhouse) 3,079 730 2,349Attached Housing Unit
(Condo Townhouse) DU 1,270
Apartments DU 2,421 1,184 1,237 Apartments 2,396 1,172 1,225 Apartments 3,512 830 2,682 Apartments DU 1,445
Mobile Home Part DU 1,798 879 919 Mobile Home Part 1,798 879 919 Mobile Home Part 2,661 629 2,032 Mobile Home Part DU 1,113Retirement/Senior
Adult Housing-
Detached DU 1,337 654 683
Retirement/Senior
Adult Housing-
Detached 1,337 654 683
Retirement/Senior
Adult Housing-
Detached 2,027 478 1,549
Retirement/Senior
Adult Housing-
Detached DU 866Assisted Living/Nursing
Home Beds 879 430 449
Assisted Living/Nursing
Home 853 417 436Assisted Living/Nursing
Home 1,269 302 967Assisted Living/Nursing
Home Beds 518
Hotel/Motel Rooms 1,178 576 602 Hotel/Motel 1,178 576 602 Hotel/Motel 1,733 412 1,321 Hotel/Motel Rooms 719
Recreational/Civic Recreational/Civic Recreational/Civic Recreational/Civic
Golf Course hole 10,460 5,114 5,346 Golf Course 10,460 5,114 5,346 Golf Course 14,961 3,540 11,421 Golf Course hole 6,075
Golf Driving Range Tees/Positions 3,595 1,758 1,837 Golf Driving Range 3,595 1,758 1,837 Golf Driving Range 5,090 1,206 3,884 Golf Driving Range Tees/Positions 2,047
Bowling Alley 1,000 Sq Ft 7,804 3,816 3,988 Bowling Alley 7,804 3,816 3,988 Bowling Alley 11,109 2,630 8,479 Bowling Alley 1,000 Sq Ft 4,491
Health/Fitness Club 1,000 Sq Ft 7,228 3,534 3,694 Health/Fitness Club 7,228 3,534 3,694 Health/Fitness Club 10,273 2,432 7,841 Health/Fitness Club 1,000 Sq Ft 4,147Recreational
Community Center 1,000 Sq Ft 6,027 2,947 3,080
Recreational
Community Center 6,027 2,947 3,080Recreational
Community Center 12,703 3,006 9,697Recreational
Community Center 1,000 Sq Ft 6,617
Church 1,000 Sq Ft 2,002 979 1,023 Church 2,002 979 1,023 Church 2,940 697 2,243 Church 1,000 Sq Ft 1,220
Daycare Center 1,000 Sq Ft 14,961 7,315 7,646 Daycare Center 14,961 7,315 7,646 Daycare Center 20,392 4,825 15,567 Daycare Center 1,000 Sq Ft 7,921
School (Elementary) 1,000 Sq Ft 2,997 1,466 1,532 School (Elementary) 3,192 1,561 1,631 School (Elementary) 4,688 1,108 3,580 School (Elementary) 1,000 Sq Ft 2,048
School (Middle/Jr High 1,000 Sq Ft 2,851 1,394 1,457 School (Middle/Jr High 2,851 1,394 1,457 School (Middle/Jr High 4,146 983 3,163 School (Middle/Jr High 1,000 Sq Ft 1,706
School (High) 1,000 Sq Ft 3,000 1,467 1,533 School (High) 3,000 1,467 1,533 School (High) 4,379 1,036 3,343 School (High) 1,000 Sq Ft 1,810
Hospital 1,000 Sq Ft 4,619 2,259 2,361 Hospital 4,338 2,121 2,217 Hospital 5,028 1,192 3,836 Hospital 1,000 Sq Ft 1,475
Clinic/Outpatient Care 1,000 Sq Ft 9,879 4,831 5,049 Clinic/Outpatient Care 9,879 4,831 5,049 Clinic/Outpatient Care 14,312 3,388 10,924 Clinic/Outpatient Care 1,000 Sq Ft 5,875
Office Office Office Office
General Office 1,000 Sq Ft 3,496 1,709 1,787 General Office 3,496 1,709 1,787 General Office 5,137 1,214 3,923 General Office 1,000 Sq Ft 2,136
Medical/Dental Office 1,000 Sq Ft 10,980 5,368 5,611 Medical/Dental Office 10,980 5,368 5,611 Medical/Dental Office 15,890 3,762 12,128 Medical/Dental Office 1,000 Sq Ft 6,517
Indicates difference : Code and 2009
Industrial
Listing in the Code of Ordinances 2009 2016
Land Use Type
Industrial
Land Use Type Unit Land Use Type Unit Increase
Increase in Fee: Code to 2016
Land Use Type
Transportation Credit Transportation Transportation Credit Transportation Transportation Credit Transportation
Cost for Impact Fee Cost for Impact Fee Cost for Impact Fee
Per Unit Fuel Taxes Per Unit Per Unit Fuel Taxes Per Unit Per Unit Fuel Taxes Per Unit
Listing in the Code of Ordinances 2009 2016
Land Use TypeLand Use Type Unit Land Use Type Unit Increase
Increase in Fee: Code to 2016
Land Use Type
Retail Retail Retail RetailBuilding
Material/Lumber 1,000 Sq Ft 7,264 3,551 3,712
Building
Material/Lumber 7,264 3,551 3,712Building
Material/Lumber 10,567 2,500 8,067Building
Material/Lumber 1,000 Sq Ft 4,355
Hardware/Paint Store 1,000 Sq Ft 8,250 4,034 4,216 Hardware/Paint Store 8,250 4,034 4,216 Hardware/Paint Store 12,022 2,844 9,178 Hardware/Paint Store 1,000 Sq Ft 4,962Nursery (Garden
Center 1,000 Sq Ft 7,058 3,451 3,607
Nursery (Garden
Center 7,058 3,451 3,607Nursery (Garden
Center 19,031 4,506 14,525Nursery (Garden
Center 1,000 Sq Ft 10,918
Shopping Center 1,000 Sq Ft 4,620 2,259 2,361 Shopping Center 4,620 2,259 2,361 Shopping Center 6,684 1,583 5,101 Shopping Center 1,000 Sq Ft 2,740Quality Restaurant (not
national chain) 1,000 Sq Ft 10,948 5,353 5,595
Quality Restaurant (not
national chain) 10,948 5,353 5,595Quality Restaurant (not
national chain) 15,936 3,773 12,163Quality Restaurant (not
national chain) 1,000 Sq Ft 6,568High Turnover/Sit
Down Restaurant 1,000 Sq Ft 11,815 5,777 6,038
High Turnover/Sit
Down Restaurant 11,815 5,777 6,038High Turnover/Sit
Down Restaurant 17,174 4,064 13,110High Turnover/Sit
Down Restaurant 1,000 Sq Ft 7,072
Fast Food Restaurant 1,000 Sq Ft 26,958 13,181 13,777 Fast Food Restaurant 26,958 13,181 13,777 Fast Food Restaurant 39,222 9,282 29,940 Fast Food Restaurant 1,000 Sq Ft 16,163
Auto Repair Shop 1,000 Sq Ft 4,294 2,099 2,194 Auto Repair Shop 4,294 2,099 2,194 Auto Repair Shop 6,266 1,482 4,784 Auto Repair Shop 1,000 Sq Ft 2,590Service Station (less
than 1,000 sq ft) Fuel Position 9,159 4,478 4,681
Service Station (less
than 1,000 sq ft) 9,159 4,478 4,681Service Station (less
than 1,000 sq ft) 13,321 3,151 10,170Service Station (less
than 1,000 sq ft) Fuel Position 5,489Supermarket (stand-
alone store) 1,000 Sq Ft 10,667 5,215 5,451
Supermarket (stand-
alone store) 10,667 5,215 5,451Supermarket (stand-
alone store) 15,518 3,671 11,847Supermarket (stand-
alone store) 1,000 Sq Ft 6,396Convenience Market
w/Gas Pumps 1,000 Sq Ft 31,245 15,277 15,968
Convenience Market
w/Gas Pumps 31,245 15,277 15,968Convenience Market
w/Gas Pumps 45,472 10,764 34,708Convenience Market
w/Gas Pumps 1,000 Sq Ft 18,740
Discount Club 1,000 Sq Ft 5,815 2,843 2,972 Discount Club 5,815 2,843 2,972 Discount Club 8,479 2,006 6,470 Discount Club 1,000 Sq Ft 3,498Pharmacy/Drugstore
w/Drive-Through 1,000 Sq Ft 7,329 3,584 3,746
Pharmacy/Drugstore
w/Drive-Through 7,329 3,584 3,746Pharmacy/Drugstore
w/Drive-Through 14,698 3,481 11,217Pharmacy/Drugstore
w/Drive-Through 1,000 Sq Ft 7,471
Furniture Store 1,000 Sq Ft 517 253 264 Furniture Store 517 253 264 Furniture Store 758 180 578 Furniture Store 1,000 Sq Ft 314
Walk-in Bank 1,000 Sq Ft 15,305 7,483 7,822 Walk-in Bank 15,305 7,483 7,822 Walk-in Bank 8,014 1,897 6,117 Walk-in Bank 1,000 Sq Ft -1,705
Drive-in Bank 1,000 Sq Ft 21,296 10,413 10,884 Drive-in Bank 12,800 6,258 6,541 Drive-in Bank 18,644 4,412 14,232 Drive-in Bank 1,000 Sq Ft 3,348
Indicates difference : Code and 2009
Technical Memorandum on the Methods of Calculating
Traffic Impact Fees
January 2009
Prepared for: City of Crestview
Moore Bass Consulting
805 North Gadsden Street Tallahassee Florida 32303
850.222.5678 off ice 850.681.2349 fax
Off ices in Destin Tal lahassee Atlanta
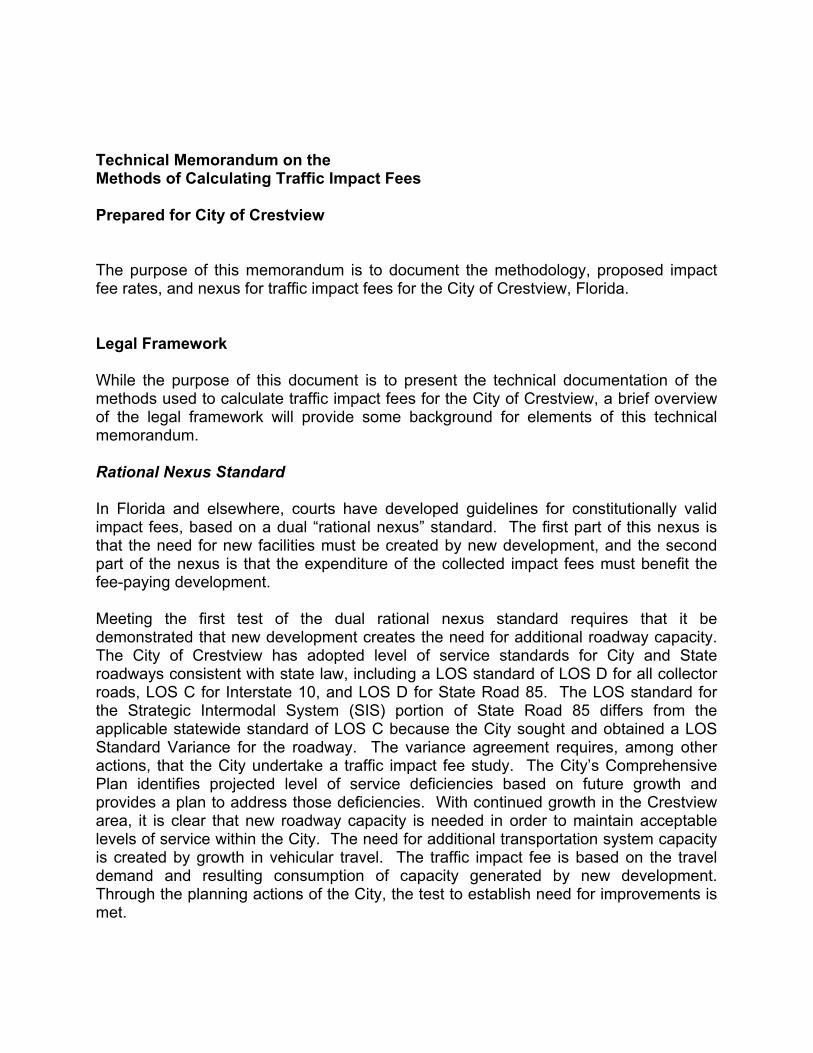
Technical Memorandum on the Methods of Calculating Traffic Impact Fees Prepared for City of Crestview The purpose of this memorandum is to document the methodology, proposed impact fee rates, and nexus for traffic impact fees for the City of Crestview, Florida. Legal Framework While the purpose of this document is to present the technical documentation of the methods used to calculate traffic impact fees for the City of Crestview, a brief overview of the legal framework will provide some background for elements of this technical memorandum. Rational Nexus Standard In Florida and elsewhere, courts have developed guidelines for constitutionally valid impact fees, based on a dual “rational nexus” standard. The first part of this nexus is that the need for new facilities must be created by new development, and the second part of the nexus is that the expenditure of the collected impact fees must benefit the fee-paying development. Meeting the first test of the dual rational nexus standard requires that it be demonstrated that new development creates the need for additional roadway capacity. The City of Crestview has adopted level of service standards for City and State roadways consistent with state law, including a LOS standard of LOS D for all collector roads, LOS C for Interstate 10, and LOS D for State Road 85. The LOS standard for the Strategic Intermodal System (SIS) portion of State Road 85 differs from the applicable statewide standard of LOS C because the City sought and obtained a LOS Standard Variance for the roadway. The variance agreement requires, among other actions, that the City undertake a traffic impact fee study. The City’s Comprehensive Plan identifies projected level of service deficiencies based on future growth and provides a plan to address those deficiencies. With continued growth in the Crestview area, it is clear that new roadway capacity is needed in order to maintain acceptable levels of service within the City. The need for additional transportation system capacity is created by growth in vehicular travel. The traffic impact fee is based on the travel demand and resulting consumption of capacity generated by new development. Through the planning actions of the City, the test to establish need for improvements is met.
Traffic Impact Fee Technical Memorandum City of Crestview 2
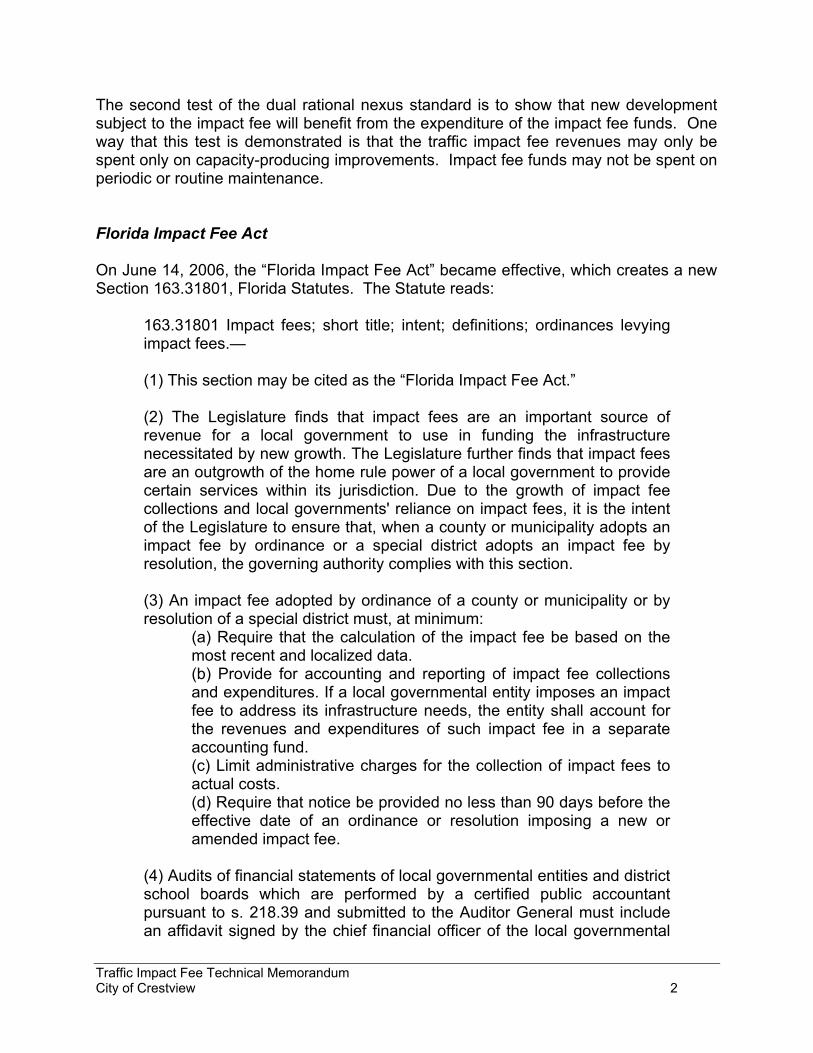
The second test of the dual rational nexus standard is to show that new development subject to the impact fee will benefit from the expenditure of the impact fee funds. One way that this test is demonstrated is that the traffic impact fee revenues may only be spent only on capacity-producing improvements. Impact fee funds may not be spent on periodic or routine maintenance. Florida Impact Fee Act On June 14, 2006, the “Florida Impact Fee Act” became effective, which creates a new Section 163.31801, Florida Statutes. The Statute reads:
163.31801 Impact fees; short title; intent; definitions; ordinances levying impact fees.— (1) This section may be cited as the “Florida Impact Fee Act.” (2) The Legislature finds that impact fees are an important source of revenue for a local government to use in funding the infrastructure necessitated by new growth. The Legislature further finds that impact fees are an outgrowth of the home rule power of a local government to provide certain services within its jurisdiction. Due to the growth of impact fee collections and local governments' reliance on impact fees, it is the intent of the Legislature to ensure that, when a county or municipality adopts an impact fee by ordinance or a special district adopts an impact fee by resolution, the governing authority complies with this section. (3) An impact fee adopted by ordinance of a county or municipality or by resolution of a special district must, at minimum:
(a) Require that the calculation of the impact fee be based on the most recent and localized data. (b) Provide for accounting and reporting of impact fee collections and expenditures. If a local governmental entity imposes an impact fee to address its infrastructure needs, the entity shall account for the revenues and expenditures of such impact fee in a separate accounting fund. (c) Limit administrative charges for the collection of impact fees to actual costs. (d) Require that notice be provided no less than 90 days before the effective date of an ordinance or resolution imposing a new or amended impact fee.
(4) Audits of financial statements of local governmental entities and district school boards which are performed by a certified public accountant pursuant to s. 218.39 and submitted to the Auditor General must include an affidavit signed by the chief financial officer of the local governmental
Traffic Impact Fee Technical Memorandum City of Crestview 3
entity or district school board stating that the local governmental entity or district school board has complied with this section.
The substantive requirement that is relevant to this technical memorandum is found in subparagraph (a), requiring that the impact fee must “be based on the most recent and localized data.” This study uses the latest data available, and is based on conditions particular to the City of Crestview. For example, the travel demand data includes the ITE Trip Generation, 8th Edition, published in late 2008 during the course of this study, and is incorporated into this analysis. The roadway costs are those calculated in 2007/2008 for the City’s update of the Capital Improvements Element. Florida-specific trip length data are used, which are then further refined by data specific to sub-county areas of Okaloosa County and other professional studies of Florida travel. Credit data is derived from the latest published Florida transportation revenue reports. In summary, this report complies with the substantive requirements of the Florida Impact Fee Act. Impact Fee Formula The first step in this process is to determine the travel that individual new developments are expected to place on the Crestview roadway system. The second step is to determine the quantity of roadway that each development type would consume, and then relate that consumption to the cost of planned roadways in Crestview. The third major step is to determine the credit applicable to new development by calculating what new development will pay in motor fuel taxes for additional roadway capacity. The general formula for this process is: Traffic Impact Fee = VMT x (Cost Per VMC – Credits)
Where: VMT = Vehicle Miles Traveled, determined by (Vehicular Trip Ends Per Day / 2) x Average Trip Length x % New Trips; Cost Per VMC (Vehicle Mile of Capacity) = (New Roads Provided x Cost of Improvements) / Added Road Capacity; and Credits = (Attributable Travel x Days Per Year) / Miles Per Gallon x Motor Fuels Tax x Present Value Factor
Travel Demand The first step in determining the impact of development projects is to estimate the travel demand for such projects or land uses. The projected travel by land use is determined by three chief factors: trip generation, percent new trips, and trip length.
Traffic Impact Fee Technical Memorandum City of Crestview 4
Trip Generation The trip generation rates used in this study are primarily from data published by the Institute of Traffic Engineers (ITE) in Trip Generation, 8th Edition, published in 2008. The ITE data represent a nationwide total of over 3,000 individual trip generation studies conducted over many years. This dataset represents the most comprehensive, industry-standard available data for most types of land uses. Each land use with ITE data is also represented by a land use code, and that code is included on pertinent data tables in this memorandum for consistency. Where ITE data is not available or not applicable, other available data is used from published trip generation studies. Of particular note is that the ITE Trip Generation 8th Edition did adjust its dataset to represent more relevant data for some land uses. One example is a Drive-In Bank (ITE land use code 912). It was determined that banks today operate very differently than they did in previous decades, and that the older data overestimated travel for modern banking practices. Therefore, data prior to the year 2000 was excluded from the dataset, and the estimated trip generation rate for such banks therefore was lowered significantly. This study uses daily trip rates, as is the common practice for such studies. Daily trip rates are used instead of other measures such as peak hourly trip rates to reflect the general nature of trips among all land uses, and to not overestimate traffic from any individual land use. For example, if PM peak hour trip generation were used, land uses such as offices and gas stations would probably have overstated traffic, while land uses such as schools or sit-down restaurants (which have relatively little afternoon “rush hour” traffic) would probably have understated traffic. Trip generation results in the number of trip ends, or driveway crossings, at a given development site. For example, a single one-way trip from work to home represents two trip ends, one trip end for the workplace and one trip end for the home. To avoid over-counting these trip ends, all trip rates are divided by two. Percent New Trips Trip rates are also adjusted by a “percent new trips” factor to reduce traffic assumptions for land uses that experience visits from drivers “passing by” on their way to their primary destination. For example, a driver leaving work at the end of the day, stopping at the convenience store, then arriving at home makes two trips, one from work to the convenience store and one from the convenience store to home, but the primary trip purpose is to go from work to home, and the stop at the convenience store is not a “new trip” but instead is a “pass-by” trip, and the “percent new trips” adjustments reduces the average trips for the convenience store land use to account for these non-new trips. The resulting characteristics of trip generation and percent new trips are shown in Table 1.
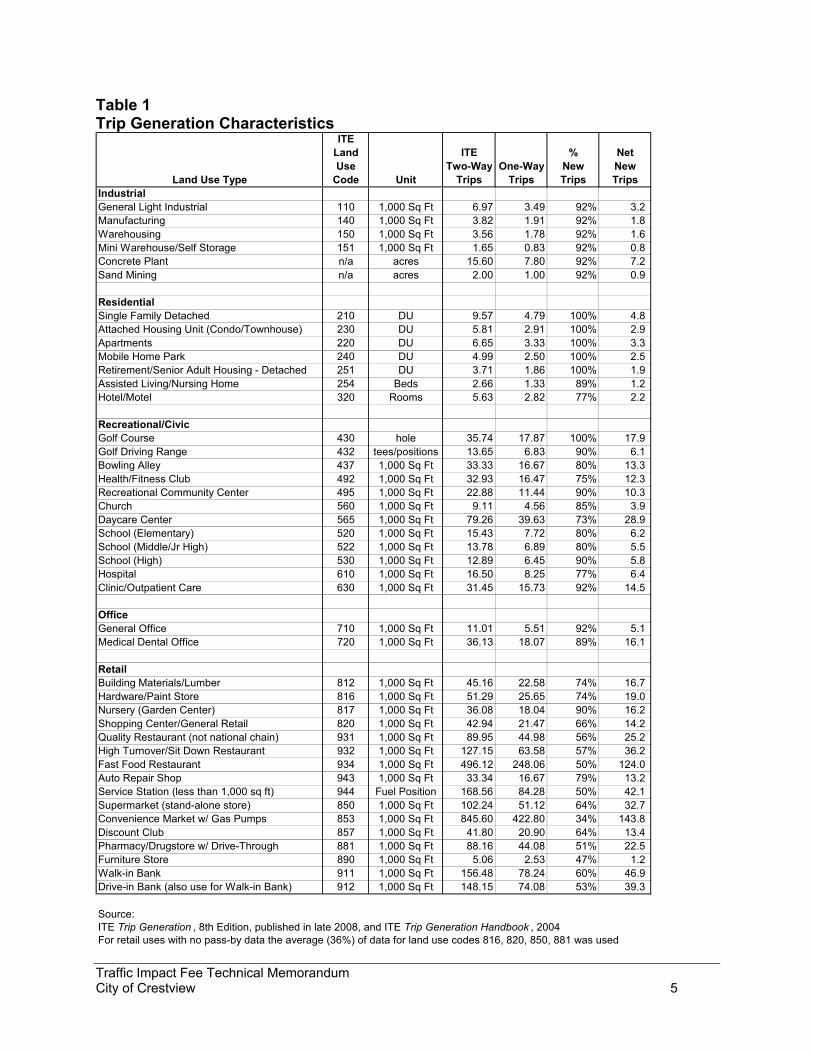
Traffic Impact Fee Technical Memorandum City of Crestview 5
Table 1 Trip Generation Characteristics
ITELand ITE % NetUse Two-Way One-Way New New
Land Use Type Code Unit Trips Trips Trips TripsIndustrialGeneral Light Industrial 110 1,000 Sq Ft 6.97 3.49 92% 3.2 Manufacturing 140 1,000 Sq Ft 3.82 1.91 92% 1.8 Warehousing 150 1,000 Sq Ft 3.56 1.78 92% 1.6 Mini Warehouse/Self Storage 151 1,000 Sq Ft 1.65 0.83 92% 0.8 Concrete Plant n/a acres 15.60 7.80 92% 7.2 Sand Mining n/a acres 2.00 1.00 92% 0.9
ResidentialSingle Family Detached 210 DU 9.57 4.79 100% 4.8 Attached Housing Unit (Condo/Townhouse) 230 DU 5.81 2.91 100% 2.9 Apartments 220 DU 6.65 3.33 100% 3.3 Mobile Home Park 240 DU 4.99 2.50 100% 2.5 Retirement/Senior Adult Housing - Detached 251 DU 3.71 1.86 100% 1.9 Assisted Living/Nursing Home 254 Beds 2.66 1.33 89% 1.2 Hotel/Motel 320 Rooms 5.63 2.82 77% 2.2
Recreational/CivicGolf Course 430 hole 35.74 17.87 100% 17.9 Golf Driving Range 432 tees/positions 13.65 6.83 90% 6.1 Bowling Alley 437 1,000 Sq Ft 33.33 16.67 80% 13.3 Health/Fitness Club 492 1,000 Sq Ft 32.93 16.47 75% 12.3 Recreational Community Center 495 1,000 Sq Ft 22.88 11.44 90% 10.3 Church 560 1,000 Sq Ft 9.11 4.56 85% 3.9 Daycare Center 565 1,000 Sq Ft 79.26 39.63 73% 28.9 School (Elementary) 520 1,000 Sq Ft 15.43 7.72 80% 6.2 School (Middle/Jr High) 522 1,000 Sq Ft 13.78 6.89 80% 5.5 School (High) 530 1,000 Sq Ft 12.89 6.45 90% 5.8 Hospital 610 1,000 Sq Ft 16.50 8.25 77% 6.4 Clinic/Outpatient Care 630 1,000 Sq Ft 31.45 15.73 92% 14.5
OfficeGeneral Office 710 1,000 Sq Ft 11.01 5.51 92% 5.1 Medical Dental Office 720 1,000 Sq Ft 36.13 18.07 89% 16.1
RetailBuilding Materials/Lumber 812 1,000 Sq Ft 45.16 22.58 74% 16.7 Hardware/Paint Store 816 1,000 Sq Ft 51.29 25.65 74% 19.0 Nursery (Garden Center) 817 1,000 Sq Ft 36.08 18.04 90% 16.2 Shopping Center/General Retail 820 1,000 Sq Ft 42.94 21.47 66% 14.2 Quality Restaurant (not national chain) 931 1,000 Sq Ft 89.95 44.98 56% 25.2 High Turnover/Sit Down Restaurant 932 1,000 Sq Ft 127.15 63.58 57% 36.2 Fast Food Restaurant 934 1,000 Sq Ft 496.12 248.06 50% 124.0 Auto Repair Shop 943 1,000 Sq Ft 33.34 16.67 79% 13.2 Service Station (less than 1,000 sq ft) 944 Fuel Position 168.56 84.28 50% 42.1 Supermarket (stand-alone store) 850 1,000 Sq Ft 102.24 51.12 64% 32.7 Convenience Market w/ Gas Pumps 853 1,000 Sq Ft 845.60 422.80 34% 143.8 Discount Club 857 1,000 Sq Ft 41.80 20.90 64% 13.4 Pharmacy/Drugstore w/ Drive-Through 881 1,000 Sq Ft 88.16 44.08 51% 22.5 Furniture Store 890 1,000 Sq Ft 5.06 2.53 47% 1.2 Walk-in Bank 911 1,000 Sq Ft 156.48 78.24 60% 46.9 Drive-in Bank (also use for Walk-in Bank) 912 1,000 Sq Ft 148.15 74.08 53% 39.3
Source:ITE Trip Generation , 8th Edition, published in late 2008, and ITE Trip Generation Handbook , 2004For retail uses with no pass-by data the average (36%) of data for land use codes 816, 820, 850, 881 was used
Traffic Impact Fee Technical Memorandum City of Crestview 6
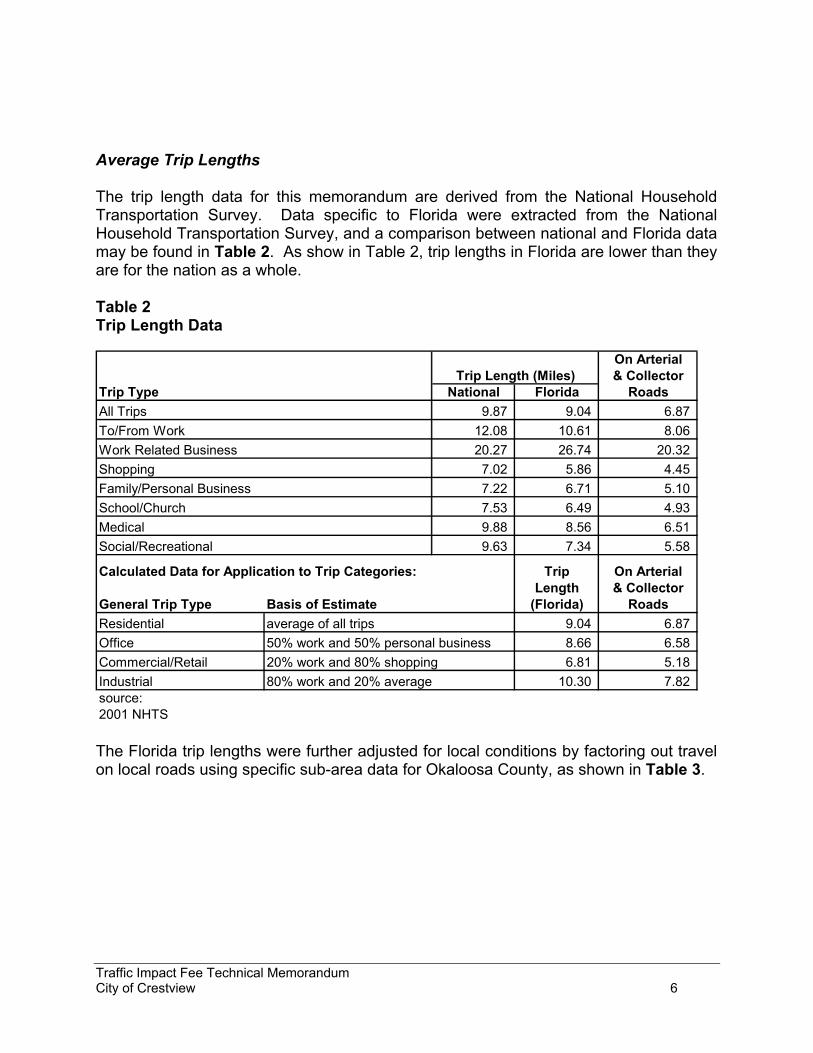
Average Trip Lengths The trip length data for this memorandum are derived from the National Household Transportation Survey. Data specific to Florida were extracted from the National Household Transportation Survey, and a comparison between national and Florida data may be found in Table 2. As show in Table 2, trip lengths in Florida are lower than they are for the nation as a whole. Table 2 Trip Length Data
On ArterialTrip Length (Miles) & Collector
Trip Type National Florida RoadsAll Trips 9.87 9.04 6.87 To/From Work 12.08 10.61 8.06 Work Related Business 20.27 26.74 20.32 Shopping 7.02 5.86 4.45 Family/Personal Business 7.22 6.71 5.10 School/Church 7.53 6.49 4.93 Medical 9.88 8.56 6.51 Social/Recreational 9.63 7.34 5.58
Calculated Data for Application to Trip Categories: Trip On ArterialLength & Collector
General Trip Type Basis of Estimate (Florida) RoadsResidential average of all trips 9.04 6.87 Office 50% work and 50% personal business 8.66 6.58 Commercial/Retail 20% work and 80% shopping 6.81 5.18 Industrial 80% work and 20% average 10.30 7.82 source:2001 NHTS The Florida trip lengths were further adjusted for local conditions by factoring out travel on local roads using specific sub-area data for Okaloosa County, as shown in Table 3.
Traffic Impact Fee Technical Memorandum City of Crestview 7
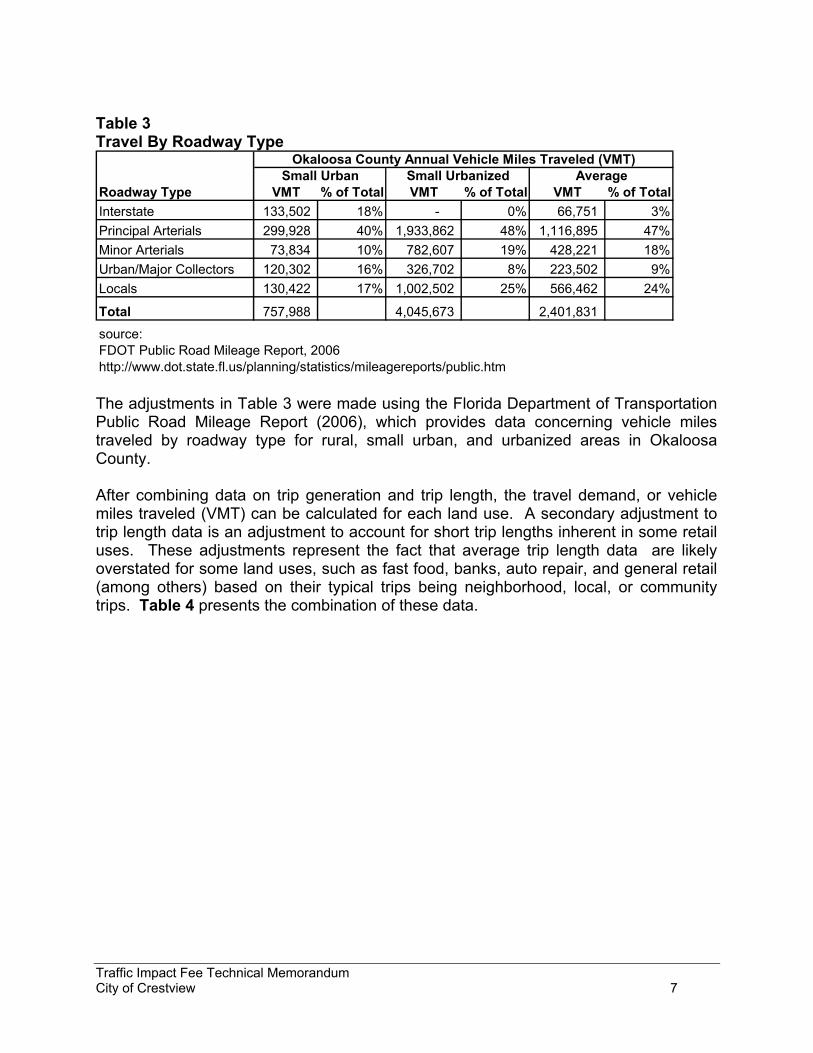
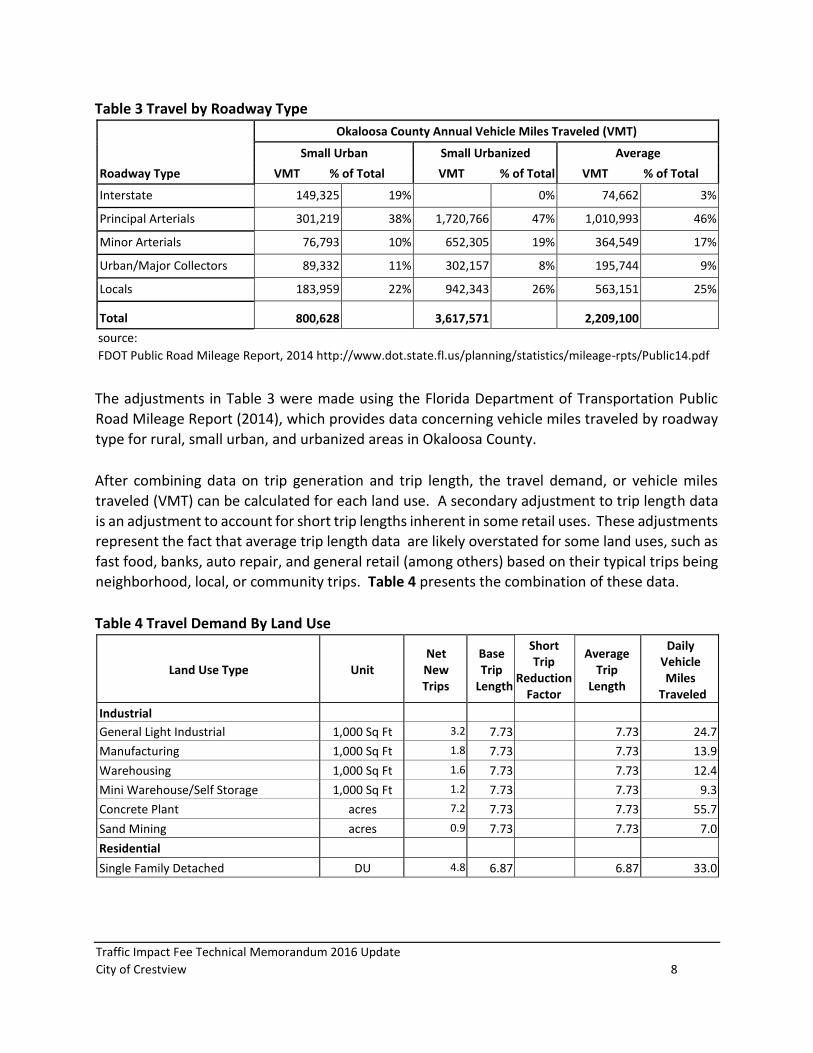
Table 3 Travel By Roadway Type
Okaloosa County Annual Vehicle Miles Traveled (VMT)Small Urban Small Urbanized Average
Roadway Type VMT % of Total VMT % of Total VMT % of TotalInterstate 133,502 18% - 0% 66,751 3%Principal Arterials 299,928 40% 1,933,862 48% 1,116,895 47%Minor Arterials 73,834 10% 782,607 19% 428,221 18%Urban/Major Collectors 120,302 16% 326,702 8% 223,502 9%Locals 130,422 17% 1,002,502 25% 566,462 24%
Total 757,988 4,045,673 2,401,831
source:FDOT Public Road Mileage Report, 2006http://www.dot.state.fl.us/planning/statistics/mileagereports/public.htm The adjustments in Table 3 were made using the Florida Department of Transportation Public Road Mileage Report (2006), which provides data concerning vehicle miles traveled by roadway type for rural, small urban, and urbanized areas in Okaloosa County. After combining data on trip generation and trip length, the travel demand, or vehicle miles traveled (VMT) can be calculated for each land use. A secondary adjustment to trip length data is an adjustment to account for short trip lengths inherent in some retail uses. These adjustments represent the fact that average trip length data are likely overstated for some land uses, such as fast food, banks, auto repair, and general retail (among others) based on their typical trips being neighborhood, local, or community trips. Table 4 presents the combination of these data.
Traffic Impact Fee Technical Memorandum City of Crestview 8
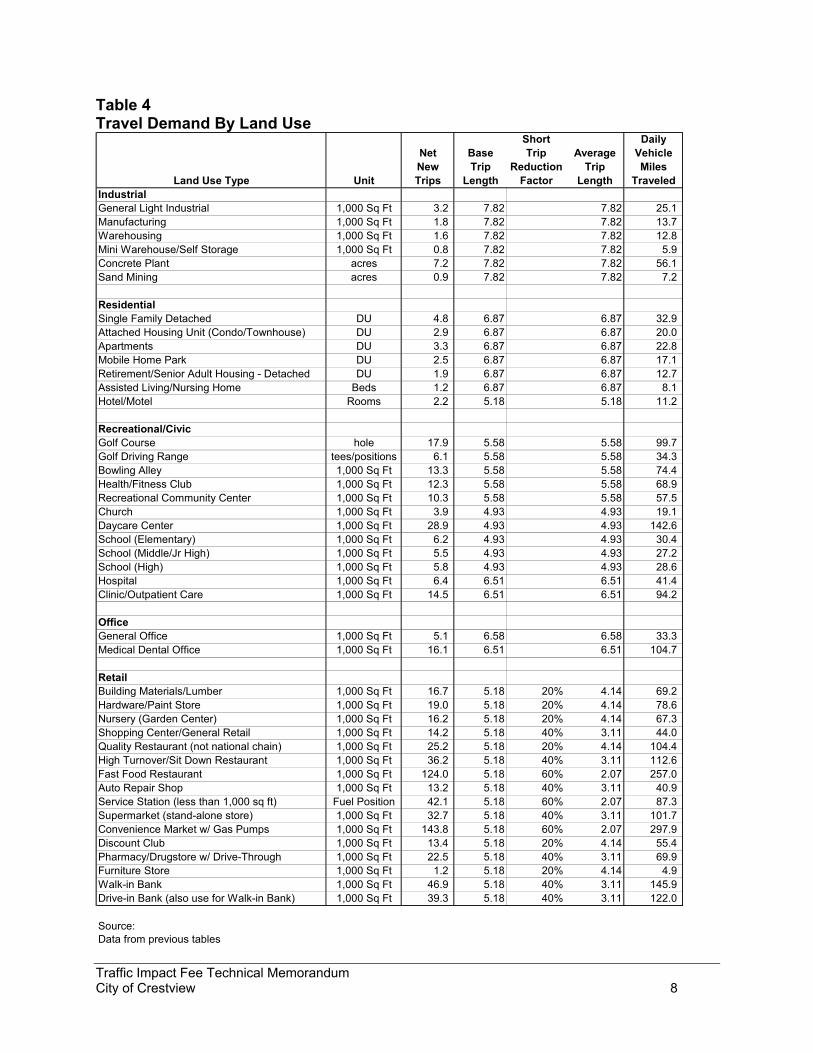
Table 4 Travel Demand By Land Use
Short DailyNet Base Trip Average VehicleNew Trip Reduction Trip Miles
Land Use Type Unit Trips Length Factor Length TraveledIndustrialGeneral Light Industrial 1,000 Sq Ft 3.2 7.82 7.82 25.1 Manufacturing 1,000 Sq Ft 1.8 7.82 7.82 13.7 Warehousing 1,000 Sq Ft 1.6 7.82 7.82 12.8 Mini Warehouse/Self Storage 1,000 Sq Ft 0.8 7.82 7.82 5.9 Concrete Plant acres 7.2 7.82 7.82 56.1 Sand Mining acres 0.9 7.82 7.82 7.2
ResidentialSingle Family Detached DU 4.8 6.87 6.87 32.9 Attached Housing Unit (Condo/Townhouse) DU 2.9 6.87 6.87 20.0 Apartments DU 3.3 6.87 6.87 22.8 Mobile Home Park DU 2.5 6.87 6.87 17.1 Retirement/Senior Adult Housing - Detached DU 1.9 6.87 6.87 12.7 Assisted Living/Nursing Home Beds 1.2 6.87 6.87 8.1 Hotel/Motel Rooms 2.2 5.18 5.18 11.2
Recreational/CivicGolf Course hole 17.9 5.58 5.58 99.7 Golf Driving Range tees/positions 6.1 5.58 5.58 34.3 Bowling Alley 1,000 Sq Ft 13.3 5.58 5.58 74.4 Health/Fitness Club 1,000 Sq Ft 12.3 5.58 5.58 68.9 Recreational Community Center 1,000 Sq Ft 10.3 5.58 5.58 57.5 Church 1,000 Sq Ft 3.9 4.93 4.93 19.1 Daycare Center 1,000 Sq Ft 28.9 4.93 4.93 142.6 School (Elementary) 1,000 Sq Ft 6.2 4.93 4.93 30.4 School (Middle/Jr High) 1,000 Sq Ft 5.5 4.93 4.93 27.2 School (High) 1,000 Sq Ft 5.8 4.93 4.93 28.6 Hospital 1,000 Sq Ft 6.4 6.51 6.51 41.4 Clinic/Outpatient Care 1,000 Sq Ft 14.5 6.51 6.51 94.2
OfficeGeneral Office 1,000 Sq Ft 5.1 6.58 6.58 33.3 Medical Dental Office 1,000 Sq Ft 16.1 6.51 6.51 104.7
RetailBuilding Materials/Lumber 1,000 Sq Ft 16.7 5.18 20% 4.14 69.2 Hardware/Paint Store 1,000 Sq Ft 19.0 5.18 20% 4.14 78.6 Nursery (Garden Center) 1,000 Sq Ft 16.2 5.18 20% 4.14 67.3 Shopping Center/General Retail 1,000 Sq Ft 14.2 5.18 40% 3.11 44.0 Quality Restaurant (not national chain) 1,000 Sq Ft 25.2 5.18 20% 4.14 104.4 High Turnover/Sit Down Restaurant 1,000 Sq Ft 36.2 5.18 40% 3.11 112.6 Fast Food Restaurant 1,000 Sq Ft 124.0 5.18 60% 2.07 257.0 Auto Repair Shop 1,000 Sq Ft 13.2 5.18 40% 3.11 40.9 Service Station (less than 1,000 sq ft) Fuel Position 42.1 5.18 60% 2.07 87.3 Supermarket (stand-alone store) 1,000 Sq Ft 32.7 5.18 40% 3.11 101.7 Convenience Market w/ Gas Pumps 1,000 Sq Ft 143.8 5.18 60% 2.07 297.9 Discount Club 1,000 Sq Ft 13.4 5.18 20% 4.14 55.4 Pharmacy/Drugstore w/ Drive-Through 1,000 Sq Ft 22.5 5.18 40% 3.11 69.9 Furniture Store 1,000 Sq Ft 1.2 5.18 20% 4.14 4.9 Walk-in Bank 1,000 Sq Ft 46.9 5.18 40% 3.11 145.9 Drive-in Bank (also use for Walk-in Bank) 1,000 Sq Ft 39.3 5.18 40% 3.11 122.0
Source:Data from previous tables
Traffic Impact Fee Technical Memorandum City of Crestview 9
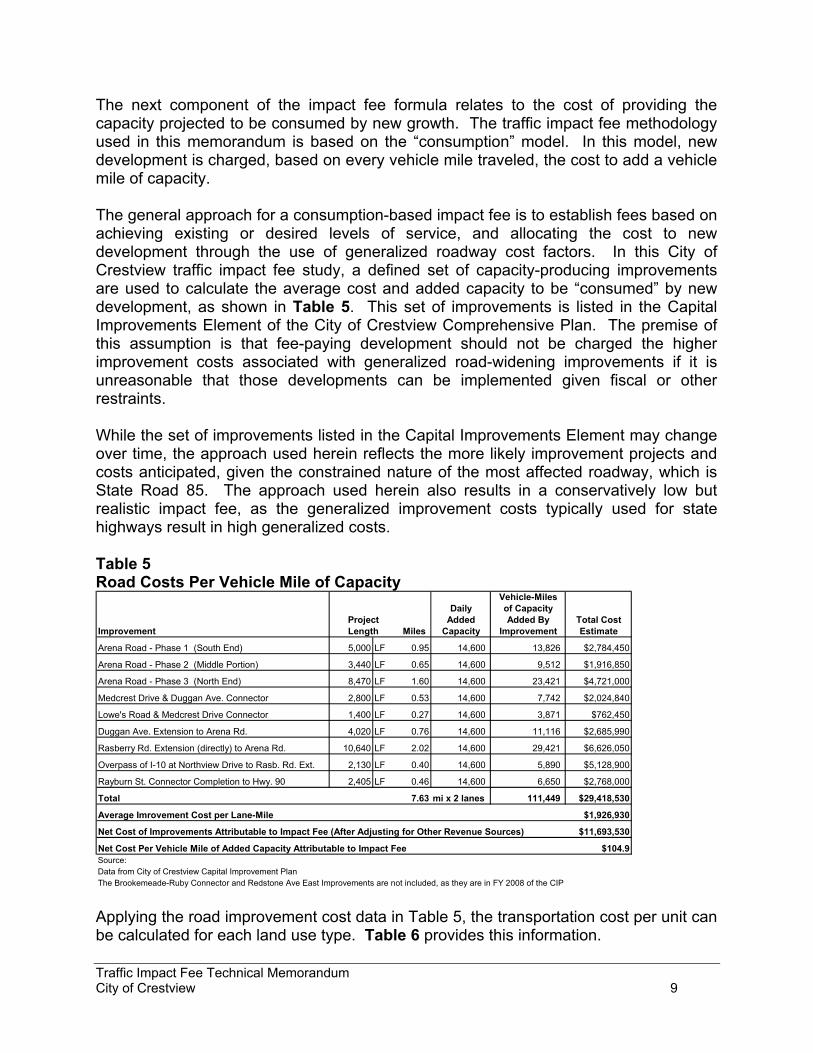
The next component of the impact fee formula relates to the cost of providing the capacity projected to be consumed by new growth. The traffic impact fee methodology used in this memorandum is based on the “consumption” model. In this model, new development is charged, based on every vehicle mile traveled, the cost to add a vehicle mile of capacity. The general approach for a consumption-based impact fee is to establish fees based on achieving existing or desired levels of service, and allocating the cost to new development through the use of generalized roadway cost factors. In this City of Crestview traffic impact fee study, a defined set of capacity-producing improvements are used to calculate the average cost and added capacity to be “consumed” by new development, as shown in Table 5. This set of improvements is listed in the Capital Improvements Element of the City of Crestview Comprehensive Plan. The premise of this assumption is that fee-paying development should not be charged the higher improvement costs associated with generalized road-widening improvements if it is unreasonable that those developments can be implemented given fiscal or other restraints. While the set of improvements listed in the Capital Improvements Element may change over time, the approach used herein reflects the more likely improvement projects and costs anticipated, given the constrained nature of the most affected roadway, which is State Road 85. The approach used herein also results in a conservatively low but realistic impact fee, as the generalized improvement costs typically used for state highways result in high generalized costs. Table 5 Road Costs Per Vehicle Mile of Capacity
Vehicle-MilesDaily of Capacity
Project Added Added By Total CostImprovement Length Miles Capacity Improvement Estimate
Arena Road - Phase 1 (South End) 5,000 LF 0.95 14,600 13,826 $2,784,450
Arena Road - Phase 2 (Middle Portion) 3,440 LF 0.65 14,600 9,512 $1,916,850
Arena Road - Phase 3 (North End) 8,470 LF 1.60 14,600 23,421 $4,721,000
Medcrest Drive & Duggan Ave. Connector 2,800 LF 0.53 14,600 7,742 $2,024,840
Lowe's Road & Medcrest Drive Connector 1,400 LF 0.27 14,600 3,871 $762,450
Duggan Ave. Extension to Arena Rd. 4,020 LF 0.76 14,600 11,116 $2,685,990
Rasberry Rd. Extension (directly) to Arena Rd. 10,640 LF 2.02 14,600 29,421 $6,626,050
Overpass of I-10 at Northview Drive to Rasb. Rd. Ext. 2,130 LF 0.40 14,600 5,890 $5,128,900
Rayburn St. Connector Completion to Hwy. 90 2,405 LF 0.46 14,600 6,650 $2,768,000
Total 7.63 mi x 2 lanes 111,449 $29,418,530
Average Imrovement Cost per Lane-Mile $1,926,930
Net Cost of Improvements Attributable to Impact Fee (After Adjusting for Other Revenue Sources) $11,693,530
Net Cost Per Vehicle Mile of Added Capacity Attributable to Impact Fee $104.9Source:Data from City of Crestview Capital Improvement PlanThe Brookemeade-Ruby Connector and Redstone Ave East Improvements are not included, as they are in FY 2008 of the CIP Applying the road improvement cost data in Table 5, the transportation cost per unit can be calculated for each land use type. Table 6 provides this information.
Traffic Impact Fee Technical Memorandum City of Crestview 10
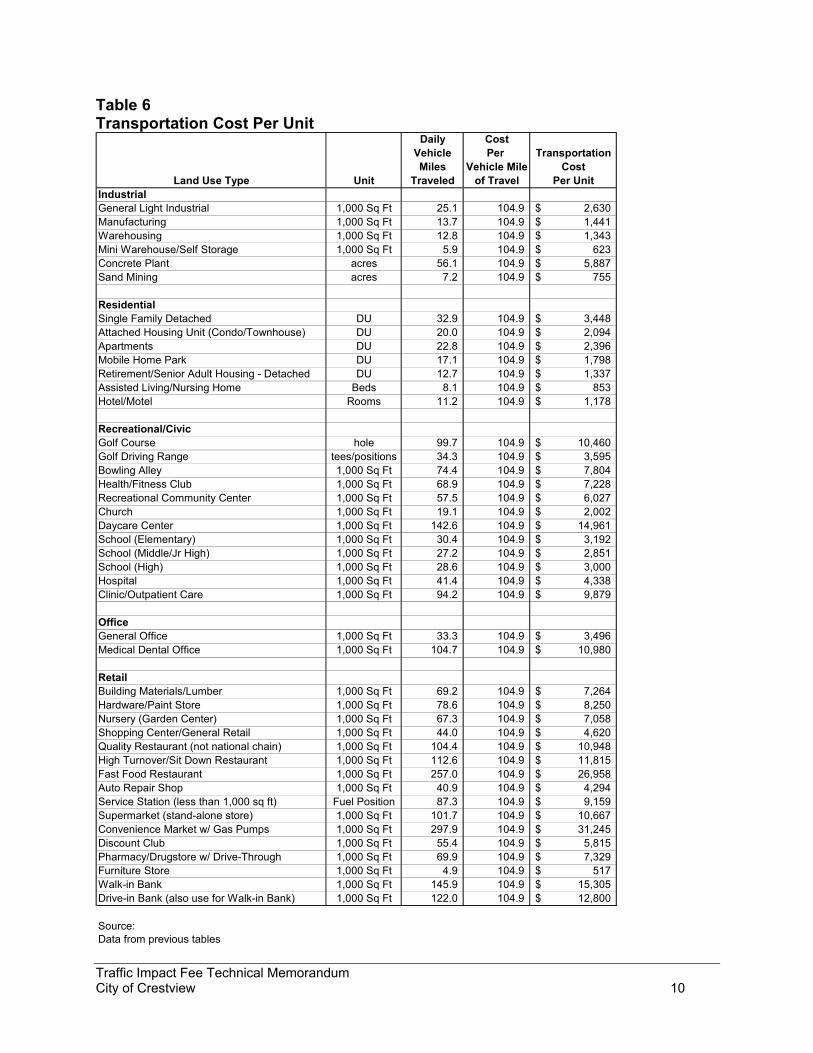
Table 6 Transportation Cost Per Unit
Daily CostVehicle Per TransportationMiles Vehicle Mile Cost
Land Use Type Unit Traveled of Travel Per UnitIndustrialGeneral Light Industrial 1,000 Sq Ft 25.1 104.9 2,630$ Manufacturing 1,000 Sq Ft 13.7 104.9 1,441$ Warehousing 1,000 Sq Ft 12.8 104.9 1,343$ Mini Warehouse/Self Storage 1,000 Sq Ft 5.9 104.9 623$ Concrete Plant acres 56.1 104.9 5,887$ Sand Mining acres 7.2 104.9 755$
ResidentialSingle Family Detached DU 32.9 104.9 3,448$ Attached Housing Unit (Condo/Townhouse) DU 20.0 104.9 2,094$ Apartments DU 22.8 104.9 2,396$ Mobile Home Park DU 17.1 104.9 1,798$ Retirement/Senior Adult Housing - Detached DU 12.7 104.9 1,337$ Assisted Living/Nursing Home Beds 8.1 104.9 853$ Hotel/Motel Rooms 11.2 104.9 1,178$
Recreational/CivicGolf Course hole 99.7 104.9 10,460$ Golf Driving Range tees/positions 34.3 104.9 3,595$ Bowling Alley 1,000 Sq Ft 74.4 104.9 7,804$ Health/Fitness Club 1,000 Sq Ft 68.9 104.9 7,228$ Recreational Community Center 1,000 Sq Ft 57.5 104.9 6,027$ Church 1,000 Sq Ft 19.1 104.9 2,002$ Daycare Center 1,000 Sq Ft 142.6 104.9 14,961$ School (Elementary) 1,000 Sq Ft 30.4 104.9 3,192$ School (Middle/Jr High) 1,000 Sq Ft 27.2 104.9 2,851$ School (High) 1,000 Sq Ft 28.6 104.9 3,000$ Hospital 1,000 Sq Ft 41.4 104.9 4,338$ Clinic/Outpatient Care 1,000 Sq Ft 94.2 104.9 9,879$
OfficeGeneral Office 1,000 Sq Ft 33.3 104.9 3,496$ Medical Dental Office 1,000 Sq Ft 104.7 104.9 10,980$
RetailBuilding Materials/Lumber 1,000 Sq Ft 69.2 104.9 7,264$ Hardware/Paint Store 1,000 Sq Ft 78.6 104.9 8,250$ Nursery (Garden Center) 1,000 Sq Ft 67.3 104.9 7,058$ Shopping Center/General Retail 1,000 Sq Ft 44.0 104.9 4,620$ Quality Restaurant (not national chain) 1,000 Sq Ft 104.4 104.9 10,948$ High Turnover/Sit Down Restaurant 1,000 Sq Ft 112.6 104.9 11,815$ Fast Food Restaurant 1,000 Sq Ft 257.0 104.9 26,958$ Auto Repair Shop 1,000 Sq Ft 40.9 104.9 4,294$ Service Station (less than 1,000 sq ft) Fuel Position 87.3 104.9 9,159$ Supermarket (stand-alone store) 1,000 Sq Ft 101.7 104.9 10,667$ Convenience Market w/ Gas Pumps 1,000 Sq Ft 297.9 104.9 31,245$ Discount Club 1,000 Sq Ft 55.4 104.9 5,815$ Pharmacy/Drugstore w/ Drive-Through 1,000 Sq Ft 69.9 104.9 7,329$ Furniture Store 1,000 Sq Ft 4.9 104.9 517$ Walk-in Bank 1,000 Sq Ft 145.9 104.9 15,305$ Drive-in Bank (also use for Walk-in Bank) 1,000 Sq Ft 122.0 104.9 12,800$
Source:Data from previous tables
Traffic Impact Fee Technical Memorandum City of Crestview 11
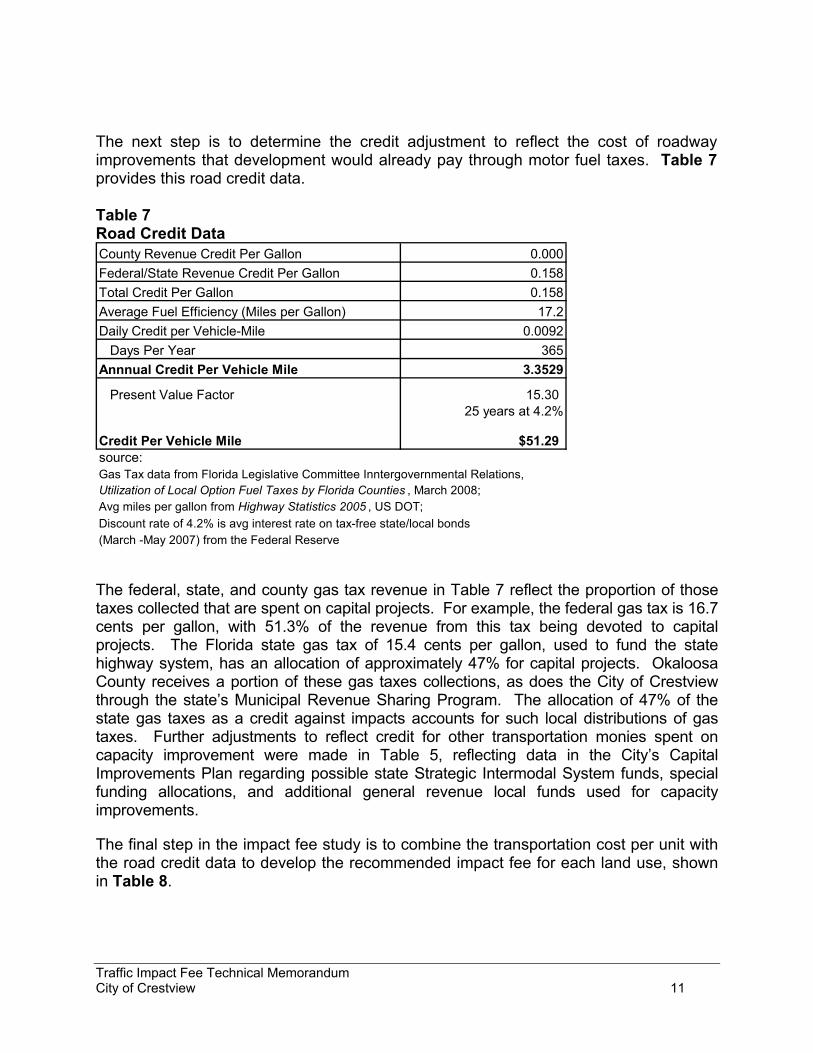
The next step is to determine the credit adjustment to reflect the cost of roadway improvements that development would already pay through motor fuel taxes. Table 7 provides this road credit data. Table 7 Road Credit Data County Revenue Credit Per Gallon 0.000Federal/State Revenue Credit Per Gallon 0.158Total Credit Per Gallon 0.158Average Fuel Efficiency (Miles per Gallon) 17.2Daily Credit per Vehicle-Mile 0.0092
Days Per Year 365Annnual Credit Per Vehicle Mile 3.3529
Present Value Factor 15.30 25 years at 4.2%
Credit Per Vehicle Mile $51.29source:Gas Tax data from Florida Legislative Committee Inntergovernmental Relations,Utilization of Local Option Fuel Taxes by Florida Counties , March 2008;Avg miles per gallon from Highway Statistics 2005 , US DOT;Discount rate of 4.2% is avg interest rate on tax-free state/local bonds(March -May 2007) from the Federal Reserve
The federal, state, and county gas tax revenue in Table 7 reflect the proportion of those taxes collected that are spent on capital projects. For example, the federal gas tax is 16.7 cents per gallon, with 51.3% of the revenue from this tax being devoted to capital projects. The Florida state gas tax of 15.4 cents per gallon, used to fund the state highway system, has an allocation of approximately 47% for capital projects. Okaloosa County receives a portion of these gas taxes collections, as does the City of Crestview through the state’s Municipal Revenue Sharing Program. The allocation of 47% of the state gas taxes as a credit against impacts accounts for such local distributions of gas taxes. Further adjustments to reflect credit for other transportation monies spent on capacity improvement were made in Table 5, reflecting data in the City’s Capital Improvements Plan regarding possible state Strategic Intermodal System funds, special funding allocations, and additional general revenue local funds used for capacity improvements.
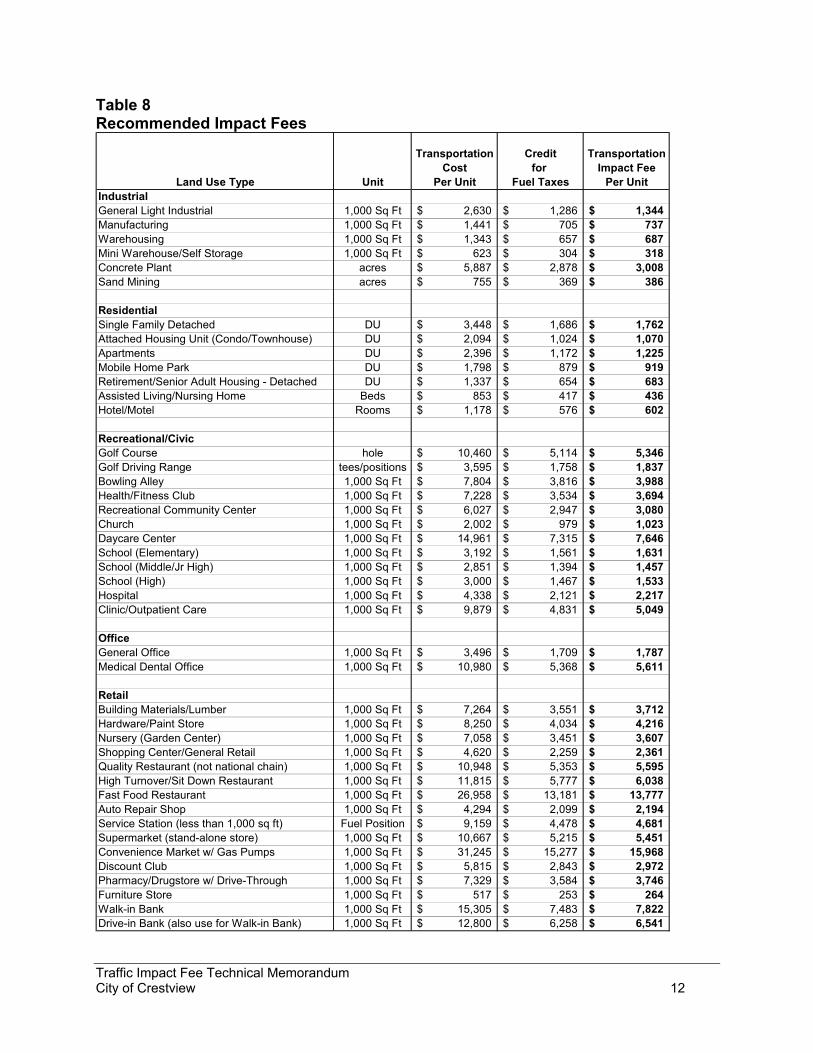
The final step in the impact fee study is to combine the transportation cost per unit with the road credit data to develop the recommended impact fee for each land use, shown in Table 8.
Traffic Impact Fee Technical Memorandum City of Crestview 12
Table 8 Recommended Impact Fees
Transportation Credit TransportationCost for Impact Fee
Land Use Type Unit Per Unit Fuel Taxes Per UnitIndustrialGeneral Light Industrial 1,000 Sq Ft 2,630$ 1,286$ 1,344$ Manufacturing 1,000 Sq Ft 1,441$ 705$ 737$ Warehousing 1,000 Sq Ft 1,343$ 657$ 687$ Mini Warehouse/Self Storage 1,000 Sq Ft 623$ 304$ 318$ Concrete Plant acres 5,887$ 2,878$ 3,008$ Sand Mining acres 755$ 369$ 386$
ResidentialSingle Family Detached DU 3,448$ 1,686$ 1,762$ Attached Housing Unit (Condo/Townhouse) DU 2,094$ 1,024$ 1,070$ Apartments DU 2,396$ 1,172$ 1,225$ Mobile Home Park DU 1,798$ 879$ 919$ Retirement/Senior Adult Housing - Detached DU 1,337$ 654$ 683$ Assisted Living/Nursing Home Beds 853$ 417$ 436$ Hotel/Motel Rooms 1,178$ 576$ 602$
Recreational/CivicGolf Course hole 10,460$ 5,114$ 5,346$ Golf Driving Range tees/positions 3,595$ 1,758$ 1,837$ Bowling Alley 1,000 Sq Ft 7,804$ 3,816$ 3,988$ Health/Fitness Club 1,000 Sq Ft 7,228$ 3,534$ 3,694$ Recreational Community Center 1,000 Sq Ft 6,027$ 2,947$ 3,080$ Church 1,000 Sq Ft 2,002$ 979$ 1,023$ Daycare Center 1,000 Sq Ft 14,961$ 7,315$ 7,646$ School (Elementary) 1,000 Sq Ft 3,192$ 1,561$ 1,631$ School (Middle/Jr High) 1,000 Sq Ft 2,851$ 1,394$ 1,457$ School (High) 1,000 Sq Ft 3,000$ 1,467$ 1,533$ Hospital 1,000 Sq Ft 4,338$ 2,121$ 2,217$ Clinic/Outpatient Care 1,000 Sq Ft 9,879$ 4,831$ 5,049$
OfficeGeneral Office 1,000 Sq Ft 3,496$ 1,709$ 1,787$ Medical Dental Office 1,000 Sq Ft 10,980$ 5,368$ 5,611$
RetailBuilding Materials/Lumber 1,000 Sq Ft 7,264$ 3,551$ 3,712$ Hardware/Paint Store 1,000 Sq Ft 8,250$ 4,034$ 4,216$ Nursery (Garden Center) 1,000 Sq Ft 7,058$ 3,451$ 3,607$ Shopping Center/General Retail 1,000 Sq Ft 4,620$ 2,259$ 2,361$ Quality Restaurant (not national chain) 1,000 Sq Ft 10,948$ 5,353$ 5,595$ High Turnover/Sit Down Restaurant 1,000 Sq Ft 11,815$ 5,777$ 6,038$ Fast Food Restaurant 1,000 Sq Ft 26,958$ 13,181$ 13,777$ Auto Repair Shop 1,000 Sq Ft 4,294$ 2,099$ 2,194$ Service Station (less than 1,000 sq ft) Fuel Position 9,159$ 4,478$ 4,681$ Supermarket (stand-alone store) 1,000 Sq Ft 10,667$ 5,215$ 5,451$ Convenience Market w/ Gas Pumps 1,000 Sq Ft 31,245$ 15,277$ 15,968$ Discount Club 1,000 Sq Ft 5,815$ 2,843$ 2,972$ Pharmacy/Drugstore w/ Drive-Through 1,000 Sq Ft 7,329$ 3,584$ 3,746$ Furniture Store 1,000 Sq Ft 517$ 253$ 264$ Walk-in Bank 1,000 Sq Ft 15,305$ 7,483$ 7,822$ Drive-in Bank (also use for Walk-in Bank) 1,000 Sq Ft 12,800$ 6,258$ 6,541$
Traffic Impact Fee Technical Memorandum City of Crestview 13
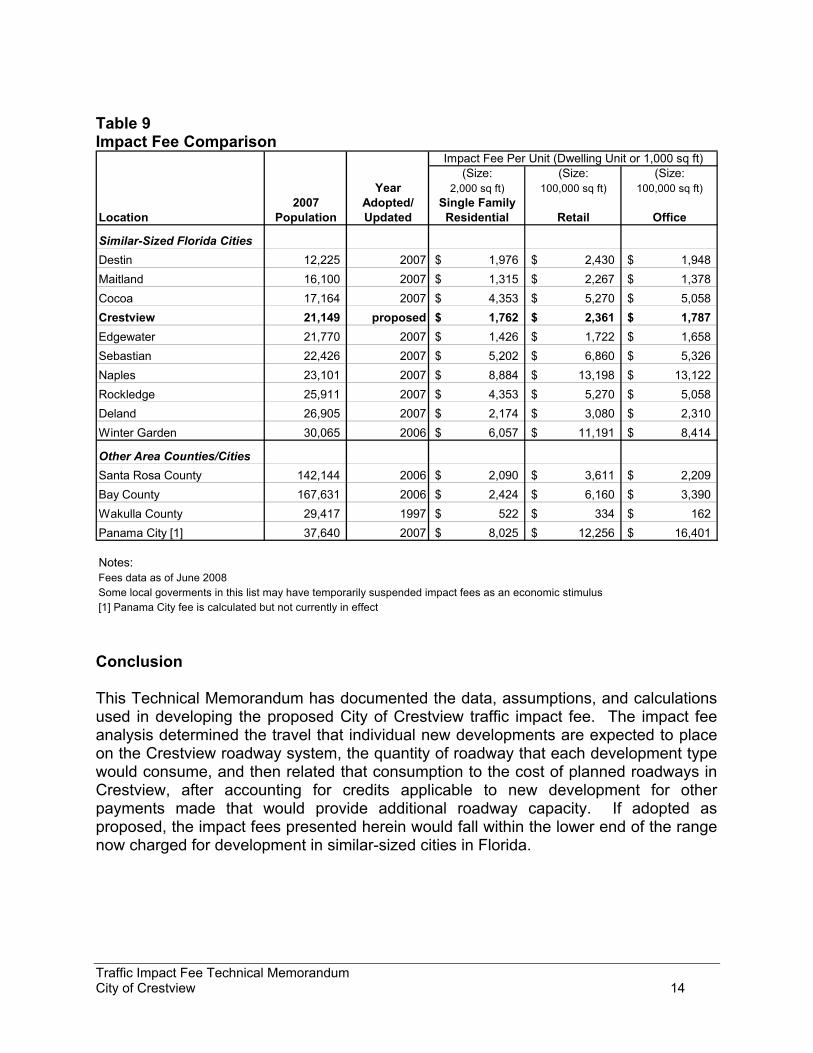
Alternative Calculations of Impact Fees As with virtually all traffic impact fee calculations, this study is based on averages and typical conditions. Therefore, it is possible that the impact of an individual new development could differ. It is recommended that the traffic impact fee ordinance provide for the opportunity to submit alternative calculations that account for differences in the underlying assumptions of this study, or that reflect new types of land uses that are not included in this study. In considering alternative calculations, however, care should be taken that such that any alternative calculations are limited to circumstances where there are meaningful differences in the averages used in this study and the more specific data of the development or land use being considered for an alternative calculation. As with all statistics, there will be variations about the mean for any of the land uses herein. If data for a specific site vary from the mean, but fall within the normal variation about the mean, then such data are not really different from the mean. Of course, there may be occasions where a particular proposed development is different than those assumed herein, and in such cases, an alternative calculation is appropriate. Impact Fee Comparisons To provide perspective, Table 9 was prepared to show impact fees charged for similar-sized Florida cities and in some nearby locations. A review of this table indicates that the calculated fee for the City of Crestview falls within the lower end of the range for similar-sized cities in Florida.
Traffic Impact Fee Technical Memorandum City of Crestview 14
Table 9 Impact Fee Comparison Impact Fee Per Unit (Dwelling Unit or 1,000 sq ft)
(Size: (Size: (Size:Year 2,000 sq ft) 100,000 sq ft) 100,000 sq ft)
2007 Adopted/ Single FamilyLocation Population Updated Residential Retail Office
Similar-Sized Florida CitiesDestin 12,225 2007 1,976$ 2,430$ 1,948$ Maitland 16,100 2007 1,315$ 2,267$ 1,378$ Cocoa 17,164 2007 4,353$ 5,270$ 5,058$ Crestview 21,149 proposed 1,762$ 2,361$ 1,787$ Edgewater 21,770 2007 1,426$ 1,722$ 1,658$ Sebastian 22,426 2007 5,202$ 6,860$ 5,326$ Naples 23,101 2007 8,884$ 13,198$ 13,122$ Rockledge 25,911 2007 4,353$ 5,270$ 5,058$ Deland 26,905 2007 2,174$ 3,080$ 2,310$ Winter Garden 30,065 2006 6,057$ 11,191$ 8,414$
Other Area Counties/CitiesSanta Rosa County 142,144 2006 2,090$ 3,611$ 2,209$ Bay County 167,631 2006 2,424$ 6,160$ 3,390$ Wakulla County 29,417 1997 522$ 334$ 162$ Panama City [1] 37,640 2007 8,025$ 12,256$ 16,401$
Notes:Fees data as of June 2008Some local goverments in this list may have temporarily suspended impact fees as an economic stimulus [1] Panama City fee is calculated but not currently in effect Conclusion This Technical Memorandum has documented the data, assumptions, and calculations used in developing the proposed City of Crestview traffic impact fee. The impact fee analysis determined the travel that individual new developments are expected to place on the Crestview roadway system, the quantity of roadway that each development type would consume, and then related that consumption to the cost of planned roadways in Crestview, after accounting for credits applicable to new development for other payments made that would provide additional roadway capacity. If adopted as proposed, the impact fees presented herein would fall within the lower end of the range now charged for development in similar-sized cities in Florida.
TECHNICAL MEMORANDUM ON THE
METHODS OF CALCULATING
TRAFFIC IMPACT FEES
APRIL 2016
PREPARED FOR:
CITY OF CRESTVIEW
Traffic Impact Fee Technical Memorandum 2016 Update
City of Crestview 1
Technical Memorandum on the
Methods of Calculating Traffic Impact Fees
Prepared for City of Crestview
The purpose of this memorandum is to document the methodology, proposed impact fee rates,
and nexus for traffic impact fees for the City of Crestview, Florida.
Legal Framework
While the purpose of this document is to present the technical documentation of the methods
used to calculate traffic impact fees for the City of Crestview, a brief overview of the legal
framework will provide some background for elements of this technical memorandum.
Rational Nexus Standard
In Florida and elsewhere, courts have developed guidelines for constitutionally valid impact fees,
based on a dual “rational nexus” standard. The first part of this nexus is that the need for new
facilities must be created by new development, and the second part of the nexus is that the
expenditure of the collected impact fees must benefit the fee-paying development.
Meeting the first test of the dual rational nexus standard requires that it be demonstrated that
new development creates the need for additional roadway capacity. The City of Crestview has
adopted level of service standards for City and State roadways consistent with state law,
including a LOS standard of LOS D for all collector roads, LOS C for Interstate 10, and LOS D for
State Road 85. The LOS standard for the Strategic Intermodal System (SIS) portion of State Road
85 differs from the applicable statewide standard of LOS C because the City sought and obtained
a LOS Standard Variance for the roadway. The variance agreement requires, among other
actions, that the City undertake a traffic impact fee study. The City’s Comprehensive Plan
identifies projected level of service deficiencies based on future growth and provides a plan to
address those deficiencies. With continued growth in the Crestview area, it is clear that new
roadway capacity is needed in order to maintain acceptable levels of service within the City. The
need for additional transportation system capacity is created by growth in vehicular travel. The
traffic impact fee is based on the travel demand and resulting consumption of capacity generated
by new development. Through the planning actions of the City, the test to establish need for
improvements is met.
Traffic Impact Fee Technical Memorandum 2016 Update
City of Crestview 2
The second test of the dual rational nexus standard is to show that new development subject to
the impact fee will benefit from the expenditure of the impact fee funds. One way that this test
is demonstrated is that the traffic impact fee revenues may only be spent only on capacity-
producing improvements. Impact fee funds may not be spent on periodic or routine
maintenance.
Florida Impact Fee Act
On June 14, 2006, the “Florida Impact Fee Act” became effective, which creates a new Section
163.31801, Florida Statutes. The Statute reads:
163.31801 Impact fees; short title; intent; definitions; ordinances levying impact fees.—
(1) This section may be cited as the “Florida Impact Fee Act.”
(2) The Legislature finds that impact fees are an important source of revenue for
a local government to use in funding the infrastructure necessitated by new
growth. The Legislature further finds that impact fees are an outgrowth of the
home rule power of a local government to provide certain services within its
jurisdiction. Due to the growth of impact fee collections and local
governments' reliance on impact fees, it is the intent of the Legislature to
ensure that, when a county or municipality adopts an impact fee by ordinance
or a special district adopts an impact fee by resolution, the governing authority
complies with this section.
(3) An impact fee adopted by ordinance of a county or municipality or by
resolution of a special district must, at minimum:
(a) Require that the calculation of the impact fee be based on the most
recent and localized data.
(b) Provide for accounting and reporting of impact fee collections and
expenditures. If a local governmental entity imposes an impact fee to
address its infrastructure needs, the entity shall account for the revenues
and expenditures of such impact fee in a separate accounting fund.
(c) Limit administrative charges for the collection of impact fees to
actual costs.
(d) Require that notice be provided no less than 90 days before the
effective date of an ordinance or resolution imposing a new or amended
impact fee.
Traffic Impact Fee Technical Memorandum 2016 Update
City of Crestview 3
(4) Audits of financial statements of local governmental entities and district school
boards which are performed by a certified public accountant pursuant to s. 218.39
and submitted to the Auditor General must include an affidavit signed by the chief
financial officer of the local governmental entity or district school board stating that
the local governmental entity or district school board has complied with this section.
(5) In any action challenging an impact fee, the government has the burden of proving by
a preponderance of the evidence that the imposition or amount of the fee meets the
requirements of state legal precedent or this section. The court may not use a
deferential standard.
The substantive requirement that is relevant to this technical memorandum is found in
subparagraph (a), requiring that the impact fee must “be based on the most recent and localized
data.” This study uses the latest data available, and is based on conditions particular to the City
of Crestview. For example, the travel demand data includes the ITE Trip Generation, 8th Edition,
published in late 2008 during the course of this study, and is incorporated into this analysis. The
roadway costs are those calculated in 2007/2008 for the City’s update of the Capital
Improvements Element. Florida-specific trip length data are used, which are then further refined
by data specific to sub-county areas of Okaloosa County and other professional studies of Florida
travel. Credit data is derived from the latest published Florida transportation revenue reports.
In summary, this report complies with the substantive requirements of the Florida Impact Fee
Act.
Impact Fee Formula
The first step in this process is to determine the travel that individual new developments are
expected to place on the Crestview roadway system. The second step is to determine the
quantity of roadway that each development type would consume, and then relate that
consumption to the cost of planned roadways in Crestview. The third major step is to determine
the credit applicable to new development by calculating what new development will pay in motor
fuel taxes for additional roadway capacity. The general formula for this process is:
Traffic Impact Fee = VMT x (Cost Per VMC – Credits)
Where:
VMT = Vehicle Miles Traveled, determined by
(Vehicular Trip Ends Per Day / 2) x Average Trip Length x % New Trips;
Traffic Impact Fee Technical Memorandum 2016 Update
City of Crestview 4
Cost Per VMC (Vehicle Mile of Capacity) = (New Roads Provided x Cost of Improvements)
/ Added Road Capacity; and
Credits = (Attributable Travel x Days Per Year) / Miles Per Gallon x Motor Fuels Tax x
Present Value Factor
Travel Demand
The first step in determining the impact of development projects is to estimate the travel demand
for such projects or land uses. The projected travel by land use is determined by three chief
factors: trip generation, percent new trips, and trip length.
Trip Generation
The trip generation rates used in this study are primarily from data published by the Institute of
Traffic Engineers (ITE) in Trip Generation, 9th Edition, published in 2012. The ITE data represent
a nationwide total of over 3,000 individual trip generation studies conducted over many years.
This dataset represents the most comprehensive, industry-standard available data for most types
of land uses. Each land use with ITE data is also represented by a land use code, and that code is
included on pertinent data tables in this memorandum for consistency. Where ITE data is not
available or not applicable, other available data is used from published trip generation studies.
Of particular note is that the ITE Trip Generation 9th Edition did adjust its dataset to represent
more relevant data for some land uses. One example is a Drive-In Bank (ITE land use code 912).
It was determined that banks today operate very differently than they did in previous decades,
and that the older data overestimated travel for modern banking practices. Therefore, data prior
to the year 2000 was excluded from the dataset, and the estimated trip generation rate for such
banks therefore was lowered significantly.
This study uses daily trip rates, as is the common practice for such studies. Daily trip rates are
used instead of other measures such as peak hourly trip rates to reflect the general nature of
trips among all land uses, and to not overestimate traffic from any individual land use. For
example, if PM peak hour trip generation were used, land uses such as offices and gas stations
would probably have overstated traffic, while land uses such as schools or sit-down restaurants
(which have relatively little afternoon “rush hour” traffic) would probably have understated
traffic.
Trip generation results in the number of trip ends, or driveway crossings, at a given development
site. For example, a single one-way trip from work to home represents two trip ends, one trip
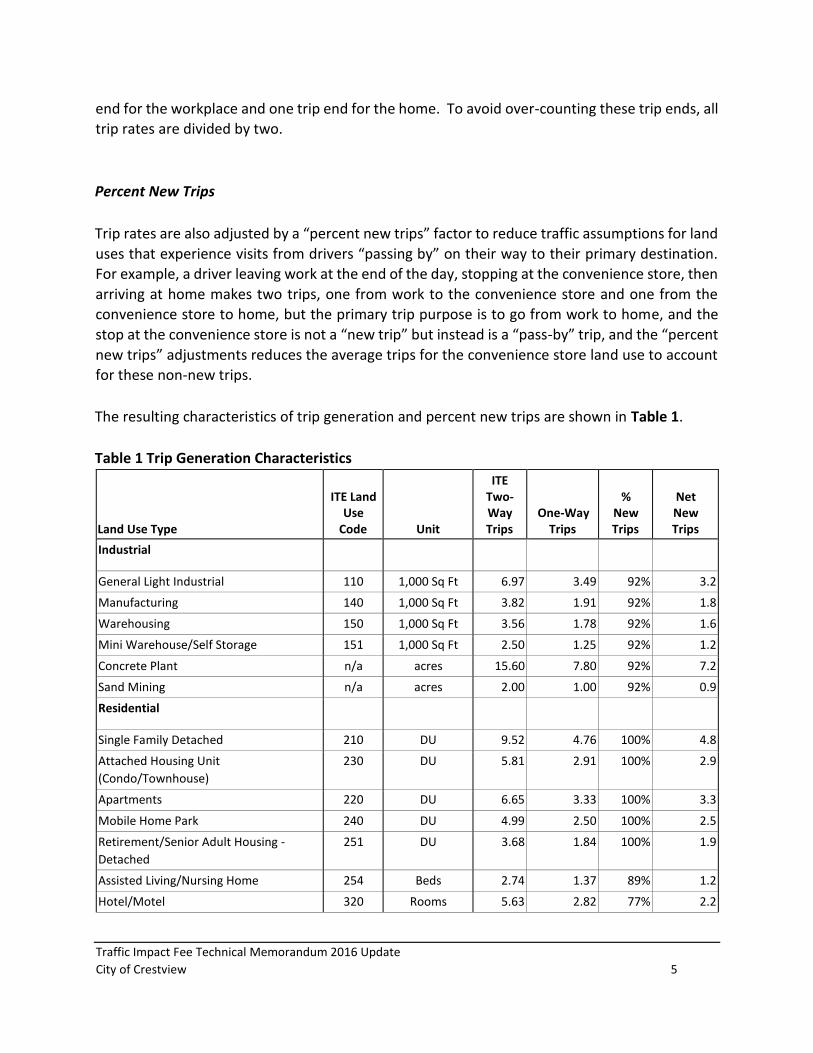
Traffic Impact Fee Technical Memorandum 2016 Update
City of Crestview 5
end for the workplace and one trip end for the home. To avoid over-counting these trip ends, all
trip rates are divided by two.
Percent New Trips
Trip rates are also adjusted by a “percent new trips” factor to reduce traffic assumptions for land
uses that experience visits from drivers “passing by” on their way to their primary destination.
For example, a driver leaving work at the end of the day, stopping at the convenience store, then
arriving at home makes two trips, one from work to the convenience store and one from the
convenience store to home, but the primary trip purpose is to go from work to home, and the
stop at the convenience store is not a “new trip” but instead is a “pass-by” trip, and the “percent
new trips” adjustments reduces the average trips for the convenience store land use to account
for these non-new trips.
The resulting characteristics of trip generation and percent new trips are shown in Table 1.
Table 1 Trip Generation Characteristics
Land Use Type
ITE Land Use
Code Unit
ITE Two-Way Trips
One-Way Trips
% New Trips
Net New Trips
Industrial
General Light Industrial 110 1,000 Sq Ft 6.97 3.49 92% 3.2
Manufacturing 140 1,000 Sq Ft 3.82 1.91 92% 1.8
Warehousing 150 1,000 Sq Ft 3.56 1.78 92% 1.6
Mini Warehouse/Self Storage 151 1,000 Sq Ft 2.50 1.25 92% 1.2
Concrete Plant n/a acres 15.60 7.80 92% 7.2
Sand Mining n/a acres 2.00 1.00 92% 0.9
Residential
Single Family Detached 210 DU 9.52 4.76 100% 4.8
Attached Housing Unit
(Condo/Townhouse)
230 DU 5.81 2.91 100% 2.9
Apartments 220 DU 6.65 3.33 100% 3.3
Mobile Home Park 240 DU 4.99 2.50 100% 2.5
Retirement/Senior Adult Housing -
Detached
251 DU 3.68 1.84 100% 1.9
Assisted Living/Nursing Home 254 Beds 2.74 1.37 89% 1.2
Hotel/Motel 320 Rooms 5.63 2.82 77% 2.2
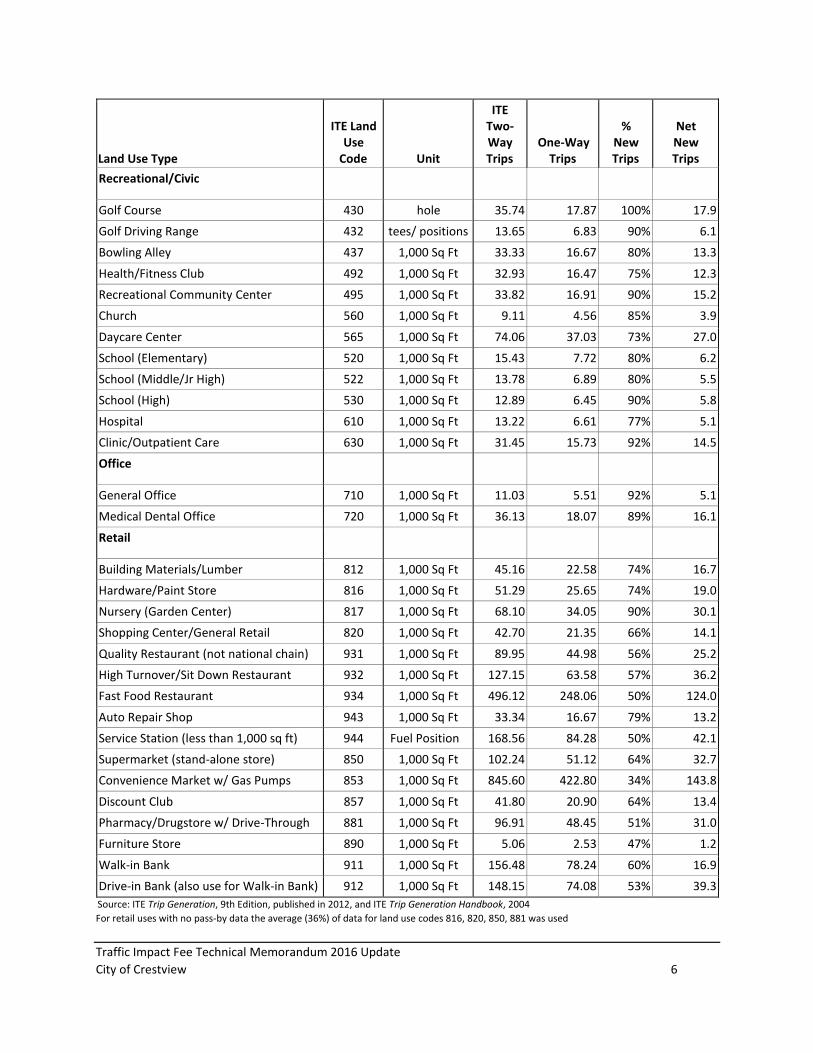
Traffic Impact Fee Technical Memorandum 2016 Update
City of Crestview 6
Land Use Type
ITE Land Use
Code Unit
ITE Two-Way Trips
One-Way Trips
% New Trips
Net New Trips
Recreational/Civic
Golf Course 430 hole 35.74 17.87 100% 17.9
Golf Driving Range 432 tees/ positions 13.65 6.83 90% 6.1
Bowling Alley 437 1,000 Sq Ft 33.33 16.67 80% 13.3
Health/Fitness Club 492 1,000 Sq Ft 32.93 16.47 75% 12.3
Recreational Community Center 495 1,000 Sq Ft 33.82 16.91 90% 15.2
Church 560 1,000 Sq Ft 9.11 4.56 85% 3.9
Daycare Center 565 1,000 Sq Ft 74.06 37.03 73% 27.0
School (Elementary) 520 1,000 Sq Ft 15.43 7.72 80% 6.2
School (Middle/Jr High) 522 1,000 Sq Ft 13.78 6.89 80% 5.5
School (High) 530 1,000 Sq Ft 12.89 6.45 90% 5.8
Hospital 610 1,000 Sq Ft 13.22 6.61 77% 5.1
Clinic/Outpatient Care 630 1,000 Sq Ft 31.45 15.73 92% 14.5
Office
General Office 710 1,000 Sq Ft 11.03 5.51 92% 5.1
Medical Dental Office 720 1,000 Sq Ft 36.13 18.07 89% 16.1
Retail
Building Materials/Lumber 812 1,000 Sq Ft 45.16 22.58 74% 16.7
Hardware/Paint Store 816 1,000 Sq Ft 51.29 25.65 74% 19.0
Nursery (Garden Center) 817 1,000 Sq Ft 68.10 34.05 90% 30.1
Shopping Center/General Retail 820 1,000 Sq Ft 42.70 21.35 66% 14.1
Quality Restaurant (not national chain) 931 1,000 Sq Ft 89.95 44.98 56% 25.2
High Turnover/Sit Down Restaurant 932 1,000 Sq Ft 127.15 63.58 57% 36.2
Fast Food Restaurant 934 1,000 Sq Ft 496.12 248.06 50% 124.0
Auto Repair Shop 943 1,000 Sq Ft 33.34 16.67 79% 13.2
Service Station (less than 1,000 sq ft) 944 Fuel Position 168.56 84.28 50% 42.1
Supermarket (stand-alone store) 850 1,000 Sq Ft 102.24 51.12 64% 32.7
Convenience Market w/ Gas Pumps 853 1,000 Sq Ft 845.60 422.80 34% 143.8
Discount Club 857 1,000 Sq Ft 41.80 20.90 64% 13.4
Pharmacy/Drugstore w/ Drive-Through 881 1,000 Sq Ft 96.91 48.45 51% 31.0
Furniture Store 890 1,000 Sq Ft 5.06 2.53 47% 1.2
Walk-in Bank 911 1,000 Sq Ft 156.48 78.24 60% 16.9
Drive-in Bank (also use for Walk-in Bank) 912 1,000 Sq Ft 148.15 74.08 53% 39.3
Source: ITE Trip Generation, 9th Edition, published in 2012, and ITE Trip Generation Handbook, 2004 For retail uses with no pass-by data the average (36%) of data for land use codes 816, 820, 850, 881 was used
Traffic Impact Fee Technical Memorandum 2016 Update
City of Crestview 7
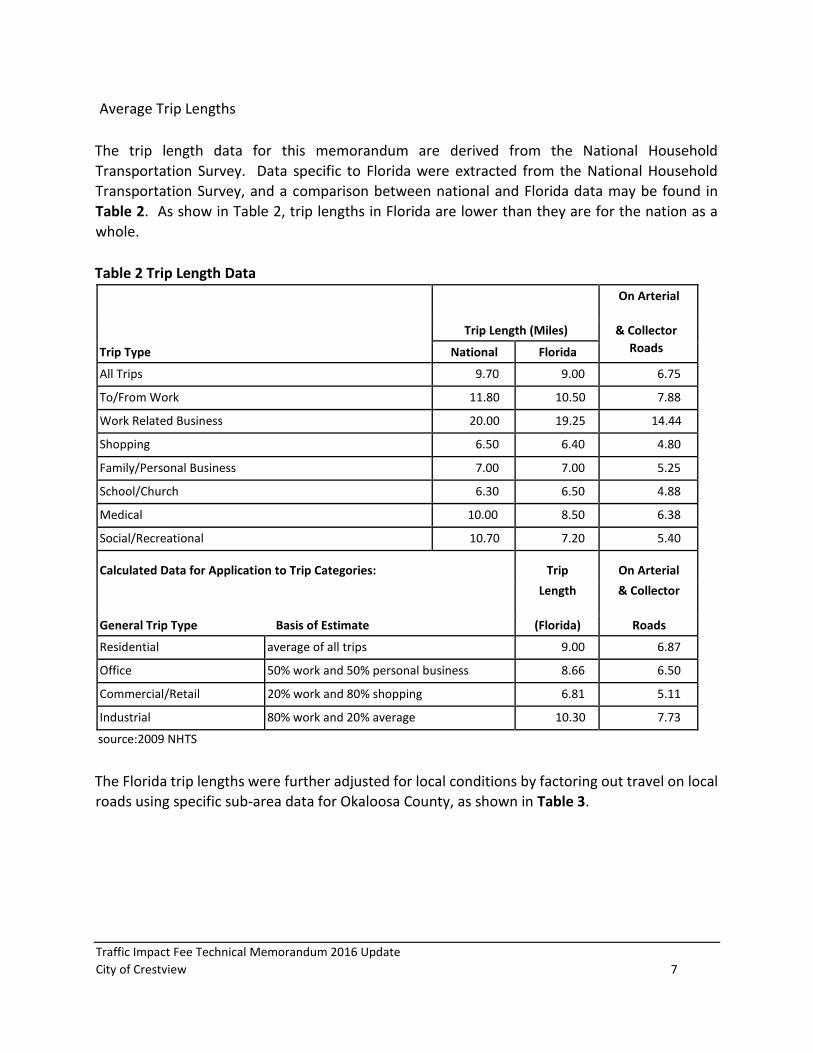
Average Trip Lengths
The trip length data for this memorandum are derived from the National Household
Transportation Survey. Data specific to Florida were extracted from the National Household
Transportation Survey, and a comparison between national and Florida data may be found in
Table 2. As show in Table 2, trip lengths in Florida are lower than they are for the nation as a
whole.
Table 2 Trip Length Data
On Arterial
Trip Type
Trip Length (Miles) & Collector
Roads National Florida
All Trips 9.70 9.00 6.75
To/From Work 11.80 10.50 7.88
Work Related Business 20.00 19.25 14.44
Shopping 6.50 6.40 4.80
Family/Personal Business 7.00 7.00 5.25
School/Church 6.30 6.50 4.88
Medical 10.00 8.50 6.38
Social/Recreational 10.70 7.20 5.40
Calculated Data for Application to Trip Categories: Trip On Arterial
Length & Collector
General Trip Type Basis of Estimate (Florida) Roads
Residential average of all trips 9.00 6.87
Office 50% work and 50% personal business 8.66 6.50
Commercial/Retail 20% work and 80% shopping 6.81 5.11
Industrial 80% work and 20% average 10.30 7.73
source:2009 NHTS
The Florida trip lengths were further adjusted for local conditions by factoring out travel on local
roads using specific sub-area data for Okaloosa County, as shown in Table 3.
Traffic Impact Fee Technical Memorandum 2016 Update
City of Crestview 8
Table 3 Travel by Roadway Type
Okaloosa County Annual Vehicle Miles Traveled (VMT)
Small Urban Small Urbanized Average
Roadway Type VMT % of Total VMT % of Total VMT % of Total
Interstate 149,325 19% 0% 74,662 3%
Principal Arterials 301,219 38% 1,720,766 47% 1,010,993 46%
Minor Arterials 76,793 10% 652,305 19% 364,549 17%
Urban/Major Collectors 89,332 11% 302,157 8% 195,744 9%
Locals 183,959 22% 942,343 26% 563,151 25%
Total 800,628 3,617,571 2,209,100
source: FDOT Public Road Mileage Report, 2014 http://www.dot.state.fl.us/planning/statistics/mileage-rpts/Public14.pdf
The adjustments in Table 3 were made using the Florida Department of Transportation Public
Road Mileage Report (2014), which provides data concerning vehicle miles traveled by roadway
type for rural, small urban, and urbanized areas in Okaloosa County.
After combining data on trip generation and trip length, the travel demand, or vehicle miles
traveled (VMT) can be calculated for each land use. A secondary adjustment to trip length data
is an adjustment to account for short trip lengths inherent in some retail uses. These adjustments
represent the fact that average trip length data are likely overstated for some land uses, such as
fast food, banks, auto repair, and general retail (among others) based on their typical trips being
neighborhood, local, or community trips. Table 4 presents the combination of these data.
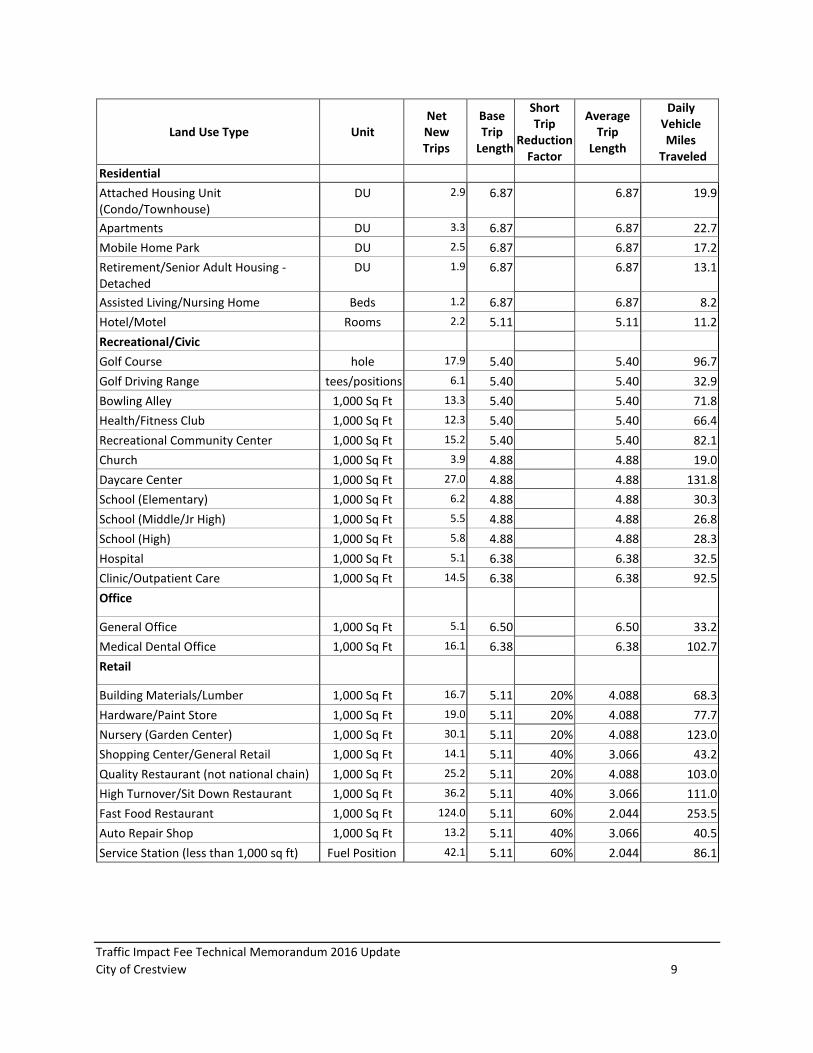
Table 4 Travel Demand By Land Use
Land Use Type Unit Net New Trips
Base Trip
Length
Short Trip
Reduction Factor
Average Trip
Length
Daily Vehicle Miles
Traveled
Industrial
General Light Industrial 1,000 Sq Ft 3.2 7.73 7.73 24.7
Manufacturing 1,000 Sq Ft 1.8 7.73 7.73 13.9
Warehousing 1,000 Sq Ft 1.6 7.73 7.73 12.4
Mini Warehouse/Self Storage 1,000 Sq Ft 1.2 7.73 7.73 9.3
Concrete Plant acres 7.2 7.73 7.73 55.7
Sand Mining acres 0.9 7.73 7.73 7.0
Residential
Single Family Detached DU 4.8 6.87 6.87 33.0
Traffic Impact Fee Technical Memorandum 2016 Update
City of Crestview 9
Land Use Type Unit Net New Trips
Base Trip
Length
Short Trip
Reduction Factor
Average Trip
Length
Daily Vehicle Miles
Traveled
Residential
Attached Housing Unit (Condo/Townhouse)
DU 2.9 6.87 6.87 19.9
Apartments DU 3.3 6.87 6.87 22.7
Mobile Home Park DU 2.5 6.87 6.87 17.2
Retirement/Senior Adult Housing - Detached
DU 1.9 6.87 6.87 13.1
Assisted Living/Nursing Home Beds 1.2 6.87 6.87 8.2
Hotel/Motel Rooms 2.2 5.11 5.11 11.2
Recreational/Civic
Golf Course hole 17.9 5.40 5.40 96.7
Golf Driving Range tees/positions 6.1 5.40 5.40 32.9
Bowling Alley 1,000 Sq Ft 13.3 5.40 5.40 71.8
Health/Fitness Club 1,000 Sq Ft 12.3 5.40 5.40 66.4
Recreational Community Center 1,000 Sq Ft 15.2 5.40 5.40 82.1
Church 1,000 Sq Ft 3.9 4.88 4.88 19.0
Daycare Center 1,000 Sq Ft 27.0 4.88 4.88 131.8
School (Elementary) 1,000 Sq Ft 6.2 4.88 4.88 30.3
School (Middle/Jr High) 1,000 Sq Ft 5.5 4.88 4.88 26.8
School (High) 1,000 Sq Ft 5.8 4.88 4.88 28.3
Hospital 1,000 Sq Ft 5.1 6.38 6.38 32.5
Clinic/Outpatient Care 1,000 Sq Ft 14.5 6.38 6.38 92.5
Office
General Office 1,000 Sq Ft 5.1 6.50 6.50 33.2
Medical Dental Office 1,000 Sq Ft 16.1 6.38 6.38 102.7
Retail
Building Materials/Lumber 1,000 Sq Ft 16.7 5.11 20% 4.088 68.3
Hardware/Paint Store 1,000 Sq Ft 19.0 5.11 20% 4.088 77.7
Nursery (Garden Center) 1,000 Sq Ft 30.1 5.11 20% 4.088 123.0
Shopping Center/General Retail 1,000 Sq Ft 14.1 5.11 40% 3.066 43.2
Quality Restaurant (not national chain) 1,000 Sq Ft 25.2 5.11 20% 4.088 103.0
High Turnover/Sit Down Restaurant 1,000 Sq Ft 36.2 5.11 40% 3.066 111.0
Fast Food Restaurant 1,000 Sq Ft 124.0 5.11 60% 2.044 253.5
Auto Repair Shop 1,000 Sq Ft 13.2 5.11 40% 3.066 40.5
Service Station (less than 1,000 sq ft) Fuel Position 42.1 5.11 60% 2.044 86.1
Traffic Impact Fee Technical Memorandum 2016 Update
City of Crestview 10
Land Use Type Unit Net New Trips
Base Trip
Length
Short Trip
Reduction Factor
Average Trip
Length
Daily Vehicle Miles
Traveled
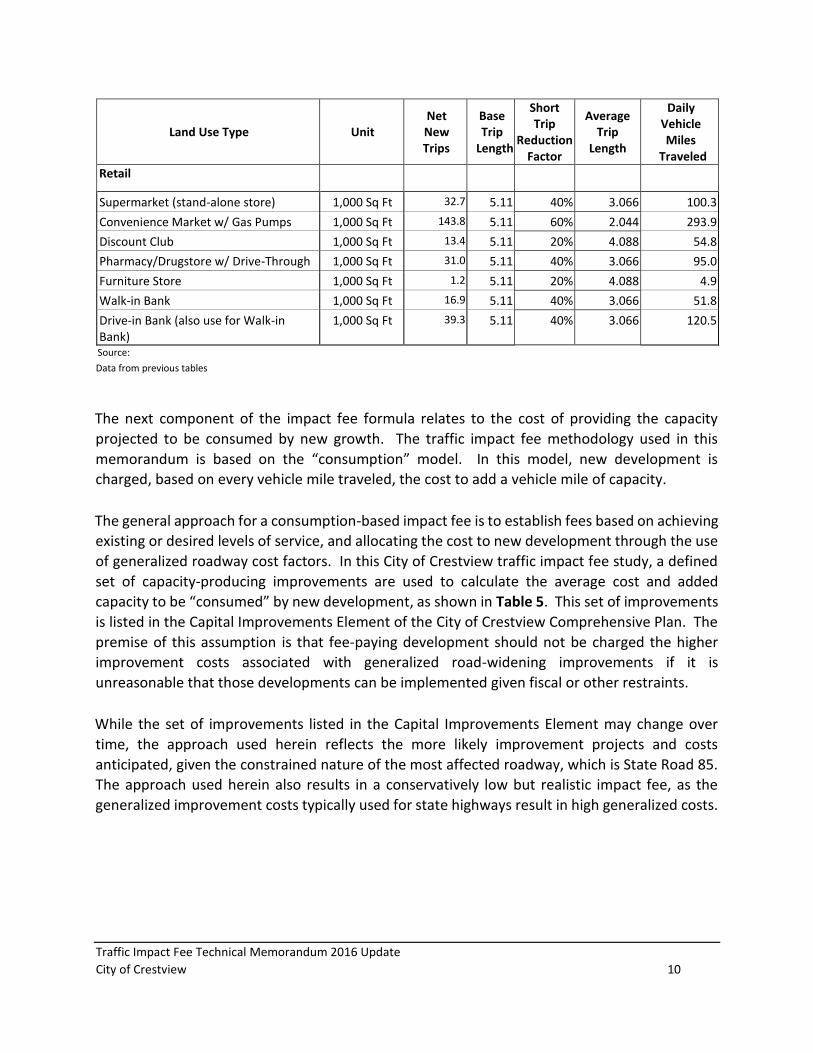
Retail
Supermarket (stand-alone store) 1,000 Sq Ft 32.7 5.11 40% 3.066 100.3
Convenience Market w/ Gas Pumps 1,000 Sq Ft 143.8 5.11 60% 2.044 293.9
Discount Club 1,000 Sq Ft 13.4 5.11 20% 4.088 54.8
Pharmacy/Drugstore w/ Drive-Through 1,000 Sq Ft 31.0 5.11 40% 3.066 95.0
Furniture Store 1,000 Sq Ft 1.2 5.11 20% 4.088 4.9
Walk-in Bank 1,000 Sq Ft 16.9 5.11 40% 3.066 51.8
Drive-in Bank (also use for Walk-in Bank)
1,000 Sq Ft 39.3 5.11 40% 3.066 120.5
Source: Data from previous tables
The next component of the impact fee formula relates to the cost of providing the capacity
projected to be consumed by new growth. The traffic impact fee methodology used in this
memorandum is based on the “consumption” model. In this model, new development is
charged, based on every vehicle mile traveled, the cost to add a vehicle mile of capacity.
The general approach for a consumption-based impact fee is to establish fees based on achieving
existing or desired levels of service, and allocating the cost to new development through the use
of generalized roadway cost factors. In this City of Crestview traffic impact fee study, a defined
set of capacity-producing improvements are used to calculate the average cost and added
capacity to be “consumed” by new development, as shown in Table 5. This set of improvements
is listed in the Capital Improvements Element of the City of Crestview Comprehensive Plan. The
premise of this assumption is that fee-paying development should not be charged the higher
improvement costs associated with generalized road-widening improvements if it is
unreasonable that those developments can be implemented given fiscal or other restraints.
While the set of improvements listed in the Capital Improvements Element may change over
time, the approach used herein reflects the more likely improvement projects and costs
anticipated, given the constrained nature of the most affected roadway, which is State Road 85.
The approach used herein also results in a conservatively low but realistic impact fee, as the
generalized improvement costs typically used for state highways result in high generalized costs.
Traffic Impact Fee Technical Memorandum 2016 Update
City of Crestview 11
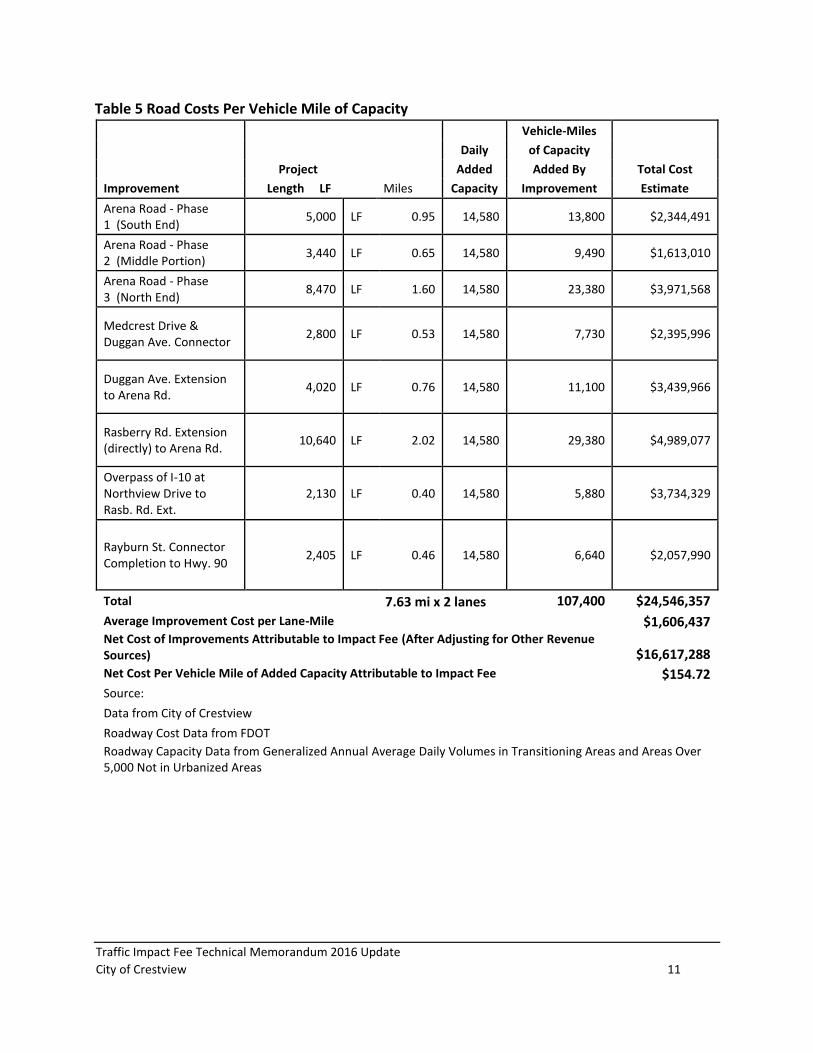
Table 5 Road Costs Per Vehicle Mile of Capacity
Vehicle-Miles
Daily of Capacity
Project Added Added By Total Cost
Improvement Length LF Miles Capacity Improvement Estimate
Arena Road - Phase 1 (South End)
5,000 LF 0.95 14,580 13,800 $2,344,491
Arena Road - Phase 2 (Middle Portion)
3,440 LF 0.65 14,580 9,490 $1,613,010
Arena Road - Phase 3 (North End)
8,470 LF 1.60 14,580 23,380 $3,971,568
Medcrest Drive & Duggan Ave. Connector
2,800 LF 0.53 14,580 7,730 $2,395,996
Duggan Ave. Extension to Arena Rd.
4,020 LF 0.76 14,580 11,100 $3,439,966
Rasberry Rd. Extension (directly) to Arena Rd.
10,640 LF 2.02 14,580 29,380 $4,989,077
Overpass of I-10 at Northview Drive to Rasb. Rd. Ext.
2,130 LF 0.40 14,580 5,880 $3,734,329
Rayburn St. Connector Completion to Hwy. 90
2,405 LF 0.46 14,580 6,640 $2,057,990
Total 7.63 mi x 2 lanes 107,400 $24,546,357 Average Improvement Cost per Lane-Mile $1,606,437 Net Cost of Improvements Attributable to Impact Fee (After Adjusting for Other Revenue Sources) $16,617,288 Net Cost Per Vehicle Mile of Added Capacity Attributable to Impact Fee $154.72 Source: Data from City of Crestview Roadway Cost Data from FDOT Roadway Capacity Data from Generalized Annual Average Daily Volumes in Transitioning Areas and Areas Over 5,000 Not in Urbanized Areas
Traffic Impact Fee Technical Memorandum 2016 Update
City of Crestview 12
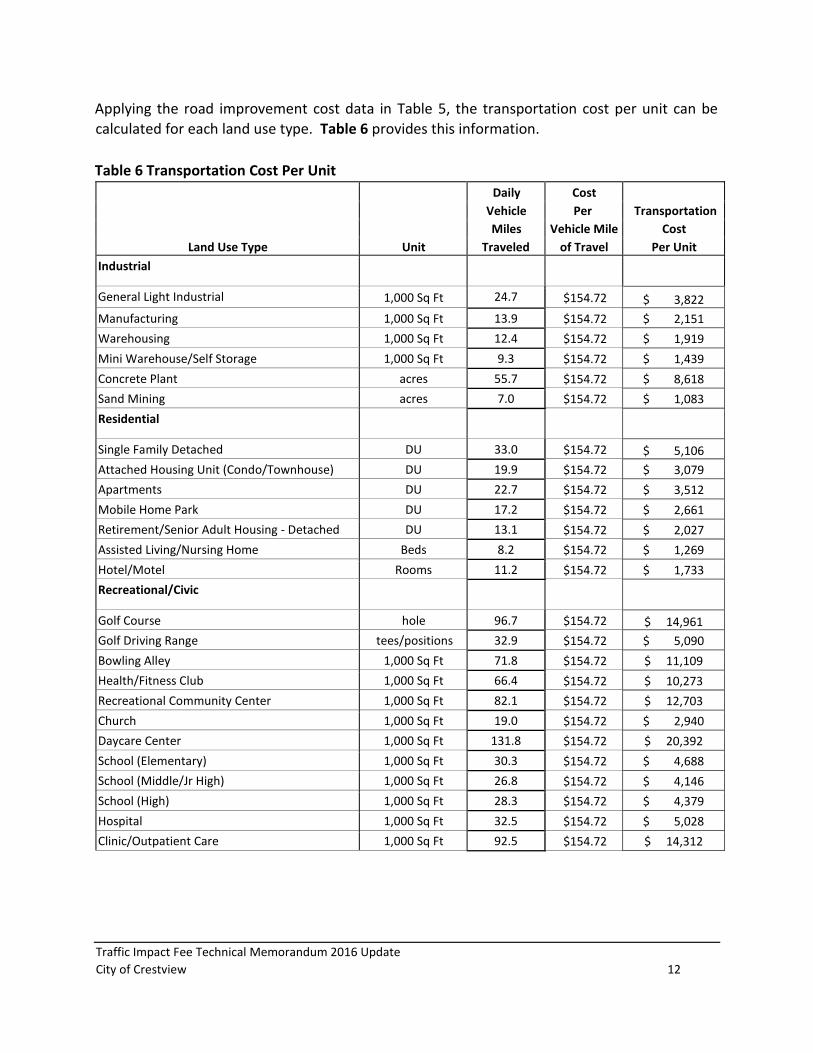
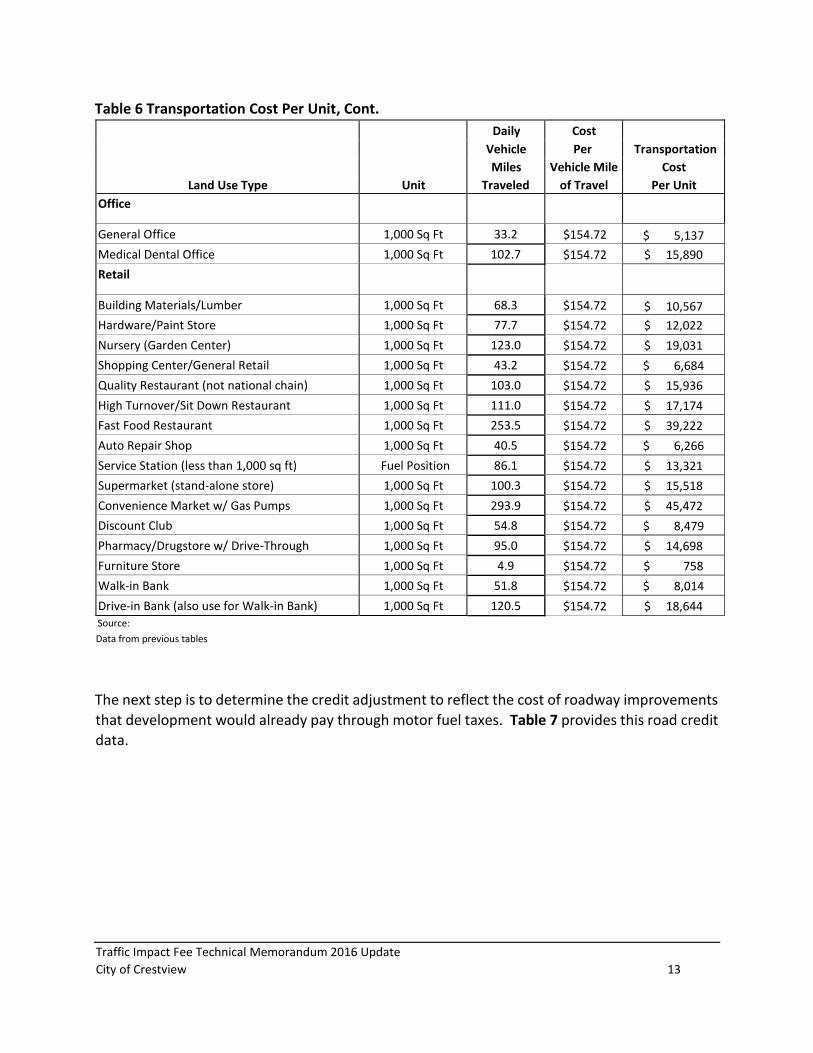
Applying the road improvement cost data in Table 5, the transportation cost per unit can be
calculated for each land use type. Table 6 provides this information.
Table 6 Transportation Cost Per Unit
Daily Cost
Vehicle Per Transportation
Miles Vehicle Mile Cost
Land Use Type Unit Traveled of Travel Per Unit
Industrial
General Light Industrial 1,000 Sq Ft 24.7 $154.72 $ 3,822
Manufacturing 1,000 Sq Ft 13.9 $154.72 $ 2,151
Warehousing 1,000 Sq Ft 12.4 $154.72 $ 1,919
Mini Warehouse/Self Storage 1,000 Sq Ft 9.3 $154.72 $ 1,439
Concrete Plant acres 55.7 $154.72 $ 8,618
Sand Mining acres 7.0 $154.72 $ 1,083
Residential
Single Family Detached DU 33.0 $154.72 $ 5,106
Attached Housing Unit (Condo/Townhouse) DU 19.9 $154.72 $ 3,079
Apartments DU 22.7 $154.72 $ 3,512
Mobile Home Park DU 17.2 $154.72 $ 2,661
Retirement/Senior Adult Housing - Detached DU 13.1 $154.72 $ 2,027
Assisted Living/Nursing Home Beds 8.2 $154.72 $ 1,269
Hotel/Motel Rooms 11.2 $154.72 $ 1,733
Recreational/Civic
Golf Course hole 96.7 $154.72 $ 14,961
Golf Driving Range tees/positions 32.9 $154.72 $ 5,090
Bowling Alley 1,000 Sq Ft 71.8 $154.72 $ 11,109
Health/Fitness Club 1,000 Sq Ft 66.4 $154.72 $ 10,273
Recreational Community Center 1,000 Sq Ft 82.1 $154.72 $ 12,703
Church 1,000 Sq Ft 19.0 $154.72 $ 2,940
Daycare Center 1,000 Sq Ft 131.8 $154.72 $ 20,392
School (Elementary) 1,000 Sq Ft 30.3 $154.72 $ 4,688
School (Middle/Jr High) 1,000 Sq Ft 26.8 $154.72 $ 4,146
School (High) 1,000 Sq Ft 28.3 $154.72 $ 4,379
Hospital 1,000 Sq Ft 32.5 $154.72 $ 5,028
Clinic/Outpatient Care 1,000 Sq Ft 92.5 $154.72 $ 14,312
Traffic Impact Fee Technical Memorandum 2016 Update
City of Crestview 13
Table 6 Transportation Cost Per Unit, Cont.
Daily Cost
Vehicle Per Transportation
Miles Vehicle Mile Cost
Land Use Type Unit Traveled of Travel Per Unit
Office
General Office 1,000 Sq Ft 33.2 $154.72 $ 5,137
Medical Dental Office 1,000 Sq Ft 102.7 $154.72 $ 15,890
Retail
Building Materials/Lumber 1,000 Sq Ft 68.3 $154.72 $ 10,567
Hardware/Paint Store 1,000 Sq Ft 77.7 $154.72 $ 12,022
Nursery (Garden Center) 1,000 Sq Ft 123.0 $154.72 $ 19,031
Shopping Center/General Retail 1,000 Sq Ft 43.2 $154.72 $ 6,684
Quality Restaurant (not national chain) 1,000 Sq Ft 103.0 $154.72 $ 15,936
High Turnover/Sit Down Restaurant 1,000 Sq Ft 111.0 $154.72 $ 17,174
Fast Food Restaurant 1,000 Sq Ft 253.5 $154.72 $ 39,222
Auto Repair Shop 1,000 Sq Ft 40.5 $154.72 $ 6,266
Service Station (less than 1,000 sq ft) Fuel Position 86.1 $154.72 $ 13,321
Supermarket (stand-alone store) 1,000 Sq Ft 100.3 $154.72 $ 15,518
Convenience Market w/ Gas Pumps 1,000 Sq Ft 293.9 $154.72 $ 45,472
Discount Club 1,000 Sq Ft 54.8 $154.72 $ 8,479
Pharmacy/Drugstore w/ Drive-Through 1,000 Sq Ft 95.0 $154.72 $ 14,698
Furniture Store 1,000 Sq Ft 4.9 $154.72 $ 758
Walk-in Bank 1,000 Sq Ft 51.8 $154.72 $ 8,014
Drive-in Bank (also use for Walk-in Bank) 1,000 Sq Ft 120.5 $154.72 $ 18,644 Source: Data from previous tables
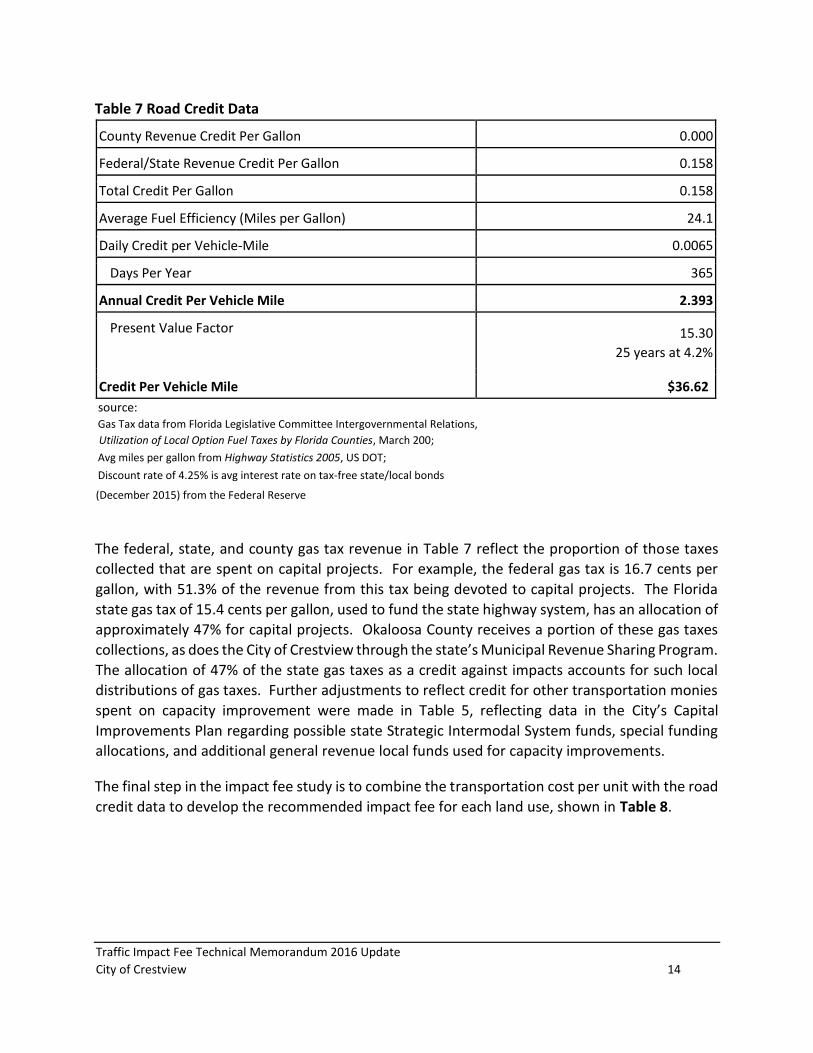
The next step is to determine the credit adjustment to reflect the cost of roadway improvements
that development would already pay through motor fuel taxes. Table 7 provides this road credit
data.
Traffic Impact Fee Technical Memorandum 2016 Update
City of Crestview 14
Table 7 Road Credit Data
County Revenue Credit Per Gallon 0.000
Federal/State Revenue Credit Per Gallon 0.158
Total Credit Per Gallon 0.158
Average Fuel Efficiency (Miles per Gallon) 24.1
Daily Credit per Vehicle-Mile 0.0065
Days Per Year 365
Annual Credit Per Vehicle Mile 2.393
Present Value Factor 15.30
25 years at 4.2%
Credit Per Vehicle Mile $36.62
source: Gas Tax data from Florida Legislative Committee Intergovernmental Relations, Utilization of Local Option Fuel Taxes by Florida Counties, March 200; Avg miles per gallon from Highway Statistics 2005, US DOT; Discount rate of 4.25% is avg interest rate on tax-free state/local bonds (December 2015) from the Federal Reserve
The federal, state, and county gas tax revenue in Table 7 reflect the proportion of those taxes
collected that are spent on capital projects. For example, the federal gas tax is 16.7 cents per
gallon, with 51.3% of the revenue from this tax being devoted to capital projects. The Florida
state gas tax of 15.4 cents per gallon, used to fund the state highway system, has an allocation of
approximately 47% for capital projects. Okaloosa County receives a portion of these gas taxes
collections, as does the City of Crestview through the state’s Municipal Revenue Sharing Program.
The allocation of 47% of the state gas taxes as a credit against impacts accounts for such local
distributions of gas taxes. Further adjustments to reflect credit for other transportation monies
spent on capacity improvement were made in Table 5, reflecting data in the City’s Capital
Improvements Plan regarding possible state Strategic Intermodal System funds, special funding
allocations, and additional general revenue local funds used for capacity improvements.
The final step in the impact fee study is to combine the transportation cost per unit with the road
credit data to develop the recommended impact fee for each land use, shown in Table 8.
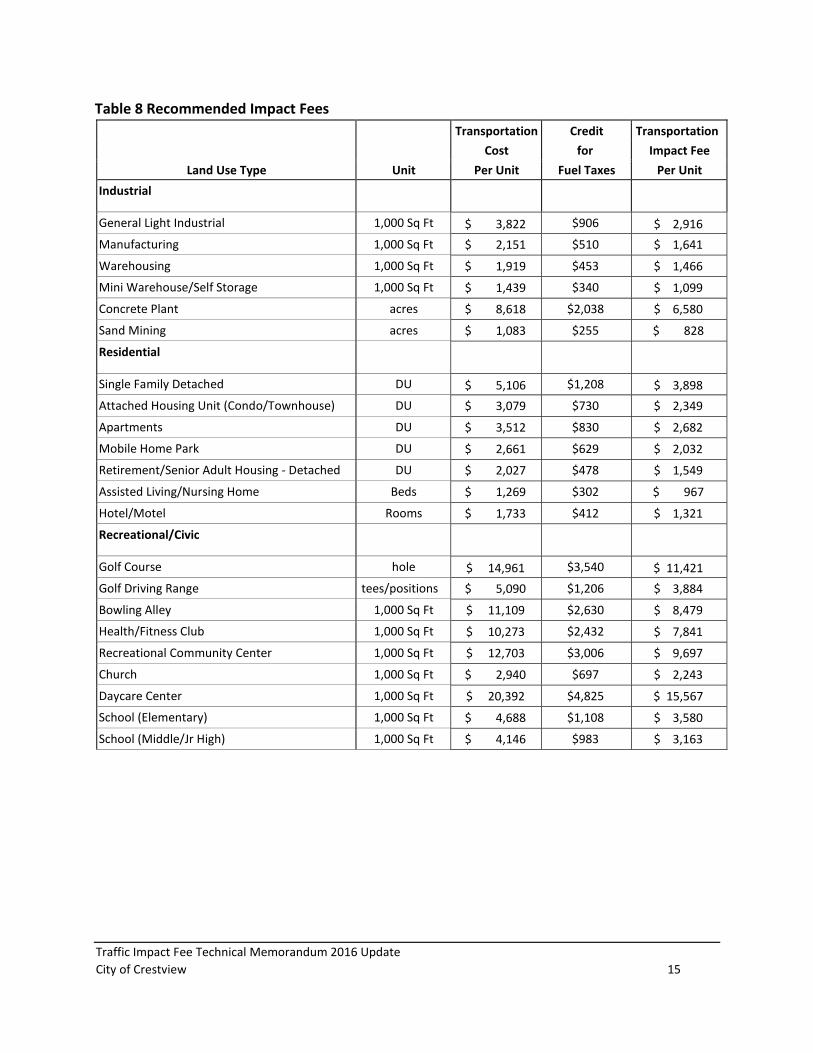
Traffic Impact Fee Technical Memorandum 2016 Update
City of Crestview 15
Table 8 Recommended Impact Fees
Transportation Credit Transportation
Cost for Impact Fee
Land Use Type Unit Per Unit Fuel Taxes Per Unit
Industrial
General Light Industrial 1,000 Sq Ft $ 3,822 $906 $ 2,916
Manufacturing 1,000 Sq Ft $ 2,151 $510 $ 1,641
Warehousing 1,000 Sq Ft $ 1,919 $453 $ 1,466
Mini Warehouse/Self Storage 1,000 Sq Ft $ 1,439 $340 $ 1,099
Concrete Plant acres $ 8,618 $2,038 $ 6,580
Sand Mining acres $ 1,083 $255 $ 828
Residential
Single Family Detached DU $ 5,106 $1,208 $ 3,898
Attached Housing Unit (Condo/Townhouse) DU $ 3,079 $730 $ 2,349
Apartments DU $ 3,512 $830 $ 2,682
Mobile Home Park DU $ 2,661 $629 $ 2,032
Retirement/Senior Adult Housing - Detached DU $ 2,027 $478 $ 1,549
Assisted Living/Nursing Home Beds $ 1,269 $302 $ 967
Hotel/Motel Rooms $ 1,733 $412 $ 1,321
Recreational/Civic
Golf Course hole $ 14,961 $3,540 $ 11,421
Golf Driving Range tees/positions $ 5,090 $1,206 $ 3,884
Bowling Alley 1,000 Sq Ft $ 11,109 $2,630 $ 8,479
Health/Fitness Club 1,000 Sq Ft $ 10,273 $2,432 $ 7,841
Recreational Community Center 1,000 Sq Ft $ 12,703 $3,006 $ 9,697
Church 1,000 Sq Ft $ 2,940 $697 $ 2,243
Daycare Center 1,000 Sq Ft $ 20,392 $4,825 $ 15,567
School (Elementary) 1,000 Sq Ft $ 4,688 $1,108 $ 3,580
School (Middle/Jr High) 1,000 Sq Ft $ 4,146 $983 $ 3,163
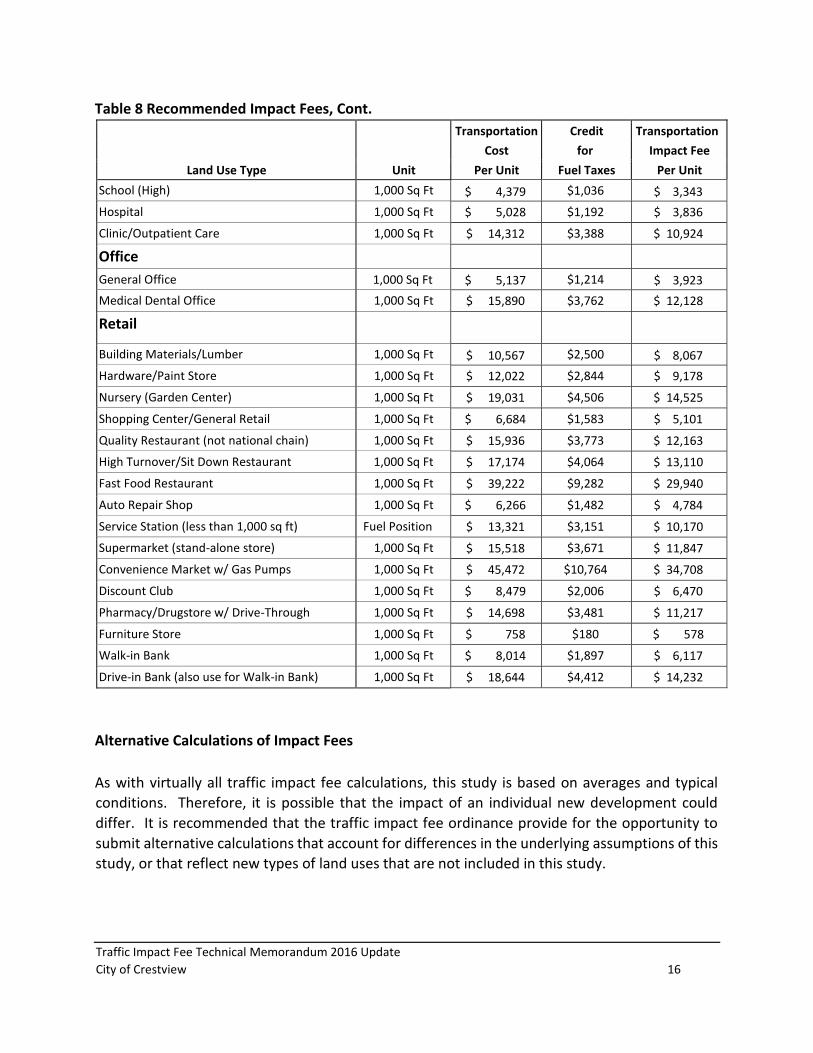
Traffic Impact Fee Technical Memorandum 2016 Update
City of Crestview 16
Table 8 Recommended Impact Fees, Cont.
Transportation Credit Transportation
Cost for Impact Fee
Land Use Type Unit Per Unit Fuel Taxes Per Unit
School (High) 1,000 Sq Ft $ 4,379 $1,036 $ 3,343
Hospital 1,000 Sq Ft $ 5,028 $1,192 $ 3,836
Clinic/Outpatient Care 1,000 Sq Ft $ 14,312 $3,388 $ 10,924
Office
General Office 1,000 Sq Ft $ 5,137 $1,214 $ 3,923
Medical Dental Office 1,000 Sq Ft $ 15,890 $3,762 $ 12,128
Retail
Building Materials/Lumber 1,000 Sq Ft $ 10,567 $2,500 $ 8,067
Hardware/Paint Store 1,000 Sq Ft $ 12,022 $2,844 $ 9,178
Nursery (Garden Center) 1,000 Sq Ft $ 19,031 $4,506 $ 14,525
Shopping Center/General Retail 1,000 Sq Ft $ 6,684 $1,583 $ 5,101
Quality Restaurant (not national chain) 1,000 Sq Ft $ 15,936 $3,773 $ 12,163
High Turnover/Sit Down Restaurant 1,000 Sq Ft $ 17,174 $4,064 $ 13,110
Fast Food Restaurant 1,000 Sq Ft $ 39,222 $9,282 $ 29,940
Auto Repair Shop 1,000 Sq Ft $ 6,266 $1,482 $ 4,784
Service Station (less than 1,000 sq ft) Fuel Position $ 13,321 $3,151 $ 10,170
Supermarket (stand-alone store) 1,000 Sq Ft $ 15,518 $3,671 $ 11,847
Convenience Market w/ Gas Pumps 1,000 Sq Ft $ 45,472 $10,764 $ 34,708
Discount Club 1,000 Sq Ft $ 8,479 $2,006 $ 6,470
Pharmacy/Drugstore w/ Drive-Through 1,000 Sq Ft $ 14,698 $3,481 $ 11,217
Furniture Store 1,000 Sq Ft $ 758 $180 $ 578
Walk-in Bank 1,000 Sq Ft $ 8,014 $1,897 $ 6,117
Drive-in Bank (also use for Walk-in Bank) 1,000 Sq Ft $ 18,644 $4,412 $ 14,232
Alternative Calculations of Impact Fees
As with virtually all traffic impact fee calculations, this study is based on averages and typical
conditions. Therefore, it is possible that the impact of an individual new development could
differ. It is recommended that the traffic impact fee ordinance provide for the opportunity to
submit alternative calculations that account for differences in the underlying assumptions of this
study, or that reflect new types of land uses that are not included in this study.
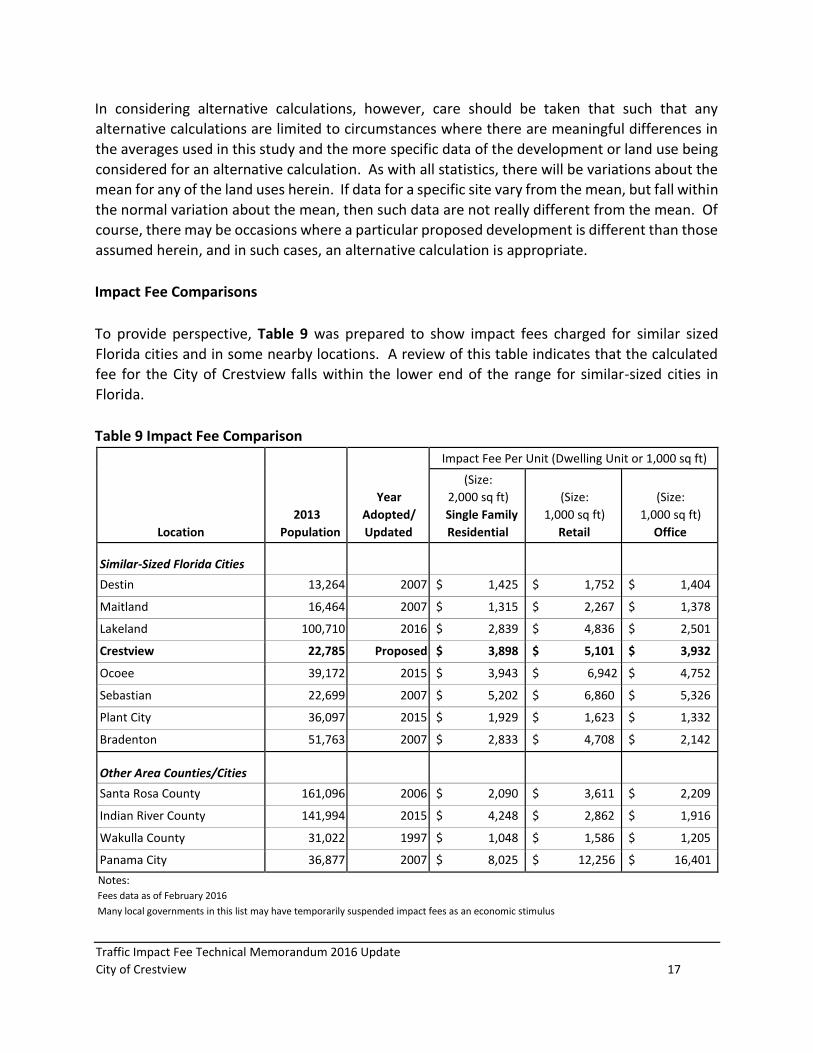
Traffic Impact Fee Technical Memorandum 2016 Update
City of Crestview 17
In considering alternative calculations, however, care should be taken that such that any
alternative calculations are limited to circumstances where there are meaningful differences in
the averages used in this study and the more specific data of the development or land use being
considered for an alternative calculation. As with all statistics, there will be variations about the
mean for any of the land uses herein. If data for a specific site vary from the mean, but fall within
the normal variation about the mean, then such data are not really different from the mean. Of
course, there may be occasions where a particular proposed development is different than those
assumed herein, and in such cases, an alternative calculation is appropriate.
Impact Fee Comparisons
To provide perspective, Table 9 was prepared to show impact fees charged for similar sized
Florida cities and in some nearby locations. A review of this table indicates that the calculated
fee for the City of Crestview falls within the lower end of the range for similar-sized cities in
Florida.
Table 9 Impact Fee Comparison
Location
2013
Population
Year
Adopted/
Updated
Impact Fee Per Unit (Dwelling Unit or 1,000 sq ft)
(Size:
2,000 sq ft)
Single Family
Residential
(Size:
1,000 sq ft)
Retail
(Size:
1,000 sq ft)
Office
Similar-Sized Florida Cities
Destin 13,264 2007 $ 1,425 $ 1,752 $ 1,404
Maitland 16,464 2007 $ 1,315 $ 2,267 $ 1,378
Lakeland 100,710 2016 $ 2,839 $ 4,836 $ 2,501
Crestview 22,785 Proposed $ 3,898 $ 5,101 $ 3,932
Ocoee 39,172 2015 $ 3,943 $ 6,942 $ 4,752
Sebastian 22,699 2007 $ 5,202 $ 6,860 $ 5,326
Plant City 36,097 2015 $ 1,929 $ 1,623 $ 1,332
Bradenton 51,763 2007 $ 2,833 $ 4,708 $ 2,142
Other Area Counties/Cities
Santa Rosa County 161,096 2006 $ 2,090 $ 3,611 $ 2,209
Indian River County 141,994 2015 $ 4,248 $ 2,862 $ 1,916
Wakulla County 31,022 1997 $ 1,048 $ 1,586 $ 1,205
Panama City 36,877 2007 $ 8,025 $ 12,256 $ 16,401
Notes: Fees data as of February 2016 Many local governments in this list may have temporarily suspended impact fees as an economic stimulus
Traffic Impact Fee Technical Memorandum 2016 Update
City of Crestview 18
Conclusion
This Technical Memorandum has documented the data, assumptions, and calculations used in
developing the proposed City of Crestview traffic impact fee. The impact fee analysis determined
the travel that individual new developments are expected to place on the Crestview roadway
system, the quantity of roadway that each development type would consume, and then related
that consumption to the cost of planned roadways in Crestview, after accounting for credits
applicable to new development for other payments made that would provide additional roadway
capacity. If adopted as proposed, the impact fees presented herein would fall within the lower
end of the range now charged for development in similar-sized cities in Florida.
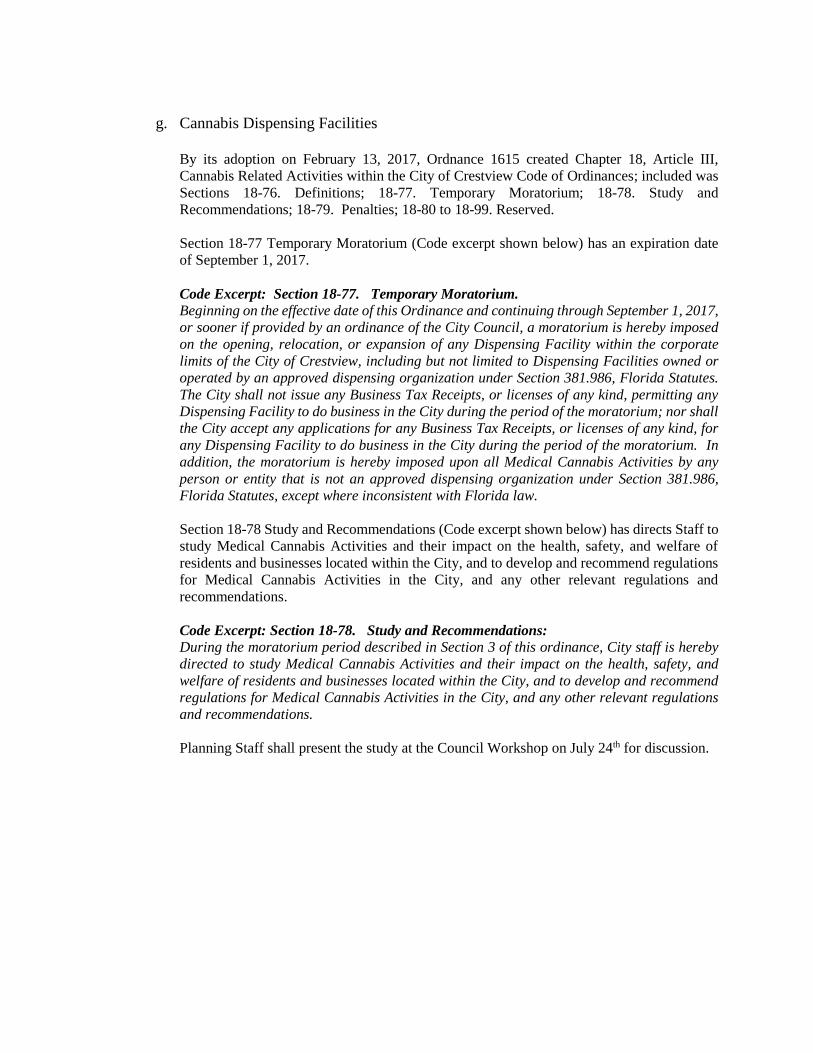
g. Cannabis Dispensing Facilities
By its adoption on February 13, 2017, Ordnance 1615 created Chapter 18, Article III,
Cannabis Related Activities within the City of Crestview Code of Ordinances; included was
Sections 18-76. Definitions; 18-77. Temporary Moratorium; 18-78. Study and
Recommendations; 18-79. Penalties; 18-80 to 18-99. Reserved.
Section 18-77 Temporary Moratorium (Code excerpt shown below) has an expiration date
of September 1, 2017.
Code Excerpt: Section 18-77. Temporary Moratorium. Beginning on the effective date of this Ordinance and continuing through September 1, 2017,
or sooner if provided by an ordinance of the City Council, a moratorium is hereby imposed
on the opening, relocation, or expansion of any Dispensing Facility within the corporate
limits of the City of Crestview, including but not limited to Dispensing Facilities owned or
operated by an approved dispensing organization under Section 381.986, Florida Statutes.
The City shall not issue any Business Tax Receipts, or licenses of any kind, permitting any
Dispensing Facility to do business in the City during the period of the moratorium; nor shall
the City accept any applications for any Business Tax Receipts, or licenses of any kind, for
any Dispensing Facility to do business in the City during the period of the moratorium. In
addition, the moratorium is hereby imposed upon all Medical Cannabis Activities by any
person or entity that is not an approved dispensing organization under Section 381.986,
Florida Statutes, except where inconsistent with Florida law.
Section 18-78 Study and Recommendations (Code excerpt shown below) has directs Staff to
study Medical Cannabis Activities and their impact on the health, safety, and welfare of
residents and businesses located within the City, and to develop and recommend regulations
for Medical Cannabis Activities in the City, and any other relevant regulations and
recommendations.
Code Excerpt: Section 18-78. Study and Recommendations:
During the moratorium period described in Section 3 of this ordinance, City staff is hereby
directed to study Medical Cannabis Activities and their impact on the health, safety, and
welfare of residents and businesses located within the City, and to develop and recommend
regulations for Medical Cannabis Activities in the City, and any other relevant regulations
and recommendations.
Planning Staff shall present the study at the Council Workshop on July 24th for discussion.
h. Camp Trailers
The Staff was given ninety days in order to research and offer a solution of the “Camp
Trailer” situation within the City of Crestview. The time shall expire by the July 10th
City Council meeting.
Staff is hereby requesting an extension of approximately 60 days to allow for the
Staff’s recommendations to be evaluated by the Planning and Zoning Board (Local
Planning Agency) for compliance with the City’s Land Use Regulations and Zoning
Requirements and Crestview Comprehensive Plan 2020 at their Meeting on July 18th
and if continued, August 15th. Upon completion of their review, the LPA will then
issue their recommendation to the Council.
A copy of the Draft Report is attached.
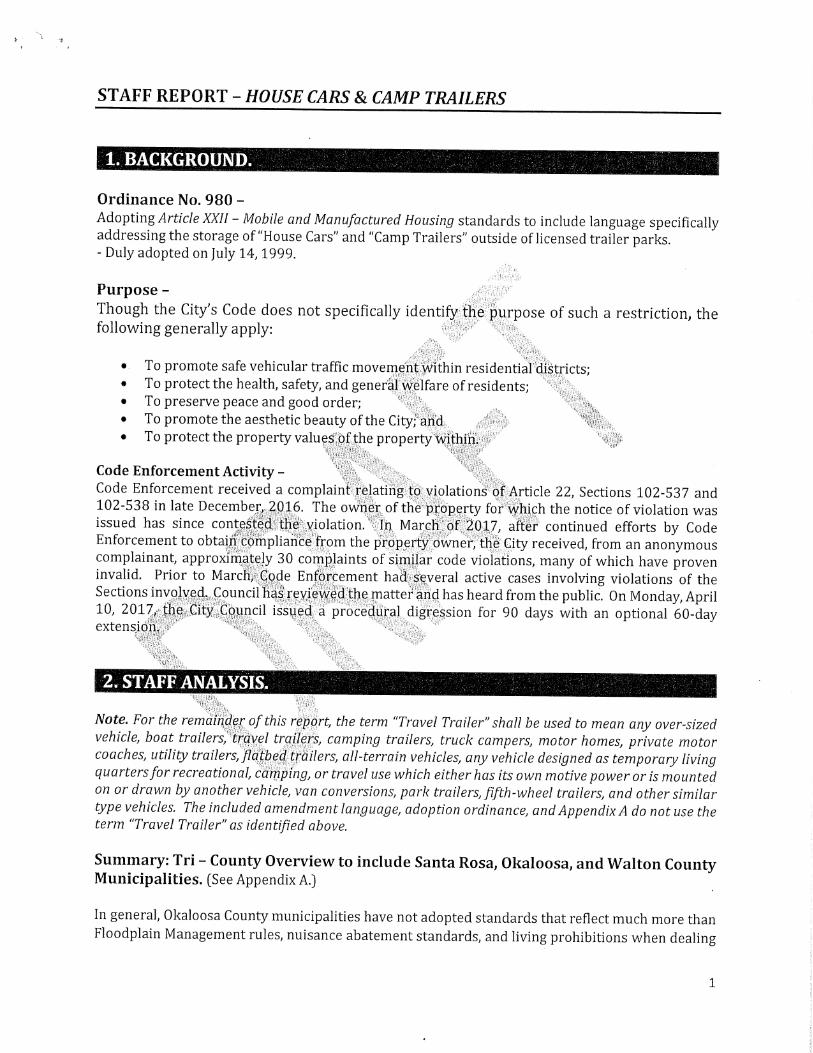
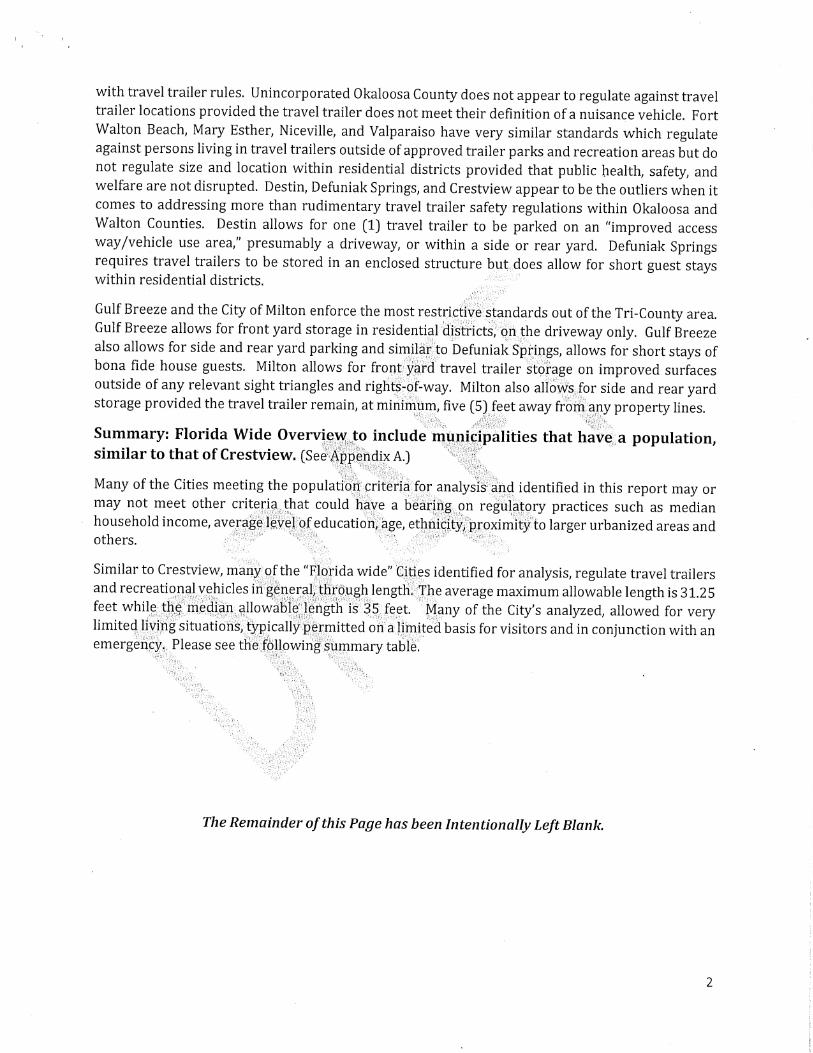
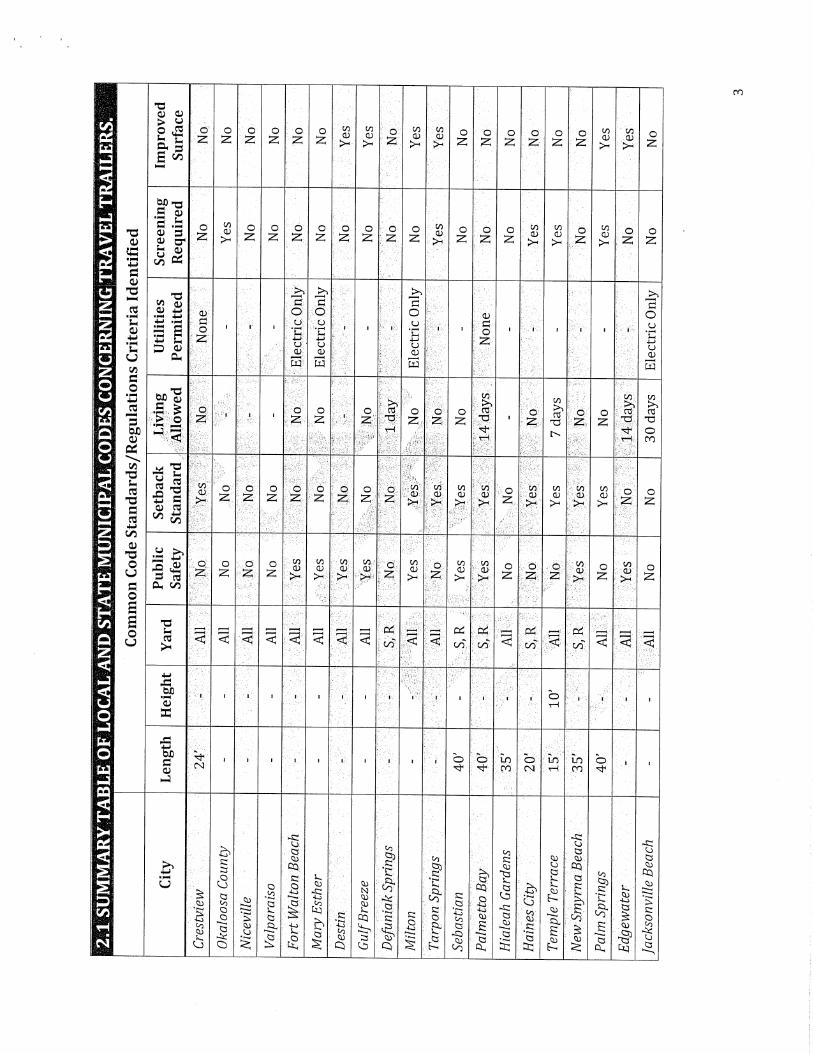
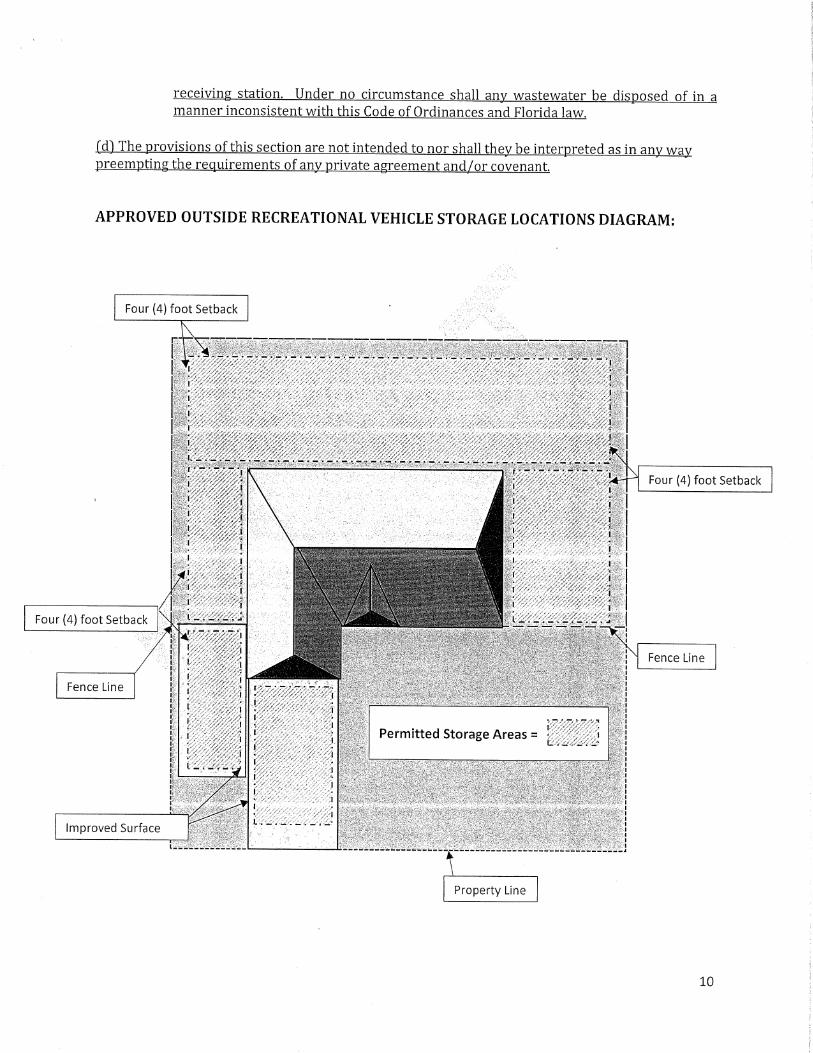
8. Comments from the Audience
9. Adjournment
Those not listed on the regular agenda who wish to address the council should fill out a yellow card. The Card must be submitted to the City Clerk. Speaking time should be three minutes or less, large groups may designate a spokesperson. All remarks should be addressed to the Council as a
whole and not to individual members. All meeting procedures are outlined in the Meeting Rules and Procedures brochure available outside the
Chambers. If any person decides to appeal any decision made by the City Council with respect to any matter considered at such meeting or hearing, he or she will need a record of the proceedings, and that, for such purpose, he or she may need to ensure that a verbatim record of the proceedings
is made, which record includes the testimony and evidence upon which the appeal is to be based. The City Council of the City of Crestview, Florida
does not discriminate upon the basis of any individual’s disability status. Anyone requiring reasonable accommodation as provided for in the American With Disabilities Act to insure access to and participation in the meeting should contact the Office of the City Clerk at (850)682-1560
prior to the meeting to make appropriate arrangements.