Embed Size (px)
Citation preview

City of Auburn, Alabama:
Outfall Reconnaissance Inventory Program
Prepared forAlabama Water Resources ConferenceSeptember 4-6, 2013Orange Beach, Alabama
City of Auburn, Alabama:
Outfall Reconnaissance Inventory Program

Presentation Outline
I. Introduction & Background
II. What is an Outfall Reconnaissance Inventory?
III. Planning, Prioritizing, and Managing Field Investigations
IV.Tracking and Documentation
V. Data Review and Analysis
VI.Summary and Conclusions

Introduction and Background

Location
Population Served – Around 60,000
Phase II Coverage – 60+/- Sq. Miles
Storm Sewer – 100+ Miles of Pipe
Receiving Waters – 450 Miles of Stream
Lee County
Legend
Lee County
Auburn University Phase II
Tallapoosa River Basin
City of Auburn Phase II
Annexed
ACT99_577
Annexed
ChattahoocheeTallapoosa

What is an Outfall Reconnaissance Inventory?

• Involves – Field Location– Documentation– Evaluation– Mapping – Characterization
of all permitted and unpermitted discharges to either the MS4 or its receiving waters.
• City of Auburn * This includes identification and inventory of other WQ related concerns
Outfall Reconnaissance Inventory
Iron Floc Anyone?

An Outfall Reconnaissance Inventory Should be Done to:
• Meet/Exceed IDDE component of MS4 permit **Can be Low Cost
• Familiarization of jurisdiction• ID other concerns (erosion etc.)• ID maintenance concerns• Assess All SS aerial crossings• ID BMP opportunities (restoration)• Most importantly - to gain intimate
knowledge of your system
An Outfall Reconnaissance Inventory Should be Completed:
• ASAP
• Reevaluate every 5 years or sooner
• Should arguably be done prior to implementation of ANY on the ground BMP other than education and outreach
• Should be performed in dry conditions, preferably at least 72-hours after any significant storm event

Planning, Prioritizing, and Managing Field Investigations

How to Plan for Outfall Reconnaissance
• Gather all existing information on storm-sewer system
• Gather all cartographic data (GIS if available)
• Identify all TMDL or 303(d) listed waters• Delineate receiving basins into
manageable units• Prioritize your schedule according to
variables of impairment and/or local knowledge
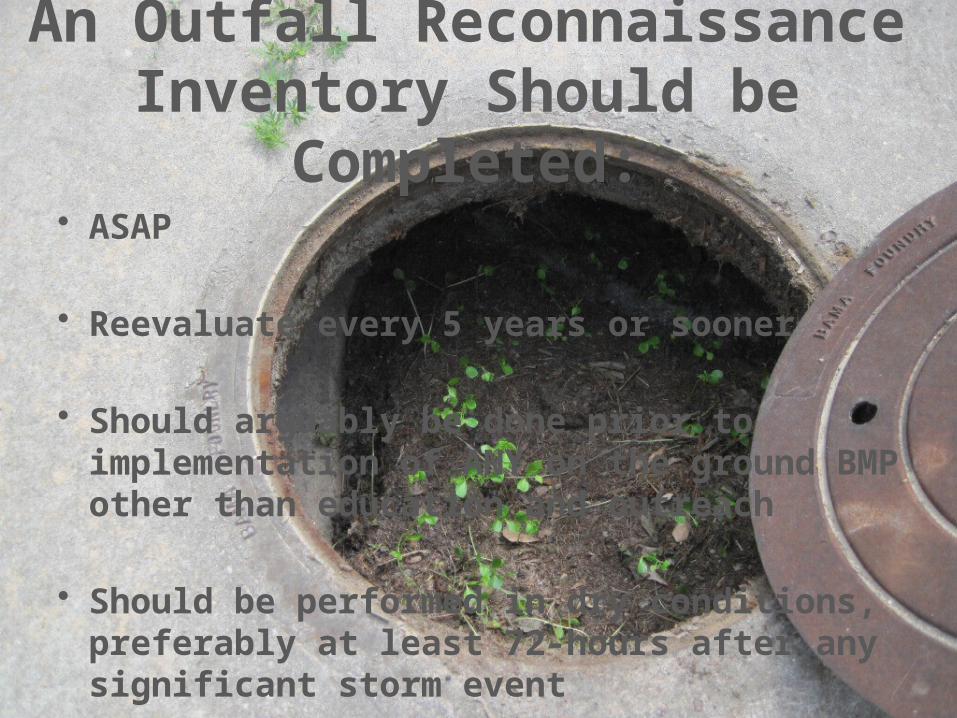
Know Your Limits.Jurisdictional Limits That Is!

SIMPLE ADVANCED
Gather Available Data

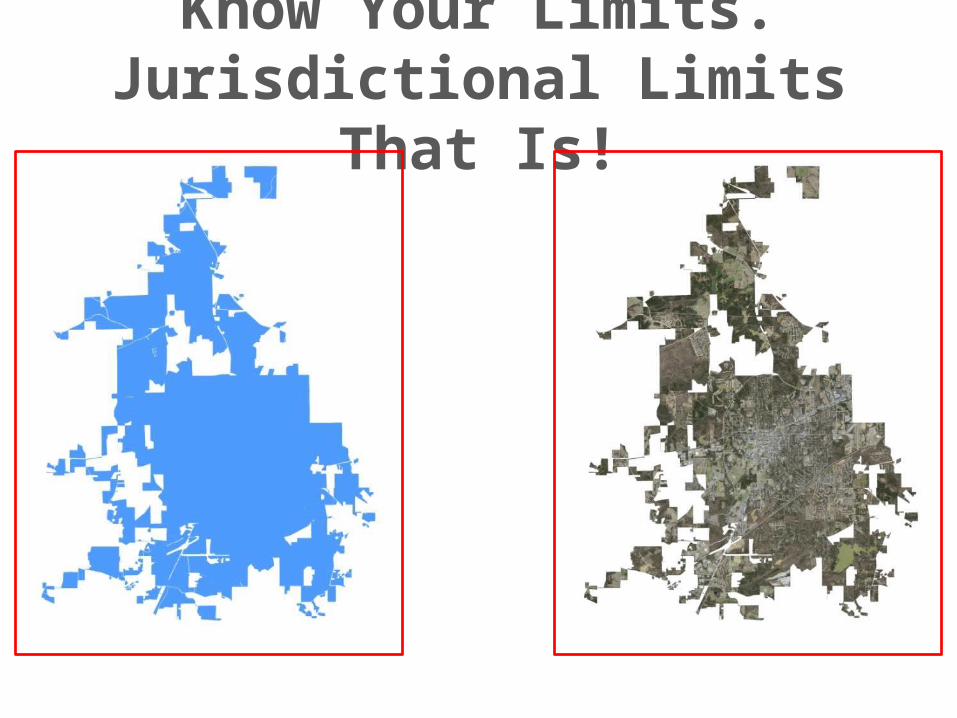
Prioritization and Scheduling• Watersheds with Approved
TMDL’s
• Watersheds with 303(d) Listed Waters
• Source Water Protection Area (Drinking Water Source)
• Watersheds Designated as Critical Habitat
• Outstanding Water Resources
A Method of Prioritization
9
10
7
6
53
4
2 1
8

Schedule by Density BASIN 1 LANDCOVER Basin 1 Outfalls Ag/Pasture Ag/Tilled Coniferous Deciduous Open Urban Water Total Headwalls Headwalls/AcreAcreage 228.51 28.56 744.20 324.07 138.06 1050.51 38.66 2552.57 440.00 0.17Percent Area 8.95% 1.12% 29.15% 12.70% 5.41% 41.15% 1.51% 100.00% BASIN 2 LANDCOVER Basin 2 Outfalls Ag/Pasture Ag/Tilled Coniferous Deciduous Open Urban Water Total Headwalls Headwalls/AcreAcreage 12.35 14.41 449.79 180.34 35.34 198.45 0.96 891.64 96.00 0.11Percent Area 1.38% 1.62% 50.45% 20.23% 3.96% 22.26% 0.11% 100.00% BASIN 3 LANDCOVER Basin 3 Outfalls Ag/Pasture Ag/Tilled Coniferous Deciduous Open Urban Water Total Headwalls Headwalls/AcreAcreage 93.81 14.52 403.45 168.79 87.33 406.79 18.81 1193.50 173.00 0.14Percent Area 7.86% 1.22% 33.80% 14.14% 7.32% 34.08% 1.58% 100.00% BASIN 4 LANDCOVER Basin 4 Outfalls Ag/Pasture Ag/Tilled Coniferous Deciduous Open Urban Water Total Headwalls Headwalls/AcreAcreage 276.39 46.02 1712.07 839.67 202.62 625.25 96.01 3798.03 58.00 0.02Percent Area 7.28% 1.21% 45.08% 22.11% 5.33% 16.46% 2.53% 100.00% BASIN 5 LANDCOVER Basin 5 Outfalls Ag/Pasture Ag/Tilled Coniferous Deciduous Open Urban Water Total Headwalls Headwalls/AcreAcreage 158.63 39.76 945.64 688.91 247.75 347.26 67.46 2495.41 63.00 0.03Percent Area 6.36% 1.59% 37.90% 27.61% 9.93% 13.92% 2.70% 100.00% BASIN 6 LANDCOVER Basin 6 Outfalls Ag/Pasture Ag/Tilled Coniferous Deciduous Open Urban Water Total Headwalls Headwalls/AcreAcreage 104.20 30.16 830.15 1304.47 505.67 364.72 12.26 3151.63 52.00 0.02Percent Area 3.31% 0.96% 26.34% 41.39% 16.04% 11.57% 0.39% 100.00% BASIN 7 LANDCOVER Basin 7 Outfalls Ag/Pasture Ag/Tilled Coniferous Deciduous Open Urban Water Total Headwalls Headwalls/AcreAcreage 680.11 83.22 2170.83 1175.72 495.01 500.26 162.50 5267.64 0.00 0.00Percent Area 12.91% 1.58% 41.21% 22.32% 9.40% 9.50% 3.08% 100.00% BASIN 8 LANDCOVER Basin 8 Outfalls Ag/Pasture Ag/Tilled Coniferous Deciduous Open Urban Water Total Headwalls Headwalls/AcreAcreage 48.54 3.73 198.65 169.43 12.91 21.98 1.19 456.43 4.00 0.01Percent Area 10.64% 0.82% 43.52% 37.12% 2.83% 4.81% 0.26% 100.00% BASIN 9 LANDCOVER Basin 9 Outfalls Ag/Pasture Ag/Tilled Coniferous Deciduous Open Urban Water Total Headwalls Headwalls/AcreAcreage 2448.06 299.80 9406.59 8070.19 2059.94 927.00 148.23 23359.80 0.00 0.00Percent Area 10.48% 1.28% 40.27% 34.55% 8.82% 3.97% 0.63% 100.00% BASIN 10 LANDCOVER Basin 10 Outfalls Ag/Pasture Ag/Tilled Coniferous Deciduous Open Urban Water Total Headwalls Headwalls/AcreAcreage 290.46 29.90 2345.14 1221.96 682.39 279.51 32.47 4881.83 21.00 0.00Percent Area 5.95% 0.61% 48.04% 25.03% 13.98% 5.73% 0.67% 100.00%
% URBAN LC HEADWALLS per ACRE

Schedule Overlay
Start Here!

Getting Started – It Takes Two
SAFETY IN NUMBERS

Necessary EquipmentField Vest
Spray PaintField Book
Tape MeasurerCameraMachete
MapORI Field Sheets
BootsSunscreenOptional
GPSPocket Colorimeter
Snake ChapsPVC Caps

Use the IDDE Guidance Manual
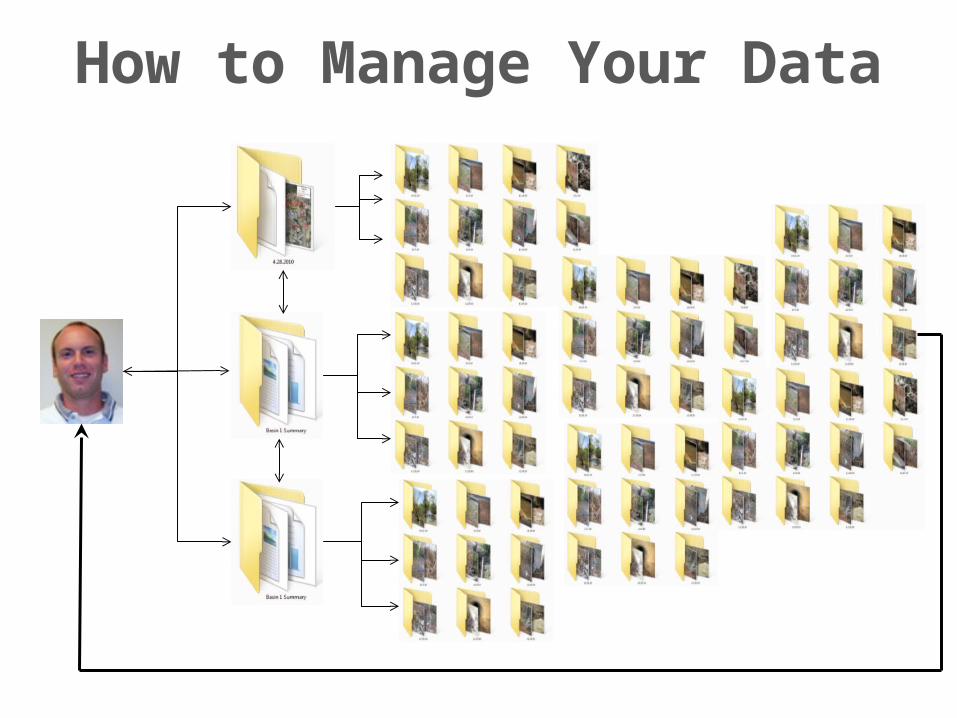
How to Manage Your Data

Information Tracking
**A Product of an Interdepartmental Collaboration Between City of Auburn Information Technology and
Water Resource Management Departments
Click Here

Integrative Database


Interdepartmental Benefits
Create Custom PDF Reports/Work Orders

Data Review and Analysis

Progress – Year 4• 3 Watersheds Completed
• 225 Miles of Stream Surveyed
• 1,161+ Outfalls Mapped and Assessed
• 734 Water Quality Concerns Identified
• 150+ Sanitary Sewer Aerial Crossings Inspected
• Vast Increase in Local Knowledge Base!

By The Numbers
79%
19%
1%
1%
Unlikely
Potential
Suspect
Obvious

By The Numbers
83%
17%
No
Yes

92%
8%
Highlights Importance ofPreventative Maintenance!!
By The Numbers
Yes
No

Internal QA/QC
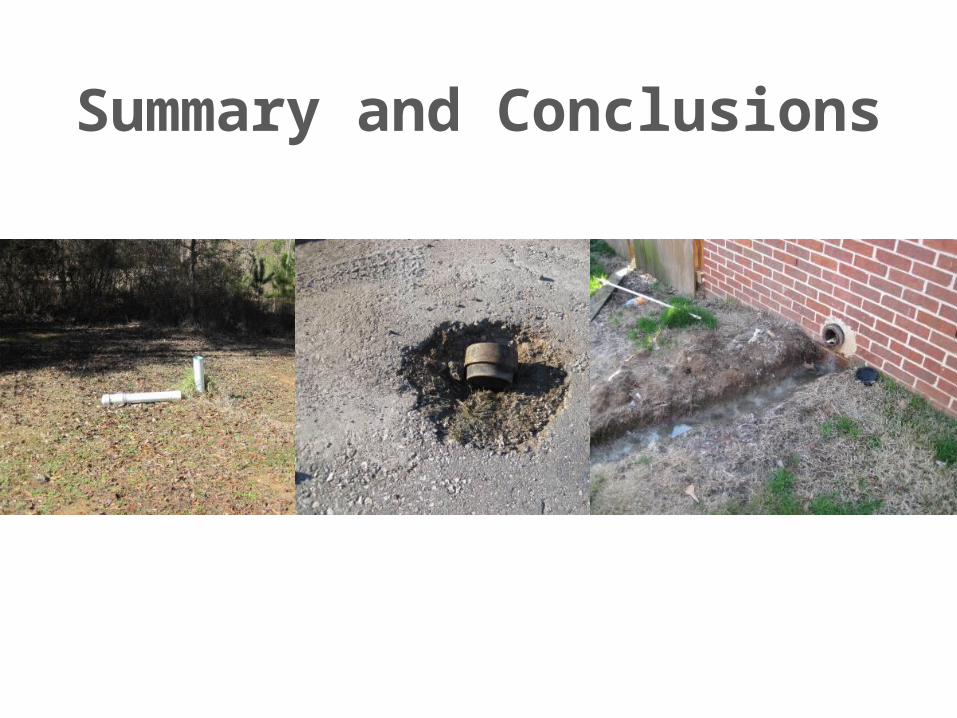
Summary and Conclusions

• INTIMATE PHYSICAL KNOWLEDGE OF YOUR WATERSHEDS IS INVALUABLE
• ORI Can be Effective and Inexpensive Tool
• Planning and Prioritization are Critical
• Quality of Data Management will Determine How Much Benefit You Receive From Your Inventory
• Share Information with other Departments and Regulatory Agencies!!

Questions???
Daniel BallardCity of Auburn, Alabama
Water Resource Management [email protected]
(334) 501-7367