Embed Size (px)
Citation preview
Logistics Division, Department of Commerce, Ministry of Commerce and Industry
19 January 2021
City Logistics
1
Outline
1. The clutter
2. De-cluttering - a conceptual framework
3. A menu of solutions & Quick wins
4. Systematic City Logistic planning – 5 steps
5. Reports & Policy documents
6. Discussions and Key Take-aways
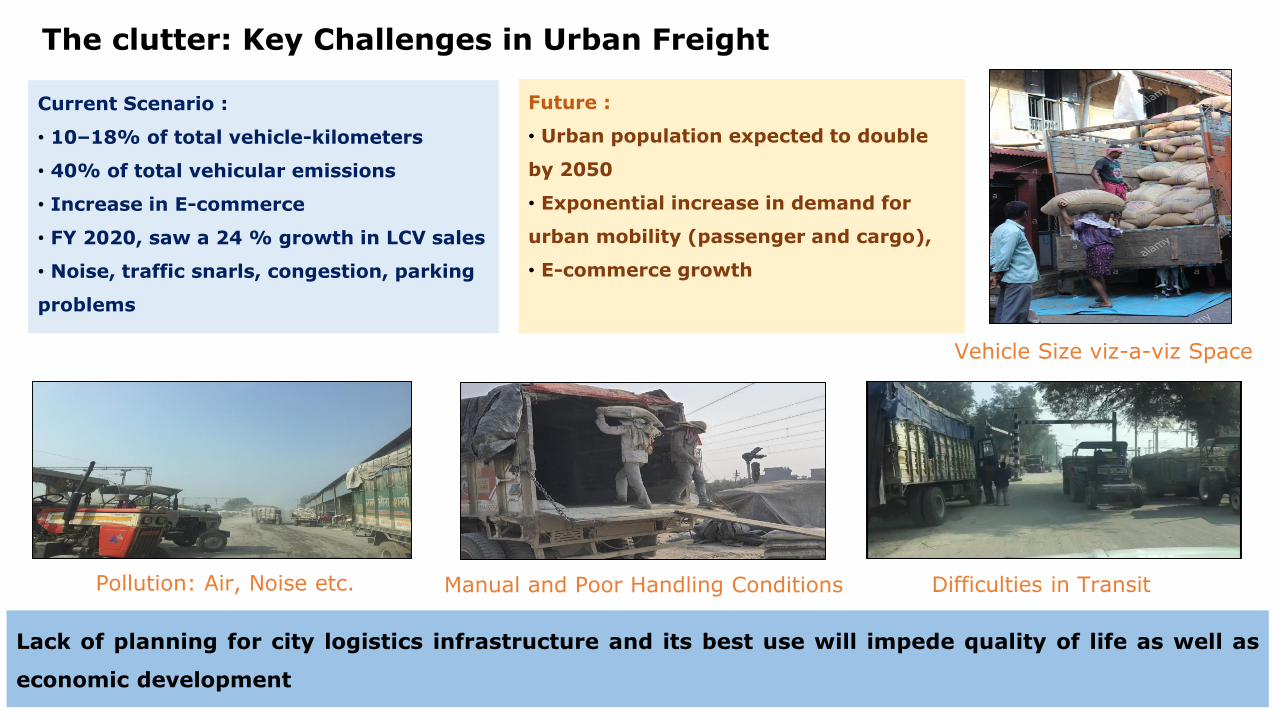
Future :
• Urban population expected to double
by 2050
• Exponential increase in demand for
urban mobility (passenger and cargo),
• E-commerce growth
The clutter: Key Challenges in Urban Freight
Current Scenario :
• 10–18% of total vehicle-kilometers
• 40% of total vehicular emissions
• Increase in E-commerce
• FY 2020, saw a 24 % growth in LCV sales
• Noise, traffic snarls, congestion, parking
problems
2
Pollution: Air, Noise etc. Manual and Poor Handling Conditions Difficulties in Transit
Vehicle Size viz-a-viz Space
Lack of planning for city logistics infrastructure and its best use will impede quality of life as well as
economic development
v/sRestrictions Planning
3
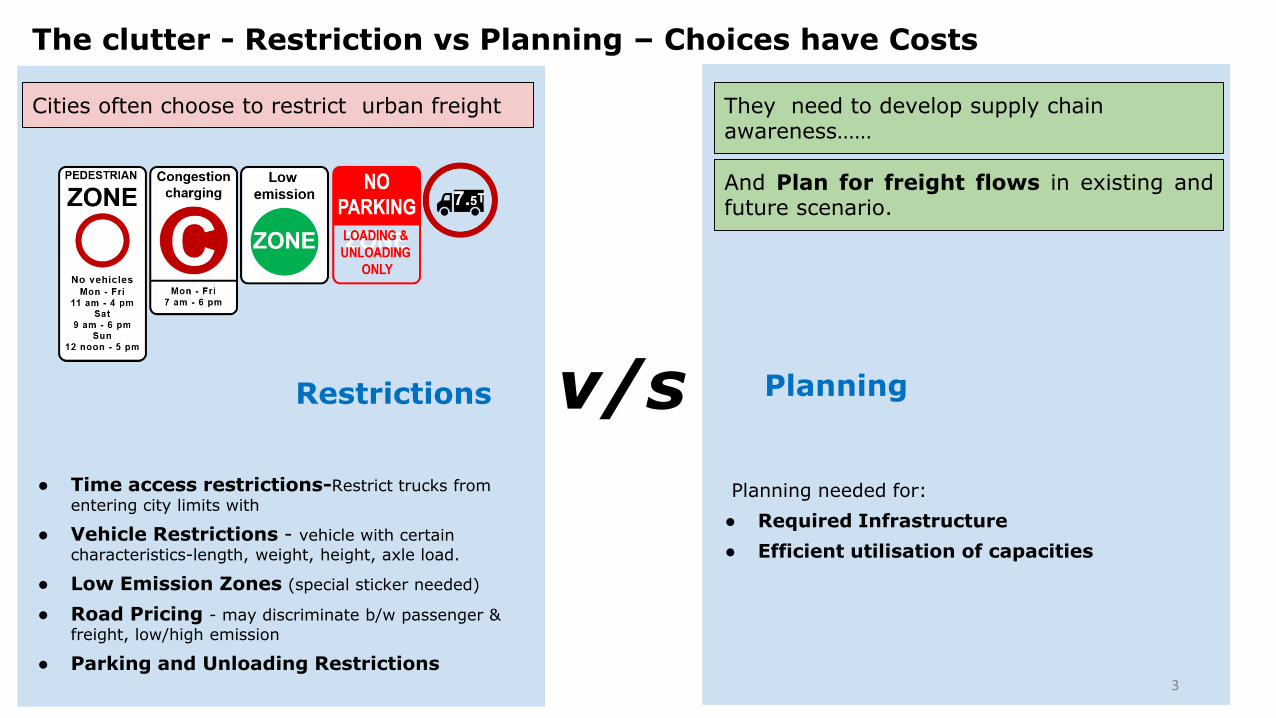
Planning needed for:
● Required Infrastructure
● Efficient utilisation of capacities
Cities often choose to restrict urban freight
● Time access restrictions-Restrict trucks from
entering city limits with
● Vehicle Restrictions - vehicle with certain
characteristics-length, weight, height, axle load.
● Low Emission Zones (special sticker needed)
● Road Pricing - may discriminate b/w passenger &
freight, low/high emission
● Parking and Unloading Restrictions
They need to develop supply chain awareness……
And Plan for freight flows in existing andfuture scenario.
The clutter - Restriction vs Planning – Choices have Costs
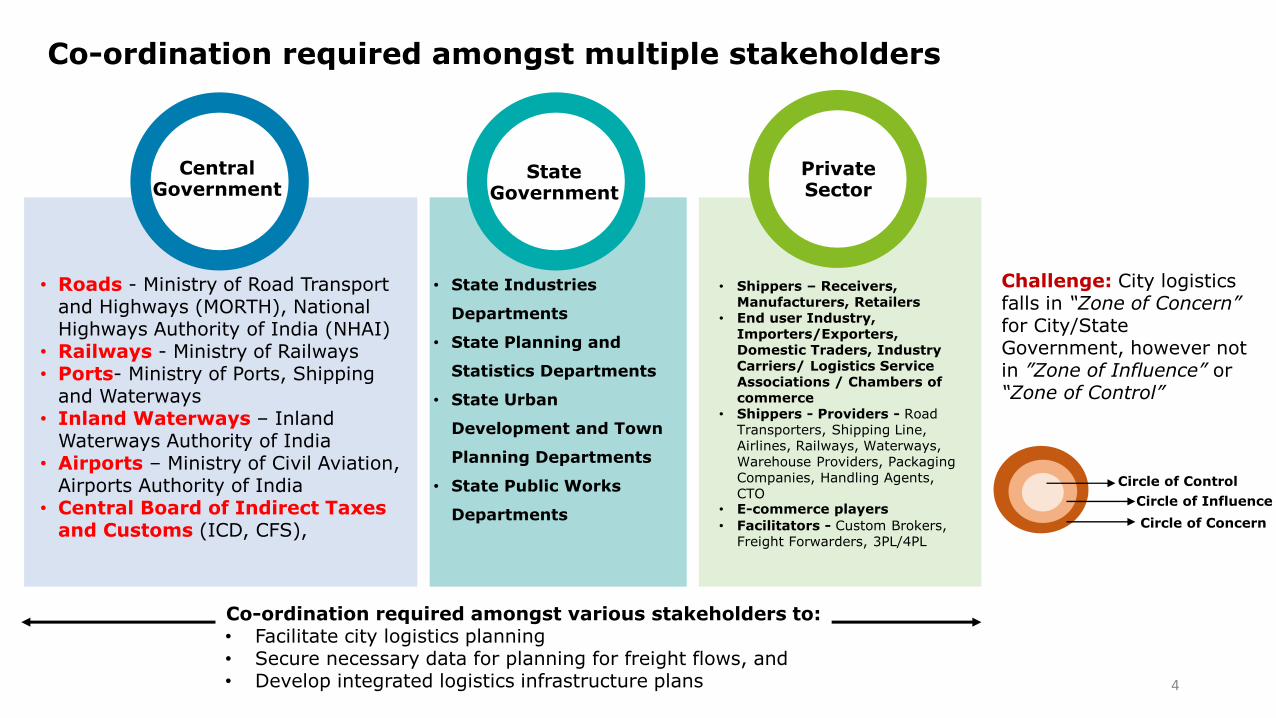
Co-ordination required amongst multiple stakeholders
4
Central Government
State Government
Private Sector
• Roads - Ministry of Road Transport and Highways (MORTH), National Highways Authority of India (NHAI)
• Railways - Ministry of Railways • Ports- Ministry of Ports, Shipping
and Waterways• Inland Waterways – Inland
Waterways Authority of India • Airports – Ministry of Civil Aviation,
Airports Authority of India• Central Board of Indirect Taxes
and Customs (ICD, CFS),
• State Industries
Departments
• State Planning and
Statistics Departments
• State Urban
Development and Town
Planning Departments
• State Public Works
Departments
• Shippers – Receivers, Manufacturers, Retailers
• End user Industry, Importers/Exporters, Domestic Traders, IndustryCarriers/ Logistics Service Associations / Chambers of commerce
• Shippers - Providers - Road Transporters, Shipping Line, Airlines, Railways, Waterways, Warehouse Providers, Packaging Companies, Handling Agents, CTO
• E-commerce players
• Facilitators - Custom Brokers, Freight Forwarders, 3PL/4PL
Co-ordination required amongst various stakeholders to: • Facilitate city logistics planning• Secure necessary data for planning for freight flows, and• Develop integrated logistics infrastructure plans
Circle of Control
Circle of Influence
Circle of Concern
Challenge: City logistics falls in “Zone of Concern” for City/State Government, however not in ”Zone of Influence” or “Zone of Control”
5
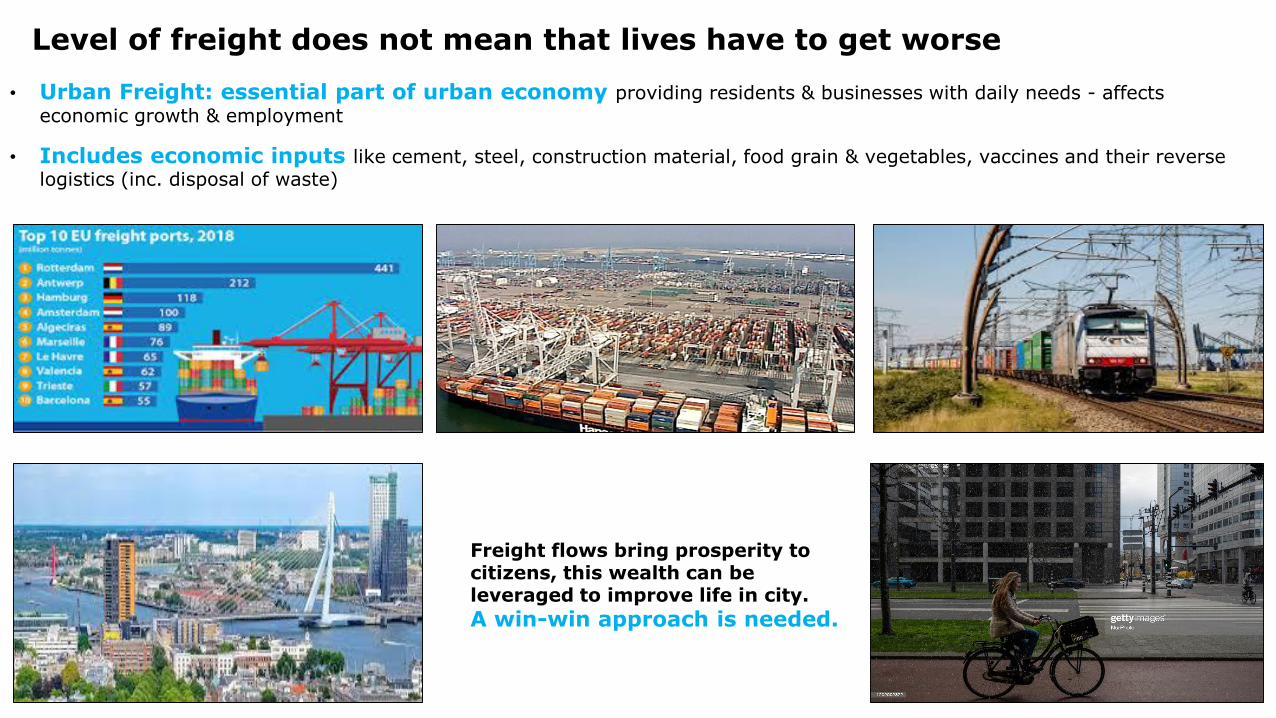
Freight flows bring prosperity to citizens, this wealth can be leveraged to improve life in city.
A win-win approach is needed.
• Urban Freight: essential part of urban economy providing residents & businesses with daily needs - affects
economic growth & employment
• Includes economic inputs like cement, steel, construction material, food grain & vegetables, vaccines and their reverse logistics (inc. disposal of waste)
Level of freight does not mean that lives have to get worse
6
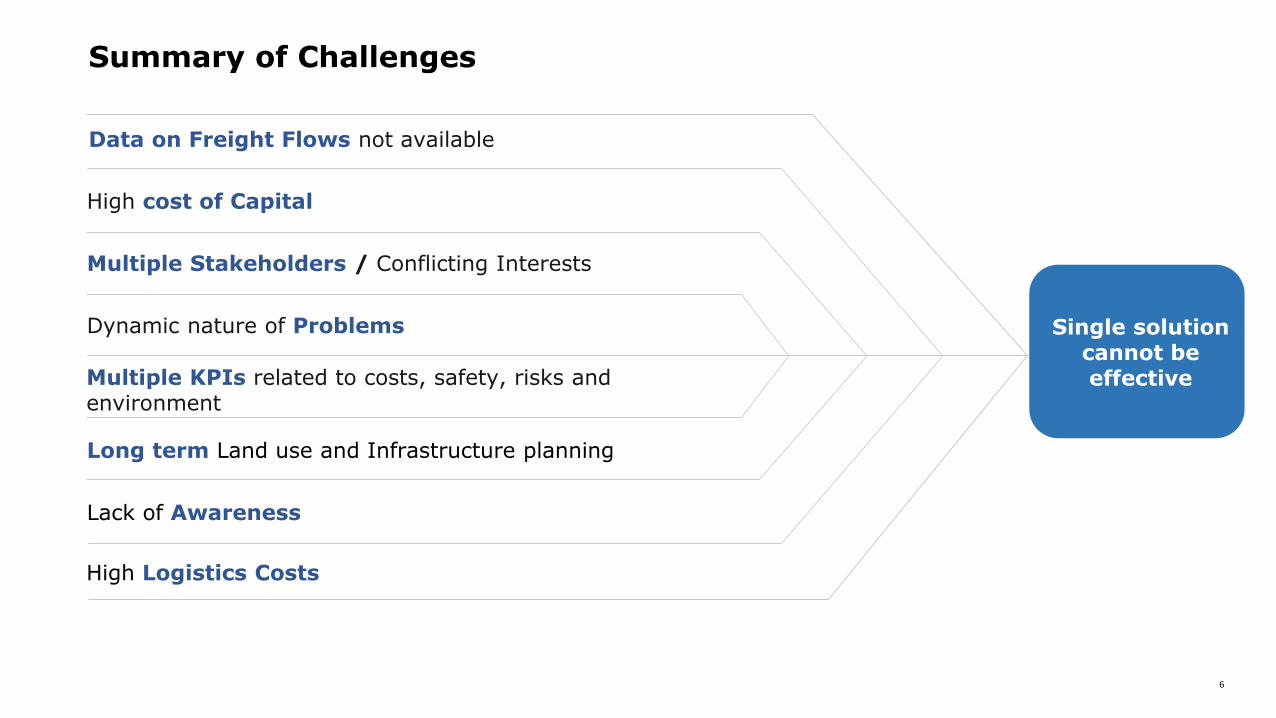
High cost of Capital
Multiple Stakeholders / Conflicting Interests
Dynamic nature of Problems
High Logistics Costs
Long term Land use and Infrastructure planning
Lack of Awareness
Single solution cannot be effective
Data on Freight Flows not available
Multiple KPIs related to costs, safety, risks and environment
Summary of Challenges
7
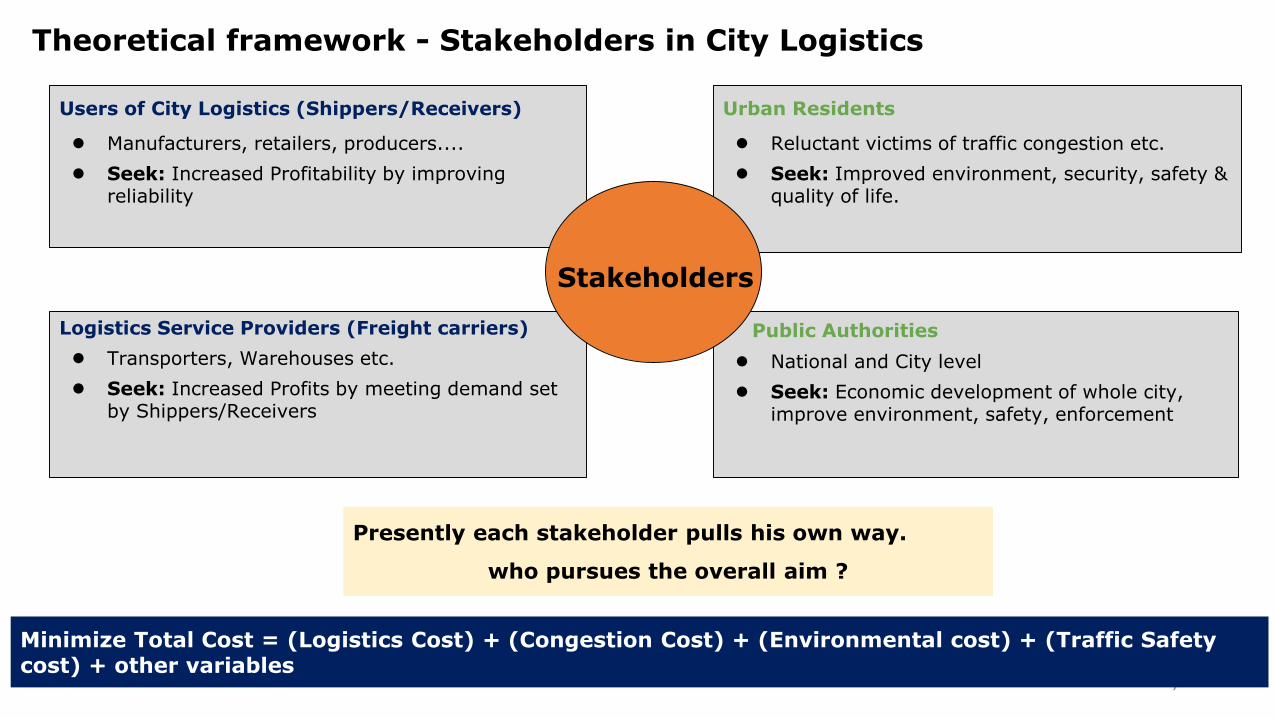
Users of City Logistics (Shippers/Receivers)
● Manufacturers, retailers, producers....
● Seek: Increased Profitability by improving reliability
Urban Residents
● Reluctant victims of traffic congestion etc.
● Seek: Improved environment, security, safety & quality of life.
Logistics Service Providers (Freight carriers)
● Transporters, Warehouses etc.
● Seek: Increased Profits by meeting demand set by Shippers/Receivers
Public Authorities
● National and City level
● Seek: Economic development of whole city, improve environment, safety, enforcement
Presently each stakeholder pulls his own way.
who pursues the overall aim ?
Minimize Total Cost = (Logistics Cost) + (Congestion Cost) + (Environmental cost) + (Traffic Safety cost) + other variables
Theoretical framework - Stakeholders in City Logistics
Stakeholders
8
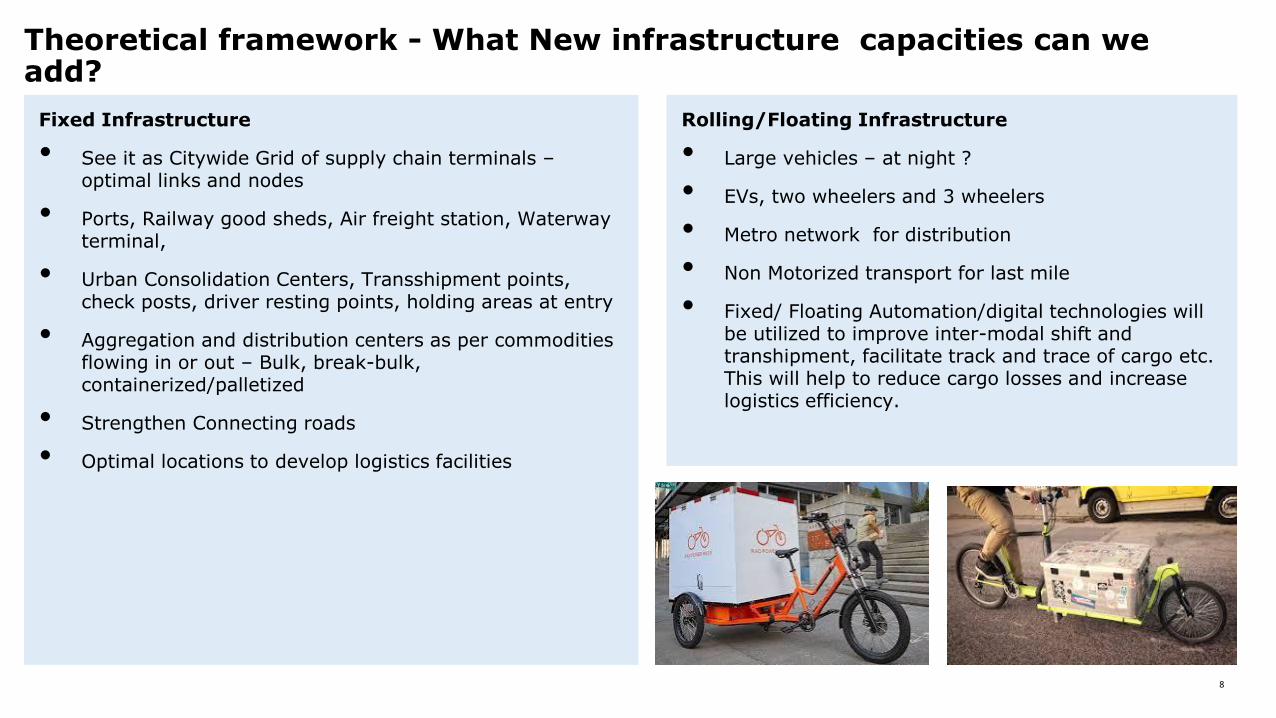
Fixed Infrastructure
• See it as Citywide Grid of supply chain terminals –optimal links and nodes
• Ports, Railway good sheds, Air freight station, Waterway terminal,
• Urban Consolidation Centers, Transshipment points, check posts, driver resting points, holding areas at entry
• Aggregation and distribution centers as per commodities flowing in or out – Bulk, break-bulk, containerized/palletized
• Strengthen Connecting roads
• Optimal locations to develop logistics facilities
Theoretical framework - What New infrastructure capacities can we add?
Rolling/Floating Infrastructure
• Large vehicles – at night ?
• EVs, two wheelers and 3 wheelers
• Metro network for distribution
• Non Motorized transport for last mile
• Fixed/ Floating Automation/digital technologies will be utilized to improve inter-modal shift and transhipment, facilitate track and trace of cargo etc. This will help to reduce cargo losses and increase logistics efficiency.
9
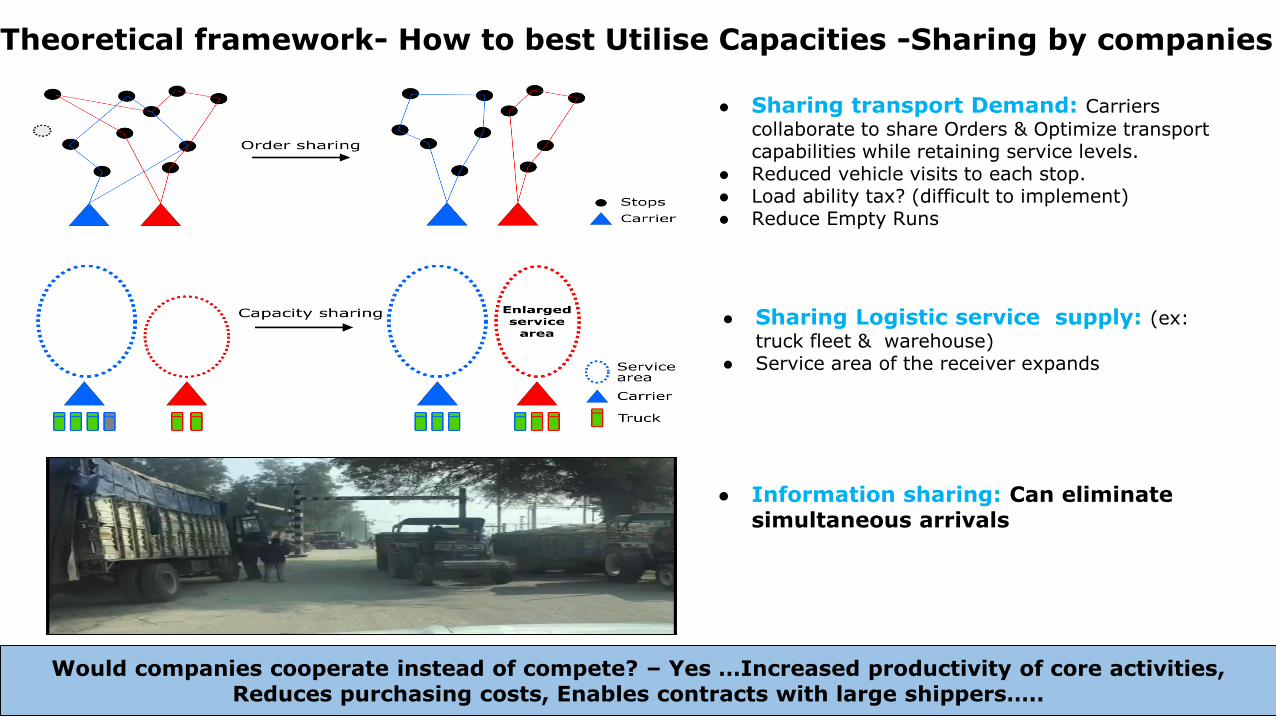
● Sharing transport Demand: Carriers
collaborate to share Orders & Optimize transport capabilities while retaining service levels.
● Reduced vehicle visits to each stop.● Load ability tax? (difficult to implement)● Reduce Empty Runs
● Sharing Logistic service supply: (ex:
truck fleet & warehouse)● Service area of the receiver expands
● Information sharing: Can eliminate simultaneous arrivals
Would companies cooperate instead of compete? – Yes …Increased productivity of core activities,Reduces purchasing costs, Enables contracts with large shippers…..
Theoretical framework- How to best Utilise Capacities -Sharing by companies
10
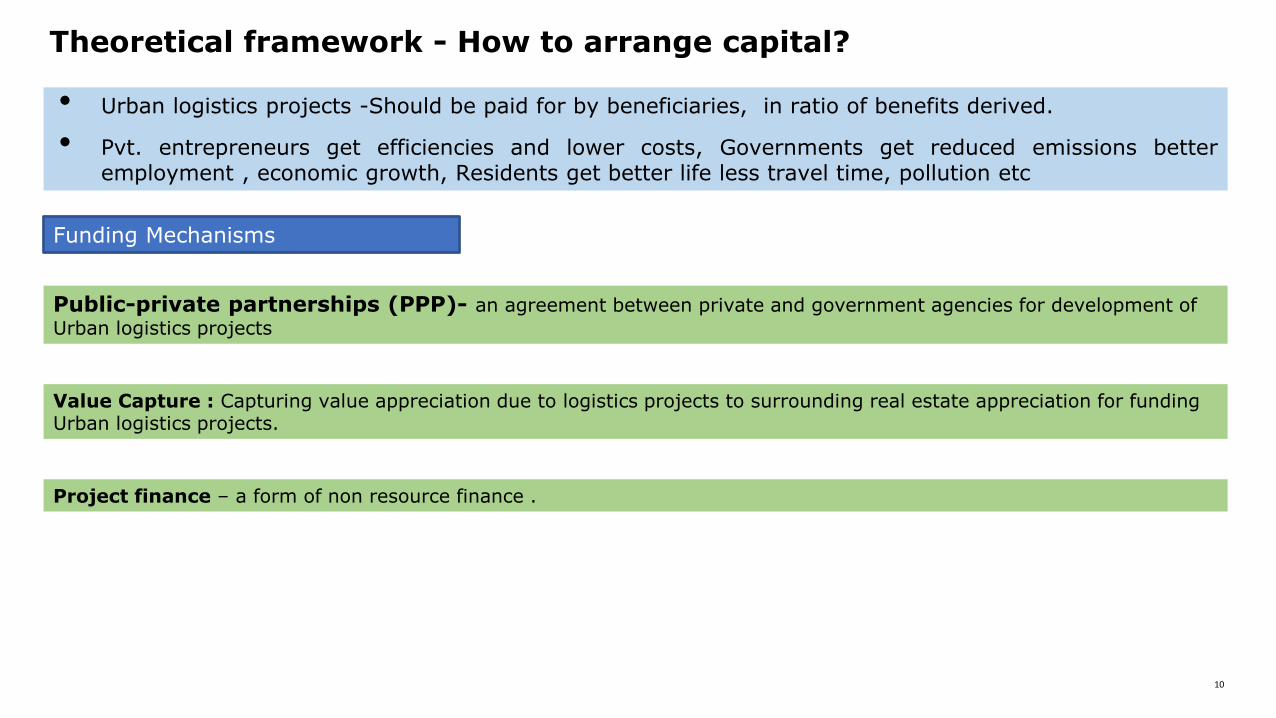
Theoretical framework - How to arrange capital?
Project finance – a form of non resource finance .
• Urban logistics projects -Should be paid for by beneficiaries, in ratio of benefits derived.
• Pvt. entrepreneurs get efficiencies and lower costs, Governments get reduced emissions betteremployment , economic growth, Residents get better life less travel time, pollution etc
Value Capture : Capturing value appreciation due to logistics projects to surrounding real estate appreciation for funding Urban logistics projects.
Public-private partnerships (PPP)- an agreement between private and government agencies for development of
Urban logistics projects
Funding Mechanisms
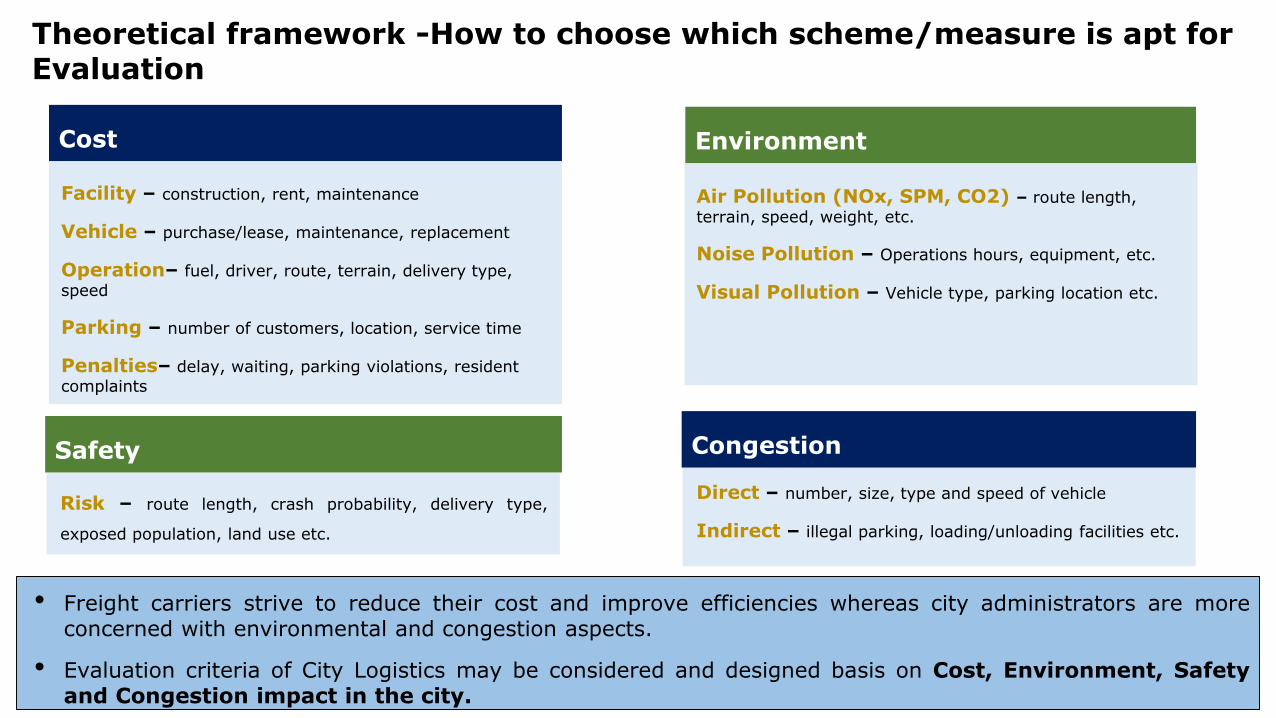
Cost
11
Environment
Safety Congestion
Theoretical framework -How to choose which scheme/measure is apt for Evaluation
• Freight carriers strive to reduce their cost and improve efficiencies whereas city administrators are moreconcerned with environmental and congestion aspects.
• Evaluation criteria of City Logistics may be considered and designed basis on Cost, Environment, Safetyand Congestion impact in the city.
Facility – construction, rent, maintenance
Vehicle – purchase/lease, maintenance, replacement
Operation– fuel, driver, route, terrain, delivery type,
speed
Parking – number of customers, location, service time
Penalties– delay, waiting, parking violations, resident
complaints
Air Pollution (NOx, SPM, CO2) – route length,
terrain, speed, weight, etc.
Noise Pollution – Operations hours, equipment, etc.
Visual Pollution – Vehicle type, parking location etc.
Risk – route length, crash probability, delivery type,
exposed population, land use etc.
Direct – number, size, type and speed of vehicle
Indirect – illegal parking, loading/unloading facilities etc.
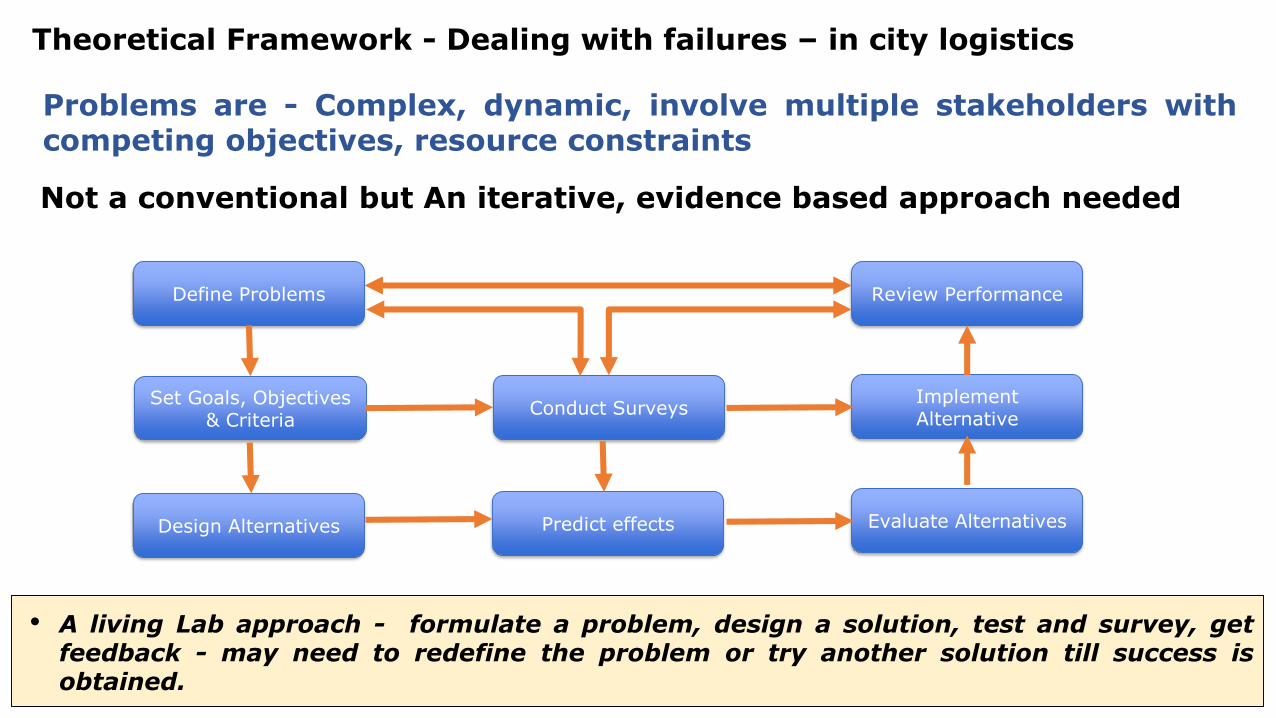
Problems are - Complex, dynamic, involve multiple stakeholders withcompeting objectives, resource constraints
12
Theoretical Framework - Dealing with failures – in city logistics
• A living Lab approach - formulate a problem, design a solution, test and survey, getfeedback - may need to redefine the problem or try another solution till success isobtained.
Define Problems
Set Goals, Objectives & Criteria
Design Alternatives Predict effects
Conduct Surveys
Review Performance
Implement Alternative
Evaluate Alternatives
Not a conventional but An iterative, evidence based approach needed
13
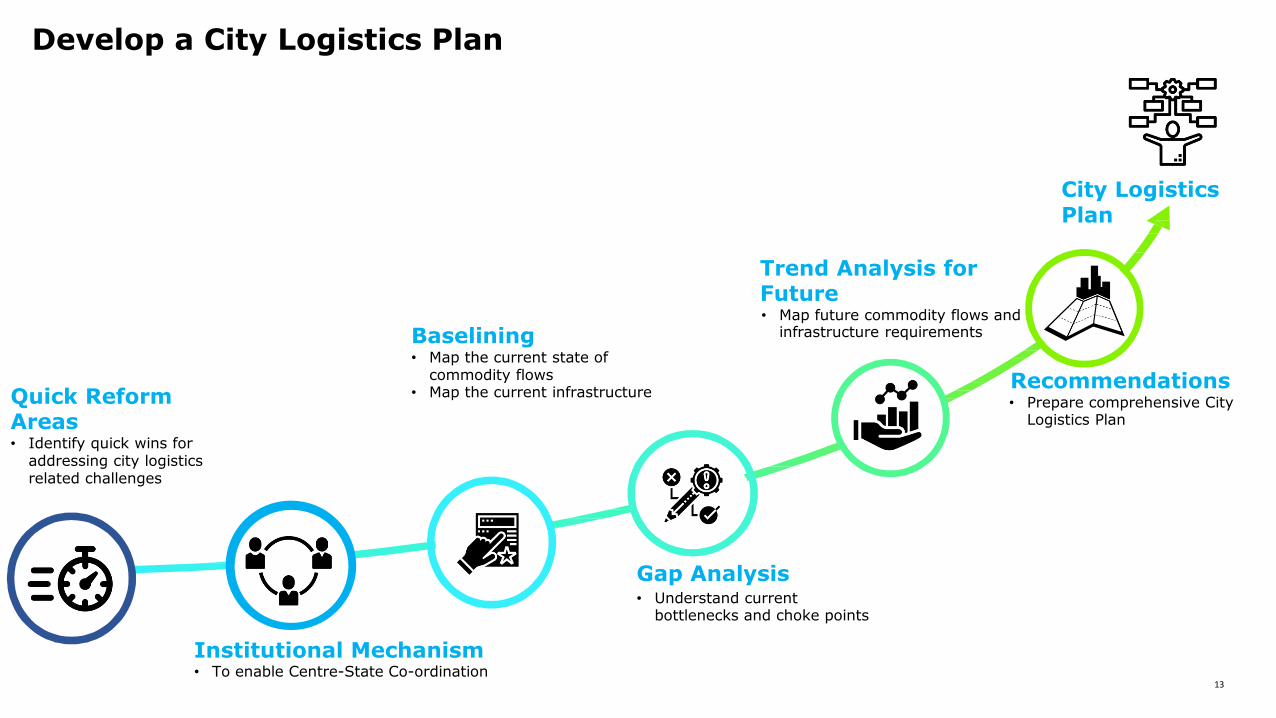
Baselining• Map the current state of
commodity flows• Map the current infrastructure
Gap Analysis• Understand current
bottlenecks and choke points
Recommendations• Prepare comprehensive City
Logistics Plan
Trend Analysis for Future • Map future commodity flows and
infrastructure requirements
City Logistics Plan
Quick Reform Areas• Identify quick wins for
addressing city logistics related challenges
Institutional Mechanism• To enable Centre-State Co-ordination
Develop a City Logistics Plan
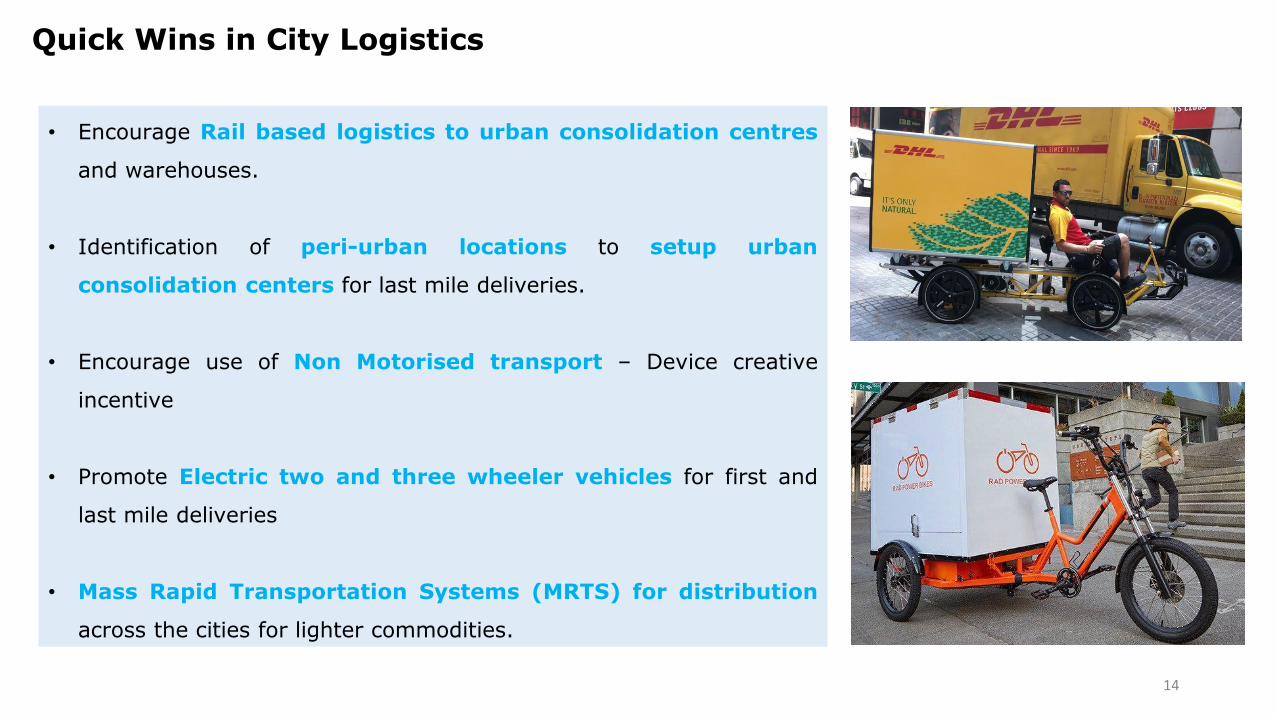
• Encourage Rail based logistics to urban consolidation centres
and warehouses.
• Identification of peri-urban locations to setup urban
consolidation centers for last mile deliveries.
• Encourage use of Non Motorised transport – Device creative
incentive
• Promote Electric two and three wheeler vehicles for first and
last mile deliveries
• Mass Rapid Transportation Systems (MRTS) for distribution
across the cities for lighter commodities.
14
Quick Wins in City Logistics
15
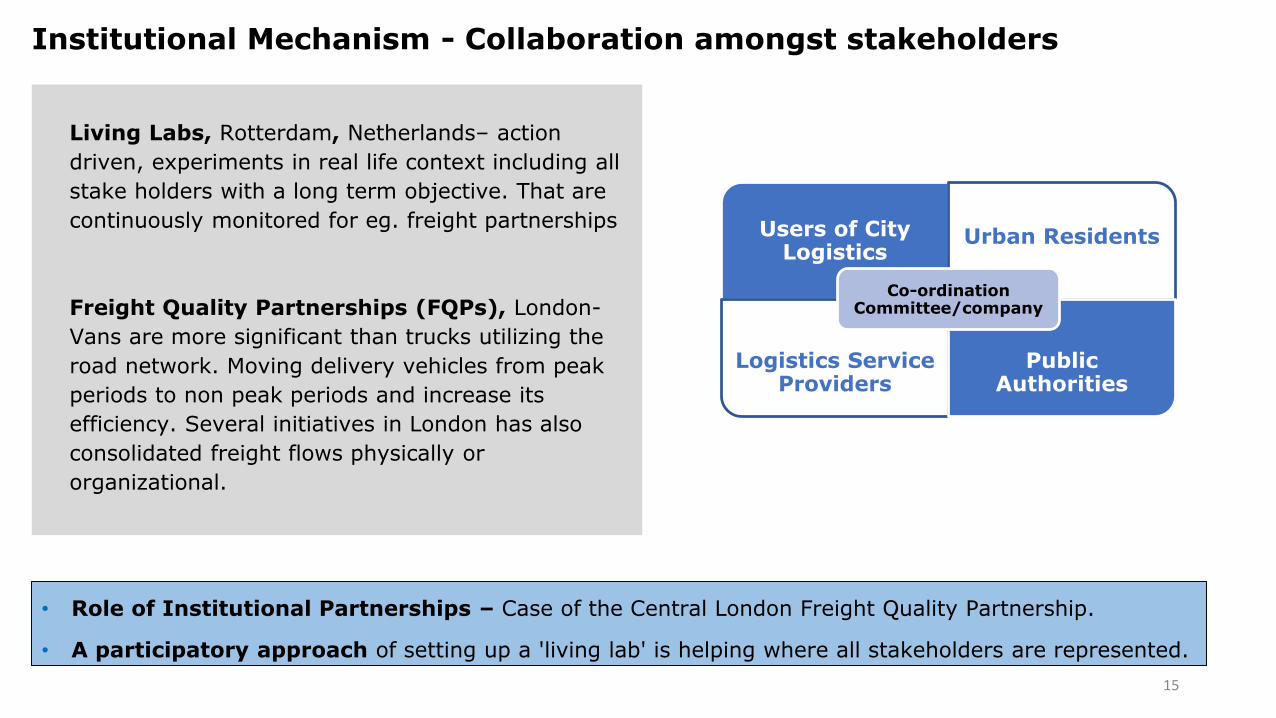
• Role of Institutional Partnerships – Case of the Central London Freight Quality Partnership.
• A participatory approach of setting up a 'living lab' is helping where all stakeholders are represented.
Institutional Mechanism - Collaboration amongst stakeholders
Users of City Logistics
Urban Residents
Logistics Service Providers
Public Authorities
Co-ordination Committee/company
Living Labs, Rotterdam, Netherlands– action
driven, experiments in real life context including all
stake holders with a long term objective. That are
continuously monitored for eg. freight partnerships
Freight Quality Partnerships (FQPs), London-
Vans are more significant than trucks utilizing the
road network. Moving delivery vehicles from peak
periods to non peak periods and increase its
efficiency. Several initiatives in London has also
consolidated freight flows physically or
organizational.

Regulatory
and
Land Planning
Restrictions on Vehicles in small areas and roads based on emissions (Low Emission Zone),
weight, size, age
Infrastructure
Berlin: Low Emission
Zone since 2008
Paris: Time slots per
type of truck in Paris
city center
India: mixed landuse
developmentMixed land use based development to reduce freight distances
Urban distribution centers (UDC) within or outside the city to shared logistics facilities for goodsconsolidation and transportation into the city
Ningbo: DHL UDC
Antwerp: bpost city
logistics
Direct injection of containers into the city via massified transport (ship, heavy rail)Paris: Direct injection
via canal through
central injection point
Menu of Possible Solutions : Case Studies: International
Market based
measures
Urban congestion charge when entering the city or a certain area
Smart fare Implementation based on the distance travelled, volume shipped or the currenttraffic conditions in the city.
Lower or Zero Emission Trucks (Euro NCAP 5, electric, gas) in combination with regulatory andland planning measures
Optimization of freight distribution via traffic information systems, freight capacity exchangesystems, centralized route planning, route optimization
Hamburg: Smart city
system connecting port
logistics and city traffic
Denmark: Pilot for use
of EV by Post Denmark
London: Congestion
charge
San Diego: I-15 Hot
Lanes
Equipment
and
technology
(enablers)
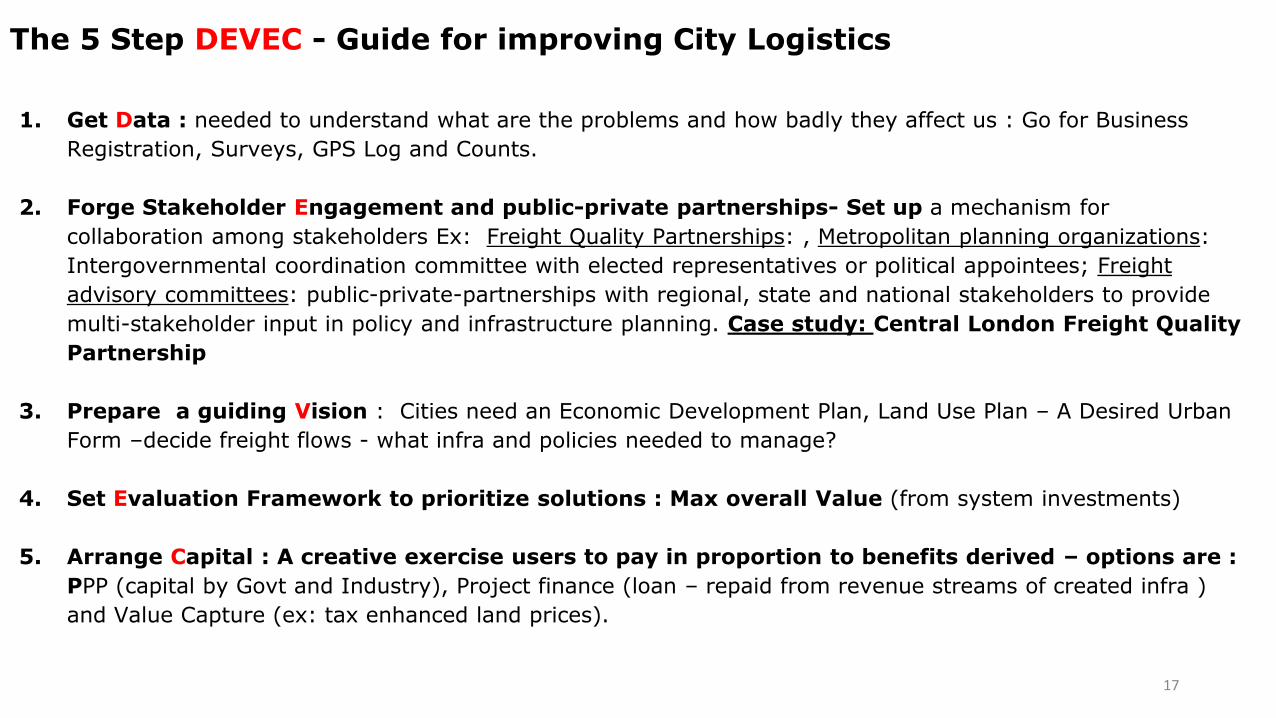
The 5 Step DEVEC - Guide for improving City Logistics
17
1. Get Data : needed to understand what are the problems and how badly they affect us : Go for Business
Registration, Surveys, GPS Log and Counts.
2. Forge Stakeholder Engagement and public-private partnerships- Set up a mechanism for
collaboration among stakeholders Ex: Freight Quality Partnerships: , Metropolitan planning organizations:
Intergovernmental coordination committee with elected representatives or political appointees; Freight
advisory committees: public-private-partnerships with regional, state and national stakeholders to provide
multi-stakeholder input in policy and infrastructure planning. Case study: Central London Freight Quality
Partnership
3. Prepare a guiding Vision : Cities need an Economic Development Plan, Land Use Plan – A Desired Urban
Form –decide freight flows - what infra and policies needed to manage?
4. Set Evaluation Framework to prioritize solutions : Max overall Value (from system investments)
5. Arrange Capital : A creative exercise users to pay in proportion to benefits derived – options are :
PPP (capital by Govt and Industry), Project finance (loan – repaid from revenue streams of created infra )
and Value Capture (ex: tax enhanced land prices).
18
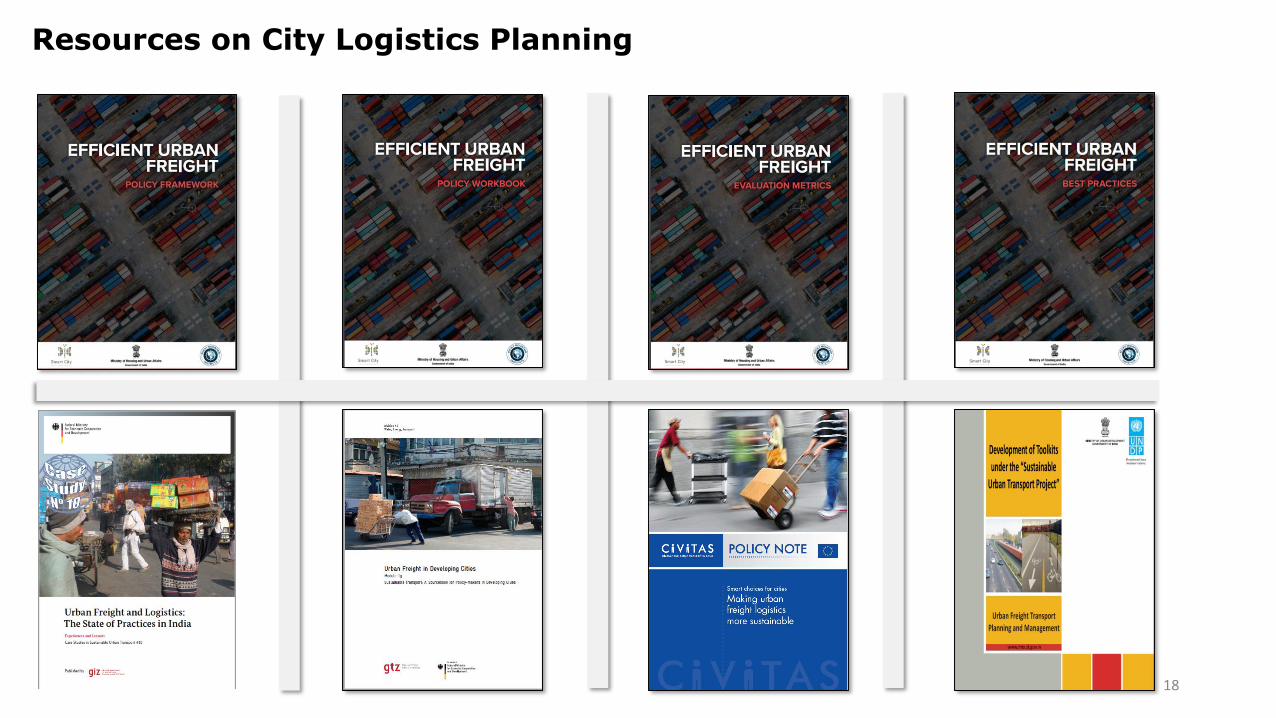
Resources on City Logistics Planning
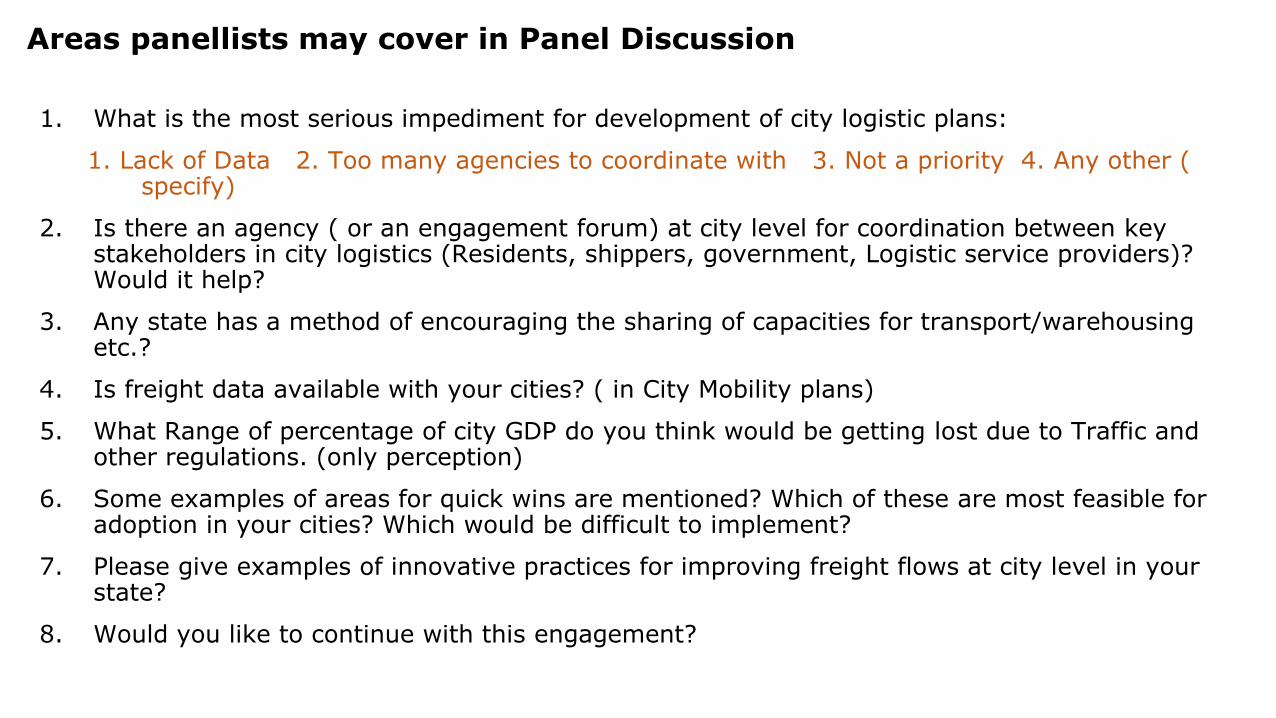
Areas panellists may cover in Panel Discussion
1. What is the most serious impediment for development of city logistic plans:
1. Lack of Data 2. Too many agencies to coordinate with 3. Not a priority 4. Any other ( specify)
2. Is there an agency ( or an engagement forum) at city level for coordination between key stakeholders in city logistics (Residents, shippers, government, Logistic service providers)? Would it help?
3. Any state has a method of encouraging the sharing of capacities for transport/warehousing etc.?
4. Is freight data available with your cities? ( in City Mobility plans)
5. What Range of percentage of city GDP do you think would be getting lost due to Traffic and other regulations. (only perception)
6. Some examples of areas for quick wins are mentioned? Which of these are most feasible for adoption in your cities? Which would be difficult to implement?
7. Please give examples of innovative practices for improving freight flows at city level in your state?
8. Would you like to continue with this engagement?
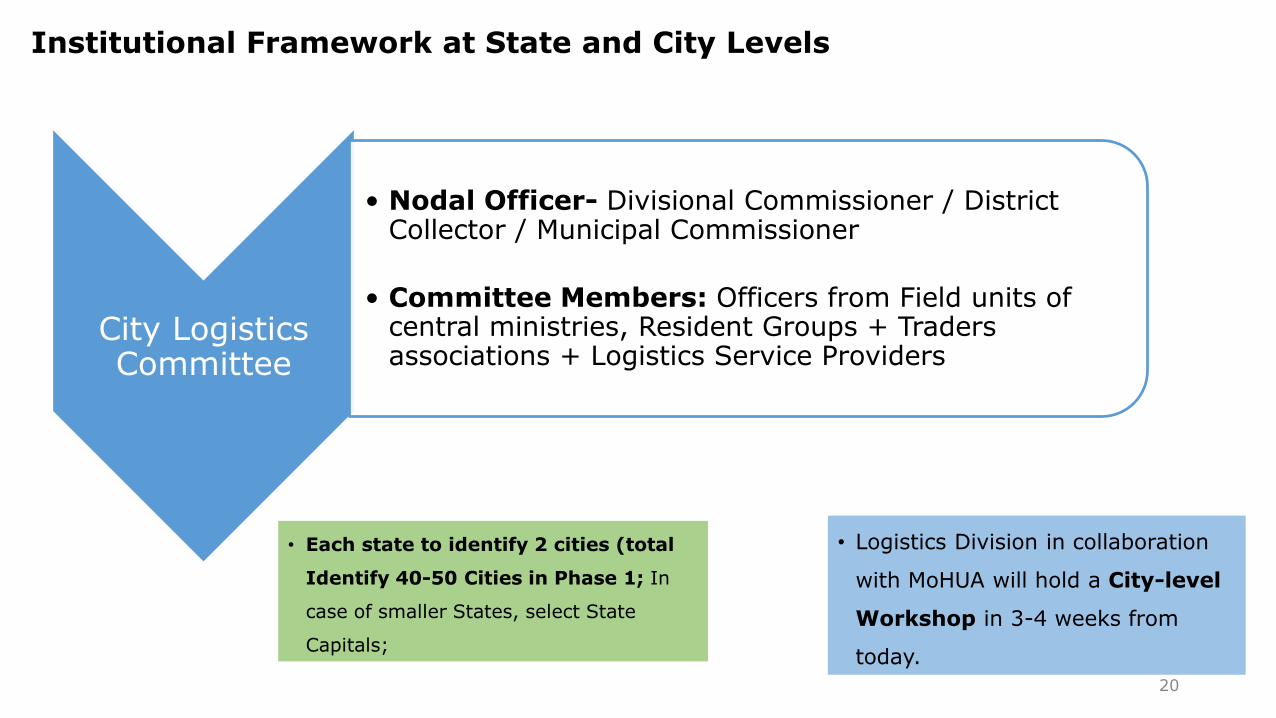
Institutional Framework at State and City Levels
20
• Each state to identify 2 cities (total
Identify 40-50 Cities in Phase 1; In
case of smaller States, select State
Capitals;
• Logistics Division in collaboration
with MoHUA will hold a City-level
Workshop in 3-4 weeks from
today.
City Logistics Committee
• Nodal Officer- Divisional Commissioner / District Collector / Municipal Commissioner
• Committee Members: Officers from Field units of central ministries, Resident Groups + Traders associations + Logistics Service Providers
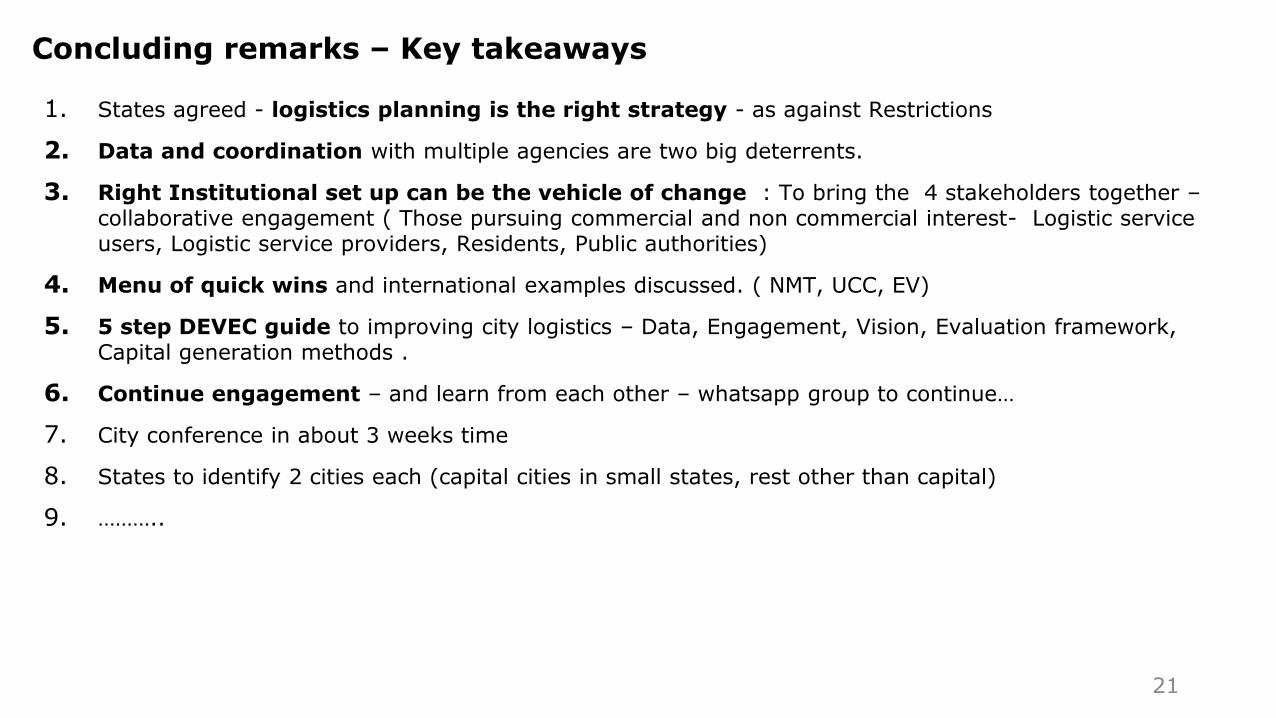
Concluding remarks – Key takeaways
1. States agreed - logistics planning is the right strategy - as against Restrictions
2. Data and coordination with multiple agencies are two big deterrents.
3. Right Institutional set up can be the vehicle of change : To bring the 4 stakeholders together –collaborative engagement ( Those pursuing commercial and non commercial interest- Logistic service users, Logistic service providers, Residents, Public authorities)
4. Menu of quick wins and international examples discussed. ( NMT, UCC, EV)
5. 5 step DEVEC guide to improving city logistics – Data, Engagement, Vision, Evaluation framework, Capital generation methods .
6. Continue engagement – and learn from each other – whatsapp group to continue…
7. City conference in about 3 weeks time
8. States to identify 2 cities each (capital cities in small states, rest other than capital)
9. ………..
21