Embed Size (px)
Citation preview
now part of
City and County of Hawaii ISWMPAdvisory Committee Presentation
Section 1: Existing ConditionsSection 5: Special Wastes
January 9, 2018
2
Section 1: Existing Conditions
3
Background
• The main components of the current solid waste management system include:– Solid waste collection– Convenience centers– Transfer stations– Energy recycling– Landfilling– Recycling and bioconversion (green waste)– Source reduction– Special waste management– Household hazardous waste (HHW) and electronic waste (e‐waste) management– Public education
4
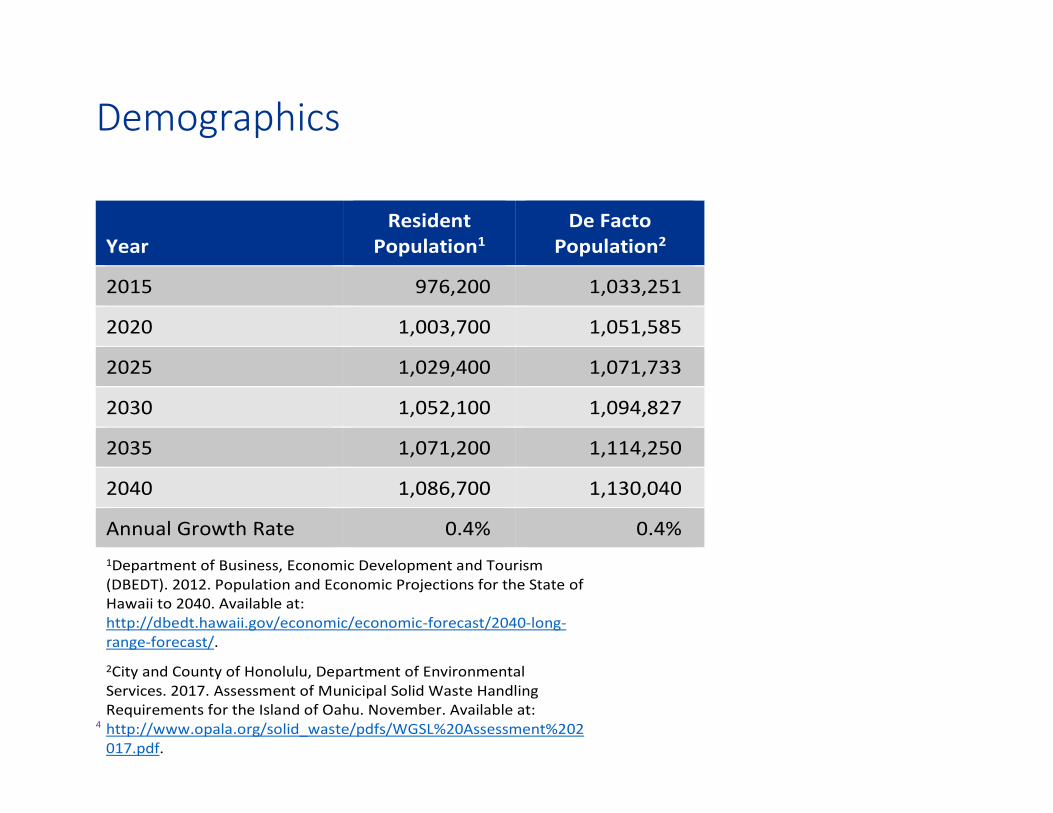
Demographics
Year Resident
Population1 De Facto
Population2
2015 976,200 1,033,251
2020 1,003,700 1,051,585
2025 1,029,400 1,071,733
2030 1,052,100 1,094,827
2035 1,071,200 1,114,250
2040 1,086,700 1,130,040
Annual Growth Rate 0.4% 0.4% 1Department of Business, Economic Development and Tourism (DBEDT). 2012. Population and Economic Projections for the State of Hawaii to 2040. Available at: http://dbedt.hawaii.gov/economic/economic‐forecast/2040‐long‐range‐forecast/.
2City and County of Honolulu, Department of Environmental Services. 2017. Assessment of Municipal Solid Waste Handling Requirements for the Island of Oahu. November. Available at: http://www.opala.org/solid_waste/pdfs/WGSL%20Assessment%202017.pdf.
5
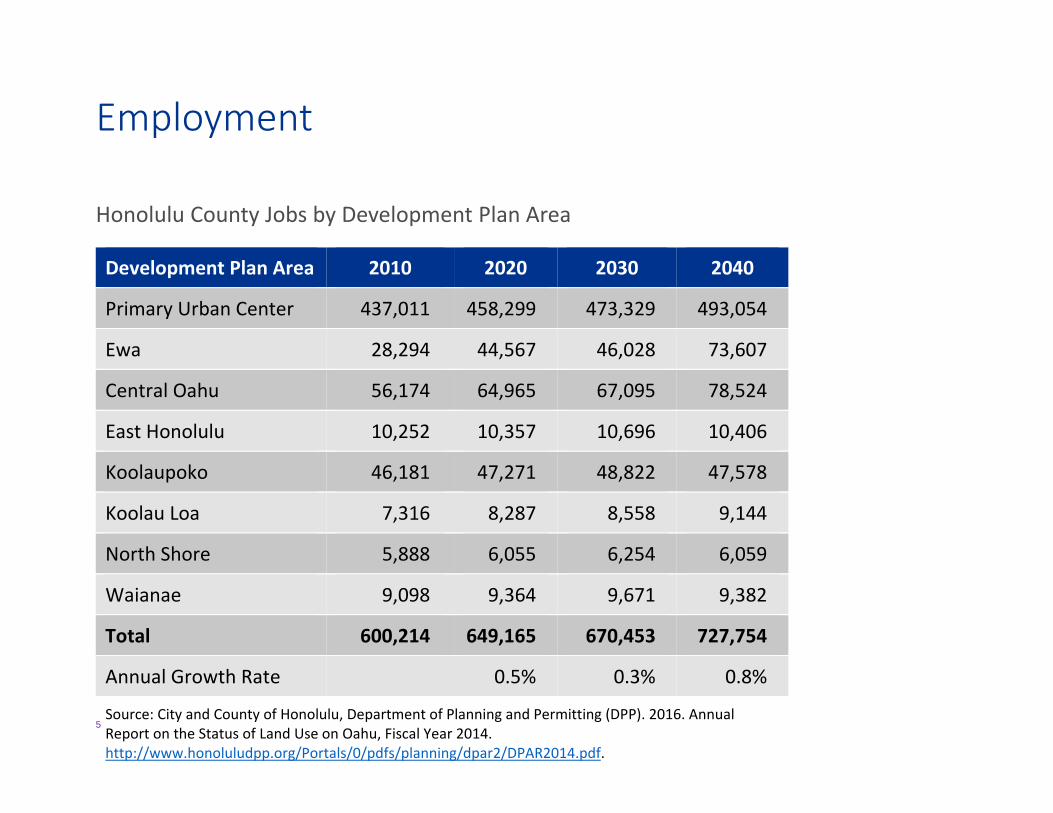
Employment
Honolulu County Jobs by Development Plan Area
Development Plan Area 2010 2020 2030 2040
Primary Urban Center 437,011 458,299 473,329 493,054
Ewa 28,294 44,567 46,028 73,607
Central Oahu 56,174 64,965 67,095 78,524
East Honolulu 10,252 10,357 10,696 10,406
Koolaupoko 46,181 47,271 48,822 47,578
Koolau Loa 7,316 8,287 8,558 9,144
North Shore 5,888 6,055 6,254 6,059
Waianae 9,098 9,364 9,671 9,382
Total 600,214 649,165 670,453 727,754
Annual Growth Rate 0.5% 0.3% 0.8%
Source: City and County of Honolulu, Department of Planning and Permitting (DPP). 2016. Annual Report on the Status of Land Use on Oahu, Fiscal Year 2014. http://www.honoluludpp.org/Portals/0/pdfs/planning/dpar2/DPAR2014.pdf.
6
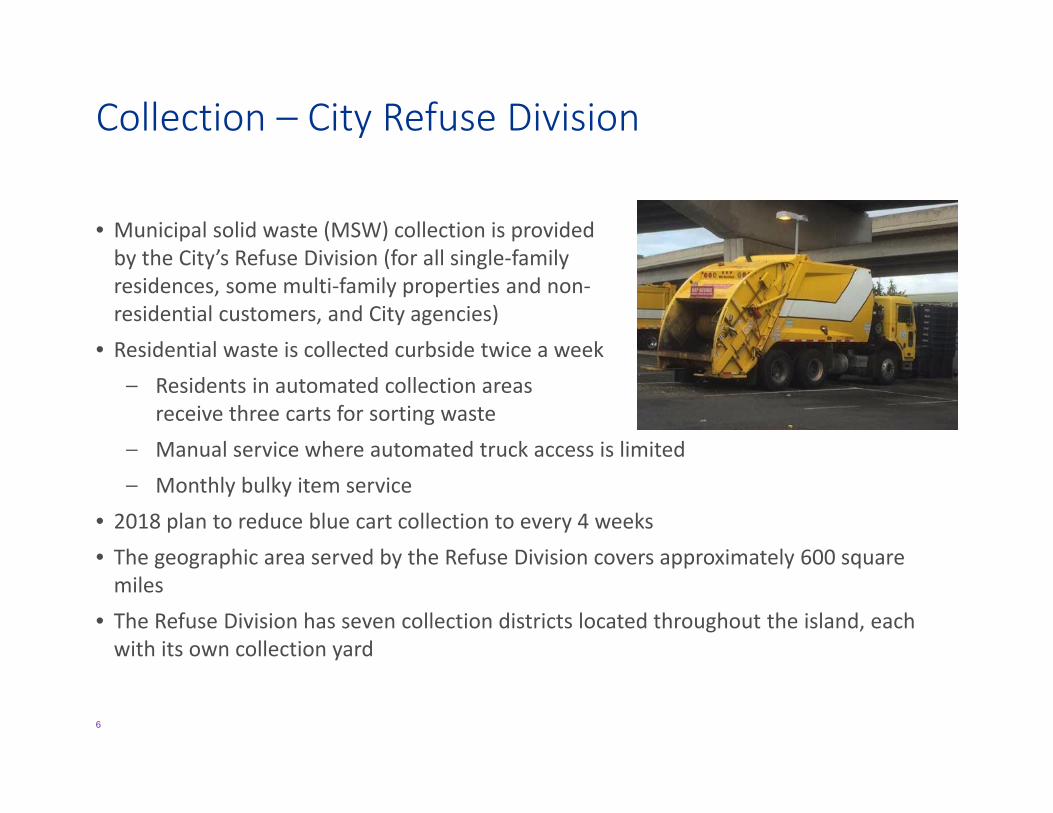
Collection – City Refuse Division
• Municipal solid waste (MSW) collection is provided by the City’s Refuse Division (for all single‐family residences, some multi‐family properties and non‐residential customers, and City agencies)
• Residential waste is collected curbside twice a week– Residents in automated collection areas
receive three carts for sorting waste – Manual service where automated truck access is limited– Monthly bulky item service
• 2018 plan to reduce blue cart collection to every 4 weeks• The geographic area served by the Refuse Division covers approximately 600 square miles
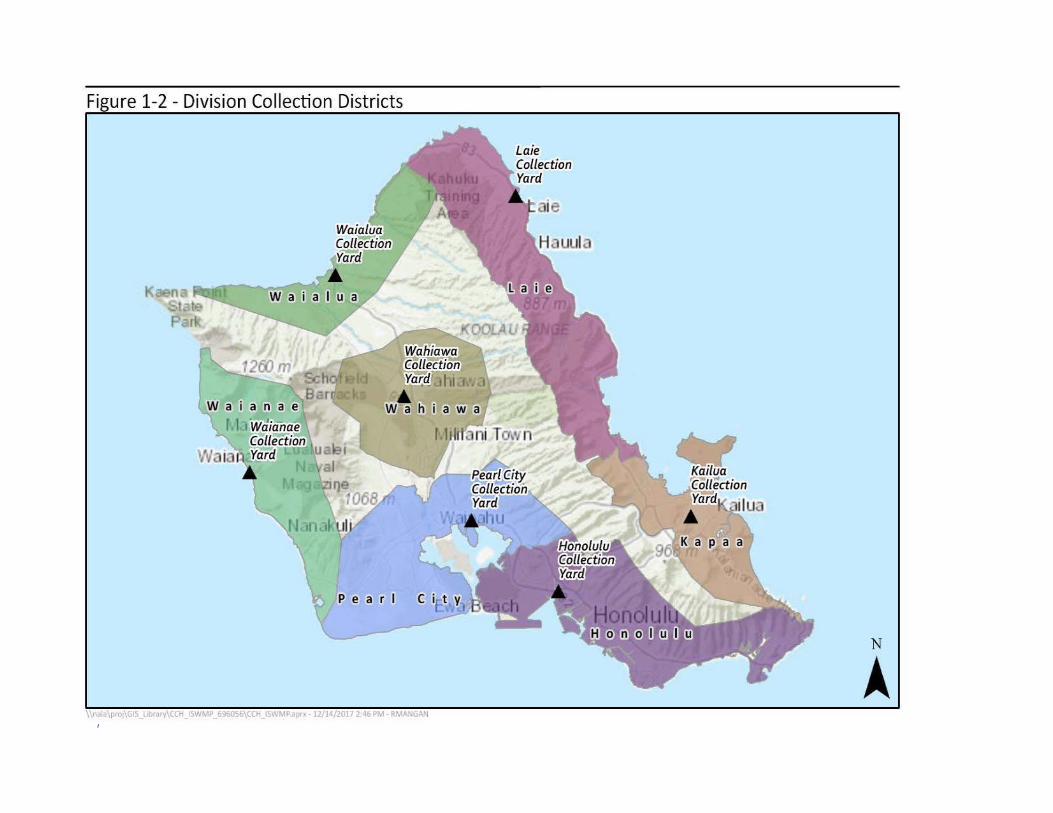
• The Refuse Division has seven collection districts located throughout the island, each with its own collection yard
7
8
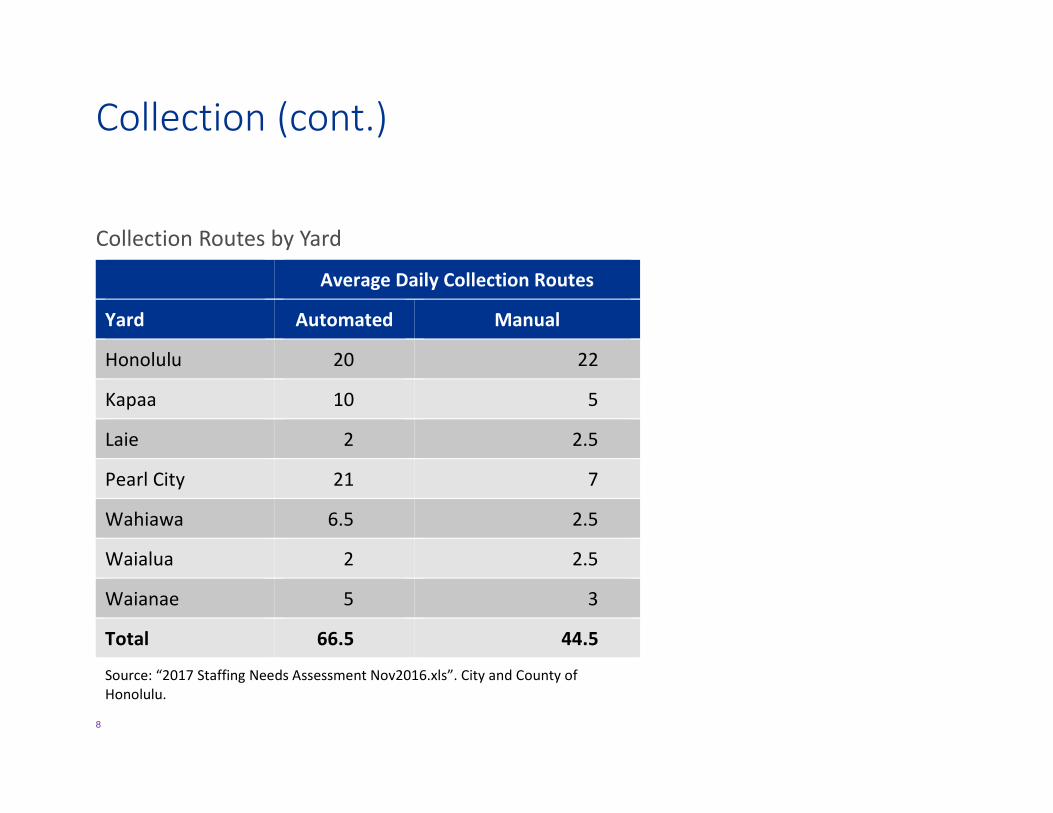
Collection (cont.)
Collection Routes by Yard
Average Daily Collection Routes
Yard Automated Manual
Honolulu 20 22
Kapaa 10 5
Laie 2 2.5
Pearl City 21 7
Wahiawa 6.5 2.5
Waialua 2 2.5
Waianae 5 3
Total 66.5 44.5
Source: “2017 Staffing Needs Assessment Nov2016.xls”. City and County of Honolulu.
9
Convenience Centers
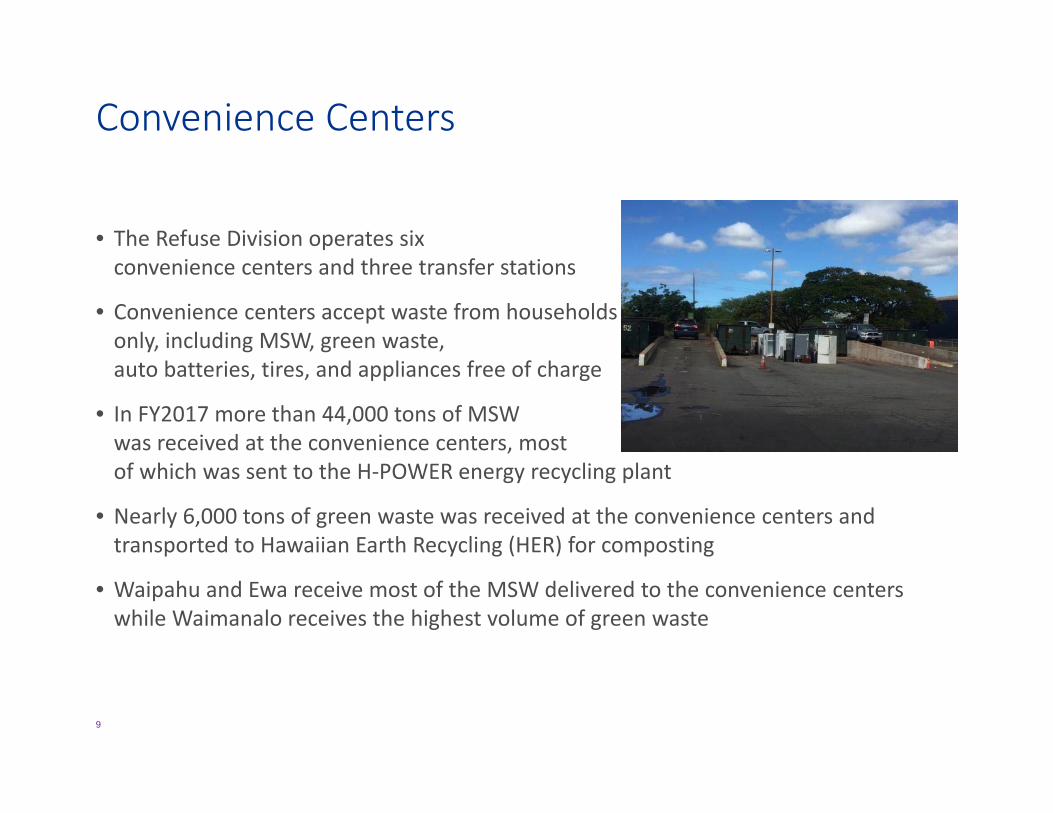
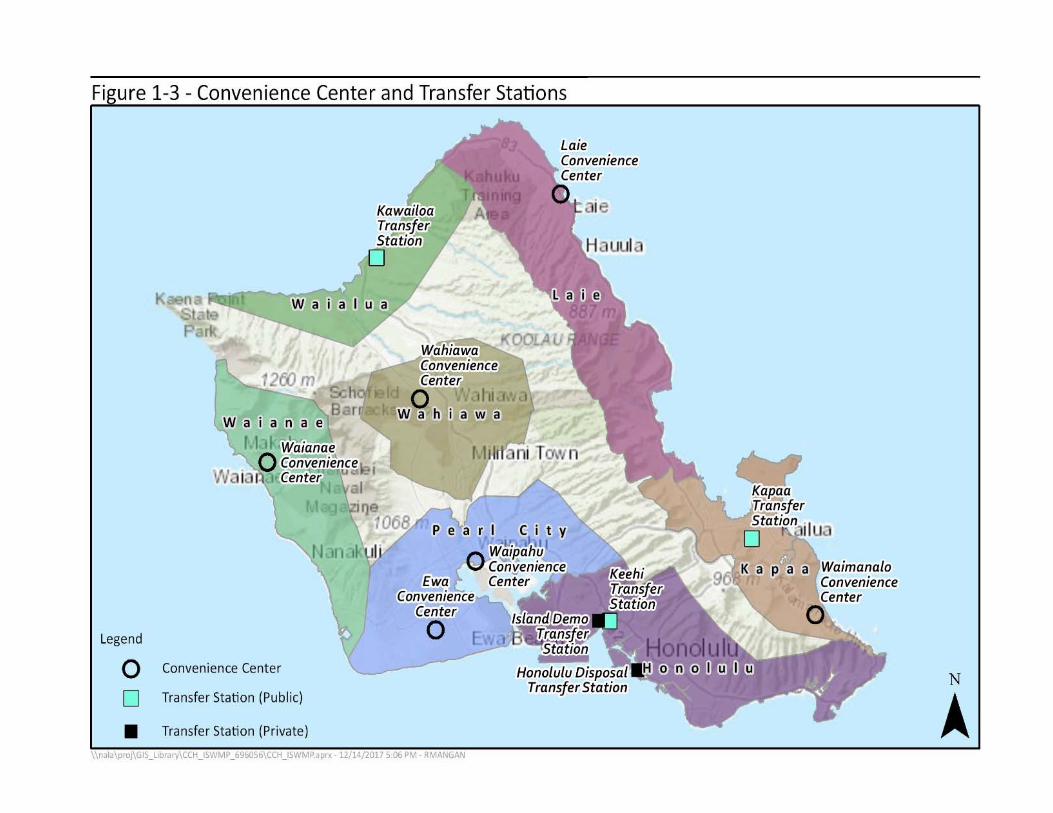
• The Refuse Division operates six convenience centers and three transfer stations
• Convenience centers accept waste from households only, including MSW, green waste, auto batteries, tires, and appliances free of charge
• In FY2017 more than 44,000 tons of MSWwas received at the convenience centers, most of which was sent to the H‐POWER energy recycling plant
• Nearly 6,000 tons of green waste was received at the convenience centers and transported to Hawaiian Earth Recycling (HER) for composting
• Waipahu and Ewa receive most of the MSW delivered to the convenience centers while Waimanalo receives the highest volume of green waste
10
11
Convenience Centers
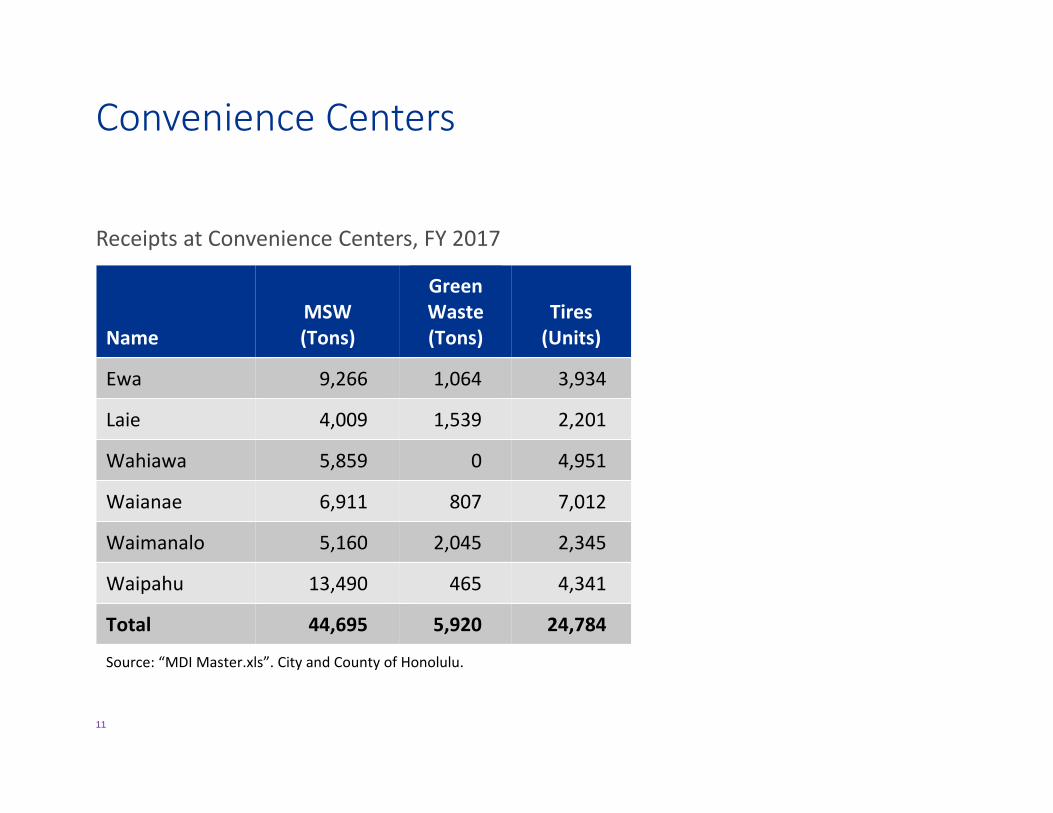
Receipts at Convenience Centers, FY 2017
Name MSW (Tons)
Green Waste (Tons)
Tires (Units)
Ewa 9,266 1,064 3,934
Laie 4,009 1,539 2,201
Wahiawa 5,859 0 4,951
Waianae 6,911 807 7,012
Waimanalo 5,160 2,045 2,345
Waipahu 13,490 465 4,341
Total 44,695 5,920 24,784
Source: “MDI Master.xls”. City and County of Honolulu.
12
Commercial Collection
• Commercial MSW is primarily collected by private haulers(a limited number of businesses are served by the Refuse Division)
• Private haulers compete to haul waste from these generators, including commercial and industrial facilities, multi‐unit residential properties, and military bases
• Most private haulers deliver their waste directly to the City disposal facilities at H‐POWER or Waimanalo Gulch Sanitary Landfill (WGSL)
• The City transfer stations receive a small number of commercial loads
• Construction and demolition (C&D) waste is not permitted at either H‐POWER or WGSL and is required to be taken to the PVT Landfill
• PVT Landfill also operates a recycling and materials recovery center
13
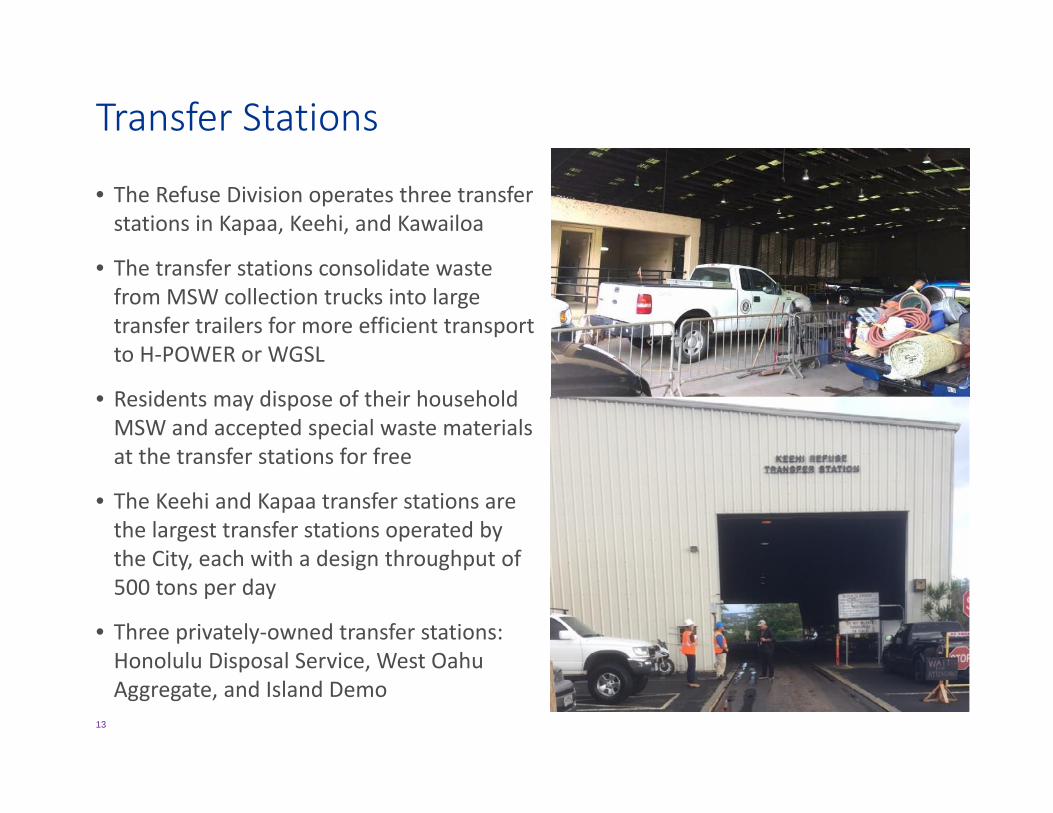
Transfer Stations
• The Refuse Division operates three transfer stations in Kapaa, Keehi, and Kawailoa
• The transfer stations consolidate waste from MSW collection trucks into large transfer trailers for more efficient transport to H‐POWER or WGSL
• Residents may dispose of their household MSW and accepted special waste materials at the transfer stations for free
• The Keehi and Kapaa transfer stations are the largest transfer stations operated by the City, each with a design throughput of 500 tons per day
• Three privately‐owned transfer stations: Honolulu Disposal Service, West Oahu Aggregate, and Island Demo
14
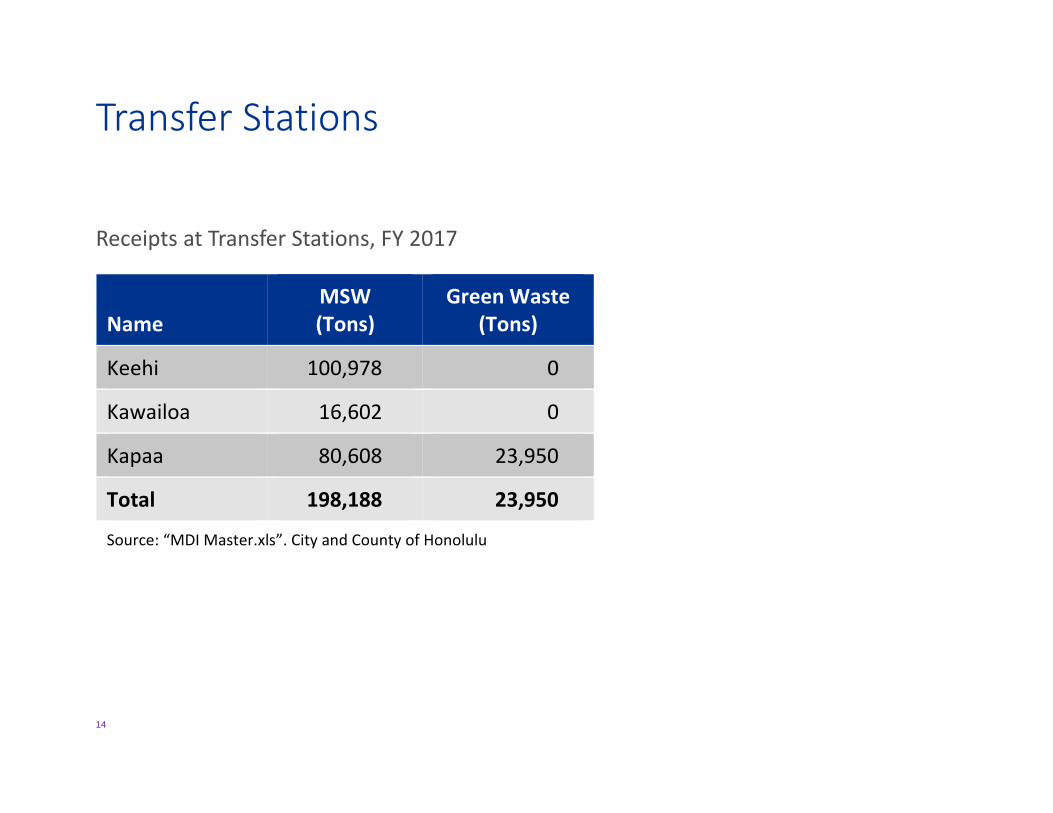
Transfer Stations
Receipts at Transfer Stations, FY 2017
Name MSW (Tons)
Green Waste (Tons)
Keehi 100,978 0
Kawailoa 16,602 0
Kapaa 80,608 23,950
Total 198,188 23,950
Source: “MDI Master.xls”. City and County of Honolulu
15
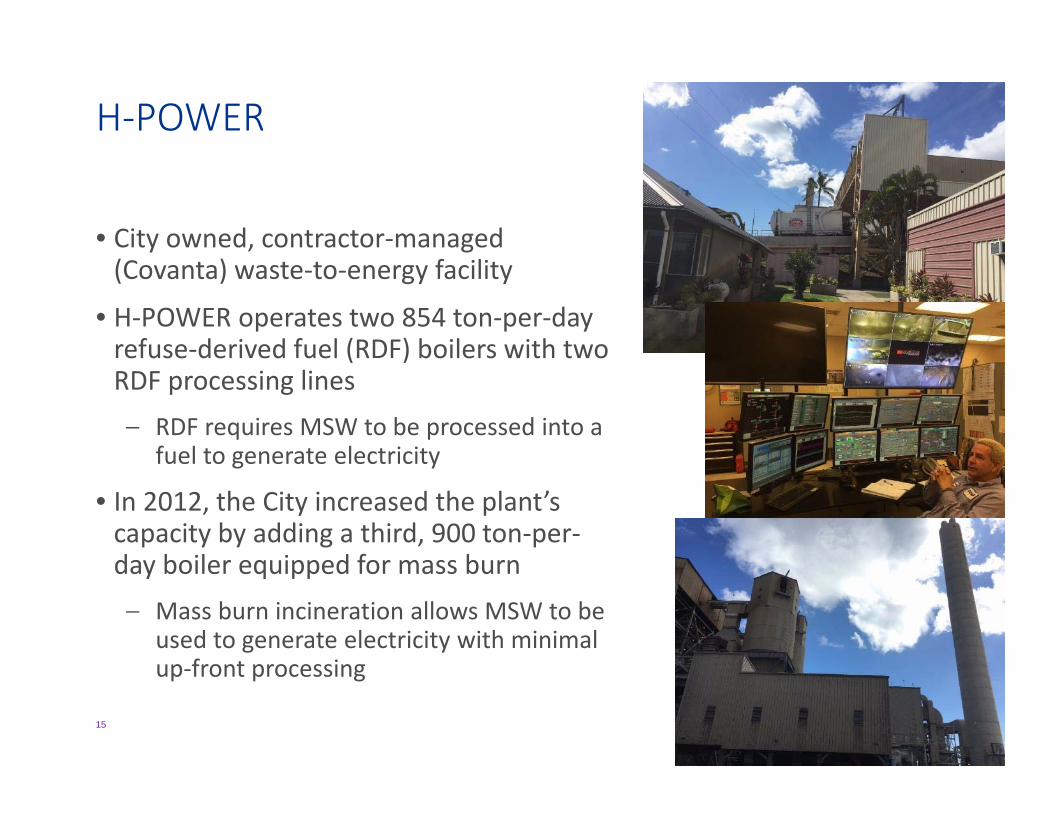
H‐POWER
• City owned, contractor‐managed (Covanta) waste‐to‐energy facility
• H‐POWER operates two 854 ton‐per‐day refuse‐derived fuel (RDF) boilers with two RDF processing lines– RDF requires MSW to be processed into a
fuel to generate electricity
• In 2012, the City increased the plant’s capacity by adding a third, 900 ton‐per‐day boiler equipped for mass burn– Mass burn incineration allows MSW to be
used to generate electricity with minimal up‐front processing
16
H‐POWER
• Accepts MSW, sewage sludge, certain types of tires and medical waste, bulky waste, and other special wastes
• Up to 90 percent of the volume of the MSW received at H‐POWER is diverted from WGSL and converted into renewable electric energy
• The City has a waste supply commitment with the facility operator to deliver 800,000 tons of solid waste per year to H‐POWER
• In FY 2017, over 734,000 tons of waste was combusted at H‐POWER to generate renewable energy
• The City has a power purchase agreement with Hawaiian Electric Company (HECO) to purchase the electricity generated at H‐POWER
17
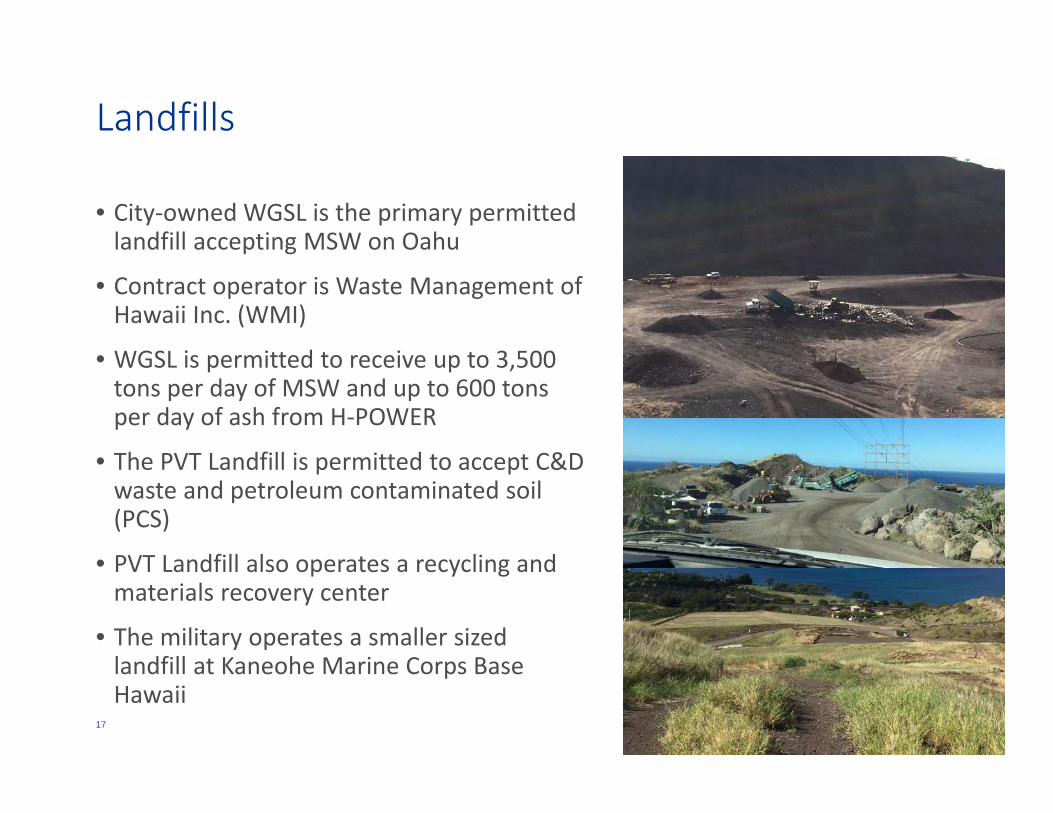
Landfills
• City‐owned WGSL is the primary permitted landfill accepting MSW on Oahu
• Contract operator is Waste Management of Hawaii Inc. (WMI)
• WGSL is permitted to receive up to 3,500 tons per day of MSW and up to 600 tons per day of ash from H‐POWER
• The PVT Landfill is permitted to accept C&Dwaste and petroleum contaminated soil (PCS)
• PVT Landfill also operates a recycling and materials recovery center
• The military operates a smaller sized landfill at Kaneohe Marine Corps Base Hawaii
18
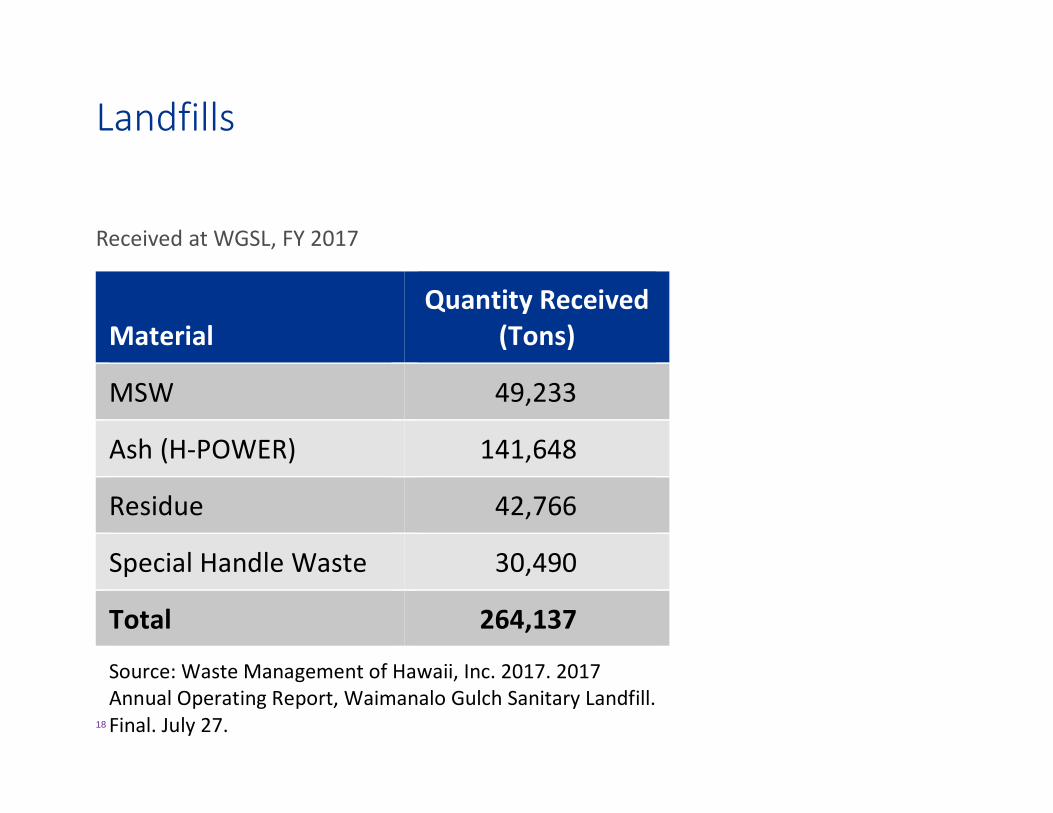
Landfills
Received at WGSL, FY 2017
Material Quantity Received
(Tons)
MSW 49,233
Ash (H‐POWER) 141,648
Residue 42,766
Special Handle Waste 30,490
Total 264,137
Source: Waste Management of Hawaii, Inc. 2017. 2017 Annual Operating Report, Waimanalo Gulch Sanitary Landfill. Final. July 27.
19
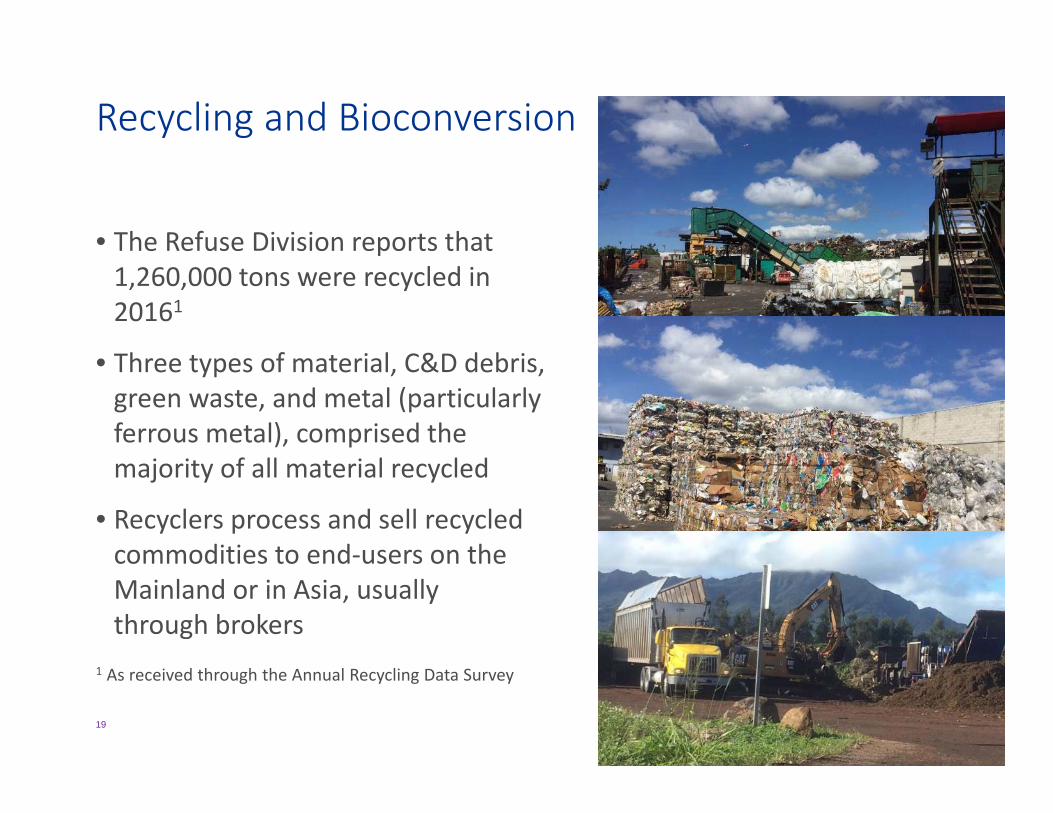
Recycling and Bioconversion
• The Refuse Division reports that 1,260,000 tons were recycled in 20161
• Three types of material, C&D debris, green waste, and metal (particularly ferrous metal), comprised the majority of all material recycled
• Recyclers process and sell recycled commodities to end‐users on the Mainland or in Asia, usually through brokers
1 As received through the Annual Recycling Data Survey
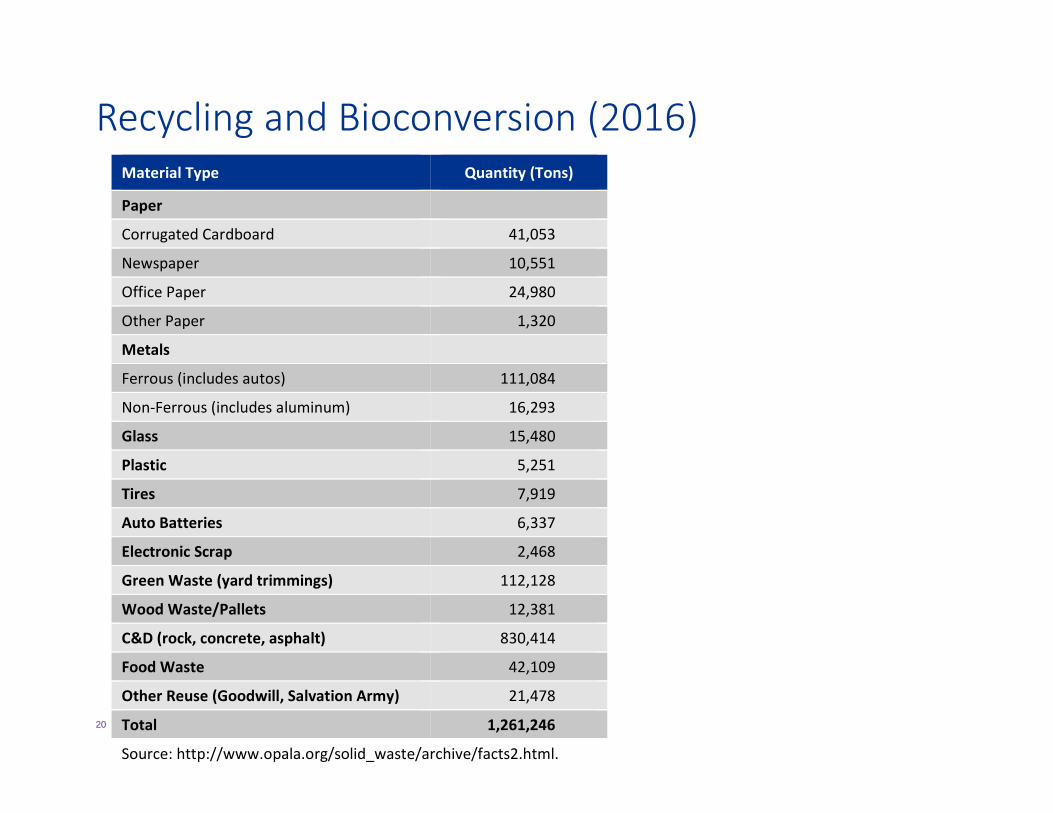
20
Recycling and Bioconversion (2016)Material Type Quantity (Tons)
Paper
Corrugated Cardboard 41,053
Newspaper 10,551
Office Paper 24,980
Other Paper 1,320
Metals
Ferrous (includes autos) 111,084
Non‐Ferrous (includes aluminum) 16,293
Glass 15,480
Plastic 5,251
Tires 7,919
Auto Batteries 6,337
Electronic Scrap 2,468
Green Waste (yard trimmings) 112,128
Wood Waste/Pallets 12,381
C&D (rock, concrete, asphalt) 830,414
Food Waste 42,109
Other Reuse (Goodwill, Salvation Army) 21,478
Total 1,261,246
Source: http://www.opala.org/solid_waste/archive/facts2.html.
21
Recycling
• City implemented recycling programs have contributed to an increase in recyclables from 74,000 tons in 1988 to over 1.2 million tons in 2016
• City recovery programs that have contributed to this increase include:– The curbside mixed recycling collection program– The curbside green waste collection program– The curbside island‐wide bulky item collection program
• Recycling Collection Programs
– Curbside recycling for most single‐family households– Most multi‐family households on the island are serviced by private waste haulers
22
Recycling cont.
• Advance Disposal Fee on Glass– Currently, there are no public recycling options for non‐deposit glass other than what is
collected in the blue carts and licensed recycler’s commercial accounts
• Deposit Beverage Container Program (HI5)– A 5‐cent deposit per beverage container (DBC) is charged for the purchase of glass,
aluminum, and plastic containers defined under the law– A 1‐cent to 1.5‐cent non‐refundable container fee is also assessed to support the costs
of recycling and State program administration– DBCs are redeemed at privately‐operated Redemption Centers and transported to
recycling facilities for processing and marketing
• Commercial Recycling– The recycling of “targeted” materials is required by law for most businesses and
government agencies– The City’s recycling ordinances identify the types of businesses that are required to
implement a recycling system and which materials are targeted
23
Bioconversion
• Green Waste – Green waste is one of the largest components of the waste stream – diversion can
have an impact on landfill life and recycling goals– HER composts residential green waste, commercial green waste, and food waste
at its main facility in Wahiawa – HER accepts green waste generated by commercial and government agencies for a
fee
• Food Waste and Biosolids– The City has a mandatory recycling ordinance for large commercial food waste
generators, such as restaurants, grocery stores, hotels, and hospitals– Food waste is recycled through a mix of technologies–food waste can be used as
animal feed, composted, and converted into biodiesel for use in vehicles– Some biosolids (wastewater treatment plants sewage sludge) are also processed
and reused
24
Source Reduction and Reuse
• Source reduction is any action that causes a net reduction in the generation of solid waste before the waste is collected
• Example source reduction programs include:– Replacing disposable materials and products with reusable ones– Reducing packaging– Reusing materials ranging from paper and containers to clothes
• Reusing products is part of Hawaii's heritage and contributes to saving landfill capacity– A total of 21,500 tons of material was reused on Oahu in 2016
• Some activities that contribute to the tonnage diverted for source reduction or reuse include thrift stores, Re‐Use Hawaii, ReStore, Grasscycling, and the City’s plastic bag ban
25
Household Hazardous Waste and Electronic Waste
• HHW wastes may pose a substantial known or potential hazard to human health or the environment when improperly treated or disposed and include automotive products, cleaners, pesticides, and paints
• The City website has guidance for waste prevention and safe disposal
• Many types of HHW can be safely disposed of in the City’s existing refuse and sewage systems per the City’s recommended method
• Used electronics or “e‐waste” includes discarded computers, cell phones, televisions and other electronic products
• The City has a disposal ban on electronics for commercial/government generators
• Home electronics are exempted from the ban and can be disposed of with regular household refuse or bulky collection
26
Public Education
• The City maintains an active and innovative solid waste management Education and Awareness program
• The cornerstone of this program is the City’s website, www.opala.org
• Other programs and educational materials used by the City include:– WasteLine, an electronic newsletter– Videos– School Teacher Kits and Discover Recycling Events
27
Section 1: Discussion
28
Section 5: Special Wastes• Asbestos• Used Motor Oil• Petroleum‐Contaminated Soil• Lead Acid Batteries• Municipal Waste Combustion Ash• Sewage Sludge• Agricultural and Farm Generated Waste• Medical Wastes• Tires• White Goods• Derelict Vehicles
29
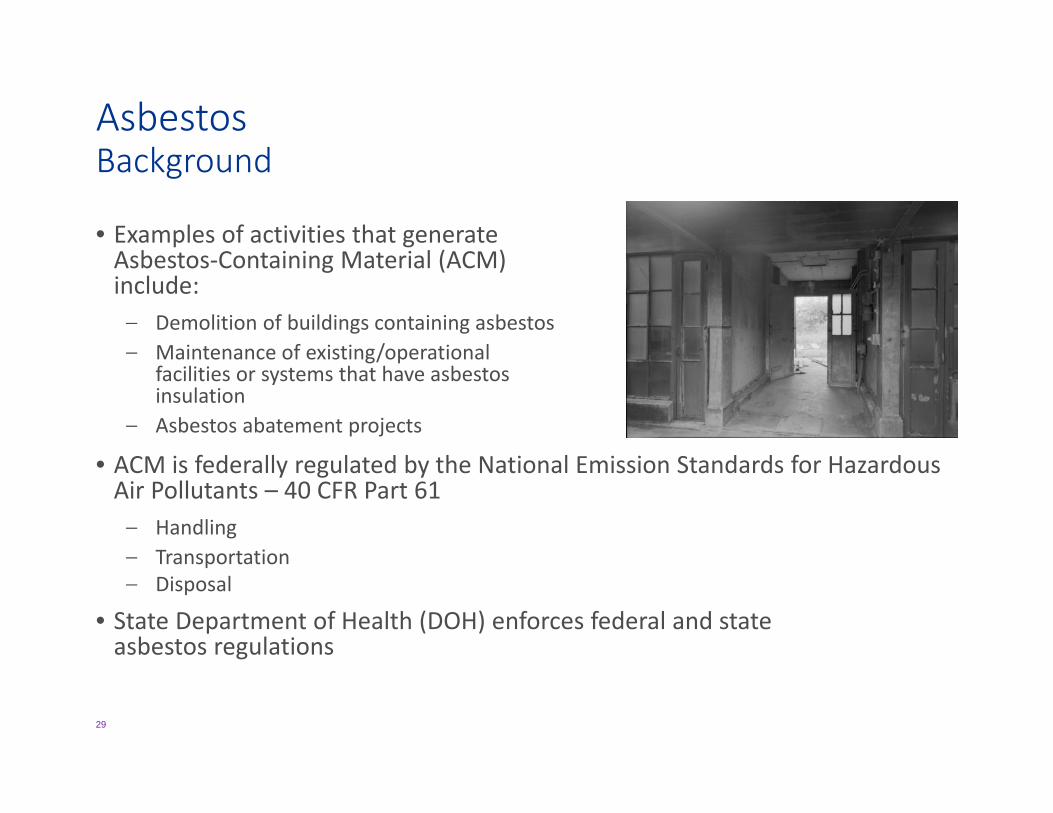
AsbestosBackground
• Examples of activities that generate Asbestos‐Containing Material (ACM) include:– Demolition of buildings containing asbestos– Maintenance of existing/operational
facilities or systems that have asbestos insulation
– Asbestos abatement projects
• ACM is federally regulated by the National Emission Standards for Hazardous Air Pollutants – 40 CFR Part 61– Handling– Transportation– Disposal
• State Department of Health (DOH) enforces federal and state asbestos regulations
30
AsbestosExisting Programs, Strategies
Existing Programs• PVT Landfill accepts ACM, with various requirements• WGSL discontinued accepting ACM in early 2017
• H‐POWER does not accept C&D debris – thus no significant quantities of ACM are received at the facility
Strategies
• No new strategies are recommended for managing ACM
31
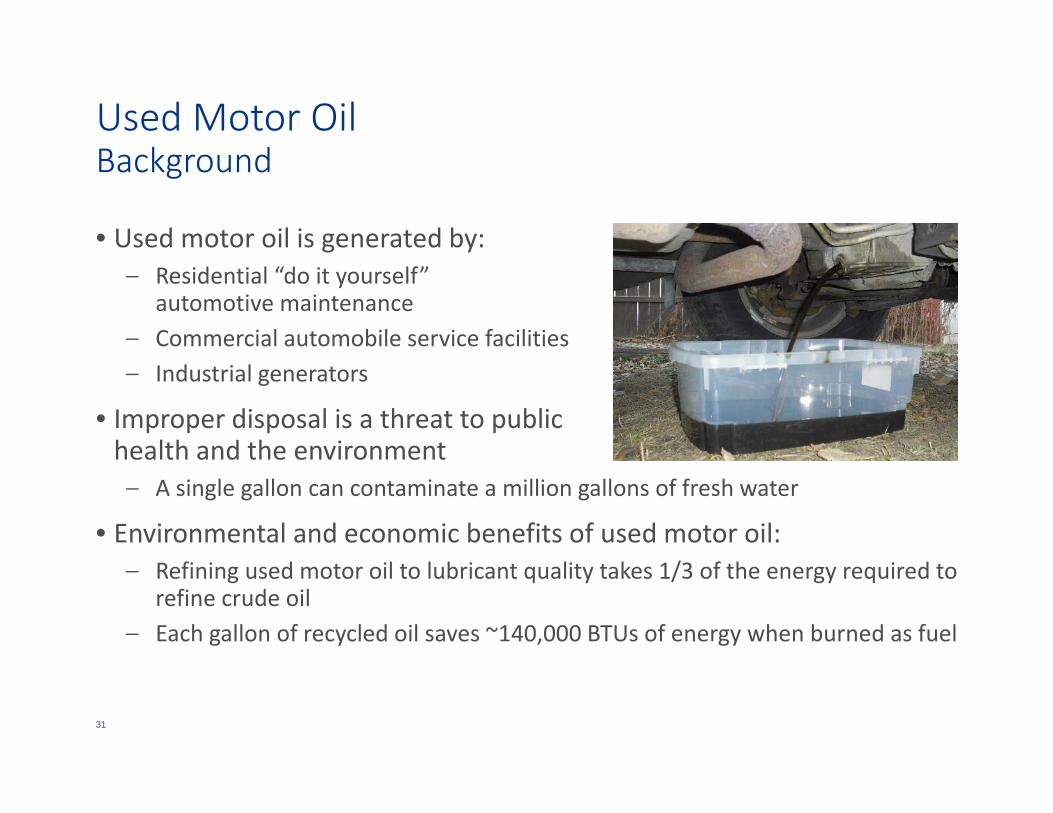
Used Motor OilBackground
• Used motor oil is generated by:– Residential “do it yourself”
automotive maintenance– Commercial automobile service facilities– Industrial generators
• Improper disposal is a threat to public health and the environment– A single gallon can contaminate a million gallons of fresh water
• Environmental and economic benefits of used motor oil:– Refining used motor oil to lubricant quality takes 1/3 of the energy required to
refine crude oil– Each gallon of recycled oil saves ~140,000 BTUs of energy when burned as fuel
32
Used Motor OilExisting Programs, Strategies
Existing Programs• City residents can dispose of used motor oil with their household trash (if sealed with absorbent material)
• Commercial generators must handle and dispose of used oil in accordance with EPA and DOH guidelines
Strategies
• The City will continue to accept used motor oil from residents and promote proper handling
• Commercial generators will remain compliant with EPA and DOHguidelines
33
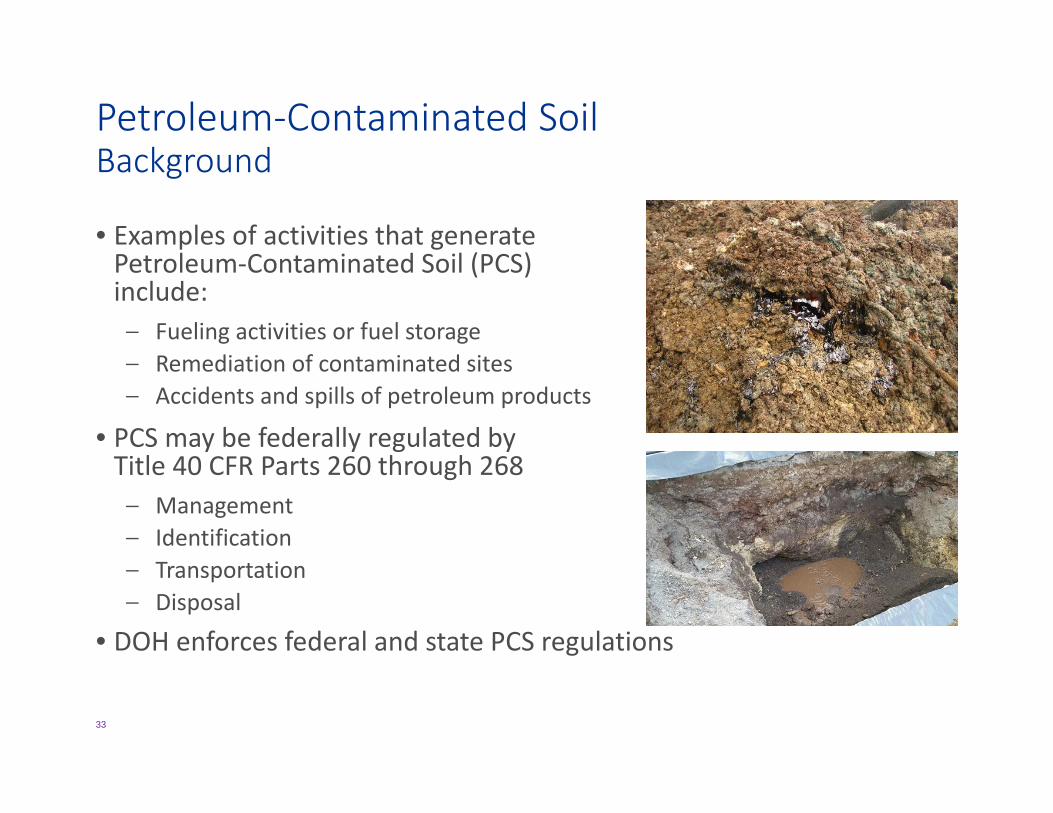
Petroleum‐Contaminated SoilBackground
• Examples of activities that generate Petroleum‐Contaminated Soil (PCS)include:– Fueling activities or fuel storage– Remediation of contaminated sites– Accidents and spills of petroleum products
• PCS may be federally regulated by Title 40 CFR Parts 260 through 268– Management– Identification– Transportation– Disposal
• DOH enforces federal and state PCS regulations
34
Petroleum‐Contaminated SoilExisting Programs, Strategies
Existing Programs• PVT Landfill accepts PCS, with various requirements (similar to ACM)
Strategies
• No new strategies are recommended for managing PCS
35
Lead Acid BatteriesBackground
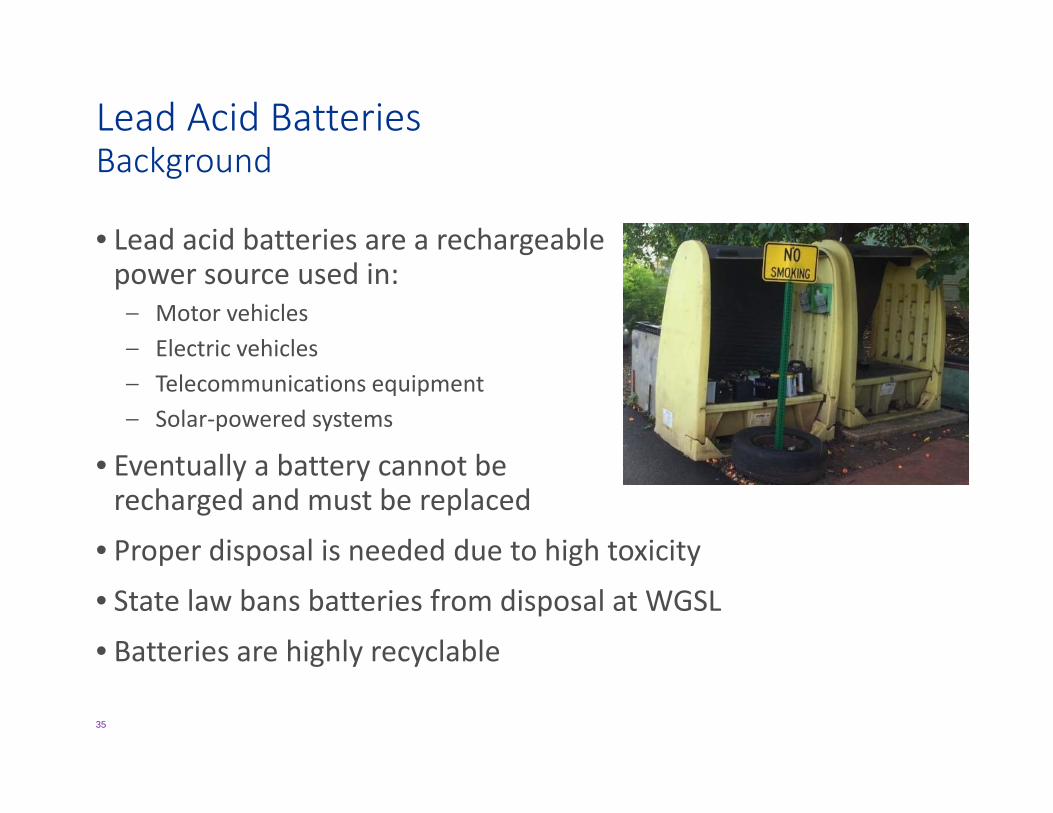
• Lead acid batteries are a rechargeable power source used in:– Motor vehicles– Electric vehicles– Telecommunications equipment– Solar‐powered systems
• Eventually a battery cannot be recharged and must be replaced
• Proper disposal is needed due to high toxicity• State law bans batteries from disposal at WGSL
• Batteries are highly recyclable
36
Lead Acid BatteriesExisting Programs, Strategies
Existing Programs• Disposal of old auto batteries
– Residents can leave old auto batteries at dealer, service station, or auto repair shop after purchase of new one
– Residents may take batteries to City convenience center or transfer station
• In FY 2017, over 2,100 lead acid batteries were recycled using City services
Strategies• Continue to collect batteries at transfer stations and convenience
centers• Continue to contract for battery recycling• Continue to promote existing infrastructure for battery recycling
37
MSW Combustion AshBackground, Existing Programs
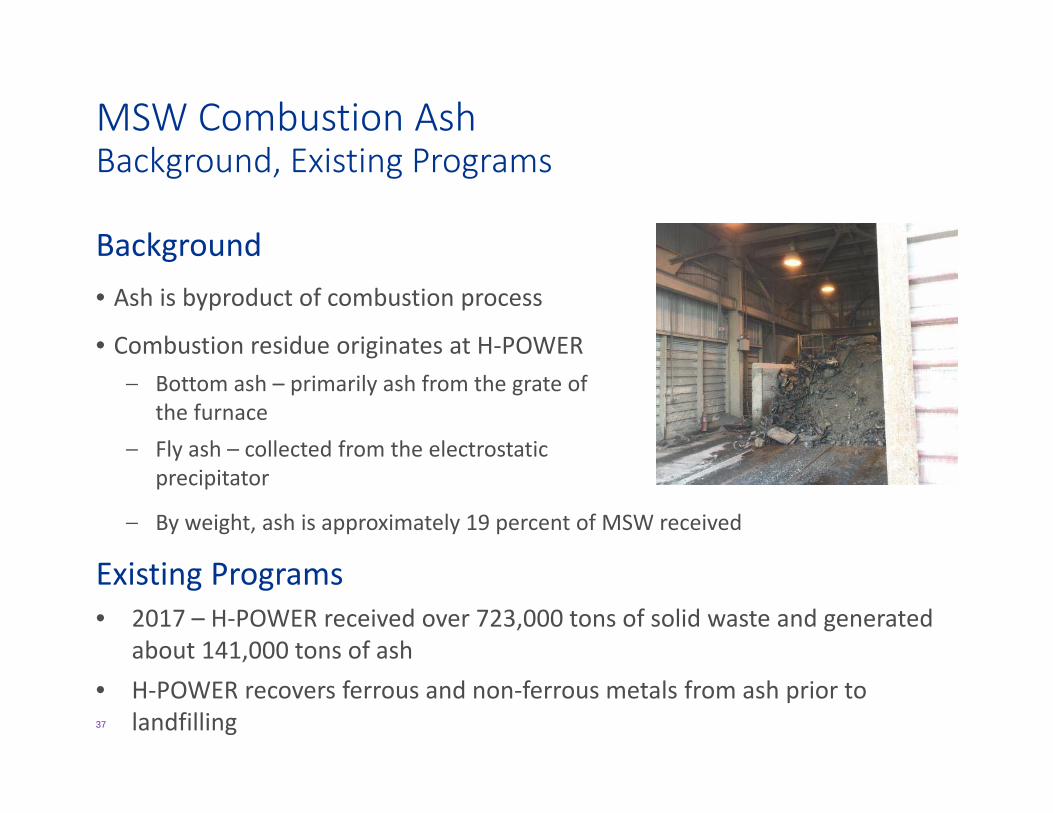
Background• Ash is byproduct of combustion process
• Combustion residue originates at H‐POWER – Bottom ash – primarily ash from the grate of
the furnace– Fly ash – collected from the electrostatic
precipitator
– By weight, ash is approximately 19 percent of MSW received
Existing Programs • 2017 – H‐POWER received over 723,000 tons of solid waste and generated
about 141,000 tons of ash• H‐POWER recovers ferrous and non‐ferrous metals from ash prior to
landfilling
38
MSW Combustion AshStrategies
• The City is working on programs to divert ash from landfill disposal
• In 2018, the City plans to solicit proposals for a beneficial reuse technologies project for ash
• Ash would be managed at new refuse facility being constructed in Campbell Industrial Park, Kapolei
• WGSL ‐ permit modifications are under development
– To balance the MSW and ash portions of the landfill to maximize available capacity
39
Sewage SludgeBackground
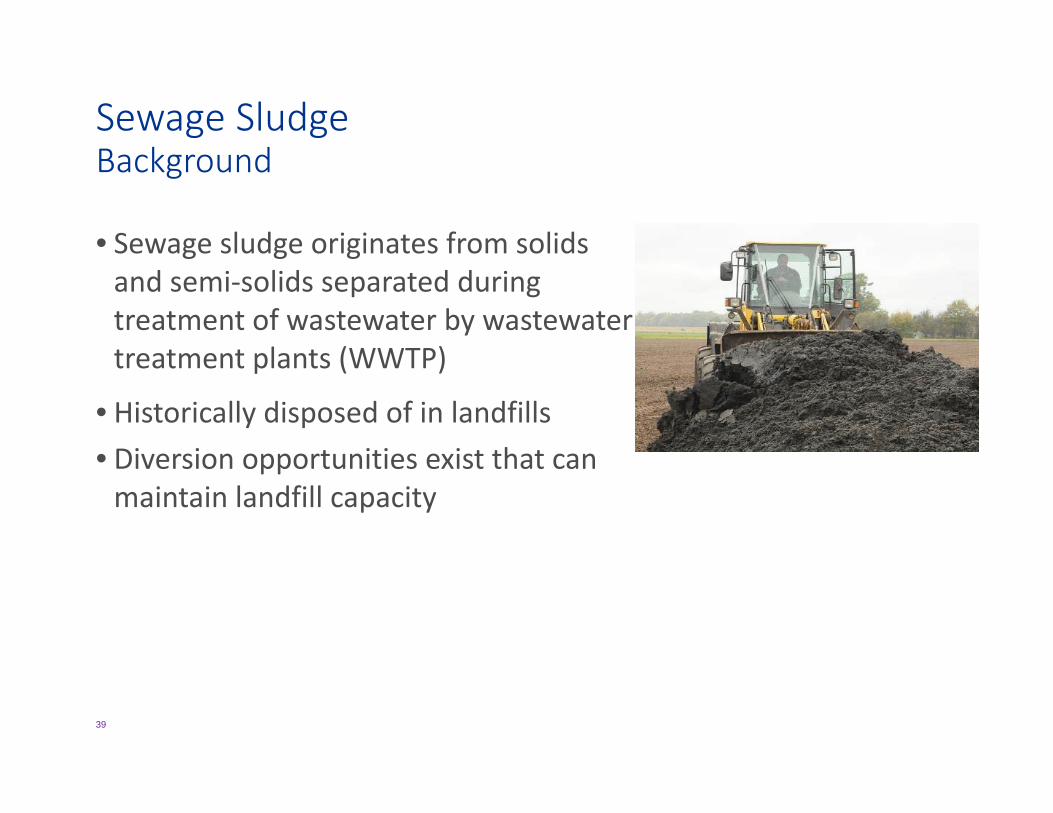
• Sewage sludge originates from solids and semi‐solids separated duringtreatment of wastewater by wastewatertreatment plants (WWTP)
• Historically disposed of in landfills• Diversion opportunities exist that can maintain landfill capacity
40
Sewage SludgeExisting Programs, Strategies
Existing Programs• Derived mainly from WWTPs that are owned/operated by the City and military installations
• Prior to 2015, most disposed of at WGSL with some exceptions:– The City contracts with Synagro to digest, dewater, and heat‐dry sewage
sludge from the Sand Island WWTP
– Military WWTP sludge sent to Navy Biosolids Treatment Facility, Kalaeloa
• After 2015, sludge diverted from WGSL to H‐POWER– In FY2017, H‐POWER received approximately 14,430 tons of sludge
Strategies• Divert sewage sludge from Hawaii Kai WWTP to H‐POWER• Convert WWTP sludge to biosolids for use as a fertilizer; H‐POWER as backup
41
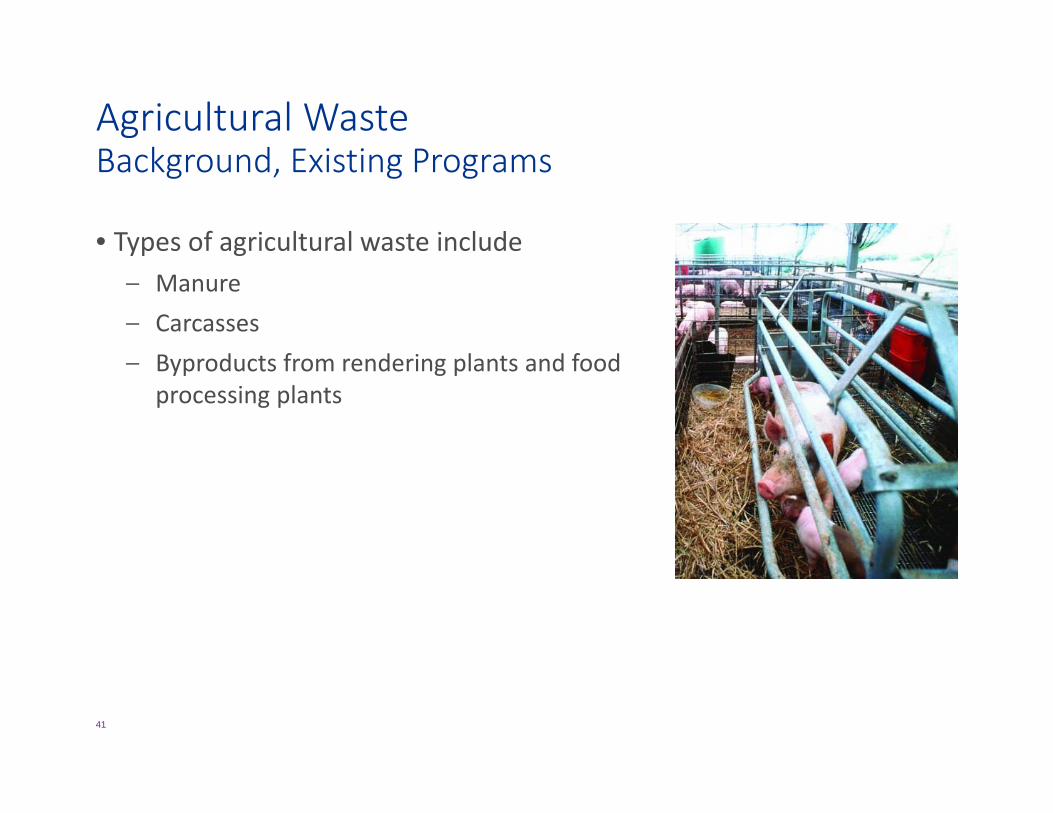
Agricultural WasteBackground, Existing Programs
• Types of agricultural waste include – Manure – Carcasses– Byproducts from rendering plants and food
processing plants
42
Agricultural Waste
Existing Programs • Most waste on Oahu is processed through onsite bioconversion or other means– Very little waste enters the City’s municipal waste stream
• WGSL accepts animal carcasses and rendering plant byproducts by appointment
Strategies• No new programs recommended
– Majority of waste is handled by the private sector– City and Covanta will explore the potential for handing animal carcasses
and rendering plant byproducts at H‐POWER
43
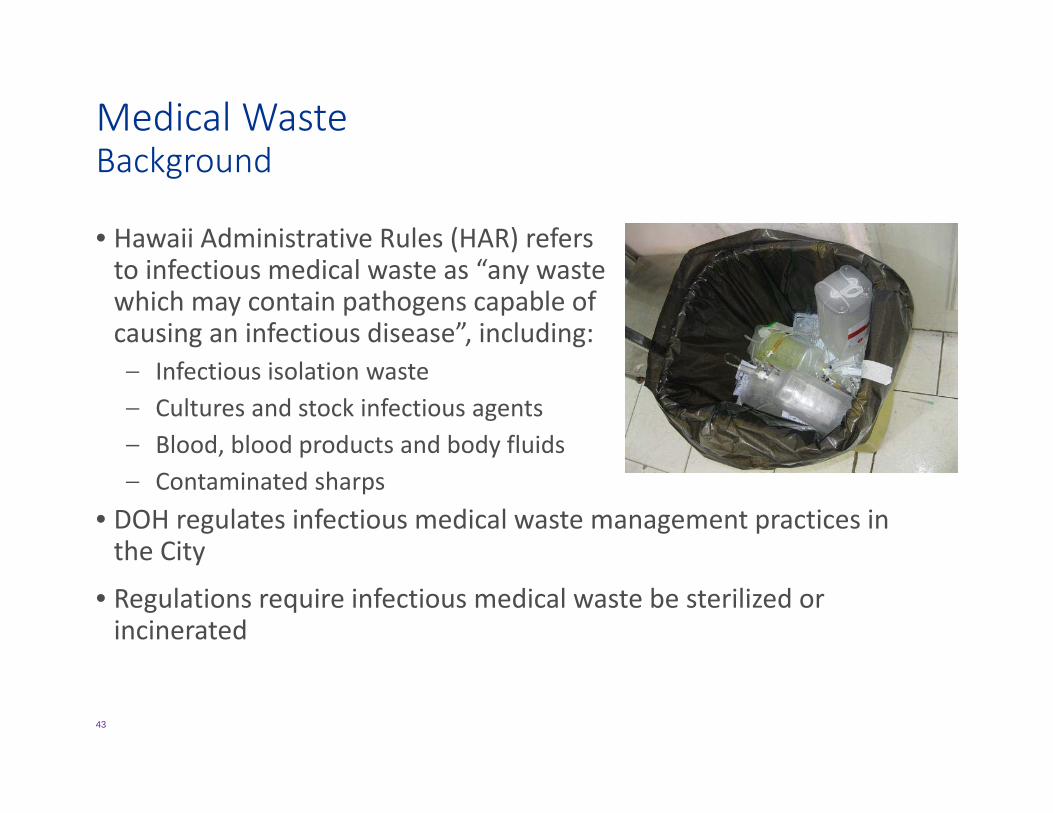
Medical WasteBackground
• Hawaii Administrative Rules (HAR) refers to infectious medical waste as “any waste which may contain pathogens capable of causing an infectious disease”, including:– Infectious isolation waste– Cultures and stock infectious agents– Blood, blood products and body fluids– Contaminated sharps
• DOH regulates infectious medical waste management practices in the City
• Regulations require infectious medical waste be sterilized or incinerated
44
Medical WasteExisting Programs, Strategies
Existing Programs
• Two private firms use an autoclave system to manage medical waste, and a pyrolysis process for pathological waste
• The City works directly with generators to direct autoclaved medical wastes to H‐POWER; treated sharps to WGSL
• Residents can dispose of medical sharps in their trash cans
Strategies
• No additional strategies have been identified: medical waste is handled adequately by the private sector
• Continue working with generators and processors to investigate methods to divert sharps from disposal
45
Scrap TiresBackground, Existing Programs
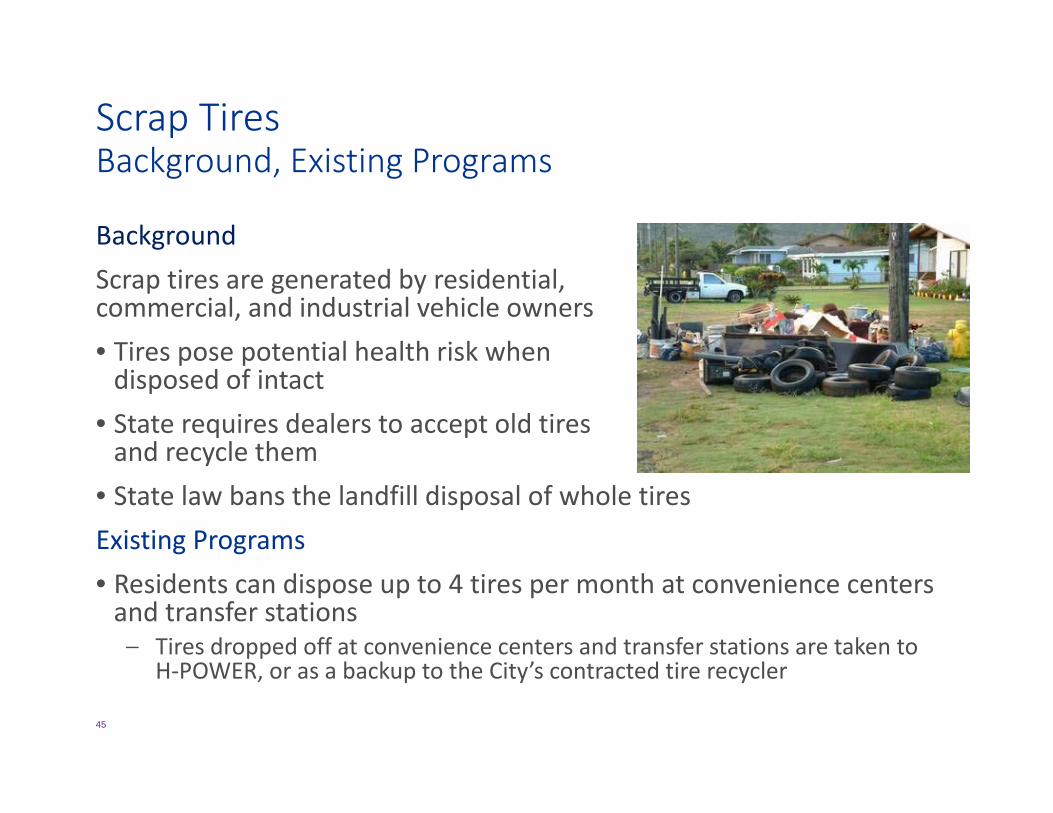
BackgroundScrap tires are generated by residential, commercial, and industrial vehicle owners• Tires pose potential health risk when disposed of intact
• State requires dealers to accept old tires and recycle them
• State law bans the landfill disposal of whole tiresExisting Programs • Residents can dispose up to 4 tires per month at convenience centers and transfer stations– Tires dropped off at convenience centers and transfer stations are taken to
H‐POWER, or as a backup to the City’s contracted tire recycler
46
Scrap TiresExisting Programs, Strategies
Existing Programs cont. • In 2014, H‐POWER received DOH variance to accept and process tires collected by Refuse Division
• In 2017, about 42,000 tires combusted at H‐POWER• Commercial and government entities are required to properly recycle and dispose of tires
Strategies • Work with State regulators to send all City government‐derived tires to H‐POWER
• Trade‐off between emissions requirement and shipping tires to Mainland for tire‐derived‐fuel
47
White GoodsBackground
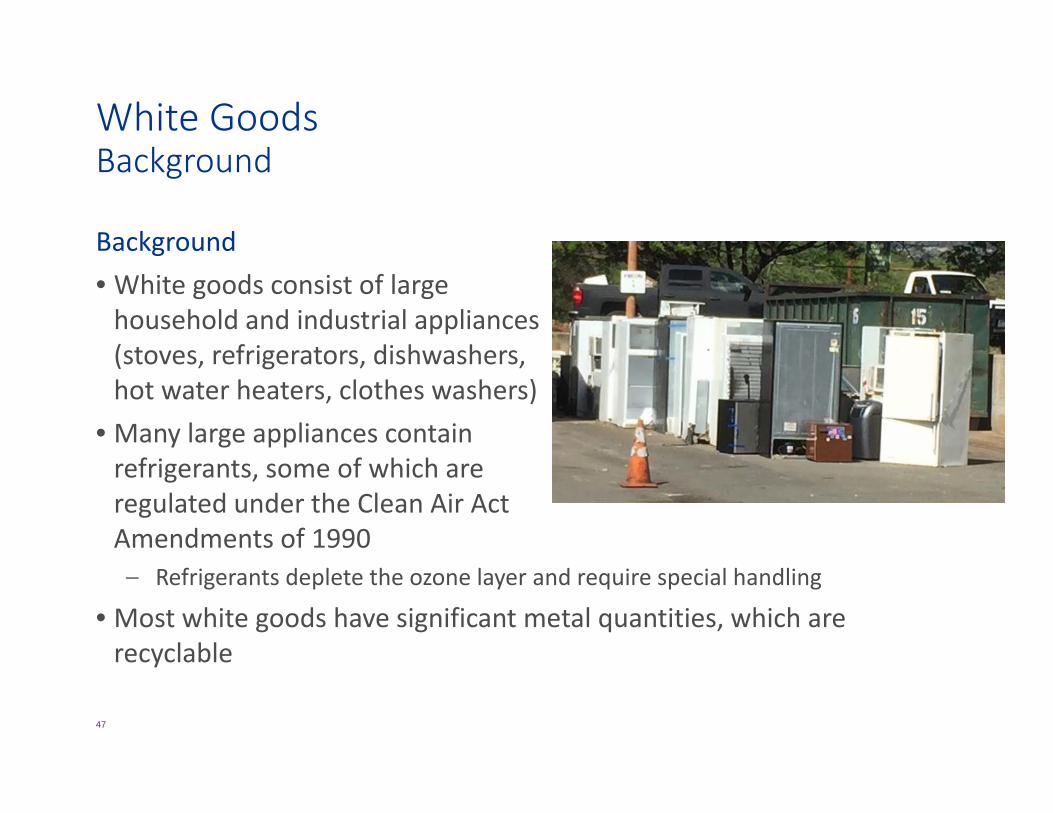
Background• White goods consist of large household and industrial appliances (stoves, refrigerators, dishwashers, hot water heaters, clothes washers)
• Many large appliances contain refrigerants, some of which are regulated under the Clean Air Act Amendments of 1990 – Refrigerants deplete the ozone layer and require special handling
• Most white goods have significant metal quantities, which are recyclable
48
White GoodsExisting Programs, Strategies
Existing Programs• City offers many programs to ensure proper disposal
– Monthly curbside pickup of bulky items is available to residents – Residents can self‐haul large appliances to convenience centers or transfer
stations– Reuse encouraged– Refrigerants managed through City’s white goods contractor– Scrap metal to recyclers; residue to WGSL for disposal
Strategies• New refuse facility in Kapolei planned to include a white goods facility to handle and process Refuse Division collected materials
• White goods collected and processed by commercial entities will remain in private sector
49
Abandoned and Derelict VehiclesBackground, Existing Programs
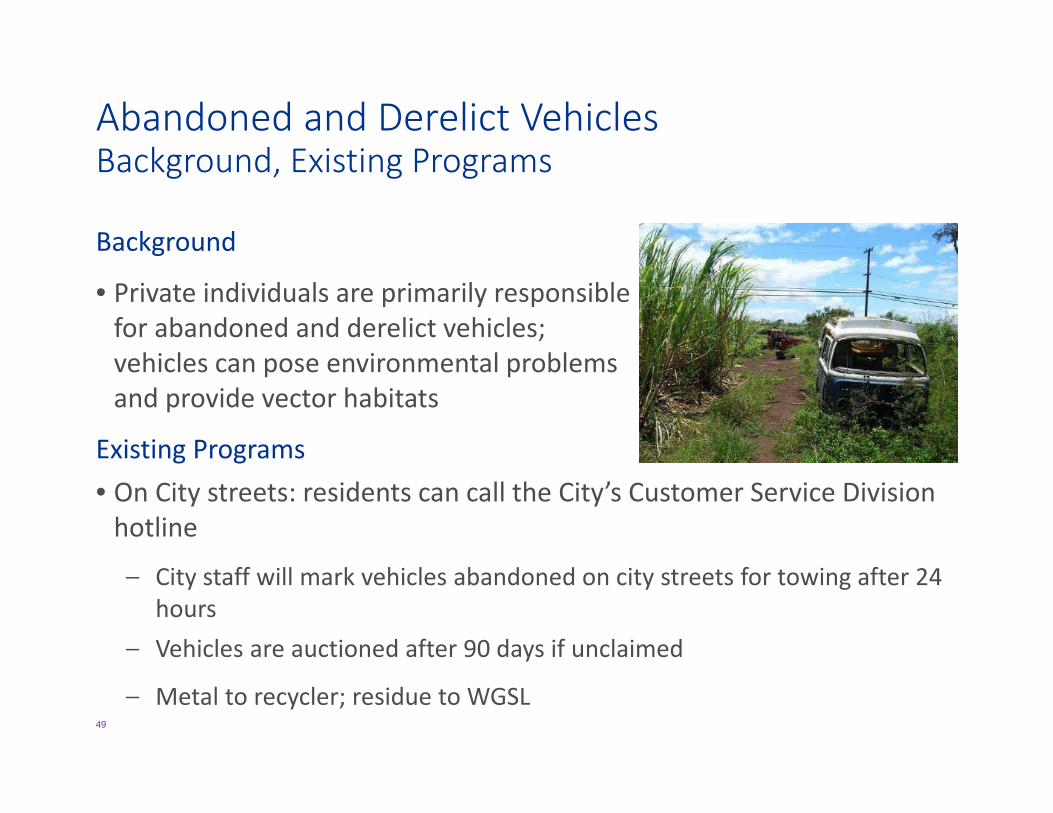
Background
• Private individuals are primarily responsible for abandoned and derelict vehicles; vehicles can pose environmental problems and provide vector habitats
Existing Programs• On City streets: residents can call the City’s Customer Service Division hotline
– City staff will mark vehicles abandoned on city streets for towing after 24 hours
– Vehicles are auctioned after 90 days if unclaimed
– Metal to recycler; residue to WGSL
50
Abandoned and Derelict VehiclesExisting Programs, Strategies
Existing Programs (cont.)• Program paid for through $7/vehicle registration fee (revolving fund)• Reports of abandoned vehicles on private, State, or Federally‐owned property are forwarded to the respective agency
Strategies• City: continued free pickup of derelict vehicles and hotline• In 2018, City’s ash recycling RFP may include beneficial use of auto recycling residue to increase landfill diversion
51
Construction and Demolition DebrisBackground
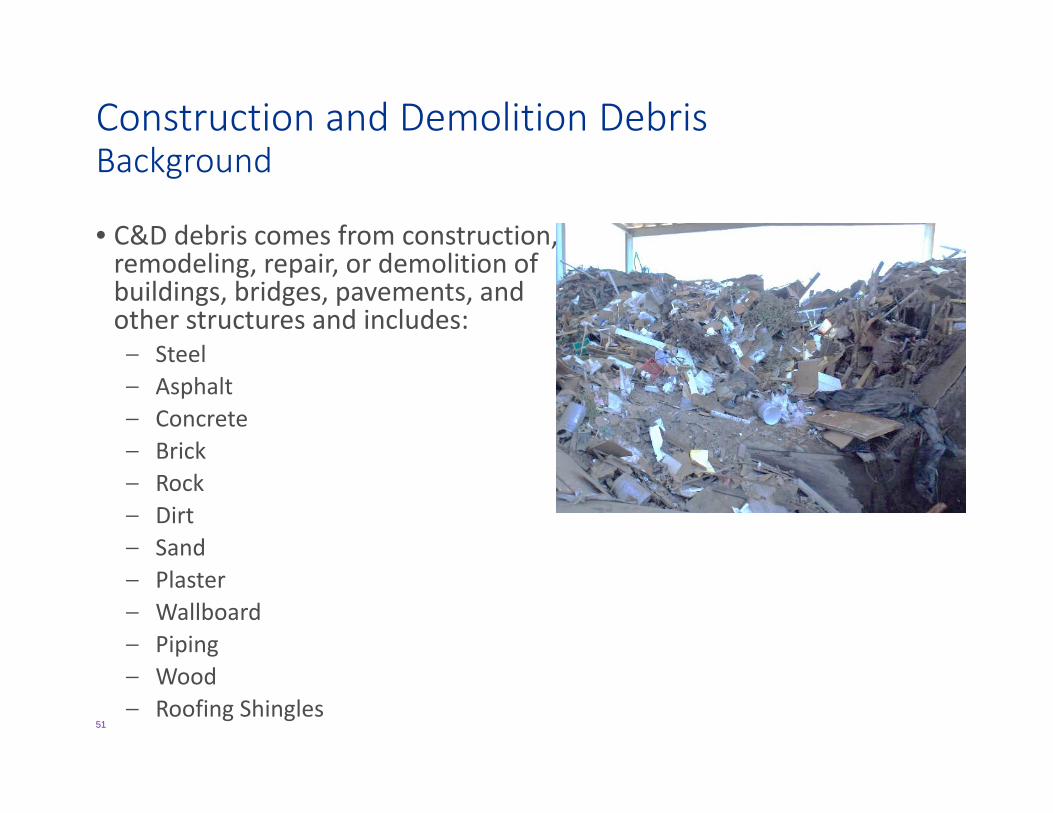
• C&D debris comes from construction, remodeling, repair, or demolition of buildings, bridges, pavements, and other structures and includes:– Steel– Asphalt– Concrete– Brick– Rock– Dirt– Sand – Plaster– Wallboard– Piping– Wood– Roofing Shingles
52
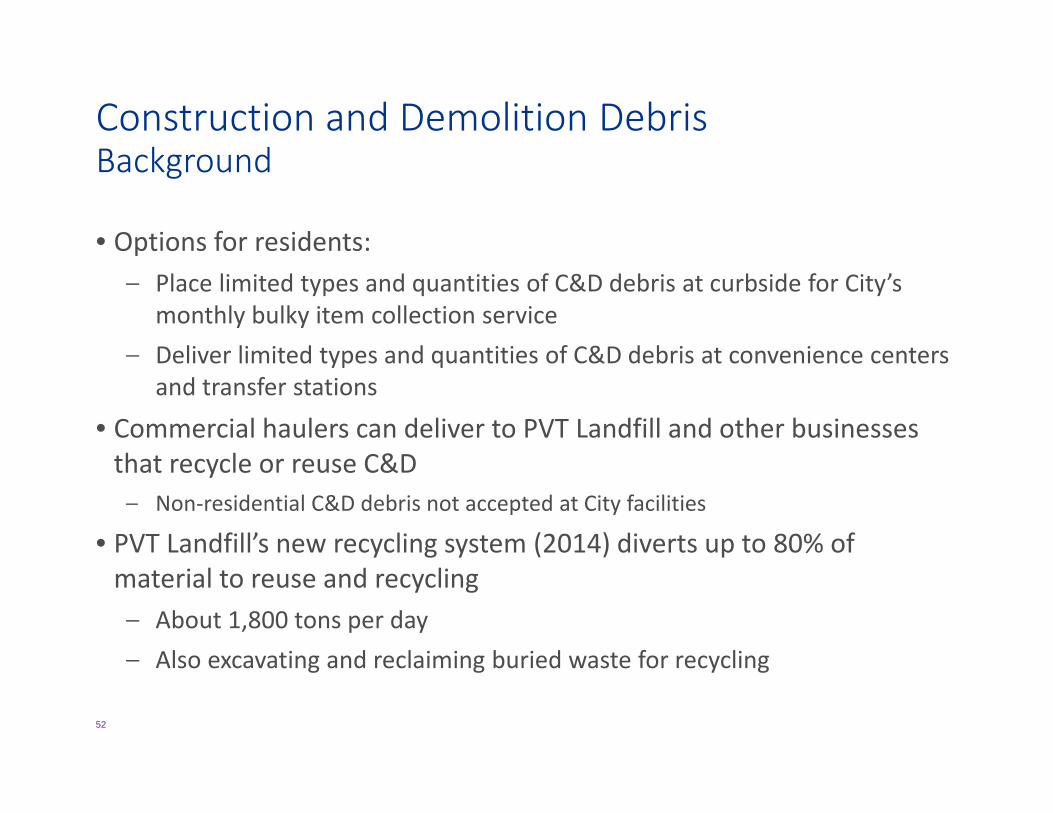
Construction and Demolition DebrisBackground
• Options for residents:– Place limited types and quantities of C&D debris at curbside for City’s
monthly bulky item collection service– Deliver limited types and quantities of C&D debris at convenience centers
and transfer stations
• Commercial haulers can deliver to PVT Landfill and other businesses that recycle or reuse C&D– Non‐residential C&D debris not accepted at City facilities
• PVT Landfill’s new recycling system (2014) diverts up to 80% of material to reuse and recycling– About 1,800 tons per day– Also excavating and reclaiming buried waste for recycling
53
Construction and Demolition DebrisExisting Programs, Strategies
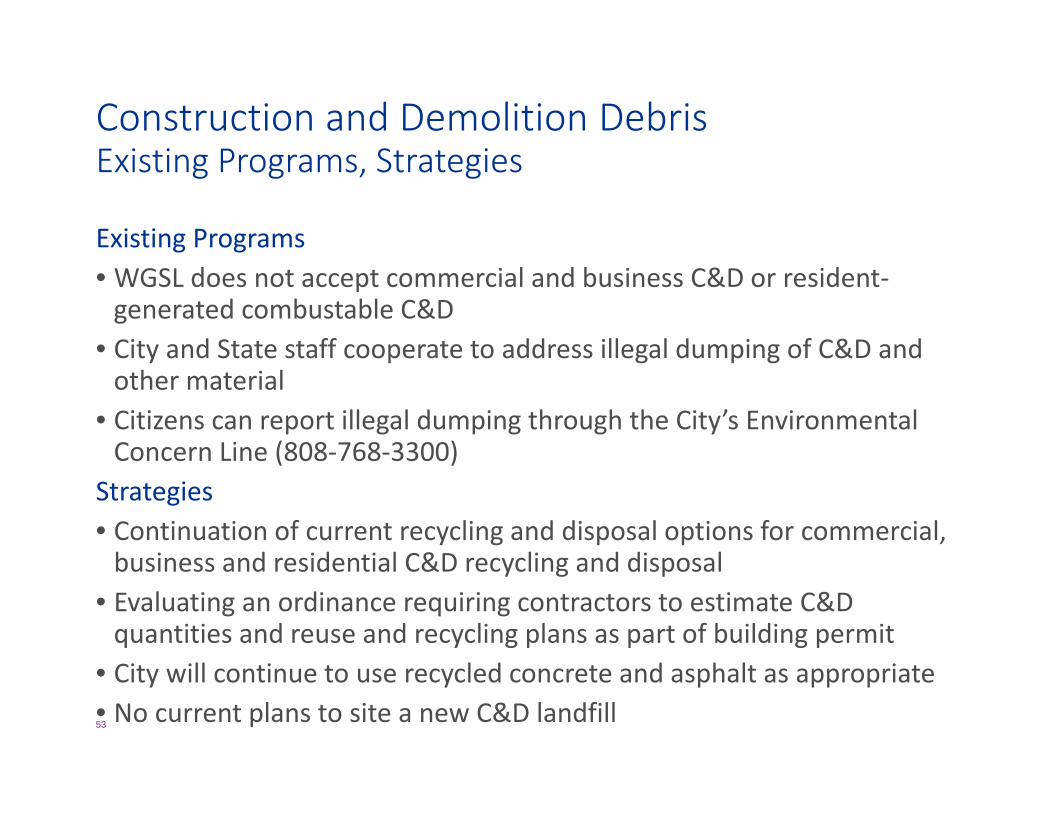
Existing Programs • WGSL does not accept commercial and business C&D or resident‐generated combustable C&D
• City and State staff cooperate to address illegal dumping of C&D and other material
• Citizens can report illegal dumping through the City’s Environmental Concern Line (808‐768‐3300)
Strategies• Continuation of current recycling and disposal options for commercial, business and residential C&D recycling and disposal
• Evaluating an ordinance requiring contractors to estimate C&Dquantities and reuse and recycling plans as part of building permit
• City will continue to use recycled concrete and asphalt as appropriate• No current plans to site a new C&D landfill
54
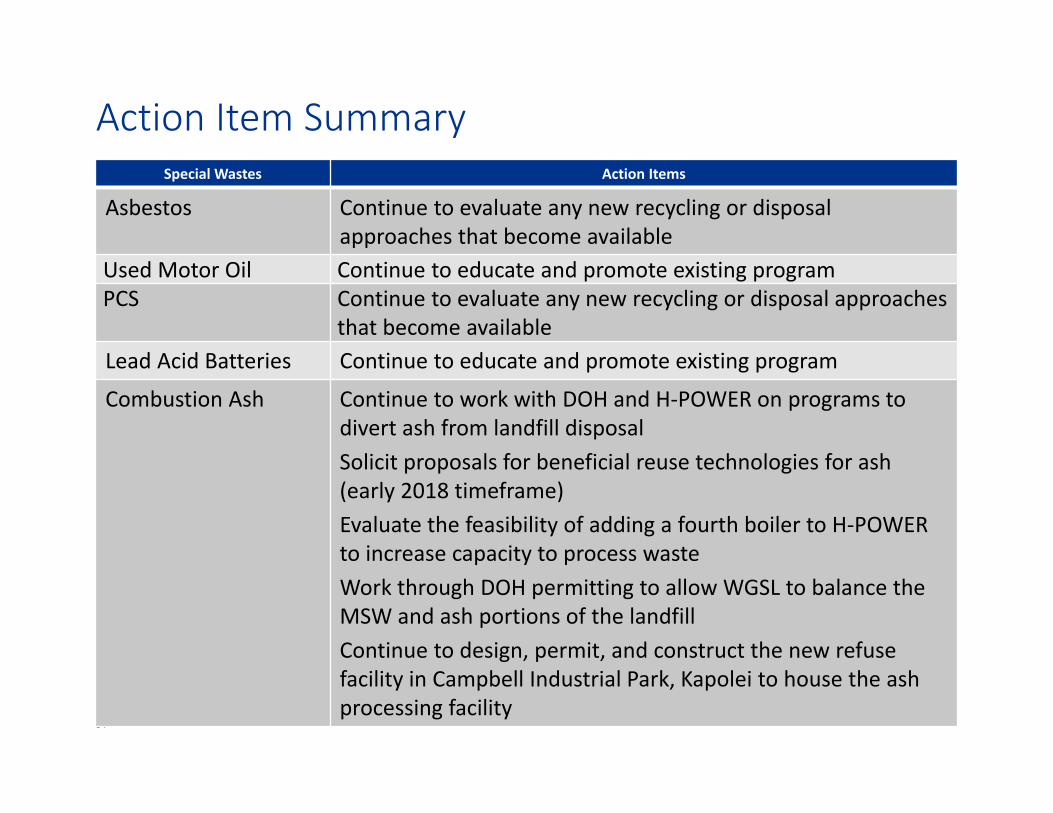
Action Item SummarySpecial Wastes Action Items
Asbestos Continue to evaluate any new recycling or disposal approaches that become available
Used Motor Oil Continue to educate and promote existing programPCS Continue to evaluate any new recycling or disposal approaches
that become availableLead Acid Batteries Continue to educate and promote existing program
Combustion Ash Continue to work with DOH and H‐POWER on programs to divert ash from landfill disposalSolicit proposals for beneficial reuse technologies for ash (early 2018 timeframe)Evaluate the feasibility of adding a fourth boiler to H‐POWER to increase capacity to process wasteWork through DOH permitting to allow WGSL to balance the MSW and ash portions of the landfillContinue to design, permit, and construct the new refuse facility in Campbell Industrial Park, Kapolei to house the ash processing facility
55
Action Item Summary (cont.)
Special Wastes Action Items
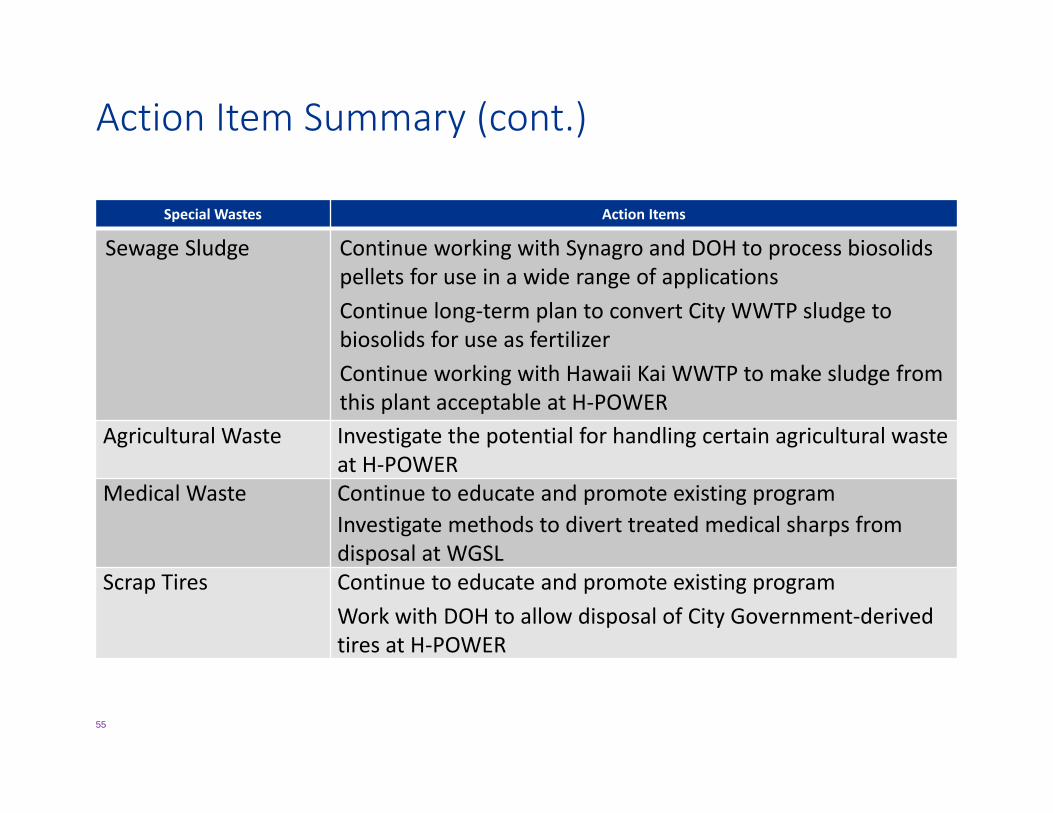
Sewage Sludge Continue working with Synagro and DOH to process biosolids pellets for use in a wide range of applicationsContinue long‐term plan to convert City WWTP sludge to biosolids for use as fertilizerContinue working with Hawaii Kai WWTP to make sludge from this plant acceptable at H‐POWER
Agricultural Waste Investigate the potential for handling certain agricultural waste at H‐POWER
Medical Waste Continue to educate and promote existing programInvestigate methods to divert treated medical sharps from disposal at WGSL
Scrap Tires Continue to educate and promote existing programWork with DOH to allow disposal of City Government‐derived tires at H‐POWER
56
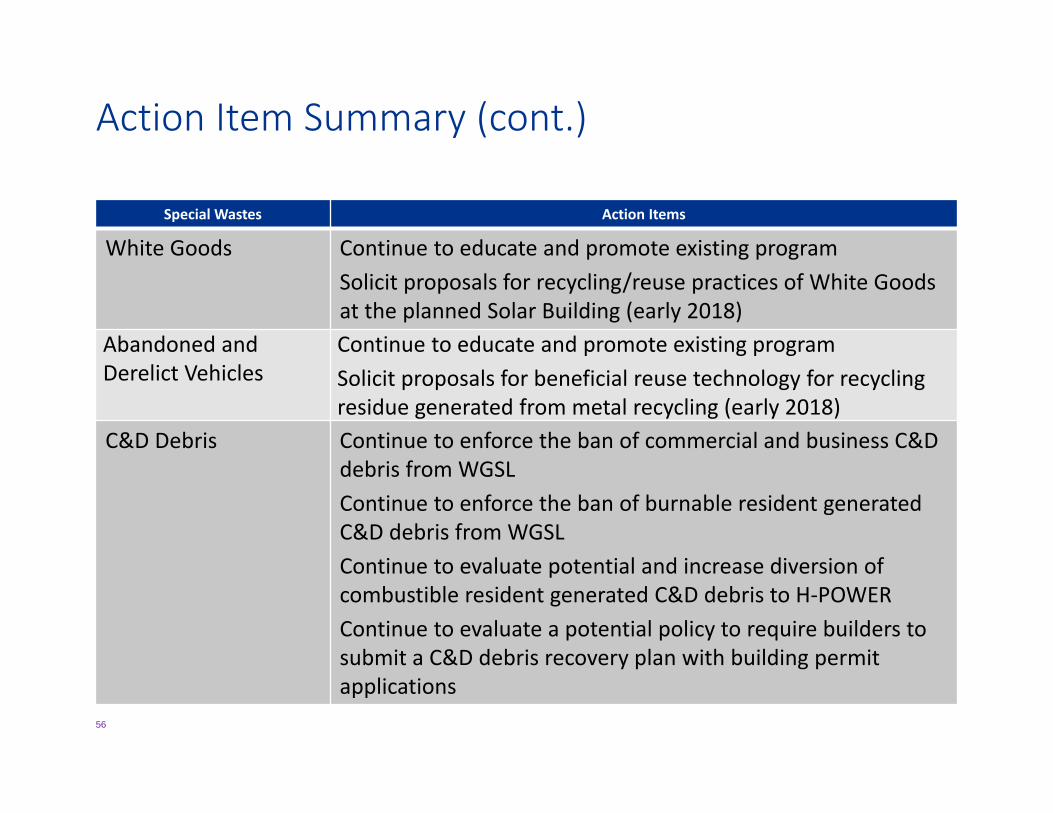
Action Item Summary (cont.)
Special Wastes Action Items
White Goods Continue to educate and promote existing programSolicit proposals for recycling/reuse practices of White Goods at the planned Solar Building (early 2018)
Abandoned and Derelict Vehicles
Continue to educate and promote existing programSolicit proposals for beneficial reuse technology for recycling residue generated from metal recycling (early 2018)
C&D Debris Continue to enforce the ban of commercial and business C&Ddebris from WGSLContinue to enforce the ban of burnable resident generated C&D debris from WGSLContinue to evaluate potential and increase diversion of combustible resident generated C&D debris to H‐POWERContinue to evaluate a potential policy to require builders to submit a C&D debris recovery plan with building permit applications
57
Section 5: Discussion