Embed Size (px)
Citation preview
© 2015 Eaton. All Rights Reserved..
Citi 2015 Industrials Conference
Richard H. Fearon, Vice Chairman and Chief Financial and Planning Officer
September 17, 2015

2 © 2015 Eaton. All Rights Reserved..
Forward Looking Statements and Non-GAAP Financial Information
This presentation and the comments we make today contain forward-looking statements concerning, among other matters, the impact of planned restructuring actions, the third quarter 2015 operating earnings per share, full year 2015 operating earnings per share, segment margins, capital expenditures, certain corporate expenses, cash flow and tax rate, organic revenue growth, foreign currency exchange rates, the impact in 2015 from foreign exchange on revenues and earnings and our capital allocation plans. These statements should be used with caution and are subject to various risks and uncertainties, many of which are outside the company’s control. The following factors could cause actual results to differ materially from those in the forward-looking statements: unanticipated changes in the markets for the company’s business segments; unanticipated downturns in business relationships with customers or their purchases from us; competitive pressures on sales and pricing; unanticipated changes in the cost of material and other production costs, or unexpected costs that cannot be recouped in product pricing; the introduction of competing technologies; unexpected technical or marketing difficulties; unexpected claims, charges, litigation or dispute resolutions; strikes or other labor unrest; the performance of recent acquisitions; unanticipated difficulties integrating acquisitions; new laws and governmental regulations; interest rate changes; stock market and currency fluctuations; war, civil or political unrest or terrorism; and unanticipated deterioration of economic and financial conditions in the United States and around the world. We do not assume any obligation to update these forward-looking statements. This presentation includes certain non-GAAP measures as defined by SEC rules. A reconciliation of those measures to the most directly comparable GAAP equivalent is provided in the investor relations section of our website at www.eaton.com and is contained in your packet.
3 © 2015 Eaton. All Rights Reserved..
Eaton – A Power Management Leader
• Power management strategy is working
• Leading Electrical franchise with a successful Cooper integration nearing completion
• Industrial businesses are well positioned for growth
• Strong margin, cash flow and attractive capital deployment alternatives strengthen prospects
• Outlook
4 © 2015 Eaton. All Rights Reserved..
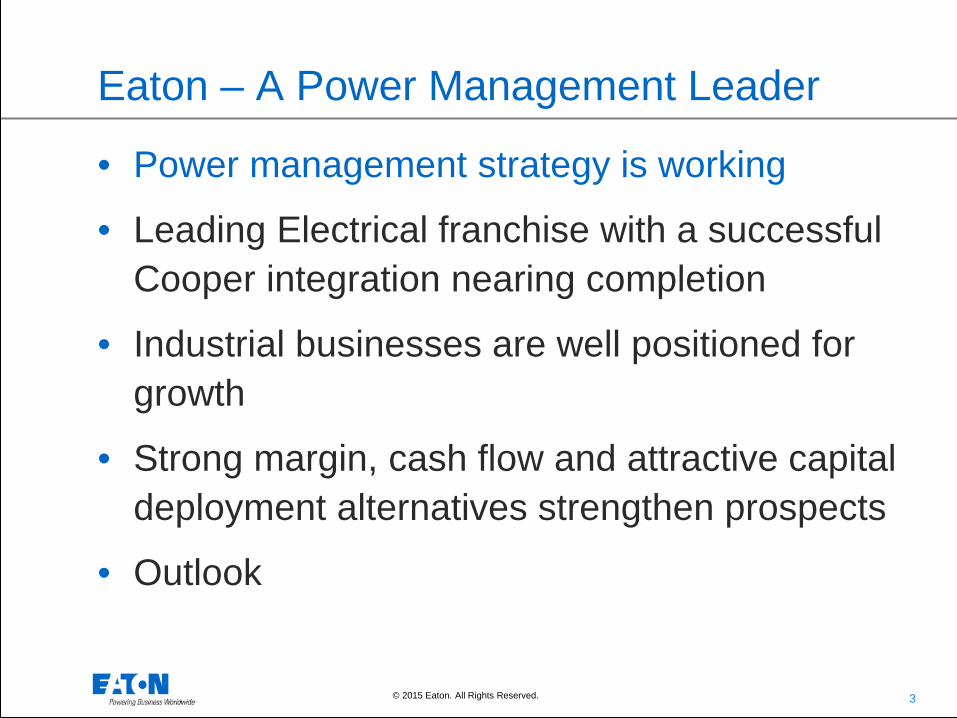
Eaton is a premier power management company…
We are uniquely positioned to provide reliable, efficient, safe and sustainable power management solutions for critical markets
Cities & Buildings
Transportation
Infrastructure Energy & Utilities
Information Technology
Industrial & Machinery
Electrical Fluid Mechanical
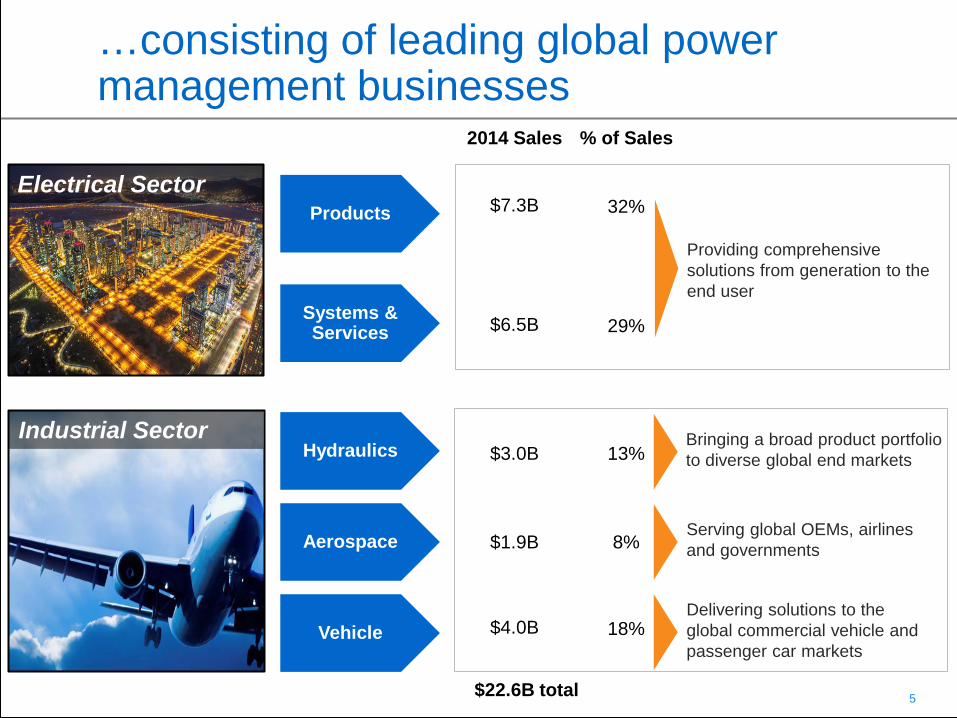
5 © 2015 Eaton. All Rights Reserved.. $22.6B total
…consisting of leading global power management businesses
Products
Systems & Services
Aerospace
Hydraulics
Vehicle
Electrical Sector $7.3B
$6.5B
$3.0B
$1.9B
$4.0B
2014 Sales
Providing comprehensive solutions from generation to the end user
Bringing a broad product portfolio to diverse global end markets
32%
29%
13%
8%
18%
% of Sales
Industrial Sector
Serving global OEMs, airlines and governments
Delivering solutions to the global commercial vehicle and passenger car markets
6 © 2015 Eaton. All Rights Reserved..
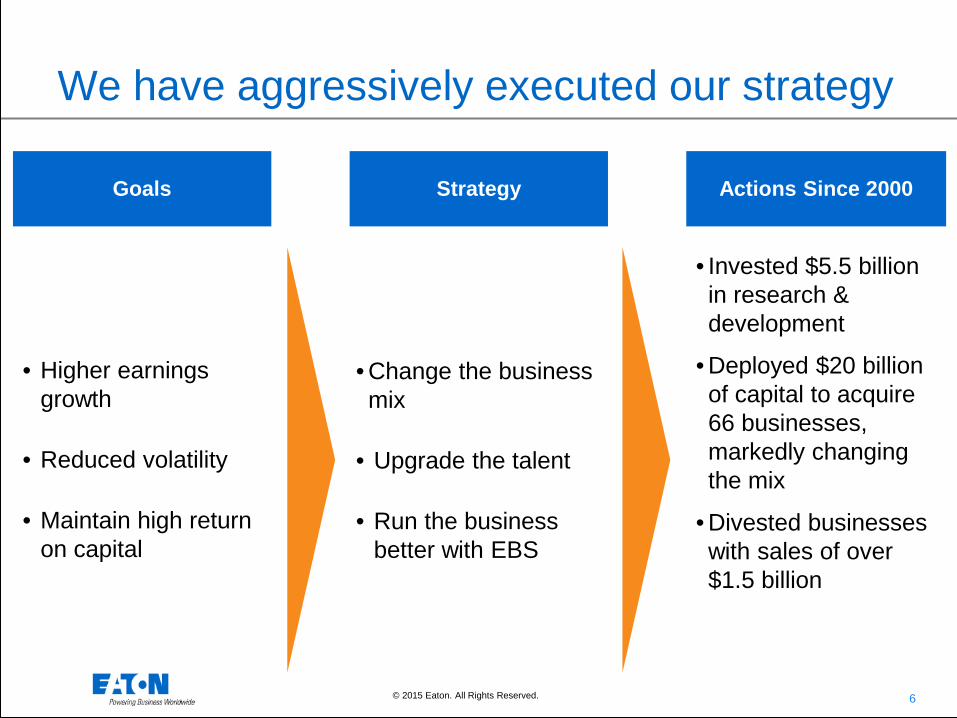
We have aggressively executed our strategy
Goals Actions Since 2000
• Higher earnings growth
• Reduced volatility
• Maintain high return on capital
• Invested $5.5 billion in research & development
• Deployed $20 billion of capital to acquire 66 businesses, markedly changing the mix
• Divested businesses with sales of over $1.5 billion
Strategy
• Change the business mix
• Upgrade the talent
• Run the business better with EBS

7 © 2015 Eaton. All Rights Reserved..
Our strategy has resulted in a balanced business that serves diverse markets
End Market
Country
Cycle
Segment
Electrical Vehicle Hydraulics Aerospace
Early Mid Late No
USA Int’l Developed Int’l Emerging
61%
11% 29% 29% 31%
13% 8% 18%
52%
25% 23%
8 © 2015 Eaton. All Rights Reserved..
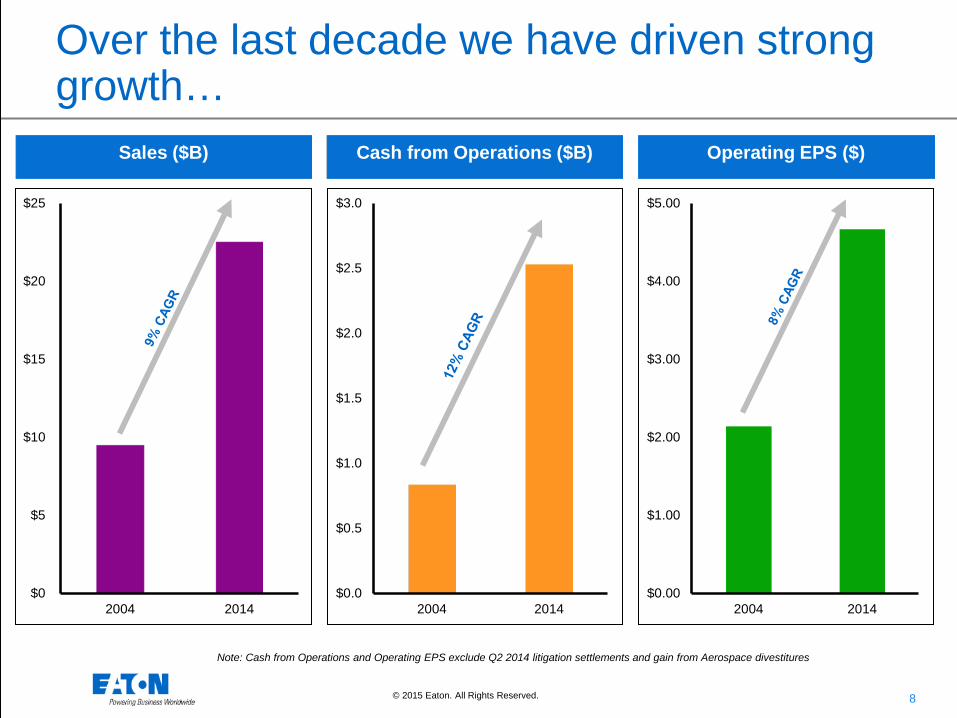
Over the last decade we have driven strong growth…
Mix
Pe
rfor
man
ce
Cash from Operations ($B) Sales ($B) Operating EPS ($)
$0
$5
$10
$15
$20
$25
2004 2014$0.0
$0.5
$1.0
$1.5
$2.0
$2.5
$3.0
2004 2014$0.00
$1.00
$2.00
$3.00
$4.00
$5.00
2004 2014
Note: Cash from Operations and Operating EPS exclude Q2 2014 litigation settlements and gain from Aerospace divestitures
9 © 2015 Eaton. All Rights Reserved..
0.0
0.1
0.2
0.3
0.4
Eaton Stand Alone PF Eaton and Cooper
Vola
tility
of E
arni
ngs
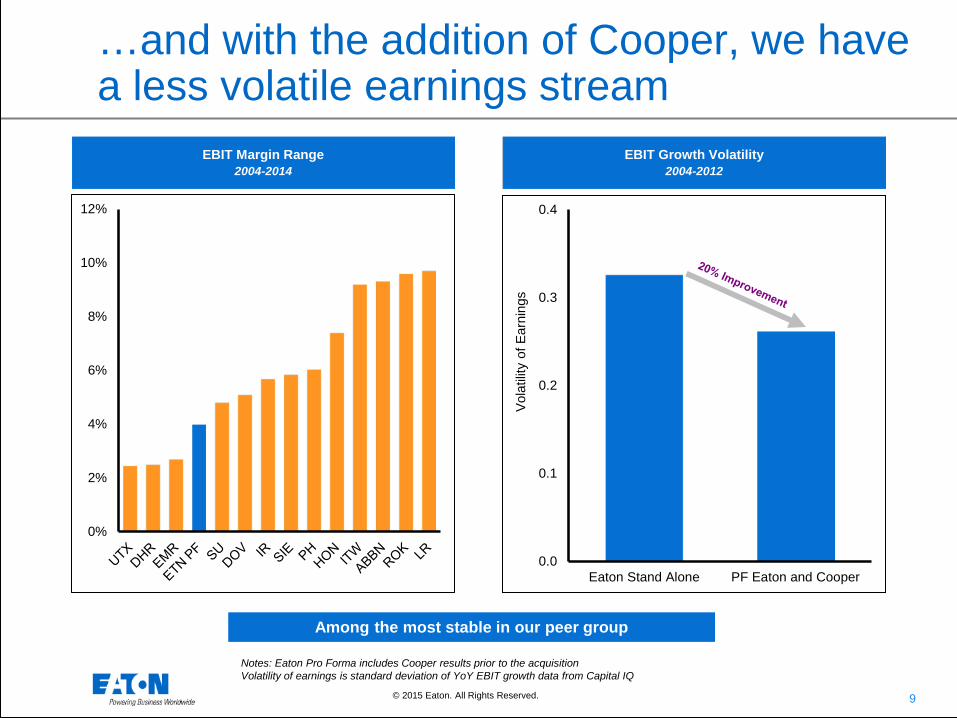
…and with the addition of Cooper, we have a less volatile earnings stream
Notes: Eaton Pro Forma includes Cooper results prior to the acquisition Volatility of earnings is standard deviation of YoY EBIT growth data from Capital IQ
Among the most stable in our peer group
0%
2%
4%
6%
8%
10%
12%
EBIT Margin Range 2004-2014
EBIT Growth Volatility 2004-2012

10 © 2015 Eaton. All Rights Reserved..
We have grown our dividend at a rapid rate…
$0.00
$0.50
$1.00
$1.50
$2.00
$2.50
2005 2006 2007 2008 2009 2010 2011 2012 2013 2014 2015e
Dividends per Share
11 © 2015 Eaton. All Rights Reserved..
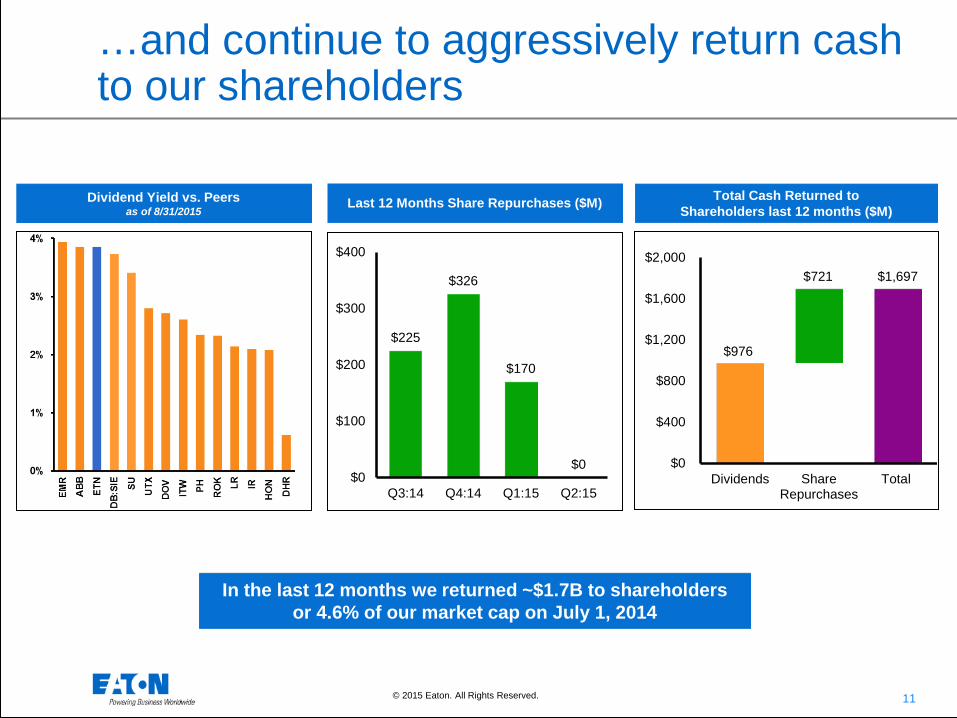
…and continue to aggressively return cash to our shareholders
Dividend Yield vs. Peers as of 8/31/2015
Total Cash Returned to Shareholders last 12 months ($M) Last 12 Months Share Repurchases ($M)
$225
$326
$170
$0 $0
$100
$200
$300
$400
Q3:14 Q4:14 Q1:15 Q2:15
$0
$400
$800
$1,200
$1,600
$2,000
Dividends ShareRepurchases
Total
$976
$721 $1,697
In the last 12 months we returned ~$1.7B to shareholders or 4.6% of our market cap on July 1, 2014
12 © 2015 Eaton. All Rights Reserved..
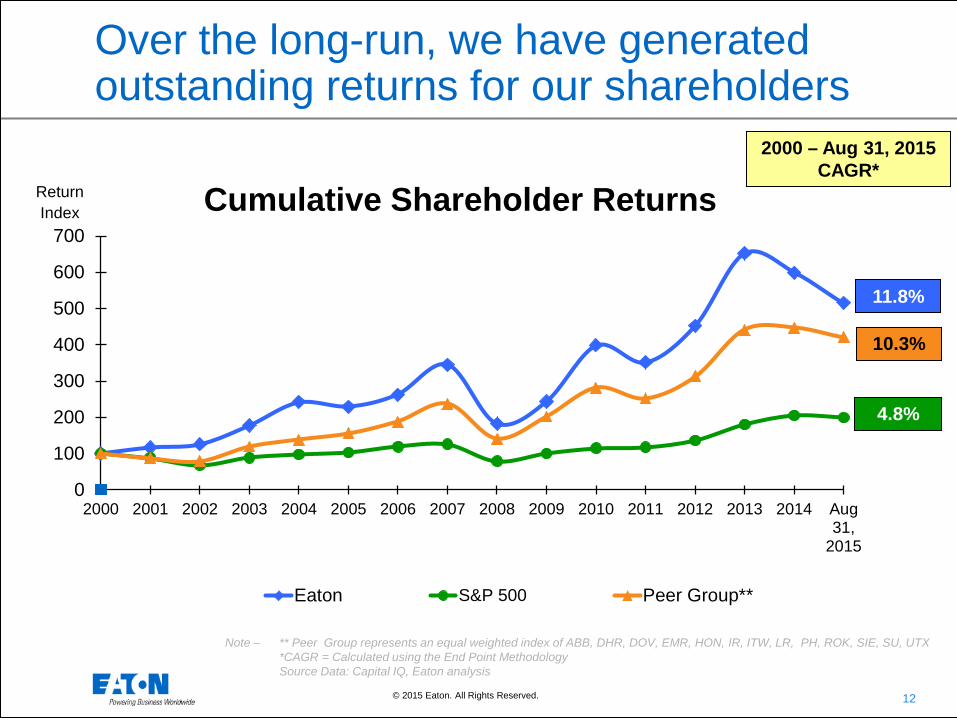
Over the long-run, we have generated outstanding returns for our shareholders
2000 – Aug 31, 2015 CAGR*
Return Index
11.8%
0
100
200
300
400
500
600
700
2000 2001 2002 2003 2004 2005 2006 2007 2008 2009 2010 2011 2012 2013 2014 Aug31,
2015
Cumulative Shareholder Returns
Eaton S&P 500 Peer Group**
10.3%
4.8%
Note – ** Peer Group represents an equal weighted index of ABB, DHR, DOV, EMR, HON, IR, ITW, LR, PH, ROK, SIE, SU, UTX *CAGR = Calculated using the End Point Methodology Source Data: Capital IQ, Eaton analysis
13 © 2015 Eaton. All Rights Reserved..
Eaton – A Power Management Leader
• Power management strategy is working
• Leading Electrical franchise with a successful Cooper integration nearing completion
• Industrial businesses are well positioned for growth
• Strong margin, cash flow and attractive capital deployment alternatives strengthen prospects
• Outlook

14 © 2015 Eaton. All Rights Reserved..
Our Electrical businesses deliver solutions for the entire power system
Data Centers Industrial Utility Commercial / Resi Machinery
15 © 2015 Eaton. All Rights Reserved..
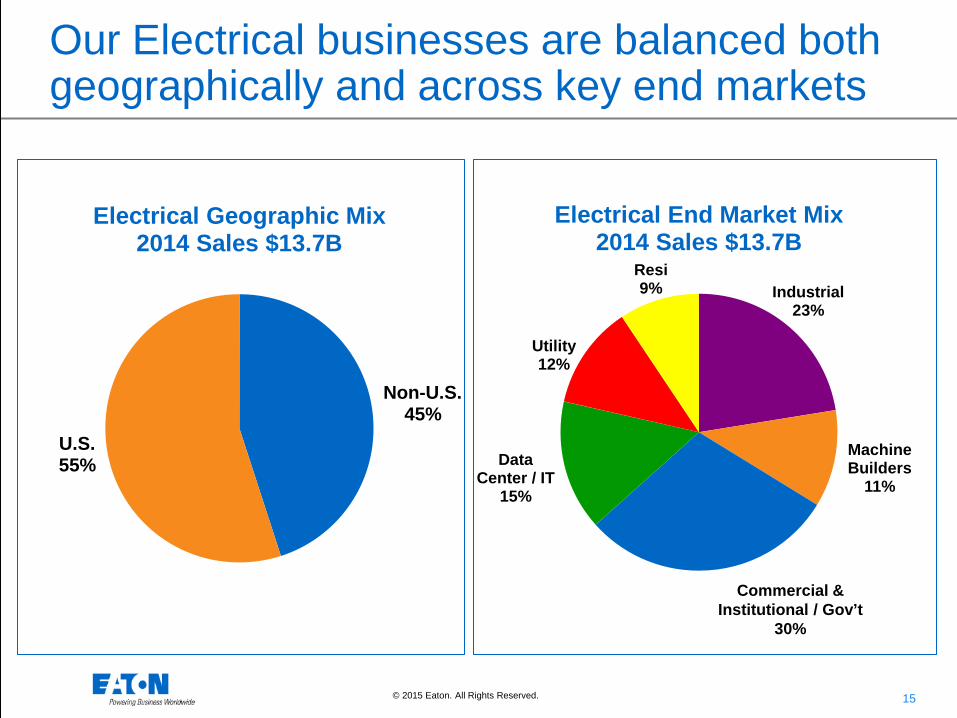
Our Electrical businesses are balanced both geographically and across key end markets
Non-U.S. 45%
U.S. 55%
Electrical Geographic Mix 2014 Sales $13.7B
Industrial 23%
Machine Builders
11% Data
Center / IT 15%
Utility 12%
Resi 9%
Electrical End Market Mix 2014 Sales $13.7B
Commercial & Institutional / Gov’t
30%
16 © 2015 Eaton. All Rights Reserved..
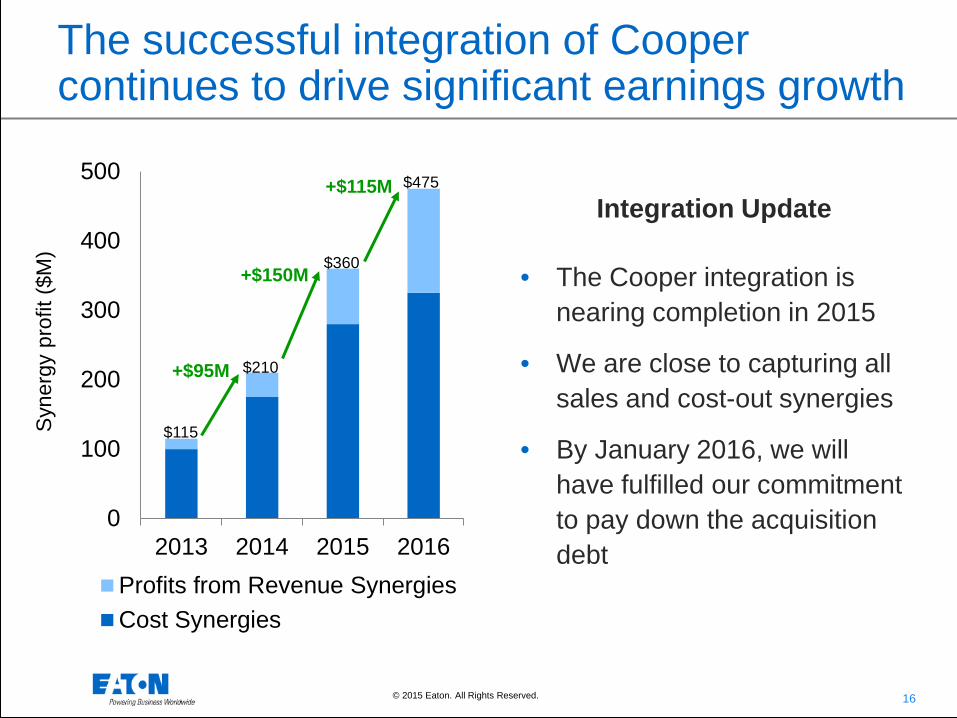
The successful integration of Cooper continues to drive significant earnings growth
0
100
200
300
400
500
2013 2014 2015 2016Profits from Revenue SynergiesCost Synergies
Integration Update
• The Cooper integration is nearing completion in 2015
• We are close to capturing all sales and cost-out synergies
• By January 2016, we will have fulfilled our commitment to pay down the acquisition debt
+$95M
+$150M
+$115M $475
$360
$210
$115 Syn
ergy
pro
fit ($
M)
17 © 2015 Eaton. All Rights Reserved..
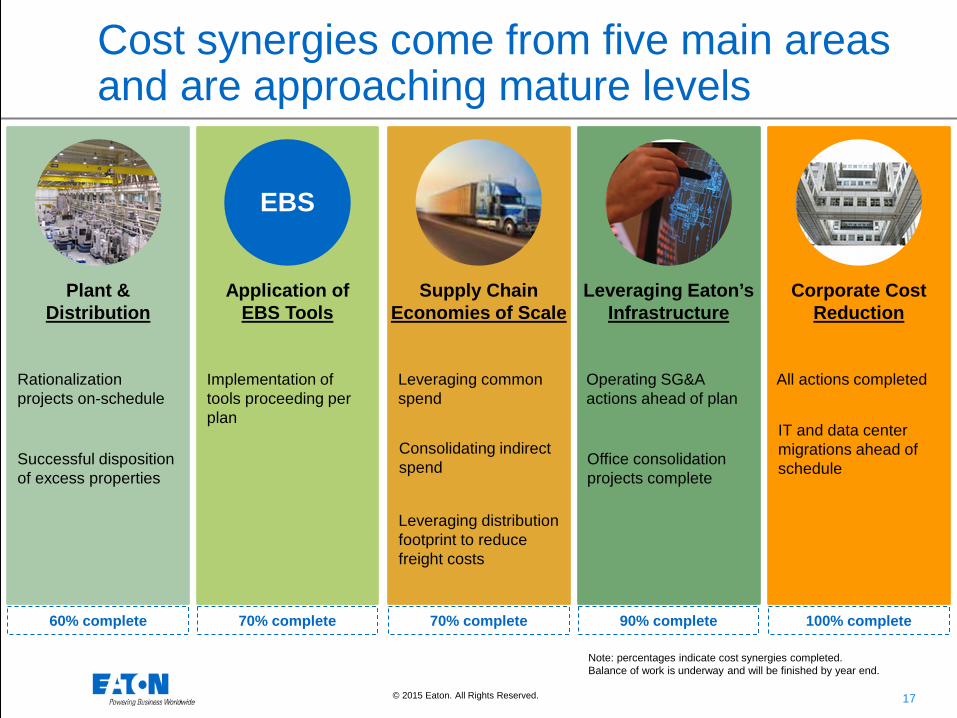
Cost synergies come from five main areas and are approaching mature levels
Plant & Distribution
Rationalization projects on-schedule
Successful disposition of excess properties
60% complete
EBS
Application of EBS Tools
Implementation of tools proceeding per plan
70% complete
Supply Chain Economies of Scale
Leveraging common spend
Consolidating indirect spend
Leveraging distribution footprint to reduce freight costs
70% complete
Leveraging Eaton’s Infrastructure
Operating SG&A actions ahead of plan
Office consolidation projects complete
90% complete
Corporate Cost Reduction
All actions completed
IT and data center migrations ahead of schedule
100% complete
Note: percentages indicate cost synergies completed. Balance of work is underway and will be finished by year end.

18 © 2015 Eaton. All Rights Reserved..
Sales synergies come from four main areas
Completed the rollout of a new distributor program to channel partners (EDAP)
Boost Channel Sales
Launched new channel web portal tools (MyEaton)
Larger Package to Common Customers
Implemented integrated selling organizations on a global basis
Added resources to focus on global accounts and key EPC firms
Service Business
Rolled out a service channel module to key distributors
Coupled service offers to all Industrial, Commercial and Utility quotations and projects
Geographic Expansion
Enhanced and expanded Eaton Tech Days in Asia, Africa, and the Middle East
Integrated selling, service, and channel activities in key regions
75% of total 2016 sales synergies 25% of total 2016 sales synergies

19 © 2015 Eaton. All Rights Reserved..
We continue to leverage innovation and product vitality to drive organic growth…
• CXH - Increased safety and reliability with unmatched arc flash mitigation
• Hazardous location boltless cover reduces installation and maintenance costs
Hazardous Area Boltless Enclosures
CXH Low Voltage Assemblies
Marine Duty Uninterruptable Power Supplies
• Marine certified UPS for marine safety, control, bridge and commercial systems
• Standard and engineered solutions address end user applications
Extending UPS technology to additional markets
General Purpose, Machine & EU Directive Drives
• General purpose and machinery drives expand functionality and increase ease of use
• Simple motor drives meet new European energy savings directive
Drives technology for every application
Creating oil & gas technology to enhance safety and maintenance
WaveStream Architectural Solutions
• Expanded WaveStream LED solutions for more design freedom
• Provides best in class optical control, brightness control and energy efficiency
Utilizing LED technology to increase flexibility
20 © 2015 Eaton. All Rights Reserved..
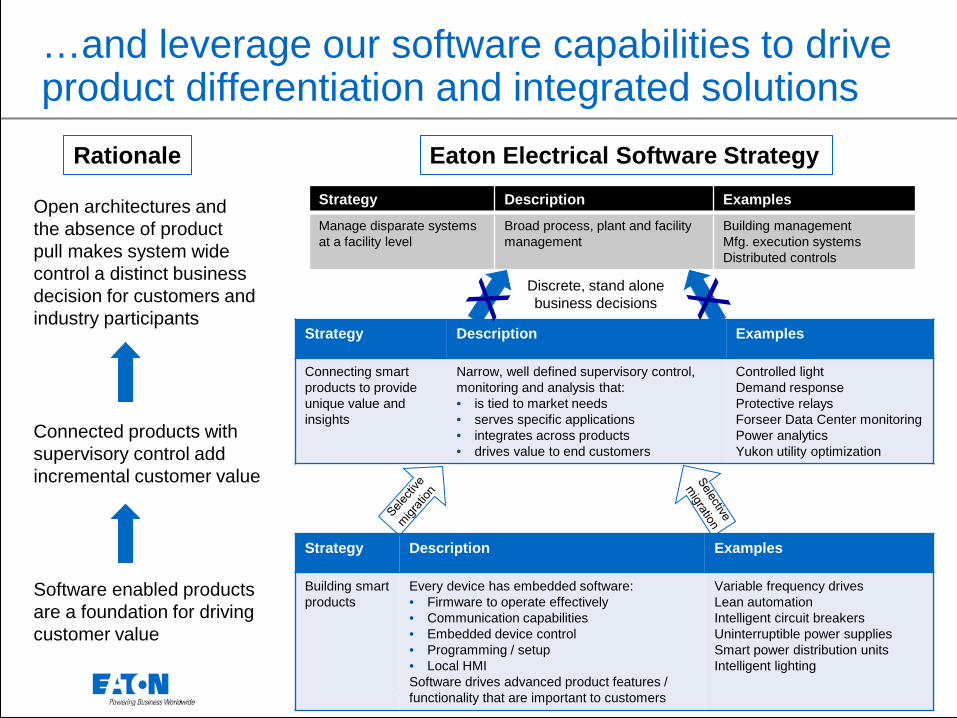
…and leverage our software capabilities to drive product differentiation and integrated solutions
Rationale
Open architectures and the absence of product pull makes system wide control a distinct business decision for customers and industry participants
Connected products with supervisory control add incremental customer value
Software enabled products are a foundation for driving customer value
Eaton Electrical Software Strategy Strategy Description Examples
Manage disparate systems at a facility level
Broad process, plant and facility management
Building management Mfg. execution systems Distributed controls
Strategy Description Examples
Connecting smart products to provide unique value and insights
Narrow, well defined supervisory control, monitoring and analysis that: • is tied to market needs • serves specific applications • integrates across products • drives value to end customers
Controlled light Demand response Protective relays Forseer Data Center monitoring Power analytics Yukon utility optimization
Strategy Description Examples
Building smart products
Every device has embedded software: • Firmware to operate effectively • Communication capabilities • Embedded device control • Programming / setup • Local HMI Software drives advanced product features / functionality that are important to customers
Variable frequency drives Lean automation Intelligent circuit breakers Uninterruptible power supplies Smart power distribution units Intelligent lighting
Discrete, stand alone business decisions
21 © 2015 Eaton. All Rights Reserved..
Eaton – A Power Management Leader
• Power management strategy is working
• Leading Electrical franchise with a successful Cooper integration nearing completion
• Industrial businesses are well positioned for growth
• Strong margin, cash flow and attractive capital deployment alternatives strengthen prospects
• Outlook
22 © 2015 Eaton. All Rights Reserved..
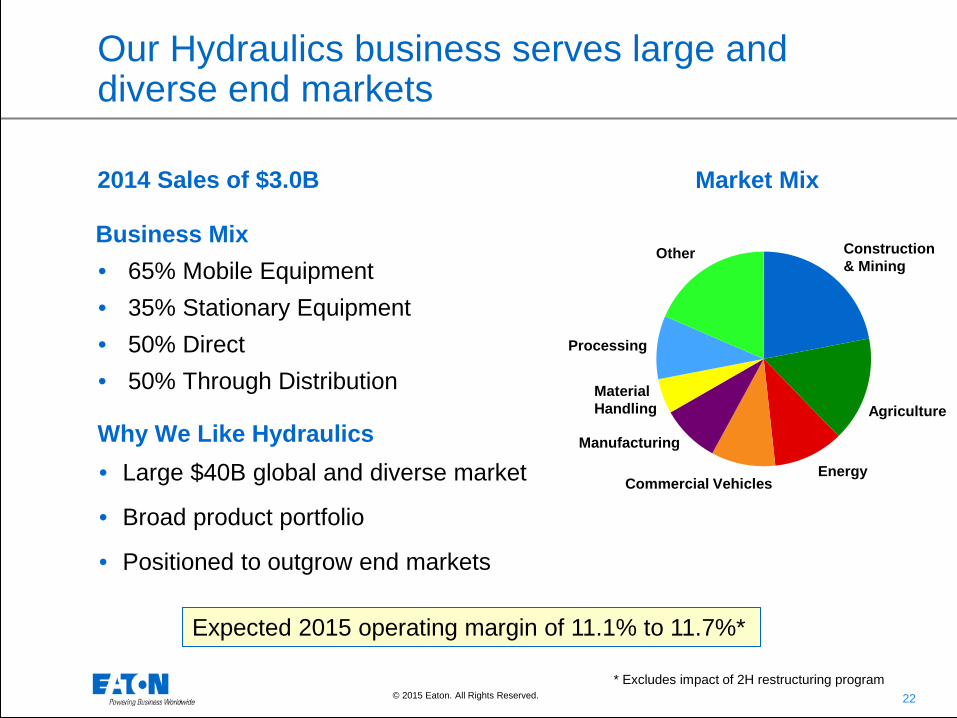
Our Hydraulics business serves large and diverse end markets
• 65% Mobile Equipment • 35% Stationary Equipment • 50% Direct • 50% Through Distribution
2014 Sales of $3.0B
• Large $40B global and diverse market
• Broad product portfolio
• Positioned to outgrow end markets
Why We Like Hydraulics
Business Mix
Market Mix
Construction & Mining
Agriculture
Energy Commercial Vehicles
Manufacturing
Material Handling
Processing
Other
Expected 2015 operating margin of 11.1% to 11.7%*
* Excludes impact of 2H restructuring program
23 © 2015 Eaton. All Rights Reserved..
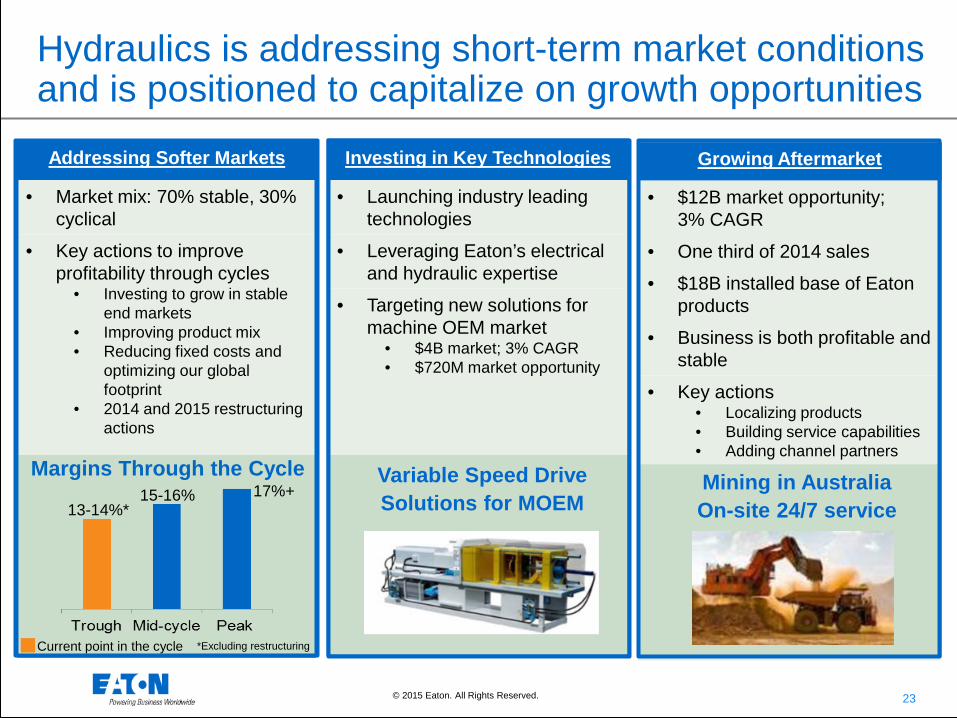
Growing Aftermarket
• $12B market opportunity; 3% CAGR
• One third of 2014 sales
• $18B installed base of Eaton products
• Business is both profitable and stable
• Key actions • Localizing products • Building service capabilities • Adding channel partners
Addressing Softer Markets
• Market mix: 70% stable, 30% cyclical
• Key actions to improve profitability through cycles
• Investing to grow in stable end markets
• Improving product mix • Reducing fixed costs and
optimizing our global footprint
• 2014 and 2015 restructuring actions
Hydraulics is addressing short-term market conditions and is positioned to capitalize on growth opportunities
Mining in Australia On-site 24/7 service
Current point in the cycle
Margins Through the Cycle
13-14%* 17%+ 15-16%
*Excluding restructuring
Investing in Key Technologies
• Launching industry leading technologies
• Leveraging Eaton’s electrical and hydraulic expertise
• Targeting new solutions for machine OEM market
• $4B market; 3% CAGR • $720M market opportunity
Variable Speed Drive Solutions for MOEM
24 © 2015 Eaton. All Rights Reserved..
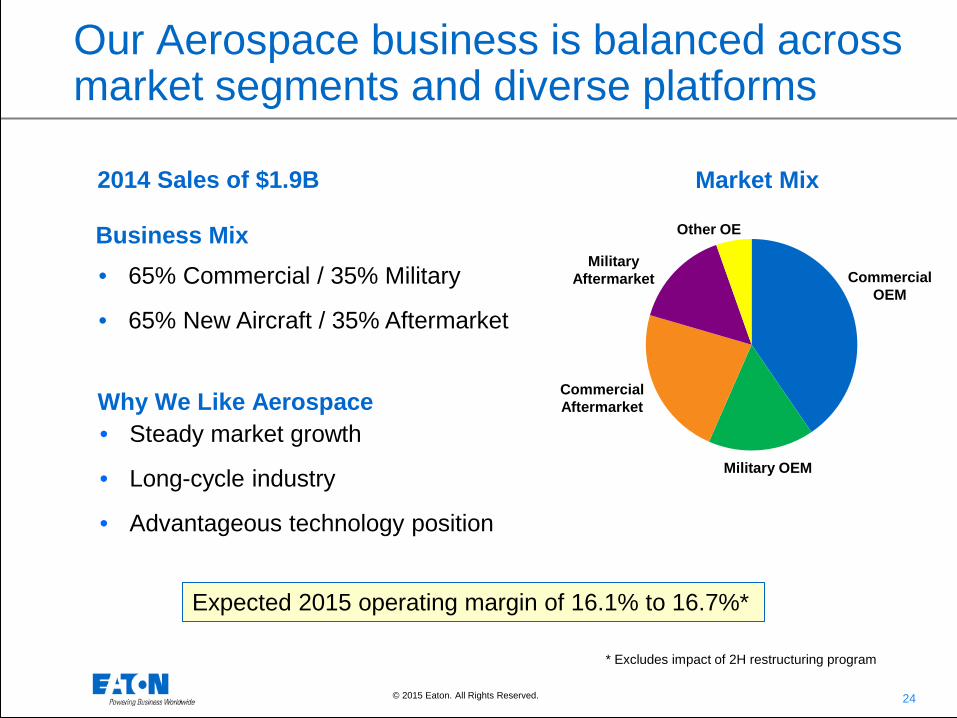
Our Aerospace business is balanced across market segments and diverse platforms
2014 Sales of $1.9B
Why We Like Aerospace
Business Mix
Market Mix
Expected 2015 operating margin of 16.1% to 16.7%*
• 65% Commercial / 35% Military
• 65% New Aircraft / 35% Aftermarket
• Steady market growth
• Long-cycle industry
• Advantageous technology position
Commercial OEM
Military OEM
Commercial Aftermarket
Military Aftermarket
Other OE
* Excludes impact of 2H restructuring program

25 © 2015 Eaton. All Rights Reserved..
Launching New Technologies • Driving more than $3B in recent
wins
• Commercial Transport • Pure Power engine seals improve
fuel efficiency and extend life cycle on 777X, a $620M opportunity
•
• Optimized subsystems to improve engine buildup on A350-1000, a $425M opportunity
• Regional Jets Hydraulic system advantages in quality and reliability on E2 jet, a $400M opportunity
• Military Tanker Closed loop system optimizes fuel flow on KC-46A, a $300M opportunity
Growing Aftermarket
• $4B global market; 2.5% CAGR
• Aggressive focus on: • Improving operational
performance • Dedicated Aftermarket
organization • Driving modifications and
upgrades
Increasing Content on Next Generation Platforms
Winning technologies and aftermarket focus will drive profitable growth on both legacy and new platforms
Aftermarket Sales 7% CAGR
Commercial Transport B787 B767
4x
Military Rotorcraft
Military Fighters
Business Jets
Regional Jets
7x
2x
8x
6x
CH-53K UH-60
F-35 F-18
Falcon 900
E2 ERJ 170/190
Falcon 5X
Prior platforms New OE platforms *Photo provided by GE Aviation
2014 2018
$120M in outgrowth by 2018

26 © 2015 Eaton. All Rights Reserved..
Our Vehicle Group provides targeted solutions for both commercial and passenger markets
2014 Sales of $4.0B
Why We Like Vehicle
Business Mix
Market Mix
Expected 2015 operating margin of 17.4% to 18.0%*
• Americas: 70%
• EMEA: 20%
• APAC: 10%
• Regulations create large opportunities for innovation
• Leader in fuel economy and emissions reduction
• Positioned to outgrow end markets
Passenger
Line Haul
Vocational
Pickup and Delivery
Ag / Off Highway Other
* Excludes impact of 2H restructuring program
27 © 2015 Eaton. All Rights Reserved..
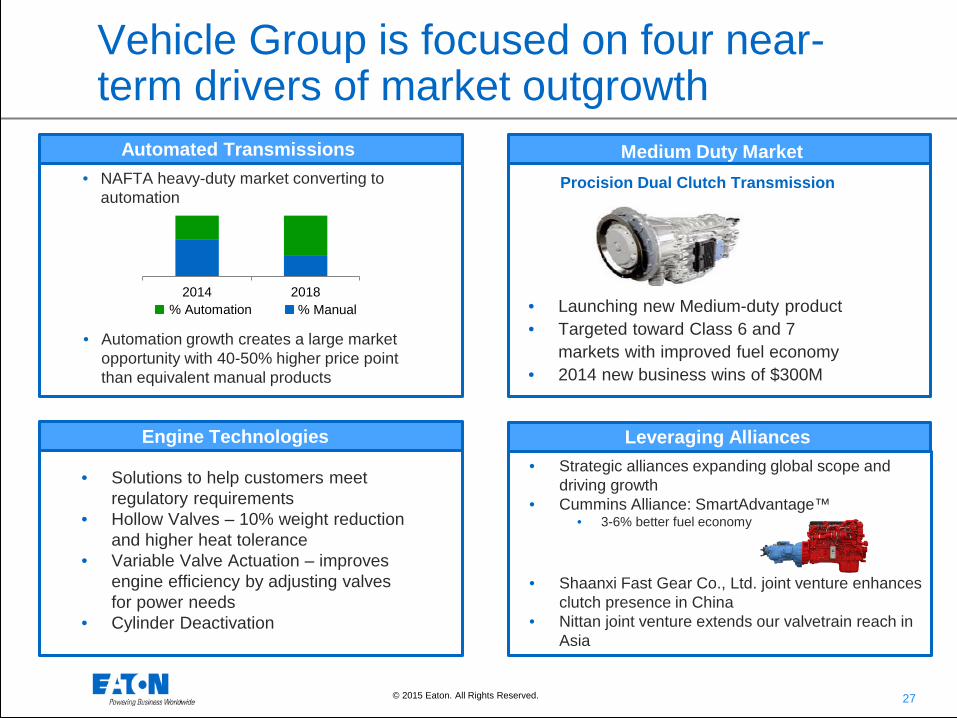
Vehicle Group is focused on four near-term drivers of market outgrowth
2014 2018% Automation % Manual
Procision Dual Clutch Transmission
Automated Transmissions • NAFTA heavy-duty market converting to
automation
• Automation growth creates a large market opportunity with 40-50% higher price point than equivalent manual products
Engine Technologies
• Solutions to help customers meet regulatory requirements
• Hollow Valves – 10% weight reduction and higher heat tolerance
• Variable Valve Actuation – improves engine efficiency by adjusting valves for power needs
• Cylinder Deactivation
Medium Duty Market
• Launching new Medium-duty product • Targeted toward Class 6 and 7
markets with improved fuel economy • 2014 new business wins of $300M
Leveraging Alliances • Strategic alliances expanding global scope and
driving growth • Cummins Alliance: SmartAdvantage™
• 3-6% better fuel economy
• Shaanxi Fast Gear Co., Ltd. joint venture enhances
clutch presence in China • Nittan joint venture extends our valvetrain reach in
Asia
28 © 2015 Eaton. All Rights Reserved..
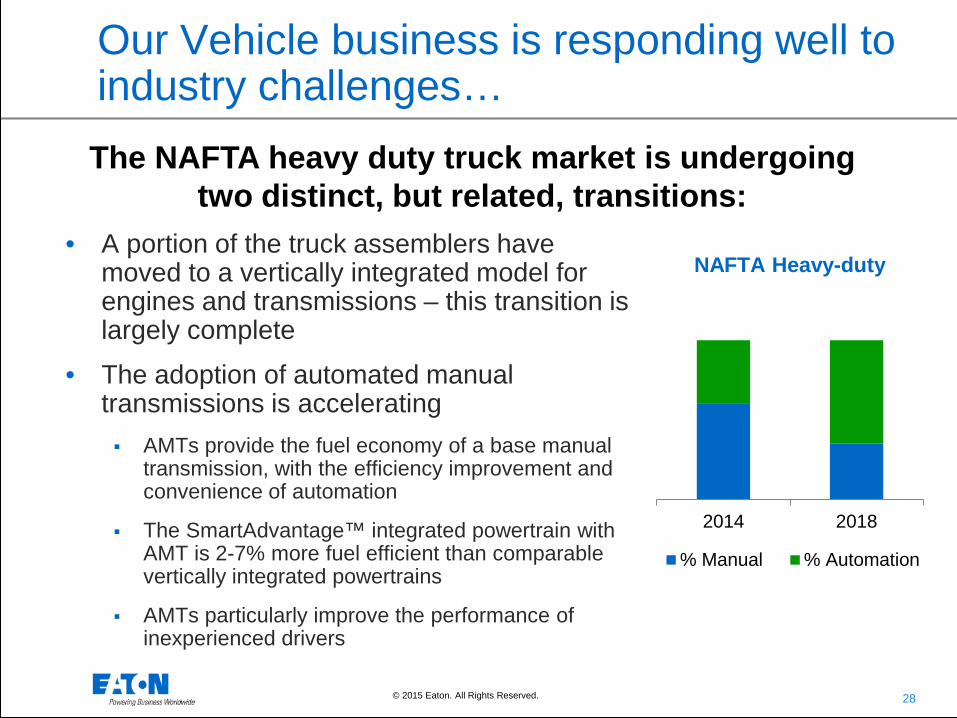
Our Vehicle business is responding well to industry challenges…
• A portion of the truck assemblers have moved to a vertically integrated model for engines and transmissions – this transition is largely complete
• The adoption of automated manual transmissions is accelerating AMTs provide the fuel economy of a base manual
transmission, with the efficiency improvement and convenience of automation
The SmartAdvantage™ integrated powertrain with AMT is 2-7% more fuel efficient than comparable vertically integrated powertrains
AMTs particularly improve the performance of inexperienced drivers
The NAFTA heavy duty truck market is undergoing two distinct, but related, transitions:
2014 2018
% Manual % Automation
NAFTA Heavy-duty

29 © 2015 Eaton. All Rights Reserved..
• Our enhanced product offerings continue to be preferred by most fleets • Fuel economy and service drive value for fleets • Eaton/Cummins partnership drives improved engine/transmission
system performance • Eaton’s SmartAdvantage AMT improves fuel economy up to 7% • Roadranger® service in the field
• The move to AMTs increases Eaton revenue • 40% - 50% higher selling price than equivalent manual products
• Launching Procision to penetrate the NA medium-duty
market
• Continued focus on growing share in aftermarket
…and we are taking actions that will enable Eaton to grow total revenues in the Vehicle Segment
30 © 2015 Eaton. All Rights Reserved..
Eaton – A Power Management Leader
• Power management strategy is working
• Leading Electrical franchise with a successful Cooper integration nearing completion
• Industrial businesses are well positioned for growth
• Strong margin, cash flow and attractive capital deployment alternatives strengthen prospects
• Outlook
31 © 2015 Eaton. All Rights Reserved..
0%
2%
4%
6%
8%
10%
12%
14%
16%
18%
20%
2000 2001 2002 2003 2004 2005 2006 2007 2008 2009 2010 2011 2012 2013 2014 2015e
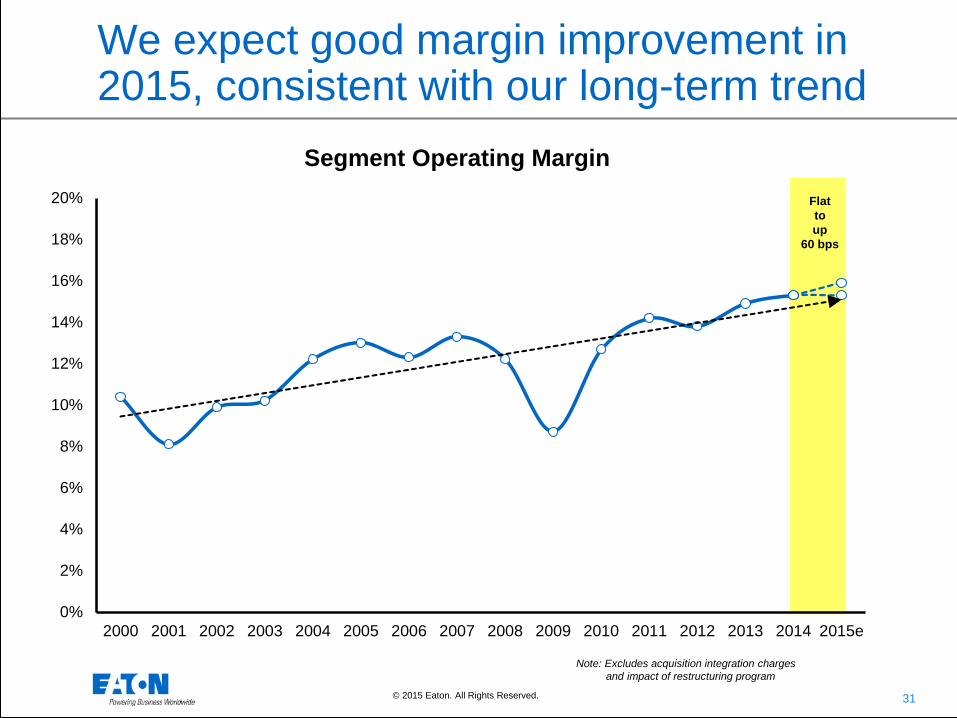
We expect good margin improvement in 2015, consistent with our long-term trend
Segment Operating Margin Flat to up
60 bps
Note: Excludes acquisition integration charges and impact of restructuring program

32 © 2015 Eaton. All Rights Reserved..
Our cash flow continues to grow rapidly and our cash earnings are strong
$0
$1
$2
$3
2011 2012 2013 2014* 2015E
Cash from Operations
($B
)
Indicates 2015 guidance range
Cash Earnings Exceed Operating EPS
$0
$3
$6
$9
2015E
Operating EPS EBITDA / Share
Notes: 1. Operating EPS excludes acquisition integration charges, Q2 2014 litigation settlements and gain from Aerospace divestitures 2. EBITDA / Share excludes acquisition integration charges

33 © 2015 Eaton. All Rights Reserved..
32%
33%
11%
23%
1%
Balance Sheet Repair 2013-2015
11%
7%
15%
67%
Portfolio Transformation 2000-2012
1%
31%
17% 14%
38%
Our capital allocation strategy has changed over time
Eaton Capital Allocation Over Time
Dividends Share Repurchase Debt Repayment Capex Acquisitions
Driving Equity Value 2016-2020

34 © 2015 Eaton. All Rights Reserved..
Summary of capital allocation plan
• We are comfortable maintaining an “A-” long-term debt rating
• Dividends are targeted to grow in line with future earnings growth Since 2005, dividends have increased by a CAGR of 14%
• We intend to use dividends and share repurchases to return between 4%-5% of our market cap to shareholders on an annual basis We plan to repurchase 1% to 2% of our shares each year Coupled with our historic dividend yield of ~3%
• For the balance of available capital, we intend to pursue M&A to continue advancing our businesses’ strategies
35 © 2015 Eaton. All Rights Reserved..
Eaton – A Power Management Leader
• Power management strategy is working
• Leading Electrical franchise with a successful Cooper integration nearing completion
• Industrial businesses are well positioned for growth
• Strong margin, cash flow and attractive capital deployment alternatives strengthen prospects
• Outlook

36 © 2015 Eaton. All Rights Reserved..
For 2015, organic revenue growth is expected to be 0% - 1%
Segment 2015 Organic Revenue Growth
Electrical 1% - 3%
Hydraulics (6)% - (8)%
Aerospace 2% - 4%
Vehicle 1% - 3%
Eaton Consolidated 0% - 1%
37 © 2015 Eaton. All Rights Reserved..
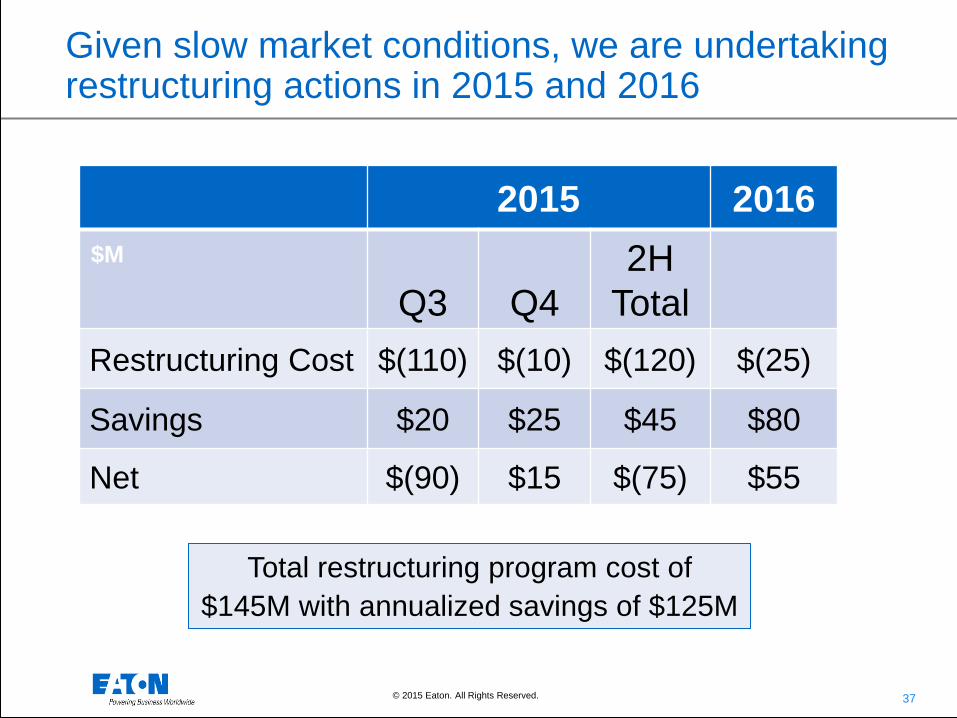
Given slow market conditions, we are undertaking restructuring actions in 2015 and 2016
2015 2016
Q3
Q4 2H
Total Restructuring Cost $(110) $(10) $(120) $(25)
Savings $20 $25 $45 $80
Net $(90) $15 $(75) $55
$M
Total restructuring program cost of $145M with annualized savings of $125M
38 © 2015 Eaton. All Rights Reserved..
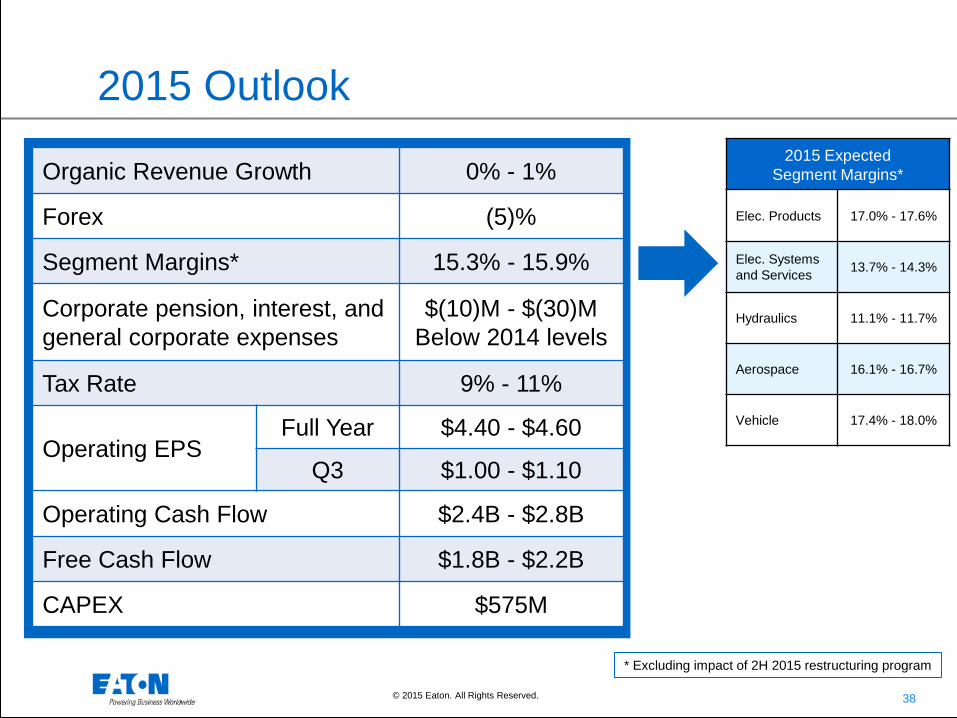
2015 Outlook 2015 Expected
Segment Margins*
Elec. Products 17.0% - 17.6%
Elec. Systems and Services 13.7% - 14.3%
Hydraulics 11.1% - 11.7%
Aerospace 16.1% - 16.7%
Vehicle 17.4% - 18.0%
Organic Revenue Growth 0% - 1%
Forex (5)%
Segment Margins* 15.3% - 15.9%
Corporate pension, interest, and general corporate expenses
$(10)M - $(30)M Below 2014 levels
Tax Rate 9% - 11%
Operating EPS Full Year $4.40 - $4.60
Q3 $1.00 - $1.10
Operating Cash Flow $2.4B - $2.8B
Free Cash Flow $1.8B - $2.2B
CAPEX $575M
* Excluding impact of 2H 2015 restructuring program
39 © 2015 Eaton. All Rights Reserved..
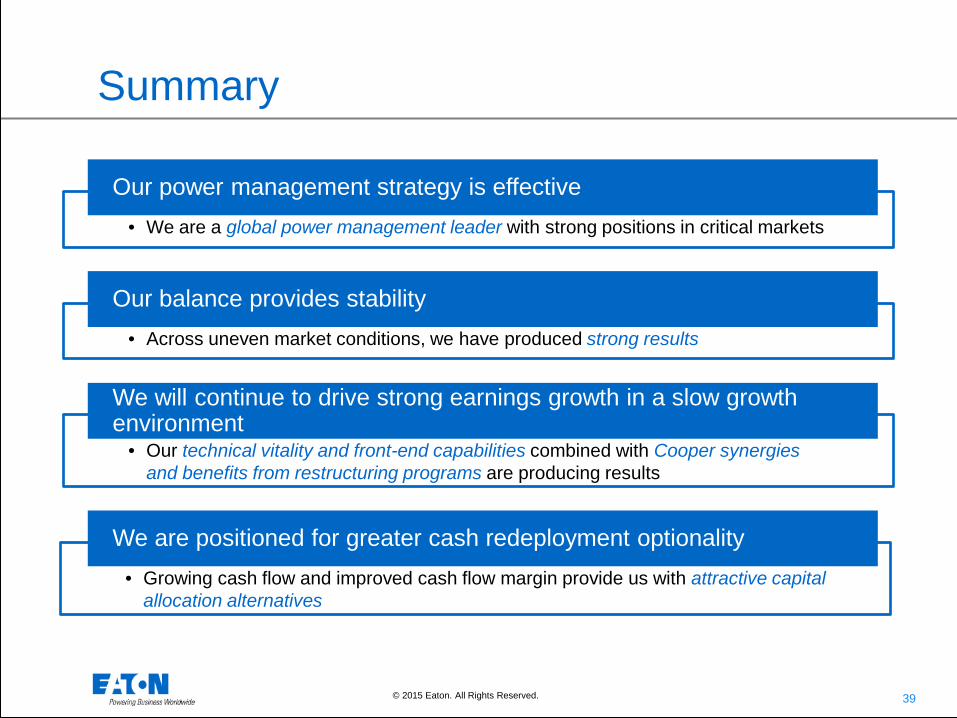
Summary
• We are a global power management leader with strong positions in critical markets
Our power management strategy is effective
• Our technical vitality and front-end capabilities combined with Cooper synergies and benefits from restructuring programs are producing results
We will continue to drive strong earnings growth in a slow growth environment
• Growing cash flow and improved cash flow margin provide us with attractive capital allocation alternatives
We are positioned for greater cash redeployment optionality
• Across uneven market conditions, we have produced strong results
Our balance provides stability

40 © 2015 Eaton. All Rights Reserved..