Embed Size (px)
Citation preview
2013-14 School Accountability Report Card — Published during the 2014-15 school yearIn accordance with state and federal requirements, the School Accountability Report Card (SARC) is put forth annually by all public schools as a tool for parents and interested parties to stay informed of the school’s progress, test scores and achievements.
Christopher High School CDS Code: 43-69484-0118380
850 Day Rd. Gilroy, CA 95020 • Phone: (408) 848-7171 • chs.gusd.ca.schoolloop.com Paul Winslow, Principal • Email: [email protected] • Grades: 9-12
Principal’s MessageIt is my honor to welcome you to the 2014-15 school year. My name is Paul Winslow, and I am excited to serve Christopher High School as your new principal. Beginning as a founding member of Christopher High School, I have served our students and community as a teacher, English department chair, assis-tant principal of curriculum and instruction, and now as principal, following the well-deserved retirement of former principal Mrs. Patricia Jolly. Our team will continue the amazing trajectory of academic excel-lence that Christopher High School has worked so hard to establish.
The Christopher High School staff prides itself on providing the rigor and relevance that are necessary to prepare our students for the demands they will face after high school. As students will gravitate toward many different college and career options, we offer a superb selection of both curricular and extracur-ricular opportunities for students to build their skills and express their talents. Even though Christopher High School is only entering into its sixth year, our passion and commitment to students are evidenced by our alumni and their presence in some of our nation’s most prestigious universities, including Stan-ford, Harvard, Cornell and nearly every California State University and University of California campus. In addition, our students are found serving our country in every branch of the military as well as learning trades to become productive members of our community and skilled workforce. All of our staff members, including the administration and the school secretaries, work in concert to provide students with the guidance, training and encouragement necessary to help our students realize their potential and attain the future they envision.
The Christopher High School learning environment is a key component to ensuring the success we have observed. Our team works together to address many of the issues that all high schools face. We have created a place where students can learn and grow, and have established systems and support structures to prevent bullying, gang activity, disrespectful behavior, substance abuse, as well as aca-demic apathy and dishonesty. Christopher High School firmly believes in and is vigilant in maintaining our academic culture, a culture that has become the trademark of our success since our opening.
This is an exciting year of opportunity and growth for all of our community and students. As a communi-ty, our students and parents form an integral part, and I would encourage all to participate in the amaz-ing curricular and extracurricular experiences or parent clubs that our school offers. Please access our website to find important dates, information regarding activities, and other helpful school information.
School Mission StatementAt Christopher High School, we aim to provide our culturally diverse students with a lifelong enthusiasm for learning within a safe environment. We foster character development and provide academic support so that each student achieves at his highest potential, graduates from high school, and is prepared for challenging postsecondary options.
Gilroy USD Mission StatementGilroy Unified School District will provide opportunities for all students to reach their highest academic and intellectual competencies and personal attributes to be lifelong learners, responsible citizens, and productive members of society. This will be accomplished by having a clear focus on student needs; the staff, parents, and community members demonstrating high expectations for themselves and for every child served; and by continually improving the quality of teaching and learning.
Types of Services FundedChristopher High School receives Gifted and Talented Education (GATE) funds. These funds are used to support our Honors and Advanced Placement (AP) courses (course development) and teacher profes-sional development. Our high school also receives Economic Impact Aid–Limited English Proficiency (EIA/LEP) funds which support our testing paraprofessional. School Library Improvement Grant (SLIG) funds are used to support our departments.
Gilroy USD Governing Board
Heather Bass
Mark Good
Patricia Midtgaard
James Pace
Linda Piceno
Jaime Rosso
Fred Tovar
Gilroy Unified School DistrictDeborah Flores, Ph.D., Superintendent Email: [email protected]
7810 Arroyo Circle Gilroy, CA 95020
Phone: (408) 847-2700
www.gusd.k12.ca.us
District Motto
“Expecting all students to use their hearts and minds well”
Para español visita: www.gusd.k12.ca.us
Gilroy USD Excellence: It Takes Everyone!
2Christopher High School
2013-14 School Accountability Report Card
Suspension and Expulsion Rates
Christopher HS
11-12 12-13 13-14
Suspension rates 9.7% 11.3% 7.9%
Expulsion rates 0.2% 0.3% 0.1%
Gilroy USD
11-12 12-13 13-14
Suspension rates 8.2% 7.0% 6.2%
Expulsion rates 0.3% 0.3% 0.1%
California
11-12 12-13 13-14
Suspension rates 5.7% 5.1% 4.4%
Expulsion rates 0.1% 0.1% 0.1%
Suspensions and ExpulsionsThis table shows the school, district, and state suspension and expulsion rates for the most recent three-year period. Note: Students are only counted one time, re-gardless of the number of suspensions.
Three-Year Data ComparisonNumber of Classrooms by Size
2011-12 2012-13 2013-14
Subject Number of Students
1-22 23-32 33+ 1-22 23-32 33+ 1-22 23-32 33+
English language arts 1 16 24 3 10 40 5 30 27
Mathematics 5 19 19 7 18 26 2 15 34
Science 6 21 11 2 39 10 6 46 5
History/social science 11 28 3 24 28 3 22 34
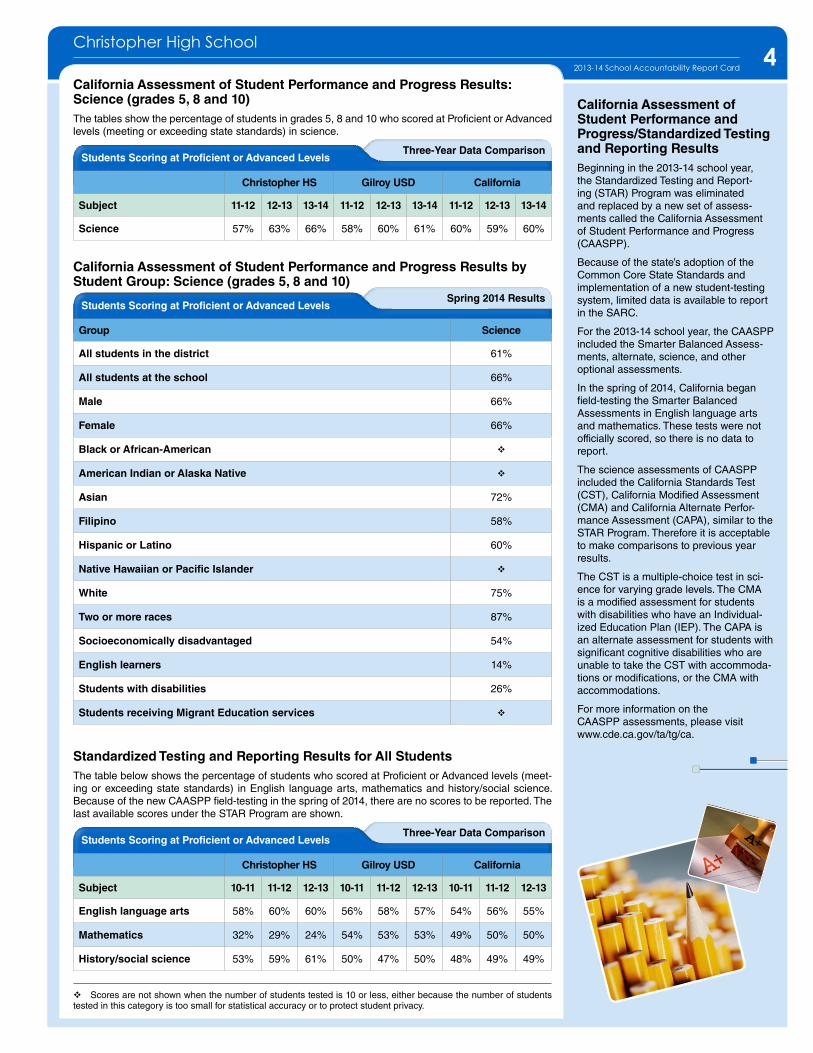
Three-Year Data ComparisonAverage Class Size
11-12 12-13 13-14
Class Size DistributionThe bar graph displays the three-year data for average class size, and the table displays the three-year data for the number of classrooms by size.
English-LanguageArts
Mathematics Science History-SocialScience
3330 29
34
29 30 3034
3032
28
33
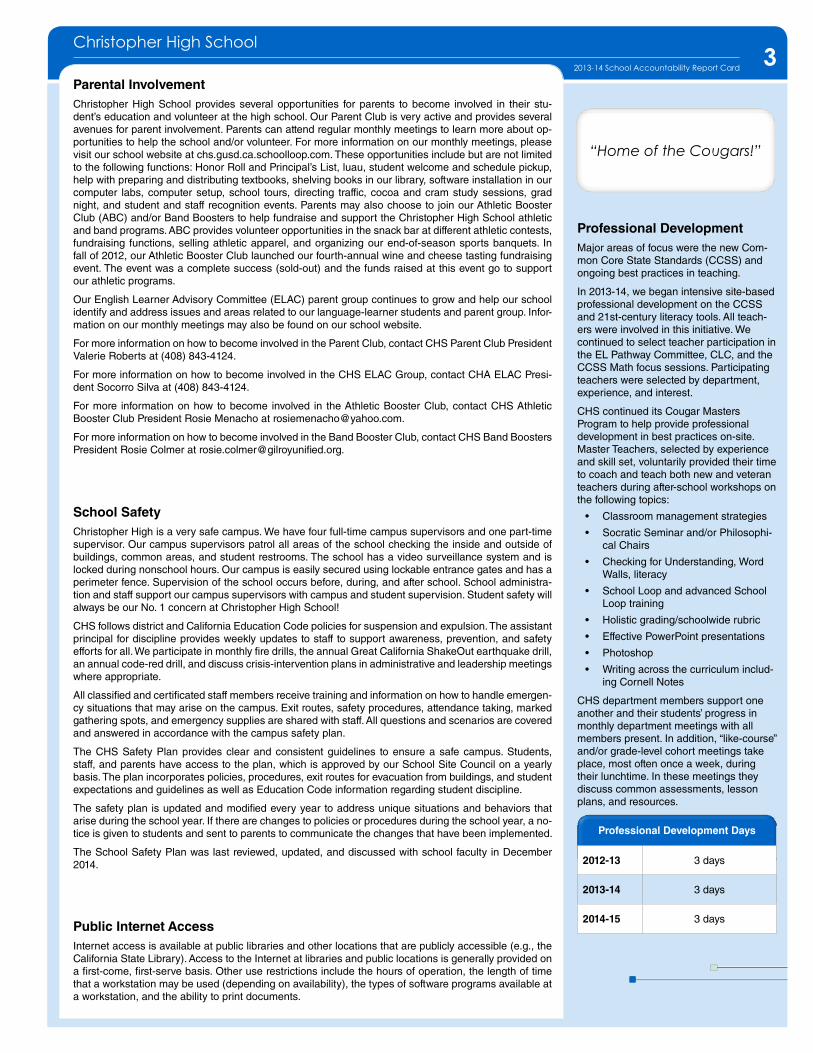
2013-14 Enrollment by Grade
Enrollment by Grade LevelThe bar graph displays the total number of students enrolled in each grade for the 2013-14 school year.
9
10
11
12
477
494
456
347
2013-14 School YearDemographics
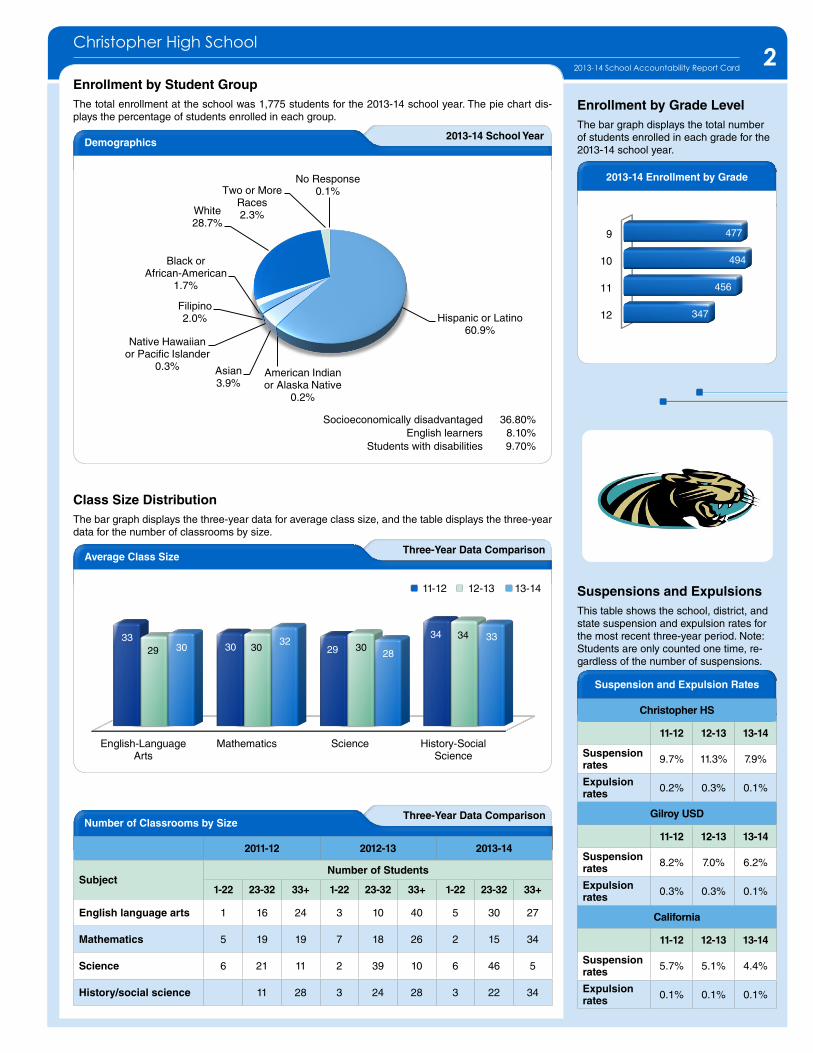
Enrollment by Student GroupThe total enrollment at the school was 1,775 students for the 2013-14 school year. The pie chart dis-plays the percentage of students enrolled in each group.
Socioeconomically disadvantaged 36.80%English learners 8.10%
Students with disabilities 9.70%
Hispanic or Latino60.9%
American Indian or Alaska Native
0.2%
Asian3.9%
Native Hawaiian or Pacific Islander
0.3%
Filipino2.0%
Black or African-American
1.7%
White28.7%
Two or More Races2.3%
No Response 0.1%
3Christopher High School
2013-14 School Accountability Report Card
Parental InvolvementChristopher High School provides several opportunities for parents to become involved in their stu-dent’s education and volunteer at the high school. Our Parent Club is very active and provides several avenues for parent involvement. Parents can attend regular monthly meetings to learn more about op-portunities to help the school and/or volunteer. For more information on our monthly meetings, please visit our school website at chs.gusd.ca.schoolloop.com. These opportunities include but are not limited to the following functions: Honor Roll and Principal’s List, luau, student welcome and schedule pickup, help with preparing and distributing textbooks, shelving books in our library, software installation in our computer labs, computer setup, school tours, directing traffic, cocoa and cram study sessions, grad night, and student and staff recognition events. Parents may also choose to join our Athletic Booster Club (ABC) and/or Band Boosters to help fundraise and support the Christopher High School athletic and band programs. ABC provides volunteer opportunities in the snack bar at different athletic contests, fundraising functions, selling athletic apparel, and organizing our end-of-season sports banquets. In fall of 2012, our Athletic Booster Club launched our fourth-annual wine and cheese tasting fundraising event. The event was a complete success (sold-out) and the funds raised at this event go to support our athletic programs.
Our English Learner Advisory Committee (ELAC) parent group continues to grow and help our school identify and address issues and areas related to our language-learner students and parent group. Infor-mation on our monthly meetings may also be found on our school website.
For more information on how to become involved in the Parent Club, contact CHS Parent Club President Valerie Roberts at (408) 843-4124.
For more information on how to become involved in the CHS ELAC Group, contact CHA ELAC Presi-dent Socorro Silva at (408) 843-4124.
For more information on how to become involved in the Athletic Booster Club, contact CHS Athletic Booster Club President Rosie Menacho at [email protected].
For more information on how to become involved in the Band Booster Club, contact CHS Band Boosters President Rosie Colmer at [email protected].
School SafetyChristopher High is a very safe campus. We have four full-time campus supervisors and one part-time supervisor. Our campus supervisors patrol all areas of the school checking the inside and outside of buildings, common areas, and student restrooms. The school has a video surveillance system and is locked during nonschool hours. Our campus is easily secured using lockable entrance gates and has a perimeter fence. Supervision of the school occurs before, during, and after school. School administra-tion and staff support our campus supervisors with campus and student supervision. Student safety will always be our No. 1 concern at Christopher High School!
CHS follows district and California Education Code policies for suspension and expulsion. The assistant principal for discipline provides weekly updates to staff to support awareness, prevention, and safety efforts for all. We participate in monthly fire drills, the annual Great California ShakeOut earthquake drill, an annual code-red drill, and discuss crisis-intervention plans in administrative and leadership meetings where appropriate.
All classified and certificated staff members receive training and information on how to handle emergen-cy situations that may arise on the campus. Exit routes, safety procedures, attendance taking, marked gathering spots, and emergency supplies are shared with staff. All questions and scenarios are covered and answered in accordance with the campus safety plan.
The CHS Safety Plan provides clear and consistent guidelines to ensure a safe campus. Students, staff, and parents have access to the plan, which is approved by our School Site Council on a yearly basis. The plan incorporates policies, procedures, exit routes for evacuation from buildings, and student expectations and guidelines as well as Education Code information regarding student discipline.
The safety plan is updated and modified every year to address unique situations and behaviors that arise during the school year. If there are changes to policies or procedures during the school year, a no-tice is given to students and sent to parents to communicate the changes that have been implemented.
The School Safety Plan was last reviewed, updated, and discussed with school faculty in December 2014.
Professional DevelopmentMajor areas of focus were the new Com-mon Core State Standards (CCSS) and ongoing best practices in teaching.
In 2013-14, we began intensive site-based professional development on the CCSS and 21st-century literacy tools. All teach-ers were involved in this initiative. We continued to select teacher participation in the EL Pathway Committee, CLC, and the CCSS Math focus sessions. Participating teachers were selected by department, experience, and interest.
CHS continued its Cougar Masters Program to help provide professional development in best practices on-site. Master Teachers, selected by experience and skill set, voluntarily provided their time to coach and teach both new and veteran teachers during after-school workshops on the following topics:
• Classroom management strategies
• Socratic Seminar and/or Philosophi-cal Chairs
• Checking for Understanding, Word Walls, literacy
• School Loop and advanced School Loop training
• Holistic grading/schoolwide rubric
• Effective PowerPoint presentations
• Photoshop
• Writing across the curriculum includ-ing Cornell Notes
CHS department members support one another and their students’ progress in monthly department meetings with all members present. In addition, “like-course” and/or grade-level cohort meetings take place, most often once a week, during their lunchtime. In these meetings they discuss common assessments, lesson plans, and resources.
Professional Development Days
2012-13 3 days
2013-14 3 days
2014-15 3 daysPublic Internet AccessInternet access is available at public libraries and other locations that are publicly accessible (e.g., the California State Library). Access to the Internet at libraries and public locations is generally provided on a first-come, first-serve basis. Other use restrictions include the hours of operation, the length of time that a workstation may be used (depending on availability), the types of software programs available at a workstation, and the ability to print documents.
“Home of the Cougars!”
4Christopher High School
2013-14 School Accountability Report Card
v Scores are not shown when the number of students tested is 10 or less, either because the number of students tested in this category is too small for statistical accuracy or to protect student privacy.
Spring 2014 ResultsStudents Scoring at Proficient or Advanced Levels
Group Science
All students in the district 61%
All students at the school 66%
Male 66%
Female 66%
Black or African-American v
American Indian or Alaska Native v
Asian 72%
Filipino 58%
Hispanic or Latino 60%
Native Hawaiian or Pacific Islander v
White 75%
Two or more races 87%
Socioeconomically disadvantaged 54%
English learners 14%
Students with disabilities 26%
Students receiving Migrant Education services v
Three-Year Data ComparisonStudents Scoring at Proficient or Advanced Levels
Christopher HS Gilroy USD California
Subject 10-11 11-12 12-13 10-11 11-12 12-13 10-11 11-12 12-13
English language arts 58% 60% 60% 56% 58% 57% 54% 56% 55%
Mathematics 32% 29% 24% 54% 53% 53% 49% 50% 50%
History/social science 53% 59% 61% 50% 47% 50% 48% 49% 49%
Standardized Testing and Reporting Results for All Students The table below shows the percentage of students who scored at Proficient or Advanced levels (meet-ing or exceeding state standards) in English language arts, mathematics and history/social science. Because of the new CAASPP field-testing in the spring of 2014, there are no scores to be reported. The last available scores under the STAR Program are shown.
California Assessment of Student Performance and Progress Results by Student Group: Science (grades 5, 8 and 10)
California Assessment of Student Performance and Progress/Standardized Testing and Reporting Results Beginning in the 2013-14 school year, the Standardized Testing and Report-ing (STAR) Program was eliminated and replaced by a new set of assess-ments called the California Assessment of Student Performance and Progress (CAASPP).
Because of the state’s adoption of the Common Core State Standards and implementation of a new student-testing system, limited data is available to report in the SARC.
For the 2013-14 school year, the CAASPP included the Smarter Balanced Assess-ments, alternate, science, and other optional assessments.
In the spring of 2014, California began field-testing the Smarter Balanced Assessments in English language arts and mathematics. These tests were not officially scored, so there is no data to report.
The science assessments of CAASPP included the California Standards Test (CST), California Modified Assessment (CMA) and California Alternate Perfor-mance Assessment (CAPA), similar to the STAR Program. Therefore it is acceptable to make comparisons to previous year results.
The CST is a multiple-choice test in sci-ence for varying grade levels. The CMA is a modified assessment for students with disabilities who have an Individual-ized Education Plan (IEP). The CAPA is an alternate assessment for students with significant cognitive disabilities who are unable to take the CST with accommoda-tions or modifications, or the CMA with accommodations.
For more information on the CAASPP assessments, please visit www.cde.ca.gov/ta/tg/ca.
Three-Year Data ComparisonStudents Scoring at Proficient or Advanced Levels
Christopher HS Gilroy USD California
Subject 11-12 12-13 13-14 11-12 12-13 13-14 11-12 12-13 13-14
Science 57% 63% 66% 58% 60% 61% 60% 59% 60%
California Assessment of Student Performance and Progress Results: Science (grades 5, 8 and 10)The tables show the percentage of students in grades 5, 8 and 10 who scored at Proficient or Advanced levels (meeting or exceeding state standards) in science.
5
Academic Performance IndexThe Academic Performance Index (API) is a numeric rating system that reflects a school and district’s performance level based on the results of annual statewide student assess-ments. It is used to measure the academic performance and progress of the schools within California. Individual outcomes are converted to points on the API scale and then averaged across all students and all tests, resulting in a single number, or API score, measured on a scale from 200 to 1,000. This score reflects the school, district or a student group’s per-formance level based on the results of statewide testing. The state has set an API score of 800 as the statewide target.
With a complete change of the K-12 education system, the State Board of Education tem-porarily suspended API. No API scores or ranks will be calculated for the next two years, as California continues the transition to the new Common Core State Standards and California Assessment of Student Performance and Progress.
To learn more about API, please visit www.cde.ca.gov/ta/ac/ap for the API information guide and www.cde.ca.gov/ta/ac/ar/aprfaq.asp for information on the changes to API.
5Christopher High School
2013-14 School Accountability Report Card
API Ranks
Three-Year Data Comparison
2011 2012 2013
Statewide API Rank 8 7 7
Similar Schools API Rank 7 6 6
nData are reported only for numerically significant groups.
v Scores are not shown when the number of students tested is 10 or less, either because the number of students tested in this category is too small for statistical accuracy or to protect student privacy.
2013 Growth API and Three-Year Data ComparisonAPI Growth by Student Group
Group2013 Growth API Christopher HS –
Actual API Change
Christopher HS Gilroy USD California 10-11 11-12 12-13
All students 801 804 790 14 3 1
Black or African-American 792 835 707 n n n
American Indian or Alaska Native v 866 742 n n n
Asian 891 923 906 n n n
Filipino 802 893 867 n n n
Hispanic or Latino 772 770 743 3 5 6
Native Hawaiian or Pacific Islander v 764 773 n n n
White 844 880 852 6 -7 1
Two or more races 826 861 845 n n n
Socioeconomically disadvantaged 753 759 742 11 3 6
English learners 678 731 717 14 -8 3
Students with disabilities 622 639 616 n n n
API Growth by Student GroupAssessment data is reported only for numerically significant groups. To be considered numerically significant for the API, the group must have either: at least 50 students with valid STAR scores who make up at least 15 percent of the total valid STAR scores, or at least 100 students with valid STAR scores. This table displays, by student group, first, the 2013 Growth API at the school, district and state level followed by the actual API change in points added or lost for the past three years at the school.
API RanksSchools are ranked in 10 categories of equal size, called deciles, from 1 (lowest) to 10 (highest) based on their API Base reports. A school’s “statewide API rank” com-pares its API to the APIs of all other schools statewide of the same type (elementary, middle or high school). A “similar schools API rank” reflects how a school com-pares to 100 statistically matched similar schools. This table shows the school’s three-year data for statewide API rank and similar schools’ API rank.
6Christopher High School
2013-14 School Accountability Report Card
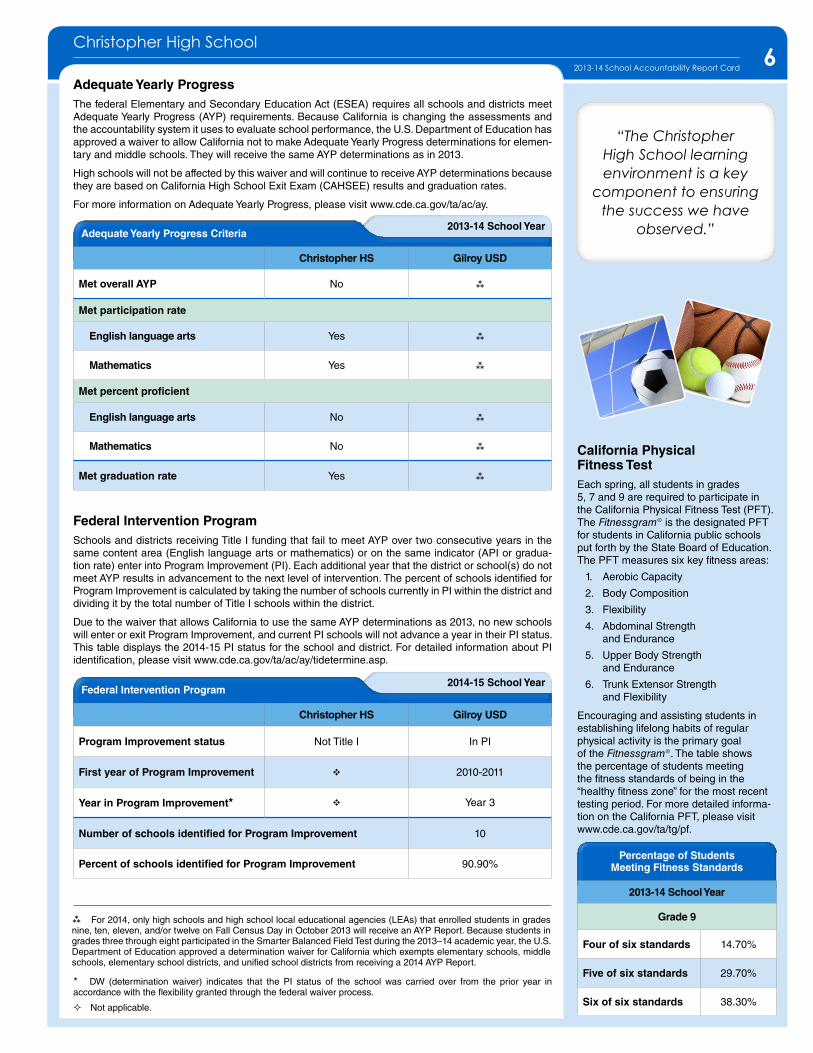
2013-14 School YearAdequate Yearly Progress Criteria
Christopher HS Gilroy USD
Met overall AYP No
Met participation rate
English language arts Yes
Mathematics Yes
Met percent proficient
English language arts No
Mathematics No
Met graduation rate Yes
Adequate Yearly ProgressThe federal Elementary and Secondary Education Act (ESEA) requires all schools and districts meet Adequate Yearly Progress (AYP) requirements. Because California is changing the assessments and the accountability system it uses to evaluate school performance, the U.S. Department of Education has approved a waiver to allow California not to make Adequate Yearly Progress determinations for elemen-tary and middle schools. They will receive the same AYP determinations as in 2013.
High schools will not be affected by this waiver and will continue to receive AYP determinations because they are based on California High School Exit Exam (CAHSEE) results and graduation rates.
For more information on Adequate Yearly Progress, please visit www.cde.ca.gov/ta/ac/ay.
2014-15 School YearFederal Intervention Program
Christopher HS Gilroy USD
Program Improvement status Not Title I In PI
First year of Program Improvement v 2010-2011
Year in Program Improvement* v Year 3
Number of schools identified for Program Improvement 10
Percent of schools identified for Program Improvement 90.90%
Federal Intervention ProgramSchools and districts receiving Title I funding that fail to meet AYP over two consecutive years in the same content area (English language arts or mathematics) or on the same indicator (API or gradua-tion rate) enter into Program Improvement (PI). Each additional year that the district or school(s) do not meet AYP results in advancement to the next level of intervention. The percent of schools identified for Program Improvement is calculated by taking the number of schools currently in PI within the district and dividing it by the total number of Title I schools within the district.
Due to the waiver that allows California to use the same AYP determinations as 2013, no new schools will enter or exit Program Improvement, and current PI schools will not advance a year in their PI status. This table displays the 2014-15 PI status for the school and district. For detailed information about PI identification, please visit www.cde.ca.gov/ta/ac/ay/tidetermine.asp.
² Not applicable.
For 2014, only high schools and high school local educational agencies (LEAs) that enrolled students in grades nine, ten, eleven, and/or twelve on Fall Census Day in October 2013 will receive an AYP Report. Because students in grades three through eight participated in the Smarter Balanced Field Test during the 2013–14 academic year, the U.S. Department of Education approved a determination waiver for California which exempts elementary schools, middle schools, elementary school districts, and unified school districts from receiving a 2014 AYP Report.
DW (determination waiver) indicates that the PI status of the school was carried over from the prior year in accordance with the flexibility granted through the federal waiver process.*
Percentage of Students Meeting Fitness Standards
2013-14 School Year
Grade 9
Four of six standards 14.70%
Five of six standards 29.70%
Six of six standards 38.30%
California Physical Fitness TestEach spring, all students in grades 5, 7 and 9 are required to participate in the California Physical Fitness Test (PFT). The Fitnessgram® is the designated PFT for students in California public schools put forth by the State Board of Education. The PFT measures six key fitness areas:
1. Aerobic Capacity
2. Body Composition
3. Flexibility
4. Abdominal Strength and Endurance
5. Upper Body Strength and Endurance
6. Trunk Extensor Strength and Flexibility
Encouraging and assisting students in establishing lifelong habits of regular physical activity is the primary goal of the Fitnessgram®. The table shows the percentage of students meeting the fitness standards of being in the “healthy fitness zone” for the most recent testing period. For more detailed informa-tion on the California PFT, please visit www.cde.ca.gov/ta/tg/pf.
“The Christopher High School learning environment is a key
component to ensuring the success we have
observed.”
777
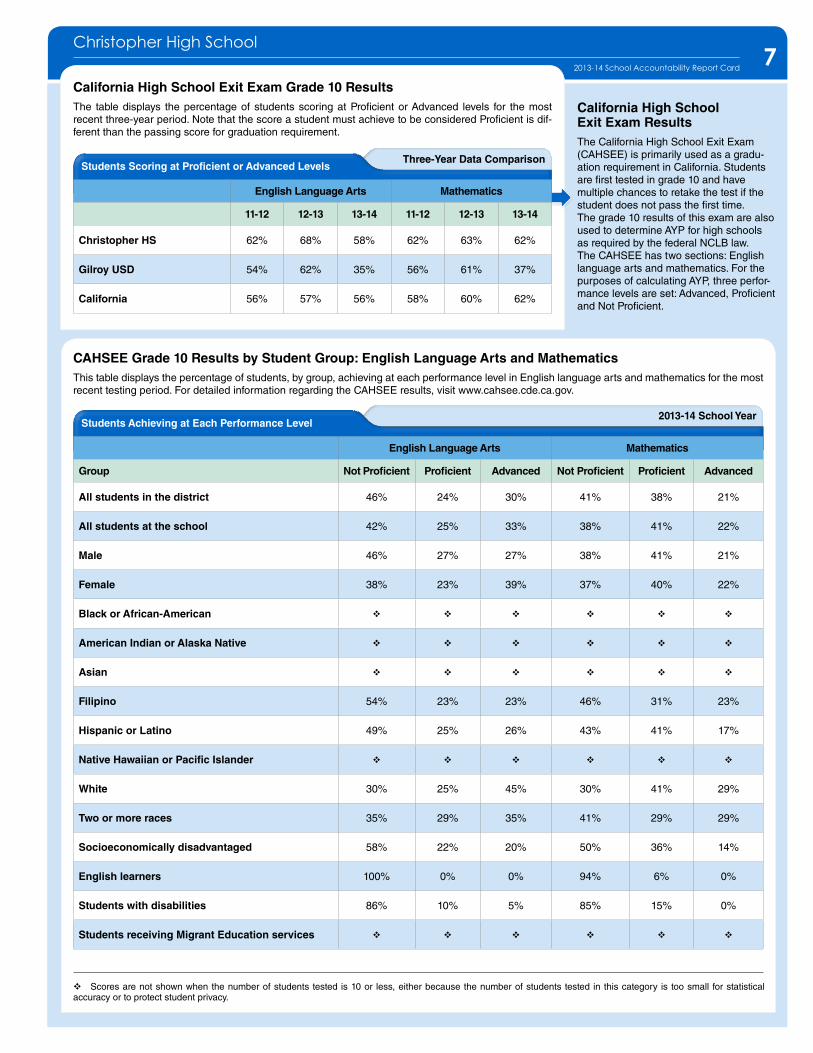
California High School Exit Exam ResultsThe California High School Exit Exam (CAHSEE) is primarily used as a gradu-ation requirement in California. Students are first tested in grade 10 and have multiple chances to retake the test if the student does not pass the first time. The grade 10 results of this exam are also used to determine AYP for high schools as required by the federal NCLB law. The CAHSEE has two sections: English language arts and mathematics. For the purposes of calculating AYP, three perfor-mance levels are set: Advanced, Proficient and Not Proficient.
7Christopher High School
2013-14 School Accountability Report Card
Three-Year Data ComparisonStudents Scoring at Proficient or Advanced Levels
English Language Arts Mathematics
11-12 12-13 13-14 11-12 12-13 13-14
Christopher HS 62% 68% 58% 62% 63% 62%
Gilroy USD 54% 62% 35% 56% 61% 37%
California 56% 57% 56% 58% 60% 62%
California High School Exit Exam Grade 10 ResultsThe table displays the percentage of students scoring at Proficient or Advanced levels for the most recent three-year period. Note that the score a student must achieve to be considered Proficient is dif-ferent than the passing score for graduation requirement.
v Scores are not shown when the number of students tested is 10 or less, either because the number of students tested in this category is too small for statistical accuracy or to protect student privacy.
2013-14 School YearStudents Achieving at Each Performance Level
English Language Arts Mathematics
Group Not Proficient Proficient Advanced Not Proficient Proficient Advanced
All students in the district 46% 24% 30% 41% 38% 21%
All students at the school 42% 25% 33% 38% 41% 22%
Male 46% 27% 27% 38% 41% 21%
Female 38% 23% 39% 37% 40% 22%
Black or African-American v v v v v v
American Indian or Alaska Native v v v v v v
Asian v v v v v v
Filipino 54% 23% 23% 46% 31% 23%
Hispanic or Latino 49% 25% 26% 43% 41% 17%
Native Hawaiian or Pacific Islander v v v v v v
White 30% 25% 45% 30% 41% 29%
Two or more races 35% 29% 35% 41% 29% 29%
Socioeconomically disadvantaged 58% 22% 20% 50% 36% 14%
English learners 100% 0% 0% 94% 6% 0%
Students with disabilities 86% 10% 5% 85% 15% 0%
Students receiving Migrant Education services v v v v v v
CAHSEE Grade 10 Results by Student Group: English Language Arts and MathematicsThis table displays the percentage of students, by group, achieving at each performance level in English language arts and mathematics for the most recent testing period. For detailed information regarding the CAHSEE results, visit www.cahsee.cde.ca.gov.

8Christopher High School
2013-14 School Accountability Report Card
Admission Requirements for California’s Public UniversitiesUniversity of California: Admission requirements for the University of California (UC) follow guidelines set forth in the Master Plan, which requires that the top one-eighth of the state’s high school graduates, as well as those transfer students who have successfully completed specified college course work, be eligible for admission to the UC. These requirements are designed to ensure that all eligible students are adequately prepared for university-level work. For general admissions requirements, please visit the UC Admissions Information Web page at http://admission.universityofcalifornia.edu.
California State University: Eligibility for admission to the California State University (CSU) is deter-mined by three factors: 1. specific high school courses, 2. grades in specified courses and test scores, and 3. graduation from high school. Some campuses have higher standards for particular majors or students who live outside the local campus area. Because of the number of students who apply, a few campuses have higher standards (supplementary admission criteria) for all applicants. Most CSU cam-puses have local admission-guarantee policies for students who graduate or transfer from high schools and colleges that are historically served by a CSU campus in that region. For admission, application and fee information, see the CSU Web page at www.calstate.edu/admission/admission.shtml.
2012-13 and 2013-14 School YearsUC/CSU Admission
Christopher HS
Percentage of students enrolled in courses required for UC or CSU admission in 2013-14 80.52%
Percentage of graduates who completed all courses required for UC or CSU admission in 2012-13 32.01%
Course Enrollment for UC and CSU AdmissionThe table displays two measures related to the school’s courses that are required for University of Cali-fornia and California State University admission for the most recent year for which data is available. For more detailed information, visit http://dq.cde.ca.gov/dataquest.
Career Technical Education Data
Christopher HS
2013-14 Participation
Number of pupils participating in CTE 611
Percentage of pupils who completed a CTE program and earned a high school diploma
39
Percentage of CTE courses that are sequenced or articulated between a school and institutions of postsecondary education
0
Career Technical Education ParticipationThis table displays information about par-ticipation in the school’s Career Technical Education (CTE) programs.
Career Technical Education ProgramsChristopher High School offers two Career Technical Education pathways: Performing Arts and Digital Media. CHS Assistant Principal Mr. Kapaku serves as our high school’s CTE representative.
The following CTE courses are offered at our school:
• Metalworking I & II
• Woodworking I & II
• Yearbook (Digital)
• Intro to Digital Media
The following ROP courses are available to students:
• Digital Design and Animation
• Advanced Digital Design and Animation
• Dance
Our high school works hard to provide our staff members with time and opportunities to collaborate on cross-curricular activities. In weekly leadership meetings, department chairpersons discuss, plan, and share cross-curricular ideas, events, and results.
One example of this includes the work that has taken place between our English department, social sciences, and arts department. Our students study the Holocaust through the lens of each discipline, join together in presentations by guest speakers, and then culminate the units with a field trip to the Mu-seum of Tolerance. Another example is that of the world languages, art, and English departments, who collaborate on daily lessons and art work culminating in an evening celebration of Día de los Muertos.
Christopher High School continues to be a full-inclusion high school; our special-education students have access to all of the general-education electives, college prep, honors, and AP classes with their peers. We have a belief at CHS that all of our students will be prepared to follow their dreams and attend college, trade school, serve in our armed forces, etc., but we will default to being college-ready.
The measurable outcomes include data analysis from the following: chapter and unit exams, California High School Exit Exam, California Standards Tests, California English Language Development Test, and teacher, parent, and student input. We determine effectiveness based on academic growth and close analysis of student, parent, teacher, academic coordinator, and administrator input. Each year, our data analysis has led us to further refinement of courses, inclusion strategies, and EL support. Based on data from these sources, we continue with an ELD 1-2 class, and added a SDAIE Global Studies Course, two Strategic English I classes, the PASS program, and shadow tutoring in math for our EL students. We offer 13 AP courses.
• Digital Design and Animation
• Advanced Digital Design and Animation
• Audio Video Production
• Digital Photography
“Our high school works hard to provide our staff members with
time and opportunities to collaborate on
cross-curricular activities.”
99Christopher High School
2013-14 School Accountability Report Card
v Scores are not shown when the number of students tested is 10 or less, either because the number of students tested in this category is too small for statistical accuracy or to protect student privacy.
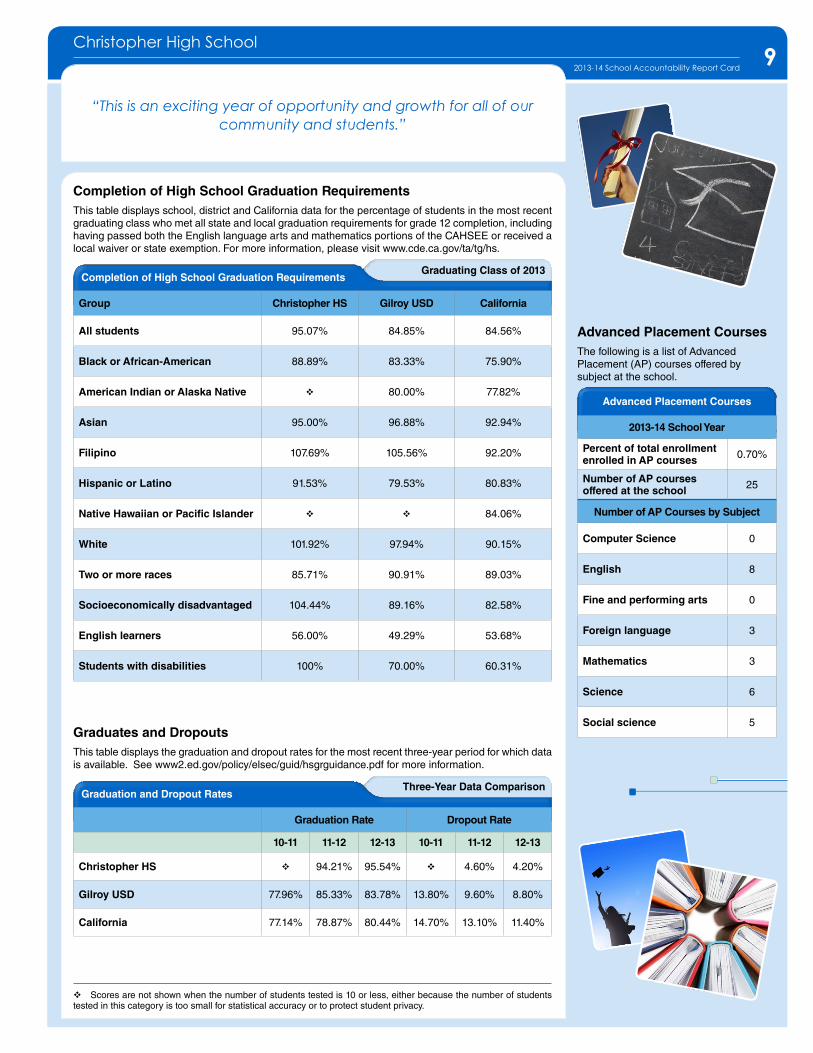
“This is an exciting year of opportunity and growth for all of our community and students.”
Graduating Class of 2013Completion of High School Graduation Requirements
Group Christopher HS Gilroy USD California
All students 95.07% 84.85% 84.56%
Black or African-American 88.89% 83.33% 75.90%
American Indian or Alaska Native v 80.00% 77.82%
Asian 95.00% 96.88% 92.94%
Filipino 107.69% 105.56% 92.20%
Hispanic or Latino 91.53% 79.53% 80.83%
Native Hawaiian or Pacific Islander v v 84.06%
White 101.92% 97.94% 90.15%
Two or more races 85.71% 90.91% 89.03%
Socioeconomically disadvantaged 104.44% 89.16% 82.58%
English learners 56.00% 49.29% 53.68%
Students with disabilities 100% 70.00% 60.31%
Completion of High School Graduation RequirementsThis table displays school, district and California data for the percentage of students in the most recent graduating class who met all state and local graduation requirements for grade 12 completion, including having passed both the English language arts and mathematics portions of the CAHSEE or received a local waiver or state exemption. For more information, please visit www.cde.ca.gov/ta/tg/hs.
Three-Year Data ComparisonGraduation and Dropout Rates
Graduation Rate Dropout Rate
10-11 11-12 12-13 10-11 11-12 12-13
Christopher HS v 94.21% 95.54% v 4.60% 4.20%
Gilroy USD 77.96% 85.33% 83.78% 13.80% 9.60% 8.80%
California 77.14% 78.87% 80.44% 14.70% 13.10% 11.40%
Graduates and DropoutsThis table displays the graduation and dropout rates for the most recent three-year period for which data is available. See www2.ed.gov/policy/elsec/guid/hsgrguidance.pdf for more information.
Advanced Placement Courses
2013-14 School Year
Percent of total enrollment enrolled in AP courses 0.70%
Number of AP courses offered at the school 25
Number of AP Courses by Subject
Computer Science 0
English 8
Fine and performing arts 0
Foreign language 3
Mathematics 3
Science 6
Social science 5
Advanced Placement CoursesThe following is a list of Advanced Placement (AP) courses offered by subject at the school.
10Christopher High School
2013-14 School Accountability Report Card
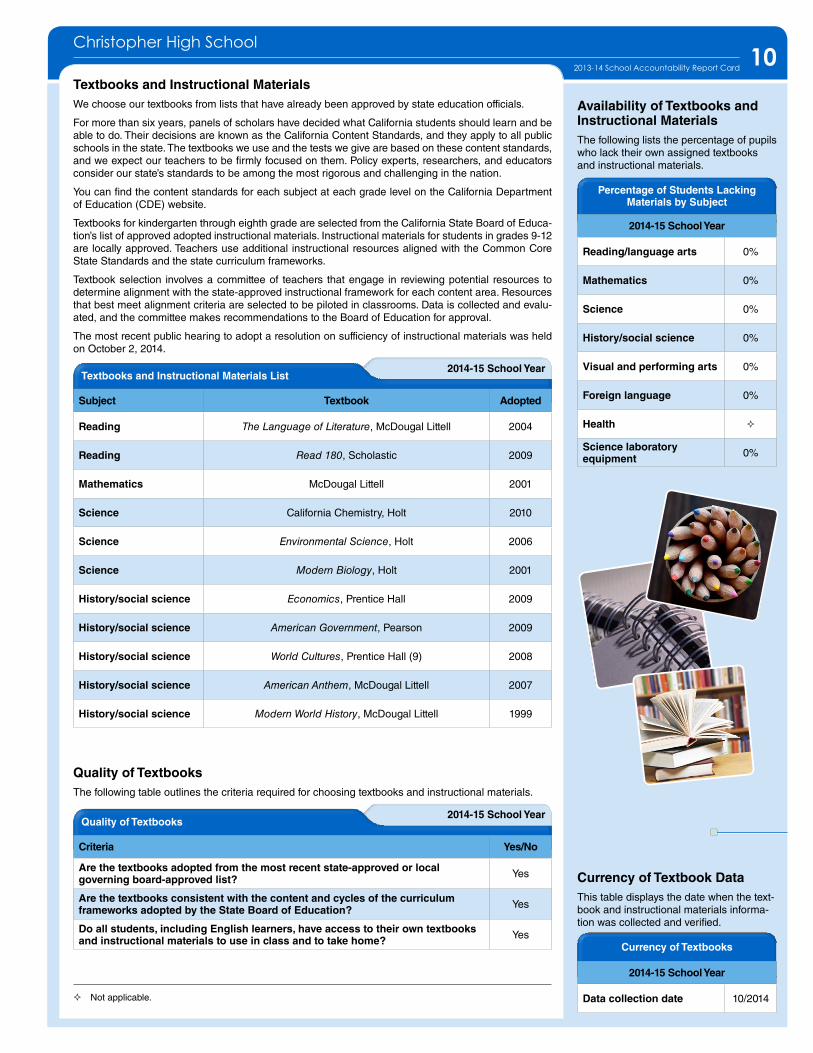
Percentage of Students Lacking Materials by Subject
2014-15 School Year
Reading/language arts 0%
Mathematics 0%
Science 0%
History/social science 0%
Visual and performing arts 0%
Foreign language 0%
Health ²
Science laboratory equipment 0%
2014-15 School YearTextbooks and Instructional Materials List
Subject Textbook Adopted
Reading The Language of Literature, McDougal Littell 2004
Reading Read 180, Scholastic 2009
Mathematics McDougal Littell 2001
Science California Chemistry, Holt 2010
Science Environmental Science, Holt 2006
Science Modern Biology, Holt 2001
History/social science Economics, Prentice Hall 2009
History/social science American Government, Pearson 2009
History/social science World Cultures, Prentice Hall (9) 2008
History/social science American Anthem, McDougal Littell 2007
History/social science Modern World History, McDougal Littell 1999
Textbooks and Instructional MaterialsWe choose our textbooks from lists that have already been approved by state education officials.
For more than six years, panels of scholars have decided what California students should learn and be able to do. Their decisions are known as the California Content Standards, and they apply to all public schools in the state. The textbooks we use and the tests we give are based on these content standards, and we expect our teachers to be firmly focused on them. Policy experts, researchers, and educators consider our state’s standards to be among the most rigorous and challenging in the nation.
You can find the content standards for each subject at each grade level on the California Department of Education (CDE) website.
Textbooks for kindergarten through eighth grade are selected from the California State Board of Educa-tion’s list of approved adopted instructional materials. Instructional materials for students in grades 9-12 are locally approved. Teachers use additional instructional resources aligned with the Common Core State Standards and the state curriculum frameworks.
Textbook selection involves a committee of teachers that engage in reviewing potential resources to determine alignment with the state-approved instructional framework for each content area. Resources that best meet alignment criteria are selected to be piloted in classrooms. Data is collected and evalu-ated, and the committee makes recommendations to the Board of Education for approval.
The most recent public hearing to adopt a resolution on sufficiency of instructional materials was held on October 2, 2014.
2014-15 School YearQuality of Textbooks
Criteria Yes/No
Are the textbooks adopted from the most recent state-approved or local governing board-approved list? Yes
Are the textbooks consistent with the content and cycles of the curriculum frameworks adopted by the State Board of Education? Yes
Do all students, including English learners, have access to their own textbooks and instructional materials to use in class and to take home? Yes
Quality of TextbooksThe following table outlines the criteria required for choosing textbooks and instructional materials.
Availability of Textbooks and Instructional MaterialsThe following lists the percentage of pupils who lack their own assigned textbooks and instructional materials.
Currency of Textbooks
2014-15 School Year
Data collection date 10/2014
Currency of Textbook DataThis table displays the date when the text-book and instructional materials informa-tion was collected and verified.
²Not applicable.
11Christopher High School
2013-14 School Accountability Report Card
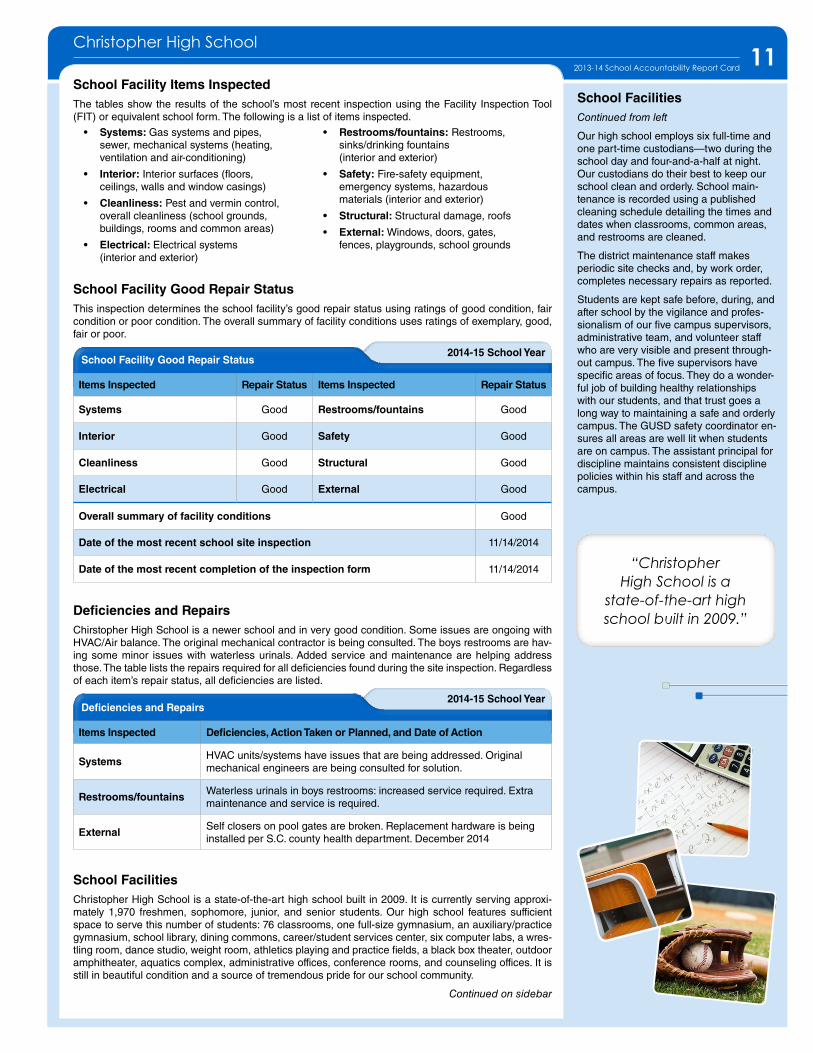
• Systems: Gas systems and pipes, sewer, mechanical systems (heating, ventilation and air-conditioning)
• Interior: Interior surfaces (floors, ceilings, walls and window casings)
• Cleanliness: Pest and vermin control, overall cleanliness (school grounds, buildings, rooms and common areas)
• Electrical: Electrical systems (interior and exterior)
• Restrooms/fountains: Restrooms, sinks/drinking fountains (interior and exterior)
• Safety: Fire-safety equipment, emergency systems, hazardous materials (interior and exterior)
• Structural: Structural damage, roofs
• External: Windows, doors, gates, fences, playgrounds, school grounds
School Facility Items Inspected The tables show the results of the school’s most recent inspection using the Facility Inspection Tool (FIT) or equivalent school form. The following is a list of items inspected.
2014-15 School YearDeficiencies and Repairs
Items Inspected Deficiencies, Action Taken or Planned, and Date of Action
Systems HVAC units/systems have issues that are being addressed. Original mechanical engineers are being consulted for solution.
Restrooms/fountains Waterless urinals in boys restrooms: increased service required. Extra maintenance and service is required.
External Self closers on pool gates are broken. Replacement hardware is being installed per S.C. county health department. December 2014
Deficiencies and RepairsChirstopher High School is a newer school and in very good condition. Some issues are ongoing with HVAC/Air balance. The original mechanical contractor is being consulted. The boys restrooms are hav-ing some minor issues with waterless urinals. Added service and maintenance are helping address those. The table lists the repairs required for all deficiencies found during the site inspection. Regardless of each item’s repair status, all deficiencies are listed.
School FacilitiesContinued from left
Our high school employs six full-time and one part-time custodians—two during the school day and four-and-a-half at night. Our custodians do their best to keep our school clean and orderly. School main-tenance is recorded using a published cleaning schedule detailing the times and dates when classrooms, common areas, and restrooms are cleaned.
The district maintenance staff makes periodic site checks and, by work order, completes necessary repairs as reported.
Students are kept safe before, during, and after school by the vigilance and profes-sionalism of our five campus supervisors, administrative team, and volunteer staff who are very visible and present through-out campus. The five supervisors have specific areas of focus. They do a wonder-ful job of building healthy relationships with our students, and that trust goes a long way to maintaining a safe and orderly campus. The GUSD safety coordinator en-sures all areas are well lit when students are on campus. The assistant principal for discipline maintains consistent discipline policies within his staff and across the campus.
2014-15 School Year
School Facility Good Repair Status This inspection determines the school facility’s good repair status using ratings of good condition, fair condition or poor condition. The overall summary of facility conditions uses ratings of exemplary, good, fair or poor.
School Facility Good Repair Status
Items Inspected Repair Status Items Inspected Repair Status
Systems Good Restrooms/fountains Good
Interior Good Safety Good
Cleanliness Good Structural Good
Electrical Good External Good
Overall summary of facility conditions Good
Date of the most recent school site inspection 11/14/2014
Date of the most recent completion of the inspection form 11/14/2014
School FacilitiesChristopher High School is a state-of-the-art high school built in 2009. It is currently serving approxi-mately 1,970 freshmen, sophomore, junior, and senior students. Our high school features sufficient space to serve this number of students: 76 classrooms, one full-size gymnasium, an auxiliary/practice gymnasium, school library, dining commons, career/student services center, six computer labs, a wres-tling room, dance studio, weight room, athletics playing and practice fields, a black box theater, outdoor amphitheater, aquatics complex, administrative offices, conference rooms, and counseling offices. It is still in beautiful condition and a source of tremendous pride for our school community.
Continued on sidebar
“Christopher High School is a
state-of-the-art high school built in 2009.”
12Christopher High School
2013-14 School Accountability Report Card
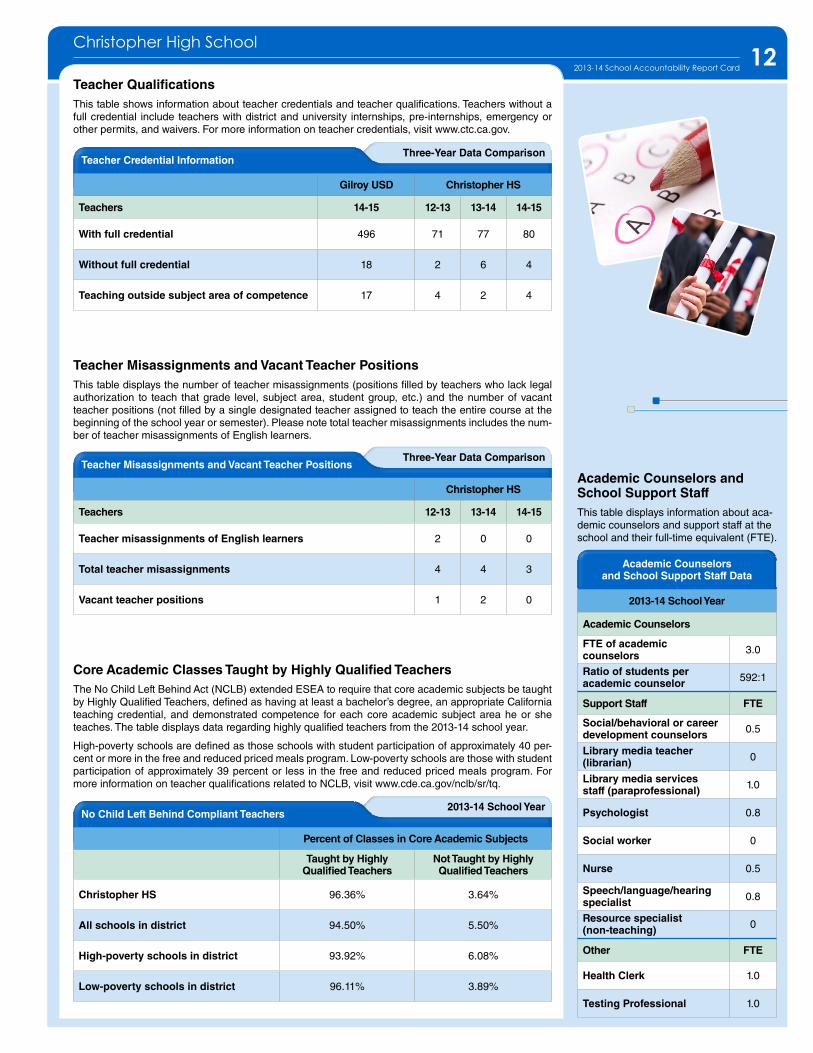
Three-Year Data ComparisonTeacher Misassignments and Vacant Teacher Positions
Christopher HS
Teachers 12-13 13-14 14-15
Teacher misassignments of English learners 2 0 0
Total teacher misassignments 4 4 3
Vacant teacher positions 1 2 0
Teacher Misassignments and Vacant Teacher PositionsThis table displays the number of teacher misassignments (positions filled by teachers who lack legal authorization to teach that grade level, subject area, student group, etc.) and the number of vacant teacher positions (not filled by a single designated teacher assigned to teach the entire course at the beginning of the school year or semester). Please note total teacher misassignments includes the num-ber of teacher misassignments of English learners.
2013-14 School YearNo Child Left Behind Compliant Teachers
Percent of Classes in Core Academic Subjects
Taught by Highly Qualified Teachers
Not Taught by Highly Qualified Teachers
Christopher HS 96.36% 3.64%
All schools in district 94.50% 5.50%
High-poverty schools in district 93.92% 6.08%
Low-poverty schools in district 96.11% 3.89%
Core Academic Classes Taught by Highly Qualified TeachersThe No Child Left Behind Act (NCLB) extended ESEA to require that core academic subjects be taught by Highly Qualified Teachers, defined as having at least a bachelor’s degree, an appropriate California teaching credential, and demonstrated competence for each core academic subject area he or she teaches. The table displays data regarding highly qualified teachers from the 2013-14 school year.
High-poverty schools are defined as those schools with student participation of approximately 40 per-cent or more in the free and reduced priced meals program. Low-poverty schools are those with student participation of approximately 39 percent or less in the free and reduced priced meals program. For more information on teacher qualifications related to NCLB, visit www.cde.ca.gov/nclb/sr/tq.
Academic Counselors and School Support Staff Data
2013-14 School Year
Academic Counselors
FTE of academic counselors 3.0
Ratio of students per academic counselor 592:1
Support Staff FTE
Social/behavioral or career development counselors 0.5
Library media teacher (librarian) 0
Library media services staff (paraprofessional) 1.0
Psychologist 0.8
Social worker 0
Nurse 0.5
Speech/language/hearing specialist 0.8
Resource specialist (non-teaching) 0
Other FTE
Health Clerk 1.0
Testing Professional 1.0
Academic Counselors and School Support StaffThis table displays information about aca-demic counselors and support staff at the school and their full-time equivalent (FTE).
Three-Year Data Comparison
Teacher QualificationsThis table shows information about teacher credentials and teacher qualifications. Teachers without a full credential include teachers with district and university internships, pre-internships, emergency or other permits, and waivers. For more information on teacher credentials, visit www.ctc.ca.gov.
Teacher Credential Information
Gilroy USD Christopher HS
Teachers 14-15 12-13 13-14 14-15
With full credential 496 71 77 80
Without full credential 18 2 6 4
Teaching outside subject area of competence 17 4 2 4
Data for this year’s SARC was provided by the California Department of Education (CDE), school, and district offices. For additional information on California schools and districts, please visit DataQuest at http://data1.cde.ca.gov/dataquest. DataQuest is an online resource that provides reports for accountability, test data, enrollment, graduates, dropouts, course enrollments, staffing, and data regarding English learners. For further information regarding the data elements and terms used in the SARC see the Academic Performance Index Reports Information Guide located on the CDE API Web page at www.cde.ca.gov/ta/ac/ap. Per Education Code Section 35256, each school district shall make hard copies of its annually updated report card available, upon request, on or before February 1 of each year.
All data accurate as of December 2014.
School Accountability Report Card
PubliShed by:
www.sia-us.com | 800.487.9234
1313Christopher High School
2013-14 School Accountability Report Card
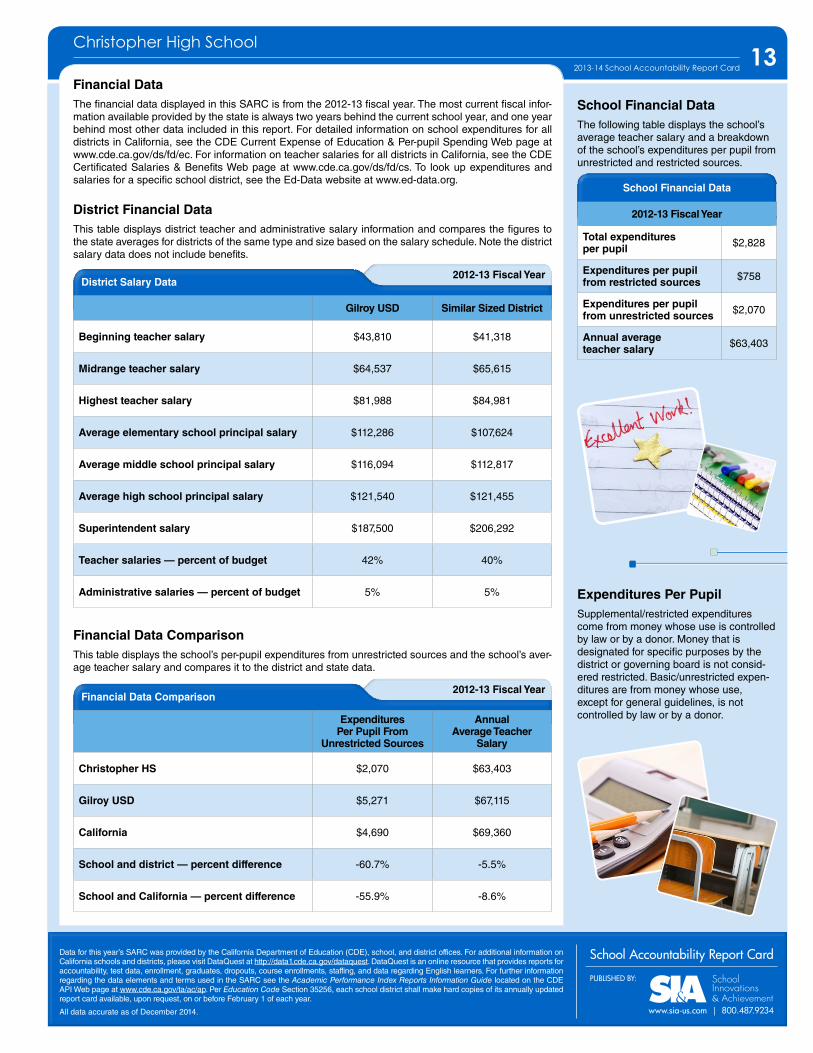
2012-13 Fiscal YearDistrict Salary Data
Gilroy USD Similar Sized District
Beginning teacher salary $43,810 $41,318
Midrange teacher salary $64,537 $65,615
Highest teacher salary $81,988 $84,981
Average elementary school principal salary $112,286 $107,624
Average middle school principal salary $116,094 $112,817
Average high school principal salary $121,540 $121,455
Superintendent salary $187,500 $206,292
Teacher salaries — percent of budget 42% 40%
Administrative salaries — percent of budget 5% 5%
2012-13 Fiscal YearFinancial Data Comparison
Expenditures Per Pupil From
Unrestricted Sources
Annual Average Teacher
Salary
Christopher HS $2,070 $63,403
Gilroy USD $5,271 $67,115
California $4,690 $69,360
School and district — percent difference -60.7% -5.5%
School and California — percent difference -55.9% -8.6%
Financial Data The financial data displayed in this SARC is from the 2012-13 fiscal year. The most current fiscal infor-mation available provided by the state is always two years behind the current school year, and one year behind most other data included in this report. For detailed information on school expenditures for all districts in California, see the CDE Current Expense of Education & Per-pupil Spending Web page at www.cde.ca.gov/ds/fd/ec. For information on teacher salaries for all districts in California, see the CDE Certificated Salaries & Benefits Web page at www.cde.ca.gov/ds/fd/cs. To look up expenditures and salaries for a specific school district, see the Ed-Data website at www.ed-data.org.
District Financial DataThis table displays district teacher and administrative salary information and compares the figures to the state averages for districts of the same type and size based on the salary schedule. Note the district salary data does not include benefits.
Financial Data ComparisonThis table displays the school’s per-pupil expenditures from unrestricted sources and the school’s aver-age teacher salary and compares it to the district and state data.
School Financial Data
2012-13 Fiscal Year
Total expenditures per pupil $2,828
Expenditures per pupil from restricted sources $758
Expenditures per pupil from unrestricted sources $2,070
Annual average teacher salary $63,403
School Financial DataThe following table displays the school’s average teacher salary and a breakdown of the school’s expenditures per pupil from unrestricted and restricted sources.
Expenditures Per PupilSupplemental/restricted expenditures come from money whose use is controlled by law or by a donor. Money that is designated for specific purposes by the district or governing board is not consid-ered restricted. Basic/unrestricted expen-ditures are from money whose use, except for general guidelines, is not controlled by law or by a donor.
School safety plan is the only other local measure of School Climate (Priority 6) that is reflected in the SARC.1
English, mathematics and physical education are the only subject areas included in Other Pupil Outcomes (Priority 8) that are reflected in the SARC.2English, mathematics and physical education are the only subject areas included in Other Pupil Outcomes (Priority 8) that are reflected in the SARC. 1
School safety plan is the only other local measure of School Climate (Priority 6) that is reflected in the SARC.2
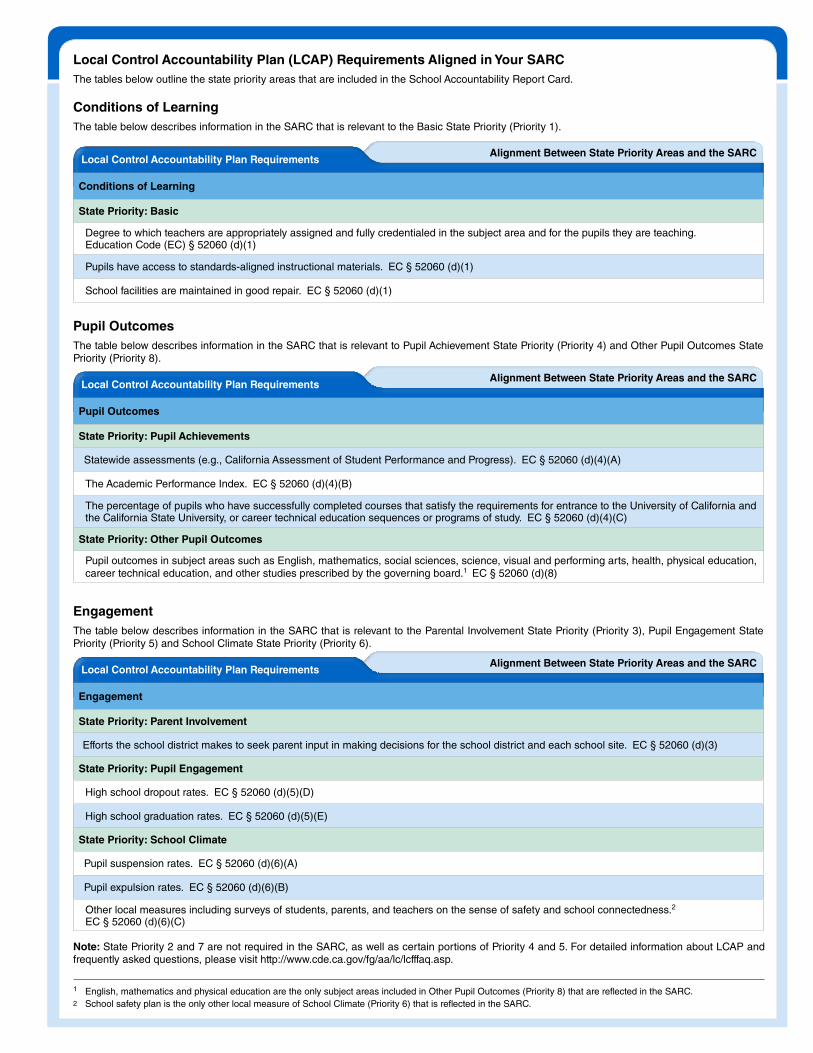
Local Control Accountability Plan (LCAP) Requirements Aligned in Your SARCThe tables below outline the state priority areas that are included in the School Accountability Report Card.
Alignment Between State Priority Areas and the SARCLocal Control Accountability Plan Requirements
Conditions of Learning
State Priority: Basic
Degree to which teachers are appropriately assigned and fully credentialed in the subject area and for the pupils they are teaching. Education Code (EC) § 52060 (d)(1)
Pupils have access to standards-aligned instructional materials. EC § 52060 (d)(1)
School facilities are maintained in good repair. EC § 52060 (d)(1)
Conditions of LearningThe table below describes information in the SARC that is relevant to the Basic State Priority (Priority 1).
Alignment Between State Priority Areas and the SARCLocal Control Accountability Plan Requirements
Pupil Outcomes
State Priority: Pupil Achievements
Statewide assessments (e.g., California Assessment of Student Performance and Progress). EC § 52060 (d)(4)(A)
The Academic Performance Index. EC § 52060 (d)(4)(B)
The percentage of pupils who have successfully completed courses that satisfy the requirements for entrance to the University of California and the California State University, or career technical education sequences or programs of study. EC § 52060 (d)(4)(C)
State Priority: Other Pupil Outcomes
Pupil outcomes in subject areas such as English, mathematics, social sciences, science, visual and performing arts, health, physical education, career technical education, and other studies prescribed by the governing board.1 EC § 52060 (d)(8)
Pupil OutcomesThe table below describes information in the SARC that is relevant to Pupil Achievement State Priority (Priority 4) and Other Pupil Outcomes State Priority (Priority 8).
Alignment Between State Priority Areas and the SARCLocal Control Accountability Plan Requirements
Engagement
State Priority: Parent Involvement
Efforts the school district makes to seek parent input in making decisions for the school district and each school site. EC § 52060 (d)(3)
State Priority: Pupil Engagement
High school dropout rates. EC § 52060 (d)(5)(D)
High school graduation rates. EC § 52060 (d)(5)(E)
State Priority: School Climate
Pupil suspension rates. EC § 52060 (d)(6)(A)
Pupil expulsion rates. EC § 52060 (d)(6)(B)
Other local measures including surveys of students, parents, and teachers on the sense of safety and school connectedness.2 EC § 52060 (d)(6)(C)
EngagementThe table below describes information in the SARC that is relevant to the Parental Involvement State Priority (Priority 3), Pupil Engagement State Priority (Priority 5) and School Climate State Priority (Priority 6).
Note: State Priority 2 and 7 are not required in the SARC, as well as certain portions of Priority 4 and 5. For detailed information about LCAP and frequently asked questions, please visit http://www.cde.ca.gov/fg/aa/lc/lcfffaq.asp.