Embed Size (px)
Citation preview
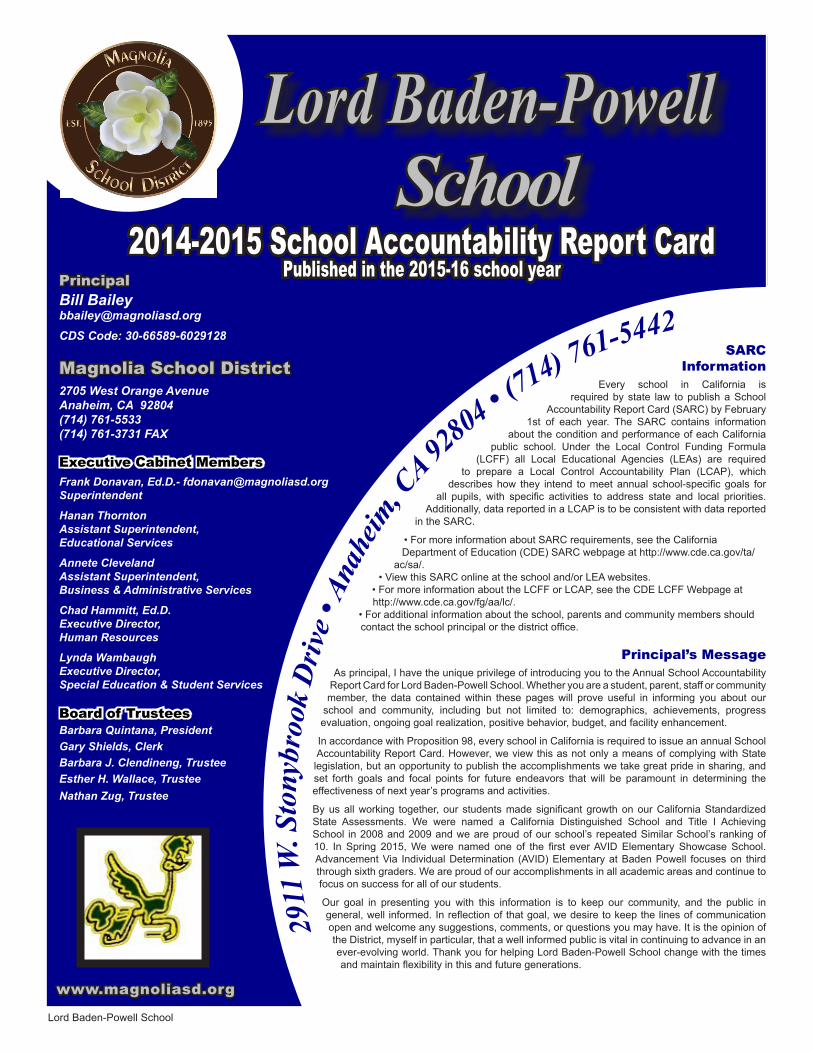
1Lord Baden-Powell School Published: January 2016
2014-2015 School Accountability Report CardPublished in the 2015-16 school yearPrincipal
Bill [email protected] Code: 30-66589-6029128
Magnolia School District2705 West Orange AvenueAnaheim, CA 92804(714) 761-5533(714) 761-3731 FAX
Executive Cabinet MembersFrank Donavan, Ed.D.- [email protected]
Hanan ThorntonAssistant Superintendent,Educational Services
Annete ClevelandAssistant Superintendent, Business & Administrative Services
Chad Hammitt, Ed.D.Executive Director, Human Resources
Lynda WambaughExecutive Director, Special Education & Student Services
Board of TrusteesBarbara Quintana, PresidentGary Shields, ClerkBarbara J. Clendineng, TrusteeEsther H. Wallace, TrusteeNathan Zug, Trustee
www.magnoliasd.org
Lord Baden-Powell School
2
911
W. S
tony
broo
k D
rive •
Ana
heim
, CA 92
804 • (
714) 761-5442SARC
InformationEvery school in California is
required by state law to publish a School Accountability Report Card (SARC) by February
1st of each year. The SARC contains information about the condition and performance of each California
public school. Under the Local Control Funding Formula (LCFF) all Local Educational Agencies (LEAs) are required
to prepare a Local Control Accountability Plan (LCAP), which describes how they intend to meet annual school-specific goals for
all pupils, with specific activities to address state and local priorities. Additionally, data reported in a LCAP is to be consistent with data reported
in the SARC.
• For more information about SARC requirements, see the California Department of Education (CDE) SARC webpage at http://www.cde.ca.gov/ta/
ac/sa/. • View this SARC online at the school and/or LEA websites.
• For more information about the LCFF or LCAP, see the CDE LCFF Webpage at http://www.cde.ca.gov/fg/aa/lc/.
• For additional information about the school, parents and community members should contact the school principal or the district office.
Principal’s MessageAs principal, I have the unique privilege of introducing you to the Annual School Accountability
Report Card for Lord Baden-Powell School. Whether you are a student, parent, staff or community member, the data contained within these pages will prove useful in informing you about our
school and community, including but not limited to: demographics, achievements, progress evaluation, ongoing goal realization, positive behavior, budget, and facility enhancement.
In accordance with Proposition 98, every school in California is required to issue an annual School Accountability Report Card. However, we view this as not only a means of complying with State legislation, but an opportunity to publish the accomplishments we take great pride in sharing, and set forth goals and focal points for future endeavors that will be paramount in determining the effectiveness of next year’s programs and activities.
By us all working together, our students made significant growth on our California Standardized State Assessments. We were named a California Distinguished School and Title I Achieving School in 2008 and 2009 and we are proud of our school’s repeated Similar School’s ranking of 10. In Spring 2015, We were named one of the first ever AVID Elementary Showcase School. Advancement Via Individual Determination (AVID) Elementary at Baden Powell focuses on third through sixth graders. We are proud of our accomplishments in all academic areas and continue to focus on success for all of our students.
Our goal in presenting you with this information is to keep our community, and the public in general, well informed. In reflection of that goal, we desire to keep the lines of communication open and welcome any suggestions, comments, or questions you may have. It is the opinion of the District, myself in particular, that a well informed public is vital in continuing to advance in an ever-evolving world. Thank you for helping Lord Baden-Powell School change with the times and maintain flexibility in this and future generations.
2Lord Baden-Powell School Published: January 2016
Community & School Profile (School Year 2015-16)Located in the Orange County City of Anaheim, the Magnolia School District educates pre-kindergarten through sixth grade students from the diverse communities of west Anaheim and Stanton. There are currently nine elementary schools (pre-K-6) in the district. Students from the Magnolia School District attend junior high and high schools in the Anaheim Union High School District. School programs and curricular objectives emphasizing English Language Development, strong community partnerships, and character education are hallmarks of the Magnolia School District.
Baden-Powell School’s goal is to provide an engaging learning environment with strong parental involvement where all students are able to participate in activities that promote academic achievement, personal growth, and high self-esteem.
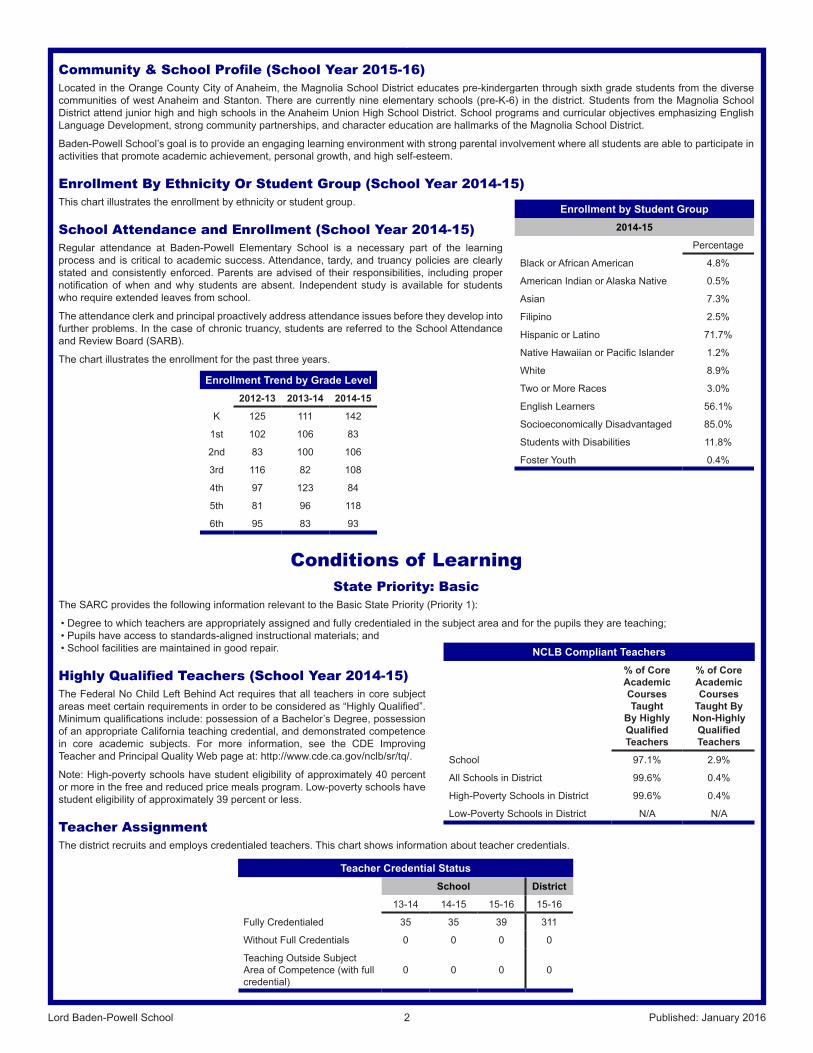
Enrollment By Ethnicity Or Student Group (School Year 2014-15)This chart illustrates the enrollment by ethnicity or student group.
School Attendance and Enrollment (School Year 2014-15)Regular attendance at Baden-Powell Elementary School is a necessary part of the learning process and is critical to academic success. Attendance, tardy, and truancy policies are clearly stated and consistently enforced. Parents are advised of their responsibilities, including proper notification of when and why students are absent. Independent study is available for students who require extended leaves from school.
The attendance clerk and principal proactively address attendance issues before they develop into further problems. In the case of chronic truancy, students are referred to the School Attendance and Review Board (SARB).
The chart illustrates the enrollment for the past three years.
Conditions of Learning State Priority: Basic
The SARC provides the following information relevant to the Basic State Priority (Priority 1):
• Degree to which teachers are appropriately assigned and fully credentialed in the subject area and for the pupils they are teaching;• Pupils have access to standards-aligned instructional materials; and• School facilities are maintained in good repair.
Highly Qualified Teachers (School Year 2014-15)The Federal No Child Left Behind Act requires that all teachers in core subject areas meet certain requirements in order to be considered as “Highly Qualified”. Minimum qualifications include: possession of a Bachelor’s Degree, possession of an appropriate California teaching credential, and demonstrated competence in core academic subjects. For more information, see the CDE Improving Teacher and Principal Quality Web page at: http://www.cde.ca.gov/nclb/sr/tq/.
Note: High-poverty schools have student eligibility of approximately 40 percent or more in the free and reduced price meals program. Low-poverty schools have student eligibility of approximately 39 percent or less.
Teacher AssignmentThe district recruits and employs credentialed teachers. This chart shows information about teacher credentials.
Enrollment by Student Group2014-15
Percentage
Black or African American 4.8%
American Indian or Alaska Native 0.5%
Asian 7.3%
Filipino 2.5%
Hispanic or Latino 71.7%
Native Hawaiian or Pacific Islander 1.2%
White 8.9%
Two or More Races 3.0%
English Learners 56.1%
Socioeconomically Disadvantaged 85.0%
Students with Disabilities 11.8%
Foster Youth 0.4%
NCLB Compliant Teachers% of Core Academic Courses Taught
By Highly Qualified Teachers
% of Core Academic Courses
Taught By Non-Highly Qualified Teachers
School 97.1% 2.9%
All Schools in District 99.6% 0.4%
High-Poverty Schools in District 99.6% 0.4%
Low-Poverty Schools in District N/A N/A
Enrollment Trend by Grade Level2012-13 2013-14 2014-15
K 125 111 142
1st 102 106 83
2nd 83 100 106
3rd 116 82 108
4th 97 123 84
5th 81 96 118
6th 95 83 93
Teacher Credential StatusSchool District
13-14 14-15 15-16 15-16
Fully Credentialed 35 35 39 311
Without Full Credentials 0 0 0 0
Teaching Outside Subject Area of Competence (with full credential)
0 0 0 0
3Lord Baden-Powell School Published: January 2016
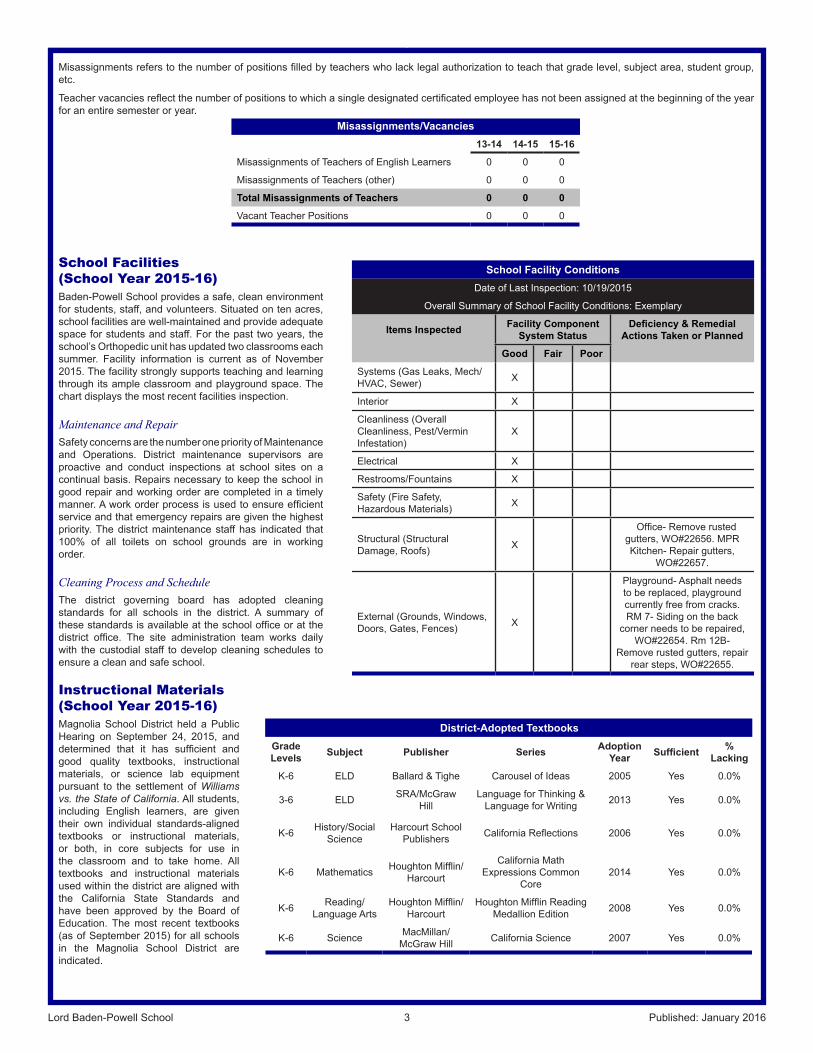
Misassignments refers to the number of positions filled by teachers who lack legal authorization to teach that grade level, subject area, student group, etc.
Teacher vacancies reflect the number of positions to which a single designated certificated employee has not been assigned at the beginning of the year for an entire semester or year.
School Facilities (School Year 2015-16)Baden-Powell School provides a safe, clean environment for students, staff, and volunteers. Situated on ten acres, school facilities are well-maintained and provide adequate space for students and staff. For the past two years, the school’s Orthopedic unit has updated two classrooms each summer. Facility information is current as of November 2015. The facility strongly supports teaching and learning through its ample classroom and playground space. The chart displays the most recent facilities inspection.
Maintenance and RepairSafety concerns are the number one priority of Maintenance and Operations. District maintenance supervisors are proactive and conduct inspections at school sites on a continual basis. Repairs necessary to keep the school in good repair and working order are completed in a timely manner. A work order process is used to ensure efficient service and that emergency repairs are given the highest priority. The district maintenance staff has indicated that 100% of all toilets on school grounds are in working order.
Cleaning Process and ScheduleThe district governing board has adopted cleaning standards for all schools in the district. A summary of these standards is available at the school office or at the district office. The site administration team works daily with the custodial staff to develop cleaning schedules to ensure a clean and safe school.
Instructional Materials (School Year 2015-16)Magnolia School District held a Public Hearing on September 24, 2015, and determined that it has sufficient and good quality textbooks, instructional materials, or science lab equipment pursuant to the settlement of Williams vs. the State of California. All students, including English learners, are given their own individual standards-aligned textbooks or instructional materials, or both, in core subjects for use in the classroom and to take home. All textbooks and instructional materials used within the district are aligned with the California State Standards and have been approved by the Board of Education. The most recent textbooks (as of September 2015) for all schools in the Magnolia School District are indicated.
Misassignments/Vacancies13-14 14-15 15-16
Misassignments of Teachers of English Learners 0 0 0
Misassignments of Teachers (other) 0 0 0
Total Misassignments of Teachers 0 0 0
Vacant Teacher Positions 0 0 0
District-Adopted TextbooksGrade Levels Subject Publisher Series Adoption
Year Sufficient % Lacking
K-6 ELD Ballard & Tighe Carousel of Ideas 2005 Yes 0.0%
3-6 ELD SRA/McGraw Hill
Language for Thinking & Language for Writing 2013 Yes 0.0%
K-6 History/Social Science
Harcourt School Publishers California Reflections 2006 Yes 0.0%
K-6 Mathematics Houghton Mifflin/Harcourt
California Math Expressions Common
Core2014 Yes 0.0%
K-6 Reading/Language Arts
Houghton Mifflin/Harcourt
Houghton Mifflin Reading Medallion Edition 2008 Yes 0.0%
K-6 Science MacMillan/ McGraw Hill California Science 2007 Yes 0.0%
School Facility ConditionsDate of Last Inspection: 10/19/2015
Overall Summary of School Facility Conditions: Exemplary
Items Inspected Facility Component System Status
Deficiency & Remedial Actions Taken or Planned
Good Fair Poor
Systems (Gas Leaks, Mech/HVAC, Sewer) X
Interior X
Cleanliness (Overall Cleanliness, Pest/Vermin Infestation)
X
Electrical X
Restrooms/Fountains X
Safety (Fire Safety, Hazardous Materials) X
Structural (Structural Damage, Roofs) X
Office- Remove rusted gutters, WO#22656. MPR Kitchen- Repair gutters,
WO#22657.
External (Grounds, Windows, Doors, Gates, Fences) X
Playground- Asphalt needs to be replaced, playground currently free from cracks. RM 7- Siding on the back
corner needs to be repaired, WO#22654. Rm 12B-
Remove rusted gutters, repair rear steps, WO#22655.
4Lord Baden-Powell School Published: January 2016
Pupil Outcomes State Priority: Pupil Achievement
The SARC provides the following information relevant to the Pupil Achievement State Priority (Priority 4):
• Statewide assessments (i.e., California Assessment of Student Performance and Progress and its predecessor the Standardized Testing and Reporting Program); and
• The percentage of pupils who have successfully completed courses that satisfy the requirements for entrance to the University of California and the California State University, or career technical education sequences or programs of study.
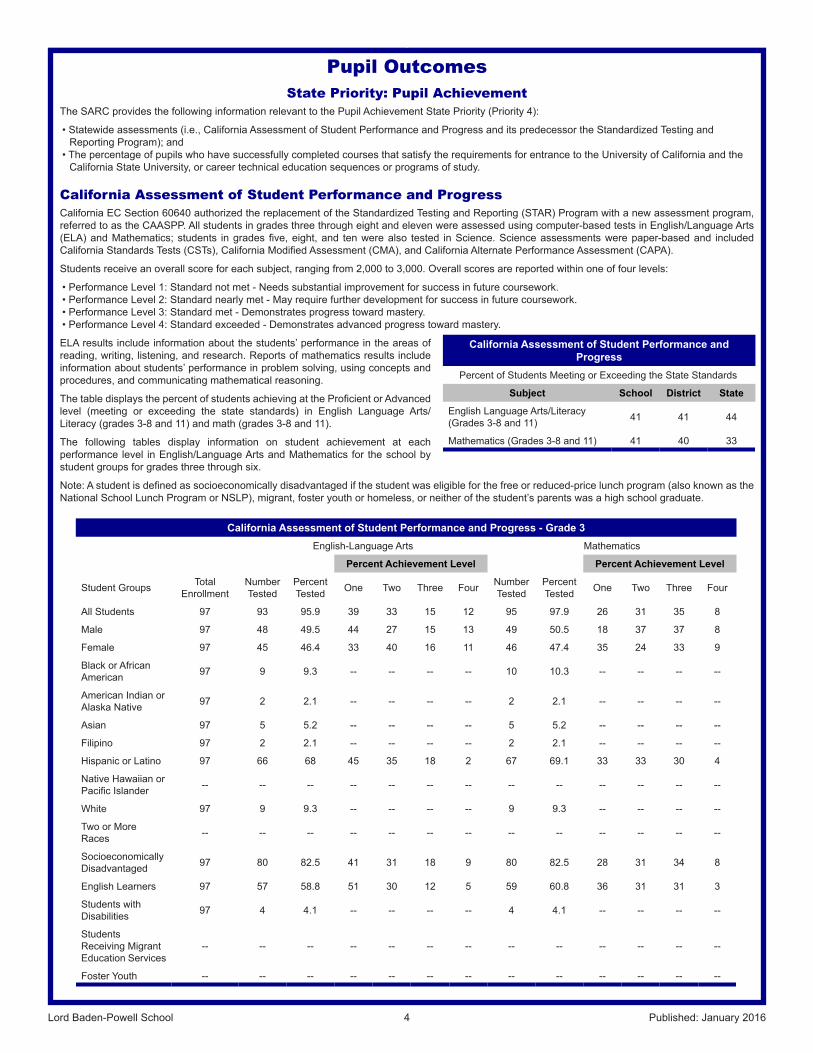
California Assessment of Student Performance and ProgressCalifornia EC Section 60640 authorized the replacement of the Standardized Testing and Reporting (STAR) Program with a new assessment program, referred to as the CAASPP. All students in grades three through eight and eleven were assessed using computer-based tests in English/Language Arts (ELA) and Mathematics; students in grades five, eight, and ten were also tested in Science. Science assessments were paper-based and included California Standards Tests (CSTs), California Modified Assessment (CMA), and California Alternate Performance Assessment (CAPA).
Students receive an overall score for each subject, ranging from 2,000 to 3,000. Overall scores are reported within one of four levels:
• Performance Level 1: Standard not met - Needs substantial improvement for success in future coursework.• Performance Level 2: Standard nearly met - May require further development for success in future coursework.• Performance Level 3: Standard met - Demonstrates progress toward mastery.• Performance Level 4: Standard exceeded - Demonstrates advanced progress toward mastery.
ELA results include information about the students’ performance in the areas of reading, writing, listening, and research. Reports of mathematics results include information about students’ performance in problem solving, using concepts and procedures, and communicating mathematical reasoning.
The table displays the percent of students achieving at the Proficient or Advanced level (meeting or exceeding the state standards) in English Language Arts/Literacy (grades 3-8 and 11) and math (grades 3-8 and 11).
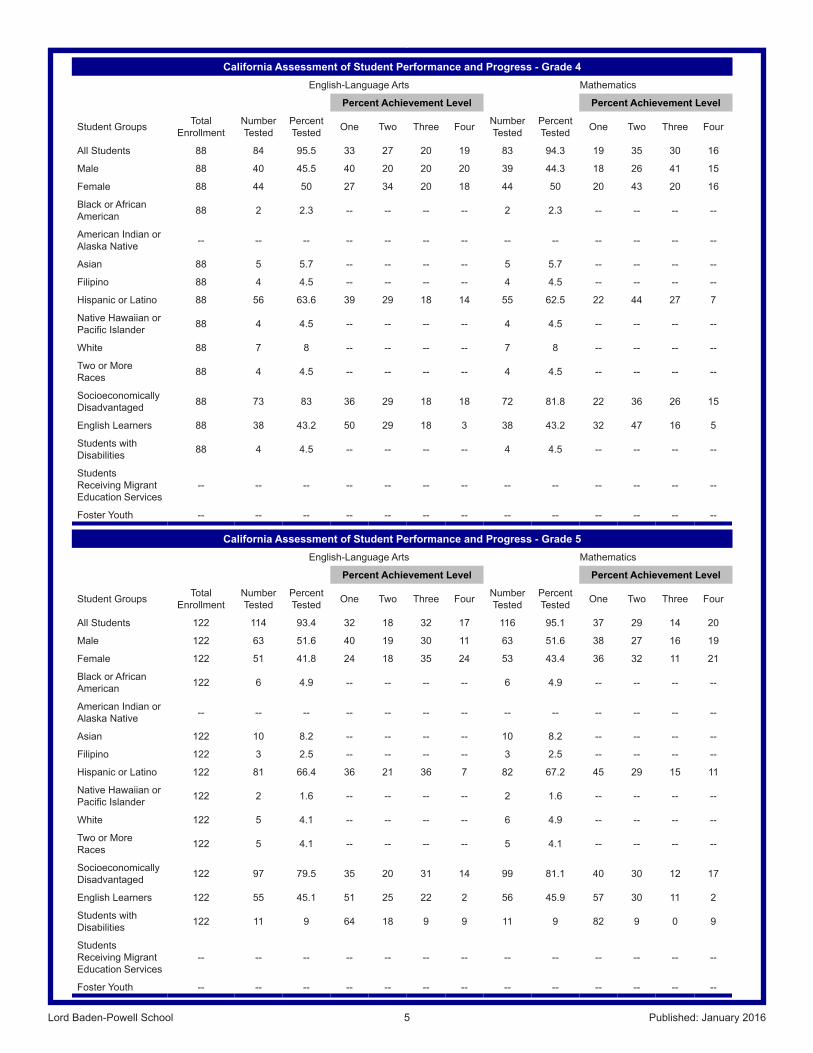
The following tables display information on student achievement at each performance level in English/Language Arts and Mathematics for the school by student groups for grades three through six.
Note: A student is defined as socioeconomically disadvantaged if the student was eligible for the free or reduced-price lunch program (also known as the National School Lunch Program or NSLP), migrant, foster youth or homeless, or neither of the student’s parents was a high school graduate.
California Assessment of Student Performance and Progress
Percent of Students Meeting or Exceeding the State Standards
Subject School District State
English Language Arts/Literacy (Grades 3-8 and 11) 41 41 44
Mathematics (Grades 3-8 and 11) 41 40 33
California Assessment of Student Performance and Progress - Grade 3English-Language Arts Mathematics
Percent Achievement Level Percent Achievement Level
Student Groups Total Enrollment
Number Tested
Percent Tested One Two Three Four Number
TestedPercent Tested One Two Three Four
All Students 97 93 95.9 39 33 15 12 95 97.9 26 31 35 8
Male 97 48 49.5 44 27 15 13 49 50.5 18 37 37 8
Female 97 45 46.4 33 40 16 11 46 47.4 35 24 33 9
Black or African American 97 9 9.3 -- -- -- -- 10 10.3 -- -- -- --
American Indian or Alaska Native 97 2 2.1 -- -- -- -- 2 2.1 -- -- -- --
Asian 97 5 5.2 -- -- -- -- 5 5.2 -- -- -- --
Filipino 97 2 2.1 -- -- -- -- 2 2.1 -- -- -- --
Hispanic or Latino 97 66 68 45 35 18 2 67 69.1 33 33 30 4
Native Hawaiian or Pacific Islander -- -- -- -- -- -- -- -- -- -- -- -- --
White 97 9 9.3 -- -- -- -- 9 9.3 -- -- -- --
Two or More Races -- -- -- -- -- -- -- -- -- -- -- -- --
Socioeconomically Disadvantaged 97 80 82.5 41 31 18 9 80 82.5 28 31 34 8
English Learners 97 57 58.8 51 30 12 5 59 60.8 36 31 31 3
Students with Disabilities 97 4 4.1 -- -- -- -- 4 4.1 -- -- -- --
Students Receiving Migrant Education Services
-- -- -- -- -- -- -- -- -- -- -- -- --
Foster Youth -- -- -- -- -- -- -- -- -- -- -- -- --
5Lord Baden-Powell School Published: January 2016
California Assessment of Student Performance and Progress - Grade 4English-Language Arts Mathematics
Percent Achievement Level Percent Achievement Level
Student Groups Total Enrollment
Number Tested
Percent Tested One Two Three Four Number
TestedPercent Tested One Two Three Four
All Students 88 84 95.5 33 27 20 19 83 94.3 19 35 30 16
Male 88 40 45.5 40 20 20 20 39 44.3 18 26 41 15
Female 88 44 50 27 34 20 18 44 50 20 43 20 16
Black or African American 88 2 2.3 -- -- -- -- 2 2.3 -- -- -- --
American Indian or Alaska Native -- -- -- -- -- -- -- -- -- -- -- -- --
Asian 88 5 5.7 -- -- -- -- 5 5.7 -- -- -- --
Filipino 88 4 4.5 -- -- -- -- 4 4.5 -- -- -- --
Hispanic or Latino 88 56 63.6 39 29 18 14 55 62.5 22 44 27 7
Native Hawaiian or Pacific Islander 88 4 4.5 -- -- -- -- 4 4.5 -- -- -- --
White 88 7 8 -- -- -- -- 7 8 -- -- -- --
Two or More Races 88 4 4.5 -- -- -- -- 4 4.5 -- -- -- --
Socioeconomically Disadvantaged 88 73 83 36 29 18 18 72 81.8 22 36 26 15
English Learners 88 38 43.2 50 29 18 3 38 43.2 32 47 16 5
Students with Disabilities 88 4 4.5 -- -- -- -- 4 4.5 -- -- -- --
Students Receiving Migrant Education Services
-- -- -- -- -- -- -- -- -- -- -- -- --
Foster Youth -- -- -- -- -- -- -- -- -- -- -- -- --
California Assessment of Student Performance and Progress - Grade 5English-Language Arts Mathematics
Percent Achievement Level Percent Achievement Level
Student Groups Total Enrollment
Number Tested
Percent Tested One Two Three Four Number
TestedPercent Tested One Two Three Four
All Students 122 114 93.4 32 18 32 17 116 95.1 37 29 14 20
Male 122 63 51.6 40 19 30 11 63 51.6 38 27 16 19
Female 122 51 41.8 24 18 35 24 53 43.4 36 32 11 21
Black or African American 122 6 4.9 -- -- -- -- 6 4.9 -- -- -- --
American Indian or Alaska Native -- -- -- -- -- -- -- -- -- -- -- -- --
Asian 122 10 8.2 -- -- -- -- 10 8.2 -- -- -- --
Filipino 122 3 2.5 -- -- -- -- 3 2.5 -- -- -- --
Hispanic or Latino 122 81 66.4 36 21 36 7 82 67.2 45 29 15 11
Native Hawaiian or Pacific Islander 122 2 1.6 -- -- -- -- 2 1.6 -- -- -- --
White 122 5 4.1 -- -- -- -- 6 4.9 -- -- -- --
Two or More Races 122 5 4.1 -- -- -- -- 5 4.1 -- -- -- --
Socioeconomically Disadvantaged 122 97 79.5 35 20 31 14 99 81.1 40 30 12 17
English Learners 122 55 45.1 51 25 22 2 56 45.9 57 30 11 2
Students with Disabilities 122 11 9 64 18 9 9 11 9 82 9 0 9
Students Receiving Migrant Education Services
-- -- -- -- -- -- -- -- -- -- -- -- --
Foster Youth -- -- -- -- -- -- -- -- -- -- -- -- --

6Lord Baden-Powell School Published: January 2016
California Standards Test (CST)The California Standards Test (CST) is administered to all students in the spring to assess student performance in relation to the State Content Standards. Student scores are reported as performance levels: Advanced (exceeds state standards), Proficient (meets standards), Basic (approaching standards), Below Basic (below standards), and Far Below Basic (well below standards).
The table displays the percent of students achieving at the Proficient or Advanced level (meeting or exceeding the state standards) in Science, for the most recent three-year period.
The second table displays the percent of students, by group, achieving at the Proficient or Advanced level (meeting or exceeding the state standards) for the most recent testing period.
For detailed information regarding the results for each grade and performance level, see the CDE CAASPP Results Web site at http://caaspp.cde.ca.gov/caaspp2015/Index.aspx.
California Assessment of Student Performance and Progress - Grade 6English-Language Arts Mathematics
Percent Achievement Level Percent Achievement Level
Student Groups Total Enrollment
Number Tested
Percent Tested One Two Three Four Number
TestedPercent Tested One Two Three Four
All Students 83 80 96.4 20 34 36 10 80 96.4 28 28 28 18
Male 83 42 50.6 21 38 31 10 42 50.6 26 24 26 24
Female 83 38 45.8 18 29 42 11 38 45.8 29 32 29 11
Black or African American 83 4 4.8 -- -- -- -- 4 4.8 -- -- -- --
American Indian or Alaska Native -- -- -- -- -- -- -- -- -- -- -- -- --
Asian 83 6 7.2 -- -- -- -- 6 7.2 -- -- -- --
Filipino -- -- -- -- -- -- -- -- -- -- -- -- --
Hispanic or Latino 83 61 73.5 26 34 33 7 61 73.5 36 26 25 13
Native Hawaiian or Pacific Islander -- -- -- -- -- -- -- -- -- -- -- -- --
White 83 8 9.6 -- -- -- -- 8 9.6 -- -- -- --
Two or More Races 83 1 1.2 -- -- -- -- 1 1.2 -- -- -- --
Socioeconomically Disadvantaged 83 76 91.6 21 36 33 11 76 91.6 29 28 28 16
English Learners 83 17 20.5 65 29 6 0 17 20.5 82 18 0 0
Students with Disabilities 83 7 8.4 -- -- -- -- 7 8.4 -- -- -- --
Students Receiving Migrant Education Services
-- -- -- -- -- -- -- -- -- -- -- -- --
Foster Youth -- -- -- -- -- -- -- -- -- -- -- -- --
California Standards Test Percentage of Students Meeting or Exceeding State Standards
Subject School District State
2013 2014 2015 2013 2014 2015 2013 2014 2015
Science (Grades 5, 8, and 10) 69 75 61 57 62 52 59 60 56
*Scores are not disclosed when fewer than 10 students are tested in a grade level and/or subgroup.
California Standards Test Percentage of Students Meeting or Exceeding State
StandardsSubgroups
Subject Science
District 52
School 61
Hispanic or Latino 55
Males 57
Females 65
Socioeconomically Disadvantaged 56
English Learners 36
*Scores are not disclosed when fewer than 10 students are tested in a grade level and/or subgroup.
7Lord Baden-Powell School Published: January 2016
State Priority: Other Pupil AchievementThe SARC provides the following information relevant to the Other Pupil Outcomes State Priority:
• Pupil outcomes in the subject areas of English, mathematics, and physical education.
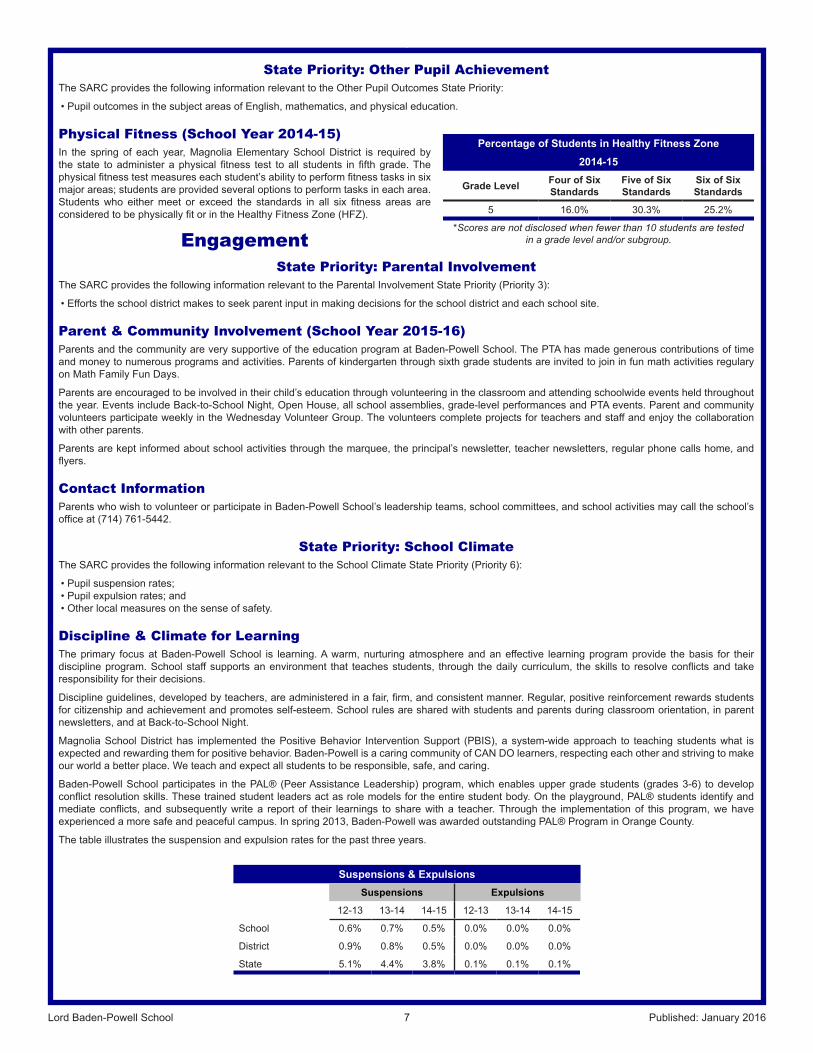
Physical Fitness (School Year 2014-15)In the spring of each year, Magnolia Elementary School District is required by the state to administer a physical fitness test to all students in fifth grade. The physical fitness test measures each student’s ability to perform fitness tasks in six major areas; students are provided several options to perform tasks in each area. Students who either meet or exceed the standards in all six fitness areas are considered to be physically fit or in the Healthy Fitness Zone (HFZ).
Engagement State Priority: Parental Involvement
The SARC provides the following information relevant to the Parental Involvement State Priority (Priority 3):
• Efforts the school district makes to seek parent input in making decisions for the school district and each school site.
Parent & Community Involvement (School Year 2015-16)Parents and the community are very supportive of the education program at Baden-Powell School. The PTA has made generous contributions of time and money to numerous programs and activities. Parents of kindergarten through sixth grade students are invited to join in fun math activities regulary on Math Family Fun Days.
Parents are encouraged to be involved in their child’s education through volunteering in the classroom and attending schoolwide events held throughout the year. Events include Back-to-School Night, Open House, all school assemblies, grade-level performances and PTA events. Parent and community volunteers participate weekly in the Wednesday Volunteer Group. The volunteers complete projects for teachers and staff and enjoy the collaboration with other parents.
Parents are kept informed about school activities through the marquee, the principal’s newsletter, teacher newsletters, regular phone calls home, and flyers.
Contact InformationParents who wish to volunteer or participate in Baden-Powell School’s leadership teams, school committees, and school activities may call the school’s office at (714) 761-5442.
State Priority: School ClimateThe SARC provides the following information relevant to the School Climate State Priority (Priority 6):
• Pupil suspension rates;• Pupil expulsion rates; and• Other local measures on the sense of safety.
Discipline & Climate for LearningThe primary focus at Baden-Powell School is learning. A warm, nurturing atmosphere and an effective learning program provide the basis for their discipline program. School staff supports an environment that teaches students, through the daily curriculum, the skills to resolve conflicts and take responsibility for their decisions.
Discipline guidelines, developed by teachers, are administered in a fair, firm, and consistent manner. Regular, positive reinforcement rewards students for citizenship and achievement and promotes self-esteem. School rules are shared with students and parents during classroom orientation, in parent newsletters, and at Back-to-School Night.
Magnolia School District has implemented the Positive Behavior Intervention Support (PBIS), a system-wide approach to teaching students what is expected and rewarding them for positive behavior. Baden-Powell is a caring community of CAN DO learners, respecting each other and striving to make our world a better place. We teach and expect all students to be responsible, safe, and caring.
Baden-Powell School participates in the PAL® (Peer Assistance Leadership) program, which enables upper grade students (grades 3-6) to develop conflict resolution skills. These trained student leaders act as role models for the entire student body. On the playground, PAL® students identify and mediate conflicts, and subsequently write a report of their learnings to share with a teacher. Through the implementation of this program, we have experienced a more safe and peaceful campus. In spring 2013, Baden-Powell was awarded outstanding PAL® Program in Orange County.
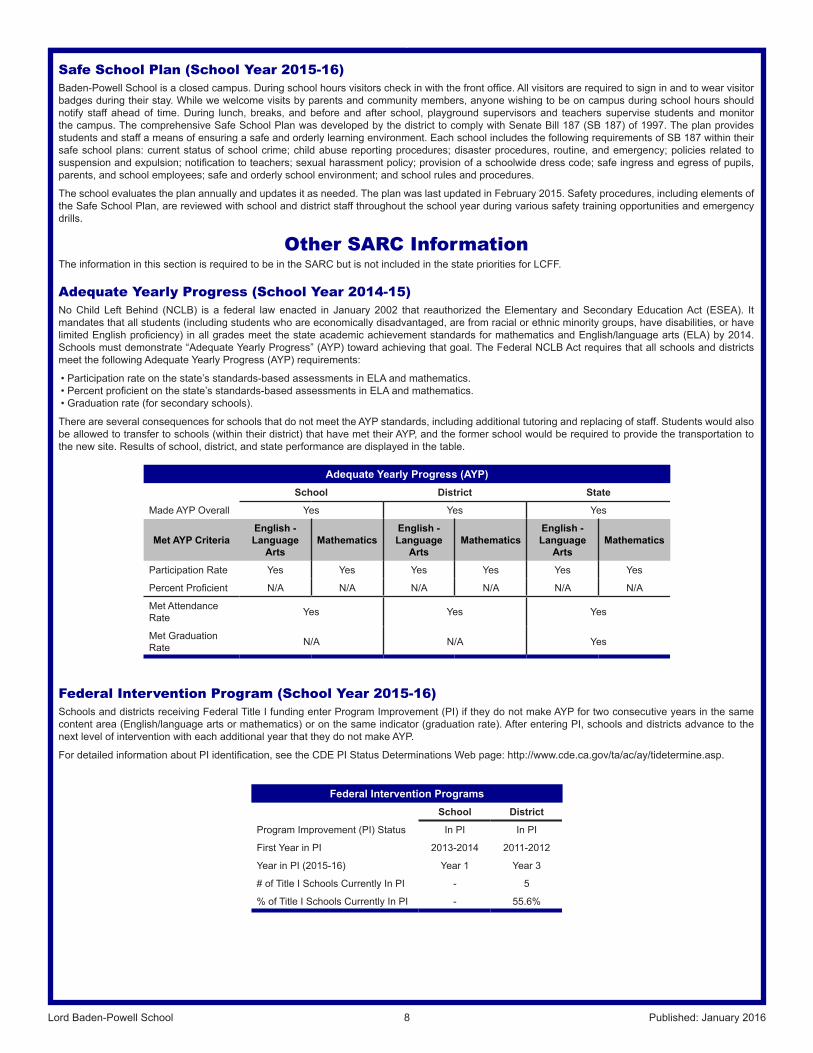
The table illustrates the suspension and expulsion rates for the past three years.
Percentage of Students in Healthy Fitness Zone2014-15
Grade Level Four of Six Standards
Five of Six Standards
Six of Six Standards
5 16.0% 30.3% 25.2%
*Scores are not disclosed when fewer than 10 students are tested in a grade level and/or subgroup.
Suspensions & ExpulsionsSuspensions Expulsions
12-13 13-14 14-15 12-13 13-14 14-15
School 0.6% 0.7% 0.5% 0.0% 0.0% 0.0%
District 0.9% 0.8% 0.5% 0.0% 0.0% 0.0%
State 5.1% 4.4% 3.8% 0.1% 0.1% 0.1%
8Lord Baden-Powell School Published: January 2016
Safe School Plan (School Year 2015-16)Baden-Powell School is a closed campus. During school hours visitors check in with the front office. All visitors are required to sign in and to wear visitor badges during their stay. While we welcome visits by parents and community members, anyone wishing to be on campus during school hours should notify staff ahead of time. During lunch, breaks, and before and after school, playground supervisors and teachers supervise students and monitor the campus. The comprehensive Safe School Plan was developed by the district to comply with Senate Bill 187 (SB 187) of 1997. The plan provides students and staff a means of ensuring a safe and orderly learning environment. Each school includes the following requirements of SB 187 within their safe school plans: current status of school crime; child abuse reporting procedures; disaster procedures, routine, and emergency; policies related to suspension and expulsion; notification to teachers; sexual harassment policy; provision of a schoolwide dress code; safe ingress and egress of pupils, parents, and school employees; safe and orderly school environment; and school rules and procedures.
The school evaluates the plan annually and updates it as needed. The plan was last updated in February 2015. Safety procedures, including elements of the Safe School Plan, are reviewed with school and district staff throughout the school year during various safety training opportunities and emergency drills.
Other SARC InformationThe information in this section is required to be in the SARC but is not included in the state priorities for LCFF.
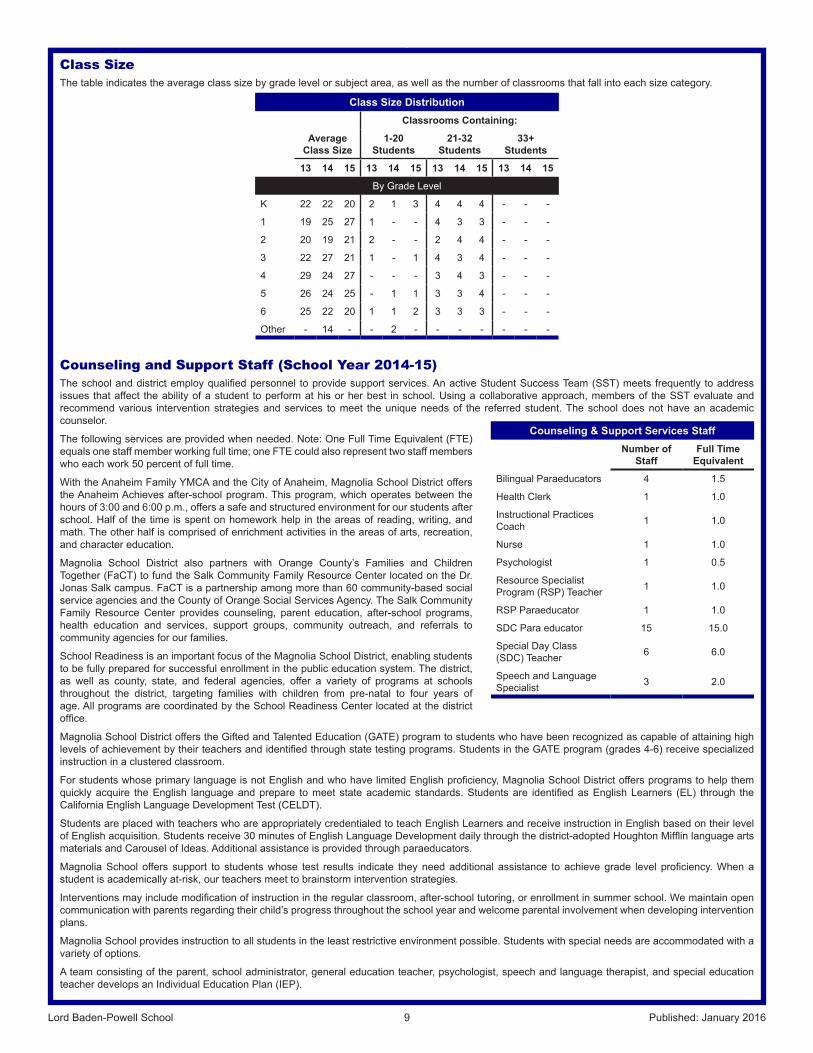
Adequate Yearly Progress (School Year 2014-15)No Child Left Behind (NCLB) is a federal law enacted in January 2002 that reauthorized the Elementary and Secondary Education Act (ESEA). It mandates that all students (including students who are economically disadvantaged, are from racial or ethnic minority groups, have disabilities, or have limited English proficiency) in all grades meet the state academic achievement standards for mathematics and English/language arts (ELA) by 2014. Schools must demonstrate “Adequate Yearly Progress” (AYP) toward achieving that goal. The Federal NCLB Act requires that all schools and districts meet the following Adequate Yearly Progress (AYP) requirements:
• Participation rate on the state’s standards-based assessments in ELA and mathematics. • Percent proficient on the state’s standards-based assessments in ELA and mathematics. • Graduation rate (for secondary schools).
There are several consequences for schools that do not meet the AYP standards, including additional tutoring and replacing of staff. Students would also be allowed to transfer to schools (within their district) that have met their AYP, and the former school would be required to provide the transportation to the new site. Results of school, district, and state performance are displayed in the table.
Federal Intervention Program (School Year 2015-16)Schools and districts receiving Federal Title I funding enter Program Improvement (PI) if they do not make AYP for two consecutive years in the same content area (English/language arts or mathematics) or on the same indicator (graduation rate). After entering PI, schools and districts advance to the next level of intervention with each additional year that they do not make AYP.
For detailed information about PI identification, see the CDE PI Status Determinations Web page: http://www.cde.ca.gov/ta/ac/ay/tidetermine.asp.
Adequate Yearly Progress (AYP)School District State
Made AYP Overall Yes Yes Yes
Met AYP CriteriaEnglish - Language
ArtsMathematics
English - Language
ArtsMathematics
English - Language
ArtsMathematics
Participation Rate Yes Yes Yes Yes Yes Yes
Percent Proficient N/A N/A N/A N/A N/A N/A
Met Attendance Rate Yes Yes Yes
Met Graduation Rate N/A N/A Yes
Federal Intervention ProgramsSchool District
Program Improvement (PI) Status In PI In PI
First Year in PI 2013-2014 2011-2012
Year in PI (2015-16) Year 1 Year 3
# of Title I Schools Currently In PI - 5
% of Title I Schools Currently In PI - 55.6%
9Lord Baden-Powell School Published: January 2016
Class SizeThe table indicates the average class size by grade level or subject area, as well as the number of classrooms that fall into each size category.
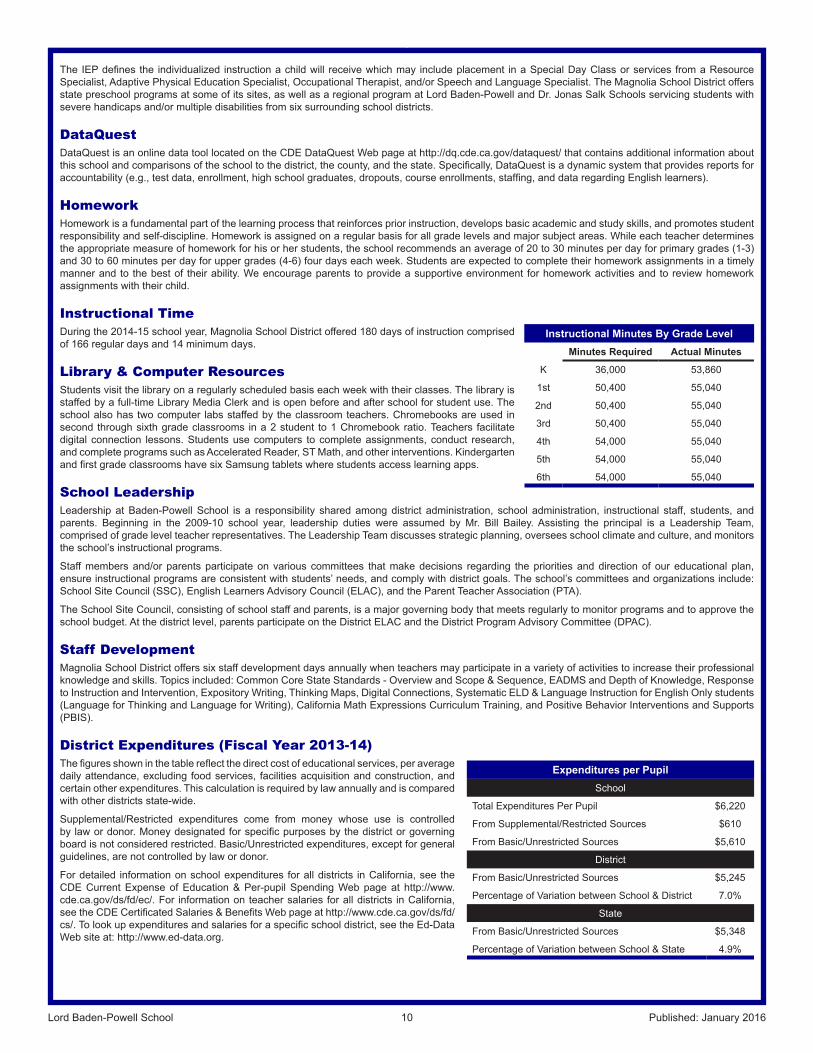
Counseling and Support Staff (School Year 2014-15)The school and district employ qualified personnel to provide support services. An active Student Success Team (SST) meets frequently to address issues that affect the ability of a student to perform at his or her best in school. Using a collaborative approach, members of the SST evaluate and recommend various intervention strategies and services to meet the unique needs of the referred student. The school does not have an academic counselor.
The following services are provided when needed. Note: One Full Time Equivalent (FTE) equals one staff member working full time; one FTE could also represent two staff members who each work 50 percent of full time.
With the Anaheim Family YMCA and the City of Anaheim, Magnolia School District offers the Anaheim Achieves after-school program. This program, which operates between the hours of 3:00 and 6:00 p.m., offers a safe and structured environment for our students after school. Half of the time is spent on homework help in the areas of reading, writing, and math. The other half is comprised of enrichment activities in the areas of arts, recreation, and character education.
Magnolia School District also partners with Orange County’s Families and Children Together (FaCT) to fund the Salk Community Family Resource Center located on the Dr. Jonas Salk campus. FaCT is a partnership among more than 60 community-based social service agencies and the County of Orange Social Services Agency. The Salk Community Family Resource Center provides counseling, parent education, after-school programs, health education and services, support groups, community outreach, and referrals to community agencies for our families.
School Readiness is an important focus of the Magnolia School District, enabling students to be fully prepared for successful enrollment in the public education system. The district, as well as county, state, and federal agencies, offer a variety of programs at schools throughout the district, targeting families with children from pre-natal to four years of age. All programs are coordinated by the School Readiness Center located at the district office.
Magnolia School District offers the Gifted and Talented Education (GATE) program to students who have been recognized as capable of attaining high levels of achievement by their teachers and identified through state testing programs. Students in the GATE program (grades 4-6) receive specialized instruction in a clustered classroom.
For students whose primary language is not English and who have limited English proficiency, Magnolia School District offers programs to help them quickly acquire the English language and prepare to meet state academic standards. Students are identified as English Learners (EL) through the California English Language Development Test (CELDT).
Students are placed with teachers who are appropriately credentialed to teach English Learners and receive instruction in English based on their level of English acquisition. Students receive 30 minutes of English Language Development daily through the district-adopted Houghton Mifflin language arts materials and Carousel of Ideas. Additional assistance is provided through paraeducators.
Magnolia School offers support to students whose test results indicate they need additional assistance to achieve grade level proficiency. When a student is academically at-risk, our teachers meet to brainstorm intervention strategies.
Interventions may include modification of instruction in the regular classroom, after-school tutoring, or enrollment in summer school. We maintain open communication with parents regarding their child’s progress throughout the school year and welcome parental involvement when developing intervention plans.
Magnolia School provides instruction to all students in the least restrictive environment possible. Students with special needs are accommodated with a variety of options.
A team consisting of the parent, school administrator, general education teacher, psychologist, speech and language therapist, and special education teacher develops an Individual Education Plan (IEP).
Class Size DistributionClassrooms Containing:
Average Class Size
1-20 Students
21-32 Students
33+ Students
13 14 15 13 14 15 13 14 15 13 14 15
By Grade Level
K 22 22 20 2 1 3 4 4 4 - - -
1 19 25 27 1 - - 4 3 3 - - -
2 20 19 21 2 - - 2 4 4 - - -
3 22 27 21 1 - 1 4 3 4 - - -
4 29 24 27 - - - 3 4 3 - - -
5 26 24 25 - 1 1 3 3 4 - - -
6 25 22 20 1 1 2 3 3 3 - - -
Other - 14 - - 2 - - - - - - -
Counseling & Support Services StaffNumber of
StaffFull Time
Equivalent
Bilingual Paraeducators 4 1.5
Health Clerk 1 1.0
Instructional Practices Coach 1 1.0
Nurse 1 1.0
Psychologist 1 0.5
Resource Specialist Program (RSP) Teacher 1 1.0
RSP Paraeducator 1 1.0
SDC Para educator 15 15.0
Special Day Class (SDC) Teacher 6 6.0
Speech and Language Specialist 3 2.0
10Lord Baden-Powell School Published: January 2016
The IEP defines the individualized instruction a child will receive which may include placement in a Special Day Class or services from a Resource Specialist, Adaptive Physical Education Specialist, Occupational Therapist, and/or Speech and Language Specialist. The Magnolia School District offers state preschool programs at some of its sites, as well as a regional program at Lord Baden-Powell and Dr. Jonas Salk Schools servicing students with severe handicaps and/or multiple disabilities from six surrounding school districts.
DataQuestDataQuest is an online data tool located on the CDE DataQuest Web page at http://dq.cde.ca.gov/dataquest/ that contains additional information about this school and comparisons of the school to the district, the county, and the state. Specifically, DataQuest is a dynamic system that provides reports for accountability (e.g., test data, enrollment, high school graduates, dropouts, course enrollments, staffing, and data regarding English learners).
HomeworkHomework is a fundamental part of the learning process that reinforces prior instruction, develops basic academic and study skills, and promotes student responsibility and self-discipline. Homework is assigned on a regular basis for all grade levels and major subject areas. While each teacher determines the appropriate measure of homework for his or her students, the school recommends an average of 20 to 30 minutes per day for primary grades (1-3) and 30 to 60 minutes per day for upper grades (4-6) four days each week. Students are expected to complete their homework assignments in a timely manner and to the best of their ability. We encourage parents to provide a supportive environment for homework activities and to review homework assignments with their child.
Instructional TimeDuring the 2014-15 school year, Magnolia School District offered 180 days of instruction comprised of 166 regular days and 14 minimum days.
Library & Computer ResourcesStudents visit the library on a regularly scheduled basis each week with their classes. The library is staffed by a full-time Library Media Clerk and is open before and after school for student use. The school also has two computer labs staffed by the classroom teachers. Chromebooks are used in second through sixth grade classrooms in a 2 student to 1 Chromebook ratio. Teachers facilitate digital connection lessons. Students use computers to complete assignments, conduct research, and complete programs such as Accelerated Reader, ST Math, and other interventions. Kindergarten and first grade classrooms have six Samsung tablets where students access learning apps.
School LeadershipLeadership at Baden-Powell School is a responsibility shared among district administration, school administration, instructional staff, students, and parents. Beginning in the 2009-10 school year, leadership duties were assumed by Mr. Bill Bailey. Assisting the principal is a Leadership Team, comprised of grade level teacher representatives. The Leadership Team discusses strategic planning, oversees school climate and culture, and monitors the school’s instructional programs.
Staff members and/or parents participate on various committees that make decisions regarding the priorities and direction of our educational plan, ensure instructional programs are consistent with students’ needs, and comply with district goals. The school’s committees and organizations include: School Site Council (SSC), English Learners Advisory Council (ELAC), and the Parent Teacher Association (PTA).
The School Site Council, consisting of school staff and parents, is a major governing body that meets regularly to monitor programs and to approve the school budget. At the district level, parents participate on the District ELAC and the District Program Advisory Committee (DPAC).
Staff DevelopmentMagnolia School District offers six staff development days annually when teachers may participate in a variety of activities to increase their professional knowledge and skills. Topics included: Common Core State Standards - Overview and Scope & Sequence, EADMS and Depth of Knowledge, Response to Instruction and Intervention, Expository Writing, Thinking Maps, Digital Connections, Systematic ELD & Language Instruction for English Only students (Language for Thinking and Language for Writing), California Math Expressions Curriculum Training, and Positive Behavior Interventions and Supports (PBIS).
District Expenditures (Fiscal Year 2013-14)The figures shown in the table reflect the direct cost of educational services, per average daily attendance, excluding food services, facilities acquisition and construction, and certain other expenditures. This calculation is required by law annually and is compared with other districts state-wide.
Supplemental/Restricted expenditures come from money whose use is controlled by law or donor. Money designated for specific purposes by the district or governing board is not considered restricted. Basic/Unrestricted expenditures, except for general guidelines, are not controlled by law or donor.
For detailed information on school expenditures for all districts in California, see the CDE Current Expense of Education & Per-pupil Spending Web page at http://www.cde.ca.gov/ds/fd/ec/. For information on teacher salaries for all districts in California, see the CDE Certificated Salaries & Benefits Web page at http://www.cde.ca.gov/ds/fd/cs/. To look up expenditures and salaries for a specific school district, see the Ed-Data Web site at: http://www.ed-data.org.
Instructional Minutes By Grade LevelMinutes Required Actual Minutes
K 36,000 53,860
1st 50,400 55,040
2nd 50,400 55,040
3rd 50,400 55,040
4th 54,000 55,040
5th 54,000 55,040
6th 54,000 55,040
Expenditures per PupilSchool
Total Expenditures Per Pupil $6,220
From Supplemental/Restricted Sources $610
From Basic/Unrestricted Sources $5,610
District
From Basic/Unrestricted Sources $5,245
Percentage of Variation between School & District 7.0%
State
From Basic/Unrestricted Sources $5,348
Percentage of Variation between School & State 4.9%
11Lord Baden-Powell School Published: January 2016
District Revenue Sources (Fiscal Year 2014-15)In addition to the State General Fund, Magnolia School District received state and federal funding for the following categorical, special education, and other support programs:
• Title I, Part A, Basic and Neglected • Title II, Part A• Title III, Part A (LEP)• Economic Impact Aid• Peer Assistance and Review
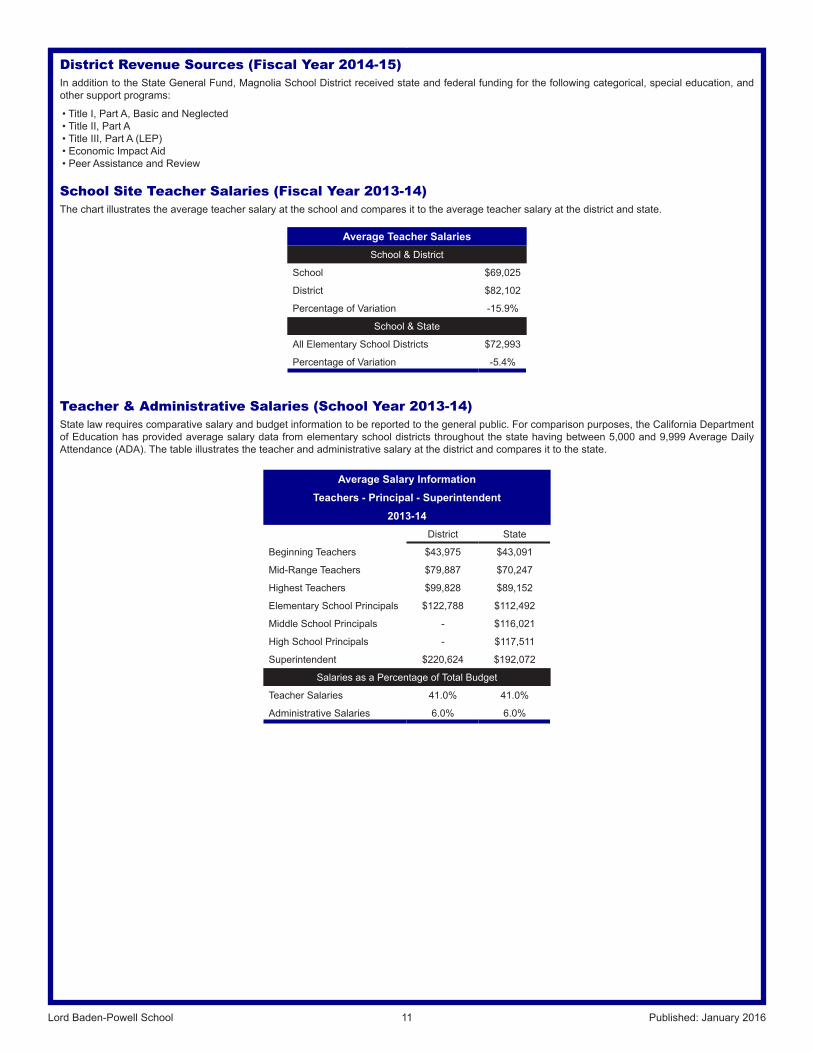
School Site Teacher Salaries (Fiscal Year 2013-14)The chart illustrates the average teacher salary at the school and compares it to the average teacher salary at the district and state.
Teacher & Administrative Salaries (School Year 2013-14)State law requires comparative salary and budget information to be reported to the general public. For comparison purposes, the California Department of Education has provided average salary data from elementary school districts throughout the state having between 5,000 and 9,999 Average Daily Attendance (ADA). The table illustrates the teacher and administrative salary at the district and compares it to the state.
Average Teacher SalariesSchool & District
School $69,025
District $82,102
Percentage of Variation -15.9%
School & State
All Elementary School Districts $72,993
Percentage of Variation -5.4%
Average Salary InformationTeachers - Principal - Superintendent
2013-14 District State
Beginning Teachers $43,975 $43,091
Mid-Range Teachers $79,887 $70,247
Highest Teachers $99,828 $89,152
Elementary School Principals $122,788 $112,492
Middle School Principals - $116,021
High School Principals - $117,511
Superintendent $220,624 $192,072
Salaries as a Percentage of Total Budget
Teacher Salaries 41.0% 41.0%
Administrative Salaries 6.0% 6.0%