Embed Size (px)
Citation preview
Christian Doppler Laboratory for Design Methodology of
Signal Processing Algorithms
Design Space Exploration
Hardware/Software Codesign
Martin Holzer
Christian Doppler Laboratory forDesign Methodology of Signal Processing Algorithms
June 6th, 2008
Christian Doppler Laboratory for Design Methodology of
Signal Processing Algorithms
2
• Embedded System Design
• Design Space Exploration• System Characterization• Estimation of Design Properties• Multi-objective Optimization
• Summary
Outline
3
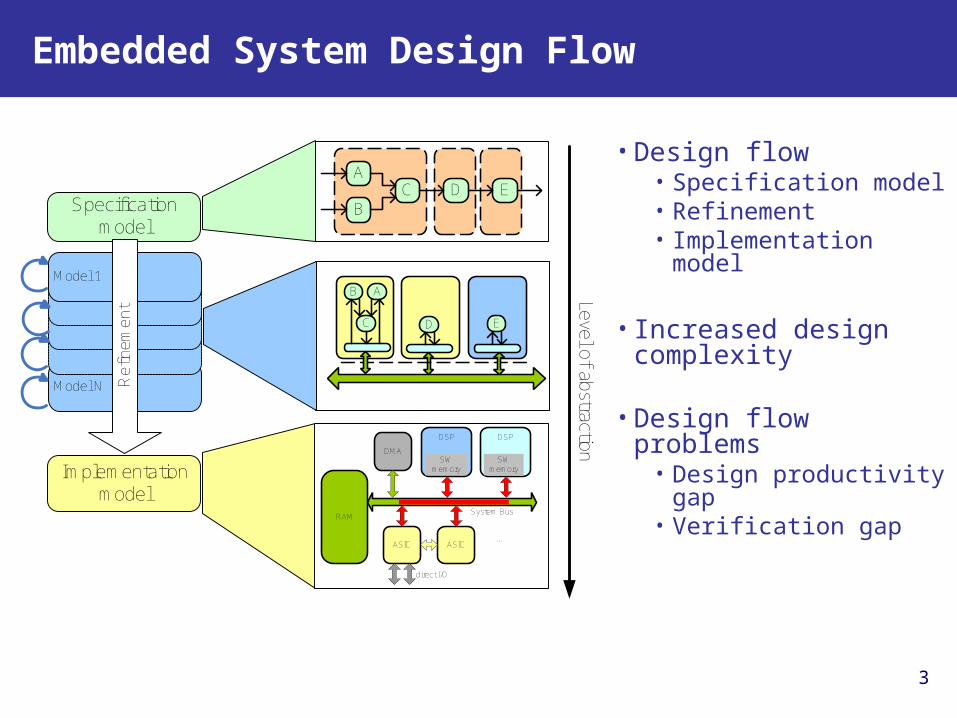
Embedded System Design Flow
• Design flow• Specification model• Refinement• Implementation model
• Increased design complexity
• Design flow problems• Design productivity
gap• Verification gap
Specificationmodel
A
BC D E
Model N
Model 1
Ref
inem
ent
B A
C D E
Implementationmodel
DSP
ASICASIC...
System BusRAM
DMASW
memory
direct I/O
DSP
SWmemory
Level of abstraction
4
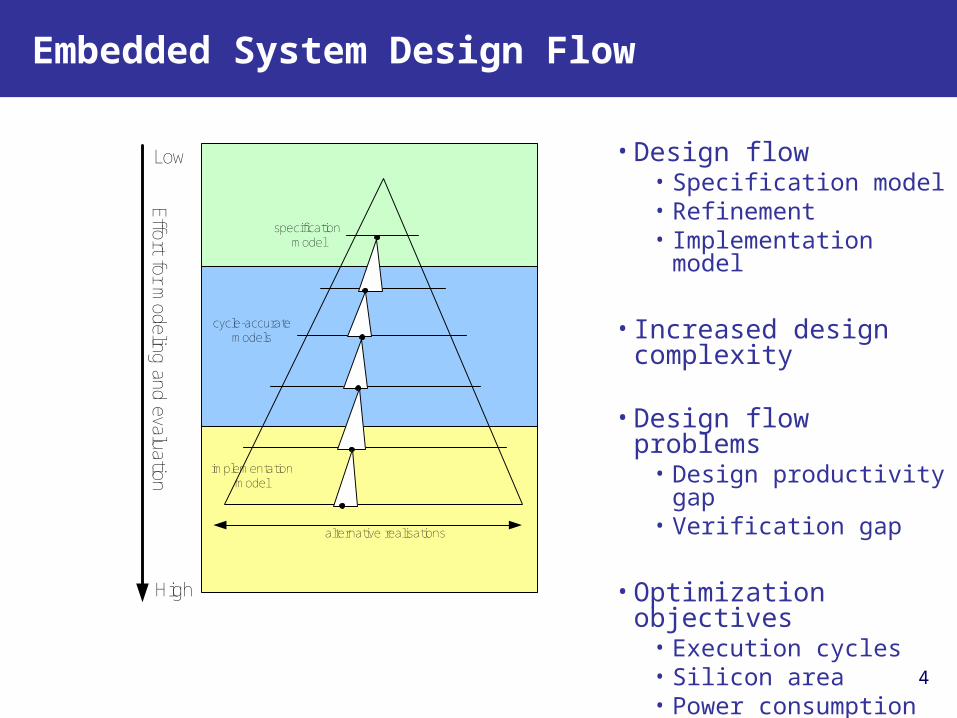
Embedded System Design Flow
• Design flow• Specification model• Refinement• Implementation model
• Increased design complexity
• Design flow problems• Design productivity
gap• Verification gap
• Optimization objectives• Execution cycles• Silicon area• Power consumption
implementationmodel
cycle-accuratemodels
specification model
alternative realisations
High
Effort for m
odeling and evaluation
Low
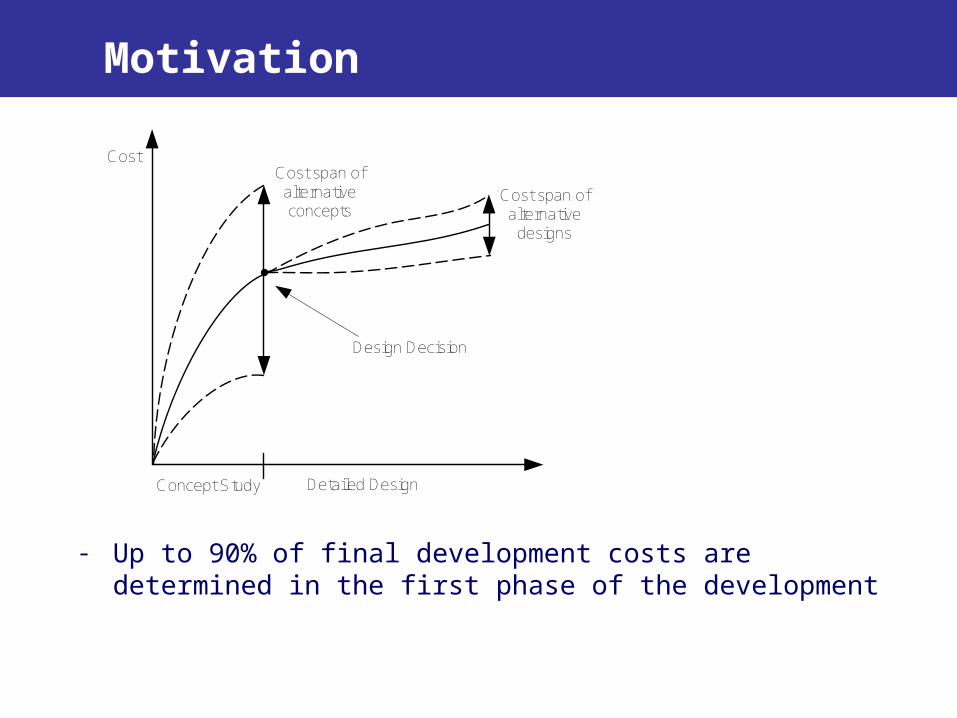
Motivation
- Up to 90% of final development costs are determined in the first phase of the development
Cost
Concept Study Detailed Design
Cost span of alternative concepts
Cost span of alternative
designs
Design Decision
6
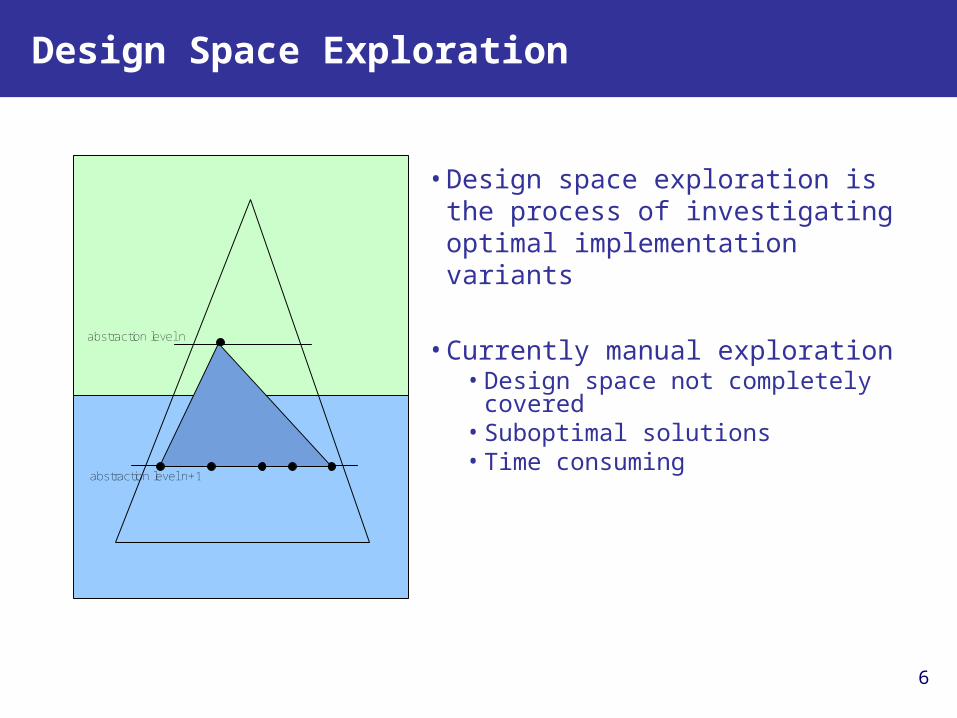
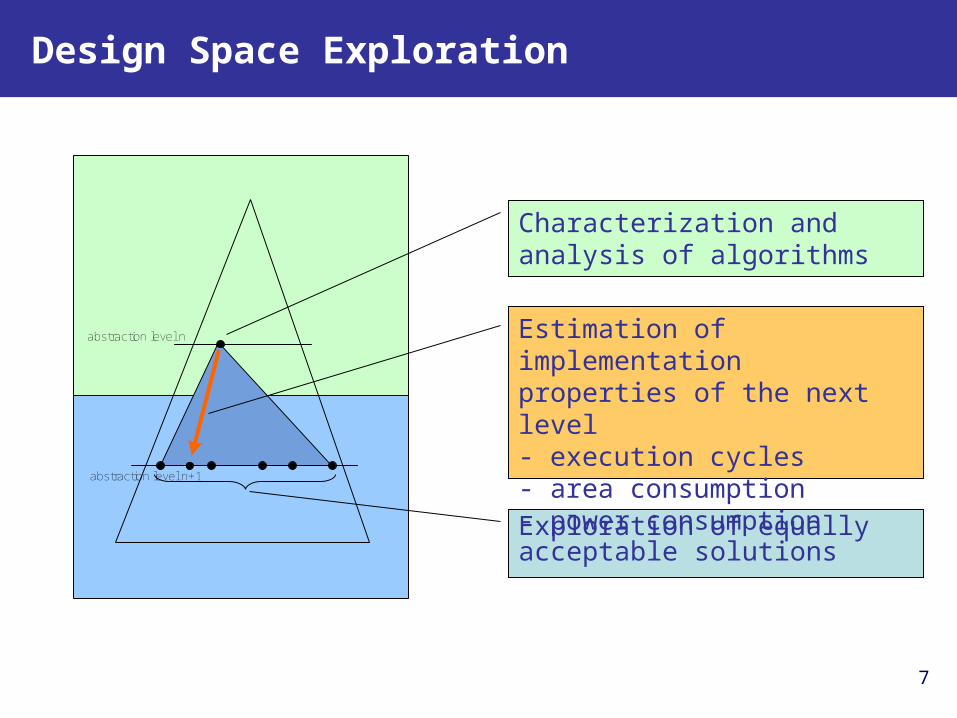
Design Space Exploration
abstraction level n
abstraction level n+1
•Design space exploration is the process of investigating optimal implementation variants
•Currently manual exploration• Design space not completely
covered• Suboptimal solutions• Time consuming
abstraction level n
abstraction level n+1
7
Design Space Exploration
Exploration of equally acceptable solutions
Characterization and analysis of algorithms
Estimation of implementation properties of the next level - execution cycles- area consumption- power consumption
8
Metrics
• A software metric is defined as numeric rating with the purpose to measure properties like
• Complexity• Reliability• Length• Quality• Performance
• Measurement procedure numerical rating• Interpretation e.g. complexity
• Methods• Dynamic• Static
9
Prediction of Implementation Effort
• COCOMO• Lines of Code (LoC) dependent• Problem: prediction of source lines at the beginning of the project is hard
• Function points• Based on
• Number of inputs • Number of outputs • Internal functions
• This measure can be derived from the specification itself

10
System Representation
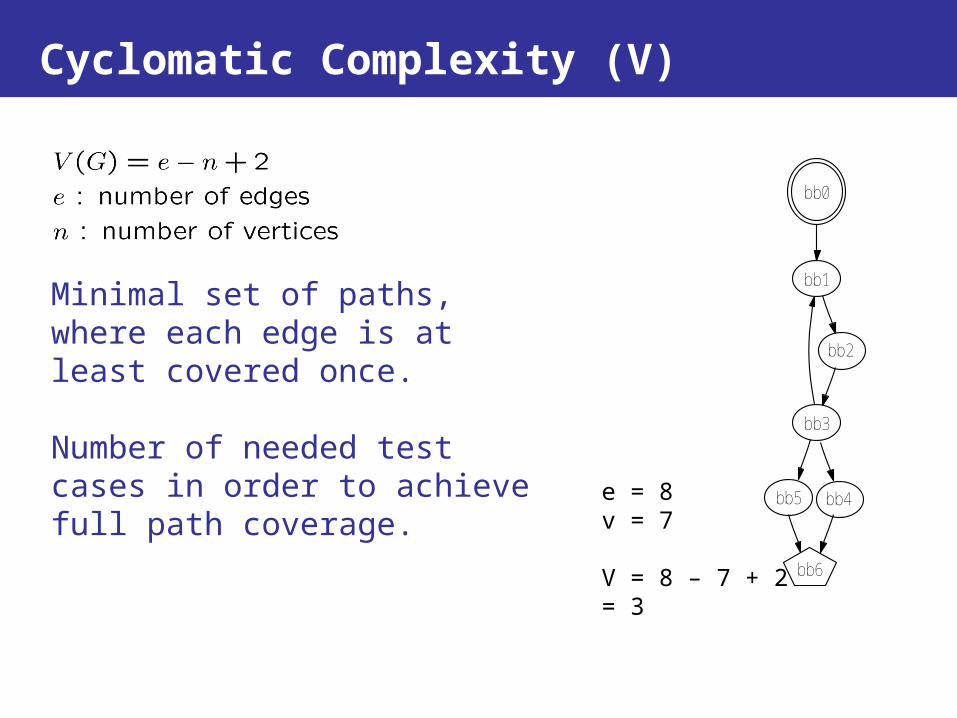
Cyclomatic Complexity (V)
Minimal set of paths, where each edge is at least covered once.
Number of needed test cases in order to achieve full path coverage.
e = 8v = 7
V = 8 – 7 + 2 = 3
bb0
bb1
bb6
bb2
bb3
bb4bb5
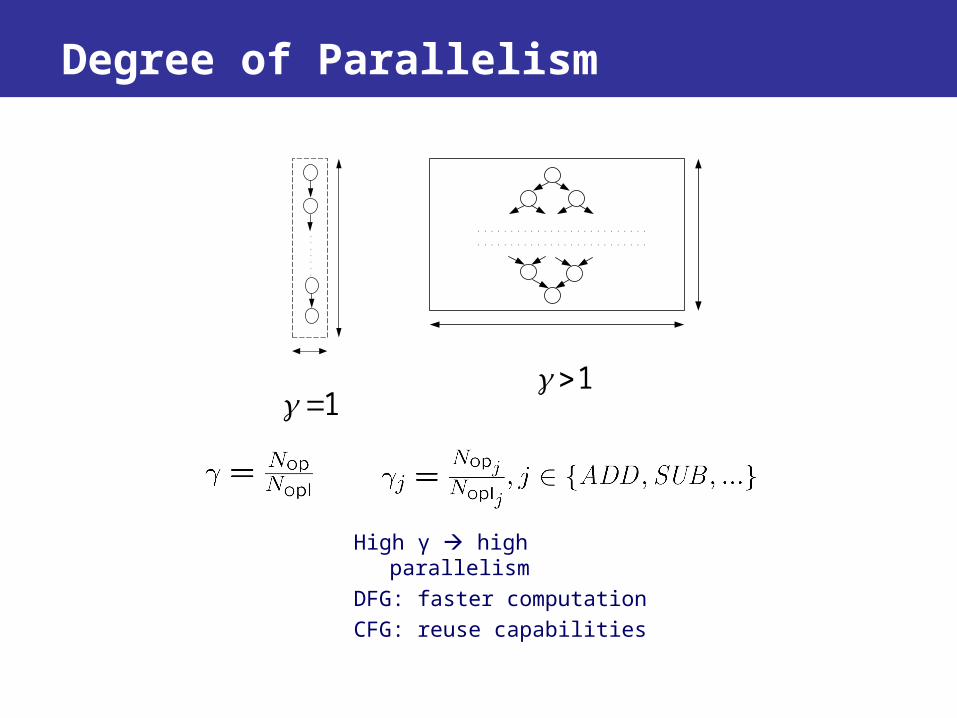
Degree of Parallelism
11
. . . . . . . . . . . . . . . . . . . . . . . . . .
. . . . . . . . . . . . . . . . . . . . . . . . . .
. . . . . . .
High γ high parallelismDFG: faster computationCFG: reuse capabilities
13
bb0
bb1
bb2
bb3
bb4 bb5
bb6
bb7
bb8 bb9
bb10
bb11
bb12
bb13
bb14
bb15
bb16
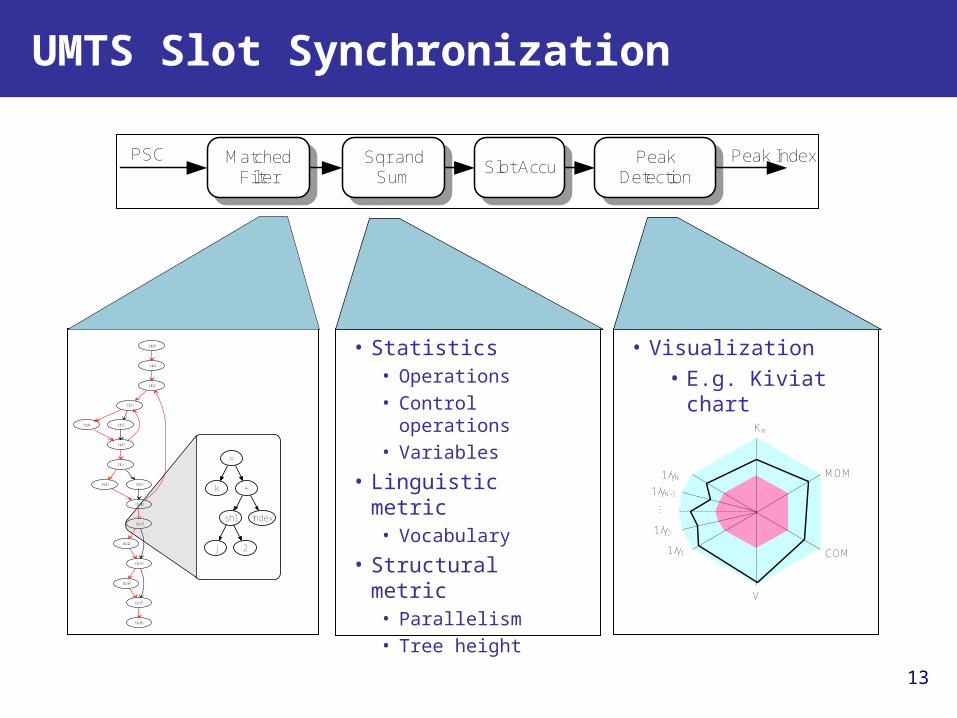
• Statistics• Operations• Control operations• Variables
• Linguistic metric• Vocabulary
• Structural metric• Parallelism• Tree height
=
k +
shl index
j 2
Km
MOM
COM
V
1/γ1
1/γN
...
1/γ2
1/γN-1
UMTS Slot Synchronization
• Visualization• E.g. Kiviat chart
MatchedFilter
Slot AccuPeak
DetectionSqr and
SumPSC Peak Index
14
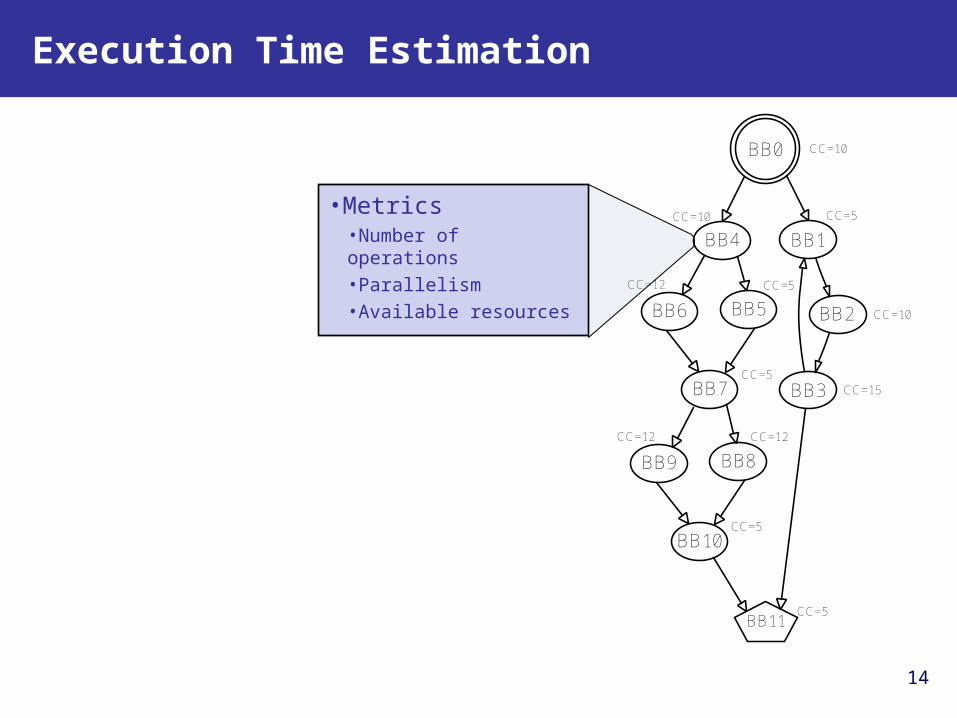
Execution Time Estimation
BB0
BB1
BB11
BB2
BB3
BB5
BB4
BB6
BB7
BB8BB9
BB10
•Metrics•Number of operations•Parallelism•Available resources
CC=10
CC=10
CC=15
CC=5
CC=10
CC=12 CC=5
CC=5
CC=5
CC=12 CC=12
CC=5
15
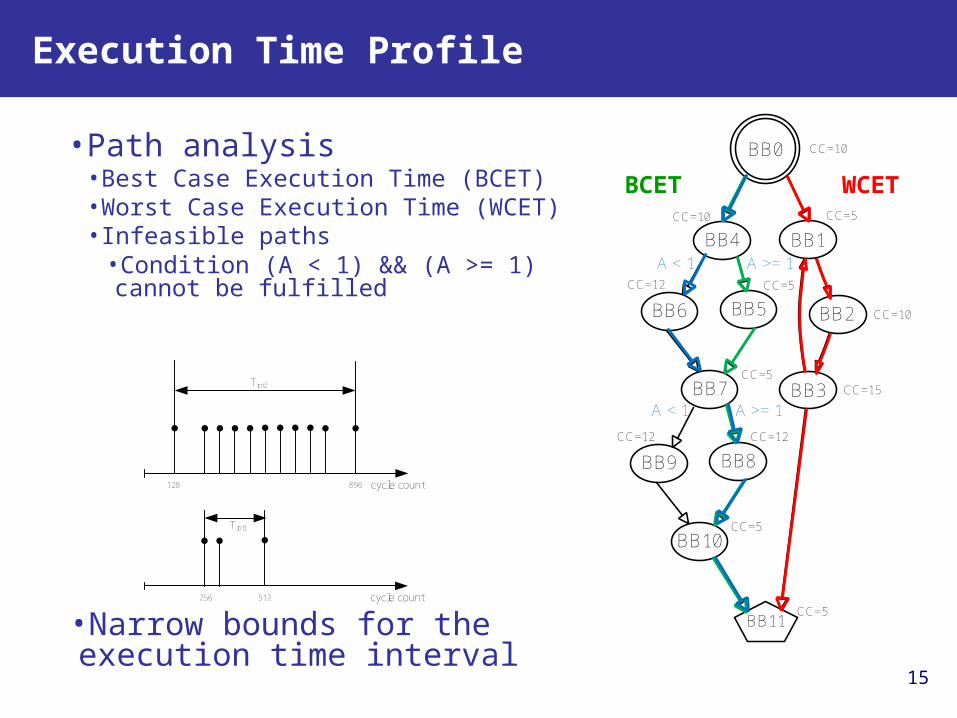
Execution Time Profile
WCETBCET
BB0
BB1
BB11
BB2
BB3
BB5
BB4
BB6
BB7
BB8BB9
BB10
CC=10
CC=10
CC=15
CC=5
CC=10
CC=12 CC=5
CC=5
CC=5
CC=12 CC=12
CC=5
A < 1
A < 1
A >= 1
A >= 1
•Path analysis •Best Case Execution Time (BCET)•Worst Case Execution Time (WCET)•Infeasible paths
•Condition (A < 1) && (A >= 1) cannot be fulfilled
cycle count128 896
Tint2
cycle count256 512
Tint1
•Narrow bounds for the execution time interval

16
Area Time Trade-off (1)
void f(){
.
.
.
z=(a+b)*c +(d+e)*f;
.
.
.
for(i = 0; i < 4; i++){
g[i] = h[i] * k;
}
.
.
.
return;}
bb0
bb2
bb5
bb3
bb4
bb1
x1
x2
x3
x4
CC
GC
+ + x x +
1 ADD1 MULCC = 5
x1
CC
+
+
x x +
2 ADD1 MULCC = 4
x2
CC
++
xx
+
2 ADD2 MULCC = 3
x4
CC
x3
CC
+ +
x
x +
1 ADD1 MULCC = 4
17
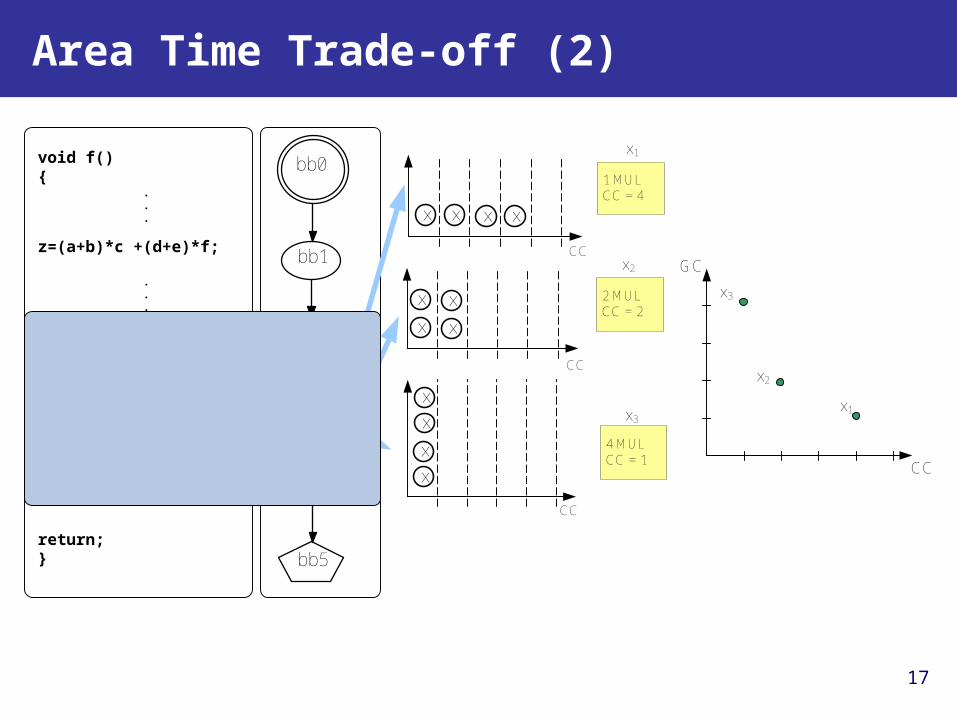
Area Time Trade-off (2)
void f(){
.
.
.
z=(a+b)*c +(d+e)*f;
.
.
.
for(i = 0; i < 4; i++){
g[i] = h[i] * k;
}
.
.
.
return;}
bb0
bb2
bb5
bb3
bb4
bb1
x1
x2
x3
CC
GC
xx
2 MULCC = 2
x2
CC
x x
1 MULCC = 4
x1
CC
xx 4 MUL
CC = 1
x3
CC
x x
xx
xx
18
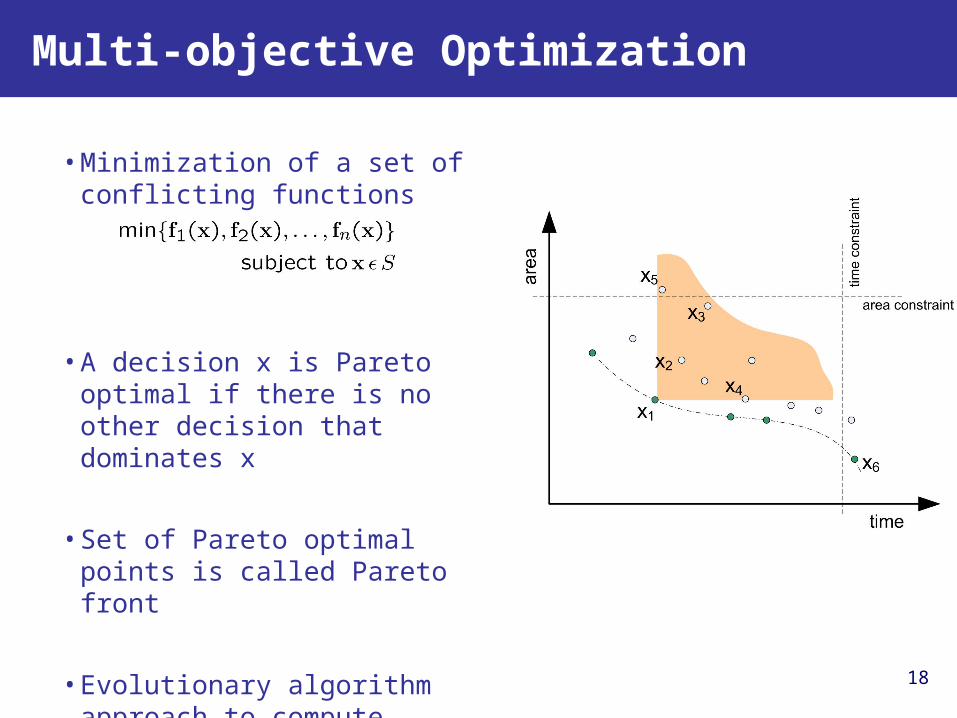
Multi-objective Optimization
•Minimization of a set of conflicting functions
•A decision x is Pareto optimal if there is no other decision that dominates x
•Set of Pareto optimal points is called Pareto front
•Evolutionary algorithm approach to compute Pareto front
19
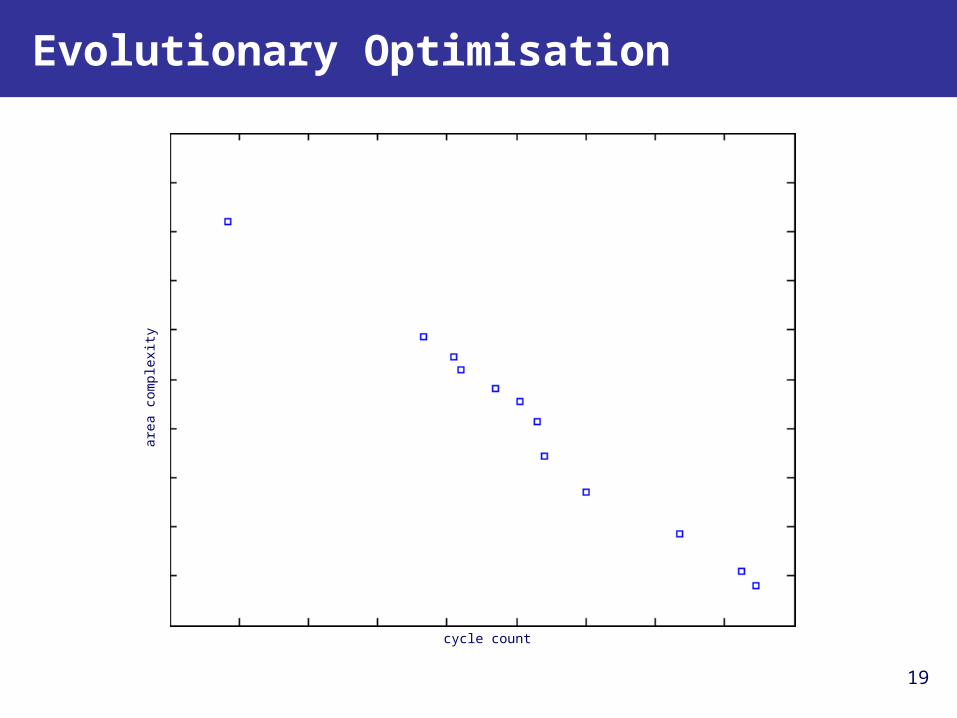
Evolutionary Optimisation
cycle count
are
a c
om
ple
xit
y
20
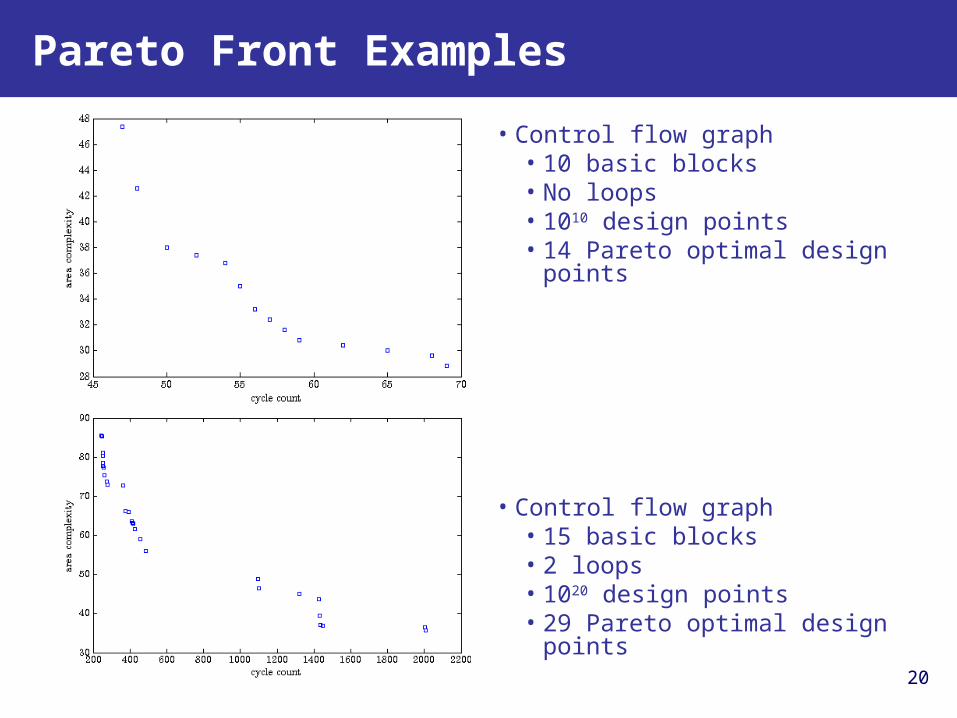
Pareto Front Examples
• Control flow graph• 10 basic blocks• No loops• 1010 design points• 14 Pareto optimal design points
• Control flow graph• 15 basic blocks• 2 loops• 1020 design points• 29 Pareto optimal design points
21
•Early design decision have high cost impact
•System characterization with static properties
•Estimation of implementation properties
•Generation of design alternatives
Summary

22
Thank you for your attention.
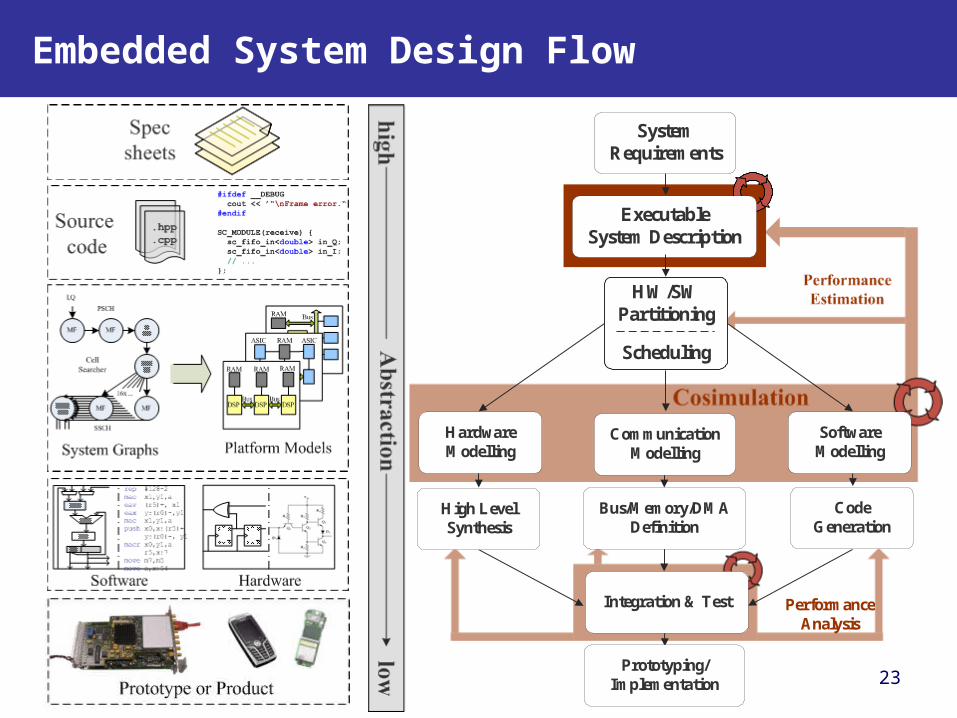
PerformanceAnalysis
23
Embedded System Design Flow
Prototyping/Implementation
ExecutableSystem Description
Integration & Test
Bus/Memory/DMA Definition
CodeGeneration
High LevelSynthesis
HW/SWPartitioning
Scheduling
CommunicationModelling
SoftwareModelling
HardwareModelling
SystemRequirements
24
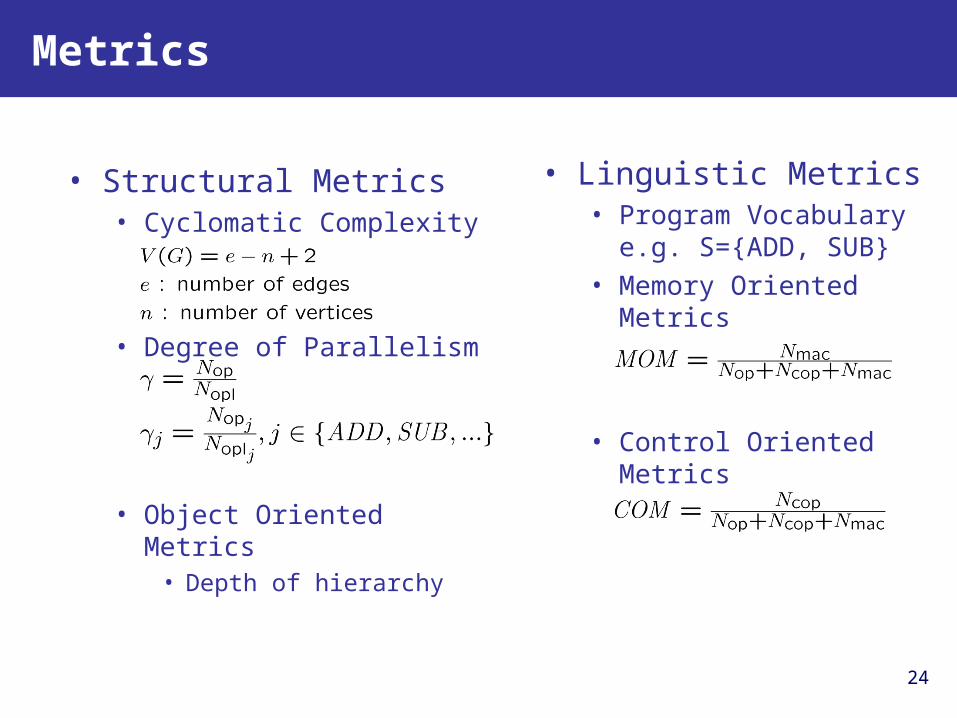
• Linguistic Metrics• Program Vocabulary
e.g. S={ADD, SUB}• Memory Oriented
Metrics
• Control Oriented Metrics
• Structural Metrics• Cyclomatic Complexity
• Degree of Parallelism
• Object Oriented Metrics• Depth of hierarchy
Metrics

Parallelism of a DFG
Nop : Total number of operationsNopl : Number of operations in the longest
path
op2
op4
op5
op6 op7 op8
op3
op1
a
dcb
Nop = 8Nopl = 5
γ = 8/5 = 1,6
High γ high parallelismfaster computationreuse capabilities
j
j
opl
op
j N
N Nop : Total number of operations of type j
Noplj : Number of operations of type j in the longest path
,...},{ SUBADDj
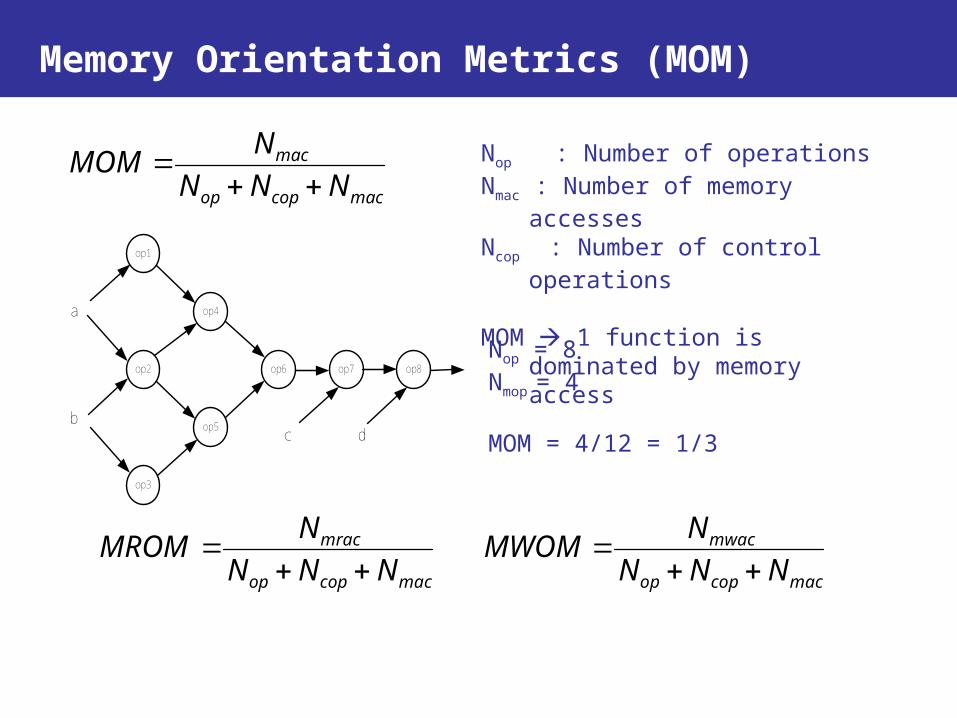
Memory Orientation Metrics (MOM)
Nop : Number of operationsNmac : Number of memory accessesNcop : Number of control operations
MOM 1 function is dominated by memory access
op2
op4
op5
op6 op7 op8
op3
op1
a
dcb
Nop = 8Nmop = 4
MOM = 4/12 = 1/3
maccopop
mac
NNN
NMOM
maccopop
mrac
NNN
NMROM
maccopop
mwac
NNN
NMWOM
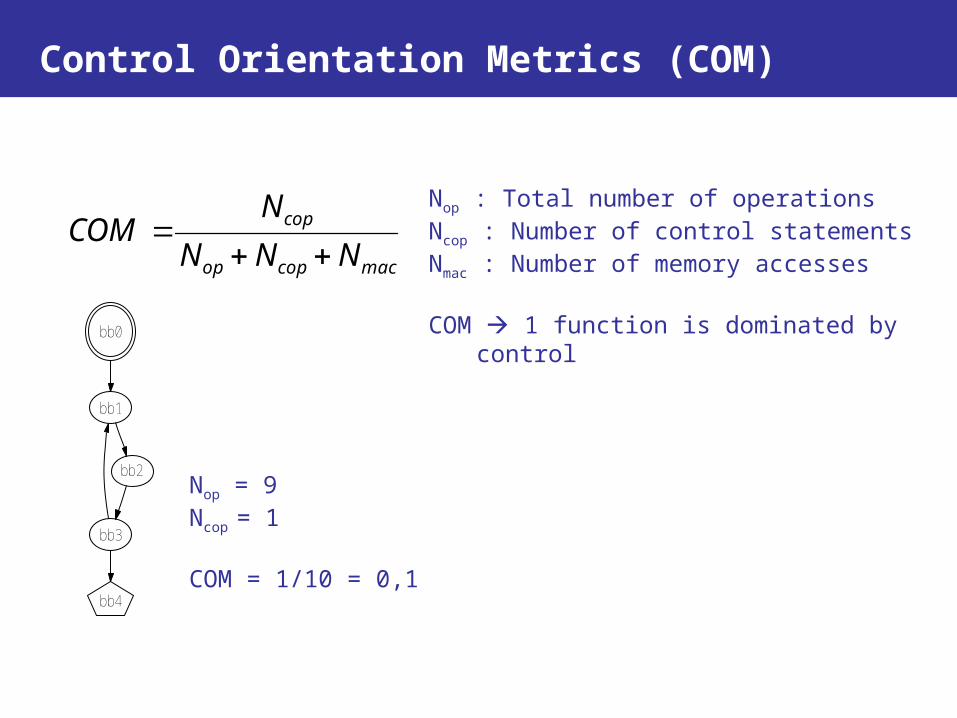
Control Orientation Metrics (COM)
Nop : Total number of operationsNcop : Number of control statementsNmac : Number of memory accesses
COM 1 function is dominated by control
Nop = 9Ncop = 1
COM = 1/10 = 0,1
bb0
bb1
bb4
bb2
bb3
maccopop
cop
NNN
NCOM
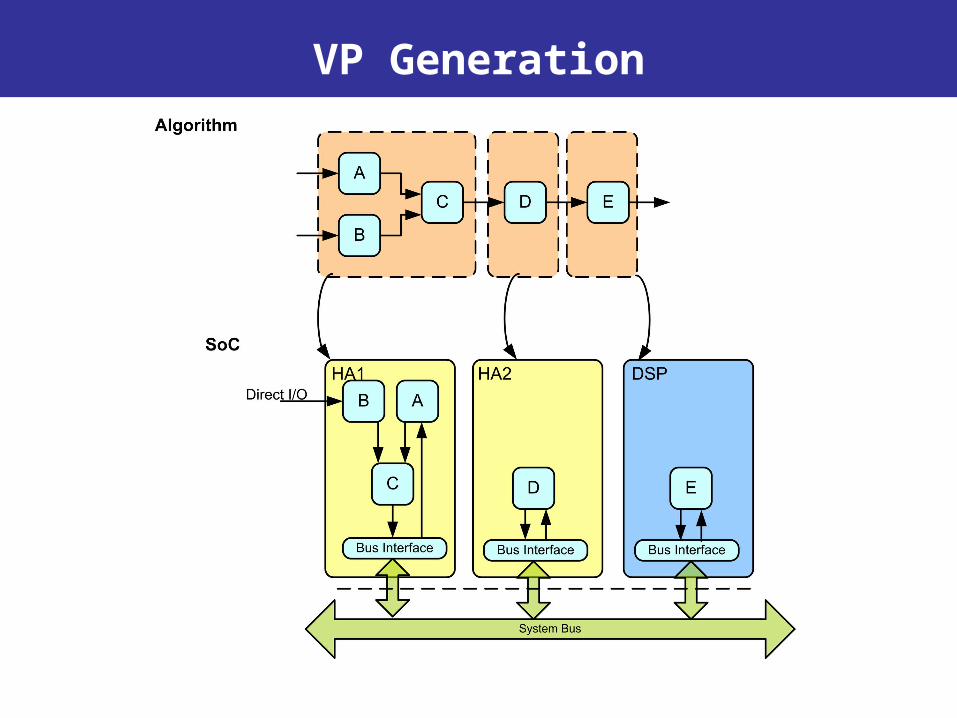
VP Generation