Embed Size (px)
Citation preview

China’s Research Progress on Black Carbon Aerosols
Joint Research Project CRAES – IMG
Olympic Project- CRAES
Joint Research Project (Olympic) CRAES-HKPolyU
Gao Jian1, Chai Fahe1, Wang Sulan1, Chen Yizhen1, Nina Schleicher2, Stefan Norra2, Tao Wang3, Wenxing Wang1
1. Chinese Research Academy of Environmental Sciences2. Institute of Mineralogy and Geochemistry, Karlsruher Institute of Technology3. HongKong Polytechnic University
The Chinese Research Academy of Environmental Science
Ministry of Environmental Protection


Global vs. Arctic Warming 1830 to the Present
BC Significantly Impacts the Arctic
Quinn et al. (AMAP Technical Report, 2008)
Arctic averageGlobal average Arctic averageGlobal average

BC May Have Bigger Role Than
Previously Understood
Warming Effect of Air Pollutants
0.35~0.9
(Carry Zhang, presentation in CRAES, 2010)

bacterias
virus
H2SO4
HNO3
SO2
NH3
O3
OH

Climate
Hazy
Visibility
PhotoChemistry
HumanHealth
BC
The bridge among different science sectors

Black Carbon (BC)
Sources of BC

Coal-burning cook stoves
in Xi’an, China
Black Carbon (BC)
Pita Bread Soaked in Lamb Soup

Asian Brown Cloud((((ABC))))
The South Asian Brown haze over the Nepalese town of Phaplu
taken March 25, 2001,
Black Carbon (BC) Research in China

Black Carbon (BC) Research in China

Black Carbon (BC) Research in China

Black Carbon (BC) Research in China

Black Carbon (BC) Research in China

Black Carbon (BC) Research in China
Cao, J.J., Lee, S.C., Ho, K.F., Zhang, X.Y., Zou, S.C., Fung, Kochy, Chow, J.C., Watson, J.G., 2003. Characteristics of
carbonaceous aerosol in Pearl River Delta region, China during 2001 winter period. Atmospheric Environment 37, 1451–1460.
Cao, J.J., Lee, S.C., Chow, J.C., Watson, J.G., Ho, K.F., Zhang, R.J., Jin, Z.D., Shen, Z.X., Chen, G.C., Kang, Y.M., Zou, S.C.,
Zhang, L.Z., Qi, S.H., Dai, M.H., Cheng,Y., Hu,K., 2007. Spatial and seasonal distributions of carbonaceous aerosols over China.
Journal of Geophysical Research 112, D22S11.

Concentration(ngm-3)
0 200 400 600 800 1000 1200 1400
Ho
urs
0
300
600
900
1200
1500
Black Carbon (BC) Research in China
Prof Jie Tang-CAMS
The variation of BC in Mt. WLG in the past ten years

Hour
1 2 3 4 5 6 7 8 9 10 11 12 13 14 15 16 17 18 19 20 21 22 23 24
Mo
nth
1
2
3
4
5
6
7
8
9
10
11
12
150ng.m-3
200ng.m-3
250ng.m-3
300ng.m-3
350ng.m-3
400ng.m-3
Hour
1 2 3 4 5 6 7 8 9 10 11 12 13 14 15 16 17 18 19 20 21 22 23 24
Mo
nth
1
2
3
4
5
6
7
8
9
10
11
12
1000ngm -3
1500ngm -3
2000ngm -3
2500ngm -3
3000ngm -3
QinghaiQinghai
WLGWLG
BeijingBeijing
SDZSDZ
Hour
1 2 3 4 5 6 7 8 9 10 11 12 13 14 15 16 17 18 19 20 21 22 23 24
Mo
nth
Aug
Sep
Oct
Nov
Dec
Jan
Feb
2000 ng.m-3
3000 ng.m-3
4000 ng.m-3
5000 ng.m-3
6000 ng.m-3
ZhejiangZhejiang
LinLin’’anan
Hour
1 2 3 4 5 6 7 8 9 10 11 12 13 14 15 16 17 18 19 20 21 22 23 24
Mo
nth
1
2
3
4
5
6
7
8
9
10
11
12
2000ng.m-3
4000ng.m-3
6000ng.m-3
8000ng.m-3
10000ng.m-3
12000ng.m-3
14000ng.m-3
SichuanSichuan
WenjiangWenjiang
Black Carbon (BC) Research in China
Prof Jie Tang-CAMS

The composition of PM2.5in Mega Cities of China
PM2.5PM2.5 BeijingBeijing ShenzhenShenzhen ChengduChengdu GuangzhouGuangzhou HongkongHongkong
Mass conc. (ug/m3)Mass conc. (ug/m3) 83 61.63 56 67.7 37.06
OCOC 16.95 14.06 14.5 24.37 8.7
ECEC 3.53 5.79 3.52 2.71 5.37
EC/PM2.5EC/PM2.5 4.3% 9.4% 6.3% 4.0% 14.5%
OC/ECOC/EC 4.80 2.43 4.12 9 1.62
SOSO4422-- 9.79 10.35 8.68 9.48 9.09
NHNH44++ 3.65 4.88 3.27 2.03 2.91
NONO33-- 3.78 2.63 3.68 1.35 1.29
SOSO4422--+NO+NO
33--+ NH+ NH
44++ 17.22 17.86 15.63 12.86 13.29

Location of Sampling Sites
A
B
C
D
E
NW
SE
Joint Research Project CRAES - IMG
km 0
km 17
km 29
km 52
km 43- Mini-volume-
sampler
- 200 l/h
- QF filter
- weekly samples
- day/night sampling

Aerosol pollution in Beijing TSP
Results of
Scanning Electron Microscopy
Anthropogenic particle:
Soot
Sampling period:
03/29 – 04/05/2006
Joint Research Project CRAES - IMG
(Schleicher, et al., 2008)

Joint Research Project CRAES - IMG
(Schleicher, et al., 2008)
1.8 to 12.2 μg/m3
(site E)
5.2 μg/m3 and 6.0 μg/m3
for all five sampling sites.
The percentage of BC of total PM2.5 ranges from 2.2 to 14.2% with an average value of 7.4% at site E.

Joint Research Project CRAES - IMG
(Schleicher, et al., 2008)
High average BC concentrations were found in autumn and winter (6.6 and 6.0 μg/m3 at site E), whereas lower concentrations occurred in spring and summer
(4.4 and 4.5 μg/m3 at site E)

Joint Research Project CRAES - IMG
(Schleicher, et al., 2008)
For the majority of the sampled weeks, night samples showed slightly
higher BC concentrations than day samples. This observation could be
explained by the regulation, that lorries are only allowed to drive during night time in most parts of Beijing.

BC measured in Mega-cities
(Zhou and Gao et al., 2009)

Location Sampling Dates
Particle Size Cut
um/Analytical
Method*
BC
PM2.5/
PM10/
TSP
The Ratio of
BC/PM2.5 or PM10
or TSP
Description of sampling
places References
Beijing 2005 2.5/O 2.37 76.8 0.031 Rural This work
Shanghai 2005 2.5/O 5.47 70.3 0.078 suburban This work
Shanghai1 Summer 1999 2.5/TOR 5.71 35.85 0.159 urban (near road) Ye et.al.[2003]
Shanghai2 Summer 1999 2.5/TOR 4.61 36.8 0.125 urban Ye et.al.[2003]
Beijing1 Summer 1999 2.5/TOR 6.27 / / urban He et.al.[2001]
Beijing2 Jul-Aug 2001 2.5/2ST 4.9 104.1 0.047 urban Dan et.al.[2004]
Beijing3 Jun-Jul 2002 2.5/2ST 5.2 99.4 0.052 Urban ( ) Dan et.al.[2004]
Beijing4 Jun-Jul 2002 2.5/2ST 6.6 86.7 0.076
Urban ( near the Capital
Steel Company) Dan et.al.[2004]
Beijing5 Jun-Jul 2002 2.5/2ST 5.3 86.8 0.061 urban ( ) Dan et.al.[2004]
Beijing6 Jul-Aug 2001 2.5/2ST 4.5 121.7 0.037 suburban Dan et.al.[2004]
Seoul 31/05– 2.5/TMO 8.4 44.4 0.189 urban ( a high school) Park et.al.[2001]
Chongju 24 July- 2.5/TOR 3.37 43.1 0.078 urban Lee et.al.[2001]
Jun-2000 2.5/TMO 5.3 / / urban Park et.al.[2002]
Seoul2 2003.3-2005.2 summer 2.5/TOT 4.1 38.2 0.107 urban ( ) Kim et al. [2007]
May-93 TSP/TO 1.38 / / urban Castro et.al.[1999]
Apr-Sep 1993 TSP/TO 2.68 / / urban (large city) Castro et.al.[1999]
Tábua Jul 1994-Aug1995 TSP/TO 1.17 / / urban(small city) Castro et.al.[1999]
Aveiro Aug-96 TSP/TO 1.26 / / urban Castro et.al.[1999]
Summer 1997-1998 10/2ST O 2.86 22.4 0.128 urban Röösli et.al.[2001]
April-Sep 2003 2.5/TOT 1.2 20.2 0.059 urban Giovanni et.al.[2005]
10 June-21August 1998 2.0/TOT 1.5 20 0.075 urban background Kubátová et al.[2002]
Anadia Aug-96 TSP/TO 1.59 / / rural Castro et.al.[1999]
K-Puszta Jul-96 10/2ST 0.6 24 0.025 rural situation Zappoli et.al.[1999]
9 July-31 August 1990 2.5/TOR 0.36 2.69 0.135 urban Chow et.al.[1996]
9 July-31 August 1990 2.5/TOR 2.61 11.01 0.237 urban Chow et.al.[1996]
9 July-31 August 1990 2.5/TOR 1.02 9.54 0.107 urban Chow et.al.[1996]
Crows Landing 9 July-31 August 1990 2.5/TOR 1.76 29.93 0.059 urban Chow et.al.[1996]
Academy 9 July-31 August 1990 2.5/TOR 1.43 16.95 0.084 urban Chow et.al.[1996]
Buttonwillow 9 July-31 August 1990 2.5/TOR 1.86 18.74 0.099 urban Chow et.al.[1996]
9 July-31 August 1990 2.5/TOR 2.95 49.65 0.059 urban Chow et.al.[1996]
Caliente 9 July-31 August 1990 2.5/TOR 3.33 19.98 0.167 urban Chow et.al.[1996]
Sequoia 9 July-31 August 1990 2.5/TOR 1.64 10.74 0.153 urban Chow et.al.[1996]
Yosemite 9 July-31 August 1990 2.5/TOR 1.87 15.97 0.117 urban Chow et.al.[1996]
Summer2001 2.5/TOR 1.1 20.1 0.055 urban Tanner et.al.[2004]
Lawrence co Summer 2001 2.5/TOR 0.74 17.7 0.042 rural site Tanner et.al.[2004]

BeijingBeijingBeijingBeijing ShanghaShanghaShanghaShanghaiiii
BC measured in Mega-cities
(Zhou and Gao et al., 2009)
The mean BC concentration showed a small increase in the morning and a more pronounced enhancement in the afternoon.

BC measured in Mega-cities
(Zhou and Gao et al., 2009)
The observed ratios are compared to those from the bottom-up emission
inventories for 2000, which were developed for the TRACE-P campaign (Streets et al., 2003)

CRAES
Changping
Olympic Project-CRAESJoint Research Project (Olympic) CRAES

Beijing-CRAES Urban site

Olympic Project-CRAES
Beijing-Changping Rural site

ChangpingBJ-CRAES
Olympic Project-CRAES

Soot Aging by Absorption of H2SO4 and H2O
Fresh soot agglomeratesSoot exposed to 1.5×1010 cm-3
H2SO4 vapor for ~12 s
(Kulmala: Science, 2003)
(Zhang RY: PNAS, 2008)
σext (
cm
2)
2e-10
4e-10
6e-10
σsca (
cm
2)
1e-10
2e-10
RH (%)
0 20 40 60 80 100σ
abs (
cm
2)
1e-10
2e-10
3e-10
a
b
c
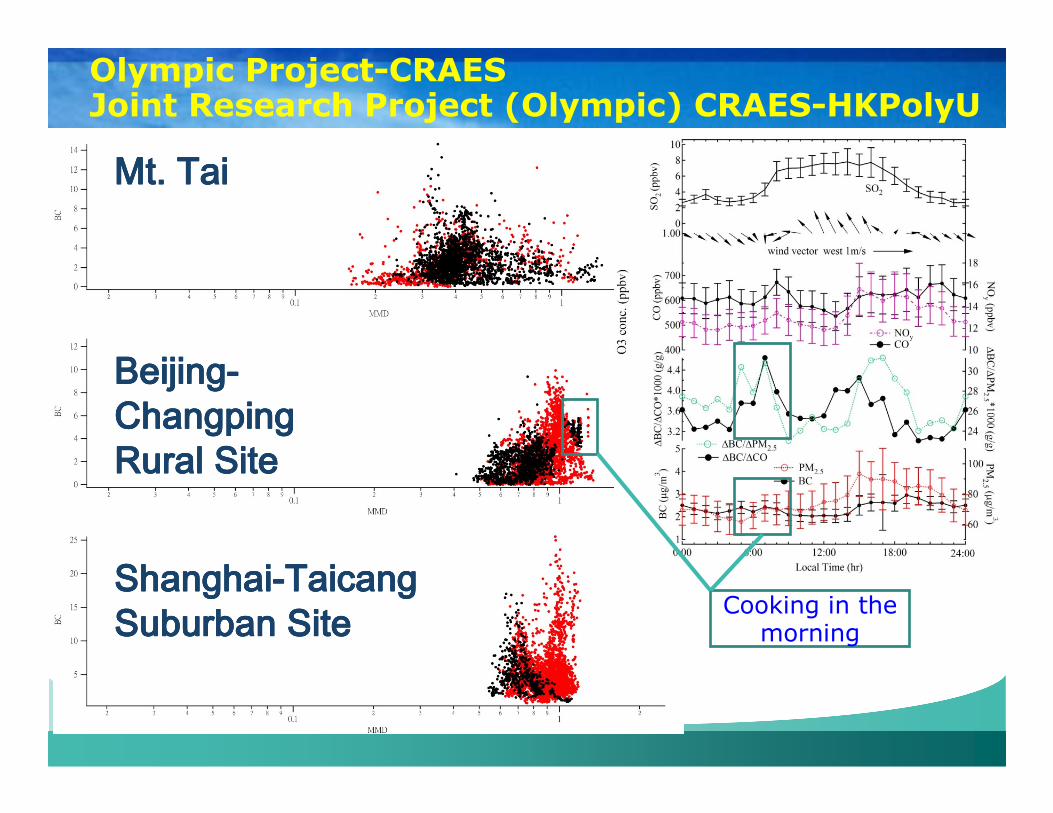
Mt. TaiMt. TaiMt. TaiMt. Tai
ShanghaiShanghaiShanghaiShanghai----TaicangTaicangTaicangTaicangSuburban SiteSuburban SiteSuburban SiteSuburban Site
BeijingBeijingBeijingBeijing----ChangpingChangpingChangpingChangpingRural SiteRural SiteRural SiteRural Site
Olympic Project-CRAESJoint Research Project (Olympic) CRAES-HKPolyU
Cooking in the morning

Olympic Project-CRAESJoint Research Project (Olympic) CRAES-HKPolyU
D(n
m)
Further study is going on…
Fresh
Aged
Coated

BC control: for policy making
� to construct a monitoring network to make clear the
long-term trend and spatial distribution of black carbon
� to develop an emission inventory
� to identify emission sources
� to determine discharge factors;
� to set-up a national emission inventory based on GIS;
� to identify the source, transfer and transform
mechanism of BC, as well as a source analysis and
transform mechanism of particles characteristics;
� to develop an online coupling of chemical mode and
climate mode;
� to study the formation process of SOA;
� and to deeply understand BC environmental and climate
effects.

LOGOMinistry of Environmental ProtectionMinistry of Environmental ProtectionMinistry of Environmental ProtectionMinistry of Environmental Protection