Embed Size (px)
Citation preview
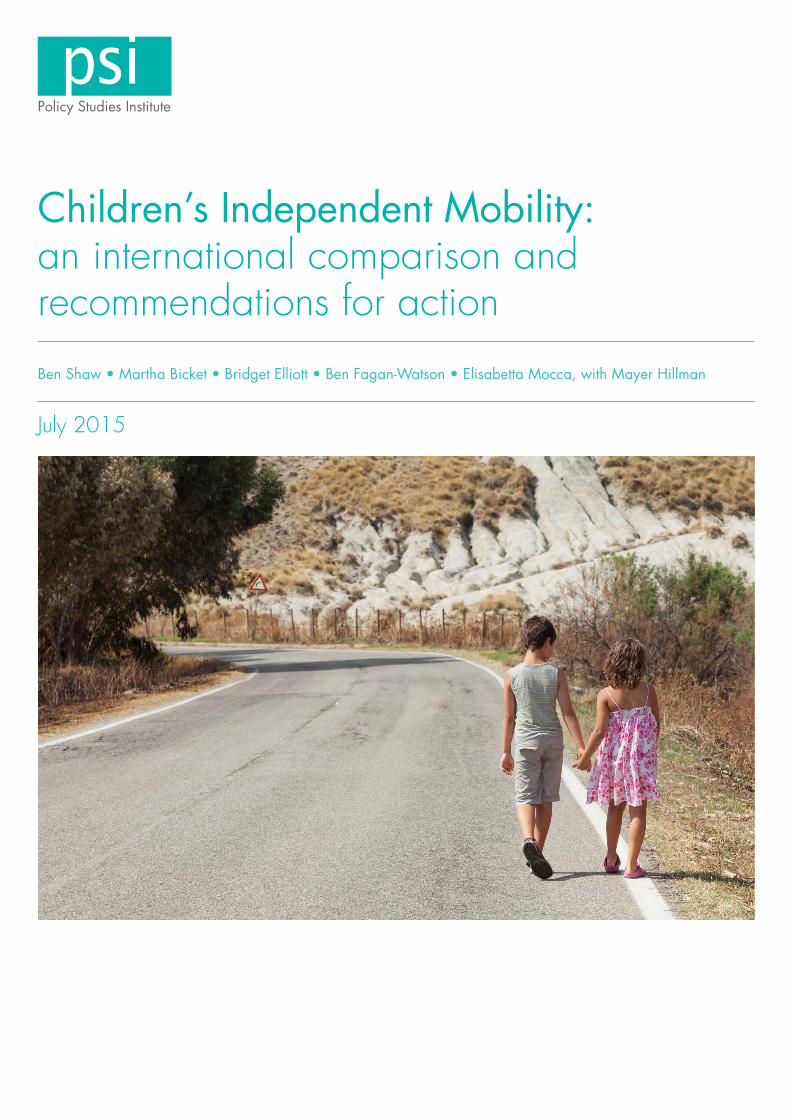
Children’s Independent Mobility: an international comparison and recommendations for action
Ben Shaw • Martha Bicket • Bridget Elliott • Ben Fagan-Watson • Elisabetta Mocca, with Mayer Hillman
July 2015
Children’s Independent Mobility: an international comparison and recommendations for action was written by Ben Shaw, Martha Bicket, Bridget Elliott, Ben Fagan-Watson and Elisabetta Mocca, with Mayer Hillman. It was published by Policy Studies Institute in 2015.
Key contributors:Roger Behrens, Pia Björklid, Alison Carver, Rita Cordovil, Riela Provi Drianda, Wafa Elias, Trine Fotel, Bjorn Frauendienst, Aslak Fyhri, Mats Gummesson, Michael Healy, Jukka Hirvonen, Randi Hjorthol, Tim Jones, Isami Kinoshita, Marketta Kyttä, Alain Legendre, Aline de Melo Nascimento, Patrick Muchaka, Jagath Munasinghe, Carlos Neto, Alanna O’Beirne, Brendan O’Keeffe, Andreas Redecker, Daniela Renzi, Julie Rudner, Aidan Scanlon, Silvia Shrubsall, Monica Vercesi, Giselle Xavier, and Yaeko Yamashita.
© Policy Studies Institute 2015. Some rights reserved.
This work is licensed under a Creative Commons Attribution-NonCommercial-NoDerivs 3.0 Unported License. To view a copy of this license, visit creativecommons.org/licenses/by-nc-nd/3.0/
ISBN 9780853740148
Policy Studies InstituteFaculty of Architecture and the Built EnvironmentUniversity of Westminster, 35 Marylebone Road, London, NW1 5LS.
T: +44 (0)20 7911 7503E: [email protected]: @PSI_LondonWeb: psi.org.uk
The University of Westminster is a charity and company limited by guarantee. Registration number: 977818. Registered office: 309 Regent Street, London W1B 2HW.7350/06.15/KR
Children’s Independent Mobility: an international comparison and recommendations for actioniii
AcknowledgmentsWith great thanks to the researchers who collaborated with us in this study to collect and analyse data for the 16 countries involved, as well as the individuals and funders supporting them, without all of whom this would not have been possible.
In alphabetical order by country:Alison Carver, David Crawford, Anna Timperio (Australia);
Aline de Melo Nascimento, Arthur Rodolfo Gomes de Oliveira, Giselle Xavier, Yaeko Yamashita (Brazil);
Trine Fotel, Jeppe Kirkelund Søndergaard (Denmark);
Jukka Hirvonen, Marketta Kyttä, Iiris Pirjola (Finland);
Elodie Brisset, Olivier David, Régis Keerle, Lucie Kostrzewa, Tiphraine Laigre, Alain Legendre, Adeline Legendre, Arnaud Lepetit, Sarah Maheo, Dominique Munchenbach, Enora Ripaud (France);
Rainer Benien, Corinna Berger, Dennis Edler, Bjorn Frauendienst, Manfred Hommel, Katharina Meyer, Markus Müller, Stefan Philipp, Andreas Redecker, Manuel Schneider (Germany);
Michael Healy, Alanna O’Beirne, Brendan O’Keeffe, Aidan Scanlon (Ireland);
Wafa Elias, Yoram Shiftan (Israel);
Alfredo Alietti, Antonella Prisco, Daniela Renzi, Monica Vercesi (Italy);
Riela Provi Drianda, Isami Kinoshita (Japan);
Guro Berge, Anne-Line Bergli, Cecilie Bergmann, Beate Elvebakk, Marit Espeland, Aslak Fyhri, Stein Owe Hansen, Randi Hjorthol, Einar Jensen Saga (Norway);
Ana Cristina Arez, Rita Cordovil, Frederico Henriques, Frederico Lopes, Duarte Moreno, Carlos Neto, Sylvie Oliveira, Silvia Shrubsall, Ana Sofia Tojo (Portugal);
Roger Behrens, Patrick Muchaka (South Africa);
Jagath Munasinghe, Julie Rudner, Naduni Wickramaarachchi (Sri Lanka);
Pia Björklid, Mats Gummesson (Sweden); and
Sarah Bell, Christine Bertram, Alex Cecchinelli, Alice Dalton, Annalisa Fagan-Watson, Ben Fagan-Watson, Mayer Hillman, Tim Jones, Karen MacKinnon, Monica Martini, Camila Oliveria, Alyssa Pennini, Ben Shaw, Matt Shaw, Ashley Slisz (UK).
Thanks are also due to Ann Kenrick and Daniel Sauter for their help.
With thanks to the steering group members: John Adams, Belinda Brown, Tim Gill, Mayer Hillman, Tim Jones, Roger Mackett, Catherine Prisk, and John Whitelegg.
With thanks to the Nuffield Foundation who funded PSI to conduct this international comparative study. The Nuffield Foundation is an endowed charitable trust that aims to improve social well-being in the widest sense. It funds research and innovation in education and social policy and also works to build capacity in education, science and social science research. The Nuffield Foundation has funded this project, but the views expressed are those of the authors and not necessarily those of the Foundation. More information is available at nuffieldfoundation.org
We would also like to thank the funders and institutions who supported the work of the international partners, including in the UK, the former Department for Children, Schools and Families, Esmée Fairbairn Foundation and Rees Jeffreys Road Fund.
With special thanks to the schools, students and parents everywhere who participated in the survey.
Any errors and omissions in the work are, of course, the responsibility of the authors.
Children’s Independent Mobility: an international comparison and recommendations for actioniv
“It is normal for children to carry out activities in the road environment – such as cycling, walking, running, playing and other common group activities. It is also important for their healthy development that children, from an early age, undertake such activities. For this reason, it is important for the road environment to be safe so that these activities can be undertaken without the child’s safety being put at risk.” WHO and Unicef, 2008, World Report on Child Injury Prevention (Chapter 2: Road traffic injury)
“The state of children is a very sensitive barometer to the effects of social environmental, economic and other changes.”
“…it is important to avoid the huge costs to society of not attending to children: governments know from research beyond doubt that what happens to children in the early years, within the family, within other forms of care, and even before birth in the womb, significantly determines their positive, or negative, growth and development. This, in turn, determines their cost or contribution to society spread over the rest of their lives.” Unicef Innocenti Research Centre (2004) Building Child Friendly Cities: A Framework for Action
Children’s Independent Mobility: an international comparison and recommendations for actionv
Summary
This report explores, through international comparison, the freedom that children have to get about and play in their local neighbourhood unaccompanied by adults – children’s independent mobility. The motivation for exploring this issue is the evidence highlighted in previous work by the Policy Studies Institute stretching back over 40 years, that independent mobility is declining with significant consequences for the health and physical, social and mental development of children.
The study documents and compares children’s independent mobility in 16 countries across the world. It reviews the policy responses that have been made and how these could be developed to respond to the levels of independent mobility observed.
The objectives and research questions of the study were to identify: 1. How does children’s independent mobility vary within, between, and across
the countries involved in the study?2. What are the factors that affect the observed levels of children’s
independent mobility?3. What are the implications of changes in children’s independent mobility for
children and their physical and social development, their parents’ lifestyles and for society in general?
4. How should policy-makers respond to the challenges posed by the findings?
MethodsThe research team at the Policy Studies Institute coordinated the collection of international datasets on children’s independent mobility with international partners from 16 countries including: Australia, Brazil, Denmark, England, Finland, France, Germany, Ireland, Israel, Italy, Japan, Norway, Portugal, South Africa, Sri Lanka and Sweden. Between early 2010 and mid-2012, 18,303 children (aged between 7 and 15 years old) and a subset of their parents from these countries were surveyed in order to explore their degree of freedom to travel and play in their local neighbourhood without adult supervision.
Separate, but typically paired, questionnaires were used for parents and their children and these collected information on children’s travel patterns and accompaniment on journeys to school and other activities. Questionnaires included core questions which served as the principal measures of independent mobility, covering factors such as whether children are allowed to: cross main roads alone; go alone to places other than school that are within walking distance; travel home from school alone; go out alone
Children’s Independent Mobility: an international comparison and recommendations for actionvi
after dark; travel on local buses alone; or cycle on main roads alone. Further questions explored children’s and parents’ attitudes and fears, mobile phone and car ownership, socio-demographics, and other potentially relevant factors.A comparative analysis of these data was conducted and an international workshop held to discuss and develop the findings and policy responses, with a particular, but not exclusive, focus on UK policy. Furthermore, a review was conducted of evidence of the range of policies and actions to improve children’s independent mobility that have been implemented by public authorities, international organisations and non-governmental organisations in order to develop recommendations for actions.
A range of caveats limit the representativeness of the findings in this study, resulting from limitations in survey design and implementation, such as sampling, self-selection, self-reporting and under- or over-exaggeration, and differences between country survey methodologies. While caveats apply to these findings it should be noted that there is very little information available on the degree of freedom children have to travel and play in their local area and even less making international comparisons. As such the data and findings represent an important resource and baseline for exploring this issue now and in the future.
Key findings The international comparison found that children’s independent mobility varies widely across the 16 countries studied. It is clear, however, that significant restrictions are placed on children’s independent mobility in nearly all the countries. Headline findings from the international comparison are that:
• Low levels of children’s independent mobility are common, with significant restrictions placed on the independent mobility of children across all the ages studied (7- to 15-year-olds). Restrictions are greatest for children under 11 but even the oldest children are restricted in what they are allowed to do, at an age when many of the rights of adulthood are close to being granted.
• Parents have significant concerns about letting their children go out alone with traffic seeming to be the strongest factor affecting the granting of independent mobility.
• When comparing aggregate rank scores of children’s independent mobility for each country, Finland is by far the highest performing country, followed by Germany, Norway, Sweden, Japan and Denmark, who score more closely to one another. Together these countries form a group of top performers in this international comparison of children’s independent mobility levels.
• Countries with the lowest aggregate rank scores of children’s independent mobility were, in order: France, Israel, Sri Lanka, Brazil, Ireland, Australia, Portugal and Italy (tied), and South Africa.
Children’s Independent Mobility: an international comparison and recommendations for actionvii
• The aggregate rank score for England places it far behind the top group of performing countries but ahead of the lowest performing group of countries.
The degree of independent mobility granted to Finnish children is striking. At age 7, a majority of Finnish children can already travel to places within walking distance or cycle to places alone; by age 8 a majority can cross main roads, travel home from school and go out after dark alone, by age 9 a majority can cycle on main roads alone, and by age 10 a majority can travel on local buses alone. Overall, Finland is the top-performing country across almost every independent mobility indicator in this study, coming second only to Germany for children’s self-reported freedom to travel on local buses alone.
In the other countries studied children are granted the freedoms of independent mobility later. By age 11, according to parents, at least a majority of children in each of the countries are allowed to cross main roads. By age 11, according to children, at least a majority of them in each of the countries are allowed to cross main roads, except for South Africa. By age 12, at least a majority of children in each of the countries are allowed to go places within walking distance alone. By age 13, at least a majority of children in each of the countries are allowed to travel home from school alone (age 12 excluding Ireland) or, according to children, use local buses alone. By age 15, at least a majority of children in nearly all of the countries surveyed exercise each of the indicators of independent mobility, except for the ability to go out alone after dark. Going out alone after dark is the most withheld independent mobility. Only in a handful of countries – Finland, Sweden, Japan and Denmark – are a majority of children of any age allowed to go out after dark.
It should be highlighted that independent ‘mobilities’ are withheld from many children and that a large proportion of children under 11 years old in most of the countries studied do not possess the freedom to get about their local area, whether crossing main roads, going to places within walking distance, or travelling home from school. These findings pose challenging questions for policy-makers and society.
Conclusions and recommendations There is a vast range of interventions that could be made to address children’s independent mobility as well as clear reasons for taking action in this area related to the health and physical, social and mental development of children.
The study reviewed the evidence of the range of policies and actions that have been undertaken by public authorities, international organisations and non-governmental organisations in order to improve children’s independent mobility. From this it is striking that the concept of independent mobility is not either a focus of many interventions or a major concern of policy-makers. Even where it is explicitly referred to little consideration
Children’s Independent Mobility: an international comparison and recommendations for actionviii
is given to the question of what an appropriate level of children’s independent mobility might be or the scale of intervention that would be required to enable a chosen level to be achieved. Independent mobility is seen as desirable but is not regarded as a right that should be accorded to children.
This report captures the best examples of approaches to addressing children’s independent mobility observed and presents a set of policy recommendations based on the lessons learnt. Approaches to enabling children’s independent mobility were found to fall under four main categories: urban planning and development; children’s mobility programmes; education and guidance on road safety and sustainable mobility; and campaigns and events. The best initiatives were found to focus on transforming urban environments to enable children’s independence and development, as part of a wider programme of social, environmental and economic development. The examples of the cities of Rotterdam and Vancouver amongst a few other examples, are notable and perhaps exceptional for their level of ambition and focus on transforming urban space for children and wider societal, environmental and economic benefits. Rotterdam saw making its urban centre child-friendly as an integral part of its economic regeneration by making families want to live in the urban centre rather than leave when they have children.
Many other initiatives focussed on what can be seen as mitigating measures to develop the skills required to survive in dangerous traffic-dominated environments rather than creating environments in which children, and people more broadly, might thrive. Teaching children (and adults) about road safety is a necessary and important life skill and will be likely to encourage some increase in mobility. However, a more ambitious and transformative approach is required that involves building awareness and support for change and then implements measures that deliver it. Not addressing the fundamental threats posed by traffic and factors of concern to parents will inevitably result in children being withdrawn from the risk or not being exposed to it until a later age. At this later age they may be granted freedom to go out in more dangerous environments without having developed their ability to negotiate less dangerous environments.
With these observations in mind this report makes the following seven recommendations for action to increase children’s independent mobility:
Recommendation 1: Implement and enforce stringent road safety measures that focus on removing danger from the road environment, not the removal of children from danger.
Recommendation 2: Reduce car dependency and the dominance of traffic in the public realm.
Recommendation 3: Put the needs of children at the heart of spatial planning and urban development – public spaces that work for children, work for everyone.
Recommendation 4: Explicitly incorporate children’s independent mobility into policy.
Children’s Independent Mobility: an international comparison and recommendations for actionix
Recommendation 5: Adopt Daylight Saving Time to allow children to better utilise daylight hours and reduce road casualties.
Recommendation 6: Invest in research to consolidate and develop knowledge on children’s independent mobility.
Recommendation 7: Create a national challenge fund to catalyse and drive action to improving children’s independent mobility.
While delivering this agenda is of course challenging, encouragement can be taken from previous examples of approaches that place children’s needs at the centre of the urban development and from the fact that significant change is possible. The level of community-led activity we have observed on reclaiming outdoor space for children (and adults), particularly in the UK, also suggests there is public desire for greater action from policy-makers to enable such change. However, if these examples of good practice are to become more widespread, consideration of the benefits of children’s independent mobility needs to be made a much higher profile and explicit consideration in policy. Better quality public and media debate is also needed on the implications of low levels of children’s independent mobility and the means by which these levels can be increased.
At its most fundamental level the debate is about the quality of the environments we wish to bring up our children in and how we enable them to flourish. We hope this report will make a contribution to this debate and lead to a significant change in policy on the role and rights of children in society.
Children’s Independent Mobility: an international comparison and recommendations for actionx
Contents
Acknowledgments ................................................................................................. ii
Summary ..............................................................................................................v
List of Figures ........................................................................................................ x
List of Tables .........................................................................................................xi
List of Boxes .........................................................................................................xi
Further information on this report and research .......................................................xiii
Foreword ..........................................................................................................1
1. Introduction ...............................................................................................3
Why is children’s independent mobility important? .................................................... 3
Children’s independent mobility as a measure ............................................................. of road safety and quality of life .............................................................................. 6
Research objectives ............................................................................................... 7
Contents of the report ............................................................................................ 8
2. Methodology ............................................................................................. 9
Survey ................................................................................................................. 8
Workshop .......................................................................................................... 12
Research limitations and caveats ........................................................................... 12
3. International Comparison .......................................................................... 13
Measuring children’s independent mobility ............................................................. 13
Overall ranking .................................................................................................. 14
Mobility rights – a closer look ............................................................................... 16
Children’s independent mobility, well-being and educational attainment ..................... 22
Attitudes and fears .............................................................................................. 26
The influence of road safety on independent mobility ............................................... 27
The influence of road traffic rules and legislation ..................................................... 32
The influence of gender ........................................................................................ 33
The influence of car ownership.............................................................................. 36
The influence of mobile phone ownership ............................................................... 36
The influence of daylight hours .............................................................................. 39
The influence of mode of travel to school and the role of the bicycle .......................... 40
Summary of survey findings and key highlights ....................................................... 44
Children’s Independent Mobility: an international comparison and recommendations for actionxi
4. How should we respond to the observed levels of children’s independent mobility? ...................................................................47
What is the trend in children’s independent mobility over time? ................................. 47
What is it that is restricting children’s independent mobility? ..................................... 49
Existing policy and actions affecting children’s independent mobility .......................... 51
What can we learn from existing interventions on children’s .......................................... independent mobility? .......................................................................................... 54
5. Recommendations: where next for children’s independent mobility?......... ....................................................... 65
Unsafe environments for children are widely tolerated ..............................................65
Withholding independent mobility may only defer risk ..............................................66
Action is needed to address parental concerns, road user behaviour, the physical environment, social and cultural factors .................................................66
Change may be resisted but it actually happens all the time ......................................67
What should be done to increase Children’s Independent Mobility? ...........................67
Recommendation 1: Implement and enforce stringent road safety measures ................68
Recommendation 2: Reduce car dependency and the dominance of traffic in the public realm ...................................................................................69
‘Recommendation 3: Put the needs of children at the heart of spatial planning and urban development – public spaces that work for children, work for everyone’ ......69
Recommendation 4: Explicitly incorporate children’s independent mobility into policy ............................................................................70
Recommendation 5: Adopt Daylight Saving Time to allow children to better utilise daylight hours and reduce road casualties .........................................71
Recommendation 6: Invest in research to consolidate and develop knowledge on children’s independent mobility .........................................................72
Recommendation 7: Create a national challenge fund to catalyse and drive action to improving children’s independent mobility ...................................72 Concluding comments – delivering places fit for children...........................................73
6. References......... ..................................................................................... 75
Children’s Independent Mobility: an international comparison and recommendations for actionxii
List of FiguresFigure 1: Key findings from previous PSI work on Children’s Independent Mobility and key developments in external policy context .........................................................5
Figure 2: Map showing the sixteen countries involved in this study ..........................................10
Figure 3: Differences in overall children’s independent mobility levels compared ....................................................................................................15
Figure 4: Percentage of children allowed to cross main roads alone (children’s responses)..........17
Figure 5: Percentage of children allowed to cross main roads alone (parents’ responses)............17
Figure 6: Percentage of children allowed to go places other than school within walking distance alone (parent’s responses) ..................................................................................................18
Figure 7: Percentage of children travel home from school alone (parent’s responses) ..................18
Figure 8: Percentage of children usually allowed to go out alone after dark (parent’s responses) ............................................................................................18
Figure 9: Percentage children allowed to travel on local buses alone (children’s responses) ........19
Figure 10: Percentage of children usually allowed to travel on local buses alone (parent’s responses) ...........................................................................................................19
Figure 11: Percentage of children allowed to cycle places alone (children’s responses) ..............19
Figure 12: Percentage of children allowed to cycle on main roads alone (parent’s responses) .....19
Figure 13: Unicef 2013 well-being rankings vs children’s independent mobility .........................22
Figure 14: Educational attainment (PISA 2009) vs children’s independent mobility ....................23
Figure 15: Level of parental agreement with statement “Most adults who live in the neighbourhood look out for other people’s children in the area”, by country, ordered by overall level of independent mobility ...................................................................24
Figure 16: Level of parental agreement with statement “Some young people and adults in the area make you afraid to let your children play outdoors”, by country, ordered by overall level of independent mobility................................................................................25
Figure 17: Level of parental concern about the risk of their child being injured in a traffic accident when crossing a road, by country ordered by overall level of independent mobility .....................................................................................................26
Figure 18: Impact of road safety on children’s independent mobility ........................................27
Figure 19: Proportion of children allowed to cross main road alone compared to road traffic death rate (age 11 cohort) .................................................................................28
Figure 20: Parental concern at risk of injury from traffic compared to road traffic death rate (age 11 cohort) .................................................................................................30
Figure 21: Parental concern at risk of injury from traffic compared to proportion to children allowed to cross roads alone (age 11 cohort) .......................................................30
Figure 22: Traffic speed law enforcement compared to proportion of children allowed to cross main roads ................................................................................................31
Figure 23: Unsupervised weekend activities of children by gender (age 11) .............................34
Figure 24: Effect of car ownership on independent mobility in the total sample (age 11 cohort) ...............................................................................................35
Children’s Independent Mobility: an international comparison and recommendations for actionxiii
Figure 25: Three countries where household car ownership affects independent mobility (no effect seen in the other 11 countries) (age 11 cohort) .........................36
Figure 26: Effect of mobile phone ownership (by child) on children’s independent mobility in the total sample (age 11 cohort) .........................................................................37
Figure 27: Four countries where mobile phone ownership affects independent mobility (no effect seen in the other 10 countries) (age 11 cohort) .........................37
Figure 28: Variation in daylight hours and the licence to go out after dark ................................39
Figure 29: How did you get to school this morning? Children age 11, ordered by independent mobility ranking, highest to lowest ...........................40
Figure 30: Percentage of children driven to school against overall independent mobility rank (age 11) ..........................................................................41
Figure 31: How did you get to school this morning? Mode of travel by country and age (countries ordered by overall independent mobility ranking) ...................................................43
Figure 32: Do you have a bicycle? By country and age. ........................................................44
Figure 33: How would you like to travel to and from school? Children age 11, ordered by independent mobility ranking, highest to lowest ...........................44
List of TablesTable 1: Number of valid survey respondents by country ........................................................11
Table 2: Core indicators of independent mobility ...................................................................13
Table 3: Overall children’s independent mobility levels compared............................................16
Table 4 Relative prevalence of granting specific mobility rights ................................................16
Table 5: Road policy differences between countries ...............................................................32
Table 6: Significant differences in the granting of independent mobility to boys and girls aged 11, by country .....................................................................33
Table 7: Daylight hours at time of survey and in terms of total annual variation .........................38
Table 8: Percentage of primary school children (7- to 11-year-olds) ............................................. granted independent mobility, England and Germany, 1971–2010. .......................................48
Table 9: Percentage of parents granting 7- to 9-year-old children licence to go to different activities, Sweden .....................................................................................48
List of BoxesBox 1: Building Blocks for a Child Friendly Rotterdam, the Netherlands ....................................55
Box 2: Vancouver’s Living First Strategy, Canada ..................................................................56
Box 3: The Child-Friendly Cities Initiative ..............................................................................57
Box 4: Children’s Tracks, Norway .......................................................................................59
Box 5: Schoolway.net and Mobility Management Plans, Austria ..............................................60
Box 6: Twelve Wishes for a Child Friendly Leeds, UK .............................................................60
Box 7: Play Happens Everywhere, Vauban, Germany ............................................................61
Box 8: Playing Out, Bristol, UK ...........................................................................................63
Children’s Independent Mobility: an international comparison and recommendations for actionxiv
Further information on this report and researchThe following accompanying appendices to this report contain more detailed information on this research: Appendix I. Survey methodology and country details.
Appendix II. Workshop Report, ‘Children’s Independent Mobility: Lessons from international experience and challenges for policy’, 16 September 2013, London.
Appendix III. Working Paper: Policies and actions to enable Children’s Independent Mobility. These appendices along with individual country reports, plots of the main findings childon children’s independent mobility, and workshop materials are available online: psi.org.uk/children_mobility
Children’s Independent Mobility: an international comparison and recommendations for action1
Foreword
This report covers four decades of research. It represents the culmination of a unique longitudinal study, set in train in 1970 at Policy Studies Institute, on the personal mobility and travel patterns of children. Its origins lay in a significant focus of my doctoral thesis in the late 1960s at the University of Edinburgh, evolving from a growing concern about the impact of the increasing volume and speed of motor traffic on the character of children’s lives beyond the confines of their home. It also emerged from a concern that regrettably far too little attention was being paid in transport policy to walking and cycling, children’s only independent means of travel. It appeared that this policy was primarily aimed at accommodating the growing proportion of the population with a car – frequently at the expense of the mobility of vulnerable groups such as children.
Addressing this problem is by no means easy. The attractions of car travel hardly need rehearsing. However, as children grow older, their interests widen, they prefer the company of their friends and informal activity on the street, and therefore, their travel needs change. Simply roaming around is a learning experience from the opportunities gained outside the home. In the past, their local neighbourhood has provided the locus for these valuable components of their development enabling them to acquire physical, practical and social skills and to promote their health and fitness. But to do so has increasingly entailed their exposure to risk of injury on the roads and, albeit much exaggerated, to danger from ‘strangers’, that is, everyone they don’t know!
It was against this background that, in 1971, through the medium of surveys, we revealed the characteristics of children’s travel and the influence and attitudes of their parents to it. Our research aimed to highlight that aspect of children’s quality of life which is indicated by their parents allowing them the basic element of freedom to get about without adult supervision. Its absence could be seen as an infringement of their right to a safe outdoor environment – a right that has been largely displaced nowadays by parents taking on responsibility for their children’s safety by accompanying them outside the home. This process has resulted in a marked reduction in children being injured on the roads, that was then claimed to be a reflection of the success of road safety measures, in spite of the fact that it could so obviously also be explained by this loss of independence.
Children’s Independent Mobility: an international comparison and recommendations for action2
A generation on, in 1990, we were able to test this theory by comparing changes that had taken place in these respects. By returning to the same schools surveyed two decades previously and by using almost identical questionnaires, we identified a massive decline in the age at which children were granted mobility ‘licences’, namely to travel alone on foot, by cycle and by bus. In addition to the temporal element made possible by repeating our surveys in England, we were also able to add a cultural dimension to the study by carrying out matching surveys in the then West Germany.
In 2010, we obtained agreement for this, a major international study entailing collaboration with fellow researchers in 16 countries around the world. Matching surveys of children and their parents were carried out. This enables us to better understand the cultural factors in the surveyed countries which have contributed to the observed marked differences in children’s independence and their parents’ attitudes to this.
With few exceptions, the surveys identified a considerable erosion of children’s independence for a period of their childhood way beyond the age when they are physically able to get about on their own, and beyond that of their parents when they were children, and even more so that of their grandparents. The much reduced incidence of injury on the roads appears to have been gained to a large degree by obliging children to be accompanied by an adult to a later age in their childhood.
It is clear that public policies, directly and indirectly, have resulted in children being treated as second class citizens whose travel needs for their leisure and recreational activities and rights to a safe environment outside the home have been largely overlooked in public policy other than on their journeys to and from school – which only account for little more than a third of all their journeys. If we are to extend children’s geographical catchment of activity and opportunity, with all the benefits for their development that come in its wake, and create an environment best suited to promoting their quality of life, a much more comprehensive strategy is needed to reverse many current policies and practices in the majority of countries involved in this study.
With much appreciation for the dedication and enthusiasm of all those colleagues who have contributed to or advised its various stages of the research programme over the years and, not least, the wide-ranging institutions which have sponsored them.
Mayer Hillman Senior Fellow Emeritus Policy Studies Institute
Children’s Independent Mobility: an international comparison and recommendations for action3
A Good Childhood by Richard Layard and Judy Dunn (2009) opens with the observation, made in relation to the UK, that children in many ways have never lived so well. They have more possessions, better homes, more holidays away and an unprecedented ability to communicate with their friends. They are also more educated and less sick than ever before. Yet, there is widespread unease about the experience of life our children have and their well-being. Issues around the nature of family life, lifestyles, education, inequality and the pressures these place on children are never far away from the media headlines. Indeed, the Children’s Society found that half a million children in the UK between 8 and 16, nearly 10 per cent, had a low sense of well-being (Children’s Society, 2012).
Among a much wider set of observations and recommendations Layard and Dunn highlight that if children are to flourish they must have the physical freedom to explore a world outside the family. The Children’s Society also highlights choice and autonomy, which of course is about more than the freedom to go out alone, as a key factor in understanding children’s well-being. It includes it as one of ten factors in the Good Childhood Index (Children’s Society, 2012).
In this report we explore through international comparison the freedom children have to get about and play in their local neighbourhood unaccompanied by adults – children’s independent mobility. At first sight this issue might seem to be concerned with a narrow focus on documenting the nature of children’s travel rather than exploring a central aspect of children’s well-being. However, in the light of the need for children to enjoy freedom if they are to flourish, and as has been clearly documented in PSI reports on this issue since 1971, children’s independent mobility links a wider set of issues related to the bigger picture of children’s lives, their well-being and the societal challenges involved in addressing these.
Why is children’s independent mobility important?
The primary aim of this study is to document and compare levels of children’s independent mobility internationally. To what degree are children free to move around their neighbourhood unaccompanied by adults? How does this vary between countries? A further aim is to explore what policy responses should be made to the levels of independent mobility observed. This study builds on earlier work conducted in England and Germany (Shaw et al., 2013, and Hillman et al., 1990, Hillman et al., 1971) adding survey data and insights on children’s independent mobility from a further
1 Introduction
Children’s Independent Mobility: an international comparison and recommendations for action4
14 countries around the world: Australia, Brazil, Denmark, Finland, France, Ireland, Italy, Israel, Japan, Norway, Portugal, South Africa, Sri Lanka and Sweden. These countries expand the approach beyond northern Europe, allowing a much wider comparison of children’s experience and the good and bad practice that affects this. The increase in countries surveyed also allows comparison of developed and developing countries and adds an important dataset in an area in which we have found there to be a paucity of data and analysis available.
The motivation for exploring this issue is the clear evidence that, firstly, independent mobility is an important factor in the health and physical, social and mental development of children, and secondly, that independent mobility is declining as shown by our previous work in this area (see Figure 1).
The evidence of the importance of children’s independent mobility was considered in our previous report in this area (Shaw et al., 2013). This showed children’s independent mobility to be important from a range of perspectives.
Firstly, on the basis of children’s rights, independent mobility is something of intrinsic value to children which they should be able to enjoy. A safe outside environment is a prerequisite for this which should be provided. This right is captured in the United Nations’ Convention on the Rights of the Child (United Nations, 1989). The Convention enshrines the right of children to rest and leisure and to engage in play and recreational activities appropriate to the age of the child, and requires that states should promote this right and encourage provision to satisfy it (Article 31), and also that every child has the right to a standard of living that is good enough to meet their physical, social and mental needs (Article 27). Secondly, the loss of independent mobility can have adverse effects on children’s well-being, health and personal development including:
• Considerable loss of autonomy and access to a safe environment outside the home,
• Consequent losses leading to a lowering of their quality of life,
• Decline in physical condition potentially leading to obesity and other health disbenefits,
• Gaining insufficient practical and social skills owing to inexperience in acting independently.
Recent evidence on the impact on reduced independent mobility on children’s health and development is summarised by, for example, Huby and Bradshaw, 2006; Mackett, 2013 and Malone, 2007. However, the impacts have long been discussed and recognised, for example, by Hillman et al., 1973, 1976, 1990 and also in work on the changing nature of cities; children’s development and psychology from the mid-twentieth century onwards (for example, Duhl, 1963; Fromm, 1960; Jacobs, 1964; Piaget, 1952, 1954 and Ward, 1990a, b). Further detail of the development of this area of research interest and the motivations for it are given in Shaw et al. (2013).
Children’s Independent Mobility: an international comparison and recommendations for action5
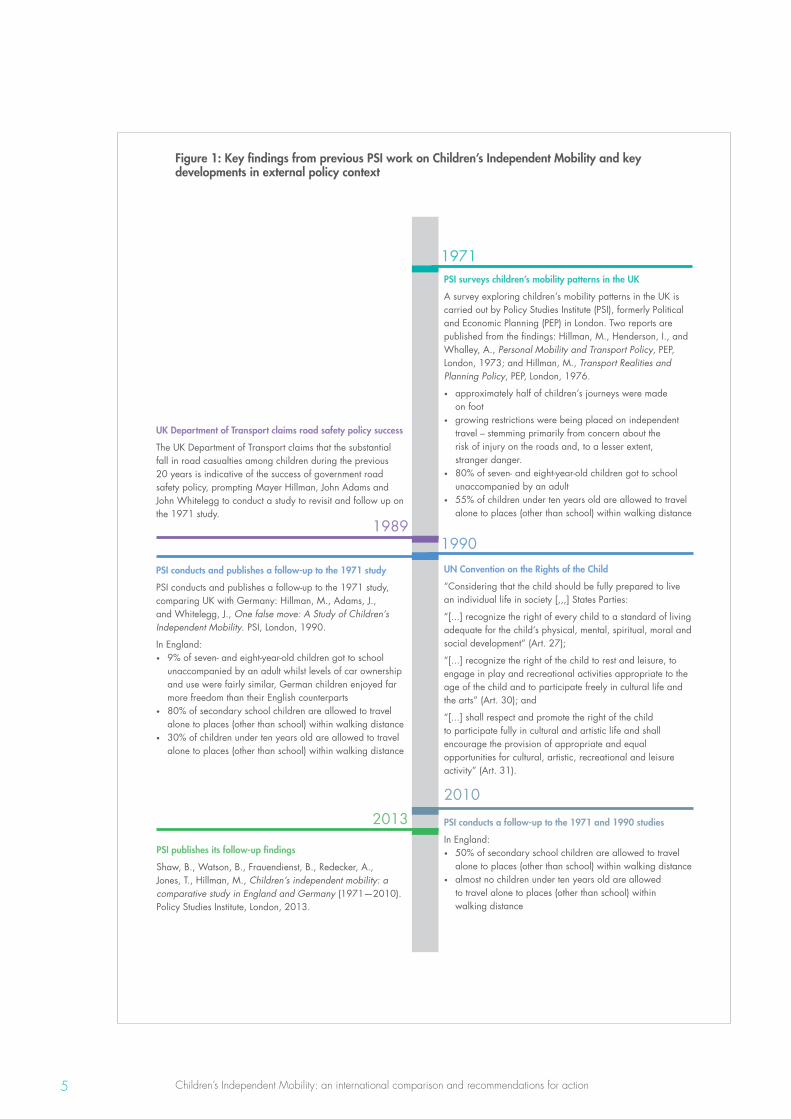
Figure 1: Key findings from previous PSI work on Children’s Independent Mobility and key developments in external policy context
1971
19891990
2010
2013
PSI surveys children’s mobility patterns in the UK
A survey exploring children’s mobility patterns in the UK is carried out by Policy Studies Institute (PSI), formerly Political and Economic Planning (PEP) in London. Two reports are published from the findings: Hillman, M., Henderson, I., and Whalley, A., Personal Mobility and Transport Policy, PEP, London, 1973; and Hillman, M., Transport Realities and Planning Policy, PEP, London, 1976.
• approximately half of children’s journeys were made on foot
• growing restrictions were being placed on independent travel – stemming primarily from concern about the risk of injury on the roads and, to a lesser extent, stranger danger.
• 80% of seven- and eight-year-old children got to school unaccompanied by an adult
• 55% of children under ten years old are allowed to travel alone to places (other than school) within walking distance
UN Convention on the Rights of the Child
“Considering that the child should be fully prepared to live an individual life in society [,,,] States Parties:
“[...] recognize the right of every child to a standard of living adequate for the child’s physical, mental, spiritual, moral and social development” (Art. 27);
“[...] recognize the right of the child to rest and leisure, to engage in play and recreational activities appropriate to the age of the child and to participate freely in cultural life and the arts” (Art. 30); and
“[...] shall respect and promote the right of the child to participate fully in cultural and artistic life and shall encourage the provision of appropriate and equal opportunities for cultural, artistic, recreational and leisure activity” (Art. 31).
UK Department of Transport claims road safety policy success
The UK Department of Transport claims that the substantial fall in road casualties among children during the previous 20 years is indicative of the success of government road safety policy, prompting Mayer Hillman, John Adams and John Whitelegg to conduct a study to revisit and follow up on the 1971 study.
PSI conducts and publishes a follow-up to the 1971 study
PSI conducts and publishes a follow-up to the 1971 study, comparing UK with Germany: Hillman, M., Adams, J., and Whitelegg, J., One false move: A Study of Children’s Independent Mobility. PSI, London, 1990.
In England:• 9% of seven- and eight-year-old children got to school
unaccompanied by an adult whilst levels of car ownership and use were fairly similar, German children enjoyed far more freedom than their English counterparts
• 80% of secondary school children are allowed to travel alone to places (other than school) within walking distance
• 30% of children under ten years old are allowed to travel alone to places (other than school) within walking distance
PSI conducts a follow-up to the 1971 and 1990 studies
In England:• 50% of secondary school children are allowed to travel
alone to places (other than school) within walking distance• almost no children under ten years old are allowed
to travel alone to places (other than school) within walking distance
PSI publishes its follow-up findings
Shaw, B., Watson, B., Frauendienst, B., Redecker, A., Jones, T., Hillman, M., Children’s independent mobility: a comparative study in England and Germany (1971—2010). Policy Studies Institute, London, 2013.
Children’s Independent Mobility: an international comparison and recommendations for action6
Independent mobility may confer immediate and longer-term benefits. Immediate benefits include, for example, the social benefit derived from a child being able to visit a nearby friend unaccompanied, the well-being associated with this and the sense for the child of self-determination in his or her life and daily activities. The benefits may also be much longer-term, for example, the health benefits derived from active travel (walking and cycling) which may not be seen until much later in life but are dependent on habits which tend to be formed at an early age (Kuh and Cooper, 1992, cited in Huby and Bradshaw, 2006). Given a recent study found only a half of 7-year-old children in the UK achieve recommended levels of physical activity (Griffiths et al., 2013) the sedentary lives of children are not only a problem now, but also in the long term.
In addition to these two child-based justifications for independent mobility – namely those of the rights children can be expected to enjoy and the development benefits it results in – there are broader justifications. The conditions in which children’s independent mobility is likely to occur – safe and vibrant towns, cities and villages not dominated by traffic, in which people feel safe and want to move around on foot and bicycle – will also result in benefits to the wider population, notably for older people and other potentially vulnerable groups in society.
A further benefit of children’s independent mobility is that it can free adults of the responsibility/obligation of having to escort their children when they travel about their local area, which can be a significant time commitment, especially for primary school children – as shown in our previous work. The implication of children not being independently mobile is that either they do not go out alone, or if they do they have to be accompanied by an adult. If they are accompanied on trips, there is a strong likelihood1 they will be driven to their destination and also have to be collected. This generates further traffic as parents drop off and then return to pick up their children, or alternatively have to wait around during the activity. This has obvious implications for parents’ and children’s lifestyles as well as social and environmental consequences. Extra traffic is likely to further reduce the likelihood that parents will grant their children independent mobility.
Children’s independent mobility as a measure of road safety and quality of life
One of the main messages and motivations for the research reported in One False Move… (Hillman et al., 1990) was that road casualty statistics are a very bad, and often misleading, measure of road safety or danger. The report took issue with the claim by the then government that because there was a drop in child fatalities on the roads between 1970 and 1990 which was accompanied by a large increase in traffic, this meant roads had become much safer.
1 Our previous work (Shaw et al., 2013) showed the car to be the most frequently used mode of travel for accompanied trips.
Children’s Independent Mobility: an international comparison and recommendations for action7
One False Move… noted the difference between measures of the physical danger of traffic, such as volume, speed, variability of speed and vehicle weight (which are rarely interpreted as such) and measures of behavioural responses to traffic danger of which there were few. The classic Appleyard (1981) Livable Streets study, that showed greater community severance with increasing traffic volumes, was noted as one measure of the behavioural response to traffic danger. Children’s independent mobility was therefore proposed in One False Move… as a behavioural measure of road safety intended to indicate the degree to which children were being removed from exposure to danger. This was felt to better reflect the true safety of roads than casualty rates.
Of course while one of the motivations for the One False Move… was in relation to measures of road safety it should be highlighted that children’s independent mobility is also an indicator of a much wider set of factors related to children’s lives including: their independence, the degree to which their rights to a safe and healthy environment are respected, the degree to which they have opportunities for mental, physical and social development and even their overall well-being.
Research objectives
The aim of this project was to carry out an international comparative study of children’s independent mobility. Our specific objectives and research questions were to identify:
• How does children’s independent mobility vary within, between, and across the countries involved in the study?
• What are the factors that affect the observed levels of children’s independent mobility?
• What are the implications of changes in children’s independent mobility for children and their physical and social development, their parents’ lifestyles and for society in general?
• How should policy-makers respond to the challenges posed by the findings?
In order to fulfil the research aims and objectives, we have coordinated the collection of international datasets on children’s independent mobility from 16 countries across the world, conducted a comparative analysis of these data and held an international workshop to discuss and develop the findings and policy responses, with a particular, but not exclusive, focus on UK policy.
The findings of the research pose challenging questions for policy-makers and society. In spite of their challenging nature we hope that they will contribute to the development of a significant improvement in the condition of the external environment in which children (and of course adults) live, grow and develop.
Children’s Independent Mobility: an international comparison and recommendations for action8
Contents of the report
Section 1 provides the introduction to this report.
Section 2 details the data sources and survey methodology used to carry out the international comparison, including details of the survey design and implementation and its limitations.
Section 3 contains the findings of the international comparison, including details of the six ‘licences’ used to measure levels of children’s independent mobility in the survey, overall country rankings of children’s independent mobility as well as a breakdown of country rankings by licence. It also presents a series of ‘spotlight’ themes which explore and seek to explain key trends and anomalies observed in the survey data.
Section 4 considers the factors that affect children’s independent mobility, and highlights lessons and conclusions that can be drawn from existing approaches to enabling children’s independent mobility.
In Section 5 we make our recommendations for improving children’s independent mobility.
Children’s Independent Mobility: an international comparison and recommendations for action9
Survey
This section gives an overview of key elements of the survey methodology. Further details are given in the accompanying reference document: Appendix I. Survey methodology and country details.
Between early 2010 and mid-2012, 18,303 children and a subset of their parents from across sixteen different countries (see Figure 2) were surveyed in order to explore their degree of freedom to travel and play in their local neighbourhood without adult supervision. The questionnaires used for children and adults in 2010 were very similar to those designed for the first surveys in England in 1971 and in England and West Germany in 1990.
Head teachers in participating primary and secondary schools were asked to nominate classes that were likely to be broadly typical of their year group to take part in the study. Children in nominated classes were given questionnaires to complete in the classroom as part of the normal school day. After the child questionnaires were handed in, each child was given a questionnaire to take home for their parent or guardian to complete and return to the school.
Separate questionnaires were used for parents and their children and these collected information on children’s travel patterns and accompaniment on journeys to school and other activities, seeking to explore the extent to which children are free to travel around their local environment without adult supervision. Further questions explored children’s and parents’ attitudes and fears, mobile phone and car ownership, socio-demographics, and other potentially relevant factors.
2 Methodology
Children’s Independent Mobility: an international comparison and recommendations for action10
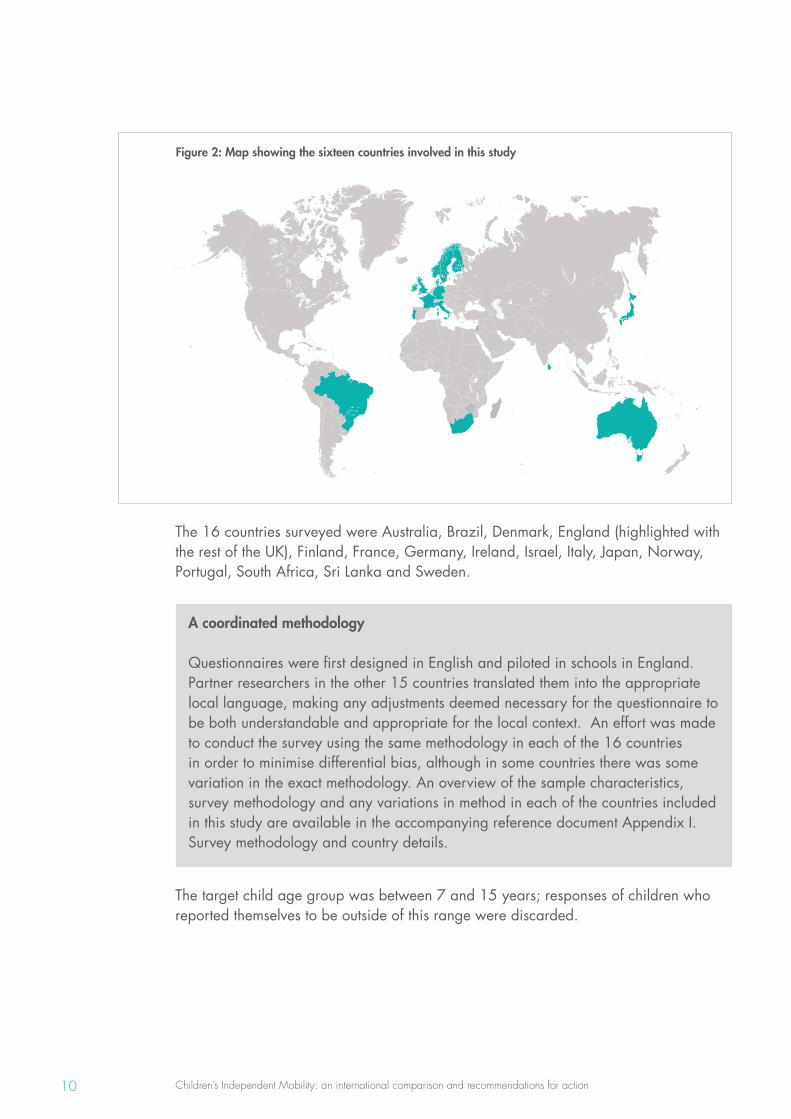
Figure 2: Map showing the sixteen countries involved in this study
The 16 countries surveyed were Australia, Brazil, Denmark, England (highlighted with the rest of the UK), Finland, France, Germany, Ireland, Israel, Italy, Japan, Norway, Portugal, South Africa, Sri Lanka and Sweden.
A coordinated methodology
Questionnaires were first designed in English and piloted in schools in England. Partner researchers in the other 15 countries translated them into the appropriate local language, making any adjustments deemed necessary for the questionnaire to be both understandable and appropriate for the local context. An effort was made to conduct the survey using the same methodology in each of the 16 countries in order to minimise differential bias, although in some countries there was some variation in the exact methodology. An overview of the sample characteristics, survey methodology and any variations in method in each of the countries included in this study are available in the accompanying reference document Appendix I. Survey methodology and country details.
The target child age group was between 7 and 15 years; responses of children who reported themselves to be outside of this range were discarded.
Children’s Independent Mobility: an international comparison and recommendations for action11
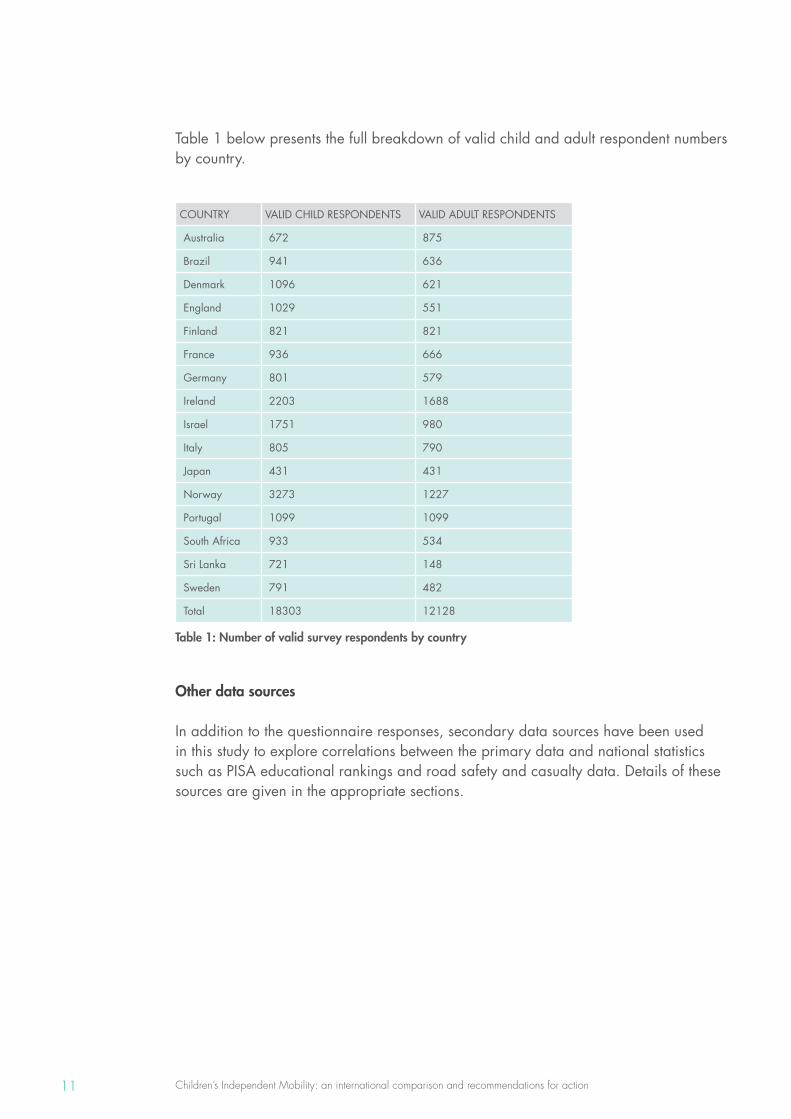
Table 1 below presents the full breakdown of valid child and adult respondent numbers by country.
COUNTRY VALID CHILD RESPONDENTS VALID ADULT RESPONDENTS
Australia 672 875
Brazil 941 636
Denmark 1096 621
England 1029 551
Finland 821 821
France 936 666
Germany 801 579
Ireland 2203 1688
Israel 1751 980
Italy 805 790
Japan 431 431
Norway 3273 1227
Portugal 1099 1099
South Africa 933 534
Sri Lanka 721 148
Sweden 791 482
Total 18303 12128
Table 1: Number of valid survey respondents by country
Other data sources
In addition to the questionnaire responses, secondary data sources have been used in this study to explore correlations between the primary data and national statistics such as PISA educational rankings and road safety and casualty data. Details of these sources are given in the appropriate sections.
Children’s Independent Mobility: an international comparison and recommendations for action12
Workshop
A workshop was held in London on 16 September 2013 to present preliminary findings from the surveys conducted in the 16 different countries above. The workshop also helped to identify and explore the main factors that account for the variations observed in levels of independent mobility in different countries, as well as facilitate discussion about the range of policy responses that can be made and challenges that need to be overcome to enable children to have greater levels of independent mobility. Further details about the workshop are available in the accompanying reference document Appendix II. Workshop Report.
Research limitations and caveats
A range of caveats limit the national representativeness of the findings in this study, resulting from limitations in survey design and implementation, such as sampling, self-selection, self-reporting and under- or over-exaggeration, and differences between country survey methodologies. For example, in South Africa, the departure from the standard sample stratification used in the other participating countries to include neighbourhood affluence and location but in only a small part of the country. The limitations, potential biases and caveats are explored in more detail in the accompanying Appendix I. Survey methodology: Country summary sheets.
While caveats apply to these findings it should be noted that there is very little information available on the degree of freedom children have to travel and play in their local area and even less making international comparisons. While the national representativeness of the findings is limited the data do provide an indication of the levels of independent mobility in 16 countries around the world and the wide variation seen in different settings. As such the data and findings represent an important resource and baseline for exploring this issue now and in the future.
Children’s Independent Mobility: an international comparison and recommendations for action13
Measuring children’s independent mobility
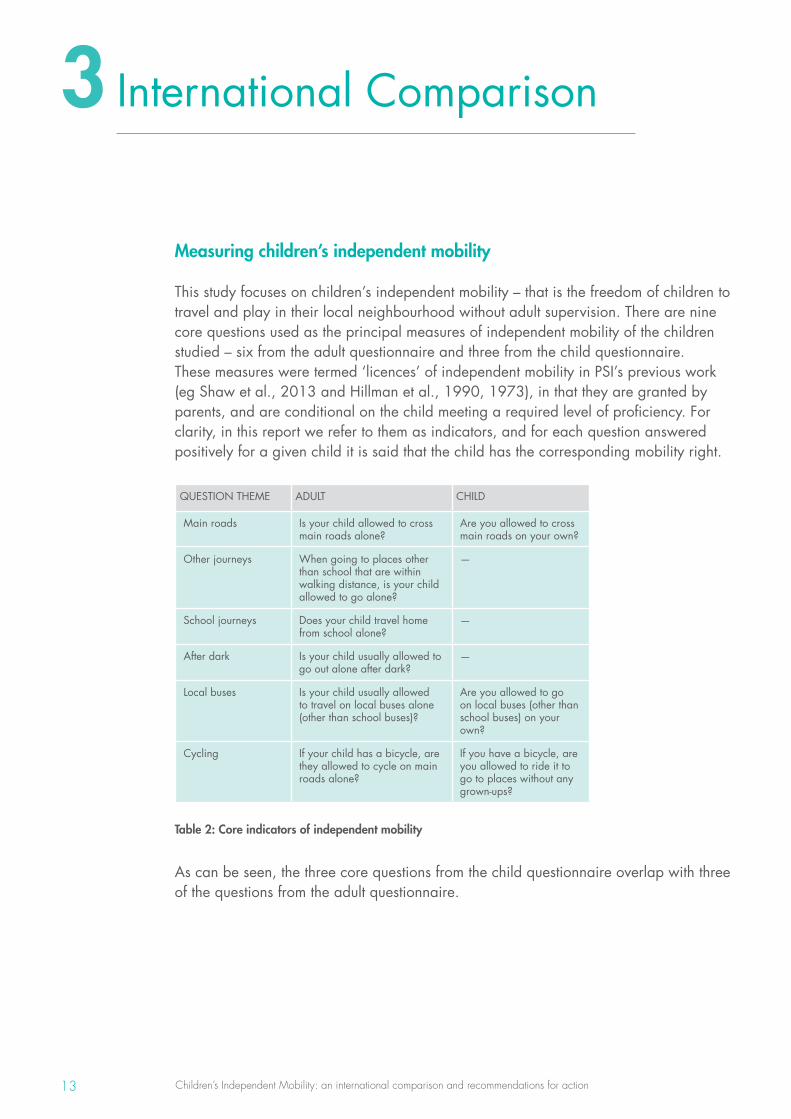
This study focuses on children’s independent mobility – that is the freedom of children to travel and play in their local neighbourhood without adult supervision. There are nine core questions used as the principal measures of independent mobility of the children studied – six from the adult questionnaire and three from the child questionnaire. These measures were termed ‘licences’ of independent mobility in PSI’s previous work (eg Shaw et al., 2013 and Hillman et al., 1990, 1973), in that they are granted by parents, and are conditional on the child meeting a required level of proficiency. For clarity, in this report we refer to them as indicators, and for each question answered positively for a given child it is said that the child has the corresponding mobility right.
QUESTION THEME ADULT CHILD
Main roads Is your child allowed to cross main roads alone?
Are you allowed to cross main roads on your own?
Other journeys When going to places other than school that are within walking distance, is your child allowed to go alone?
—
School journeys Does your child travel home from school alone?
—
After dark Is your child usually allowed to go out alone after dark?
—
Local buses Is your child usually allowed to travel on local buses alone (other than school buses)?
Are you allowed to go on local buses (other than school buses) on your own?
Cycling If your child has a bicycle, are they allowed to cycle on main roads alone?
If you have a bicycle, are you allowed to ride it to go to places without any grown-ups?
Table 2: Core indicators of independent mobility
As can be seen, the three core questions from the child questionnaire overlap with three of the questions from the adult questionnaire.
3 International Comparison
Children’s Independent Mobility: an international comparison and recommendations for action14
Overall ranking
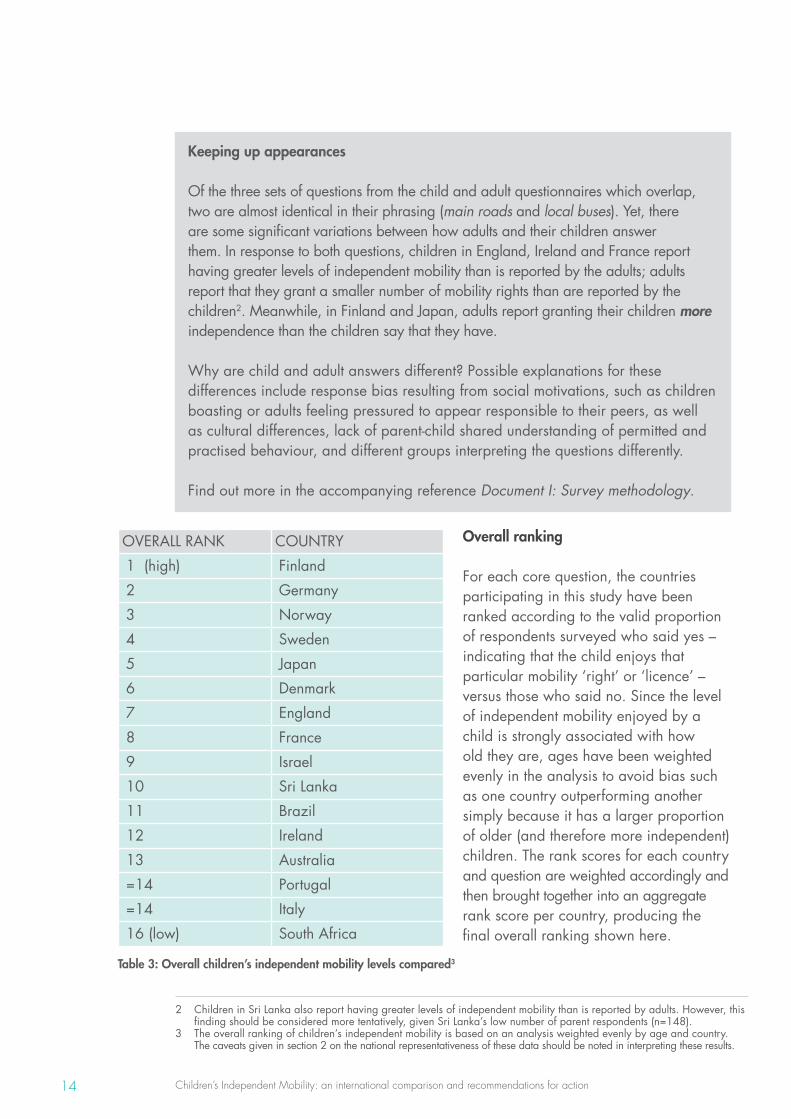
For each core question, the countries participating in this study have been ranked according to the valid proportion of respondents surveyed who said yes – indicating that the child enjoys that particular mobility ‘right’ or ‘licence’ – versus those who said no. Since the level of independent mobility enjoyed by a child is strongly associated with how old they are, ages have been weighted evenly in the analysis to avoid bias such as one country outperforming another simply because it has a larger proportion of older (and therefore more independent) children. The rank scores for each country and question are weighted accordingly and then brought together into an aggregate rank score per country, producing the final overall ranking shown here.
Keeping up appearances
Of the three sets of questions from the child and adult questionnaires which overlap, two are almost identical in their phrasing (main roads and local buses). Yet, there are some significant variations between how adults and their children answer them. In response to both questions, children in England, Ireland and France report having greater levels of independent mobility than is reported by the adults; adults report that they grant a smaller number of mobility rights than are reported by the children2. Meanwhile, in Finland and Japan, adults report granting their children more independence than the children say that they have.
Why are child and adult answers different? Possible explanations for these differences include response bias resulting from social motivations, such as children boasting or adults feeling pressured to appear responsible to their peers, as well as cultural differences, lack of parent-child shared understanding of permitted and practised behaviour, and different groups interpreting the questions differently.
Find out more in the accompanying reference Document I: Survey methodology.
OVERALL RANK COUNTRY
1 (high) Finland
2 Germany
3 Norway
4 Sweden
5 Japan
6 Denmark
7 England
8 France
9 Israel
10 Sri Lanka
11 Brazil
12 Ireland
13 Australia
=14 Portugal
=14 Italy
16 (low) South Africa
Table 3: Overall children’s independent mobility levels compared3
2 Children in Sri Lanka also report having greater levels of independent mobility than is reported by adults. However, this finding should be considered more tentatively, given Sri Lanka’s low number of parent respondents (n=148).
3 The overall ranking of children’s independent mobility is based on an analysis weighted evenly by age and country. The caveats given in section 2 on the national representativeness of these data should be noted in interpreting these results.
Children’s Independent Mobility: an international comparison and recommendations for action15
‘Even Stevens’
As well as weighting age equally, this ranking methodology treats the six core themes (main roads, other journeys, school journeys, after dark, local buses, cycling) with equal importance; responses are grouped by theme and then weighted equally. For example, in the ranking, a child’s entitlement to cross main roads alone is treated with equal impact on their level of independent mobility as being allowed to go out alone after dark.
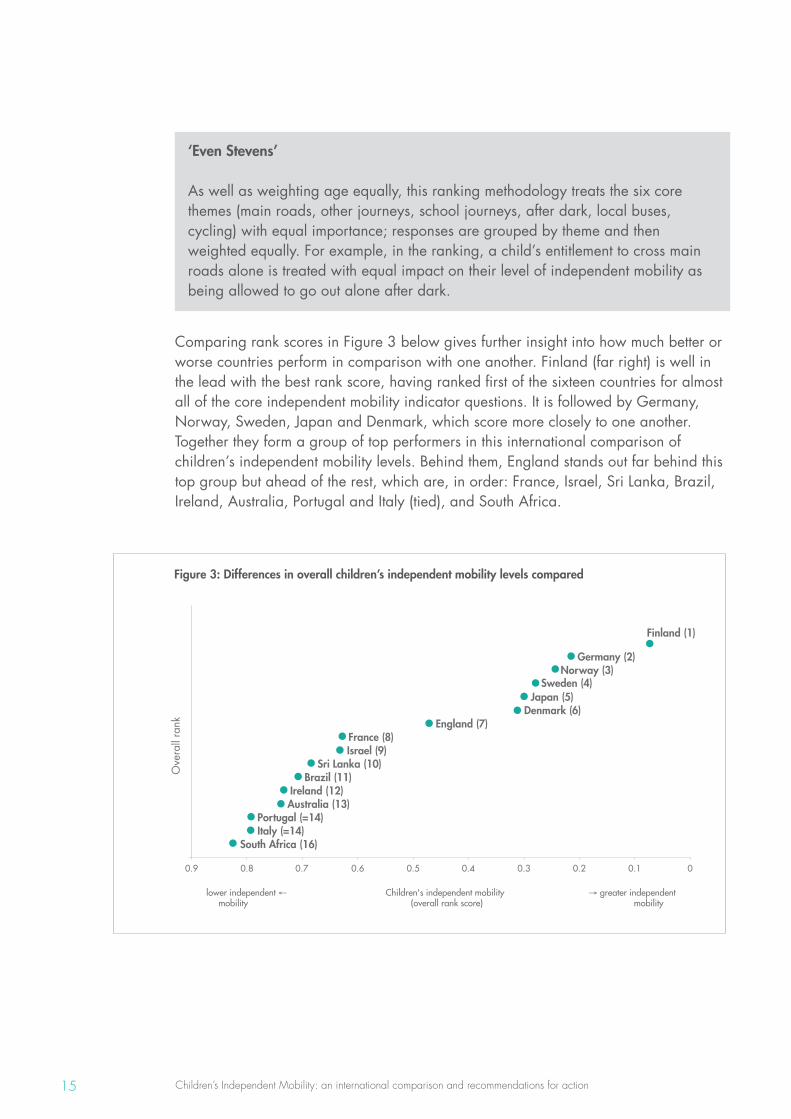
Comparing rank scores in Figure 3 below gives further insight into how much better or worse countries perform in comparison with one another. Finland (far right) is well in the lead with the best rank score, having ranked first of the sixteen countries for almost all of the core independent mobility indicator questions. It is followed by Germany, Norway, Sweden, Japan and Denmark, which score more closely to one another. Together they form a group of top performers in this international comparison of children’s independent mobility levels. Behind them, England stands out far behind this top group but ahead of the rest, which are, in order: France, Israel, Sri Lanka, Brazil, Ireland, Australia, Portugal and Italy (tied), and South Africa.
0 0.1 0.2 0.3 0.4 0.5 0.6 0.7 0.8 0.9
Ove
rall
rank
Finland (1)
Germany (2) Norway (3)
Sweden (4) Japan (5)
Denmark (6) England (7)
France (8) Israel (9)
Sri Lanka (10) Brazil (11)
Ireland (12) Australia (13)
Portugal (=14) Italy (=14)
South Africa (16)
Figure 3: Differences in overall children’s independent mobility levels compared
Children’s Independent Mobility: an international comparison and recommendations for action16
Mobility rights – a closer look
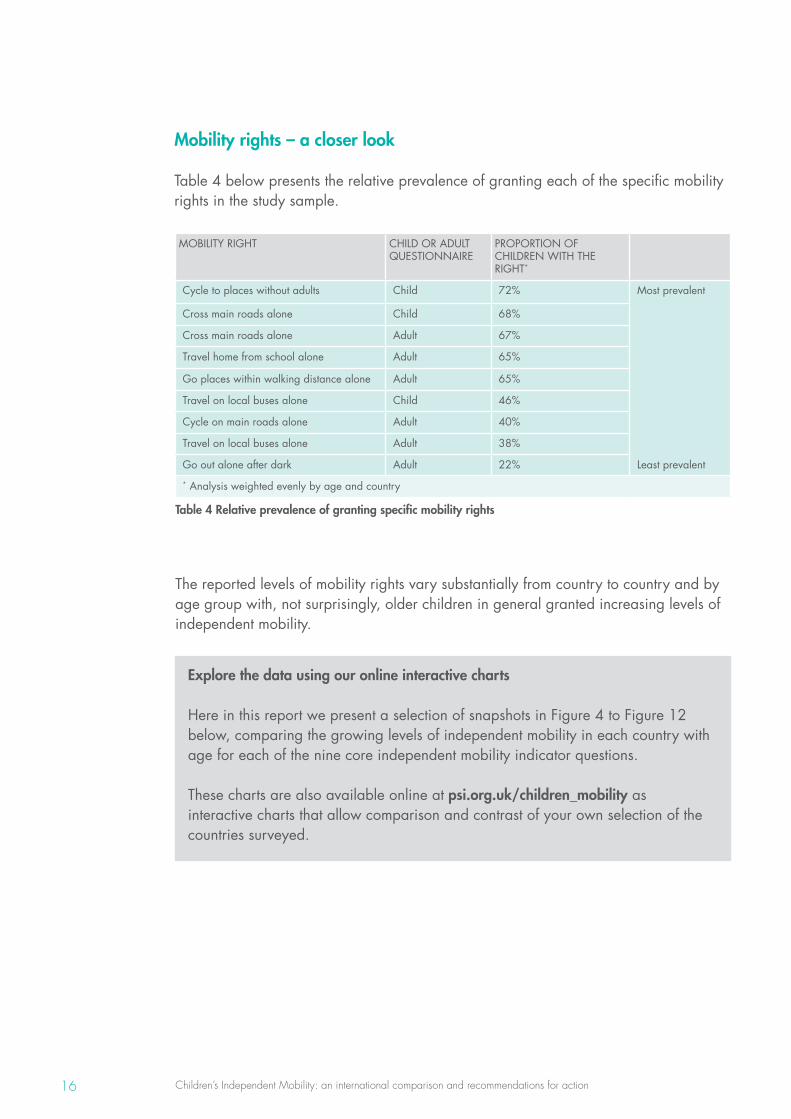
Table 4 below presents the relative prevalence of granting each of the specific mobility rights in the study sample.
MOBILITY RIGHT CHILD OR ADULT QUESTIONNAIRE
PROPORTION OF CHILDREN WITH THE RIGHT*
Cycle to places without adults Child 72% Most prevalent
Cross main roads alone Child 68%
Cross main roads alone Adult 67%
Travel home from school alone Adult 65%
Go places within walking distance alone Adult 65%
Travel on local buses alone Child 46%
Cycle on main roads alone Adult 40%
Travel on local buses alone Adult 38%
Go out alone after dark Adult 22% Least prevalent
* Analysis weighted evenly by age and country
Table 4 Relative prevalence of granting specific mobility rights
The reported levels of mobility rights vary substantially from country to country and by age group with, not surprisingly, older children in general granted increasing levels of independent mobility.
Explore the data using our online interactive charts
Here in this report we present a selection of snapshots in Figure 4 to Figure 12 below, comparing the growing levels of independent mobility in each country with age for each of the nine core independent mobility indicator questions.
These charts are also available online at psi.org.uk/children_mobility as interactive charts that allow comparison and contrast of your own selection of the countries surveyed.
Children’s Independent Mobility: an international comparison and recommendations for action17
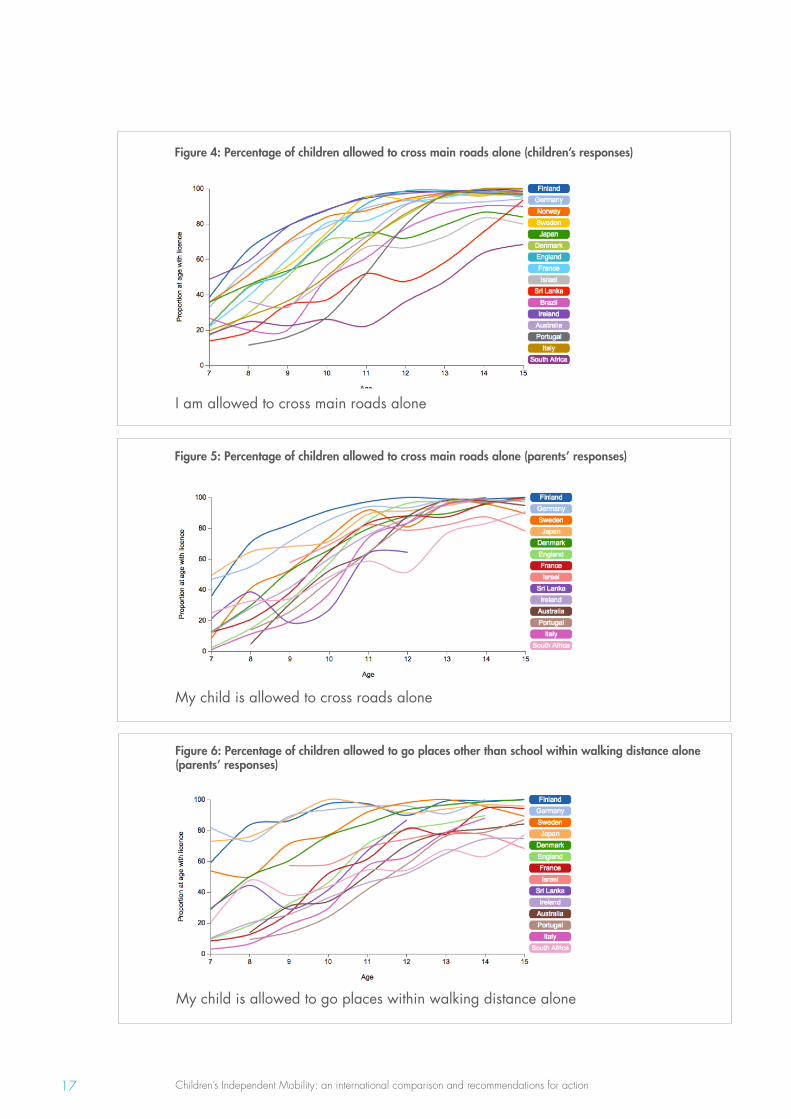
I am allowed to cross main roads alone
Figure 4: Percentage of children allowed to cross main roads alone (children’s responses)
My child is allowed to cross roads alone
Figure 5: Percentage of children allowed to cross main roads alone (parents’ responses)
My child is allowed to go places within walking distance alone
Figure 6: Percentage of children allowed to go places other than school within walking distance alone (parents’ responses)
Children’s Independent Mobility: an international comparison and recommendations for action18
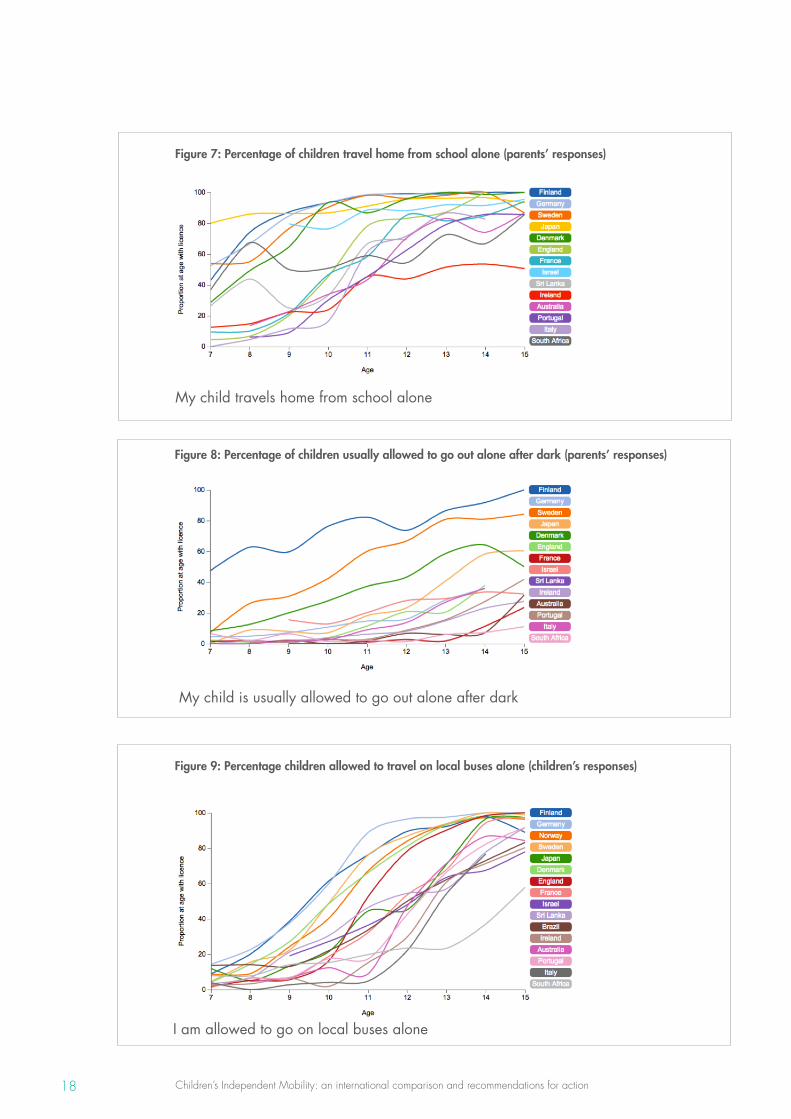
My child travels home from school alone
Figure 7: Percentage of children travel home from school alone (parents’ responses)
My child is usually allowed to go out alone after dark
Figure 8: Percentage of children usually allowed to go out alone after dark (parents’ responses)
I am allowed to go on local buses alone
Figure 9: Percentage children allowed to travel on local buses alone (children’s responses)
Children’s Independent Mobility: an international comparison and recommendations for action19
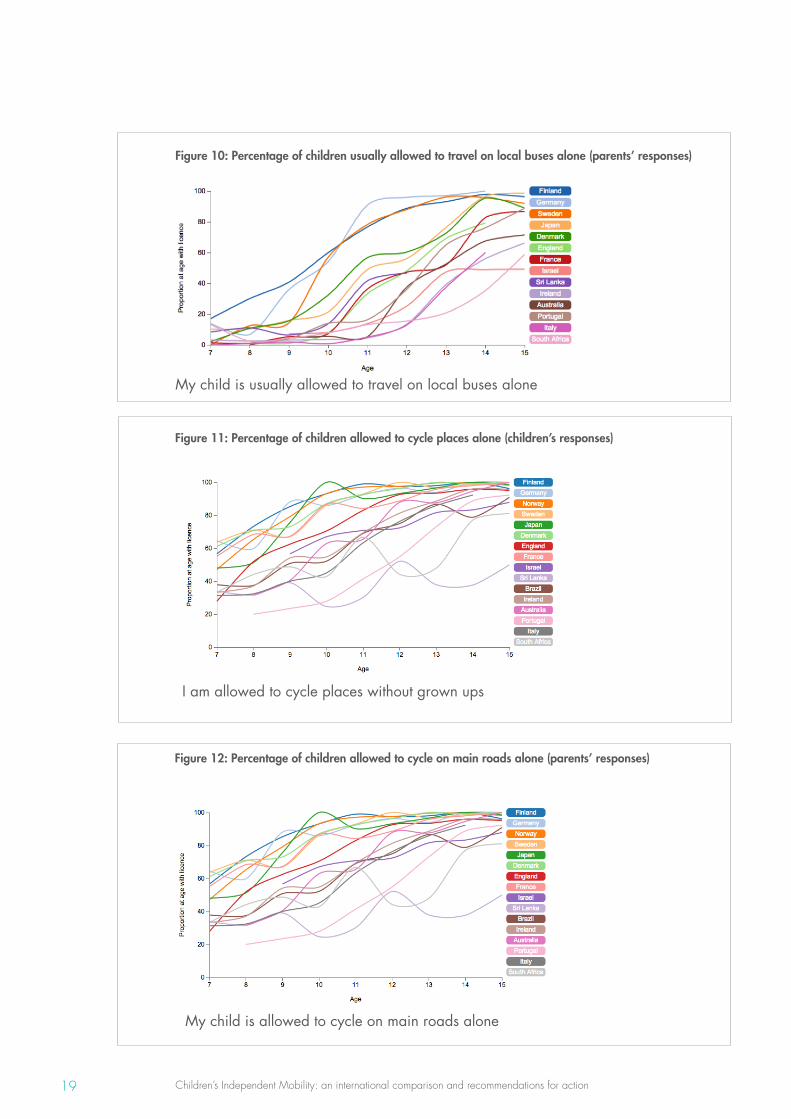
My child is usually allowed to travel on local buses alone
I am allowed to cycle places without grown ups
Figure 10: Percentage of children usually allowed to travel on local buses alone (parents’ responses)
Figure 11: Percentage of children allowed to cycle places alone (children’s responses)
My child is allowed to cycle on main roads alone
Figure 12: Percentage of children allowed to cycle on main roads alone (parents’ responses)
Children’s Independent Mobility: an international comparison and recommendations for action20
Some key observations:There are substantial variations between the levels of independent mobility of children from different countries surveyed in this study.
• The degree of independent mobility granted to Finnish children is striking. At age 7, a majority of Finnish children can already travel to places within walking distance or cycle to places alone; by age 8 a majority can cross main roads, travel home from school and go out after dark alone, by age 9 a majority can cycle on main roads alone, and by age 10 a majority can travel on local buses alone. Overall, Finland is the top-performing country across almost every independent mobility indicator in this study, coming second only to Germany for children’s self-reported freedom to travel on local buses alone.
In the other countries studied children are granted the freedoms of independent mobility later:
• By age 11, according to parents, at least a majority of children in each of the countries are allowed to cross main roads. By age 11, according to children, at least a majority of them in each of the countries are allowed to cross main roads, except for South Africa.
• By age 12, at least a majority of children in each of the countries are allowed to go places within walking distance alone.
• By age 13, at least a majority of children in each of the countries are allowed to travel home from school alone (age 12 excluding Ireland) or, according to children, use local buses alone.
• By age 15, at least a majority of children in nearly all of the countries surveyed exercise each of the indicators of independent mobility, except for the ability to go out alone after dark.
• Going out alone after dark is the most withheld independent mobility. Only in a handful of countries – Finland, Sweden, Japan and Denmark – are a majority of children of any age allowed to go out after dark.
• The countries which grant their children independent mobility earliest and latest are typically separated by about three years (on the basis of when a majority of children in a country have the freedom). For example, children in Italy are between 3 and 4 years behind their Finnish and German counterparts in terms of their freedom to travel on local buses alone; at age 10, approximately 60 per cent of children in Finland and Germany are allowed to travel on local buses alone (irrespective of whether you ask them or their parents) whereas children in Italy do not reach this level until 13 or 14 years of age.
Children’s Independent Mobility: an international comparison and recommendations for action21
It should be emphasised that independent ‘mobilities’ are withheld from many children and that a large proportion of children under 11 in most of the countries studied do not possess the freedom to get about their local area, whether crossing main roads, going to places within walking distance, or travelling home from school.
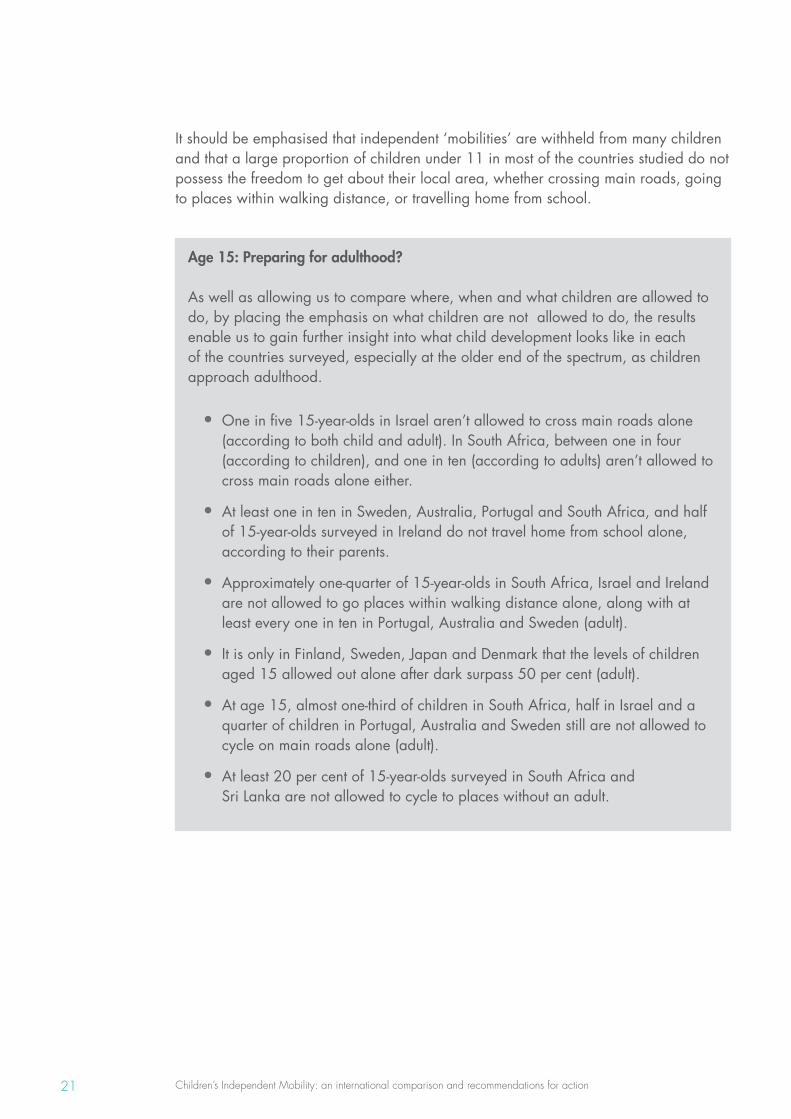
Age 15: Preparing for adulthood?
As well as allowing us to compare where, when and what children are allowed to do, by placing the emphasis on what children are not allowed to do, the results enable us to gain further insight into what child development looks like in each of the countries surveyed, especially at the older end of the spectrum, as children approach adulthood.
• One in five 15-year-olds in Israel aren’t allowed to cross main roads alone (according to both child and adult). In South Africa, between one in four (according to children), and one in ten (according to adults) aren’t allowed to cross main roads alone either.
• At least one in ten in Sweden, Australia, Portugal and South Africa, and half of 15-year-olds surveyed in Ireland do not travel home from school alone, according to their parents.
• Approximately one-quarter of 15-year-olds in South Africa, Israel and Ireland are not allowed to go places within walking distance alone, along with at least every one in ten in Portugal, Australia and Sweden (adult).
• It is only in Finland, Sweden, Japan and Denmark that the levels of children aged 15 allowed out alone after dark surpass 50 per cent (adult).
• At age 15, almost one-third of children in South Africa, half in Israel and a quarter of children in Portugal, Australia and Sweden still are not allowed to cycle on main roads alone (adult).
• At least 20 per cent of 15-year-olds surveyed in South Africa and Sri Lanka are not allowed to cycle to places without an adult.
Children’s Independent Mobility: an international comparison and recommendations for action22
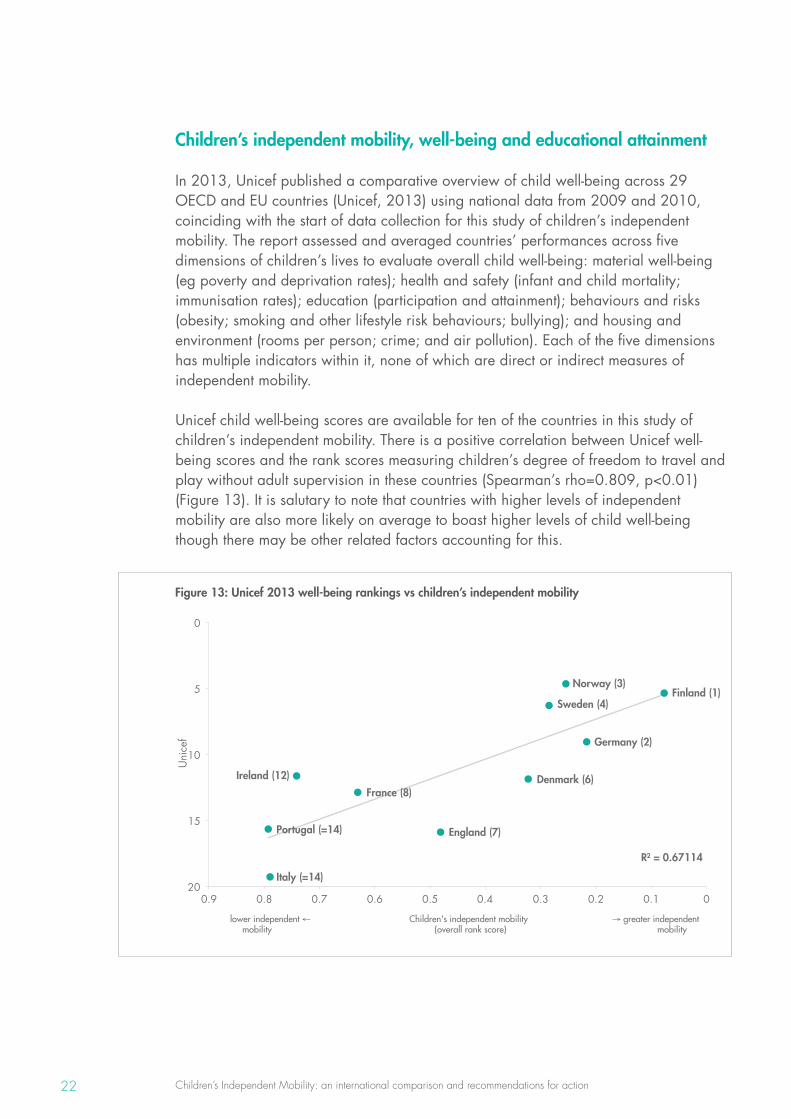
Children’s independent mobility, well-being and educational attainment
In 2013, Unicef published a comparative overview of child well-being across 29 OECD and EU countries (Unicef, 2013) using national data from 2009 and 2010, coinciding with the start of data collection for this study of children’s independent mobility. The report assessed and averaged countries’ performances across five dimensions of children’s lives to evaluate overall child well-being: material well-being (eg poverty and deprivation rates); health and safety (infant and child mortality; immunisation rates); education (participation and attainment); behaviours and risks (obesity; smoking and other lifestyle risk behaviours; bullying); and housing and environment (rooms per person; crime; and air pollution). Each of the five dimensions has multiple indicators within it, none of which are direct or indirect measures of independent mobility.
Unicef child well-being scores are available for ten of the countries in this study of children’s independent mobility. There is a positive correlation between Unicef well-being scores and the rank scores measuring children’s degree of freedom to travel and play without adult supervision in these countries (Spearman’s rho=0.809, p<0.01) (Figure 13). It is salutary to note that countries with higher levels of independent mobility are also more likely on average to boast higher levels of child well-being though there may be other related factors accounting for this.
Figure 13: Unicef 2013 well-being rankings vs children’s independent mobility
Finland (1)
Germany (2)
Norway (3)
Sweden (4)
Denmark (6)
England (7)
France (8)
Ireland (12)
Portugal (=14)
Italy (=14)
R² = 0.67114
0
5
10
15
20 0 0.1 0.2 0.3 0.4 0.5 0.6 0.7 0.8 0.9
Uni
cef
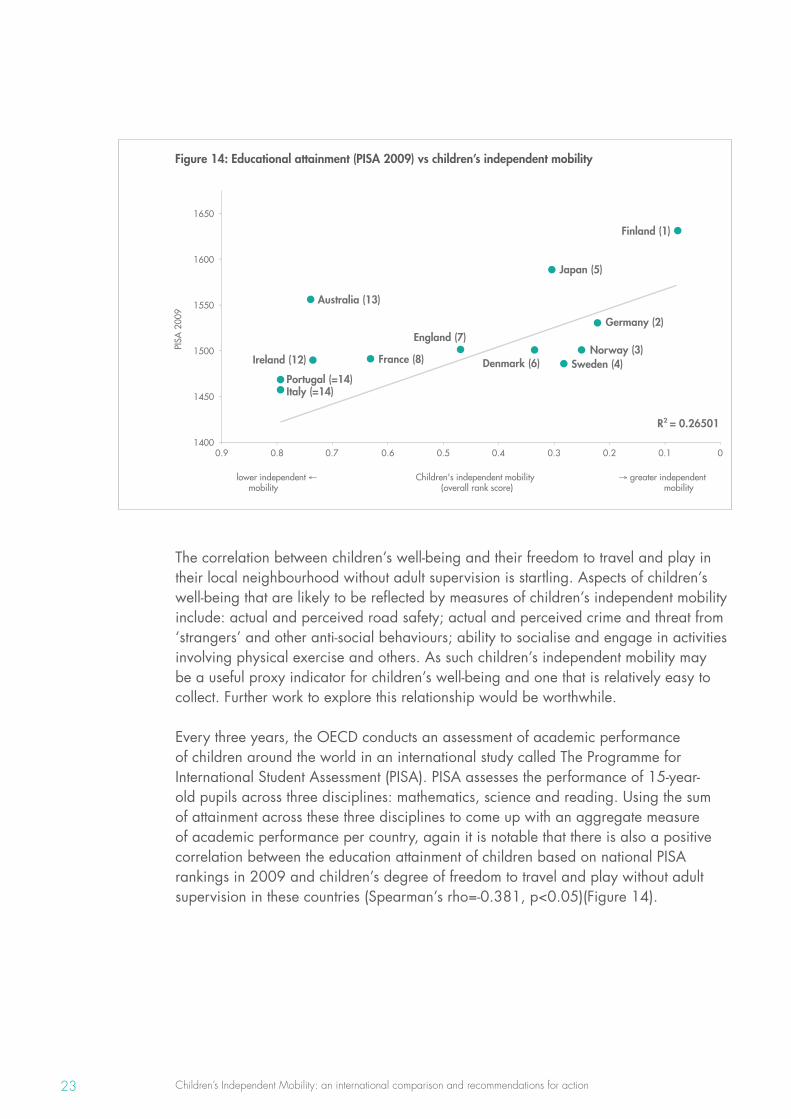
Children’s Independent Mobility: an international comparison and recommendations for action23
Finland (1)
Germany (2)
Norway (3) Sweden (4)
Japan (5)
Denmark (6)
England (7)
France (8) Ireland (12)
Australia (13)
Portugal (=14) Italy (=14)
R² = 0.26501
1400
1450
1500
1550
1600
1650
0 0.1 0.2 0.3 0.4 0.5 0.6 0.7 0.8 0.9
PISA
200
9
Figure 14: Educational attainment (PISA 2009) vs children’s independent mobility
The correlation between children’s well-being and their freedom to travel and play in their local neighbourhood without adult supervision is startling. Aspects of children’s well-being that are likely to be reflected by measures of children’s independent mobility include: actual and perceived road safety; actual and perceived crime and threat from ‘strangers’ and other anti-social behaviours; ability to socialise and engage in activities involving physical exercise and others. As such children’s independent mobility may be a useful proxy indicator for children’s well-being and one that is relatively easy to collect. Further work to explore this relationship would be worthwhile.
Every three years, the OECD conducts an assessment of academic performance of children around the world in an international study called The Programme for International Student Assessment (PISA). PISA assesses the performance of 15-year-old pupils across three disciplines: mathematics, science and reading. Using the sum of attainment across these three disciplines to come up with an aggregate measure of academic performance per country, again it is notable that there is also a positive correlation between the education attainment of children based on national PISA rankings in 2009 and children’s degree of freedom to travel and play without adult supervision in these countries (Spearman’s rho=-0.381, p<0.05)(Figure 14).
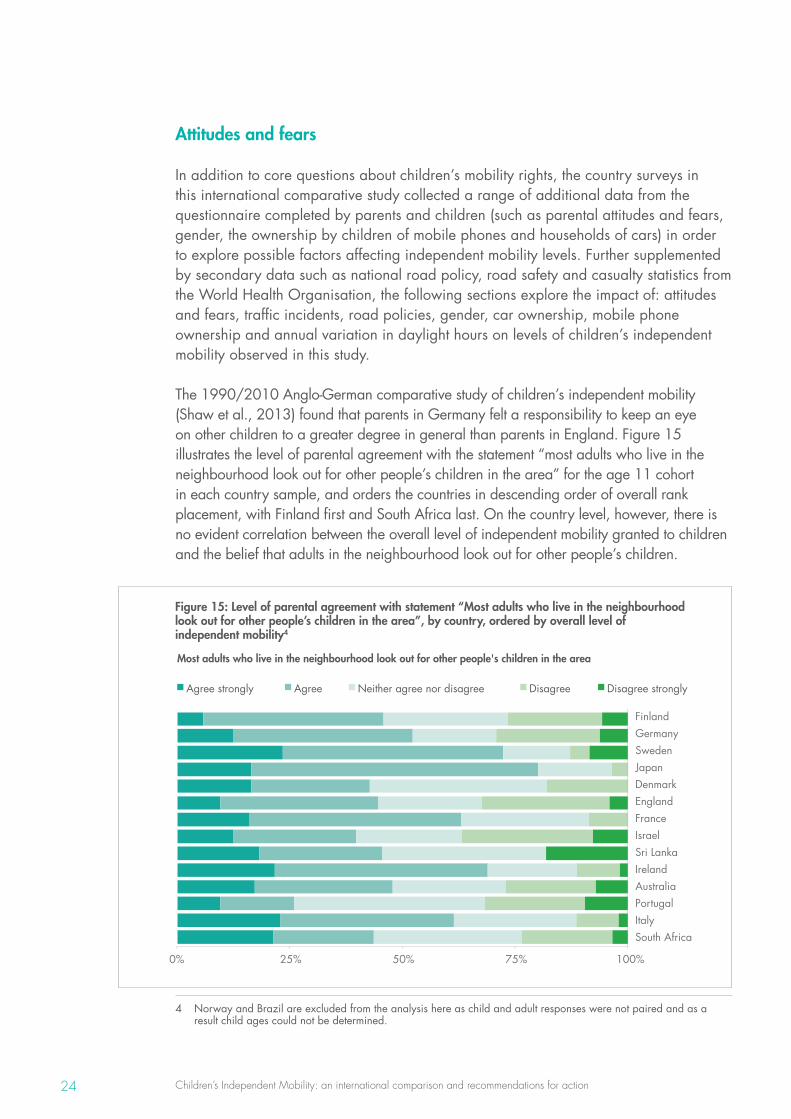
Children’s Independent Mobility: an international comparison and recommendations for action24
Attitudes and fears
In addition to core questions about children’s mobility rights, the country surveys in this international comparative study collected a range of additional data from the questionnaire completed by parents and children (such as parental attitudes and fears, gender, the ownership by children of mobile phones and households of cars) in order to explore possible factors affecting independent mobility levels. Further supplemented by secondary data such as national road policy, road safety and casualty statistics from the World Health Organisation, the following sections explore the impact of: attitudes and fears, traffic incidents, road policies, gender, car ownership, mobile phone ownership and annual variation in daylight hours on levels of children’s independent mobility observed in this study.
The 1990/2010 Anglo-German comparative study of children’s independent mobility (Shaw et al., 2013) found that parents in Germany felt a responsibility to keep an eye on other children to a greater degree in general than parents in England. Figure 15 illustrates the level of parental agreement with the statement “most adults who live in the neighbourhood look out for other people’s children in the area” for the age 11 cohort in each country sample, and orders the countries in descending order of overall rank placement, with Finland first and South Africa last. On the country level, however, there is no evident correlation between the overall level of independent mobility granted to children and the belief that adults in the neighbourhood look out for other people’s children.
Figure 15: Level of parental agreement with statement “Most adults who live in the neighbourhood look out for other people’s children in the area”, by country, ordered by overall level of independent mobility4
Most adults who live in the neighbourhood look out for other people's children in the area
0% 25% 50% 75% 100%
Finland Germany Sweden Japan Denmark England France Israel Sri Lanka Ireland Australia Portugal Italy South Africa
Agree strongly Agree Neither agree nor disagree Disagree Disagree strongly
4 Norway and Brazil are excluded from the analysis here as child and adult responses were not paired and as a result child ages could not be determined.
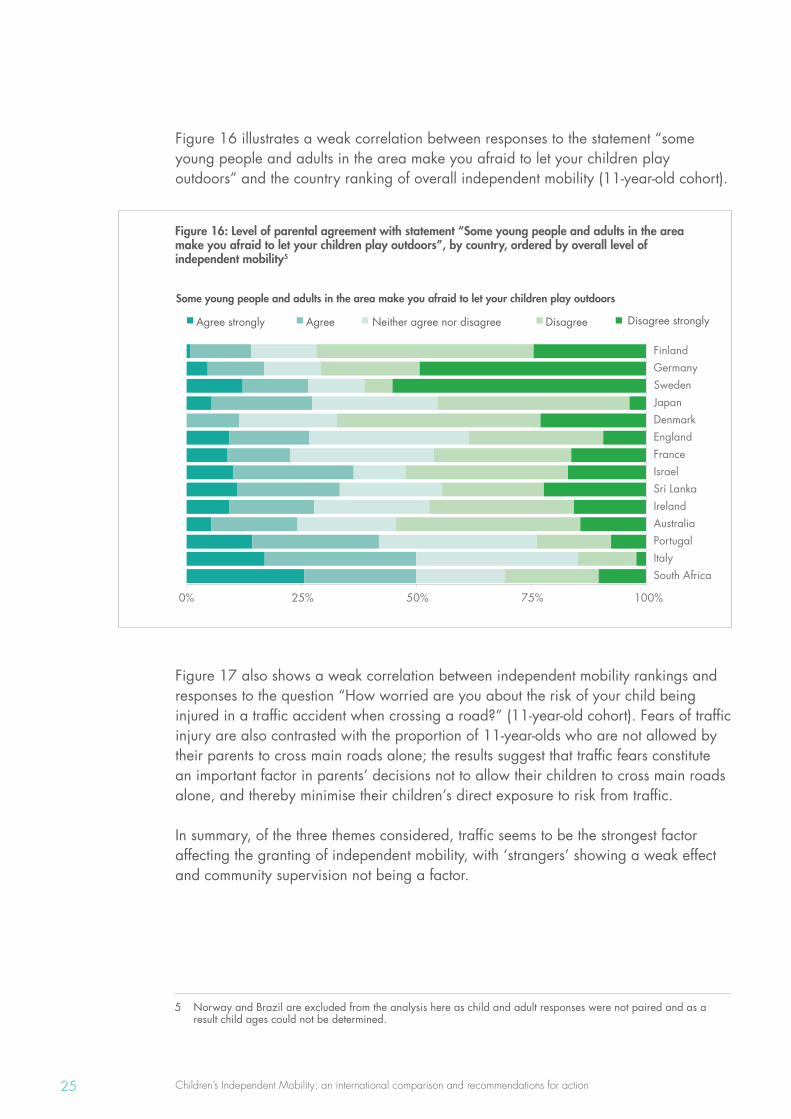
Children’s Independent Mobility: an international comparison and recommendations for action25
Figure 16 illustrates a weak correlation between responses to the statement “some young people and adults in the area make you afraid to let your children play outdoors” and the country ranking of overall independent mobility (11-year-old cohort).
Figure 16: Level of parental agreement with statement “Some young people and adults in the area make you afraid to let your children play outdoors”, by country, ordered by overall level of independent mobility5
0% 25% 50% 75% 100%
Finland Germany Sweden Japan Denmark England France Israel Sri Lanka Ireland Australia Portugal Italy South Africa
Agree strongly Agree Neither agree nor disagree Disagree Disagree strongly
Some young people and adults in the area make you afraid to let your children play outdoors
Figure 17 also shows a weak correlation between independent mobility rankings and responses to the question “How worried are you about the risk of your child being injured in a traffic accident when crossing a road?” (11-year-old cohort). Fears of traffic injury are also contrasted with the proportion of 11-year-olds who are not allowed by their parents to cross main roads alone; the results suggest that traffic fears constitute an important factor in parents’ decisions not to allow their children to cross main roads alone, and thereby minimise their children’s direct exposure to risk from traffic.
In summary, of the three themes considered, traffic seems to be the strongest factor affecting the granting of independent mobility, with ‘strangers’ showing a weak effect and community supervision not being a factor.
5 Norway and Brazil are excluded from the analysis here as child and adult responses were not paired and as a result child ages could not be determined.
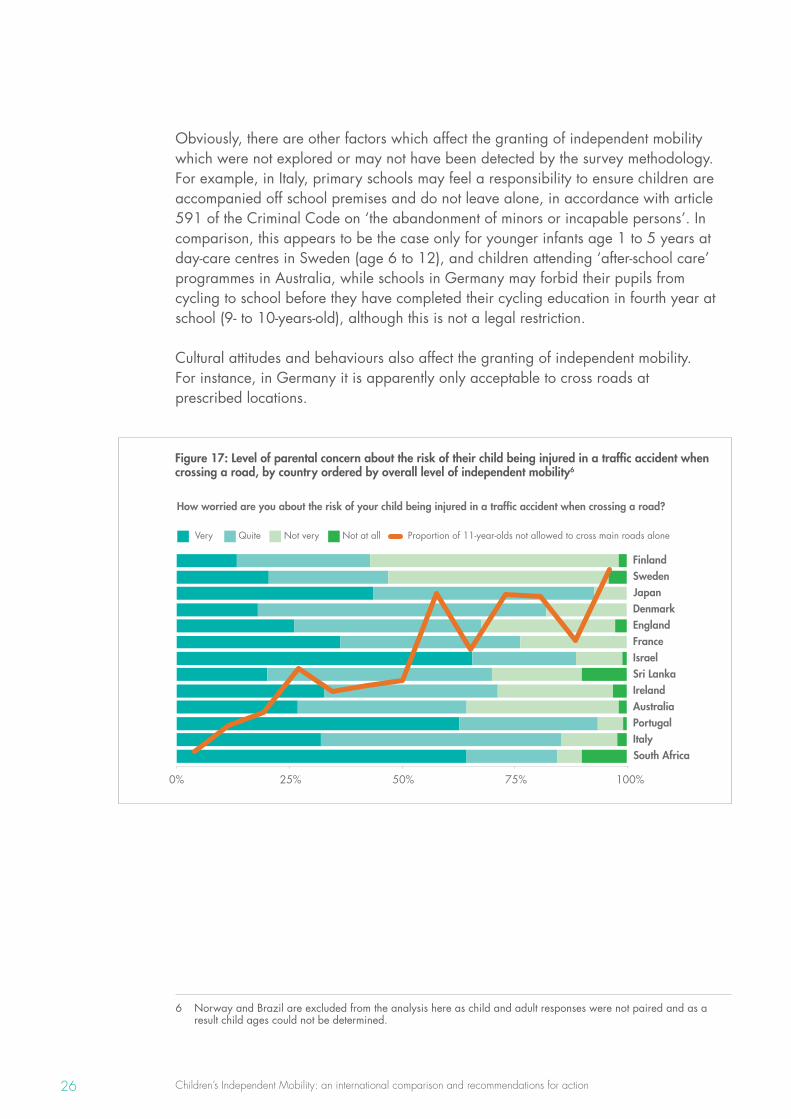
Children’s Independent Mobility: an international comparison and recommendations for action26
Obviously, there are other factors which affect the granting of independent mobility which were not explored or may not have been detected by the survey methodology. For example, in Italy, primary schools may feel a responsibility to ensure children are accompanied off school premises and do not leave alone, in accordance with article 591 of the Criminal Code on ‘the abandonment of minors or incapable persons’. In comparison, this appears to be the case only for younger infants age 1 to 5 years at day-care centres in Sweden (age 6 to 12), and children attending ‘after-school care’ programmes in Australia, while schools in Germany may forbid their pupils from cycling to school before they have completed their cycling education in fourth year at school (9- to 10-years-old), although this is not a legal restriction.
Cultural attitudes and behaviours also affect the granting of independent mobility. For instance, in Germany it is apparently only acceptable to cross roads at prescribed locations.
Figure 17: Level of parental concern about the risk of their child being injured in a traffic accident when crossing a road, by country ordered by overall level of independent mobility6
0% 25% 50% 75% 100%
How worried are you about the risk of your child being injured in a traffic accident when crossing a road?
Finland Sweden Japan Denmark England France Israel Sri Lanka Ireland Australia Portugal Italy South Africa
Very Quite Not very Not at all Proportion of 11-year-olds not allowed to cross main roads alone
6 Norway and Brazil are excluded from the analysis here as child and adult responses were not paired and as a result child ages could not be determined.
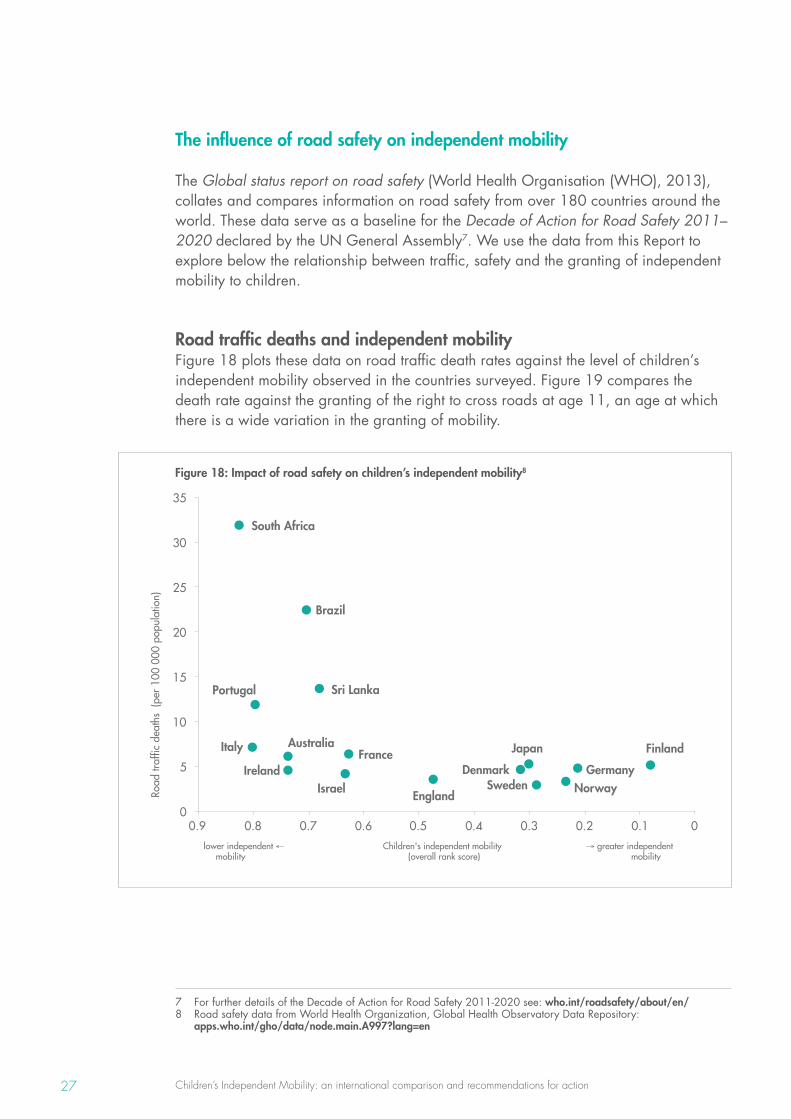
Children’s Independent Mobility: an international comparison and recommendations for action27
The influence of road safety on independent mobility
The Global status report on road safety (World Health Organisation (WHO), 2013), collates and compares information on road safety from over 180 countries around the world. These data serve as a baseline for the Decade of Action for Road Safety 2011–2020 declared by the UN General Assembly7. We use the data from this Report to explore below the relationship between traffic, safety and the granting of independent mobility to children.
Road traffic deaths and independent mobilityFigure 18 plots these data on road traffic death rates against the level of children’s independent mobility observed in the countries surveyed. Figure 19 compares the death rate against the granting of the right to cross roads at age 11, an age at which there is a wide variation in the granting of mobility.
Figure 18: Impact of road safety on children’s independent mobility8
7 For further details of the Decade of Action for Road Safety 2011-2020 see: who.int/roadsafety/about/en/ 8 Road safety data from World Health Organization, Global Health Observatory Data Repository:
apps.who.int/gho/data/node.main.A997?lang=en
Road
traf
fic d
eath
s (p
er 1
00 0
00 p
opul
atio
n)
Finland
Germany Norway Sweden
Japan
Denmark
England
France
Israel
Sri Lanka
Brazil
Ireland
Australia
Portugal
Italy
South Africa
0
5
10
15
20
25
30
35
0 0.1 0.2 0.3 0.4 0.5 0.6 0.7 0.8 0.9
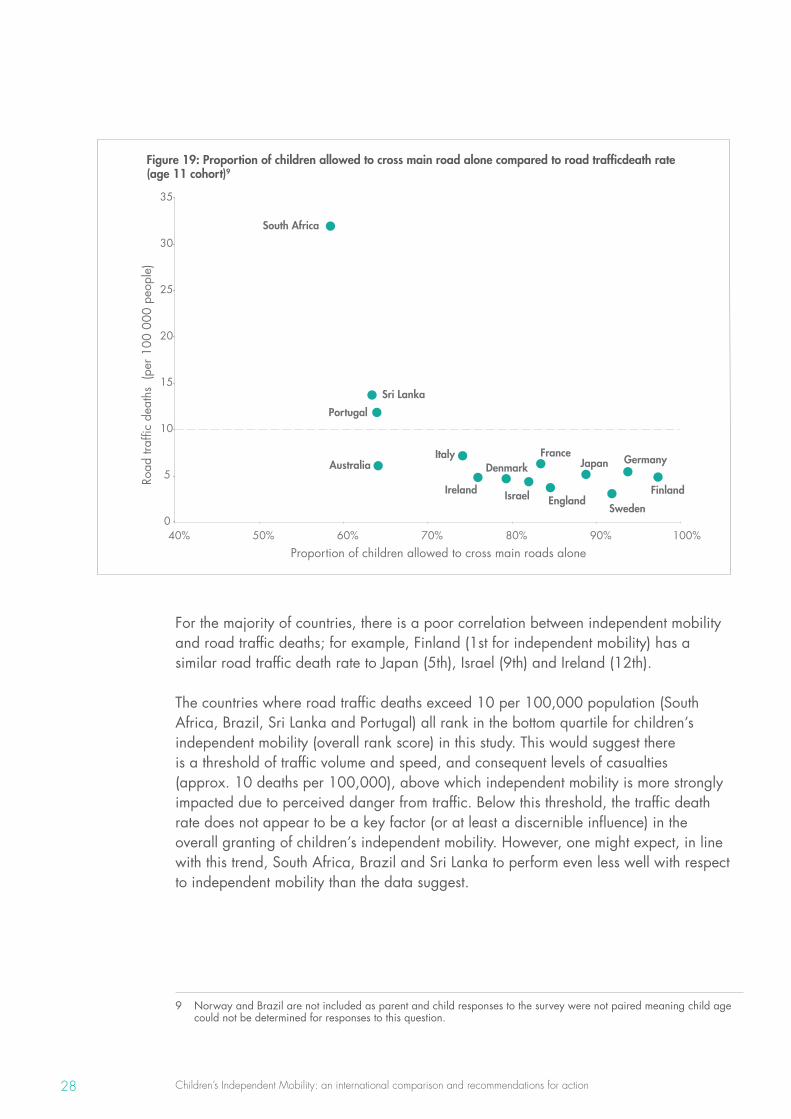
Children’s Independent Mobility: an international comparison and recommendations for action28
Figure 19: Proportion of children allowed to cross main road alone compared to road trafficdeath rate (age 11 cohort)9
Finland
Germany
Sweden
Japan Denmark
England
France
Israel
Sri Lanka
Ireland
Australia
Portugal
Italy
South Africa
0
5
10
15
20
25
30
35
40% 50% 60% 70% 80% 90% 100%
Road
traf
fic d
eath
s (p
er 1
00 0
00 p
eopl
e)
Proportion of children allowed to cross main roads alone
For the majority of countries, there is a poor correlation between independent mobility and road traffic deaths; for example, Finland (1st for independent mobility) has a similar road traffic death rate to Japan (5th), Israel (9th) and Ireland (12th).
The countries where road traffic deaths exceed 10 per 100,000 population (South Africa, Brazil, Sri Lanka and Portugal) all rank in the bottom quartile for children’s independent mobility (overall rank score) in this study. This would suggest there is a threshold of traffic volume and speed, and consequent levels of casualties (approx. 10 deaths per 100,000), above which independent mobility is more strongly impacted due to perceived danger from traffic. Below this threshold, the traffic death rate does not appear to be a key factor (or at least a discernible influence) in the overall granting of children’s independent mobility. However, one might expect, in line with this trend, South Africa, Brazil and Sri Lanka to perform even less well with respect to independent mobility than the data suggest.
9 Norway and Brazil are not included as parent and child responses to the survey were not paired meaning child age could not be determined for responses to this question.
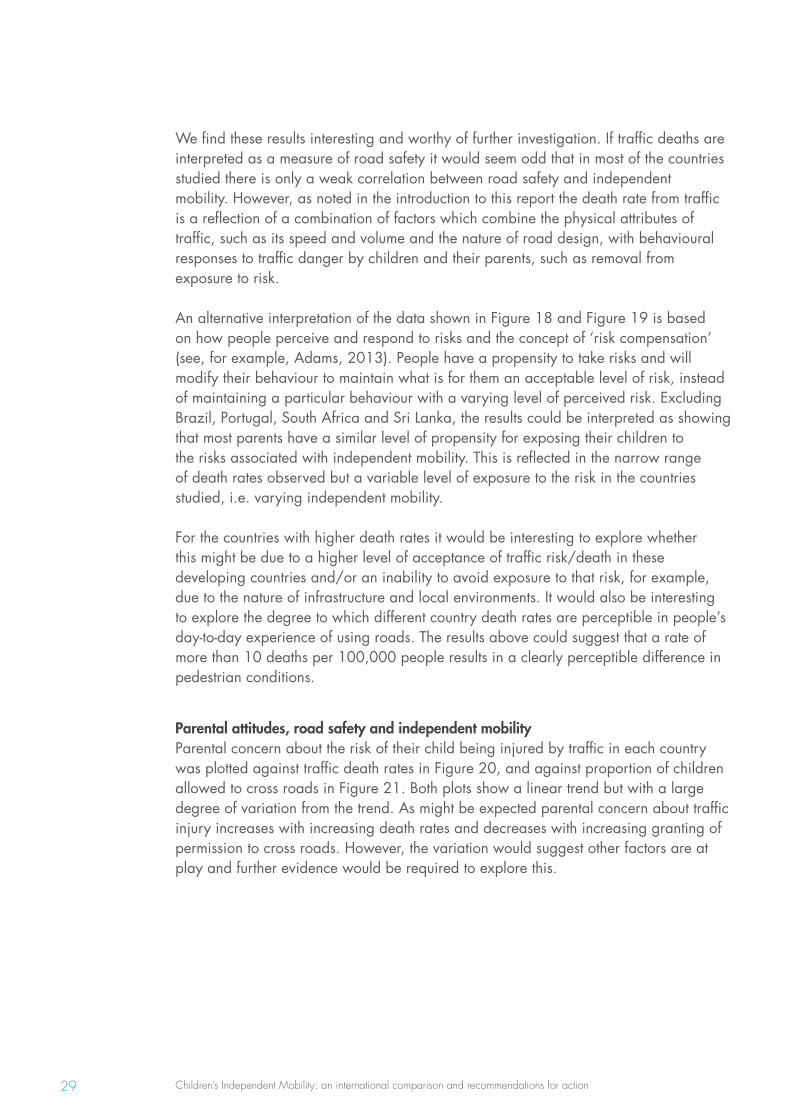
Children’s Independent Mobility: an international comparison and recommendations for action29
We find these results interesting and worthy of further investigation. If traffic deaths are interpreted as a measure of road safety it would seem odd that in most of the countries studied there is only a weak correlation between road safety and independent mobility. However, as noted in the introduction to this report the death rate from traffic is a reflection of a combination of factors which combine the physical attributes of traffic, such as its speed and volume and the nature of road design, with behavioural responses to traffic danger by children and their parents, such as removal from exposure to risk.
An alternative interpretation of the data shown in Figure 18 and Figure 19 is based on how people perceive and respond to risks and the concept of ‘risk compensation’ (see, for example, Adams, 2013). People have a propensity to take risks and will modify their behaviour to maintain what is for them an acceptable level of risk, instead of maintaining a particular behaviour with a varying level of perceived risk. Excluding Brazil, Portugal, South Africa and Sri Lanka, the results could be interpreted as showing that most parents have a similar level of propensity for exposing their children to the risks associated with independent mobility. This is reflected in the narrow range of death rates observed but a variable level of exposure to the risk in the countries studied, i.e. varying independent mobility.
For the countries with higher death rates it would be interesting to explore whether this might be due to a higher level of acceptance of traffic risk/death in these developing countries and/or an inability to avoid exposure to that risk, for example, due to the nature of infrastructure and local environments. It would also be interesting to explore the degree to which different country death rates are perceptible in people’s day-to-day experience of using roads. The results above could suggest that a rate of more than 10 deaths per 100,000 people results in a clearly perceptible difference in pedestrian conditions.
Parental attitudes, road safety and independent mobilityParental concern about the risk of their child being injured by traffic in each country was plotted against traffic death rates in Figure 20, and against proportion of children allowed to cross roads in Figure 21. Both plots show a linear trend but with a large degree of variation from the trend. As might be expected parental concern about traffic injury increases with increasing death rates and decreases with increasing granting of permission to cross roads. However, the variation would suggest other factors are at play and further evidence would be required to explore this.
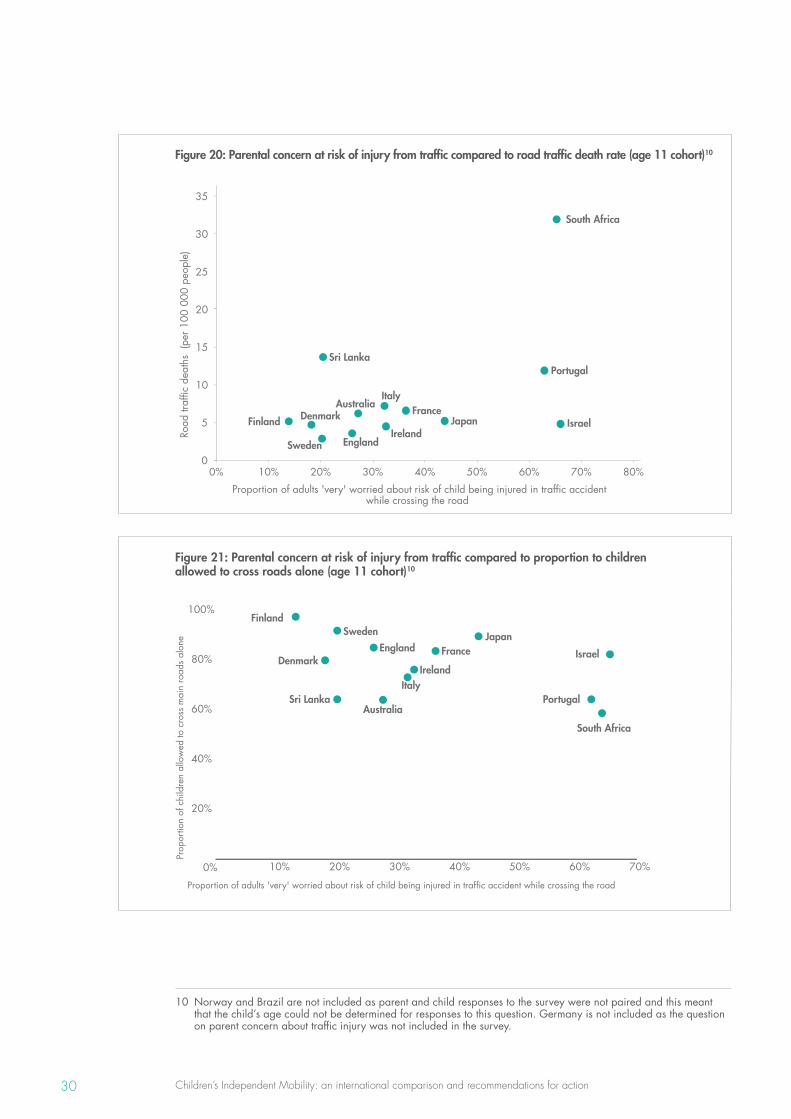
Children’s Independent Mobility: an international comparison and recommendations for action30
Figure 20: Parental concern at risk of injury from traffic compared to road traffic death rate (age 11 cohort)10
Finland
Sweden
Japan Denmark
England
France Israel
Sri Lanka
Ireland
Australia
Portugal
Italy
South Africa
0
5
10
15
20
25
30
35
0% 10% 20% 30% 40% 50% 60% 70% 80%
Road
traf
fic d
eath
s (p
er 1
00 0
00 p
eopl
e)
Proportion of adults 'very' worried about risk of child being injured in traffic accident while crossing the road
Figure 21: Parental concern at risk of injury from traffic compared to proportion to children allowed to cross roads alone (age 11 cohort)10
Finland Sweden Japan
Denmark England France Israel
Sri Lanka
Ireland
Australia Portugal
Italy
South Africa
20%
40%
60%
80%
100%
0% 10% 20% 30% 40% 50% 60% 70%
Prop
ortio
n of
chi
ldre
n al
low
ed to
cro
ss m
ain
road
s al
one
Proportion of adults 'very' worried about risk of child being injured in traffic accident while crossing the road
10 Norway and Brazil are not included as parent and child responses to the survey were not paired and this meant that the child’s age could not be determined for responses to this question. Germany is not included as the question on parent concern about traffic injury was not included in the survey.
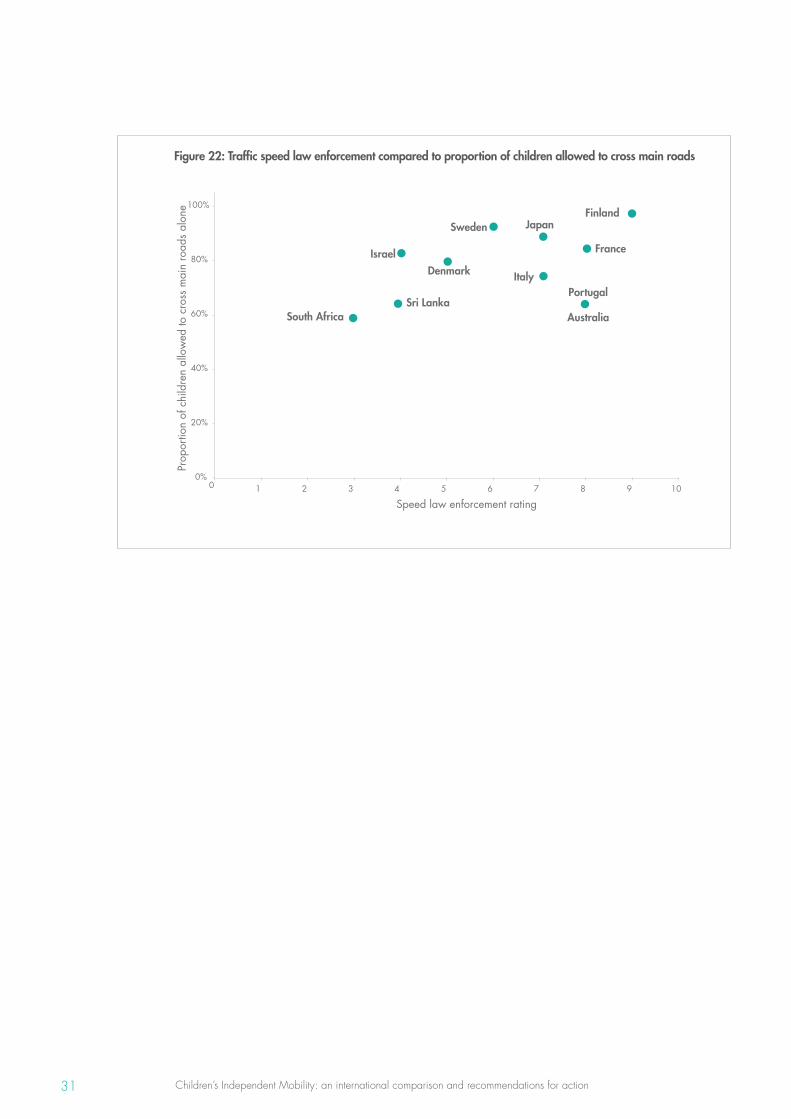
Children’s Independent Mobility: an international comparison and recommendations for action31
Figure 22: Traffic speed law enforcement compared to proportion of children allowed to cross main roads
Finland Sweden Japan
Denmark
France Israel
Sri Lanka Australia
Portugal Italy
South Africa
0%
20%
40%
60%
80%
100%
0 1 2 3 4 5 6 7 8 9 10
Prop
ortio
n of
chi
ldre
n al
low
ed to
cro
ss m
ain
road
s al
one
Speed law enforcement rating
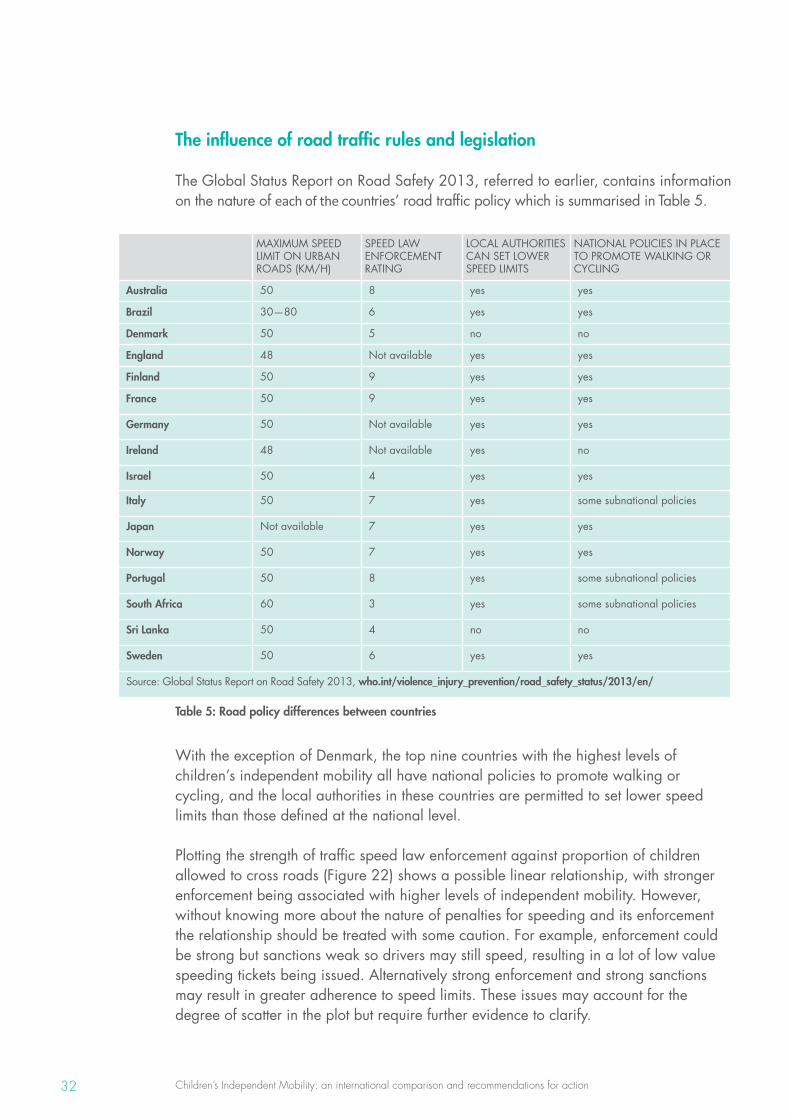
Children’s Independent Mobility: an international comparison and recommendations for action32
The influence of road traffic rules and legislation
The Global Status Report on Road Safety 2013, referred to earlier, contains information on the nature of each of the countries’ road traffic policy which is summarised in Table 5.
MAXIMUM SPEED LIMIT ON URBAN ROADS (KM/H)
SPEED LAW ENFORCEMENT RATING
LOCAL AUTHORITIES CAN SET LOWER SPEED LIMITS
NATIONAL POLICIES IN PLACE TO PROMOTE WALKING OR CYCLING
Australia 50 8 yes yes
Brazil 30—80 6 yes yes
Denmark 50 5 no no
England 48 Not available yes yes
Finland 50 9 yes yes
France 50 9 yes yes
Germany 50 Not available yes yes
Ireland 48 Not available yes no
Israel 50 4 yes yes
Italy 50 7 yes some subnational policies
Japan Not available 7 yes yes
Norway 50 7 yes yes
Portugal 50 8 yes some subnational policies
South Africa 60 3 yes some subnational policies
Sri Lanka 50 4 no no
Sweden 50 6 yes yes
Source: Global Status Report on Road Safety 2013, who.int/violence_injury_prevention/road_safety_status/2013/en/
Table 5: Road policy differences between countries
With the exception of Denmark, the top nine countries with the highest levels of children’s independent mobility all have national policies to promote walking or cycling, and the local authorities in these countries are permitted to set lower speed limits than those defined at the national level.
Plotting the strength of traffic speed law enforcement against proportion of children allowed to cross roads (Figure 22) shows a possible linear relationship, with stronger enforcement being associated with higher levels of independent mobility. However, without knowing more about the nature of penalties for speeding and its enforcement the relationship should be treated with some caution. For example, enforcement could be strong but sanctions weak so drivers may still speed, resulting in a lot of low value speeding tickets being issued. Alternatively strong enforcement and strong sanctions may result in greater adherence to speed limits. These issues may account for the degree of scatter in the plot but require further evidence to clarify.
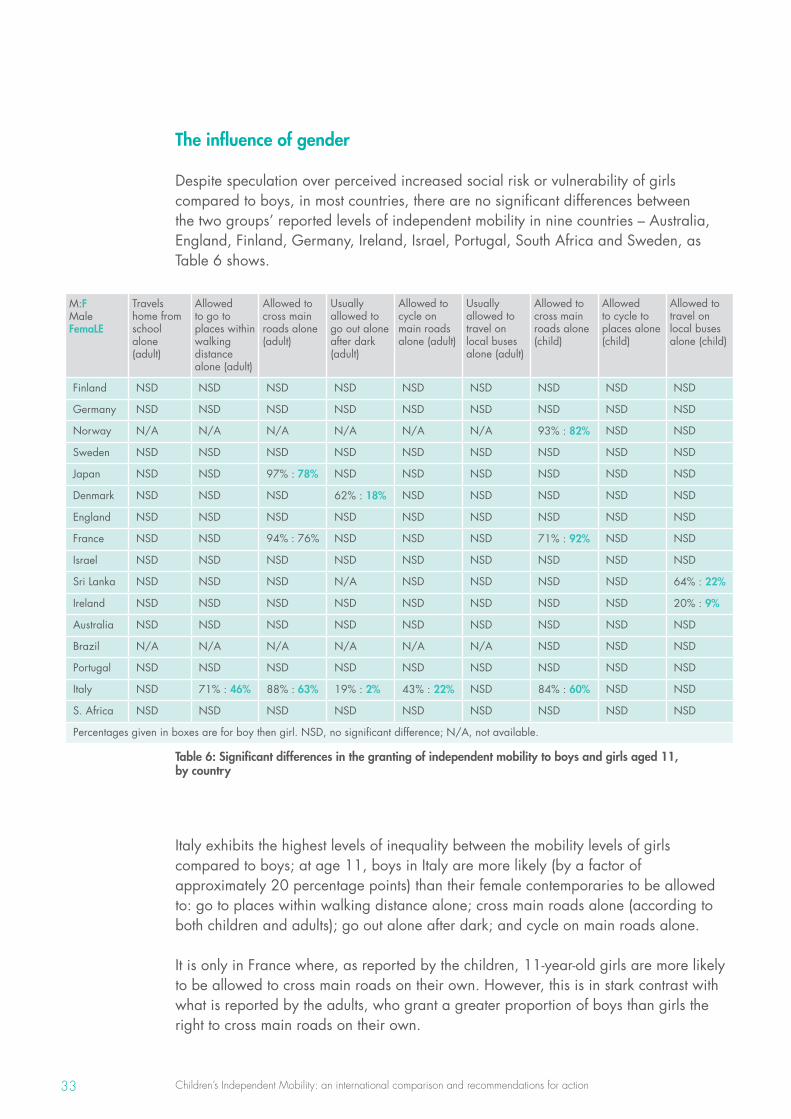
Children’s Independent Mobility: an international comparison and recommendations for action33
The influence of gender
Despite speculation over perceived increased social risk or vulnerability of girls compared to boys, in most countries, there are no significant differences between the two groups’ reported levels of independent mobility in nine countries – Australia, England, Finland, Germany, Ireland, Israel, Portugal, South Africa and Sweden, as Table 6 shows.
M:F MaleFemaLE
Travels home from school alone (adult)
Allowed to go to places within walking distance alone (adult)
Allowed to cross main roads alone (adult)
Usually allowed to go out alone after dark (adult)
Allowed to cycle on main roads alone (adult)
Usually allowed to travel on local buses alone (adult)
Allowed to cross main roads alone (child)
Allowed to cycle to places alone (child)
Allowed to travel on local buses alone (child)
Finland NSD NSD NSD NSD NSD NSD NSD NSD NSD
Germany NSD NSD NSD NSD NSD NSD NSD NSD NSD
Norway N/A N/A N/A N/A N/A N/A 93% : 82% NSD NSD
Sweden NSD NSD NSD NSD NSD NSD NSD NSD NSD
Japan NSD NSD 97% : 78% NSD NSD NSD NSD NSD NSD
Denmark NSD NSD NSD 62% : 18% NSD NSD NSD NSD NSD
England NSD NSD NSD NSD NSD NSD NSD NSD NSD
France NSD NSD 94% : 76% NSD NSD NSD 71% : 92% NSD NSD
Israel NSD NSD NSD NSD NSD NSD NSD NSD NSD
Sri Lanka NSD NSD NSD N/A NSD NSD NSD NSD 64% : 22%
Ireland NSD NSD NSD NSD NSD NSD NSD NSD 20% : 9%
Australia NSD NSD NSD NSD NSD NSD NSD NSD NSD
Brazil N/A N/A N/A N/A N/A N/A NSD NSD NSD
Portugal NSD NSD NSD NSD NSD NSD NSD NSD NSD
Italy NSD 71% : 46% 88% : 63% 19% : 2% 43% : 22% NSD 84% : 60% NSD NSD
S. Africa NSD NSD NSD NSD NSD NSD NSD NSD NSD
Percentages given in boxes are for boy then girl. NSD, no significant difference; N/A, not available.
Table 6: Significant differences in the granting of independent mobility to boys and girls aged 11, by country
Italy exhibits the highest levels of inequality between the mobility levels of girls compared to boys; at age 11, boys in Italy are more likely (by a factor of approximately 20 percentage points) than their female contemporaries to be allowed to: go to places within walking distance alone; cross main roads alone (according to both children and adults); go out alone after dark; and cycle on main roads alone.
It is only in France where, as reported by the children, 11-year-old girls are more likely to be allowed to cross main roads on their own. However, this is in stark contrast with what is reported by the adults, who grant a greater proportion of boys than girls the right to cross main roads on their own.
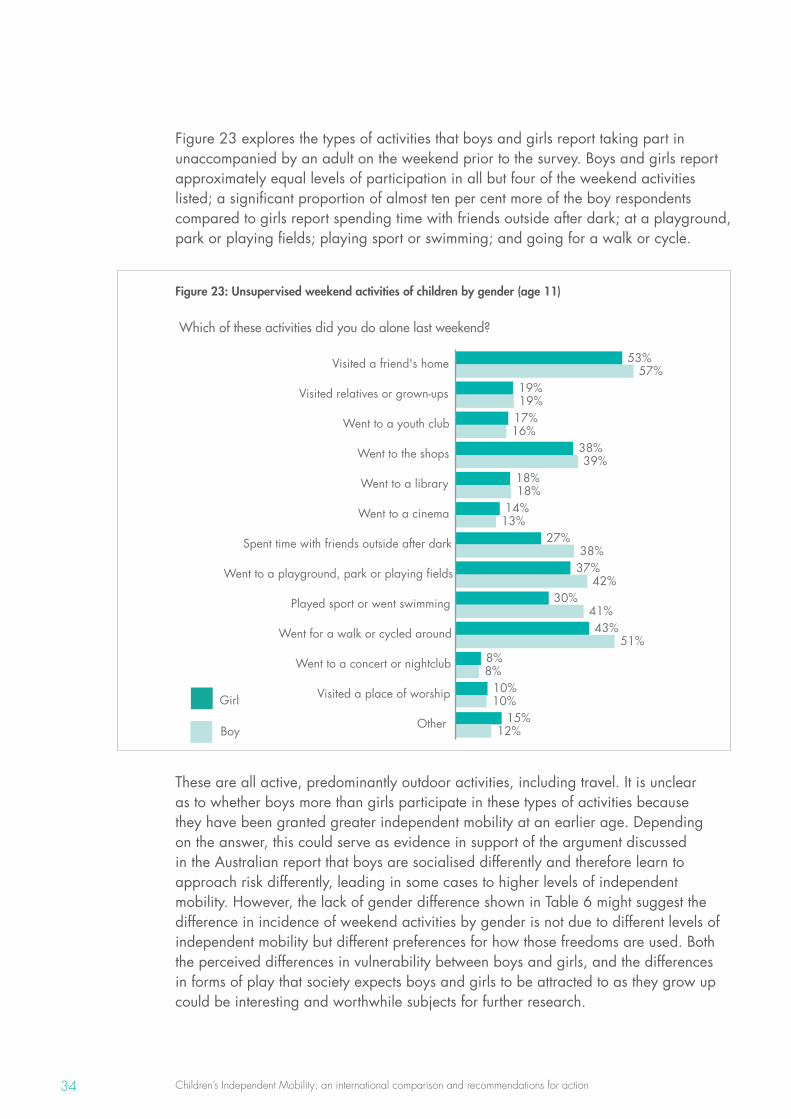
Children’s Independent Mobility: an international comparison and recommendations for action34
Figure 23 explores the types of activities that boys and girls report taking part in unaccompanied by an adult on the weekend prior to the survey. Boys and girls report approximately equal levels of participation in all but four of the weekend activities listed; a significant proportion of almost ten per cent more of the boy respondents compared to girls report spending time with friends outside after dark; at a playground, park or playing fields; playing sport or swimming; and going for a walk or cycle.
53%
19%
17%
38%
18%
14%
27%
37%
30%
43%
8%
10%
15%
57%
19%
16%
39%
18%
13%
38%
42%
41%
51%
8%
10%
12%
Visited a friend's home
Visited relatives or grown-ups
Went to a youth club
Went to the shops
Went to a library
Went to a cinema
Spent time with friends outside after dark
Went to a playground, park or playing fields
Played sport or went swimming
Went for a walk or cycled around
Went to a concert or nightclub
Visited a place of worship
Other
Which of these activities did you do alone last weekend?
Girl
Boy
Figure 23: Unsupervised weekend activities of children by gender (age 11)
These are all active, predominantly outdoor activities, including travel. It is unclear as to whether boys more than girls participate in these types of activities because they have been granted greater independent mobility at an earlier age. Depending on the answer, this could serve as evidence in support of the argument discussed in the Australian report that boys are socialised differently and therefore learn to approach risk differently, leading in some cases to higher levels of independent mobility. However, the lack of gender difference shown in Table 6 might suggest the difference in incidence of weekend activities by gender is not due to different levels of independent mobility but different preferences for how those freedoms are used. Both the perceived differences in vulnerability between boys and girls, and the differences in forms of play that society expects boys and girls to be attracted to as they grow up could be interesting and worthwhile subjects for further research.
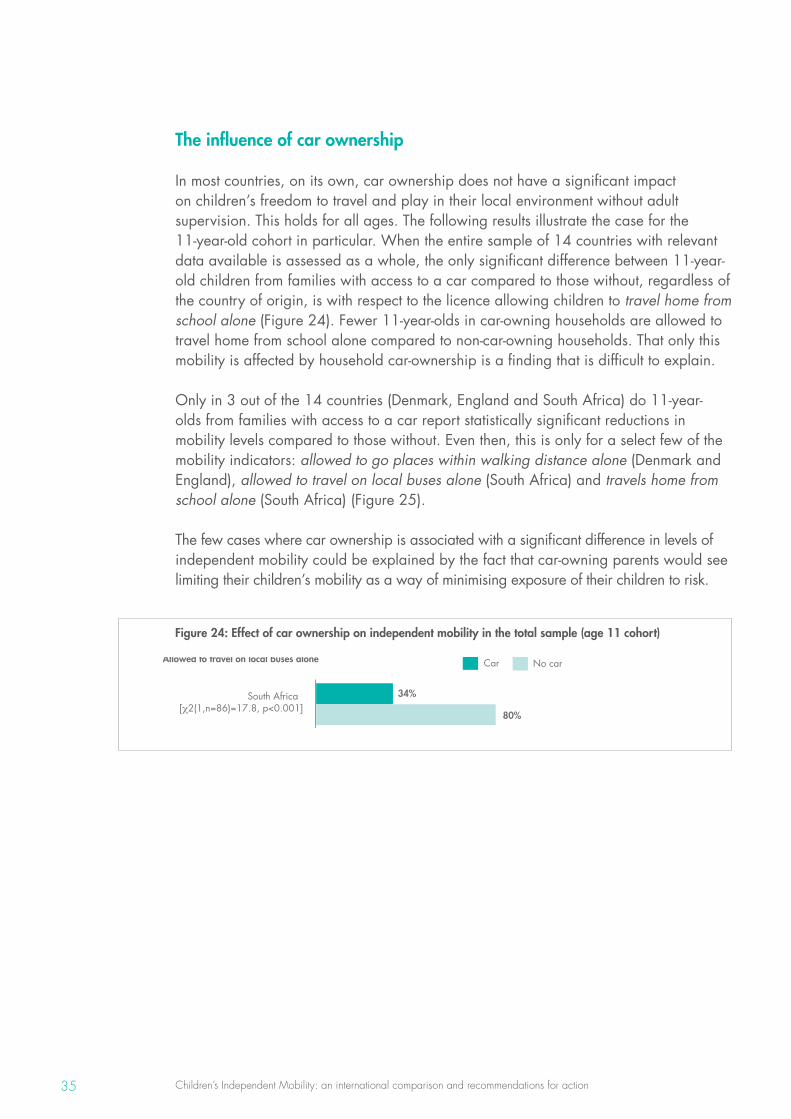
Children’s Independent Mobility: an international comparison and recommendations for action35
The influence of car ownership
In most countries, on its own, car ownership does not have a significant impact on children’s freedom to travel and play in their local environment without adult supervision. This holds for all ages. The following results illustrate the case for the 11-year-old cohort in particular. When the entire sample of 14 countries with relevant data available is assessed as a whole, the only significant difference between 11-year-old children from families with access to a car compared to those without, regardless of the country of origin, is with respect to the licence allowing children to travel home from school alone (Figure 24). Fewer 11-year-olds in car-owning households are allowed to travel home from school alone compared to non-car-owning households. That only this mobility is affected by household car-ownership is a finding that is difficult to explain.
Only in 3 out of the 14 countries (Denmark, England and South Africa) do 11-year-olds from families with access to a car report statistically significant reductions in mobility levels compared to those without. Even then, this is only for a select few of the mobility indicators: allowed to go places within walking distance alone (Denmark and England), allowed to travel on local buses alone (South Africa) and travels home from school alone (South Africa) (Figure 25).
The few cases where car ownership is associated with a significant difference in levels of independent mobility could be explained by the fact that car-owning parents would see limiting their children’s mobility as a way of minimising exposure of their children to risk.
Figure 24: Effect of car ownership on independent mobility in the total sample (age 11 cohort)
34%
80%
South Africa [ 2(1,n=86)=17.8, p<0.001]
Allowed to travel on local buses alone
Car No car
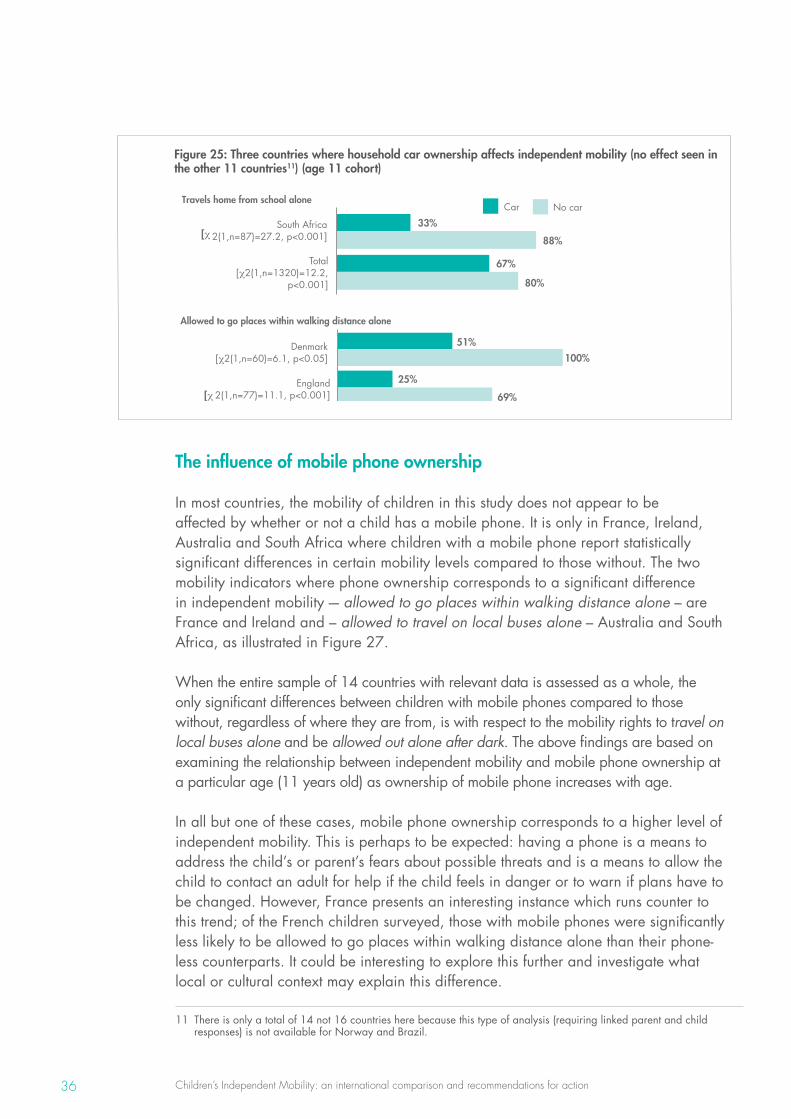
Children’s Independent Mobility: an international comparison and recommendations for action36
Figure 25: Three countries where household car ownership affects independent mobility (no effect seen in the other 11 countries11) (age 11 cohort)
The influence of mobile phone ownership
In most countries, the mobility of children in this study does not appear to be affected by whether or not a child has a mobile phone. It is only in France, Ireland, Australia and South Africa where children with a mobile phone report statistically significant differences in certain mobility levels compared to those without. The two mobility indicators where phone ownership corresponds to a significant difference in independent mobility -– allowed to go places within walking distance alone – are France and Ireland and – allowed to travel on local buses alone – Australia and South Africa, as illustrated in Figure 27.
When the entire sample of 14 countries with relevant data is assessed as a whole, the only significant differences between children with mobile phones compared to those without, regardless of where they are from, is with respect to the mobility rights to travel on local buses alone and be allowed out alone after dark. The above findings are based on examining the relationship between independent mobility and mobile phone ownership at a particular age (11 years old) as ownership of mobile phone increases with age.
In all but one of these cases, mobile phone ownership corresponds to a higher level of independent mobility. This is perhaps to be expected: having a phone is a means to address the child’s or parent’s fears about possible threats and is a means to allow the child to contact an adult for help if the child feels in danger or to warn if plans have to be changed. However, France presents an interesting instance which runs counter to this trend; of the French children surveyed, those with mobile phones were significantly less likely to be allowed to go places within walking distance alone than their phone-less counterparts. It could be interesting to explore this further and investigate what local or cultural context may explain this difference.
Travels home from school alone
Allowed to go places within walking distance alone
Car No car
33%
67%
88%
80%
South Africa [ 2(1,n=87)=27.2, p<0.001]
Total [ 2(1,n=1320)=12.2,
p<0.001]
51%
25%
100%
69%
Denmark [ 2(1,n=60)=6.1, p<0.05]
England [ 2(1,n=77)=11.1, p<0.001]
11 There is only a total of 14 not 16 countries here because this type of analysis (requiring linked parent and child responses) is not available for Norway and Brazil.
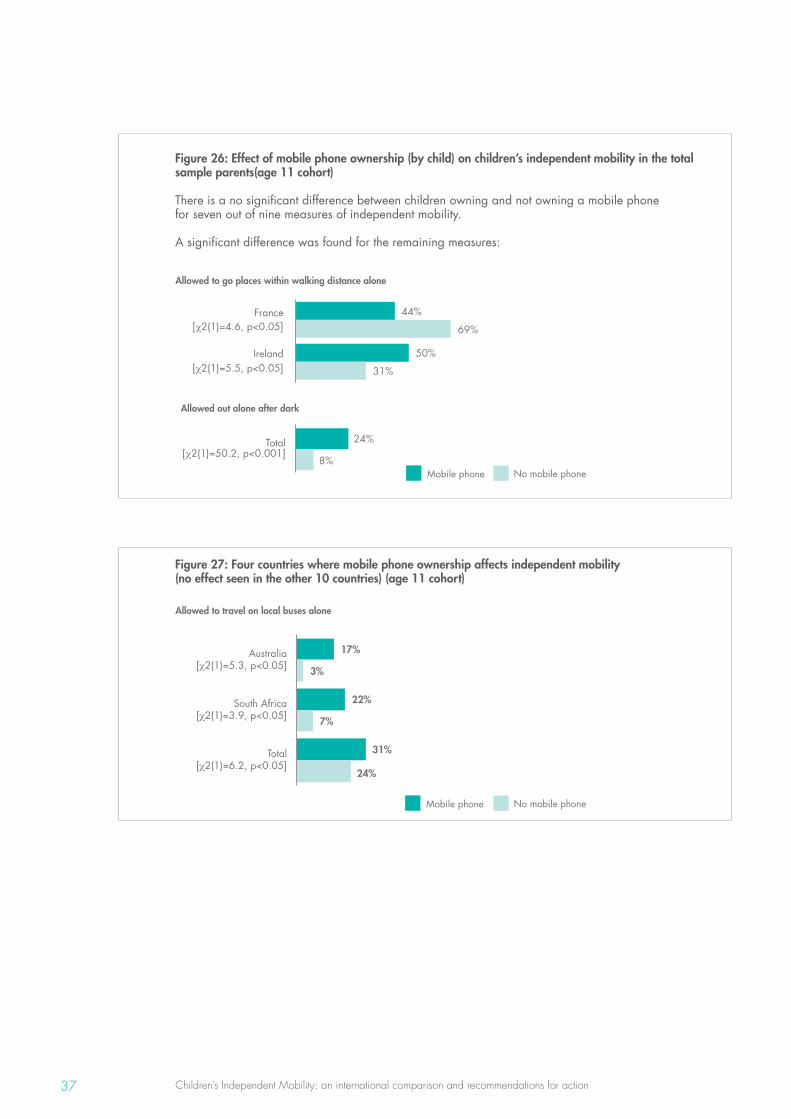
Children’s Independent Mobility: an international comparison and recommendations for action37
Figure 26: Effect of mobile phone ownership (by child) on children’s independent mobility in the total
sample parents(age 11 cohort)
There is a no significant difference between children owning and not owning a mobile phone for seven out of nine measures of independent mobility.
A significant difference was found for the remaining measures:
Figure 27: Four countries where mobile phone ownership affects independent mobility (no effect seen in the other 10 countries) (age 11 cohort)
Allowed to go places within walking distance alone
Allowed out alone after dark
Mobile phone No mobile phone
24%
8%
Total [ 2(1)=50.2, p<0.001]
44%
50%
69%
31%
France [ 2(1)=4.6, p<0.05]
Ireland [ 2(1)=5.5, p<0.05]
Allowed to travel on local buses alone
Mobile phone No mobile phone
17%
22%
31%
3%
7%
24%
Australia [ 2(1)=5.3, p<0.05]
South Africa [ 2(1)=3.9, p<0.05]
Total [ 2(1)=6.2, p<0.05]
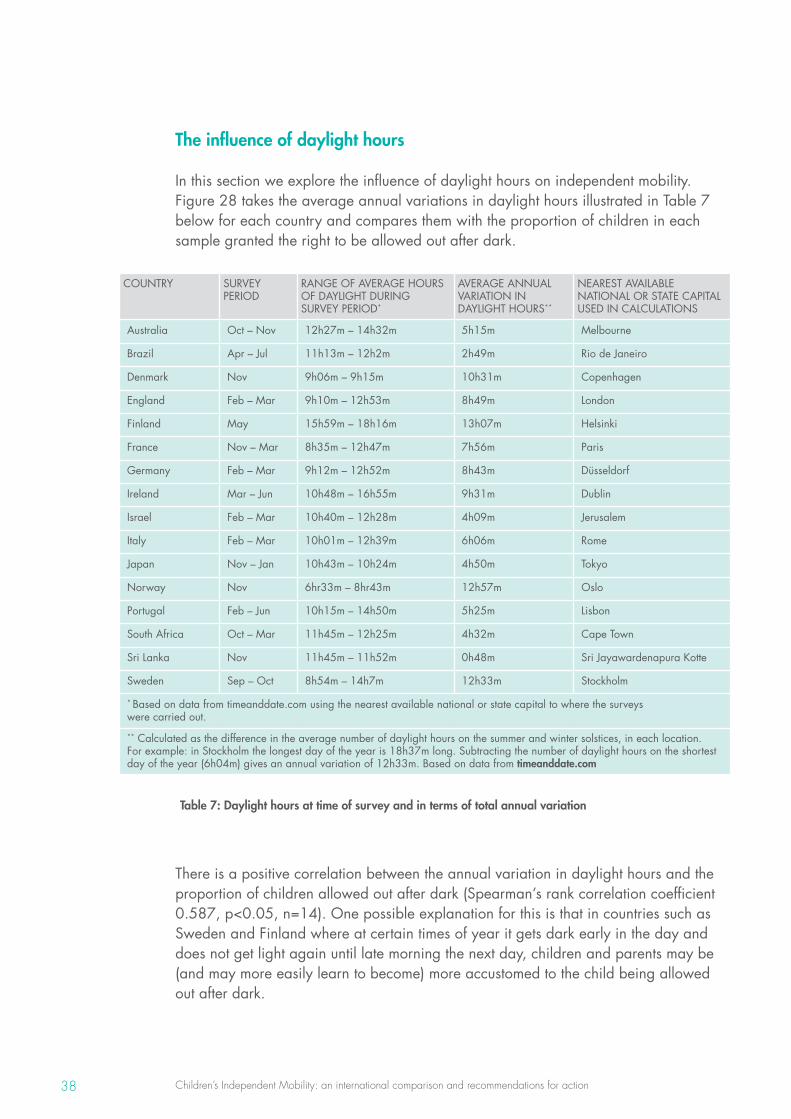
Children’s Independent Mobility: an international comparison and recommendations for action38
The influence of daylight hours
In this section we explore the influence of daylight hours on independent mobility. Figure 28 takes the average annual variations in daylight hours illustrated in Table 7 below for each country and compares them with the proportion of children in each sample granted the right to be allowed out after dark.
COUNTRY SURVEY PERIOD
RANGE OF AVERAGE HOURS OF DAYLIGHT DURING SURVEY PERIOD*
AVERAGE ANNUAL VARIATION IN DAYLIGHT HOURS**
NEAREST AVAILABLE NATIONAL OR STATE CAPITAL USED IN CALCULATIONS
Australia Oct – Nov 12h27m – 14h32m 5h15m Melbourne
Brazil Apr – Jul 11h13m – 12h2m 2h49m Rio de Janeiro
Denmark Nov 9h06m – 9h15m 10h31m Copenhagen
England Feb – Mar 9h10m – 12h53m 8h49m London
Finland May 15h59m – 18h16m 13h07m Helsinki
France Nov – Mar 8h35m – 12h47m 7h56m Paris
Germany Feb – Mar 9h12m – 12h52m 8h43m Düsseldorf
Ireland Mar – Jun 10h48m – 16h55m 9h31m Dublin
Israel Feb – Mar 10h40m – 12h28m 4h09m Jerusalem
Italy Feb – Mar 10h01m – 12h39m 6h06m Rome
Japan Nov – Jan 10h43m – 10h24m 4h50m Tokyo
Norway Nov 6hr33m – 8hr43m 12h57m Oslo
Portugal Feb – Jun 10h15m – 14h50m 5h25m Lisbon
South Africa Oct – Mar 11h45m – 12h25m 4h32m Cape Town
Sri Lanka Nov 11h45m – 11h52m 0h48m Sri Jayawardenapura Kotte
Sweden Sep – Oct 8h54m – 14h7m 12h33m Stockholm
* Based on data from timeanddate.com using the nearest available national or state capital to where the surveys were carried out.
** Calculated as the difference in the average number of daylight hours on the summer and winter solstices, in each location. For example: in Stockholm the longest day of the year is 18h37m long. Subtracting the number of daylight hours on the shortest day of the year (6h04m) gives an annual variation of 12h33m. Based on data from timeanddate.com
Table 7: Daylight hours at time of survey and in terms of total annual variation
There is a positive correlation between the annual variation in daylight hours and the proportion of children allowed out after dark (Spearman’s rank correlation coefficient 0.587, p<0.05, n=14). One possible explanation for this is that in countries such as Sweden and Finland where at certain times of year it gets dark early in the day and does not get light again until late morning the next day, children and parents may be (and may more easily learn to become) more accustomed to the child being allowed out after dark.
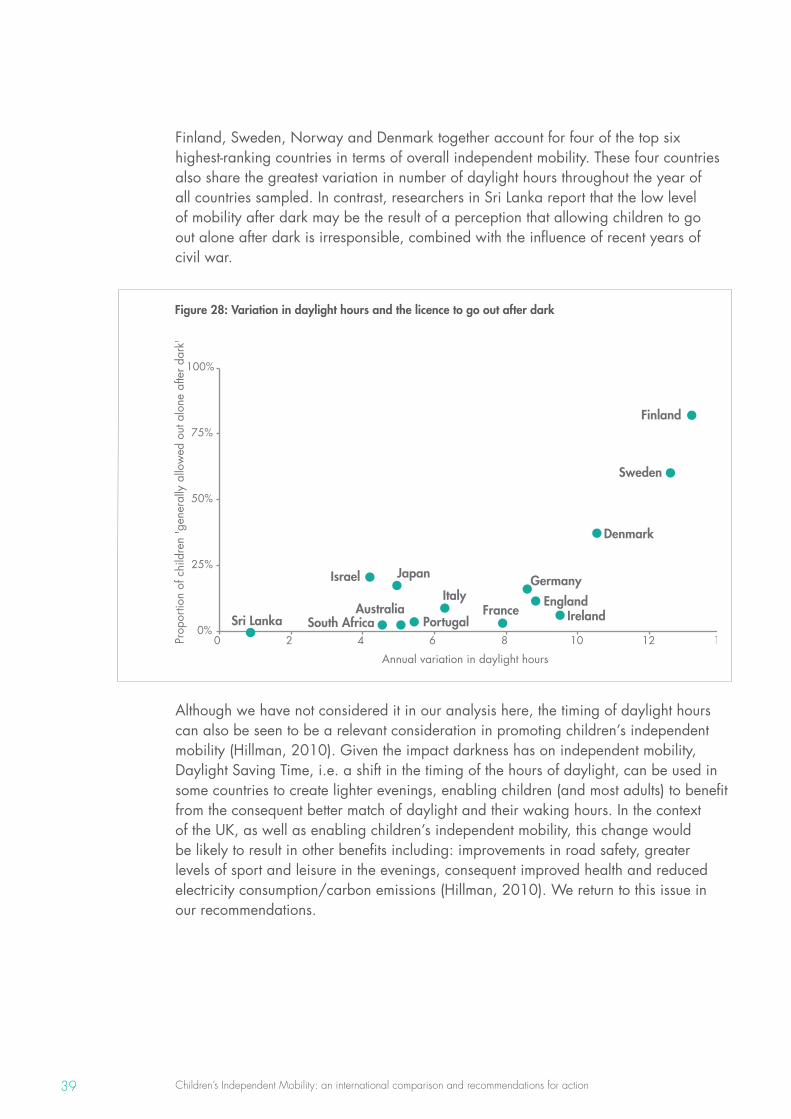
Children’s Independent Mobility: an international comparison and recommendations for action39
Finland, Sweden, Norway and Denmark together account for four of the top six highest-ranking countries in terms of overall independent mobility. These four countries also share the greatest variation in number of daylight hours throughout the year of all countries sampled. In contrast, researchers in Sri Lanka report that the low level of mobility after dark may be the result of a perception that allowing children to go out alone after dark is irresponsible, combined with the influence of recent years of civil war.
Figure 28: Variation in daylight hours and the licence to go out after dark
Finland
Germany
Sweden
Japan
Denmark
England France
Israel
Sri Lanka Ireland Australia Portugal
Italy
South Africa 0%
25%
50%
75%
100%
0 2 4 6 8 10 12 14 Prop
ortio
n of
chi
ldre
n 'g
ener
ally
allo
wed
out
alo
ne a
fter d
ark'
Annual variation in daylight hours
Although we have not considered it in our analysis here, the timing of daylight hours can also be seen to be a relevant consideration in promoting children’s independent mobility (Hillman, 2010). Given the impact darkness has on independent mobility, Daylight Saving Time, i.e. a shift in the timing of the hours of daylight, can be used in some countries to create lighter evenings, enabling children (and most adults) to benefit from the consequent better match of daylight and their waking hours. In the context of the UK, as well as enabling children’s independent mobility, this change would be likely to result in other benefits including: improvements in road safety, greater levels of sport and leisure in the evenings, consequent improved health and reduced electricity consumption/carbon emissions (Hillman, 2010). We return to this issue in our recommendations.
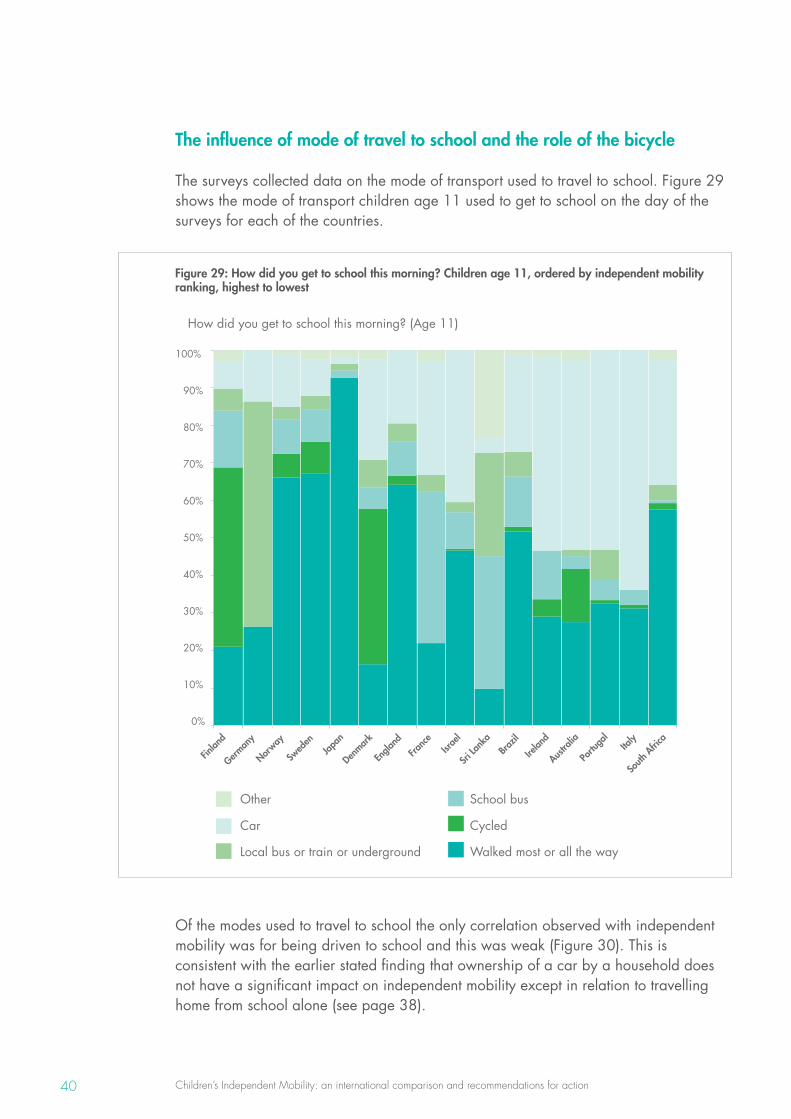
Children’s Independent Mobility: an international comparison and recommendations for action40
The influence of mode of travel to school and the role of the bicycle
The surveys collected data on the mode of transport used to travel to school. Figure 29 shows the mode of transport children age 11 used to get to school on the day of the surveys for each of the countries.
Figure 29: How did you get to school this morning? Children age 11, ordered by independent mobility ranking, highest to lowest
0%
10%
20%
30%
40%
50%
60%
70%
80%
90%
100%
Finlan
d
German
y
Norway
Swed
en
Japa
n
Denmar
k
Engla
nd
Franc
e
Israe
l
Sri La
nka
Braz
il
Irelan
d
Austra
lia
Portu
gal
Italy
South
Afri
ca
How did you get to school this morning? (Age 11)
Other
Car
Local bus or train or underground
School bus
Cycled
Walked most or all the way
Of the modes used to travel to school the only correlation observed with independent mobility was for being driven to school and this was weak (Figure 30). This is consistent with the earlier stated finding that ownership of a car by a household does not have a significant impact on independent mobility except in relation to travelling home from school alone (see page 38).
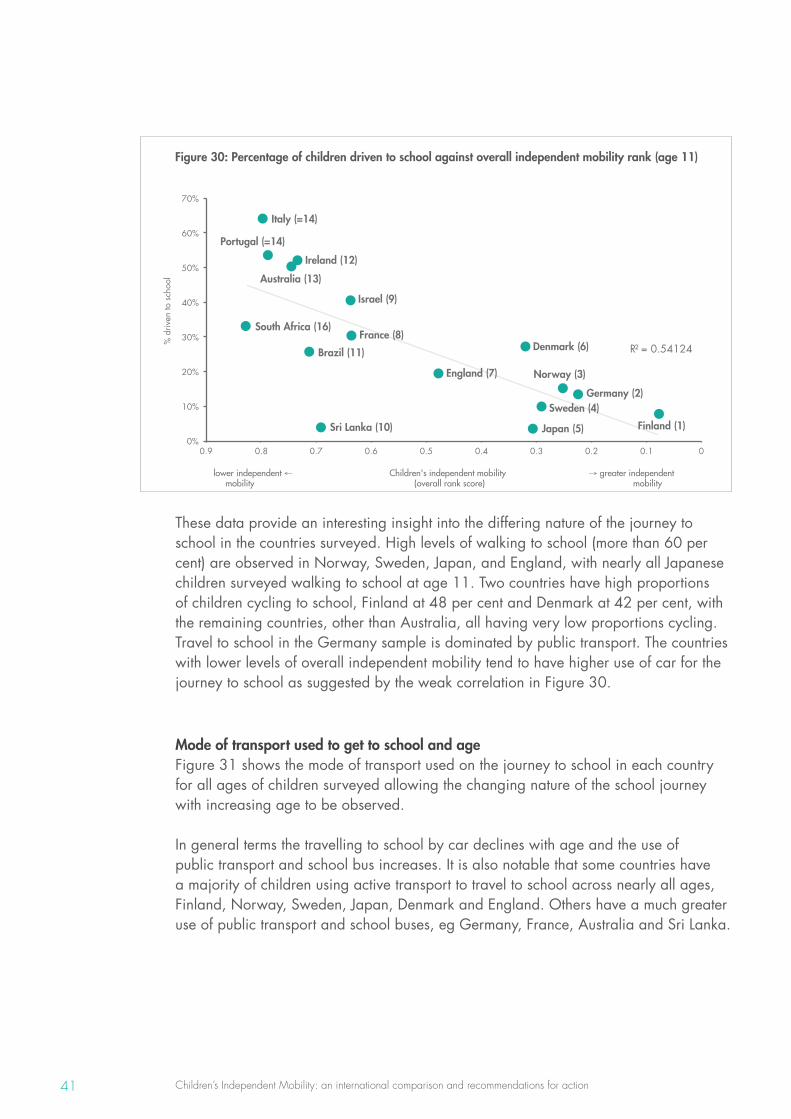
Children’s Independent Mobility: an international comparison and recommendations for action41
Figure 30: Percentage of children driven to school against overall independent mobility rank (age 11)
Germany (2)
Norway (3)
Japan (5)
Denmark (6)
Israel (9)
Sri Lanka (10)
Brazil (11)
Ireland (12)
Australia (13)
Portugal (=14)
Italy (=14)
South Africa (16)
R² = 0.54124
0%
10%
20%
30%
40%
50%
60%
70%
0 0.1 0.2 0.3 0.4 0.5 0.6 0.7 0.8 0.9
% d
riven
to s
choo
l
France (8)
Sweden (4)
England (7)
Finland (1)
These data provide an interesting insight into the differing nature of the journey to school in the countries surveyed. High levels of walking to school (more than 60 per cent) are observed in Norway, Sweden, Japan, and England, with nearly all Japanese children surveyed walking to school at age 11. Two countries have high proportions of children cycling to school, Finland at 48 per cent and Denmark at 42 per cent, with the remaining countries, other than Australia, all having very low proportions cycling. Travel to school in the Germany sample is dominated by public transport. The countries with lower levels of overall independent mobility tend to have higher use of car for the journey to school as suggested by the weak correlation in Figure 30.
Mode of transport used to get to school and ageFigure 31 shows the mode of transport used on the journey to school in each country for all ages of children surveyed allowing the changing nature of the school journey with increasing age to be observed.
In general terms the travelling to school by car declines with age and the use of public transport and school bus increases. It is also notable that some countries have a majority of children using active transport to travel to school across nearly all ages, Finland, Norway, Sweden, Japan, Denmark and England. Others have a much greater use of public transport and school buses, eg Germany, France, Australia and Sri Lanka.
Children’s Independent Mobility: an international comparison and recommendations for action42
Accounting for the reasons behind these differences is not possible without further research into the local conditions present, for example, distances to school, nature of settlement, quality of local infrastructure/public transport, and the effect social and cultural factors may have and so on. It would be interesting to further explore the degree to which the modal splits observed have resulted from differing policy frameworks and the lessons that could be learnt from this. For example, are the high levels of cycling in Finland and Denmark the result of active interventions or have they evolved due to the local circumstances and what accounts for the very high levels of walking to school in Japan?
The role of bicycles in children’s mobilityThe very small role that bicycles play in children’s mobility, whether accompanied by adults or independent, is striking from Figure 29 and Figure 31. Bicycles are the main mode by which children can extend their range of mobility without adult support. The data reveal that, except for Finland and Denmark, this potential is almost entirely overlooked, at least on the journey to school with the typically larger distances to secondary schools being made by public transport, school bus or car, although walking remains an important mode of transport in a number of countries.
This low level of use of bicycles is in spite of the high levels of ownership in nearly all countries surveyed (Figure 32) and an expressed preference by many of the children surveyed for cycling or walking as a means to get to school (Figure 33).
The supressed demand for these modes is likely, especially for cycling, to be associated with road conditions and parents’ perception of whether it is safe for children to share roads with traffic. Again the reasons behind high levels of bicycle use in Finland and Denmark would be worth exploring to understand how bicycle use could be encouraged as a mode of transport to school and more generally.
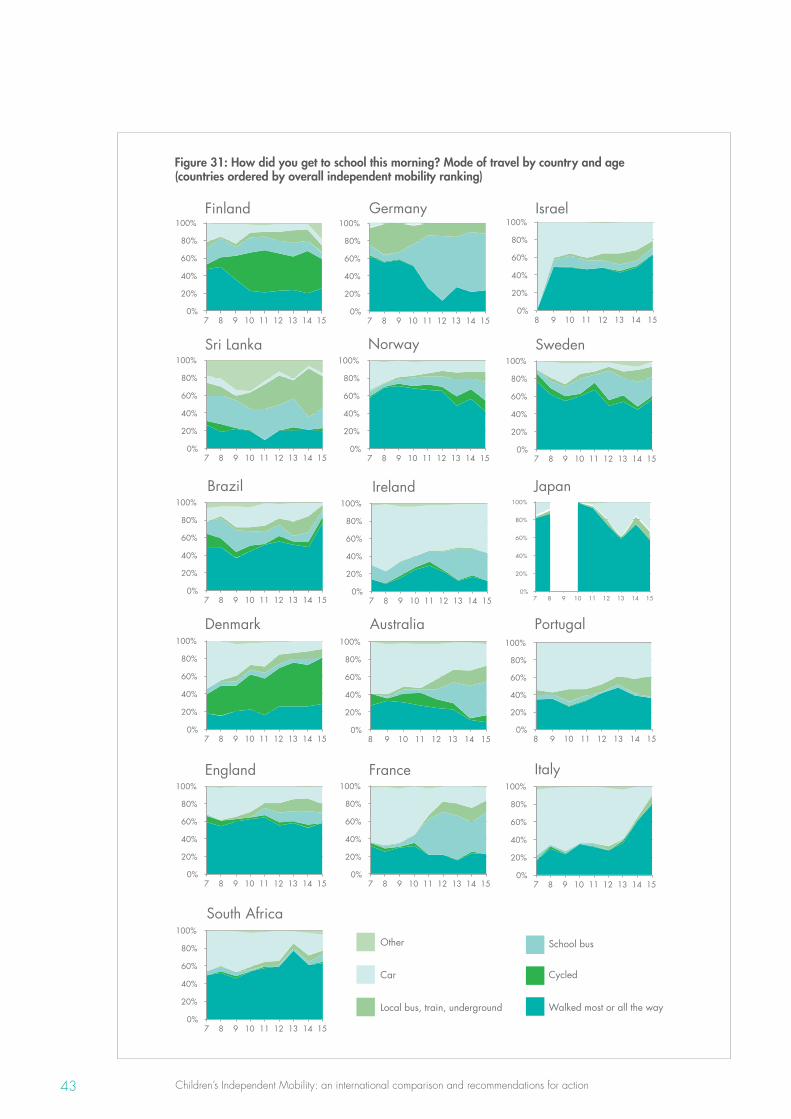
Children’s Independent Mobility: an international comparison and recommendations for action43
Figure 31: How did you get to school this morning? Mode of travel by country and age (countries ordered by overall independent mobility ranking)
0%
20%
40%
60%
80%
100%
7 8 9 10 11 12 13 14 15 0%
20%
40%
60%
80%
100%
7 8 9 10 11 12 13 14 15 0%
20%
40%
60%
80%
100%
7 8 9 10 11 12 13 14 15
JapanIrelandBrazil
0%
20%
40%
60%
80%
100%
7 8 9 10 11 12 13 14 15 0%
20%
40%
60%
80%
100%
7 8 9 10 11 12 13 14 15 0%
20%
40%
60%
80%
100%
7 8 9 10 11 12 13 14 15
Sri Lanka Norway Sweden
0%
20%
40%
60%
80%
100%
7 8 9 10 11 12 13 14 15 0%
20%
40%
60%
80%
100%
7 8 9 10 11 12 13 14 15 0%
20%
40%
60%
80%
100%
8 9 10 11 12 13 14 15
IsraelGermanyFinland
0%
20%
40%
60%
80%
100%
7 8 9 10 11 12 13 14 15 0%
20%
40%
60%
80%
100%
7 8 9 10 11 12 13 14 15 0%
20%
40%
60%
80%
100%
7 8 9 10 11 12 13 14 15
Italy FranceEngland
0%
20%
40%
60%
80%
100%
7 8 9 10 11 12 13 14 15 0%
20%
40%
60%
80%
100%
8 9 10 11 12 13 14 15 0%
20%
40%
60%
80%
100%
8 9 10 11 12 13 14 15
Australia PortugalDenmark
South Africa
0%
20%
40%
60%
80%
100%
7 8 9 10 11 12 13 14 15
Other
Car
Local bus, train, underground
School bus
Cycled
Walked most or all the way
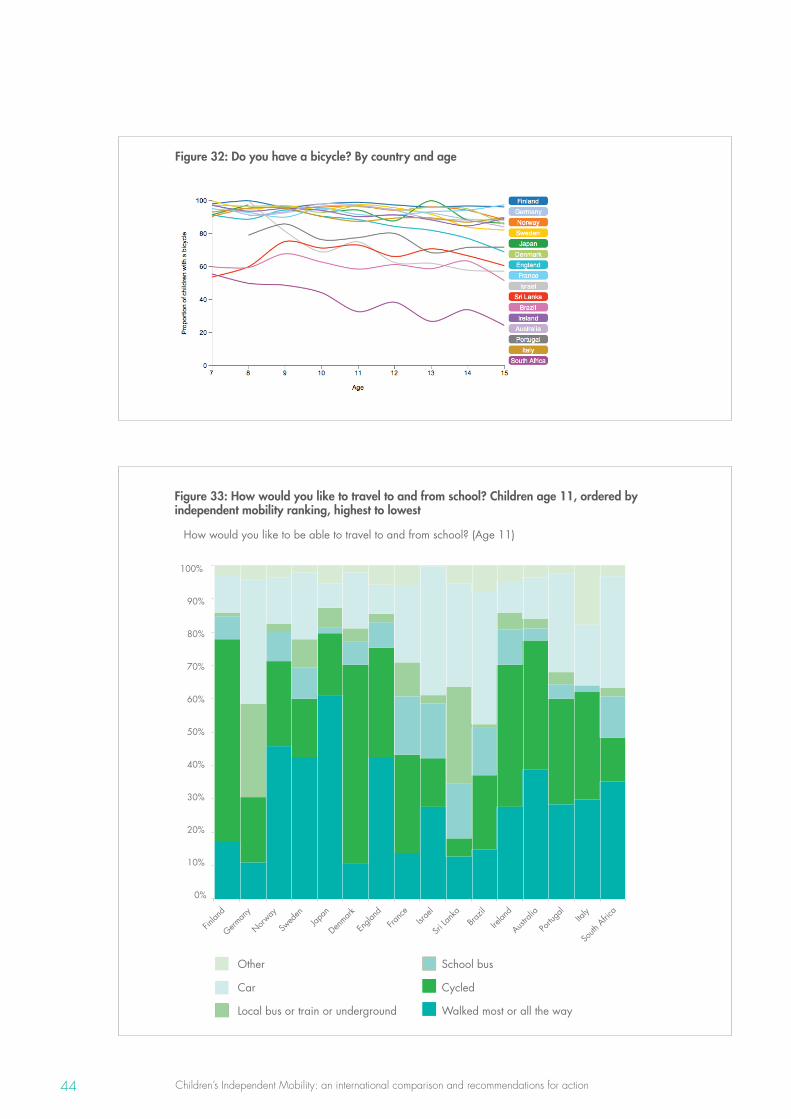
Children’s Independent Mobility: an international comparison and recommendations for action44
Figure 32: Do you have a bicycle? By country and age
Figure 33: How would you like to travel to and from school? Children age 11, ordered by independent mobility ranking, highest to lowest
0%
10%
20%
30%
40%
50%
60%
70%
80%
90%
100%
Finlan
d
German
y
Norway
Swed
en
Japan
Denmark
Engla
nd
Franc
e
Israe
l
Sri La
nka
Brazil
Irelan
d
Austral
ia
Portu
gal
Italy
South
Afric
a
How would you like to be able to travel to and from school? (Age 11)
Other
Car
Local bus or train or underground
School bus
Cycled
Walked most or all the way
Children’s Independent Mobility: an international comparison and recommendations for action45
Summary of survey findings and key highlights
We have observed that:
• Significant restrictions are placed on the independent mobility of children across all the ages studied (7–15-year-olds). Restrictions are greatest for children under 11 but even the oldest children are restricted in what they are allowed to do, at an age when many of the rights of adulthood are close to being granted, including the right to drive vehicles on the road once the test has been passed.
• Gender differences coincide with differences in mobility levels in less than 10 per cent of all possible country-indicator pairings. Where these are significant, boys are more likely to enjoy higher levels of independent mobility – aside from in France, where girls report being more likely to be allowed to cross main roads alone. Of the countries surveyed, Italy performs worst with regard to gender differences, with boys granted greater independent mobility than girls in five of the nine indicator questions.
• Some differences in the factors affecting children’s independent mobility may be less easy to address than others (daylight hours, geographical constraints and social norms/traditions).
• For policy-makers seeking to improve children’s independent mobility, the results provide some evidence to recommend further exploring the role of improving speed law enforcement and providing local authorities with the flexibility to set lower speed limits. In practice, lowering speed limits adds only a few minutes to journeys by motorised means (Plowden and Hillman, 1996).
• Mobile phone and car ownership are not on their own significant factors in the granting of independent mobility rights in the majority of countries surveyed.
• (Dis)trust thy neighbour: one might expect adults who trust others in their neighbourhood to look out for their child would grant a higher level of independent mobility to their child. Our results show no correlation between adults’ trust in other adults in their neighbourhood to look out for their children and the ranking of independent mobility granted between the different country samples. However, there was a slight correlation between distrust of people in the neighbourhood, or a perception of ‘stranger danger’, and a reduction in the level of independent mobility between country samples.
• The multiple correlations between road traffic issues (eg death rates, parental fears, speed enforcement) and independent mobility suggest this ought to be one of the key areas of focus for the concerned policy-maker.
Children’s Independent Mobility: an international comparison and recommendations for action46
• Children’s independent mobility varies between countries, with predominantly northern European countries and Japan at the top of our ranking.
• There is a wide variation in the mode of travel children use to get to school by country and age with some countries having high levels of walking to school, and others being based on cars, school bus or public transport. There is a weak correlation between travel to school by car and low levels of overall independent mobility. Bicycles are hardly used at all on the journey to school except for Finland and Denmark.
In the following sections we move on to the issue of how to respond to the observed levels of children’s independent mobility, further considering the survey data and bringing in wider relevant evidence from the literature and practice.
Children’s Independent Mobility: an international comparison and recommendations for action47
The survey findings presented in the previous section of this report show that children’s independent mobility varies widely across the 16 countries studied. It is clear, however, that significant restrictions are placed on children’s independent mobility in nearly all the countries.
What is the trend in children’s independent mobility over time?
The surveys reported above give us a snapshot of the levels of children’s independent mobility in each country surveyed. However, they only allow a limited indication of the trend over time. This is obtained by comparison of children’s responses with the age parents say they were allowed to travel about their neighbourhood alone as a child.
On this basis, an increase in the age of granting of independent mobility over time between the parent’s childhood and their child’s is noted in country reports including especially from Australia, Brazil, Finland, Ireland, and Italy. This points to a widespread drop in independent mobility over time. Caveats about the rigour of these comparisons are made in the individual reports and the drop is not necessarily universal. For example, the surveys in Israel report a lowering in the age of granting independent mobility between the parent’s childhood and their child’s, i.e. an increase in independent mobility in both Arab and Jewish communities, and in Japan little change has taken place between parents and their children.
More reliably, a significant decline in children’s independent mobility in recent decades can be observed from surveys conducted in England, Germany and Sweden. These include for primary school aged children (7- to 11-years-old) the findings of the surveys conducted in England in 1971 (Hillman et al., 1973, 1976) and England and Germany in 1990 and 2010 (Hillman et al., 1990, Shaw et al., 2013) as shown in Table 8 and in Sweden, for children 7- to 9-years old, between 1981 and 2012 (Björklid and Gummesson, 2013) as shown in Table 9.
4 How should we respond to the observed levels of children’s independent mobility?
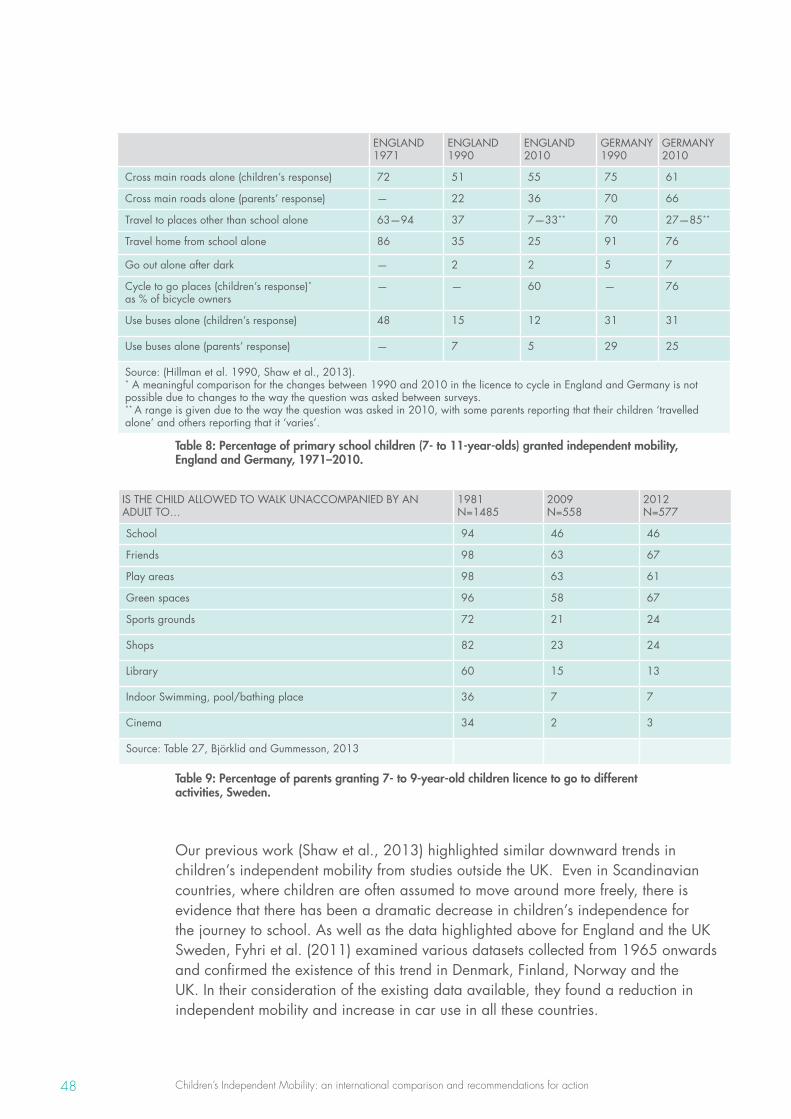
Children’s Independent Mobility: an international comparison and recommendations for action48
IS THE CHILD ALLOWED TO WALK UNACCOMPANIED BY AN ADULT TO…
1981N=1485
2009 N=558
2012N=577
School 94 46 46
Friends 98 63 67
Play areas 98 63 61
Green spaces 96 58 67
Sports grounds 72 21 24
Shops 82 23 24
Library 60 15 13
Indoor Swimming, pool/bathing place 36 7 7
Cinema 34 2 3
Source: Table 27, Björklid and Gummesson, 2013
Table 9: Percentage of parents granting 7- to 9-year-old children licence to go to different activities, Sweden.
Our previous work (Shaw et al., 2013) highlighted similar downward trends in children’s independent mobility from studies outside the UK. Even in Scandinavian countries, where children are often assumed to move around more freely, there is evidence that there has been a dramatic decrease in children’s independence for the journey to school. As well as the data highlighted above for England and the UK Sweden, Fyhri et al. (2011) examined various datasets collected from 1965 onwards and confirmed the existence of this trend in Denmark, Finland, Norway and the UK. In their consideration of the existing data available, they found a reduction in independent mobility and increase in car use in all these countries.
ENGLAND 1971
ENGLAND 1990
ENGLAND 2010
GERMANY 1990
GERMANY 2010
Cross main roads alone (children’s response) 72 51 55 75 61
Cross main roads alone (parents’ response) — 22 36 70 66
Travel to places other than school alone 63 —94 37 7—33** 70 27—85**
Travel home from school alone 86 35 25 91 76
Go out alone after dark — 2 2 5 7
Cycle to go places (children’s response)* as % of bicycle owners
— — 60 — 76
Use buses alone (children’s response) 48 15 12 31 31
Use buses alone (parents’ response) — 7 5 29 25
Source: (Hillman et al. 1990, Shaw et al., 2013). * A meaningful comparison for the changes between 1990 and 2010 in the licence to cycle in England and Germany is not possible due to changes to the way the question was asked between surveys.** A range is given due to the way the question was asked in 2010, with some parents reporting that their children ‘travelled alone’ and others reporting that it ‘varies’.
Table 8: Percentage of primary school children (7- to 11-year-olds) granted independent mobility, England and Germany, 1971–2010.
Children’s Independent Mobility: an international comparison and recommendations for action49
Given these declining and low levels of children’s independent mobility, and the compelling reasons presented in the introduction for taking action to improve it, we consider in the following sections the factors affecting children’s independent mobility and the options for increasing it.
What is it that is restricting children’s independent mobility?
Increasing levels of children’s independent mobility requires action to address the many factors that affect whether parents grant their children independent mobility. In this section we briefly collate what is known about factors that affect children’s independent mobility from the international surveys and wider literature.
Our previous work in this area (Shaw et al., 2013) highlighted the factors accounting for changes in levels of children’s independent mobility through a literature review. This revealed a complex interaction of factors relating to the attributes of children and their parents, the external environment in which they live, and the cultural and social factors affecting attitudes and behaviour. As such, there is a wide range of literature relevant to the topic, with factors varying in importance in different studies and settings.
For example, Johansson’s (2006) study of children’s organised leisure travel used Kuller’s (1991) Human-Environment Interaction (HEI) model to explore the relationship between environmental, social, individual and child factors, and the outcome of the parents’ attitudes and mode choice or ‘basic emotional process’. The study revealed a trend towards children being driven to places by parents in southern Sweden and a preference amongst parents for driving the children on leisure journeys rather than allowing independent travel.
More generally, as would be expected, a key variable of independent mobility is age. Traffic danger is also consistently cited by parents as a barrier to the granting of independent mobility (eg Hillman, et al., 1990; Lynch, 1977; Karsten et al., 2002; Johansson, 2006; Shaw et al., 2013; and Zwerts et al., 2010).
Other factors cited as influencing the degree of independent mobility include:
• living in urban areas, with higher population density and connectivity/accessibility of destinations having a positive effect,
• gender, with boys often, but not always, being more independently mobile than girls,
• proximity of desired destinations,
Children’s Independent Mobility: an international comparison and recommendations for action50
• parental behaviour and attitudes,
• socio-economic status and household car ownership,
• ‘stranger danger’ (more usefully framed in some sources as ‘social fear’), and, the strength of community relations.
Parents may also not grant their children independent mobility because to do so would be to risk displaying poor parenting skills and associated perceived or real social censure (Dowling, 2000; Dyck, 1990; Sanger, 1995, cited in Collins and Kearns, 2001).
A survey by Play England (2013) for Playday 2013 on the barriers to children playing outside where they live illustrates this point. As well as concerns expressed about traffic (53 per cent of parents) and stranger danger (40 per cent), 28 per cent of the parents surveyed expressed fear of being judged by neighbours if they let their children play unsupervised outdoors, while almost a third (32 per cent) believed allowing their children to play ball games or make noise outdoors would cause problems with neighbours. Social norms may therefore be a powerful mechanism acting against children being granted independent mobility even when the levels of risk or the child’s capabilities to negotiate the external environmental alone would seem to warrant allowing them to travel unsupervised.
Much of the reduction in children travelling independently may be due to increased car use by parents (for example, Fotel and Thomsen, 2004, Fyhri et al., 2011). Additionally, increased car dependency – by preference and/or need – has led to the loss of many local facilities. This in turn means longer distances need to be travelled to access more distant ones, which is another factor of concern for parents in granting their children the permission to travel alone (Fyhri and Hjorthol, 2009; Fyhri et al., 2011, Zwerts et al., 2010).
Changes in lifestyles, adult employment practices, the nature of children’s play and the development of new technologies for play and communication between parents and children are also cited as having an impact on levels of independent mobility (Fyrhi et al., 2011; Mackett, 2013). The shift from informal play to children’s involvement in structured and organised activities, with a driver of this being the increased employment of both of a child’s parents, and the role of the car in managing time-pressured, geographical dispersed lifestyles, are examples of these social and lifestyle changes (Fyhri et al., 2011).
Children’s Independent Mobility: an international comparison and recommendations for action51
Factors affecting independent mobility derived from the surveysThe survey methodology used in this project allows for some exploration of the factors accounting for children’s independent mobility. When all the countries surveyed were analysed together, only weak relationships were observed between levels of independent mobility and individual factors that might account for them. At the country level many of the factors indicated above correlated with the levels of independent mobility observed. Big variations are seen between the individual areas surveyed within each country but only limited detail could be extracted from the survey analysis. Infrastructure and external environmental factors are cited frequently in country reports as affecting independent mobility but not as the exclusive factor of importance. Traffic is the main concern of parents across the surveys whereas children are less concerned by traffic and more worried about strangers. The degree to which this is reported across the individual countries, namely that children appear fearful of strangers, is striking. The South African surveys, which selected schools on the basis of location and neighbourhood affluence, found that independent mobility varied considerably between wealthy and poor households, and across age and gender. These findings are reported in Behrens and Muchaka (2011).
Children’s independent mobility clearly varies widely and is affected by a range of factors. How should policy-makers and communities use this knowledge to respond to the challenge of increasing children’s independent mobility?
Existing policy and actions affecting children’s independent mobility
To address the question of what policy-makers and other actors could do to increase children’s independent mobility, we conducted a review of evidence of the range of policies and actions to improve children’s independent mobility that have been implemented by public authorities, international organisations and non-governmental organisations.
Examples of interventions intended to address children’s independent mobility were sought through the internet, literature and database searches and the personal knowledge of the research teams. Sources included primary materials produced during the interventions and secondary sources reporting on the initiatives such as grey literature and peer-reviewed journals.
The apparent paucity of material explicitly focusing on interventions to improve children’s independent mobility (however it is phrased or framed) meant that our search was extended to cover more general terms related to children’s autonomy and their engagement in activities such as, playing, walking, cycling etc. outside without, or with only minimal, adult supervision. We also looked for examples intended to address the factors highlighted above, such as the external environment and traffic. The review was not meant to be comprehensive, since a wealth of policies, programmes, initiatives and campaigns have been implemented worldwide, the review of which was beyond the resources available.
Children’s Independent Mobility: an international comparison and recommendations for action52
On the basis of the interventions we have considered, approaches to enabling children’s independent mobility can be grouped into four main categories:
1. Urban planning and development These interventions use planning and development processes to make urban environments more child-friendly and enable independent mobility. They vary in scale from single housing estates or streets, for example, the Dutch ‘Woonerven’ home zones and UK equivalents such as Gun Wharf Home Zone12, Plymouth, UK, to wider city areas such as Rotterdam and Vancouver (see Box 1 and Box 2 below) or even multi-city approaches, for example, those under the UN’s Child Friendly City initiative (see Box 3 and Box 6). They consider the design of the public realm holistically, including the allocation of space to different uses and transport modes, and making the housing and streetscape people and child-friendly so that children’s activities can easily be supervised. The needs of different population groups and communities are accommodated, for example Children Tracks, Norway (Box 4). There is often a move away from the conventional zoning of children’s play space into defined areas, based on the premise that children will want to and should be able to play anywhere, for example Play Happens Everywhere in Vauban, Germany (Box 7). They can involve planning processes led by local authorities or utilise more innovative approaches to the involvement of communities and children. The latter are as much about refreshing the democratic process of shaping a city’s future as they are about narrowly defined planning, development or transport initiatives.
2. Children’s mobility programmesThese initiatives aim to incentivise and enable children’s mobility – accompanied and unaccompanied – on foot, bicycle and public transport. Examples include Mobility Management Plans in Austria (Box 5)‘, the travel theme of the Green Schools and Eco Schools Initiatives on the island of Ireland13 and Sustrans in the UK14. Typically involving local authorities, schools and parents, they combine measures to enable children to have mobility, initially accompanied by adults, but gradually developing into greater individual autonomy. They include combinations of activities to get about on foot, bike or public transport with and without adults, road safety training and also processes to identify and remove particular parental concerns and barriers to independent mobility, for example, dangerous or absent road crossings, lack of traffic calming and so on. Although non-school travel is addressed by some, these initiatives largely tend to focus on the school journey and overlook the wider, and important, need of children to be able to get about their local area alone, for example, to visit friends, get to local amenities or just play in the street.
12 For details of the Gun Wharf Home Zone see: udc.homesandcommunities.co.uk/urban-design-compendium?page_id=4071&page=181
13 For details see greenschoolsireland.org/themes/travel.197.html14 For details see sustrans.org.uk
Children’s Independent Mobility: an international comparison and recommendations for action53
3. Education and guidance on road safety and sustainable mobility These initiatives focus on raising awareness of road safety issues and sustainable mobility options with children to equip them with the skills to be safe when travelling or playing in the local area. Guidance and advice is also provided to institutions working with children on how to promote road safety and enable sustainable mobility. There is an overlap with the previous category of children’s mobility programmes. However, these education, awareness and guidance initiatives are more limited. They have a greater focus on marketing materials, communications and in-class learning rather than practical learning by experience. Where practical training is provided it tends to be off public roads in traffic-free environments, rather than training children to deal with the real roads, routes and traffic conditions they need to tackle to get about their local area.
4. Campaigns and events These initiatives run by NGOs, communities or local government involve actions to challenge and catalyse change in public attitudes and behaviours to children’s independent mobility and play. Examples in the UK include Playing Out (Box 8), Play England’s Playday15, and Living Streets Walk Once a Week campaign16 and in Europe the ZOOM campaign17. They can be annual, monthly or more frequent events and focus on promoting and enabling children to travel or play outside alone. They have similarities and overlaps with the mobility initiatives and education categories above but involve broader public communication and awareness raising activities. One-off activities often involve temporary reallocation of road space and the removal or restriction of traffic on roads to demonstrate how this enables children to have greater independence, better opportunities for play and/or make streets more sociable places for the communities that live in them.
There are overlaps between these four categories and sometimes an initiative could fall in one or more of them. Some are focused on policies intended to shape the physical environment and the pattern of traffic within it. Others are intended to affect children’s and adults’ perception of the local environment and modes of transport that are appropriate. Others are aimed at equipping children and parents with the skills they need to get about safely or incentivising those activities.
Further details and examples of the initiatives we have examined are given in a separate working paper Appendix III. Working Paper: Policies and actions to enable Children’s Independent Mobility. Below we make some observations on the overall nature of interventions affecting children’s independent mobility and highlight some of the approaches we consider most interesting.
15 See playday.org.uk for details.16 See livingstreets.org.uk/walk-with-us/walk-to-school/primary-schools/walk-once-a-week for details.17 See zoom-kidsforclimate.eu for details.
Children’s Independent Mobility: an international comparison and recommendations for action54
What can we learn from existing interventions on children’s independent mobility?
Encouragement can be drawn from the best initiatives…The best initiatives we have found focus on transforming urban environments to enable children’s independence and development, as part of a wider programme of social, environmental and economic development. The authorities in Rotterdam and Vancouver, for example, realised that creating the conditions in which families wished to bring up children was central to the regeneration and development of their cities (see Box 1 and Box 2). They consequently implemented large-scale, multi-year programmes to become child-friendly cities which included enabling independent mobility through coordinated and widespread measures. As planners in Vancouver realised when working on the regeneration of its Downtown Peninsula, ‘If you design places that work well for children, they seem to work well for everyone’ (Beasley, 2009).
The Child Friendly Cities Initiative launched by Unicef and UN-Habitat intended to put children at the heart of the urban agenda and is the process developed for local government to implement the UN Convention on the Rights of the Child (Box 3).
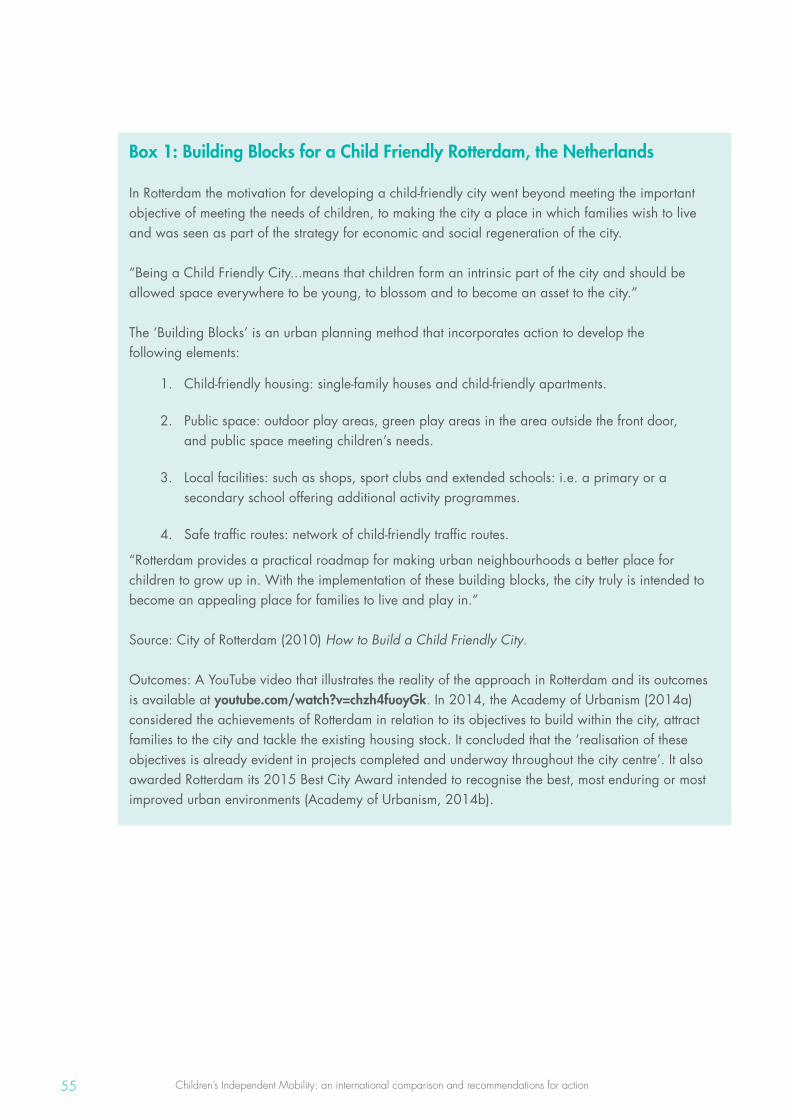
Children’s Independent Mobility: an international comparison and recommendations for action55
Box 1: Building Blocks for a Child Friendly Rotterdam, the Netherlands In Rotterdam the motivation for developing a child-friendly city went beyond meeting the important objective of meeting the needs of children, to making the city a place in which families wish to live and was seen as part of the strategy for economic and social regeneration of the city.
“Being a Child Friendly City...means that children form an intrinsic part of the city and should be allowed space everywhere to be young, to blossom and to become an asset to the city.”
The ‘Building Blocks’ is an urban planning method that incorporates action to develop the following elements:
1. Child-friendly housing: single-family houses and child-friendly apartments.
2. Public space: outdoor play areas, green play areas in the area outside the front door, and public space meeting children’s needs.
3. Local facilities: such as shops, sport clubs and extended schools: i.e. a primary or a secondary school offering additional activity programmes.
4. Safe traffic routes: network of child-friendly traffic routes.
“Rotterdam provides a practical roadmap for making urban neighbourhoods a better place for children to grow up in. With the implementation of these building blocks, the city truly is intended to become an appealing place for families to live and play in.”
Source: City of Rotterdam (2010) How to Build a Child Friendly City.
Outcomes: A YouTube video that illustrates the reality of the approach in Rotterdam and its outcomes is available at youtube.com/watch?v=chzh4fuoyGk. In 2014, the Academy of Urbanism (2014a) considered the achievements of Rotterdam in relation to its objectives to build within the city, attract families to the city and tackle the existing housing stock. It concluded that the ‘realisation of these objectives is already evident in projects completed and underway throughout the city centre’. It also awarded Rotterdam its 2015 Best City Award intended to recognise the best, most enduring or most improved urban environments (Academy of Urbanism, 2014b).
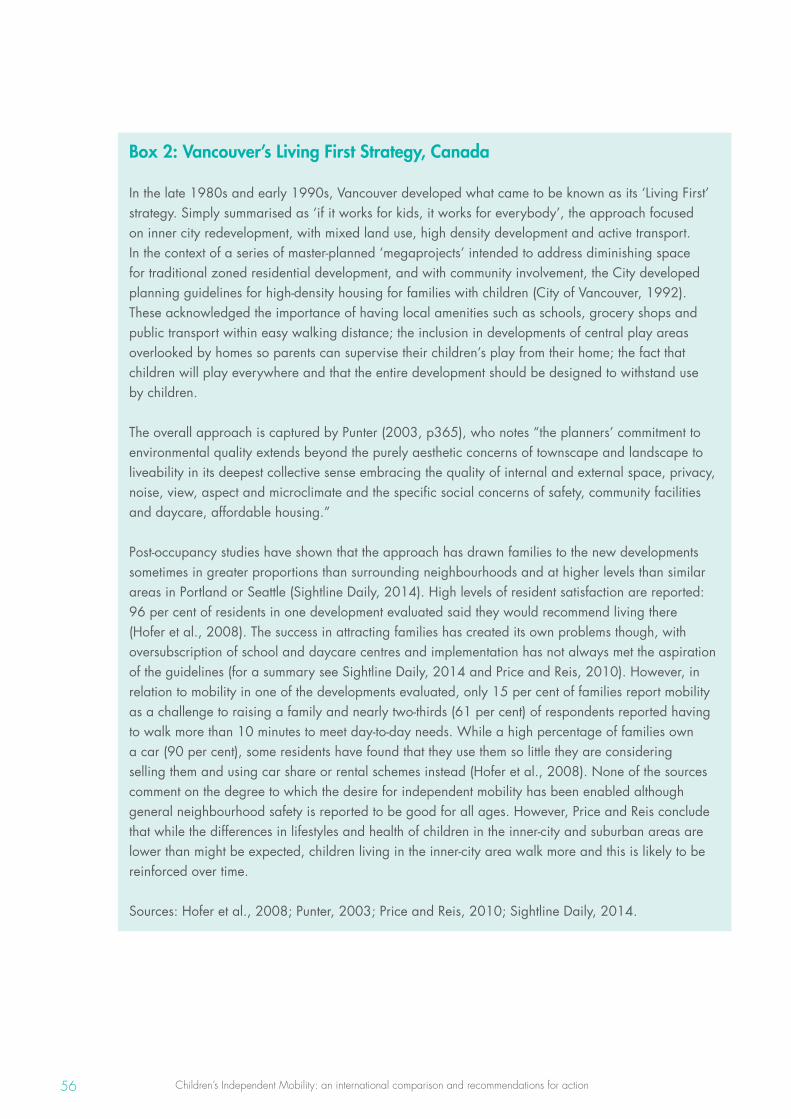
Children’s Independent Mobility: an international comparison and recommendations for action56
Box 2: Vancouver’s Living First Strategy, Canada
In the late 1980s and early 1990s, Vancouver developed what came to be known as its ‘Living First’ strategy. Simply summarised as ‘if it works for kids, it works for everybody’, the approach focused on inner city redevelopment, with mixed land use, high density development and active transport. In the context of a series of master-planned ‘megaprojects’ intended to address diminishing space for traditional zoned residential development, and with community involvement, the City developed planning guidelines for high-density housing for families with children (City of Vancouver, 1992). These acknowledged the importance of having local amenities such as schools, grocery shops and public transport within easy walking distance; the inclusion in developments of central play areas overlooked by homes so parents can supervise their children’s play from their home; the fact that children will play everywhere and that the entire development should be designed to withstand use by children.
The overall approach is captured by Punter (2003, p365), who notes “the planners’ commitment to environmental quality extends beyond the purely aesthetic concerns of townscape and landscape to liveability in its deepest collective sense embracing the quality of internal and external space, privacy, noise, view, aspect and microclimate and the specific social concerns of safety, community facilities and daycare, affordable housing.”
Post-occupancy studies have shown that the approach has drawn families to the new developments sometimes in greater proportions than surrounding neighbourhoods and at higher levels than similar areas in Portland or Seattle (Sightline Daily, 2014). High levels of resident satisfaction are reported: 96 per cent of residents in one development evaluated said they would recommend living there (Hofer et al., 2008). The success in attracting families has created its own problems though, with oversubscription of school and daycare centres and implementation has not always met the aspiration of the guidelines (for a summary see Sightline Daily, 2014 and Price and Reis, 2010). However, in relation to mobility in one of the developments evaluated, only 15 per cent of families report mobility as a challenge to raising a family and nearly two-thirds (61 per cent) of respondents reported having to walk more than 10 minutes to meet day-to-day needs. While a high percentage of families own a car (90 per cent), some residents have found that they use them so little they are considering selling them and using car share or rental schemes instead (Hofer et al., 2008). None of the sources comment on the degree to which the desire for independent mobility has been enabled although general neighbourhood safety is reported to be good for all ages. However, Price and Reis conclude that while the differences in lifestyles and health of children in the inner-city and suburban areas are lower than might be expected, children living in the inner-city area walk more and this is likely to be reinforced over time.
Sources: Hofer et al., 2008; Punter, 2003; Price and Reis, 2010; Sightline Daily, 2014.
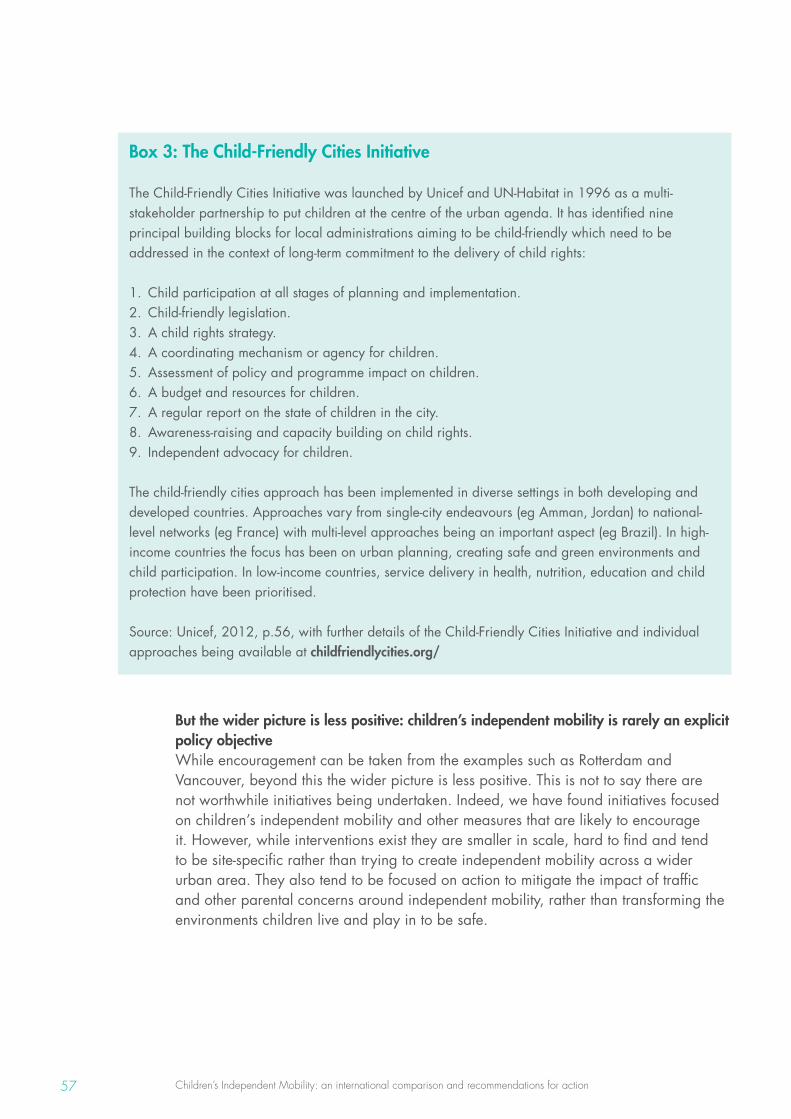
Children’s Independent Mobility: an international comparison and recommendations for action57
Box 3: The Child-Friendly Cities Initiative
The Child-Friendly Cities Initiative was launched by Unicef and UN-Habitat in 1996 as a multi-stakeholder partnership to put children at the centre of the urban agenda. It has identified nine principal building blocks for local administrations aiming to be child-friendly which need to be addressed in the context of long-term commitment to the delivery of child rights:
1. Child participation at all stages of planning and implementation.2. Child-friendly legislation.3. A child rights strategy. 4. A coordinating mechanism or agency for children.5. Assessment of policy and programme impact on children.6. A budget and resources for children.7. A regular report on the state of children in the city.8. Awareness-raising and capacity building on child rights.9. Independent advocacy for children.
The child-friendly cities approach has been implemented in diverse settings in both developing and developed countries. Approaches vary from single-city endeavours (eg Amman, Jordan) to national-level networks (eg France) with multi-level approaches being an important aspect (eg Brazil). In high-income countries the focus has been on urban planning, creating safe and green environments and child participation. In low-income countries, service delivery in health, nutrition, education and child protection have been prioritised.
Source: Unicef, 2012, p.56, with further details of the Child-Friendly Cities Initiative and individual approaches being available at childfriendlycities.org/
But the wider picture is less positive: children’s independent mobility is rarely an explicit policy objectiveWhile encouragement can be taken from the examples such as Rotterdam and Vancouver, beyond this the wider picture is less positive. This is not to say there are not worthwhile initiatives being undertaken. Indeed, we have found initiatives focused on children’s independent mobility and other measures that are likely to encourage it. However, while interventions exist they are smaller in scale, hard to find and tend to be site-specific rather than trying to create independent mobility across a wider urban area. They also tend to be focused on action to mitigate the impact of traffic and other parental concerns around independent mobility, rather than transforming the environments children live and play in to be safe.
Children’s Independent Mobility: an international comparison and recommendations for action58
In our search for case studies very few interventions were identified where children’s independent mobility was cited as an objective. Yet, there is a wealth of cases in which children’s independent mobility could result from the initiatives and programmes addressing children’s mobility, access to play space, well-being or as part of broader urban renewal projects. However, we see little evidence that children’s independent mobility, the justifications for it and actions required to enable it feature widely or highly in policy-makers’ considerations and priorities. Children’s independent mobility could be a powerful unifying theme and a measure of success for a whole suite of activities aiming to improve urban environments.
There is a lack of integration of policy and action at different levelsMost of the initiatives we have identified that may affect children’s independent mobility operate at the local level and are delivered through combinations of actions from local authorities, schools, police, NGOs, and parents. We have only seen a few examples in which the national policy framework is intentionally supportive of local actions on children’s independent mobility. These cases include the Children’s Tracks programme in Norway (Box 4) and Mobility Management Plans in Austria (Box 5).
At a national level, children’s independent mobility can benefit from an explicit and coordinated policy framework aimed at improving general living conditions, the well-being of children and the policies for transport, land use planning, health, education and policing. Conversely, it is interesting to consider how few policies pursued by government are actually appraised for their impact on children. A review of the impact of national policy frameworks and their level of support, whether positive or negative, for children’s independent mobility is beyond the scope of this project. However, it would be interesting to explore how national policies are appraised for their impact on children. How do policy-makers enable the development and protection of children’s needs and desires? Much stronger coordination by national policy and policy appraisal systems would seem to be necessary.
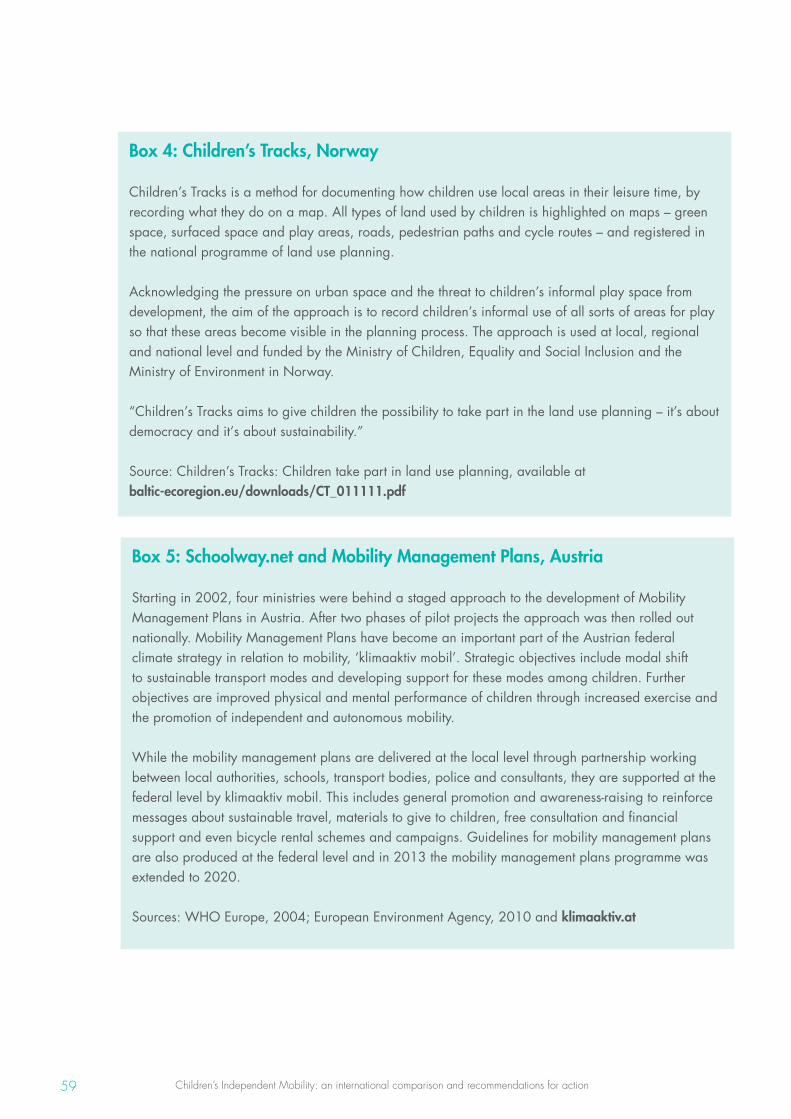
Children’s Independent Mobility: an international comparison and recommendations for action59
Box 4: Children’s Tracks, Norway
Children’s Tracks is a method for documenting how children use local areas in their leisure time, by recording what they do on a map. All types of land used by children is highlighted on maps – green space, surfaced space and play areas, roads, pedestrian paths and cycle routes – and registered in the national programme of land use planning.
Acknowledging the pressure on urban space and the threat to children’s informal play space from development, the aim of the approach is to record children’s informal use of all sorts of areas for play so that these areas become visible in the planning process. The approach is used at local, regional and national level and funded by the Ministry of Children, Equality and Social Inclusion and the Ministry of Environment in Norway.
“Children’s Tracks aims to give children the possibility to take part in the land use planning – it’s about democracy and it‘s about sustainability.”
Source: Children’s Tracks: Children take part in land use planning, available at baltic-ecoregion.eu/downloads/CT_011111.pdf
Box 5: Schoolway.net and Mobility Management Plans, Austria
Starting in 2002, four ministries were behind a staged approach to the development of Mobility Management Plans in Austria. After two phases of pilot projects the approach was then rolled out nationally. Mobility Management Plans have become an important part of the Austrian federal climate strategy in relation to mobility, ‘klimaaktiv mobil’. Strategic objectives include modal shift to sustainable transport modes and developing support for these modes among children. Further objectives are improved physical and mental performance of children through increased exercise and the promotion of independent and autonomous mobility.
While the mobility management plans are delivered at the local level through partnership working between local authorities, schools, transport bodies, police and consultants, they are supported at the federal level by klimaaktiv mobil. This includes general promotion and awareness-raising to reinforce messages about sustainable travel, materials to give to children, free consultation and financial support and even bicycle rental schemes and campaigns. Guidelines for mobility management plans are also produced at the federal level and in 2013 the mobility management plans programme was extended to 2020.
Sources: WHO Europe, 2004; European Environment Agency, 2010 and klimaaktiv.at
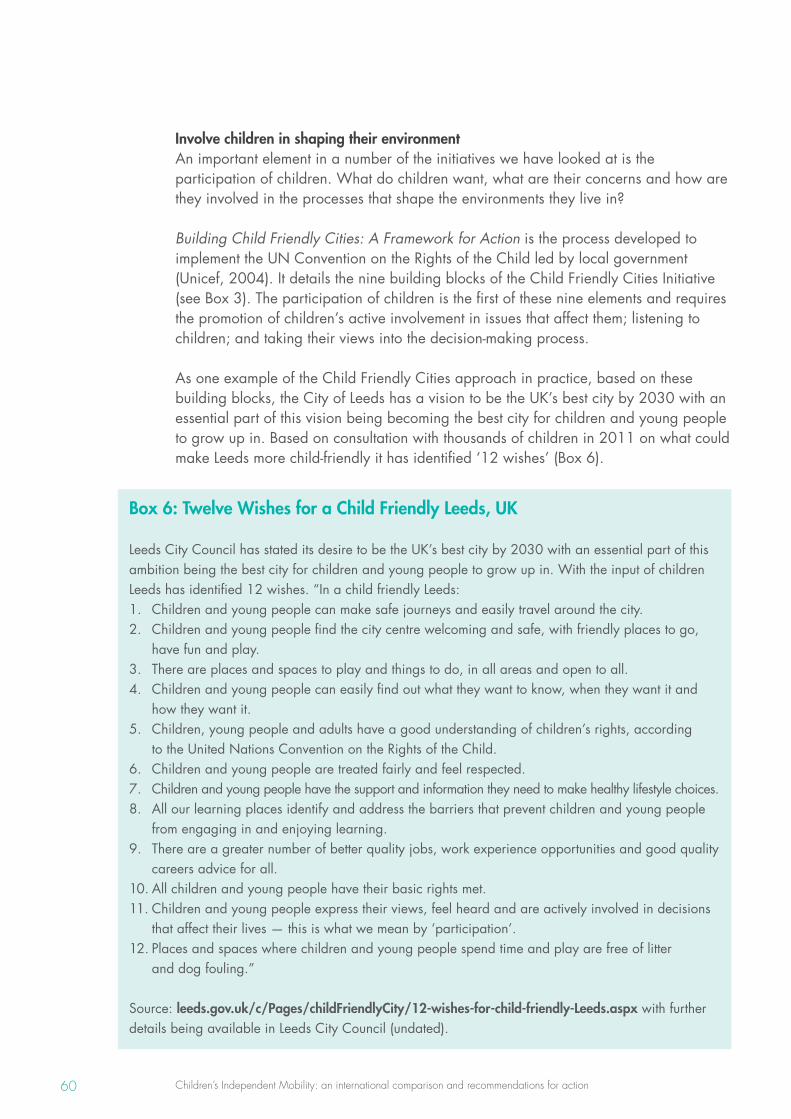
Children’s Independent Mobility: an international comparison and recommendations for action60
Involve children in shaping their environment An important element in a number of the initiatives we have looked at is the participation of children. What do children want, what are their concerns and how are they involved in the processes that shape the environments they live in?
Building Child Friendly Cities: A Framework for Action is the process developed to implement the UN Convention on the Rights of the Child led by local government (Unicef, 2004). It details the nine building blocks of the Child Friendly Cities Initiative (see Box 3). The participation of children is the first of these nine elements and requires the promotion of children’s active involvement in issues that affect them; listening to children; and taking their views into the decision-making process.
As one example of the Child Friendly Cities approach in practice, based on these building blocks, the City of Leeds has a vision to be the UK’s best city by 2030 with an essential part of this vision being becoming the best city for children and young people to grow up in. Based on consultation with thousands of children in 2011 on what could make Leeds more child-friendly it has identified ‘12 wishes’ (Box 6).
Box 6: Twelve Wishes for a Child Friendly Leeds, UK Leeds City Council has stated its desire to be the UK’s best city by 2030 with an essential part of this ambition being the best city for children and young people to grow up in. With the input of children Leeds has identified 12 wishes. “In a child friendly Leeds:1. Children and young people can make safe journeys and easily travel around the city.2. Children and young people find the city centre welcoming and safe, with friendly places to go,
have fun and play.3. There are places and spaces to play and things to do, in all areas and open to all.4. Children and young people can easily find out what they want to know, when they want it and
how they want it.5. Children, young people and adults have a good understanding of children’s rights, according
to the United Nations Convention on the Rights of the Child. 6. Children and young people are treated fairly and feel respected.7. Children and young people have the support and information they need to make healthy lifestyle choices.8. All our learning places identify and address the barriers that prevent children and young people
from engaging in and enjoying learning.9. There are a greater number of better quality jobs, work experience opportunities and good quality
careers advice for all.10. All children and young people have their basic rights met.11. Children and young people express their views, feel heard and are actively involved in decisions
that affect their lives — this is what we mean by ‘participation’.12. Places and spaces where children and young people spend time and play are free of litter
and dog fouling.” Source: leeds.gov.uk/c/Pages/childFriendlyCity/12-wishes-for-child-friendly-Leeds.aspx with further details being available in Leeds City Council (undated).
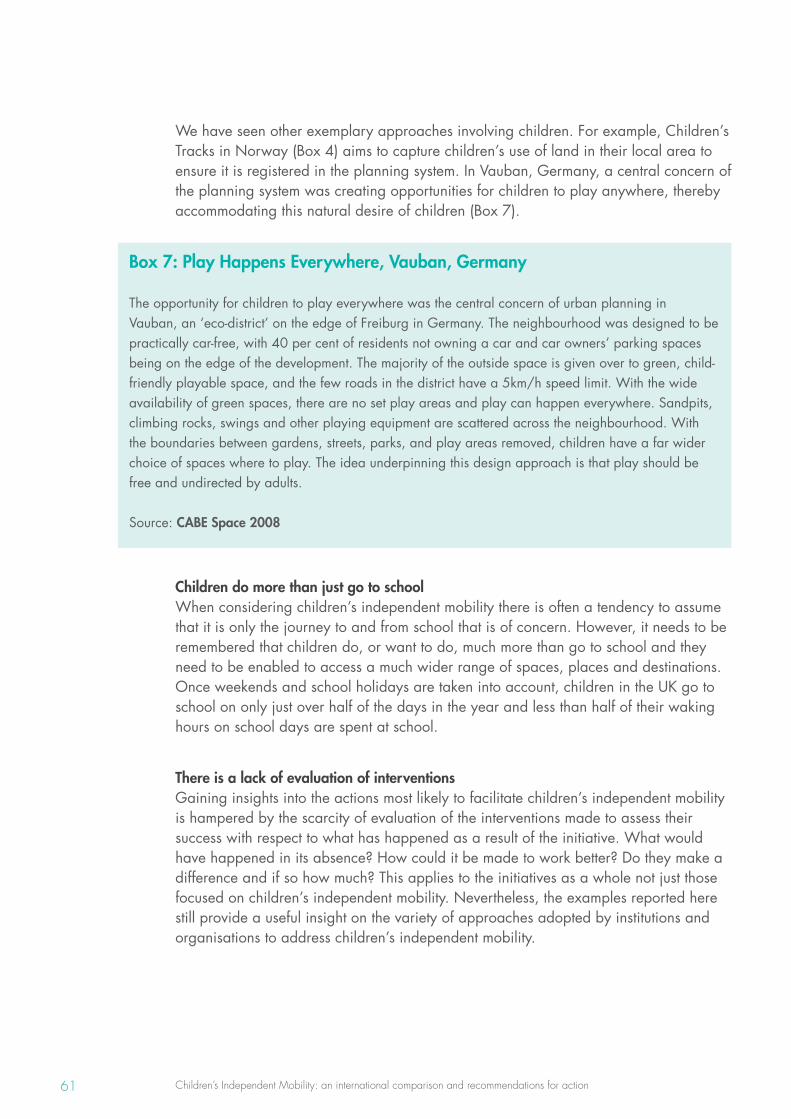
Children’s Independent Mobility: an international comparison and recommendations for action61
We have seen other exemplary approaches involving children. For example, Children’s Tracks in Norway (Box 4) aims to capture children’s use of land in their local area to ensure it is registered in the planning system. In Vauban, Germany, a central concern of the planning system was creating opportunities for children to play anywhere, thereby accommodating this natural desire of children (Box 7).
Box 7: Play Happens Everywhere, Vauban, Germany
The opportunity for children to play everywhere was the central concern of urban planning in Vauban, an ‘eco-district’ on the edge of Freiburg in Germany. The neighbourhood was designed to be practically car-free, with 40 per cent of residents not owning a car and car owners’ parking spaces being on the edge of the development. The majority of the outside space is given over to green, child-friendly playable space, and the few roads in the district have a 5km/h speed limit. With the wide availability of green spaces, there are no set play areas and play can happen everywhere. Sandpits, climbing rocks, swings and other playing equipment are scattered across the neighbourhood. With the boundaries between gardens, streets, parks, and play areas removed, children have a far wider choice of spaces where to play. The idea underpinning this design approach is that play should be free and undirected by adults.
Source: CABE Space 2008
Children do more than just go to schoolWhen considering children’s independent mobility there is often a tendency to assume that it is only the journey to and from school that is of concern. However, it needs to be remembered that children do, or want to do, much more than go to school and they need to be enabled to access a much wider range of spaces, places and destinations. Once weekends and school holidays are taken into account, children in the UK go to school on only just over half of the days in the year and less than half of their waking hours on school days are spent at school.
There is a lack of evaluation of interventionsGaining insights into the actions most likely to facilitate children’s independent mobility is hampered by the scarcity of evaluation of the interventions made to assess their success with respect to what has happened as a result of the initiative. What would have happened in its absence? How could it be made to work better? Do they make a difference and if so how much? This applies to the initiatives as a whole not just those focused on children’s independent mobility. Nevertheless, the examples reported here still provide a useful insight on the variety of approaches adopted by institutions and organisations to address children’s independent mobility.
Children’s Independent Mobility: an international comparison and recommendations for action62
Local action is building support for children’s independent mobility and play Many charities, NGOs, and activists with the help of schools, families and policy-makers have or are running one-off events or longer campaigns to promote and enable the right for children to travel or play alone while, at the same time, addressing parental concerns. These events might occur only once or be repeated on an annual, monthly or more frequent basis. In examining these activities we found a growing level of community activity and desire for action on a range of issues related to children’s lives, play and independent mobility.
These initiatives include promoting of independent travel either to school (for example, Living Streets Walk to School Campaign and Sustrans’ Campaign for Safer Streets, UK; Safe and Environmentally-friendly Ways to School, Limbourg, Belgium; Walk Safely to School Day, New South Wales, Australia) or incentivising children’s independent travel (ZOOM Campaign, Europe). Other initiatives have sought to raise awareness of dangers children incur in traffic (Big Danger for Small Road Users, Austria; Give us Some Space campaign, Geel, Belgium) which moves the focus from equipping the child with skills to be safe to encouraging drivers to drive responsibly and with consideration for children.
Independent play is another issue widely covered by campaigning activities mainly in urban environments (for example, One hundred streets to play, Italy; KidsSquare, Belfast18; Playday, UK19; Playing Out, Bristol (Box 8) and Play Streets, Hackney, UK20). There is an apparently burgeoning level of activity in the UK focusing on play and independence and broader links to the value of children’s play outside, and in natural environments, for instance, Outdoor Nation and Project Wild Thing21.
18 See belfasthealthycities.com/all-news/131-kids-square.html19 See playday.org.uk20 See hackney.gov.uk/play-streets.htm#.VMrPci7lPEY 21 See outdoornation.org.uk and projectwildthing.com
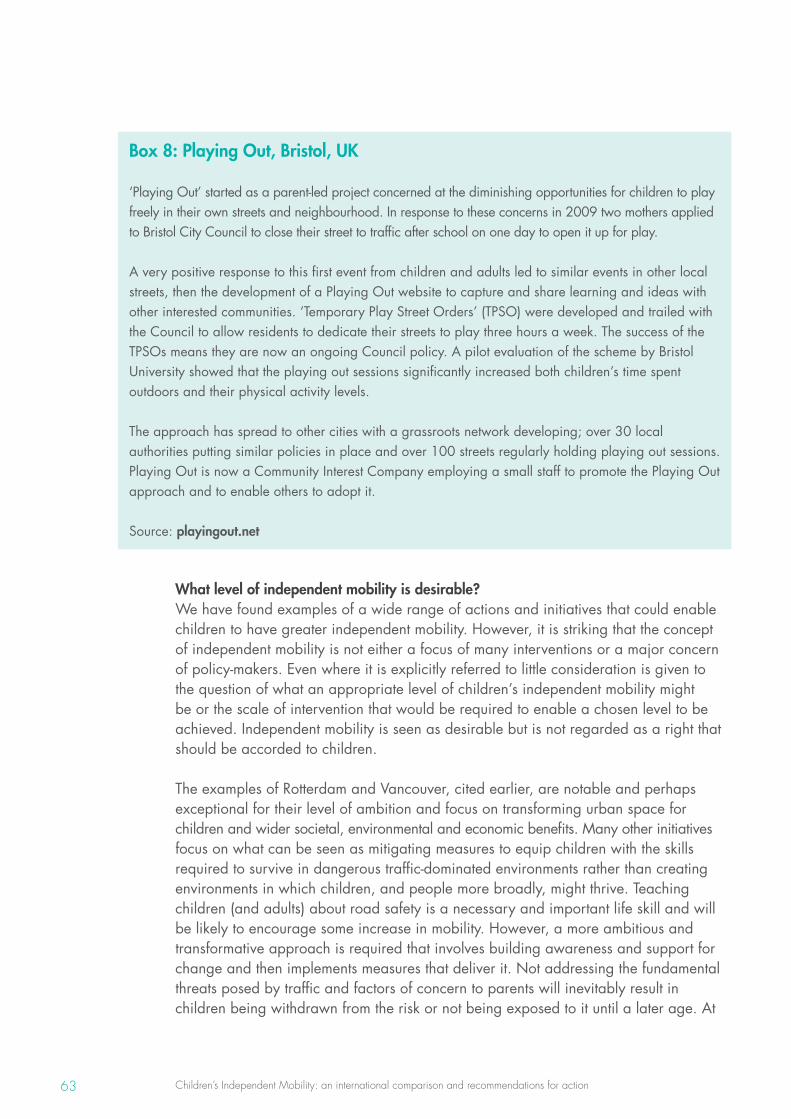
Children’s Independent Mobility: an international comparison and recommendations for action63
Box 8: Playing Out, Bristol, UK
‘Playing Out’ started as a parent-led project concerned at the diminishing opportunities for children to play freely in their own streets and neighbourhood. In response to these concerns in 2009 two mothers applied to Bristol City Council to close their street to traffic after school on one day to open it up for play.
A very positive response to this first event from children and adults led to similar events in other local streets, then the development of a Playing Out website to capture and share learning and ideas with other interested communities. ‘Temporary Play Street Orders’ (TPSO) were developed and trailed with the Council to allow residents to dedicate their streets to play three hours a week. The success of the TPSOs means they are now an ongoing Council policy. A pilot evaluation of the scheme by Bristol University showed that the playing out sessions significantly increased both children’s time spent outdoors and their physical activity levels.
The approach has spread to other cities with a grassroots network developing; over 30 local authorities putting similar policies in place and over 100 streets regularly holding playing out sessions. Playing Out is now a Community Interest Company employing a small staff to promote the Playing Out approach and to enable others to adopt it. Source: playingout.net
What level of independent mobility is desirable? We have found examples of a wide range of actions and initiatives that could enable children to have greater independent mobility. However, it is striking that the concept of independent mobility is not either a focus of many interventions or a major concern of policy-makers. Even where it is explicitly referred to little consideration is given to the question of what an appropriate level of children’s independent mobility might be or the scale of intervention that would be required to enable a chosen level to be achieved. Independent mobility is seen as desirable but is not regarded as a right that should be accorded to children.
The examples of Rotterdam and Vancouver, cited earlier, are notable and perhaps exceptional for their level of ambition and focus on transforming urban space for children and wider societal, environmental and economic benefits. Many other initiatives focus on what can be seen as mitigating measures to equip children with the skills required to survive in dangerous traffic-dominated environments rather than creating environments in which children, and people more broadly, might thrive. Teaching children (and adults) about road safety is a necessary and important life skill and will be likely to encourage some increase in mobility. However, a more ambitious and transformative approach is required that involves building awareness and support for change and then implements measures that deliver it. Not addressing the fundamental threats posed by traffic and factors of concern to parents will inevitably result in children being withdrawn from the risk or not being exposed to it until a later age. At
Children’s Independent Mobility: an international comparison and recommendations for action64
this later age they may be granted freedom to go out in more dangerous environments without having developed their ability to negotiate less dangerous environments.
With these observations in mind we make our recommendations for action to increase children’s independent mobility in the next section.
Children’s Independent Mobility: an international comparison and recommendations for action65
The international surveys we have reported on in this report show that low levels of children’s independent mobility are common, that the trend over time in many countries is downwards and that parents have significant concerns about letting their children go out alone. We have also shown that there are good reasons for taking action to increase children’s independent mobility for the developmental, health, social and well-being benefits it brings. Action is also justified on the basis of the rights to a safe environment a child should be able to enjoy. The links we have observed between children’s independent mobility, well-being and educational attainment are very striking (see Figure 13 and Figure 14).
Before presenting our recommendations we would like to highlight some general observations drawn from having examined this area in detail.
Unsafe environments for children are widely tolerated
We are struck by the apparent high-level of societal acceptance of unsafe environments in which children are expected to live and develop, largely owing not only to the speed and volume of traffic, but also from a reduction in the number of adult pedestrians able to keep an eye on children. Conversely we are struck that there is not a more widespread call to resolve this issue, especially so, given the high levels of concern parents have reported about the risks of injury from traffic. To a great extent, children’s rights to a safe environment seem to be considered less justified than allowing drivers to travel at speeds which are clearly not safe for others who are entitled to use the road. Where lower limits are set, enforcement is often weak and considered an unreasonable imposition on drivers or on police time22.
The benefits of children’s independent mobility such as improved, health, well-being and personal development, which are often long-term and sometimes hard to perceive, tend to be outweighed by parental concerns related to the more immediate and obvious real or perceived dangers associated with independent mobility presented by traffic, strangers and even other children, such as from bullying. The removal of children from the threat posed by traffic, in particular, becomes self-reinforcing with a cycle of fewer children being allowed out alone, more children being escorted – typically by car, resulting in more traffic, further increasing risks and consequently fewer children being allowed out alone.
5 Recommendations: where next for children’s independent mobility?
22 For example, the London Borough of Islington was the first in the UK to introduce a borough-wide 20mph limit in 2011 and initially struggled to get police agreement to enforce the limit (London Evening Standard, 2011). The police considered the 20mph limit should be ‘self-enforcing’ in line with the then guidance on speed enforcement from the Association of Chief Police Officers (ACPO). This guidance was updated in 2013 (ACPO, 2013) to indicate that 20mph limits would be enforced where appropriate signing of the limit and engineering measures are in place.
Children’s Independent Mobility: an international comparison and recommendations for action66
Withholding independent mobility may only defer risk
There may even be a perverse effect at play here. Withholding independent mobility at a young age may expose children to greater risk later in their childhood. The granting of gradually increasing independent mobility from an early age allows children to develop and consolidate skills of independent mobility over time as parents allow them and in progressively more complex environments. The delay in granting independent mobility may result in the exposure of children to greater risk when they are older. The transfer to secondary school with longer more complex journeys is often being allowed without children having gained the earlier experience to help them. In the UK a spike in pedestrian road casualties accompanies the move to secondary school23.
It is only a few years after many children have been granted independent mobility that they can drive motorised vehicles. Seventeen or eighteen is the typical age full driving licences are granted although some countries are lower than this. Notably the United States where it is possible to have a full licence at 16 years old in some states24, and New Zealand where the minimum driving age was increased from 15 to 16 in 2011 (the Guardian, 2011) with a full licence being possible from 16 years, six months. In Italy a moped can be ridden at 14 years old.
Action is needed to address parental concerns, road user behaviour, the physical environment, social and cultural factors
Traffic is not the only reinforcing factor at work of course. The role the media and press play in this issue in emphasising and downplaying particular risks and creating fear and social pressure for parents to act in certain ways is another self-reinforcing cycle. The danger, for example, posed by predatory strangers is consistently promoted by some parts of the media as a significant or growing threat to the children with evidence to suggest the public believe this to be the case (Gill, 2007). Yet statistics show children’s risk of being abducted or killed by strangers has not changed in decades (Silverman and Wilson, 2002, cited in Gill, 2007a25). Much greater risks are posed by traffic and people children know.
These issues were apparent in our previous work in this area (Shaw et al., 2013) in which a polarisation could be observed between those wishing to see a society in which children’s independent mobility should be significantly increased on one hand and, on the other, those who see letting children out alone as dangerous and irresponsible and even the curtailment of children’s freedom as a necessary enabler of the wider benefits of
23 In the UK the annual number of killed and seriously injured child pedestrians (up to age 16) peaks at age 11 and 12 for the journey to and from school (Department for Transport, 2014a) and overall the 12- to15-years-old grouping having the highest pedestrian killed and seriously injured rate (Department for Transport, 2014b).
24 For example, in Idaho a full licence can be granted at 16 and 15 year olds can drive alone during daylight hours (Idaho Transportation Department, 2014).
25 This is one issue Gill (2007) explores in a broader consideration of the changing nature of childhood and the growth in risk aversion which can actually have the perverse outcome of damaging and endangering children’s lives.
Children’s Independent Mobility: an international comparison and recommendations for action67
a motorised society. Of course, these views are not mutually exclusive and perhaps represent the difference between how people would like the world to be and the current reality of many external environments children live and move about in. The point to be drawn from this discussion is that addressing and changing people’s attitudes and behaviour to children’s independent mobility requires a response from policy-makers and professional practitioners that is different and goes beyond measures focused on, for example, shaping the built environment and road infrastructure.
Action needs to address parents’ concerns, road users’ behaviour, the physical environment and social and cultural factors. Achieving this objective requires cross-cutting policy from government at both the local and national levels to work together with affected communities to address the various facets of children’s independent mobility: transport, education, road safety, health, community cohesion and urban planning.
Change may be resisted but it actually happens all the time
While it can be argued that change will be resisted by vocal portions of the population, it has been shown that, in the domain of transport policy, people’s transport behaviours are not fixed and immutable – they change over time in response to personal and external factors, and the disruptions these create is accommodated. Predictions made before the implementation of schemes of the implications of reallocation of road space have been found to be excessively pessimistic and significant deterioration in traffic conditions rarely result (Cairns et al., 2002 ). In fact Marsden and Docherty (2013) contend that people can be far more adaptable to major change than the policy process currently assumes. NGOs and activists, in cooperation with local councils, could use their experience to strengthen a ‘sense of community’, which is pivotal in developing trust and tolerance among neighbours.
Against this backdrop of evidence on levels of independent mobility and the potential benefits to be derived from enabling it we believe that children’s independent mobility should be a much higher profile and explicit objective of policy-making. We give our more specific recommendations below. These have been developed in the context of the authors’ UK experience but we believe they are generally applicable. We would highlight that the recommendations are about more than children’s journey to and from school. They are intended to enhance the ability of children to engage independently in the full range of activities they want and should be able to, including playing, visiting friends, and getting to local amenities and leisure facilities.
Children’s Independent Mobility: an international comparison and recommendations for action68
What should be done to increase children’s independent mobility?
There is a huge range of interventions that could be made to address children’s independent mobility. We have tried to capture the range of possibilities and highlight key interventions which are outlined below grouped into seven areas. Space precludes us from expanding on the details of all of these and the combinations of measures that will be required in different circumstances. We present these options to stimulate debate and aid those wishing to enable children’s independent mobility whether national or local policy-maker, concerned adult, parent or indeed child.
Recommendation 1: Implement and enforce stringent road safety measures Road safety measures should focus on removing danger from the road environment, not the removal of children from danger. This requires:
• Increased use of traffic calming, reallocation of road space to walking and cycling, and provision of well-designed segregated space for cycling where desirable and possible,
• The setting of appropriately low speed limits as they have little impact on urban journey times but can have a large effect on safety and the severity of injury or death rates in collisions – provided of course they are adhered to and enforced,
• Restriction of the use of mobile phones while driving and strict enforcement and penalties for their use,
• Ensuring and enforcing the roadworthiness of vehicles to ensure the basic mechanical function and safety of vehicles, but also ensuring drivers maintain clean windscreens, adjusted mirrors, etc. to ensure visibility of other road users,
• Better driver training, especially of young and commercial drivers, with particular efforts to raise awareness of vulnerable road users and the behaviours drivers need to anticipate and accommodate,
• Meaningful driving bans, fines and custodial sentences for careless and dangerous driving with greater publicity given to unacceptably poor standards of driving,
• Changed liability and insurance regimes. For example, presumed liability would encourage the insurance industry to invest in reducing the threat to vulnerable users and give easier access to compensation for victims of road collisions (RoadPeace 2012); telematics or ‘blackbox’ technologies that reward safer driving with reduced insurance premiums (through GPS tracking of factors affecting collisions, such as braking, cornering, speed and time of day), and can also provide feedback to the drivers (Which?, 2015),
Children’s Independent Mobility: an international comparison and recommendations for action69
• Information, education and training on road safety for children, parents and drivers, including a particular emphasis on challenging the routine acceptance of dangerous road conditions and overlooking children’s desire for and right to safe independent mobility.
These are intended to better protect vulnerable road users and incentivise safe and considerate driving. There is a need to move away from victim blaming to addressing the root cause of danger which is traffic and the acceptance of routinely high levels of road danger.
Recommendation 2: Reduce car dependency and the dominance of traffic in the public realmDanger from traffic is a key factor preventing parents from granting children’s independent mobility. Recommendation 1 focuses on ensuring vehicles are driven safely. Recommendation 2 addresses the volume of traffic and dependency on cars for mobility. Achieving a reduction of car dependency and the domination of traffic in the public realm is a not insignificant task and requires coordinated planning, transport, health, education and economic policies at the national and local level. We cannot give full details of the measures required here but actions include national and local policies:
• Encouraging the provision and use of local public amenities and services,
• Encouraging and enabling walking and cycling as routine modes of travel,
• Increasing the area and connectivity of pedestrianised areas,
• The reallocation of road space to walking and cycling, including well-designed segregated space for cycling where possible, and consideration of the location, quantity and safety implications of car-parking,
• Improving the provision and affordability of public transport,
• Providing training and skills for parents and children about walking and cycling and the use of public transport.
Recommendation 3: Put the needs of children at the heart of spatial planning and urban development – public spaces that work for children, work for everyoneRecommendations 1 and 2 address the dangers and volume of traffic as a key barrier of children’s independent mobility. This recommendation focuses on enabling a more constructive approach to creating urban, village and rural environments that deliver children’s needs and desires including independent mobility. This needs to be about the design and environmental aesthetics but also ensuring that high environmental standards are set and delivered.
Children’s Independent Mobility: an international comparison and recommendations for action70
Rotterdam, Vancouver and the Child Friendly Cities Initiative are examples of how children’s needs can be put at the heart of the development process in an integrated and holistic way. They create benefits for children and wider society. The means of doing so in Rotterdam, Vancouver and the Child Friendly Cities Initiative given above can be referred to but, at a minimum, there is a need for:
• Area planning processes that take into account children’s needs, safety issues and parental concerns,
• Environmental policies that ensure healthy environments especially in relation to air pollution, noise and green space,
• Connected and safe transport networks that allow children to independently access play, friends, school, leisure facilities, shops and other amenities,
• Meaningful consultation and involvement of children in design processes.
Transforming urban areas takes time. The value of other activities that create space and support for children’s independence such as Playing Out (see Box 8) and other similar activities should not be overlooked.
Recommendation 4: Explicitly incorporate children’s independent mobility into policy Children’s independent mobility rarely features in policy-makers’ considerations. Given that greater independent mobility results in benefits for children and wider society, there is a strong case for incorporating it explicitly into policy-making at all levels of government. At the same time, national government needs to create a supportive framework for local governments to implement local measures and encourage other stakeholders to be involved.
Children’s independent mobility has value both as a policy objective in itself and as an indicator of the wider success, or otherwise, of other policies including those related to children’s well-being, planning, transport, housing, road safety and the liveability of urban areas.
Children’s independent mobility should be incorporated into policy indicators, appraisal, monitoring and evaluation including:
• The use of measures of children’s independent mobility as an indicator of road safety, and people’s perceptions of road safety alongside road casualty statistics. This would be to reflect and inform progress on policy objectives beyond road safety as narrowly defined casualty reduction, including addressing the liveability of areas and utility of road space for a range of users, pedestrians, children, and other vulnerable users.
Children’s Independent Mobility: an international comparison and recommendations for action71
• A more explicit and thorough incorporation of children’s needs and independent mobility into processes of policy appraisal, guidance monitoring and evaluation is required for policy areas that impact on children such as planning, transport, housing, education, health and so on. In particular, there is a need to ensure policy appraisal routinely, and more thoroughly considers and gives weight in decisions to the impacts of policy proposals on children’s independent mobility and well-being. The City of Vancouver’s 1992 Guidelines for High-Density Housing for Families with Children is a good example of the range of factors that need to be addressed to create child and family friendly developments.
• Better evaluation of the effectiveness of policies and interventions in addressing children’s independent mobility and other related policy objectives.
Policy-making on children’s independent mobility should:
• Be inclusive: schools, non-governmental organisations working for children’s well-being, children and parents play an important part in decision-making and policy implementation. The involvement of these actors will support policy-makers in identifying the factors affecting children’s mobility and providing innovative solutions to tackle them.
• Be integrated: an effective approach to enhance children’s independent mobility should combine both physical interventions on the built environment and initiatives changing social and parental attitudes towards children’s freedom to move.
• Embed responsibilities for promoting children’s independent mobility in key public institutions of education, health, transport and planning both nationally and locally, for example, the role of head teachers, schools and education authorities in allowing and enabling children to walk or to cycle to school on their own – including making good provision for bicycles at schools.
The cross-cutting nature of measures required to address children’s independent mobility requires a coordinating mechanism. We return to this in recommendation 7.
Recommendation 5: Adopt Daylight Saving Time to allow children to better utilise daylight hours and reduce road casualtiesThe surveys conducted as part of this work revealed that darkness is one of the most significant barriers to parents granting children independent mobility. The adoption of ‘Single Double Summertime’ (SDST)26, resulting in lighter evenings in the UK and countries at similar latitudes, would address this issue by shifting daily an hour of daylight to the afternoon/evening – a time when children are also better able to utilise it. The wider benefits of this daylight saving include a reduction in road casualties, greater levels of outdoor leisure and social activity and consequent health benefits for the population, especially children (Hillman, 2010).
26 Meaning that in the UK the clocks are set to GMT+1 hour in the winter and GMT+2 hours in the summer effectively advancing the clocks an hour throughout the year compared to current arrangements.
Children’s Independent Mobility: an international comparison and recommendations for action72
Recommendation 6: Invest in research to consolidate and develop knowledge on children’s independent mobilityWhile there is a wide body of evidence relevant to children’s independent mobility, this is spread across diverse disciplines and literatures. This report has tried to bring together the main themes. However, there is a need to invest much greater resource in understanding the impacts of independent mobility on children’s social, mental and physical development, their health, lifestyles and desires. What are factors affecting levels of independent mobility? What do children and parents really think about their levels of independence and mobility? What are the implications of new mobility options and technologies, for example, driverless cars, speed control technologies, pedestrian detection systems (including the tagging of children to enable approaching cars to detect them) and innovative road safety approaches such as the projection of virtual walls across roads as crossings? (For details and discussion of some of these Intelligent Transportation Systems (ITS), see Leden et al., 2014.) How can we address the social acceptance of pervasive and real danger from traffic but reduce concern about ‘social fears’ of for example, strangers.
Evaluation, learning and reporting will need to be a central part of the challenge fund programme in recommendation 5. How are professionals working in planning, transport, road safety and health learning about these issues and are they equipped for the challenges associated with the transformation that improving children’s independent mobility requires? For example, Gill (2007b), in evaluating implementation of the London Play Home Zones project found that professionals lacked the skills and knowledge to deliver effective child-friendly streets in practice.
This research makes an important contribution to the research in this area by providing a baseline and allowing international comparisons to be made on independent mobility. However, there is need for much greater investment in understanding the benefits of independent mobility, the reasons for its reduction and how to restore it. What are the implications in terms of long-term lifestyles and health for children with low independent mobility? What is the effect on casualty rates of delaying granting of independent mobility? Is deferring independence actually reducing casualties, for example, in relation to the peak of child pedestrian casualties at 11 and 12 years old27.
Recommendation 7: Create a national challenge fund to catalyse and drive action to improving children’s independent mobility The recommendations above cover a wide range of actors and possible areas for action. A mechanism is required to coordinate and drive action across these diverse areas. We believe there is a need for a large scale catalytic intervention from national government. This needs to:
• Make improving children’s independent mobility and developing child-friendly cities an explicit national policy objective – highlighting the economic, social and environmental justifications for the challenge.
27 See Department for Transport, 2014a, 2014b for child pedestrian casualty statistics.
Children’s Independent Mobility: an international comparison and recommendations for action73
• Set up a national level, cross-cutting task force to coordinate action from different policy areas including transport, planning, education and health.
• Create a large-scale, long-term challenge fund to enable action at the urban level. For example, a fund to support ten urban areas that commit to achieving a transformation of children’s independent mobility in the next ten years. This needs to cover not just town and city centres but urban areas more widely as well as smaller scale and rural settlements.
• Ensure the actions supported utilise design principles that bring children’s needs and views into policy and political processes in a participatory process.
An important part of the work of those involved in the challenge fund will be experimenting with ways of framing and communicating these issues to a wider audience to enable constructive debate and action. Children’s safety, health and development are important and sensitive issues and, as we have seen in the polarisation of opinions on this issue, social pressure for parents to act in ways that may not be in the long-term interest of their children. Social acceptance of different types of risk, for example from traffic and strangers, and the implications of growing political and professional risk aversion, need to be explored. The media and press have a role to play in providing responsible coverage of these issues and challenges and constructing enabling rather than fear-based social narratives around children and parents’ behaviour.
Children’s Independent Mobility: an international comparison and recommendations for action74
Concluding comments – delivering places fit for children
We have highlighted that increasing children’s independent mobility is justified in terms of children’s physical, mental and social development, their health, rights and well-being. We have also identified a range of policy options that could be used to deliver increased children’s independent mobility and the wider benefits it would bring. Delivering this agenda is of course challenging. The dominance of traffic in local environments, which is reported by parents as a major concern in relation to their children’s independent mobility, is ingrained in attitudes, behaviour and infrastructures. However, we have identified examples of approaches that place children’s needs at the centre of the urban development and have delivered real change on the ground in challenging the contemporary view which has evolved from prevailing economic and social circumstances.
Encouragement should be taken from the fact that significant change is possible. Mechanisms exist to increase children’s independent mobility and have been put into practice at national, urban and local levels. The level of community-led activity we have observed on reclaiming outdoor space for children (and adults), particularly in the UK, also suggests there is public desire for greater action from policy-makers to enable such change. However, if these examples of good practice are to become more widespread, consideration of the benefits of children’s independent mobility needs to be made a much higher profile and explicit consideration in policy-making. Better quality public and media debate is also needed on the implications of low levels of children’s independent mobility and the means by which these levels can be increased.
At its most fundamental level the debate is about the quality of the environments we wish to bring up our children in and how we enable them to flourish. We hope this report will make a contribution to this debate and lead to a significant change in policy on the role and rights of children in society.
Children’s Independent Mobility: an international comparison and recommendations for action75
6 References
Academy of Urbanism, 2014a. Assessments, Urbanism Awards, Rotterdam. [Online] Accessed 2 April 2015. Available at: academyofurbanism.org.uk/rotterdam/
Academy of Urbanism, 2014b. Urbanism Awards: Rotterdam takes top prize. [Online] Accessed 2 April 2015.Available at: academyofurbanism.org.uk/urbanism-awards-rotterdam-takes-top-prize/
ACPO (2013) ACPO Speed Enforcement Policy Guidelines 2011–2015: Joining Forces for Safer Roads. [Online] Accessed 2 April 2015. Available at: acpo.police.uk/documents/uniformed/2013/201305-uoba-joining-forces-safer-roads.pdf
Adams, J, 2013. Risk Compensation in Cities at Risk, in T. Rossetto et al. (eds.), Cities at Risk: Living with Perils in the 21st Century, Springer, London
Appleyard, D. 1981. Livable Streets, University of California Press, Berkeley
Beasley, L. 2009. Smart growth in Rotterdam: Considerations from a Vancouver perspective. AIR, Rotterdam. [Online] Accessed 2 April 2015. Available at: vanderleeuwkring.nl/media/files/key_note_larry_beasley_.pdf
Behrens, R., and Muchaka, P., 2011. Child Independent Mobility in South Africa: the case of Cape Town and its hinterland. Global Studies of Childhood, 1 (3), 167-184
Björklid and Gummesson, 2013. Children’s Independent Mobility in Sweden. Borlänge: The Swedish Transport Administration. [Online] accessed 2 April 2015. Available at online4.ineko.se/trafikverket/Product/Detail/44149
CABE Space, 2008. Public space lessons: Designing and planning for play. Commission for Architecture and the Built Environment, London
Children’s Society, 2012. The Good Childhood Report 2012: A review of our children’s well-being. London, Children’s Society
City of Rotterdam, 2010. Rotterdam, city with a future: How to build a Child Friendly City. Youth, Education and Society department, City of Rotterdam. [Online] Accessed 2 April 2015. Available at: rotterdam.nl/JOS/kindvriendelijk/Rotterdam%20City%20with%20a%20future.pdf
City of Vancouver, 1992. Guidelines for High-Density Housing for Families with Children. City of Vancouver Land Use and Development Policies and Guidelines. [Online] Accessed 2 April 2015. Available at: former.vancouver.ca/commsvcs/guidelines/H004.pdf
Collins, D. & Kearns, R.A., 2001. The safe journeys of an enterprising school: negotiating landscapes of opportunity and risk. Health & Place, 7(4), 293-306
Department for Transport, 2014a. Casualties involved in reported road accidents (RAS30), Table RAS30030, Reported child casualties in accidents occurring between 7:30 and 8:59am or between 3:00 and 4:59pm on a school day, by road user type, severity, gender and age, Great Britain, latest available year. [Online] Accessed 2 April 2015. Available at: gov.uk/government/statistical-data-sets/ras30-reported-casualties-in-road-accidents
Department for Transport, 2014b. Casualties involved in reported road accidents (RAS30), Table RAS30011, Reported killed or seriously injured casualties by gender, road user type and age, Great Britain, 2005-09 average, annual for latest 8 available years. [Online] Accessed 2 April 2015. Available at: www.gov.uk/government/statistical-data-sets/ras30-reported-casualties-in-road-accidents
Dowling, R., 2000. Cultures of mothering and car use in suburban Sydney: a preliminary investigation. Geoforum, 31(3), 345-353
Dyck, I., 1990. Space, time, and renegotiating motherhood: an exploration of the domestic workplace. Environment and Planning D: Society and Space, 8(4), 459-483
Duhl, L. J. E. and Powell, J., 1963. The urban condition: people and policy in the Metropolis. New York: Simon & Schuster
European Environment Agency, 2010. Examples of Show Cases of National Policies to Promote Sustainable Household Consumption: The case of Austria. European Environmental Agency/European Topic Centre on Sustainable Consumption and Production (ETC/SCP)
Fotel, T. N. and Thomsen, T.U., 2004. The surveillance of children’s mobility. Surveillance & Society 1(4): 535-554
Children’s Independent Mobility: an international comparison and recommendations for action76
Fromm, E., 1960. The fear of freedom. London: Routledge & Kegan Paul
Fyhri, A. and Hjorthol, R., 2009. Children’s independent mobility to school, friends and leisure activities. Journal of Transport Geography, 17(5), 377-384
Fyhri, A., Hjorthol, R., Mackett, R.L., Fotel, T.N. and Kyttä, M., 2011. Children’s active travel and independent mobility in four countries: Development, social contributing trends and measures. Transport Policy, 18 (5), 703-710
Gill, T., 2007a. No Fear: Growing up in a Risk Averse Society. London, Calouste Gulbenkian Foundation
Gill, T., 2007b. Can I play out? Lessons from London Play’s Home Zones project. London, London Play
Griffiths, L. J., Cortina-Borja M., Sera, F., et al. How active are our children? Findings from the Millennium Cohort Study. BMJ Open 2013; 3:e002893. doi:10.1136/bmjopen-2013-002893
The Guardian (2011) New Zealand raises driving age to 16. The Guardian, 1 August 2011. [Online] Accessed 2 April 2015. Available at theguardian.com/world/2011/aug/01/new-zealand-raises-driving-age
Hofer, N et al., 2008. Compilation Report of the Process, Findings and Recommendations from the False Creek North Post-Occupancy Evaluation. [Online] Accessed 2 April 2015. Available at http://www.sarkissian.com.au/wp-content/uploads/2011/03/FCN-POE-Compilation-Report-FINAL.pdf
Hillman., M (1970), Mobility in New Towns, Doctoral dissertation, University of Edinburgh
Hillman, M., 2010. Making The Most Of Daylight Hours: The implications for Scotland. London, Policy Studies Institute
Hillman, M., Adams J. and Whitelegg, J., 1990. One false move: a study of children’s independent mobility, London: Policy Studies Institute
Hillman, M., Henderson, I., and Whalley, A., 1973. Personal mobility and transport policy. London, Political and Economic Planning
Hillman, M., Henderson, I., and Whalley, A., 1976. Transport Realities and Planning Policy: Studies of Friction and Freedom in Daily Travel. London, Political and Economic Planning
Huby, M. and Bradshaw, J., 2006. A review of environmental dimension of children and young people’s wellbeing (Vol 1), University of York. [Online] Accessed 2- April 2015. Available at: sd-commission.org.uk/publications.php?id=526
Idaho Transportation Department, 2014. Driver’s Manual Idaho. [Online] Accessed 2 April 2015. Available at itd.idaho.gov/dmv/DriverServices/documents/driFver_manual.pdf
Jacobs, J., 1964. The death and life of great American cities. Harmondsworth: Penguin Books in association with Jonathan Cape
Johansson, M., 2006. Environment and parental factors as determinants of mode for children’s leisure travel. Journal of Environmental Psychology, 26(2), 156-169
Kuh, D. J. L. and Cooper, C. (1992) Physical activity at 36 years: patterns and childhood predictors in a longitudinal study, Journal of Epidemiology 46: 114-119
Kuller, R., 1991. Environmental assessment from neuropsychological perspective. In Garling, T. & Evans, G.W. (eds) Environmental Cognition and Action: An integrated approach. Oxford: Oxford University Press
Leden, L., Gårder, P., Schirokoff, A., Monterde-i-Bort, H., Johansson, C., Basbas, S. 2014. A sustainable city environment through child safety and mobility – A challenge based on ITS? Accident Analysis and Prevention 62, 406-414
Leeds City Council, undated. Information for children and young people about… …Making Leeds a child friendly city. [Online] Accessed 2 April 2015. Available at: leeds.gov.uk/c/Release%20Documents/CfL%20Children%20Young%20People%20Leaflet%20%282%29.pdf
Layard, R., and Dunn, J., 2009. A Good Childhood: Searching for Values in a Competitive Age, London, Penguin Books
London Evening Standard, Islington becomes first entire 20mph zone but police won’t enforce it. London Evening Standard, 18 November 2011. [Online] Accessed 2 April 2015. Available at: standard.co.uk/news/islington-becomes-first-entire-20mph-zone-but-police-wont-enforce-it-6369627.html
Mackett, R.L., 2013. Children’s travel behaviour and its health implications, Transport Policy, 26, 66-72
Malone, K., 2007. The bubble-wrap generation: children growing up in walled gardens. Environmental Education Research, 13(4), 513-527
Piaget, J., 1954. Intelligence and affectivity: their relationship during child development. (Original in French, translated
Children’s Independent Mobility: an international comparison and recommendations for action77
into English and edited by Brown, T. A., Kaegi, C. E. & Rosenzweig, M. R. 1981.Palo Alto, Calif.: Annual Reviews Inc.)
Piaget, J. and Cook, M., (translator) 1952. The origins of intelligence in children. New York: International Universities Press
Play England, 2013. Unwelcoming communities stop playing out. [Online] Accessed 2 April 2015. Available at: playengland.org.uk/news/2013/08/unwelcoming-communities-stop-children-playing-out.aspx
Plowden, S. and Hillman, M., 1996. Speed Control and Transport Policy. London, Policy Studies Institute
Price, G. and Reis, R., 2010. Making kid-friendly cities: Lessons from two cities, Preventive Medicine 50, s95-96
Punter, J., 2003. The Vancouver Achievement: Urban Planning and Design. Vancouver, UBC Press
RoadPeace, 2012. Stricter liability for a civilised compensation system. [Online] Accessed 2 April 2015. Available at: roadpeace.org/resources/Stricter_liability_2012.doc
Sanger, C., 1995. Girls and the getaway: cars, culture, and the predicament of gendered space. University of Pennsylvania Law Review 144, 705–756
Shaw, B., Watson, B., Frauendienst, B., Redecker, A., Jones, T. with Hillman, M., 2013. Children’s independent mobility: a comparative study in England and Germany (1971-2010), London: Policy Studies Institute
Sightline Daily, 2014. Are you planning to have Kids? Parts 1 and 2. [Online] Accessed 2 April 2015. Available at: daily.sightline.org/2014/07/08/are-you-planning-to-have-kids-part-1/ and daily.sightline.org/2014/07/29/are-you-planning-to-have-kids-part-2/
Silverman, J. and Wilson, D., 2002. Innocence Betrayed: Paedophilia, the media and society. Cambridge, Polity
Unicef, 2012 The State of The World’s Children 2012: Children in an Urban World. Unicef, New York
Unicef, 2013. Child Well-being in Rich Countries: A comparative overview. Innocenti Report Card 11. Unicef Office of Research, Florence
Unicef Innocenti Research Centre, 2004. Building Child Friendly Cities: A Framework for Action. Unicef Innocenti Research Centre, Florence
United Nations, 1989. Convention on the Rights of the Child. General Assembly resolution 44/25 of 20 November 1989. [Online) Accessed 2 April 2015. Available at ohchr.org/EN/ProfessionalInterest/Pages/CRC.aspx
Ward, C., 1990a. The Child in the City, 2nd ed., NCVO Publications
Ward, C., 1990b. The Child in the Country, NCVO Publications
Which?, 2015. Black box insurance: how it works. [Online] Accessed 2 April 2015. Available at: which.co.uk/money/insurance/guides/black-box-car-insurance/black-box-car-insurance-how-it-works/
World Health Organization, 2013. Global status report on road safety 2013: supporting a decade of action. World Health Organisation, Geneva
World Health Organization, Europe, 2004. Children’s Health and Environment Case Studies Summary Book. World Health Organization Regional Office for Europe, Rome
Zwerts et al., 2010. How children view their travel behaviour: a case study from Flanders (Belgium), Journal of Transport Geography

psi.org.uk