Embed Size (px)
Citation preview
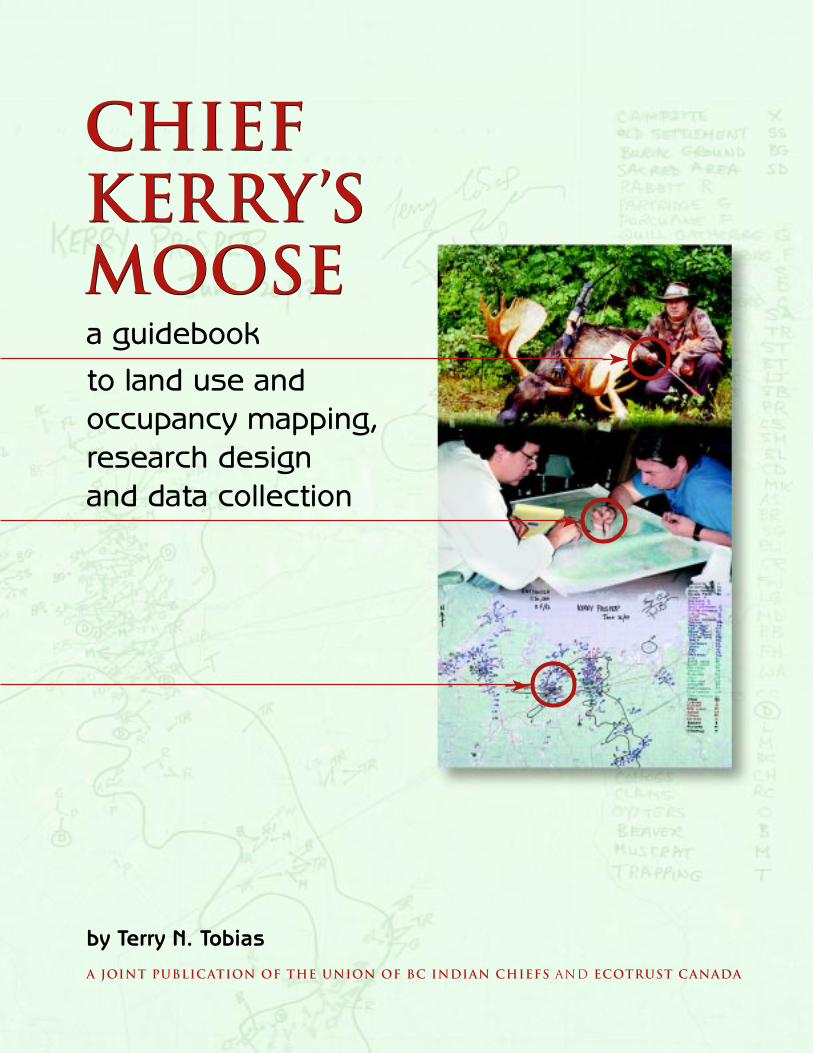
a guidebookto land use andoccupancy mapping,research designand data collection
A joint publication of the Union of BC Indian Chiefs and Ecotrust Canada
➛
➛
➛
by Terry N. Tobias
ChiefKerry’sMoose
ChiefKerry’sMoose
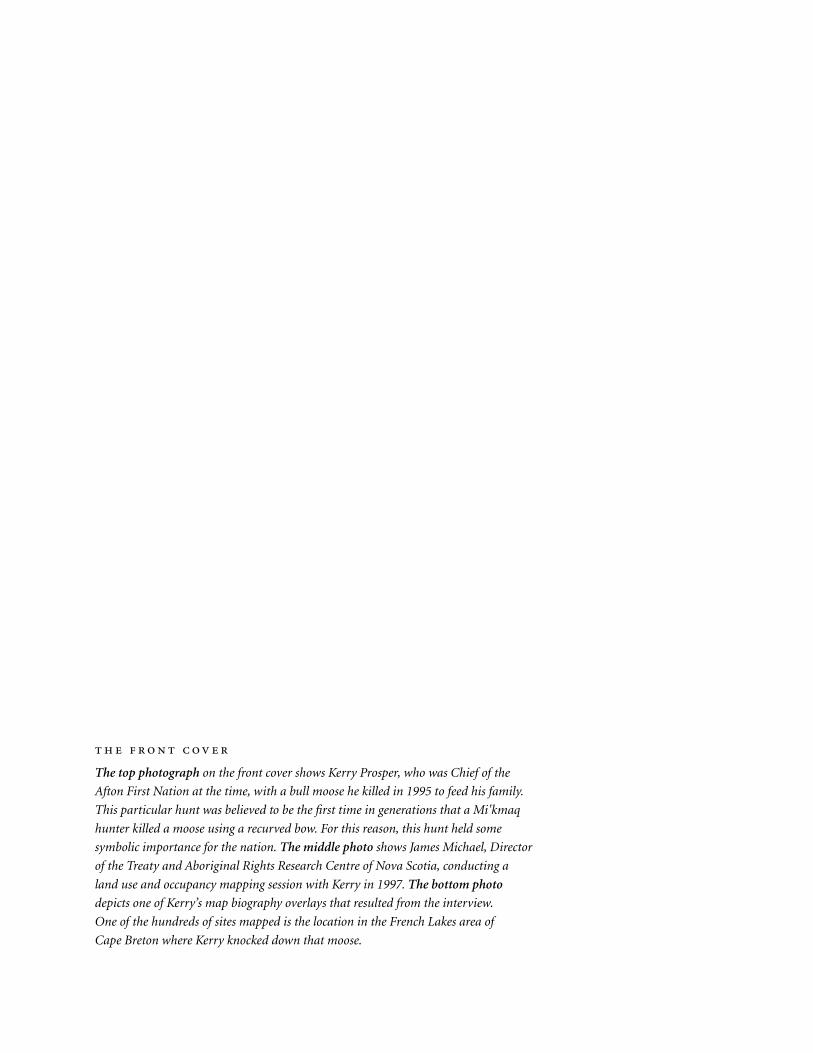
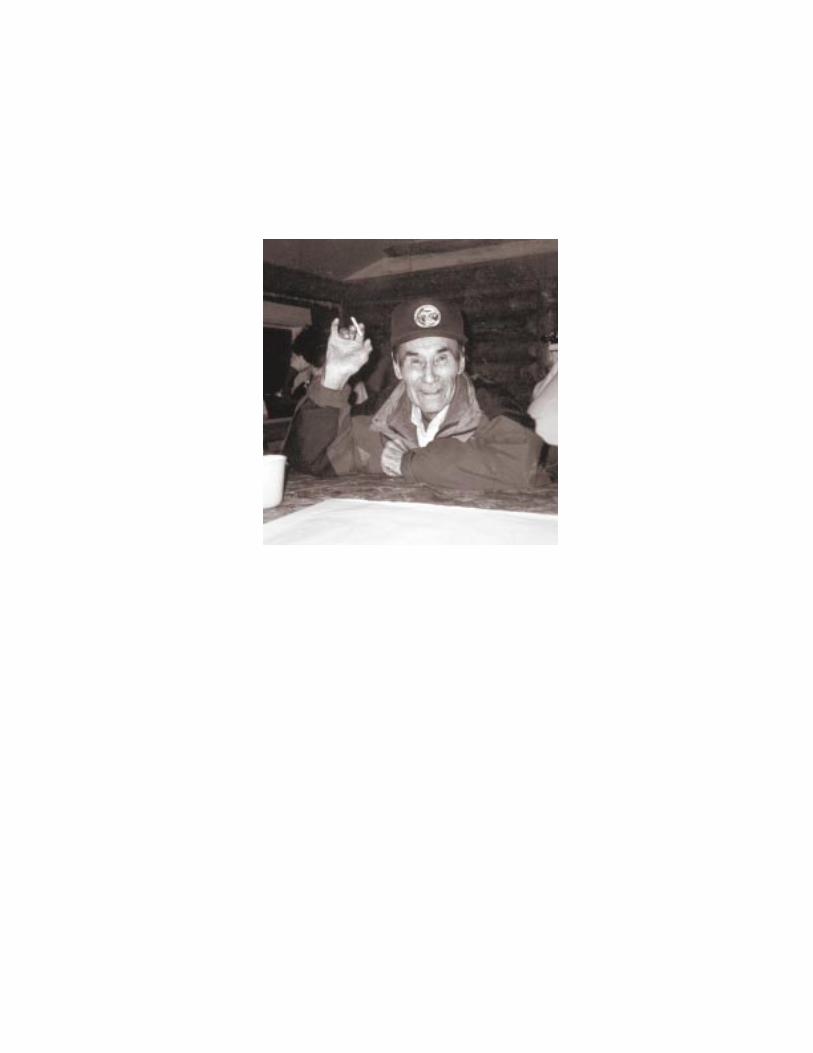
The top photograph on the front cover shows Kerry Prosper, who was Chief of the
Afton First Nation at the time, with a bull moose he killed in 1995 to feed his family.
This particular hunt was believed to be the first time in generations that a Mi'kmaq
hunter killed a moose using a recurved bow. For this reason, this hunt held some
symbolic importance for the nation. The middle photo shows James Michael, Director
of the Treaty and Aboriginal Rights Research Centre of Nova Scotia, conducting a
land use and occupancy mapping session with Kerry in 1997. The bottom photo
depicts one of Kerry’s map biography overlays that resulted from the interview.
One of the hundreds of sites mapped is the location in the French Lakes area of
Cape Breton where Kerry knocked down that moose.
a guidebook to land useand occupancy mapping,
research design anddata collection
ChiefK er ry ’sMoose
Part one in a series of publications intended for First Nationresearchers and decision makers, illustrating best practices
in land use and occupancy research and mapping.
Copyright © 2000 by Terry Tobias00 01 02 03 4 3 2 1
Rights reserved. This book may be reproduced or transmitted in any form by any means,electronic or mechanical, including photocopying and recording, or by any informationstorage or retrieval system, without permission from the publisher or author. The bookcan be downloaded from either the Union of BC Indian Chiefs web site (below) or theAboriginal Mapping Network web site (http://www.nativemaps.org). No part of thebook may be modified, re-packaged or resold without the written permission of theauthor, who can be contacted through Ecotrust Canada.
The views expressed in this publication are those of the author, and are not necessarilyshared by the Union of BC Indian Chiefs or Ecotrust Canada.
Union of BC Indian Chiefs342 Water Street, 5th FloorVancouver, B.C., V6B 1B6, CanadaTelephone (604) 684-0231Web site␣ ␣ http://www.ubcic.bc.ca
Ecotrust Canada1226 Hamilton Street, Suite 202Vancouver, B.C., V6B 2S8, CanadaTelephone (604) 682-4141Web site␣ ␣ http://www.ecotrustcan.org
Canadian Cataloguing in Publication DataTobias, Terry N., 1951–
Chief Kerry’s moose
Copublished by: Ecotrust Canada.ISBN 1-896866-04-2
1. Native peoples – Land tenure – Canada – Maps.* 2. Native peoples –Land tenure – Canada – Research.* 3. Land use – Canada – Maps.4. Land use – Canada – Research. I. Union of British Columbia Indian Chiefs.II. Ecotrust Canada. III. Title.E78.C2T62 2000 333.2’089’97071 C00-910464-X
Price: $14.95Additional copies of this publication may be purchased through the Union of BCIndian Chiefs.
Published with assistance from the Union of BC Indian Chiefs and the Walter andDuncan Gordon Foundation.
Edited by Alex RoseDesign and production by Alaris Design, VictoriaFigures and sketches by Dirk Van StralenMaps by Arbex Forest Resource Consultants Ltd.Printing by Western Printers and Lithographers
Printed and bound in CanadaPrinted on Domtar Naturals, minimum 50% recycled/30% post-consumer waste
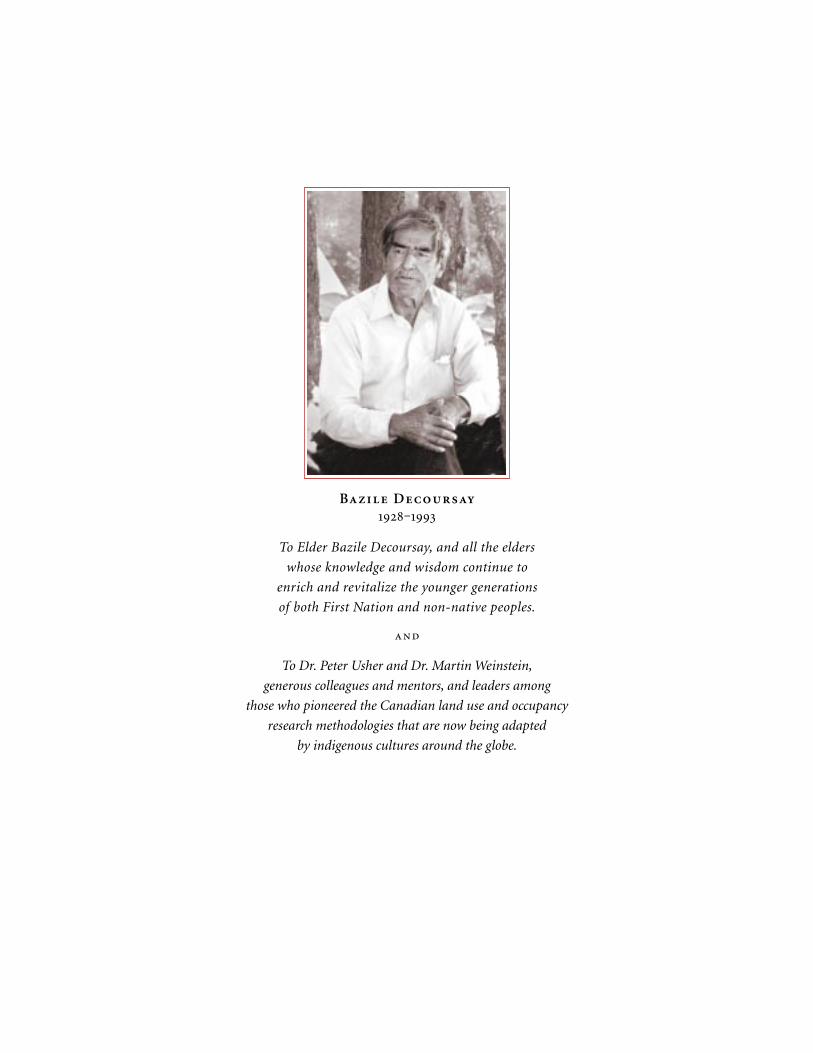
Bazile Decoursay‒
To Elder Bazile Decoursay, and all the elders
whose knowledge and wisdom continue to
enrich and revitalize the younger generations
of both First Nation and non-native peoples.
and
To Dr. Peter Usher and Dr. Martin Weinstein,
generous colleagues and mentors, and leaders among
those who pioneered the Canadian land use and occupancy
research methodologies that are now being adapted
by indigenous cultures around the globe.
CONTENTS
Introduction ..................................................................................................................................... xi
1 Land Use and Occupancy Mapping:
A Definition and A Warning .......................................................................................... 1
2 The Tasks of a Mapping Project ................................................................................... 4
3 Map Biographies and Composites .........................................................................12
4 Doing Quality Research .....................................................................................................19
5 Designing the Project:
Why, Who, When, Where and What ...................................................................33
6 Principles of Research Design and Implementation ........................38
7 Measuring Quality ....................................................................................................................49
8 Creating a Culture of Research ..................................................................................56
Summary .............................................................................................................................................58
Glossary .................................................................................................................................................62
I nformation – access to it, or access denied – has long been at the
root of how communities have expressed who they are, to themselves
and outsiders. The oral traditions of First Nations have been –
for hundreds of years – cherished and deeply respected ways of
communicating complex information about culture, politics, the environ-
ment, and what we now call economics. After European contact, these oral
communications were given less and less weight, and First Nations were
put at a profound disadvantage in negotiating about their lands and
resources.␣ Just a few years ago, I remember talking to a provincial cabinet
minister about forestry operations that were going to have a serious
negative impact on Algonquin lands and the Algonquins’ ability to sustain
themselves.␣ The minister said, “Prove it to me!” Clearly, words were not
sufficient. That was a seminal moment in my life, and in my work.
It became clear to me that sure, we had anecdotal testimony, but
that was not good enough. How can you demonstrate that the activities
of outsiders are affecting your survival? It is so difficult to prove to the
non-native establishment that you’ve got rights. You have to be able to show
the impact to a people who are not themselves land based. So you need to
draw them a picture. That’s what land use and occupancy mapping is all about.
This has become even more important following the 1997 landmark
Supreme Court of Canada ruling in Delgamuukw. Although the court found
that oral testimony does have weight in law, the court also underlined the
F o r e w o r d
need to demonstrate physical occupation of territory in order to prove
Aboriginal title. The only way you can prove physical occupation is by tell-
ing the court, “I was here, I have a house here, I have a trapline here, hunt
small game over here ... ” All these are markers of occupancy, and the only
way to prove occupancy is by having a map that sets out the evidence in
terms the people across the negotiating table, or a judge, will understand
and accept.
For many First Nations though, the question is, “How to get started in
the right direction so that our maps end up really serving our community
and nation?” This is where Terry Tobias’ guidebook on use and occupancy
mapping will be an extremely useful and timely tool. It is aimed at the
community level – for researchers, lawyers and planners working in
Aboriginal and treaty rights research and natural resource management.
I have been working in this field for about 18 years as a lawyer, advising
First Nations in the preparation of evidence both for court and negotia-
tion purposes. In all these years, my experience has been that there is not
enough attention paid to methodology and detail. As the competition for
scarce natural resources increases it can be expected that research stand-
ards will be more closely scrutinized by governments, courts and third party
interests as our nations seek to establish Aboriginal title to lands and
resources. Therefore, it is important for First Nations and their advisors to
know how to do this research and how to do it well.
Terry Tobias’ work provides sound guidance in this regard by an indi-
vidual who is accomplished, credible and experienced in this field. I’d like
to add that credit is due to the Union of B.C. Indian Chiefs and Ecotrust
Canada for helping bring this important project to fruition, and getting
this guidebook to communities where it is desperately needed.
So take heart. The research is worth the effort.␣ Years ago the minister
made his challenge, “Prove it!” And in those days, no logging company
ever asked the Algonquins where they could cut. Now they don’t cut
without asking the permission of the Algonquins.
David C. Nahwegahbow, LL.B.
David is a Anishinabe lawyer from Whitefish River First Nation nearManitoulin Island, Ontario. He practises Aboriginal law and has an office inOttawa. David is also President of the Indigenous Bar Association in Canada.
○ ○ ○ ○ ○ ○ ○ ○ ○ ○ ○ ○ ○ ○ ○ ○ ○ ○ ○ ○ ○ ○ ○
F o r e w o r d
vii
Acknowledgements
I would like to acknowledge the many hundreds of elders and interview
participants whose knowledge, patience, criticism and humour at the map-
ping table has helped my ongoing learning about how to assist First Nationswith the design of their cultural mapping projects.
I would also like to acknowledge those who have in quiet and importantways been my mentors over the years, in the arena of land use and occu-
pancy research: Dr. Peter Douglas Elias, Dr. Harvey Feit, Dr. Peter J. Usher,
and Dr. Martin Weinstein.
In 1982 George Smith and the Northern Village of Pinehouse invited
me to live in their community and help design research that would demon-strate the importance of traditional resources to their way of life. In prepa-
ration, I wrote Martin Weinstein and asked his advice. He sent me a copy of
Dr. Hugh Brody’s beautifully written book, Maps and Dreams, which wasthen just hot off the press. That book documented the Union of BC Indian
Chiefs groundbreaking and successful attempt to employ land use and oc-
cupancy mapping to help stop the construction of a pipeline. In some waysthen, things are coming full circle with Chief Kerry’s Moose, another UBCIC
initiative. I would like to acknowledge the president of the UBCIC, Chief
Stewart Phillip, and Leigh Ogston and all the other personnel whose ongo-ing endeavours are providing quality guidance, reference materials and con-
ferences for First Nation researchers at the community, regional, national,
and international levels. I would like to thank once again George Smith andall the people who welcomed me into their community almost two decades
ago, and who were so good to me during my Pinehouse years.
This manual has benefited tremendously from the input of many peo-
ple who reviewed drafts. With my sincere thanks, these people include: Dr.
Hugh Brody, Honourary Associate, Scott Polar Research Institute, Univer-sity of Cambridge; Jennifer Carpenter, Research Director, Heiltsuk Cultural
Education Centre, Bella Bella; David Carruthers, Director, Information Serv-
ices, Ecotrust Canada, Vancouver; Petr Cizek, Cizek Environmental Serv-ices, Yellowknife; Russell Diabo, MFH Consulting Services, Sorrento; Dr. Peter
Douglas Elias, Perisor Research Services, Calgary; Tina Erickson, Treaty Co-
ordinator, Nakazdli Band, Fort St. James; Dr. Fikret Berkes, Professor, Natu-ral Resources Institute, University of Manitoba; Charlotte Francois,
Community Researcher, Adams Lake and Neskonlith Traditional Use Study,
Chase; Lana Garbitt, Community Researcher, Saulteau First Nation,Chetwynd; Sarah Gaunt, Heritage Planner, Champagne and Aishihik First
Nation, Whitehorse; Dr. Bob Gibson, Associate Professor, Department of
Environment and Resources Studies, University of Waterloo; Ian Gill, Chair,Management Group, Ecotrust Canada; Steve Izma, Wilfred Laurier Univer-
sity Press and Between the Lines Publishing, Waterloo and Toronto; Philip
Jeddore, Community Researcher, Miawpukek First Nation Traditional UseStudy, Conne River; Dr. Robbie Keith, Former Executive Director, Canadian
○ ○ ○ ○ ○ ○ ○ ○ ○ ○ ○ ○ ○ ○ ○ ○ ○ ○ ○ ○ ○ ○ ○
C H I E F K E R R Y ’ S M O O S E
viii
Arctic Resources Committee, Ottawa; Stephen Kilburn, Geopraxis Inc.,
Guelph; Erin Kellogg, Vice President, Ecotrust Canada; Joan Kuyek, NationalCo-ordinator, MiningWatch Canada, Ottawa; James Michael, Director, Treaty
and Aboriginal Rights Research Centre of Nova Scotia, Shubenacadie; Dr.
Greg Michalenko, Associate Professor, Department of Environment and Re-sources Studies, University of Waterloo; Shayne McDonald, Legal Advisor
for The Miawpukek First Nation, Conne River; Allan McLaren, Community
Researcher, Algonquin Nation Secretariat, Timiskaming; David Nahwegahbow,President, Indigenous Bar Association in Canada, Ottawa; Leigh Ogston,
Research Director, Union of British Columbia Indian Chiefs, Vancouver;
Dr. Rick Riewe, Professor, Department of Zoology, University of Manitoba;Dr. Sue Roark-Calnek, Associate Professor, Emerita, Department of Anthro-
pology, State University of New York at Geneseo; Mike Robinson, Former
Executive Director, Arctic Institute of North America, University of Calgary;David Roth, dmr Research Services, Burnaby; Michel Sands, Community
Research Co-ordinator, Nin•Da•Waab•Jig Research Centre, Walpole Island
First Nation, Walpole Island; Chief Harry St-Denis, Wolf Lake First Nation,Temiscaming; Paul Prosper, Research Director, Confederacy of Mainland
Mi’kmaq, Truro; Doug Urquhart, Environmental Consultant, Whitehorse;
Dr. Peter Usher, P.J. Usher Consulting Services, Ottawa; Dr. Martin Weinstein,Weinstein Consulting Services, Comox. I take responsibility for the material
presented in the guidebook, and the views and approaches described are
not necessarily endorsed by all the reviewers.
David Nahwegahbow provided the foreword for which I am grateful,
and he, Chief Arthur Manuel, and Chief Leonard George kindly providedsome words of support for the back cover. Justin George graciously helped
obtain Chief George’s contribution.
My thanks to all the photographers who allowed me to publish their
material: David Carruthers (page xiii), Lawrence Catholique (page 51), Petr
Cizek (pages iv, 2), Shirl Hall (pages 41, 42), Greg Michalenko (both photoson page 45 ), Scot Nickels (bottom photos on pages 20, 54), Kerry Prosper
(top photo on front cover and pages 34, 36, 44) and the Union of BC Indian
Chiefs (back cover). Special permission has been given by the photogra-phers to use the photos for the sole purpose of this manual. Any photo not
credited in the forgoing was taken by myself (or in a couple instances, with
the use of my camera).
I am grateful to the community of Pangnirtung for allowing me to use
David Carruther’s photograph of their inukshuk, and to Matthew Nakashukand Margaret Karpik for obtaining that permission. I also want to thank
Jennifer Carpenter of the Heiltsuk Cultural Education Centre, for getting a
selection of Heiltsuk photos to me for consideration, and for obtaining theHeiltsuk permission forms. Victor Oskenekisses of Wrigley kindly obtained
the OK from Elder Felix Tale to use the two photographs showing Felix.
Vince Natomagan’s efforts in obtaining permissions from Raymond Iron,Dale Smith and Henry Smith are greatly appreciated, as is his family’s
○ ○ ○ ○ ○ ○ ○ ○ ○ ○ ○ ○ ○ ○ ○ ○ ○ ○ ○ ○ ○ ○ ○
A c k n o w l e d g e m e n t s
ix
permission to use a photo of the late Elder Helen Natomagan. Thanks to
Bernadette Ratt for obtaining Larry Iron’s OK, and to Hector Jerome forchasing down permissions from Antoine and Lucie Decoursay, and Elder
Genevieve Decoursay.
And my thanks to those recognizable in the photos who gave me
permission to have their images published. These include Sam Acko,
Fred Askoty, Elder Aloysius Benoit, Gloria Benoit, Chief Stewart Cameron,Cyril Carpenter, Petr Cizek, Antoine Decoursay, Elder Genevieve Decoursay,
Lucie Decoursay, Russell Diabo, Lana Garbitt, Deana Hunt, Elder Peter
Hunter, Alvin Iron, Larry Iron, Raymond Iron, Phil Jeddore, Hector Jerome,Jayne Konisenta, Chief Peter Marsellais, Stan McDonald, James Michael, Chief
Vernon Morris, Stan Napolean, Scot Nickels, Elder Leo Norwegian,
Carrie Paquette, Peter Paul, Kerry Prosper, Sue Roark-Calnek, Dale Smith,Henry Smith, Elder Martin Smith, Benny Stewart, Elder Felix Tale,
Michel Thusky, and Elder Evelyn Windsor.
Tim Bernard of the Mi’kmaq Maliseet Nations News provided the photo
of Kerry Prosper’s map biography (bottom, front cover). My sincere thanks
to Kerry for letting me use his map biography on the cover, and for allowinghis name to be used in the book’s title. Special thanks to Hector Jerome,
barrel-chested elder of the Algonquins of Barriere Lake, for making avail-
able his map biography (page 13). I am grateful to the Algonquins of BarriereLake for permission to reproduce images of their preliminary composite
maps (pages 14-17), and to David Nahwegahbow for facilitating that
permission. And thanks to Bruce Byford and Michele Rodrick of ArbexForest Resource Consultants Ltd. for sending the Algonquins’ digital files.
My thanks to Alex Rose for his professional editing services, to ArifinGraham of Alaris Design for the layout, and to Dirk Van Stralen of Awesome
Ink for providing the thumbnails and figures. Chief Arthur Manuel of the
Neskonlith Indian Band provided permission to use his community’s offi-cial letterhead for a sidebar graphic, as did Councillor Ken Dennis on behalf
of the Adams Lake Indian Band. Thanks to Sikee Liu of Ecotrust Canada, for
helping to identify the terms for inclusion in the glossary. David Carruthersof Ecotrust did a fine job stick handling this publication through the pro-
duction process, not to mention his yeoman patience in bearing with the
vagaries of my life, and all that has meant for nailing down a publicationdeadline. My sincere thanks also to Leigh Ogston, of the Union of BC Indian
Chiefs, for her patience.
The Union of British Columbia Indian Chiefs supported the writing of
the initial draft of this manual, and the Walter and Duncan Gordon Foun-
dation funded the production costs. My thanks to Christine Lee and ChrisGullage of the Gordon Foundation for helping to distribute the manuscript
to a wide network of reviewers.
○ ○ ○ ○ ○ ○ ○ ○ ○ ○ ○ ○ ○ ○ ○ ○ ○ ○ ○ ○ ○ ○ ○
C H I E F K E R R Y ’ S M O O S E
x
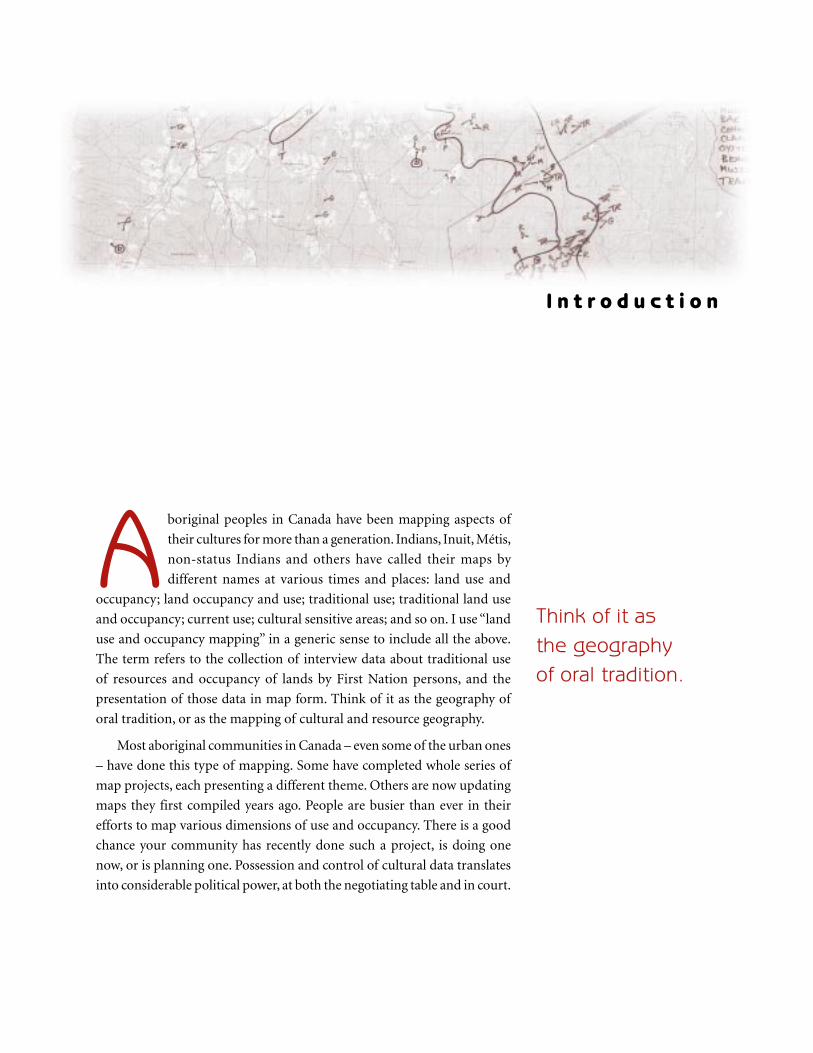
A boriginal peoples in Canada have been mapping aspects of
their cultures for more than a generation. Indians, Inuit, Métis,
non-status Indians and others have called their maps by
different names at various times and places: land use and
occupancy; land occupancy and use; traditional use; traditional land use
and occupancy; current use; cultural sensitive areas; and so on. I use “land
use and occupancy mapping” in a generic sense to include all the above.
The term refers to the collection of interview data about traditional use
of resources and occupancy of lands by First Nation persons, and the
presentation of those data in map form. Think of it as the geography of
oral tradition, or as the mapping of cultural and resource geography.
Most aboriginal communities in Canada – even some of the urban ones
– have done this type of mapping. Some have completed whole series of
map projects, each presenting a different theme. Others are now updating
maps they first compiled years ago. People are busier than ever in their
efforts to map various dimensions of use and occupancy. There is a good
chance your community has recently done such a project, is doing one
now, or is planning one. Possession and control of cultural data translates
into considerable political power, at both the negotiating table and in court.
Think of it asthe geographyof oral tradition.
I n t r o d u c t i o n
Good quality mapping can be used in support of many different
projects, some of which are listed below.
◆ Documenting elders’ oral history before more knowledge is lost.
◆ Determining shared use areas and reconciling boundary conflictsbetween neighbouring aboriginal communities.
◆ Providing evidence for court cases involving aboriginal rightsand title.
◆ Settling treaty and claims under federal land claims processes.
◆ Supporting compensation claims.
◆ Negotiating co-management agreements.
◆ Negotiating protective measures and benefits from industrialdevelopment.
◆ Determining probable impacts of development.
◆ Supporting injunctions to stop unwanted development.
◆ Providing baseline data for long-term community planning andresource management.
◆ Supporting administrative programs such as land use permitting.
◆ Developing education curricula.
Any group with aspirations to meaningful self-government and recog-
nition of rights will engage in this kind of research. Governments probably
will not drop extinguishment and surrender of aboriginal title from their
agendas, although they may use different words for them. The need to do
cultural research will remain as important as ever. Your grandparents’ and
parents’ knowledge about their cultural pursuits and use of resources
is central to getting recognition of rights in today’s political climate.
Similarly, the ability to document your own and your childrens’ land and
water-based activities may be critical for proving title and rights in the
decades to come.
Even in a friendly political climate, an aboriginal government must
acquire, update, and control access to an inventory of its people’s cultural
resources. Self-government requires the capacity to manage resources.
Baseline inventories of cultural sites are needed and periodically need to
be refined, verified and updated. Culture is not static or fixed in stone –
patterns of occupancy and use change over time. There will always be a
need to do good research, whether this involves collecting an initial base-
line inventory or doing subsequent monitoring for change.
Many First Nation groups and communities have expressed concerns
about a lack of clear direction for generating maps that will serve them
well. This guide offers some ideas and recommendations that will result in
Governmentsprobably will not
drop extinguishmentand surrender from
their agendas.
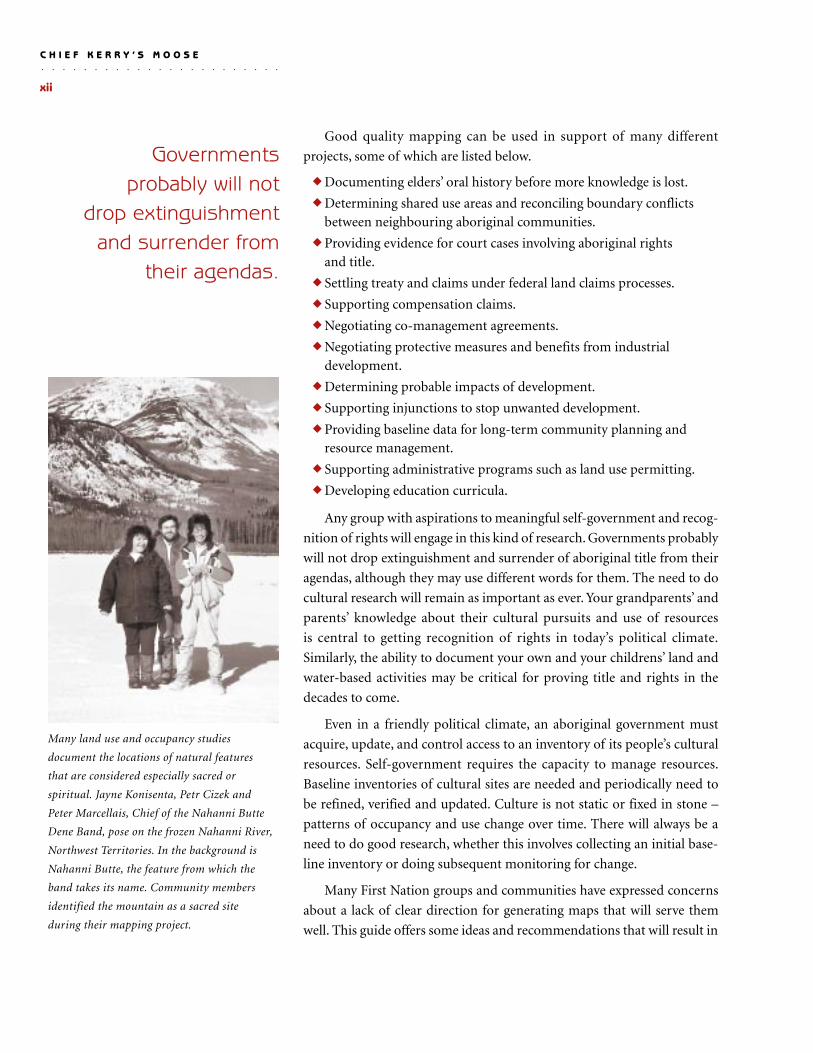
Many land use and occupancy studies
document the locations of natural features
that are considered especially sacred or
spiritual. Jayne Konisenta, Petr Cizek and
Peter Marcellais, Chief of the Nahanni Butte
Dene Band, pose on the frozen Nahanni River,
Northwest Territories. In the background is
Nahanni Butte, the feature from which the
band takes its name. Community members
identified the mountain as a sacred site
during their mapping project.
○ ○ ○ ○ ○ ○ ○ ○ ○ ○ ○ ○ ○ ○ ○ ○ ○ ○ ○ ○ ○ ○ ○
C H I E F K E R R Y ’ S M O O S E
xii
○ ○ ○ ○ ○ ○ ○ ○ ○ ○ ○ ○ ○ ○ ○ ○ ○ ○ ○ ○ ○ ○ ○
I n t r o d u c t i o n
xiii
the construction of good maps. It is based on almost two decades of expe-
rience designing land use and occupancy mapping projects, and working
with indigenous peoples at the community level to collect the data they
need. The recommendations are grounded in hard experience of what
has and has not worked for these kinds of projects.
This book is for leaders, administrators, and program personnel at the
community or First Nation government level, as well as their consultants
and external research people, and community researchers who have had
experience with similar kinds of studies. The information and ideas
contained here should be of use to anyone who has the responsibilities
of designing mapping projects and providing guidance to community
interviewers.
What follows is a consideration of the key factors that lead to success
for aboriginal mapping. I do not offer a simple formula, or off-the-shelf
methodology, that can be applied across the board. This is impossible. There
are so many different reasons that research is done, a huge range of
cultural and linguistic diversity among Canada’s indigenous communities,
and enormous contrasts in various nations’ relationships to resources.
The lifestyles of an urban community, and its dependence on traditional
harvesting, are very different from a northern village’s.
The discussion starts with what land use and occupancy mapping is
about and cautions you to consider an important distinction between use
and occupancy. I then outline the tasks involved. The concepts of map
biography and map composite are introduced with the help of samples
from a particular project. The guide then emphasizes the importance of
quality data, and goes on to stress that although people tend to underesti-
mate the challenge of obtaining good data, it is straightforward once
you know how to conduct what is called social science. The importance of
avoiding the museum approach to mapping is highlighted, followed by
a look at how to lay the groundwork for good research. Obtaining and
training good personnel, taking control of research design, and respecting
your workers’ limitations are discussed. Special attention is paid to response
burden, the factor that most commonly undermines research. The five
defining characteristics of any project (the why, who, when, where, and
what) are discussed, along with the principles guiding research design and
implementation, the measures of quality, and the culture of research. The
guide ends with a summary of recommendations. There is a glossary at
the back to help the reader with terms that may be unfamiliar.
The recommendationsare groundedin hard experienceof what hasand has not workedfor these kindsof projects.
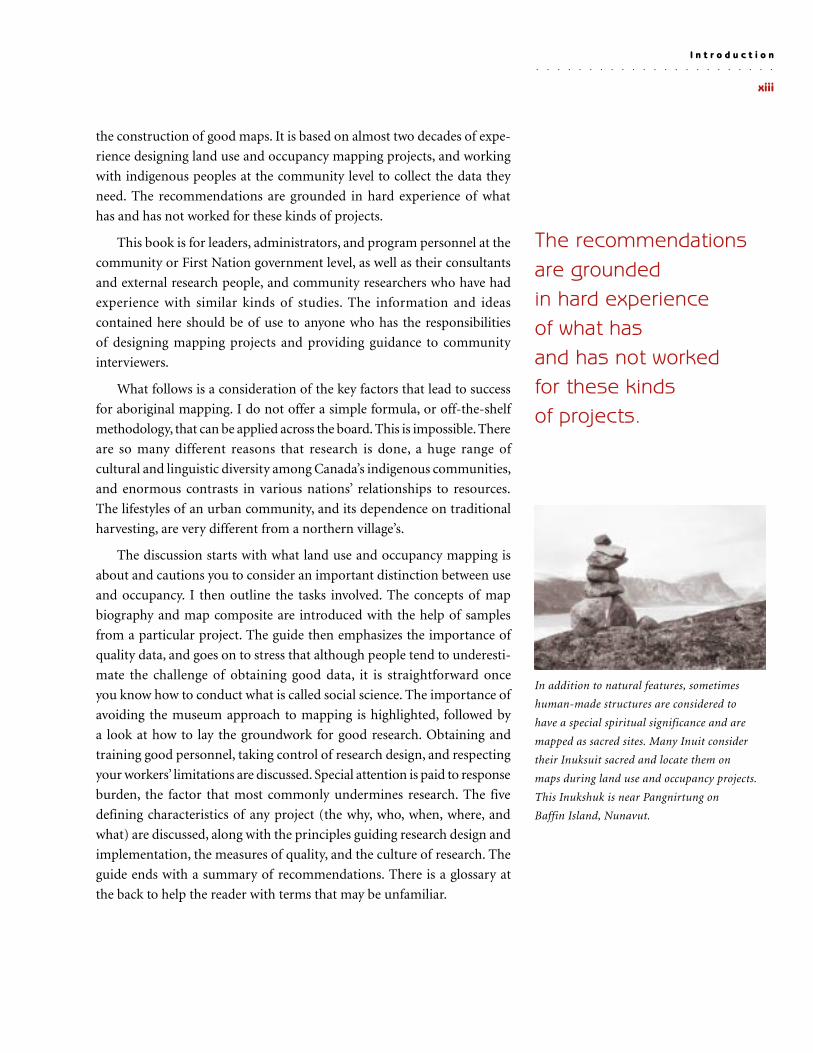
In addition to natural features, sometimes
human-made structures are considered to
have a special spiritual significance and are
mapped as sacred sites. Many Inuit consider
their Inuksuit sacred and locate them on
maps during land use and occupancy projects.
This Inukshuk is near Pangnirtung on
Baffin Island, Nunavut.
D espite the tremendous diversity among First Nations they all
share one thing – the harvesting of fish, wildlife, and plant
materials has been the historical basis of economic life. Many
aboriginal communities remain dependent on wild
mammals, birds, fish, other creatures, and undomesticated plants to feed
and shelter themselves. In the pursuit of the resources that continue to be
the foundation of their cultures, people leave traces over the landscape,
evidence that they have been there. Many of their activities leave no visible
evidence, however. Instead, they etch themselves in the minds of those
who travel their homeland in search of physical and spiritual sustenance.
First Nation peoples carry maps of their homelands in their heads. For
most people, these mental images are embroidered with intricate detail
and knowledge, based on the community’s oral history and the individu-
al’s direct relationship to the traditional territory and its resources. Land
use and occupancy mapping is about documenting those aspects of the
individual’s experience that can be shown on a map. It is about telling the
story of a person’s life on the land. Over time individual experience
becomes part of the collective oral tradition, a story of much grander
proportions. In this respect, use and occupancy mapping is a means to
help record a nation’s oral history.
Mapping is not just about obtaining a set of maps. There are other
benefits that arise from the process of obtaining them. When properly done,
use and occupancy interviews increase the participants’ awareness of their
1L a n d U s e a n d O c c u p a n c y M a p p i n g :
A D e f i n i t i o n a n d a W a r n i n g
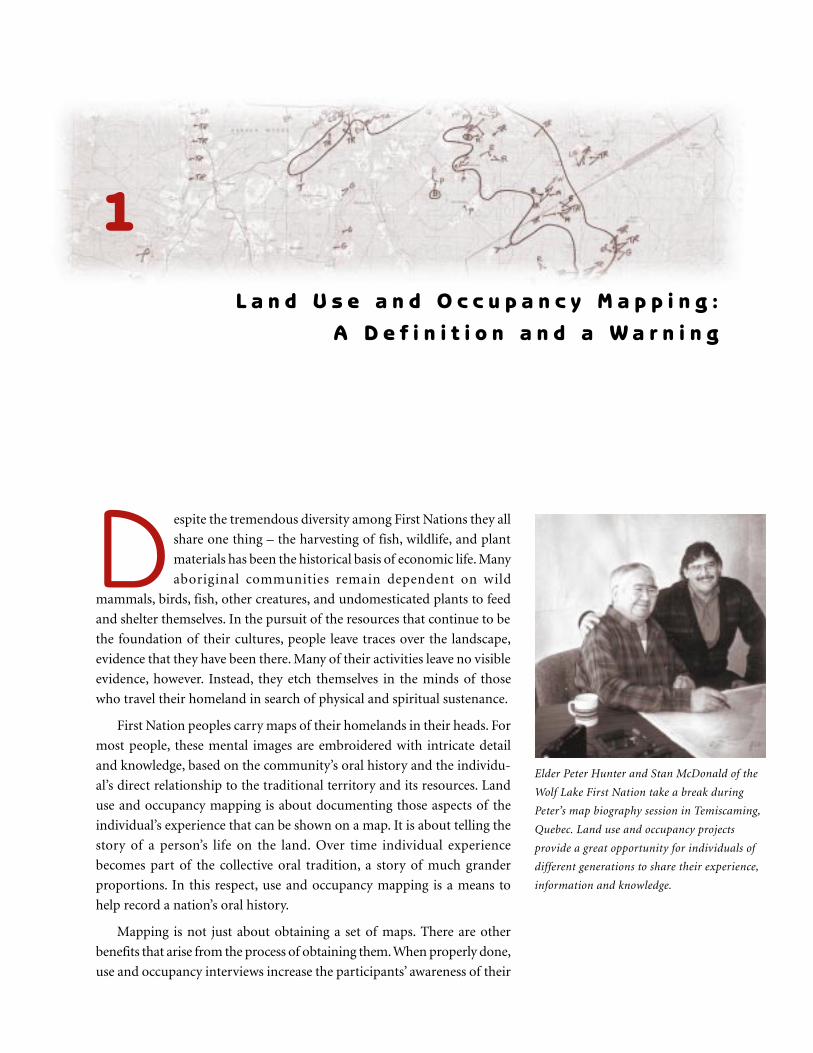
Elder Peter Hunter and Stan McDonald of the
Wolf Lake First Nation take a break during
Peter’s map biography session in Temiscaming,
Quebec. Land use and occupancy projects
provide a great opportunity for individuals of
different generations to share their experience,
information and knowledge.
○ ○ ○ ○ ○ ○ ○ ○ ○ ○ ○ ○ ○ ○ ○ ○ ○ ○ ○ ○ ○ ○ ○
C H I E F K E R R Y ’ S M O O S E
2
connection to territory. People are usually surprised to see how much they
have used their land. They often have a new-found sense that their activi-
ties as individuals are part of a larger picture involving the whole commu-
nity. Mapping always gives rise to a heightened awareness of aboriginal
rights that have been denied, and an increased willingness to be involved
in strategies to right long-standing injustices. There are opportunities for
individuals of different generations to share their experience, information
and knowledge.
Elders from different villages are often brought together, renewing
bonds between communities and strengthening the First Nation. Overall,
land use and occupancy mapping helps to invigorate a people’s pride in its
cultural heritage. In addition, the administrative and technical capacity
acquired through successful mapping projects increases the nation’s
abilities to administer and manage its territory.
Listed below are some of the types of land use and occupancy informa-
tion that have been mapped by aboriginal groups.
◆ Places where animals are harvested for food, clothing, medicines,tools, and other purposes.
◆ Places where plant materials are harvested for food, clothing,medicines, tools, shelter and fuel.
◆ Places where rocks, minerals, and soils are collected for making tools,conducting ceremonies, and other purposes.
◆ Ecological knowledge of habitats and sites critical to the survival ofimportant animal populations; for instance, caribou migrationcorridors, islands where moose calve, waterfowl breeding groundsand staging areas, and spawning beds.
◆ Habitation sites, such as settlements, trading posts, cabins, camps,and burial grounds.
◆ Spiritual or sacred places such as ceremony sites, rock paintings,areas inhabited by non-human or supernatural beings, and birth anddeath sites.
◆ Legends and other accounts about specific places.
◆ Travel and trade routes.
◆ Aboriginal place names.
Dr. Peter Usher, one of the pioneers of land use and occupancy meth-
odology, has made an important distinction between “use” and “occupancy.”
He regards some of the above kinds of information as evidence of one or
the other, but not both. Peter has looked closely at this distinction while
examining First Nations’ maps, and his work indicates that it is critical to
pay attention to the difference between use and occupancy when using
maps in certain political processes.
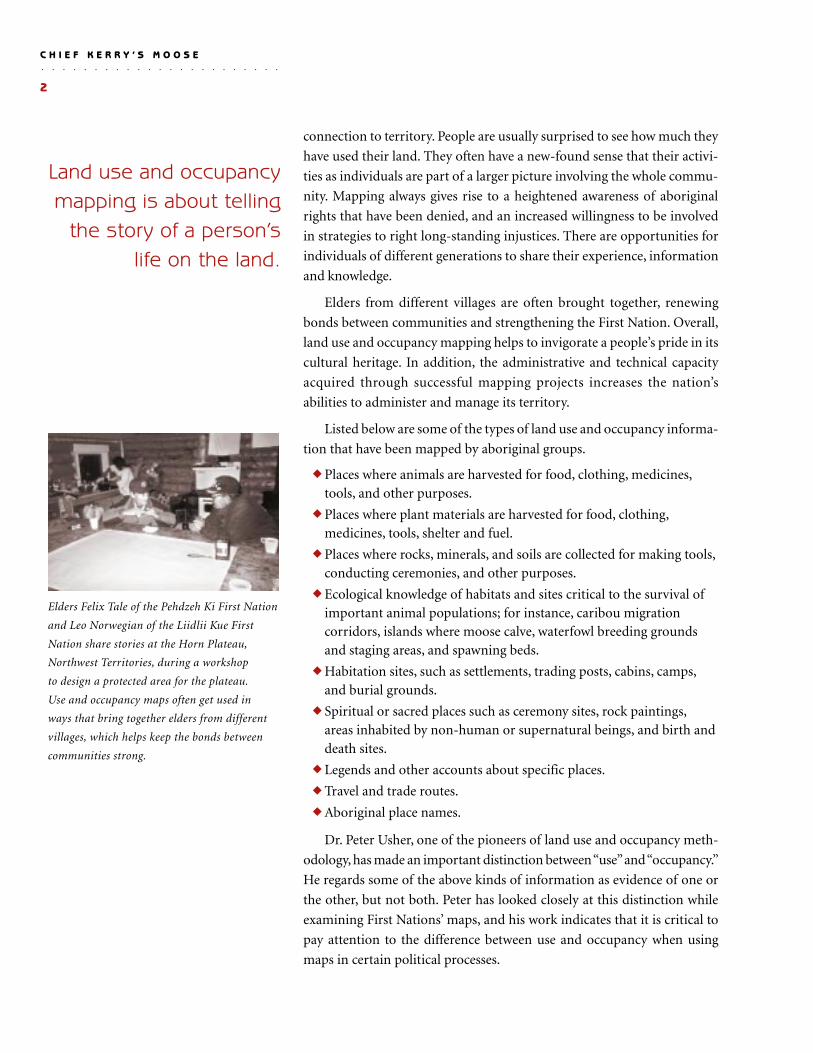
Elders Felix Tale of the Pehdzeh Ki First Nation
and Leo Norwegian of the Liidlii Kue First
Nation share stories at the Horn Plateau,
Northwest Territories, during a workshop
to design a protected area for the plateau.
Use and occupancy maps often get used in
ways that bring together elders from different
villages, which helps keep the bonds between
communities strong.
Land use and occupancymapping is about telling
the story of a person’slife on the land.
3
The following distinction draws directly from Peter’s work:
Use refers to activities involving the harvest of traditional resources;
things like hunting, trapping, fishing, gathering of medicinal plants and
berry picking, and travelling to engage in these activities. For any given
community or nation, use occurs over a specific geographic area.
Occupancy refers to the area which, as Peter puts it, a “particular group
regards as its own by virtue of continuing use, habitation, naming, knowl-
edge, and control.”
These two geographic areas are usually different in extent. Use map-
ping documents the locations where activities like hunting, fishing and
travelling occur. Occupancy mapping, by contrast, records the following
types of information: stories and legends about places; ecological knowl-
edge of places; indigenous place names; habitation sites like cabins and
burial grounds.
The geographic extent of use tends to be larger than the extent of occu-
pancy, and in Peter Usher’s words, “limits of occupancy are likely to be
much more stable over time than the limits of use; the mapping of occu-
pancy, in contrast to use, would normally reveal both much less overlap
and a more obvious boundary between aboriginal territories” (Figure 1).
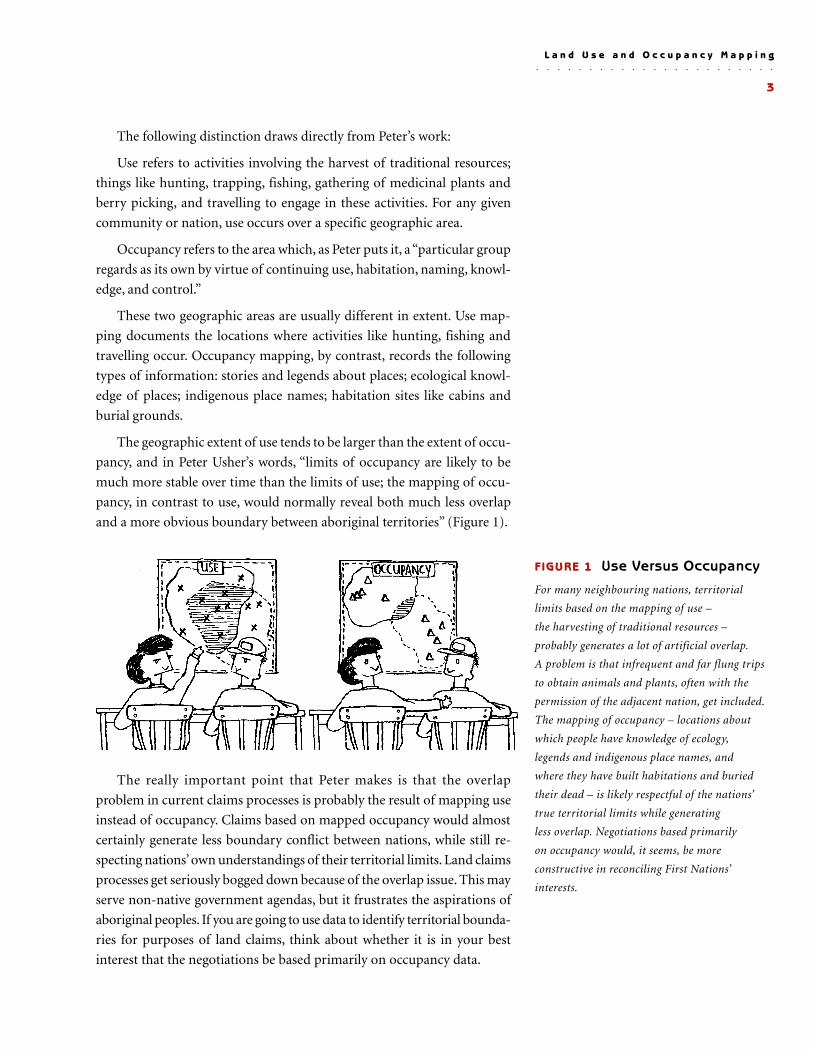
The really important point that Peter makes is that the overlap
problem in current claims processes is probably the result of mapping use
instead of occupancy. Claims based on mapped occupancy would almost
certainly generate less boundary conflict between nations, while still re-
specting nations’ own understandings of their territorial limits. Land claims
processes get seriously bogged down because of the overlap issue. This may
serve non-native government agendas, but it frustrates the aspirations of
aboriginal peoples. If you are going to use data to identify territorial bounda-
ries for purposes of land claims, think about whether it is in your best
interest that the negotiations be based primarily on occupancy data.
FIGURE 1 Use Versus Occupancy
For many neighbouring nations, territorial
limits based on the mapping of use –
the harvesting of traditional resources –
probably generates a lot of artificial overlap.
A problem is that infrequent and far flung trips
to obtain animals and plants, often with the
permission of the adjacent nation, get included.
The mapping of occupancy – locations about
which people have knowledge of ecology,
legends and indigenous place names, and
where they have built habitations and buried
their dead – is likely respectful of the nations’
true territorial limits while generating
less overlap. Negotiations based primarily
on occupancy would, it seems, be more
constructive in reconciling First Nations’
interests.
○ ○ ○ ○ ○ ○ ○ ○ ○ ○ ○ ○ ○ ○ ○ ○ ○ ○ ○ ○ ○ ○ ○
L a n d U s e a n d O c c u p a n c y M a p p i n g
○ ○ ○ ○ ○ ○ ○ ○ ○ ○ ○ ○ ○ ○ ○ ○ ○ ○ ○ ○ ○ ○ ○
C H I E F K E R R Y ’ S M O O S E
4
A n ideal use and occupancy mapping project includes all of the
tasks discussed below. Successful projects include most of
them. The tasks obviously have to occur in a general sequence,
but in practice the steps are not as linear as they appear. Some
of them require months to complete. To meet project deadlines, it is
usually necessary to carry out certain tasks at the same time.
The first four tasks produce what is called raw data, which are the many
thousands of individual datum, or facts, contained on interview
audiocassettes and participants’ overlays and maps. Tasks 1-4 take you to
the end of the data collection part of land use and occupancy mapping
research, and they are the subject of this guide. Tasks 5-13 occur after the
data are collected. They are discussed briefly below to provide a sense of
the things you will have to do with the raw data to get them into forms that
are useable; for example, reports, databases, or community map sets. These
are often referred to as research product.
TASK 1 Development of Community Consensus
There is no point starting a land use and occupancy mapping project
unless people in the community want it to happen. There must be a sub-
stantial number of individuals willing to participate. Seemingly obvious,
this requirement is sometimes lost sight of in the flush of excitement when
funding becomes available to do research. Community support is one of
2T h e Ta s k s o f a M a p p i n g P r o j e c t
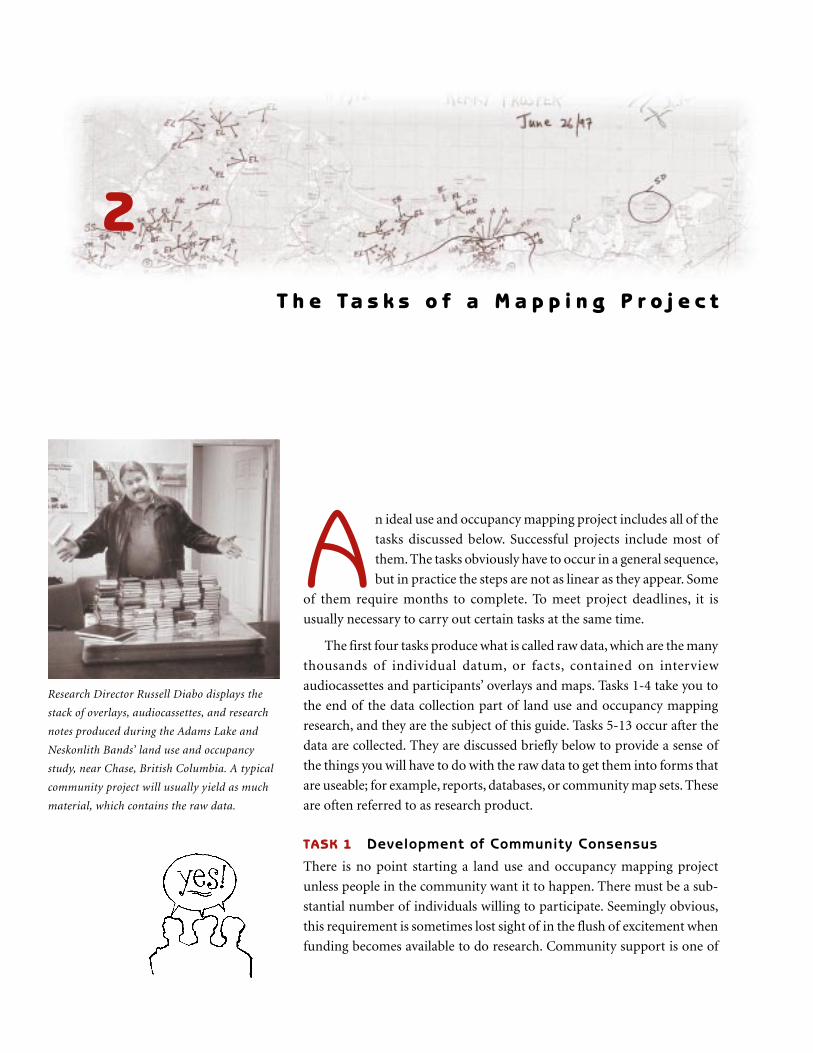
Research Director Russell Diabo displays the
stack of overlays, audiocassettes, and research
notes produced during the Adams Lake and
Neskonlith Bands’ land use and occupancy
study, near Chase, British Columbia. A typical
community project will usually yield as much
material, which contains the raw data.
5
the three key factors that must be in place for use and occupancy mapping
to succeed. (Its importance is discussed in Laying the Groundwork for Good
Research in Chapter 4.)
TASK 2 Hiring and Training Personnel
The second key factor for success is the team of people who do the inter-
viewing. These individuals must have dedication to the project and the
skills needed to collect data from community members. (Discussion of
Research Personnel and Training appears in Chapter 4.)
TASK 3 Development of Research Designand Testing of Interview Guide
Data collectors will be using an interview guide when they ask community
people for their use and occupancy information. The interview guide points
to the third factor that must be in place for the mapping to succeed. It
guides the asking of questions, and is the most concrete expression of re-
search design. (This entire book is about research design, but the following
sections are most to the point: Chapter 4: Avoiding Response Burden;
Chapter 5: Designing the Project; Chapter 6: Principles of Research Design
and Implementation; and Chapter 7: Measuring Quality.)
TASK 4 Interviewing Participantsand Collecting Map Biographies
Use and occupancy data are collected using a standard method known as
the map biography. This is a face to face interview during which the par-
ticipant indicates on a map the places he or she has harvested resources or
gone to for spiritual purposes. In some cases the participant also marks
places that he or she has never used or even visited, but has knowledge
about. (See Chapter 3: Map Biographies and Composites.)
TASK 5 Replication and Storage of Raw Data
After data are collected, it is a good idea to make copies of the maps and
tapes that contain them. Most nations now recognize the importance of
having back-up copies of all raw data, because many communities have
lost irreplaceable data through fire, vandalism, water damage, or simply by
losing track of materials when community administrations change or move
from one building to another. Videocassettes, audiocassettes, and research
notes can be easily copied, and maps or overlays can be reproduced using a
variety of processes including photography and blueprinting. Copies and
originals should be stored in separate and secure locations. One nation
carefully copied all its raw data, then stored the copies alongside the origi-
nals. An arsonist torched the building, destroying years’ worth of data, much
of it from elders who had passed on.
○ ○ ○ ○ ○ ○ ○ ○ ○ ○ ○ ○ ○ ○ ○ ○ ○ ○ ○ ○ ○ ○ ○
T h e T a s k s o f a M a p p i n g P r o j e c t
○ ○ ○ ○ ○ ○ ○ ○ ○ ○ ○ ○ ○ ○ ○ ○ ○ ○ ○ ○ ○ ○ ○
C H I E F K E R R Y ’ S M O O S E
6
TASK 6 Translation of Indigenous LanguageInterview Tapes
Sometimes it is necessary to have all the interviews done in the indigenous
language. For instance, some use and occupancy mapping involves getting
information that is best expressed using the first tongue, things like eco-
logical knowledge and aboriginal place names. Other kinds of data can be
as easily obtained using English or French.
Is it necessary to interview all participants about where they harvested
resources or travelled or camped on their territory, in the indigenous
language? Although ideally this would be preferable, the question raises
two important issues.
◆ Many communities now have only a handful of people whounderstand the old people’s vocabulary and their way of usinglanguage well enough to make a good translation of their language.
◆ Translation work is very time consuming, which means it is alsoexpensive.
These two factors can create a situation where the audiocassette data are
temporarily, even permanently, unavailable. Also, because of the intensity
of translation work and the possibility of burnout, the best research design
might involve using your skilled translators only when they are really
needed.
Obviously, any elder who does not speak English or French, or who has
a strong preference to be interviewed only in their first language, should
have her or his wish respected.
TASK 7 Transcription of Audiocassettes
Interview tapes contain raw data that need to be converted into written or
typed form, called transcripts, so that they can be turned into a useable
research product like a report. Whenever possible transcripts should be
input into a computer because a word processor allows users of the data to
search for information electronically.
Sometimes it is necessary to make verbatim transcriptions, in which
every word heard on the tape is recorded in the transcript. This is very time
consuming and expensive, requiring about nine hours of labour for each
recorded hour. It should be undertaken only when really necessary so that
more of the project’s budget can be used for other tasks. It may be neces-
sary to make verbatim transcripts in preparation for court, but is it neces-
sary to do so when producing a report for presentation at a co-management
table? A lot of material can be transcribed using a non-verbatim approach,
requiring perhaps three hours of labour for each cassette hour.
Many communities havelost irreplaceable data
through fire, vandalism,water damage,
or simply by losingtrack of materials.
7
TASK 8 Review of Transcripts and Map Biography Data
In this task the reviewer carefully reads each participant’s transcript while
checking the data that were marked on that person’s overlays or maps dur-
ing the interview. There might be a checklist of two or three dozen items
that have to be kept in mind while looking at each overlay. This review has
three main purposes. One is that the material in the transcript is checked
for consistency with the material marked on the overlays. Any contradic-
tions, omissions, or other problems are noted for clarification by the par-
ticipant. A simple example would be a burial site on the map that is not
mentioned in the transcript. Two, the reviewer also makes sure everything
marked on each overlay follows the rules the interviewers were supposed
to use during data collection (Task 4). Are the titles and labels correct, map
symbols readable, and polygons completed? This process makes the
digitizers’ job (Task 9) much easier and shorter. The third main reason for
doing the review is that all the transcript data are coded, in the margin of
the transcript copy, in preparation for database entry (Task 11) and report
writing (Task 13).
TASK 9 Digitizing Data on Map Biographiesand Producing Digital Composites
Digitizing is the process of converting data that have been marked on over-
lays or paper maps into electronic form. Data are stored in a computer
running geographical information systems (GIS) software, which is a
mapping software program. All the data appearing on all participants’
overlays get digitized. Once they are in electronic form, they are checked
against the original hard-copy maps or overlays, to make sure the digitizers
did not accidentally omit data or locate some inaccurately. The digitized
information can then be stored and combined in different ways. Various
combinations are produced as digital composites and can be displayed
on the computer screen (Task 10). They can also be printed as composite
maps on paper (Task 12), again showing any combination of data.
Flexibility alone makes developing GIS capacity a good investment when
possible. Producing map sets by hand will meet certain limited objectives,
but the disadvantage is that all that work goes into producing a set of
maps that can only be used for one or two purposes. GIS costs are high,
technicians need a lot of training and experience, and digitizing is
time-consuming, but once the data are digitized your nation can always
add new data, or go back and print out new maps that show different
combinations of old data.
○ ○ ○ ○ ○ ○ ○ ○ ○ ○ ○ ○ ○ ○ ○ ○ ○ ○ ○ ○ ○ ○ ○
T h e T a s k s o f a M a p p i n g P r o j e c t
Flexibility alone makesdeveloping GIS capacitya good investmentwhen possible.
○ ○ ○ ○ ○ ○ ○ ○ ○ ○ ○ ○ ○ ○ ○ ○ ○ ○ ○ ○ ○ ○ ○
C H I E F K E R R Y ’ S M O O S E
8
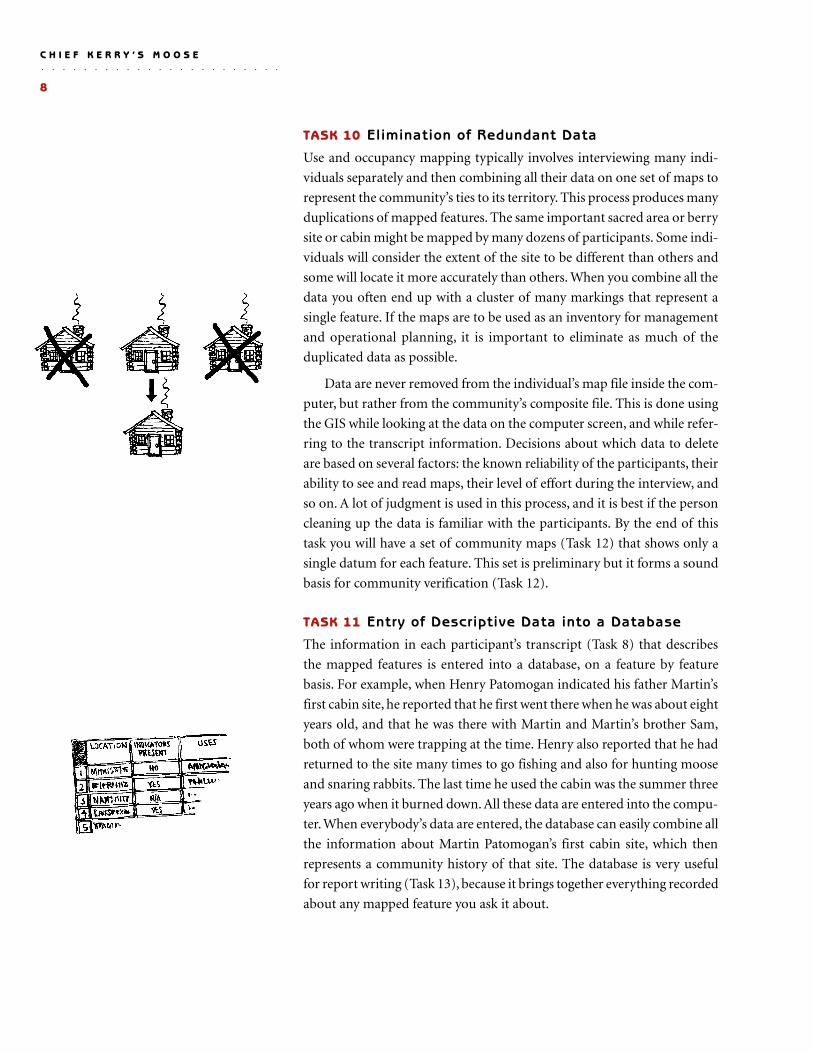
TASK 10 Elimination of Redundant Data
Use and occupancy mapping typically involves interviewing many indi-
viduals separately and then combining all their data on one set of maps to
represent the community’s ties to its territory. This process produces many
duplications of mapped features. The same important sacred area or berry
site or cabin might be mapped by many dozens of participants. Some indi-
viduals will consider the extent of the site to be different than others and
some will locate it more accurately than others. When you combine all the
data you often end up with a cluster of many markings that represent a
single feature. If the maps are to be used as an inventory for management
and operational planning, it is important to eliminate as much of the
duplicated data as possible.
Data are never removed from the individual’s map file inside the com-
puter, but rather from the community’s composite file. This is done using
the GIS while looking at the data on the computer screen, and while refer-
ring to the transcript information. Decisions about which data to delete
are based on several factors: the known reliability of the participants, their
ability to see and read maps, their level of effort during the interview, and
so on. A lot of judgment is used in this process, and it is best if the person
cleaning up the data is familiar with the participants. By the end of this
task you will have a set of community maps (Task 12) that shows only a
single datum for each feature. This set is preliminary but it forms a sound
basis for community verification (Task 12).
TASK 11 Entry of Descriptive Data into a Database
The information in each participant’s transcript (Task 8) that describes
the mapped features is entered into a database, on a feature by feature
basis. For example, when Henry Patomogan indicated his father Martin’s
first cabin site, he reported that he first went there when he was about eight
years old, and that he was there with Martin and Martin’s brother Sam,
both of whom were trapping at the time. Henry also reported that he had
returned to the site many times to go fishing and also for hunting moose
and snaring rabbits. The last time he used the cabin was the summer three
years ago when it burned down. All these data are entered into the compu-
ter. When everybody’s data are entered, the database can easily combine all
the information about Martin Patomogan’s first cabin site, which then
represents a community history of that site. The database is very useful
for report writing (Task 13), because it brings together everything recorded
about any mapped feature you ask it about.
9
When people see theircommunity’s mapsfor the first time,they are almost alwayssurprised and delighted.
○ ○ ○ ○ ○ ○ ○ ○ ○ ○ ○ ○ ○ ○ ○ ○ ○ ○ ○ ○ ○ ○ ○
T h e T a s k s o f a M a p p i n g P r o j e c t
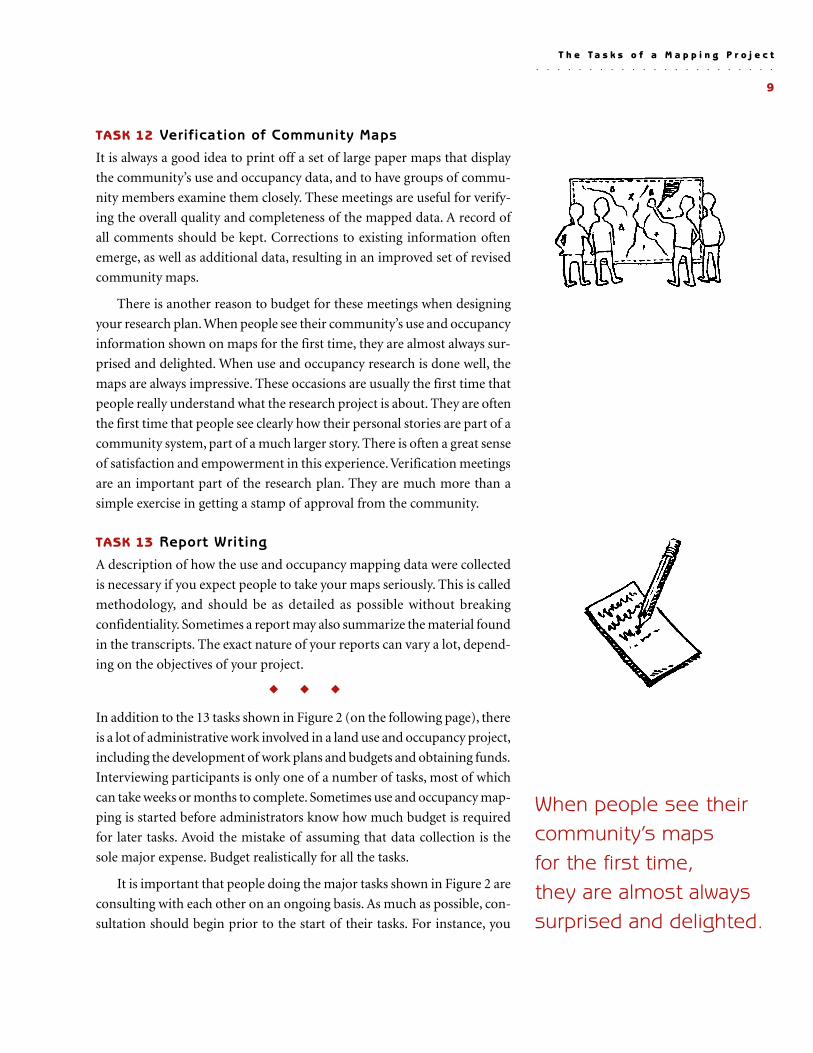
TASK 12 Verification of Community Maps
It is always a good idea to print off a set of large paper maps that display
the community’s use and occupancy data, and to have groups of commu-
nity members examine them closely. These meetings are useful for verify-
ing the overall quality and completeness of the mapped data. A record of
all comments should be kept. Corrections to existing information often
emerge, as well as additional data, resulting in an improved set of revised
community maps.
There is another reason to budget for these meetings when designing
your research plan. When people see their community’s use and occupancy
information shown on maps for the first time, they are almost always sur-
prised and delighted. When use and occupancy research is done well, the
maps are always impressive. These occasions are usually the first time that
people really understand what the research project is about. They are often
the first time that people see clearly how their personal stories are part of a
community system, part of a much larger story. There is often a great sense
of satisfaction and empowerment in this experience. Verification meetings
are an important part of the research plan. They are much more than a
simple exercise in getting a stamp of approval from the community.
TASK 13 Report Writing
A description of how the use and occupancy mapping data were collected
is necessary if you expect people to take your maps seriously. This is called
methodology, and should be as detailed as possible without breaking
confidentiality. Sometimes a report may also summarize the material found
in the transcripts. The exact nature of your reports can vary a lot, depend-
ing on the objectives of your project.
◆ ◆ ◆
In addition to the 13 tasks shown in Figure 2 (on the following page), there
is a lot of administrative work involved in a land use and occupancy project,
including the development of work plans and budgets and obtaining funds.
Interviewing participants is only one of a number of tasks, most of which
can take weeks or months to complete. Sometimes use and occupancy map-
ping is started before administrators know how much budget is required
for later tasks. Avoid the mistake of assuming that data collection is the
sole major expense. Budget realistically for all the tasks.
It is important that people doing the major tasks shown in Figure 2 are
consulting with each other on an ongoing basis. As much as possible, con-
sultation should begin prior to the start of their tasks. For instance, you
○ ○ ○ ○ ○ ○ ○ ○ ○ ○ ○ ○ ○ ○ ○ ○ ○ ○ ○ ○ ○ ○ ○
C H I E F K E R R Y ’ S M O O S E
10
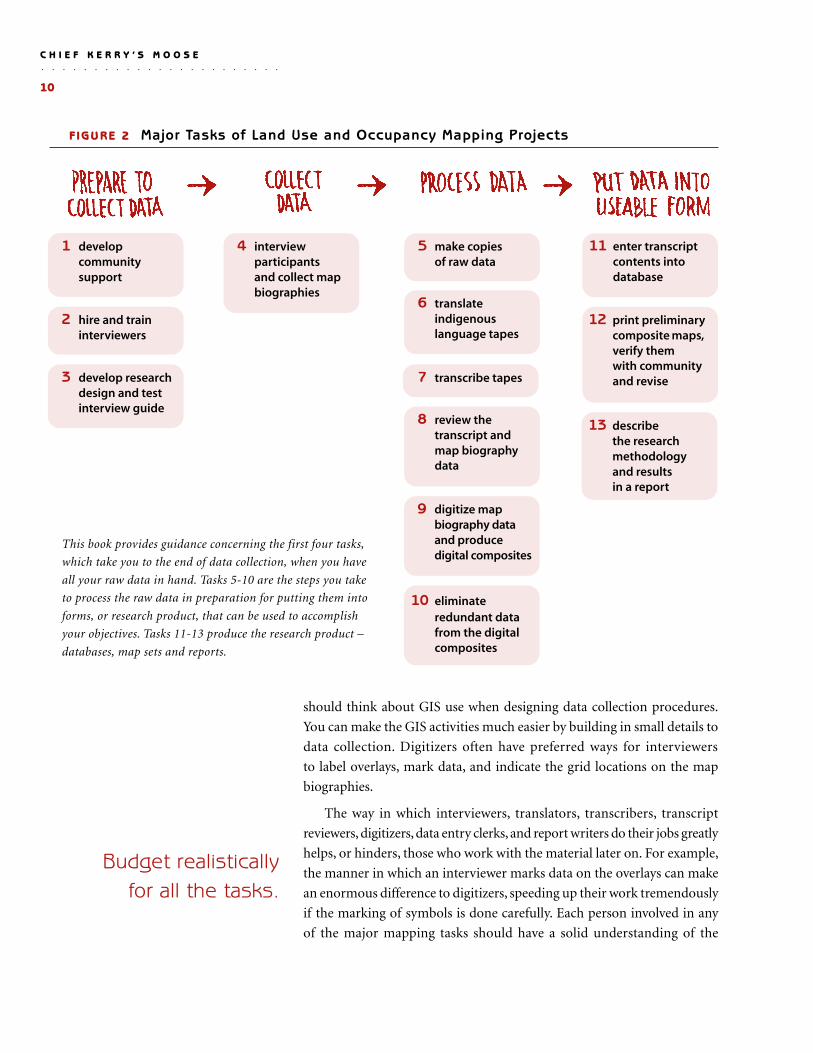
FIGURE 2 Major Tasks of Land Use and Occupancy Mapping Projects
This book provides guidance concerning the first four tasks,
which take you to the end of data collection, when you have
all your raw data in hand. Tasks 5-10 are the steps you take
to process the raw data in preparation for putting them into
forms, or research product, that can be used to accomplish
your objectives. Tasks 11-13 produce the research product –
databases, map sets and reports.
3 develop researchdesign and testinterview guide
2 hire and traininterviewers
1 developcommunitysupport
4 interviewparticipantsand collect mapbiographies
5 make copiesof raw data
6 translateindigenouslanguage tapes
7 transcribe tapes
8 review thetranscript andmap biographydata
9 digitize mapbiography dataand producedigital composites
10 eliminateredundant datafrom the digitalcomposites
11 enter transcriptcontents intodatabase
12 print preliminarycomposite maps,verify themwith communityand revise
13 describethe researchmethodologyand resultsin a report
should think about GIS use when designing data collection procedures.
You can make the GIS activities much easier by building in small details to
data collection. Digitizers often have preferred ways for interviewers
to label overlays, mark data, and indicate the grid locations on the map
biographies.
The way in which interviewers, translators, transcribers, transcript
reviewers, digitizers, data entry clerks, and report writers do their jobs greatly
helps, or hinders, those who work with the material later on. For example,
the manner in which an interviewer marks data on the overlays can make
an enormous difference to digitizers, speeding up their work tremendously
if the marking of symbols is done carefully. Each person involved in any
of the major mapping tasks should have a solid understanding of the
Budget realisticallyfor all the tasks.
11
○ ○ ○ ○ ○ ○ ○ ○ ○ ○ ○ ○ ○ ○ ○ ○ ○ ○ ○ ○ ○ ○ ○
T h e T a s k s o f a M a p p i n g P r o j e c t
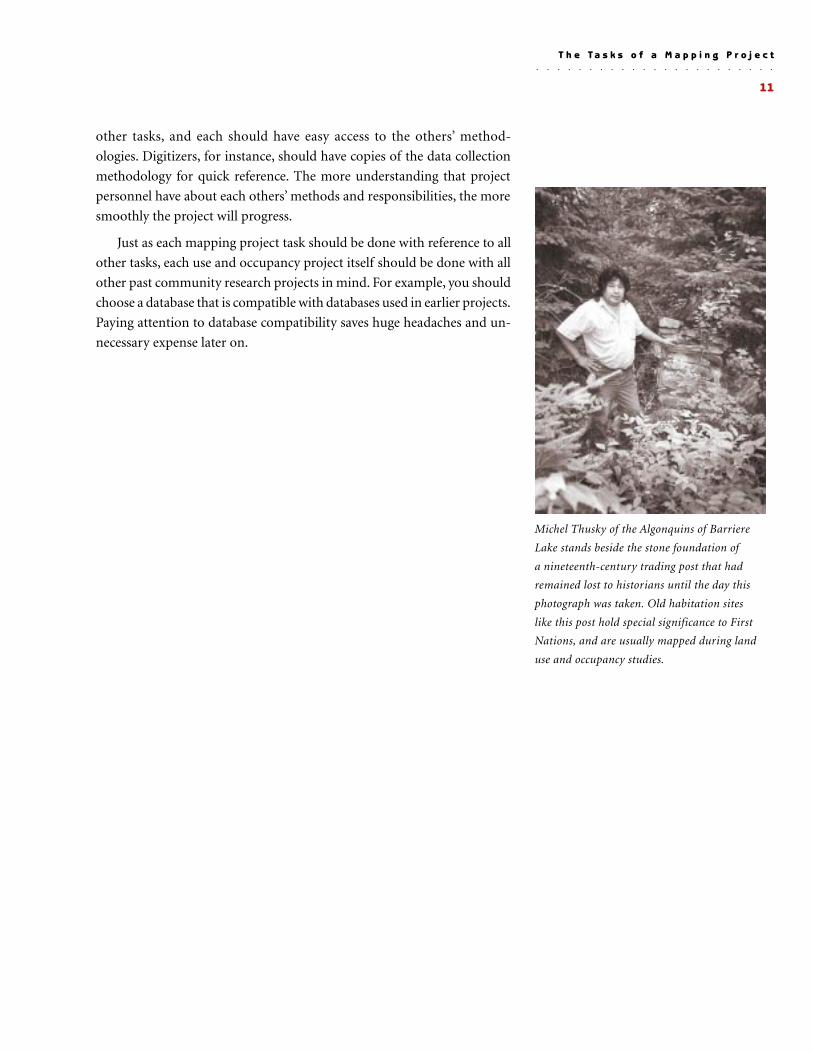
Michel Thusky of the Algonquins of Barriere
Lake stands beside the stone foundation of
a nineteenth-century trading post that had
remained lost to historians until the day this
photograph was taken. Old habitation sites
like this post hold special significance to First
Nations, and are usually mapped during land
use and occupancy studies.
other tasks, and each should have easy access to the others’ method-
ologies. Digitizers, for instance, should have copies of the data collection
methodology for quick reference. The more understanding that project
personnel have about each others’ methods and responsibilities, the more
smoothly the project will progress.
Just as each mapping project task should be done with reference to all
other tasks, each use and occupancy project itself should be done with all
other past community research projects in mind. For example, you should
choose a database that is compatible with databases used in earlier projects.
Paying attention to database compatibility saves huge headaches and un-
necessary expense later on.
○ ○ ○ ○ ○ ○ ○ ○ ○ ○ ○ ○ ○ ○ ○ ○ ○ ○ ○ ○ ○ ○ ○
C H I E F K E R R Y ’ S M O O S E
12
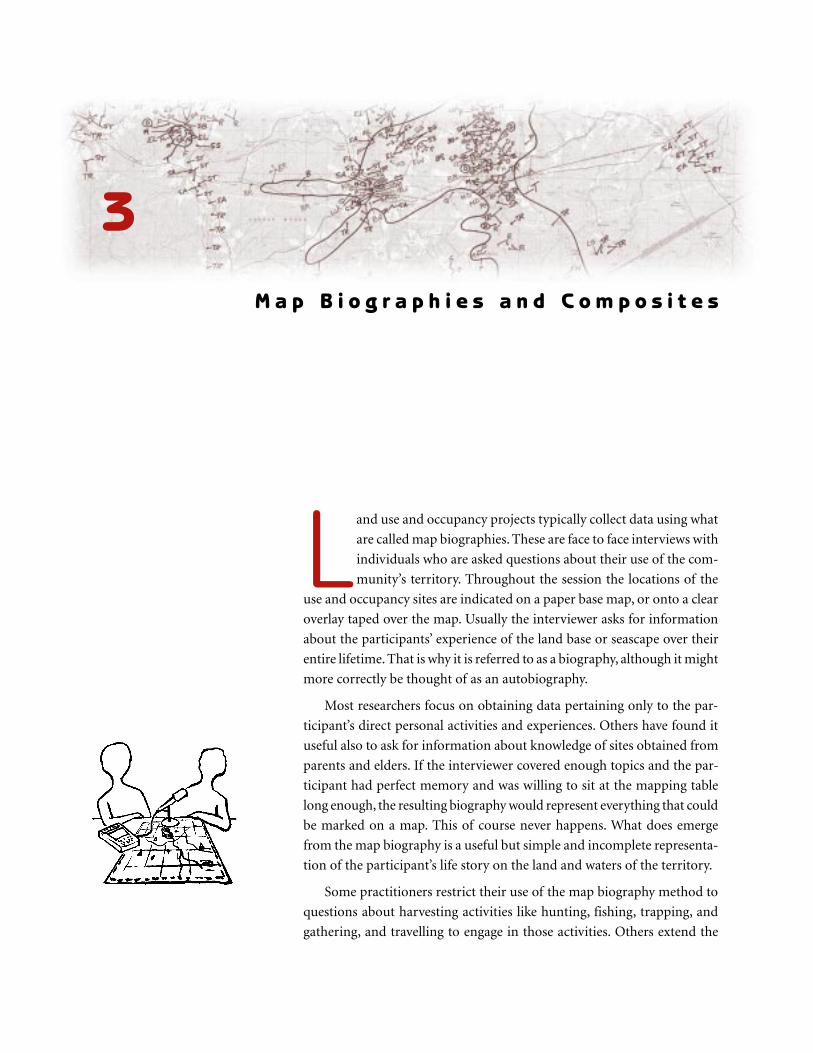
L and use and occupancy projects typically collect data using what
are called map biographies. These are face to face interviews with
individuals who are asked questions about their use of the com-
munity’s territory. Throughout the session the locations of the
use and occupancy sites are indicated on a paper base map, or onto a clear
overlay taped over the map. Usually the interviewer asks for information
about the participants’ experience of the land base or seascape over their
entire lifetime. That is why it is referred to as a biography, although it might
more correctly be thought of as an autobiography.
Most researchers focus on obtaining data pertaining only to the par-
ticipant’s direct personal activities and experiences. Others have found it
useful also to ask for information about knowledge of sites obtained from
parents and elders. If the interviewer covered enough topics and the par-
ticipant had perfect memory and was willing to sit at the mapping table
long enough, the resulting biography would represent everything that could
be marked on a map. This of course never happens. What does emerge
from the map biography is a useful but simple and incomplete representa-
tion of the participant’s life story on the land and waters of the territory.
Some practitioners restrict their use of the map biography method to
questions about harvesting activities like hunting, fishing, trapping, and
gathering, and travelling to engage in those activities. Others extend the
3M a p B i o g r a p h i e s a n d C o m p o s i t e s
13
map biography method to cover questions about the participant’s experi-
ence and knowledge of ecology and critical wildlife habitat, traditional
habitation sites, spiritual and sacred areas, legends and stories associated
with sites, and aboriginal place names.
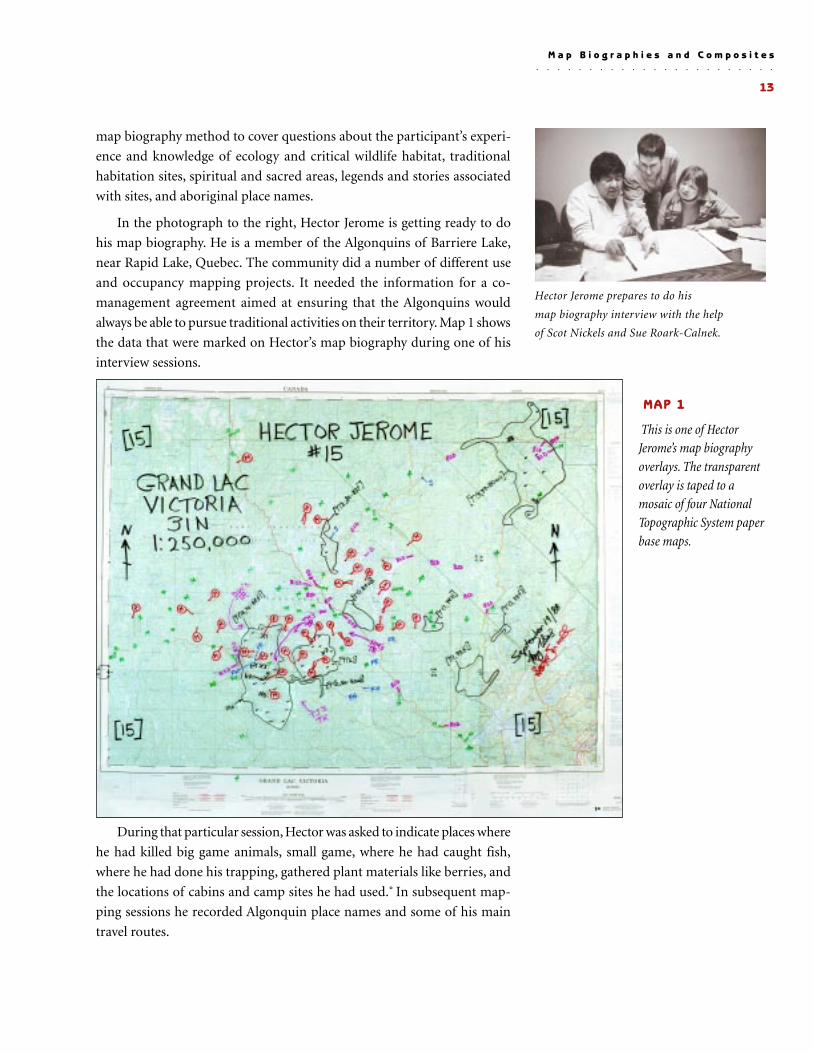
In the photograph to the right, Hector Jerome is getting ready to do
his map biography. He is a member of the Algonquins of Barriere Lake,
near Rapid Lake, Quebec. The community did a number of different use
and occupancy mapping projects. It needed the information for a co-
management agreement aimed at ensuring that the Algonquins would
always be able to pursue traditional activities on their territory. Map 1 shows
the data that were marked on Hector’s map biography during one of his
interview sessions.
During that particular session, Hector was asked to indicate places where
he had killed big game animals, small game, where he had caught fish,
where he had done his trapping, gathered plant materials like berries, and
the locations of cabins and camp sites he had used.␣ In subsequent map-
ping sessions he recorded Algonquin place names and some of his main
travel routes.
Hector Jerome prepares to do his
map biography interview with the help
of Scot Nickels and Sue Roark-Calnek.
MAP 1
This is one of HectorJerome’s map biographyoverlays. The transparentoverlay is taped to amosaic of four NationalTopographic System paperbase maps.
○ ○ ○ ○ ○ ○ ○ ○ ○ ○ ○ ○ ○ ○ ○ ○ ○ ○ ○ ○ ○ ○ ○
M a p B i o g r a p h i e s a n d C o m p o s i t e s
○ ○ ○ ○ ○ ○ ○ ○ ○ ○ ○ ○ ○ ○ ○ ○ ○ ○ ○ ○ ○ ○ ○
C H I E F K E R R Y ’ S M O O S E
14
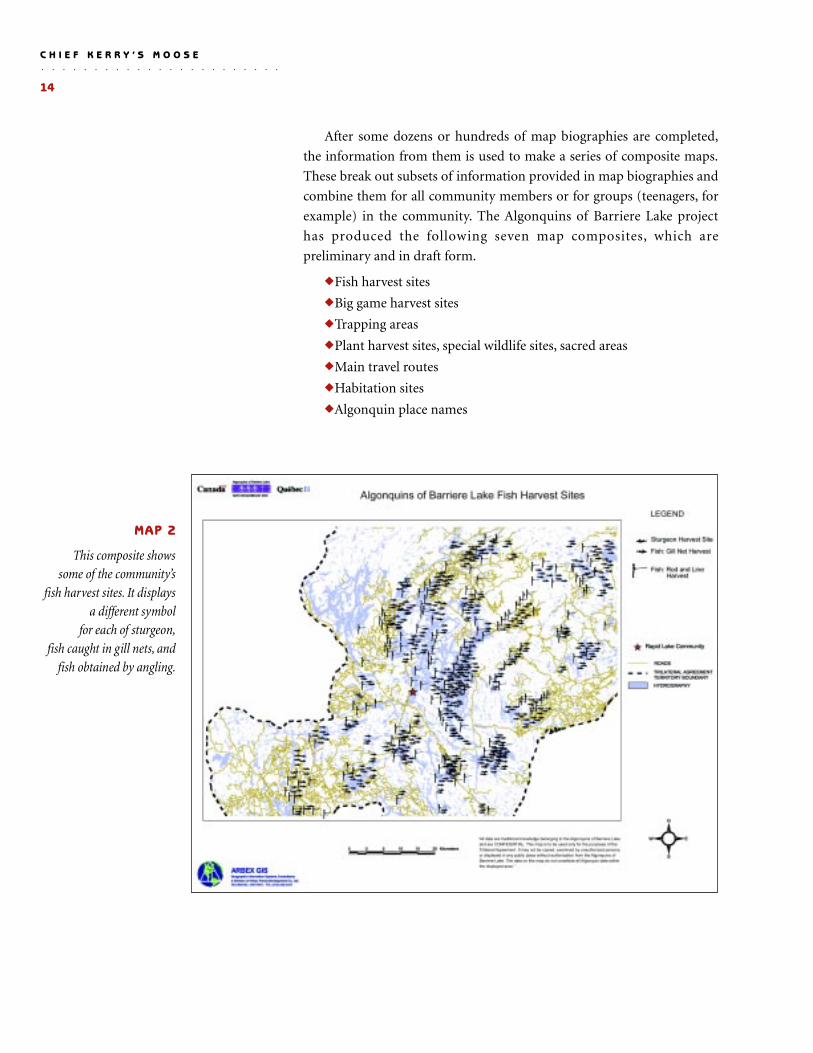
MAP 2
This composite showssome of the community’s
fish harvest sites. It displaysa different symbol
for each of sturgeon,fish caught in gill nets, and
fish obtained by angling.
After some dozens or hundreds of map biographies are completed,
the information from them is used to make a series of composite maps.
These break out subsets of information provided in map biographies and
combine them for all community members or for groups (teenagers, for
example) in the community. The Algonquins of Barriere Lake project
has produced the following seven map composites, which are
preliminary and in draft form.
◆ Fish harvest sites
◆ Big game harvest sites
◆ Trapping areas
◆ Plant harvest sites, special wildlife sites, sacred areas
◆ Main travel routes
◆ Habitation sites
◆ Algonquin place names
15
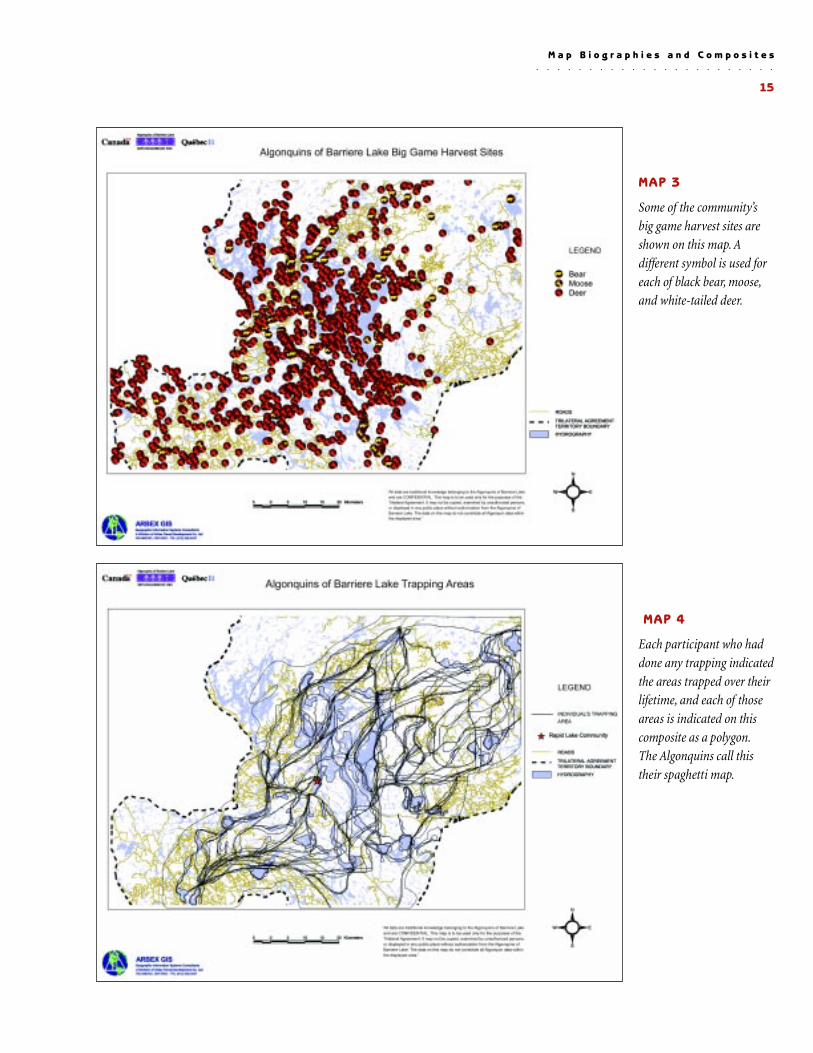
MAP 3
Some of the community’sbig game harvest sites areshown on this map. Adifferent symbol is used foreach of black bear, moose,and white-tailed deer.
MAP 4
Each participant who haddone any trapping indicatedthe areas trapped over theirlifetime, and each of thoseareas is indicated on thiscomposite as a polygon.The Algonquins call thistheir spaghetti map.
○ ○ ○ ○ ○ ○ ○ ○ ○ ○ ○ ○ ○ ○ ○ ○ ○ ○ ○ ○ ○ ○ ○
M a p B i o g r a p h i e s a n d C o m p o s i t e s
○ ○ ○ ○ ○ ○ ○ ○ ○ ○ ○ ○ ○ ○ ○ ○ ○ ○ ○ ○ ○ ○ ○
C H I E F K E R R Y ’ S M O O S E
16
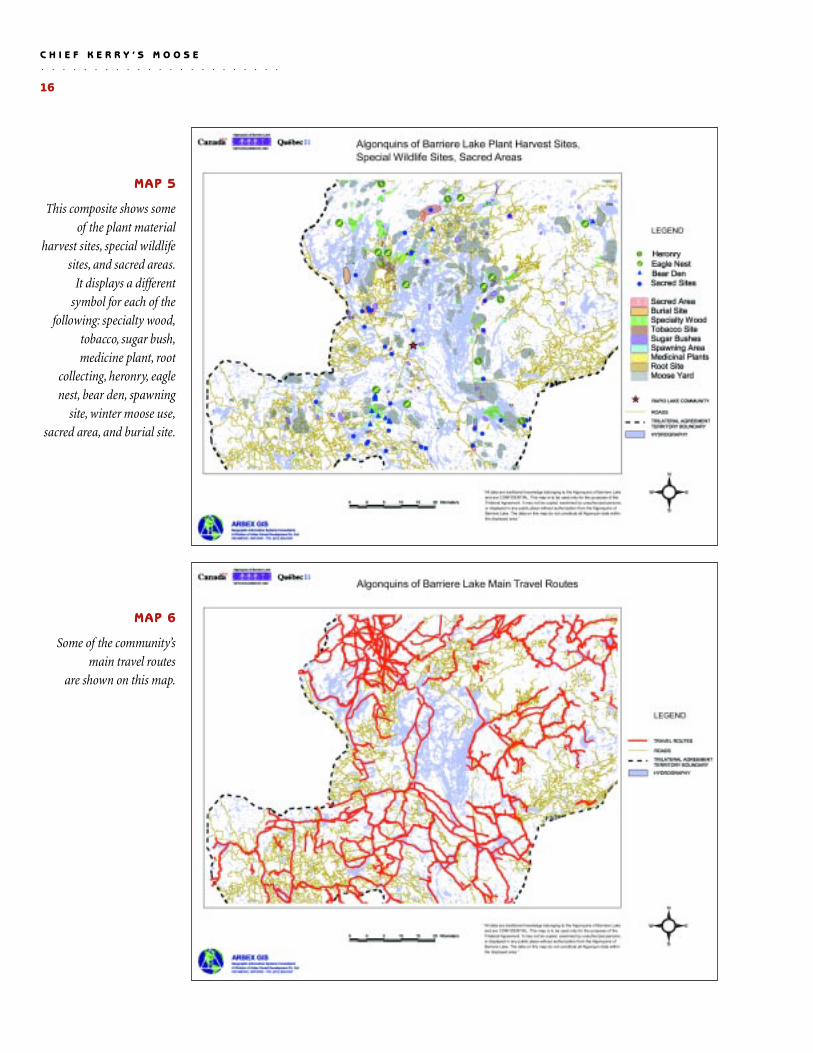
MAP 5
This composite shows someof the plant material
harvest sites, special wildlifesites, and sacred areas.
It displays a differentsymbol for each of the
following: specialty wood,tobacco, sugar bush,medicine plant, root
collecting, heronry, eaglenest, bear den, spawning
site, winter moose use,sacred area, and burial site.
MAP 6
Some of the community’smain travel routes
are shown on this map.
17
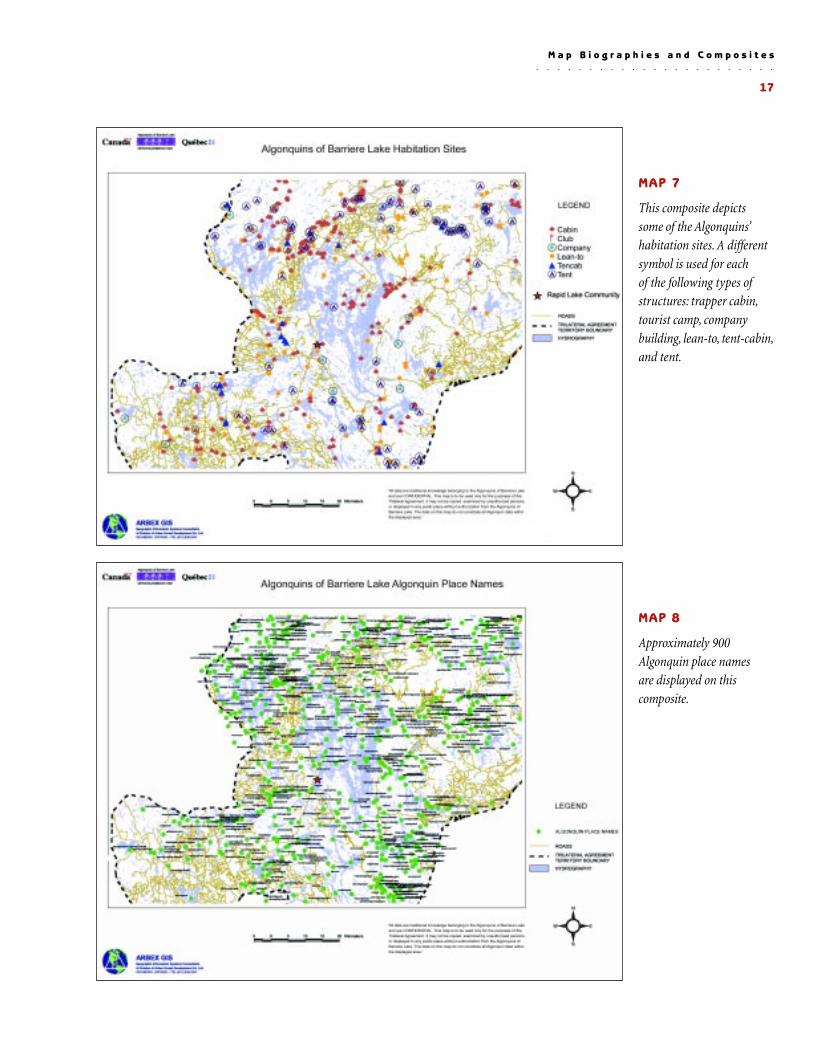
MAP 7
This composite depictssome of the Algonquins’habitation sites. A differentsymbol is used for eachof the following types ofstructures: trapper cabin,tourist camp, companybuilding, lean-to, tent-cabin,and tent.
MAP 8
Approximately 900Algonquin place namesare displayed on thiscomposite.
○ ○ ○ ○ ○ ○ ○ ○ ○ ○ ○ ○ ○ ○ ○ ○ ○ ○ ○ ○ ○ ○ ○
M a p B i o g r a p h i e s a n d C o m p o s i t e s
○ ○ ○ ○ ○ ○ ○ ○ ○ ○ ○ ○ ○ ○ ○ ○ ○ ○ ○ ○ ○ ○ ○
C H I E F K E R R Y ’ S M O O S E
18
The categories for each composite change depending on what part of
the country the mapping is being done for, which First Nation is doing it,
and the intended uses of the maps. The Barriere Lake big game composite
(Map 3) has three different symbols, one for each of moose, deer and black
bear. In contrast, the Nahanni Butte Dene Band’s big game composite might
show symbols for each of moose, bighorn sheep, mountain goat, caribou,
deer, black bear, and grizzly bear.
While the map biography is used for collecting an individual’s use and
occupancy information, the map composite is used for displaying or pre-
senting the entire community’s data. The biography is a data collection
tool while the composites are what are used for presentation, education,
negotiation, litigation, and so on.
19
T he history of Indian policy and the often adversarial nature of
negotiations with government, industry, and sometimes with
neighbouring aboriginal groups, suggests that the quality of
mapped land use and occupancy data will remain a key factor in
successful negotiations and litigation. Data quality may become even more
important as populations grow, and as increasing numbers of corporations,
agencies, and indigenous peoples lay claim to diminishing resources.
This section of the guide addresses the issue of doing good research.
Most existing policies, guidelines and handbooks instructing indigenous
organizations how to map their cultural resources are flawed, and often
contain the seeds of failure. Sometimes the authors of such material work
within institutions whose goals are not entirely compatible with those of
indigenous communities. Or sometimes the people who write the material
are not skilled at doing the very thing they are instructing others to do.
In some provincial and territorial jurisdictions for instance, archaeologists
and foresters are given the responsibility of producing the how-to
material. They cannot be expected to put together guidelines for doing
successful social science research in First Nation communities.
There are different standards of quality that your research can meet.
Project designers often give insufficient thought to the issue of quality, and
their final maps end up being of limited use. In some instances, data qual-
ity is so poor that maps end up not being used at all for fear that if others
Most existing policies,guidelines andhandbooks containthe seeds of failure.
4D o i n g Q u a l i t y R e s e a r c h
○ ○ ○ ○ ○ ○ ○ ○ ○ ○ ○ ○ ○ ○ ○ ○ ○ ○ ○ ○ ○ ○ ○
C H I E F K E R R Y ’ S M O O S E
20
got hold of them the information would be used against aboriginal inter-
ests. Sometimes having no data is better than having poor data, because
poor data can be used against you. The standard depends on the intended
use. For instance, the level of quality needed to use data internally for
curriculum development is different than that needed to succeed in a court
action. If you aim your sights high, then your maps are likely to withstand
any level of critical examination.
There are four good reasons to set your sights high.
◆ Mapped cultural inventories can be useful in many different contexts,even unforeseeable ones. It makes sense to collect the data in amanner that allows your community to use the maps in anysituation.
◆ Land use and occupancy information warrants respect, even a levelof reverence. It deserves to be documented in a manner thatminimizes the probability that it will be dismissed or disregarded.
◆ Many aboriginal communities are losing the elders who possessknowledge that the majority of their children and grandchildren donot. There is an urgency to document oral history and traditionalknowledge for the benefit of future generations.
◆ Doing good quality land use and occupancy research is no moreexpensive than doing poor work, especially when you consider thelong-term consequences.
Some communities that did cultural mapping a decade ago, when there
was no immediate threat to their resource bases, are doing the research
over again. They realize that the original work was not done carefully enough
to counter the unwanted industrial development that is now taking place
on their territories. When you think of the long-term benefits that can
result from negotiations about who gets access to your territories, and
the potential role of data in those negotiations, it makes sense to adopt
a single, consistent approach to research. Simply, if you are going to do it,
do it well.
Doing research well is not the same as making the results look profes-
sional. Quality has to do with the manner in which data are collected while
appearances have to do with the manner in which data are presented. The
GIS technicians, using their computers, can make almost any data set look
impressive, but they cannot improve the quality of the data.
Some aboriginal administrations have made the mistake of letting tech-
nology lead or define their research agendas. A large number of communi-
ties now possess GIS hardware and software but not the capacity to operate
it well. They have fine-looking maps that are great to hang in the local
There is an urgencyto document oral
history and traditionalknowledge for the
benefit of futuregenerations.
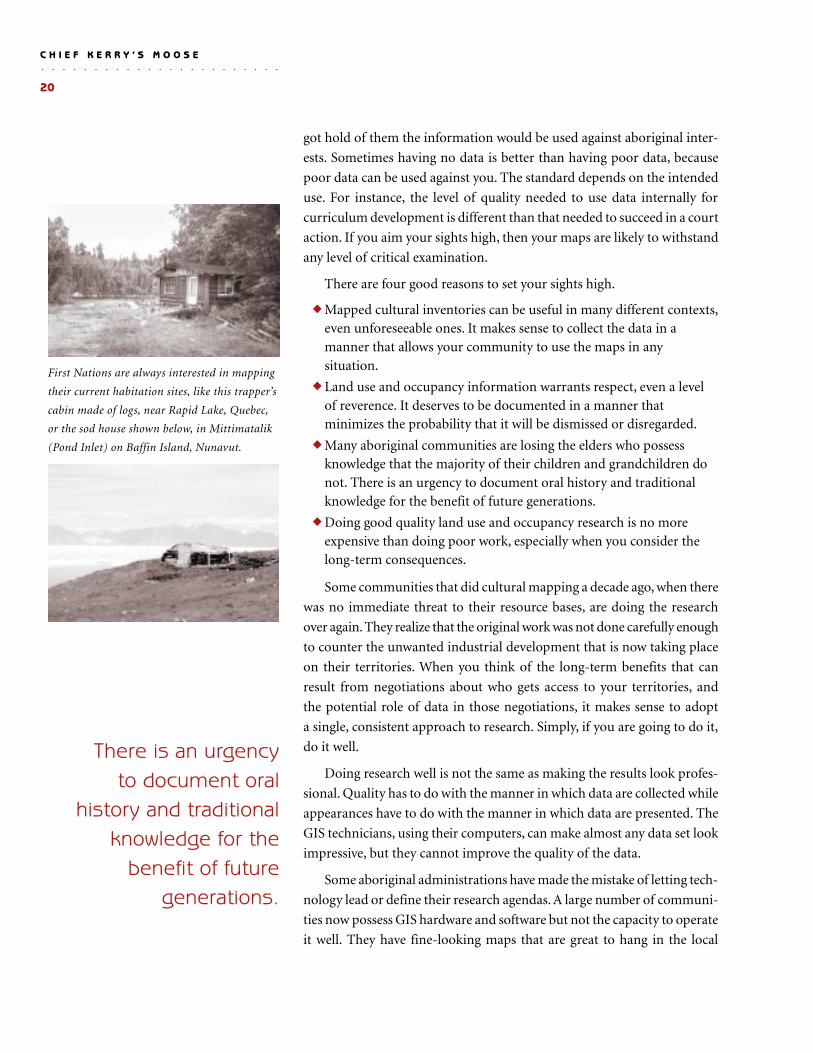
First Nations are always interested in mapping
their current habitation sites, like this trapper’s
cabin made of logs, near Rapid Lake, Quebec,
or the sod house shown below, in Mittimatalik
(Pond Inlet) on Baffin Island, Nunavut.
21
band office or school. Unfortunately, many of these same maps would not
get taken seriously in negotiations with provincial, territorial, federal,
or other indigenous governments.
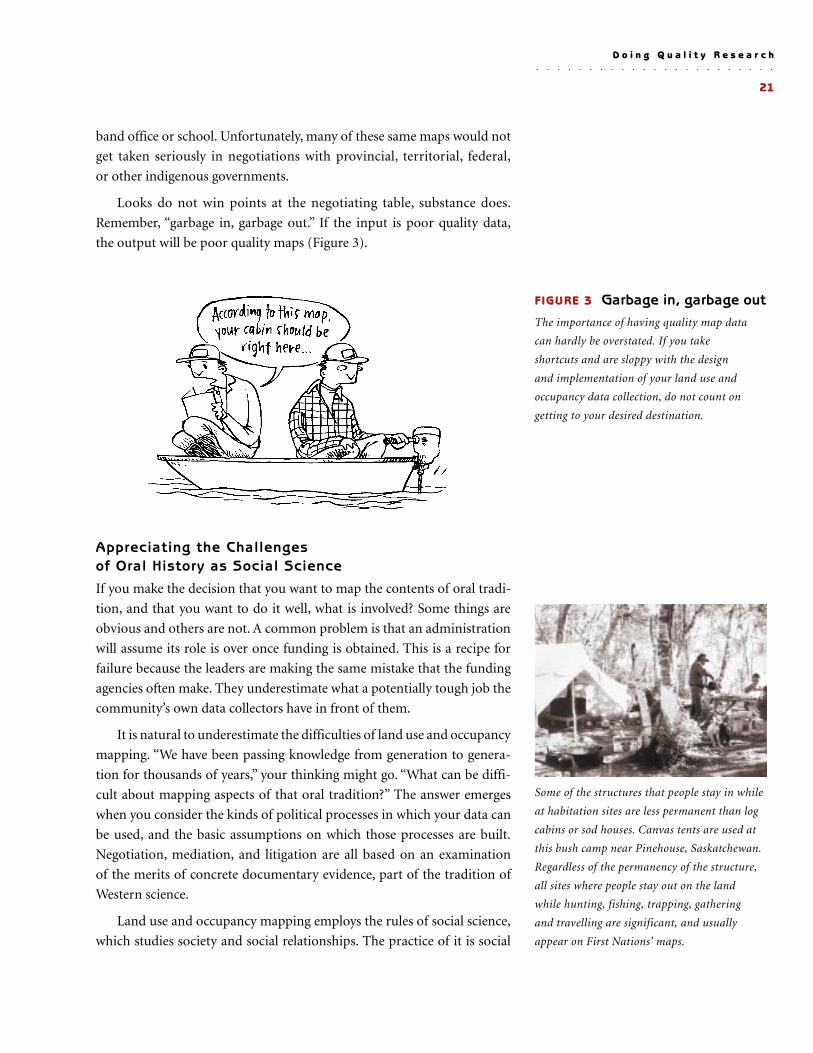
Looks do not win points at the negotiating table, substance does.
Remember, “garbage in, garbage out.” If the input is poor quality data,
the output will be poor quality maps (Figure 3).
Appreciating the Challengesof Oral History as Social Science
If you make the decision that you want to map the contents of oral tradi-
tion, and that you want to do it well, what is involved? Some things are
obvious and others are not. A common problem is that an administration
will assume its role is over once funding is obtained. This is a recipe for
failure because the leaders are making the same mistake that the funding
agencies often make. They underestimate what a potentially tough job the
community’s own data collectors have in front of them.
It is natural to underestimate the difficulties of land use and occupancy
mapping. “We have been passing knowledge from generation to genera-
tion for thousands of years,” your thinking might go. “What can be diffi-
cult about mapping aspects of that oral tradition?” The answer emerges
when you consider the kinds of political processes in which your data can
be used, and the basic assumptions on which those processes are built.
Negotiation, mediation, and litigation are all based on an examination
of the merits of concrete documentary evidence, part of the tradition of
Western science.
Land use and occupancy mapping employs the rules of social science,
which studies society and social relationships. The practice of it is social
FIGURE 3 Garbage in, garbage outThe importance of having quality map data
can hardly be overstated. If you take
shortcuts and are sloppy with the design
and implementation of your land use and
occupancy data collection, do not count on
getting to your desired destination.
○ ○ ○ ○ ○ ○ ○ ○ ○ ○ ○ ○ ○ ○ ○ ○ ○ ○ ○ ○ ○ ○ ○
D o i n g Q u a l i t y R e s e a r c h
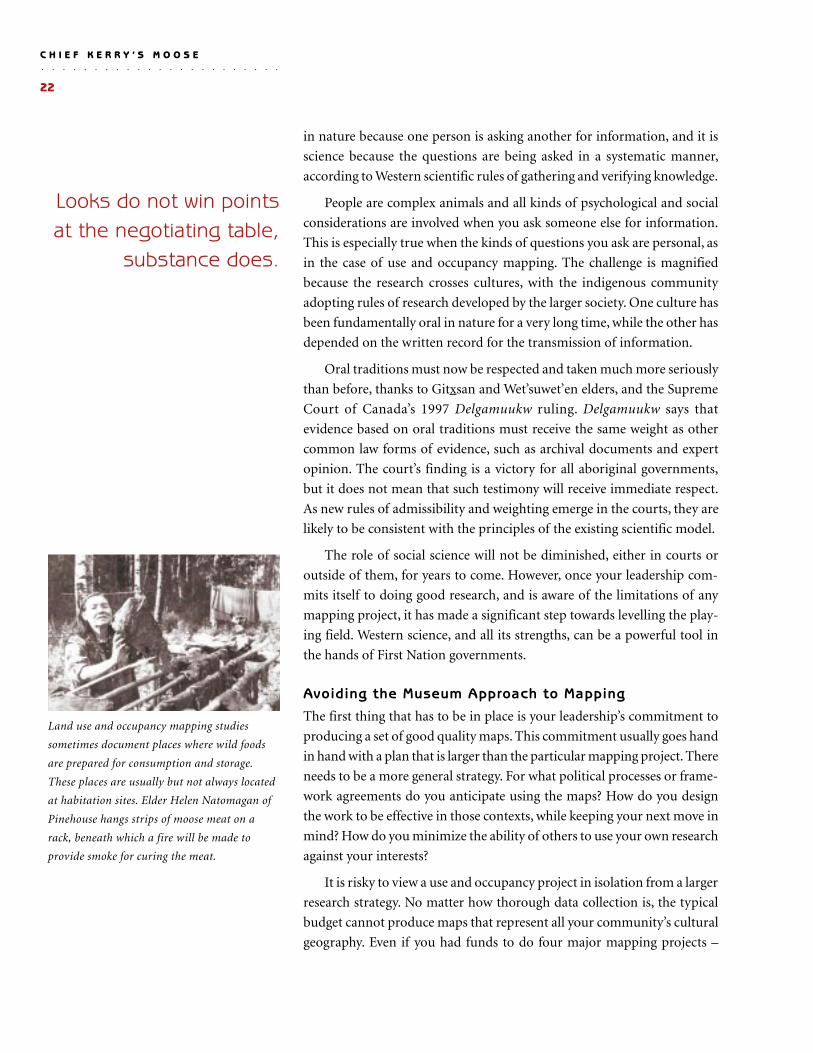
Some of the structures that people stay in while
at habitation sites are less permanent than log
cabins or sod houses. Canvas tents are used at
this bush camp near Pinehouse, Saskatchewan.
Regardless of the permanency of the structure,
all sites where people stay out on the land
while hunting, fishing, trapping, gathering
and travelling are significant, and usually
appear on First Nations’ maps.
○ ○ ○ ○ ○ ○ ○ ○ ○ ○ ○ ○ ○ ○ ○ ○ ○ ○ ○ ○ ○ ○ ○
C H I E F K E R R Y ’ S M O O S E
22
in nature because one person is asking another for information, and it is
science because the questions are being asked in a systematic manner,
according to Western scientific rules of gathering and verifying knowledge.
People are complex animals and all kinds of psychological and social
considerations are involved when you ask someone else for information.
This is especially true when the kinds of questions you ask are personal, as
in the case of use and occupancy mapping. The challenge is magnified
because the research crosses cultures, with the indigenous community
adopting rules of research developed by the larger society. One culture has
been fundamentally oral in nature for a very long time, while the other has
depended on the written record for the transmission of information.
Oral traditions must now be respected and taken much more seriously
than before, thanks to Gitxsan and Wet’suwet’en elders, and the Supreme
Court of Canada’s 1997 Delgamuukw ruling. Delgamuukw says that
evidence based on oral traditions must receive the same weight as other
common law forms of evidence, such as archival documents and expert
opinion. The court’s finding is a victory for all aboriginal governments,
but it does not mean that such testimony will receive immediate respect.
As new rules of admissibility and weighting emerge in the courts, they are
likely to be consistent with the principles of the existing scientific model.
The role of social science will not be diminished, either in courts or
outside of them, for years to come. However, once your leadership com-
mits itself to doing good research, and is aware of the limitations of any
mapping project, it has made a significant step towards levelling the play-
ing field. Western science, and all its strengths, can be a powerful tool in
the hands of First Nation governments.
Avoiding the Museum Approach to Mapping
The first thing that has to be in place is your leadership’s commitment to
producing a set of good quality maps. This commitment usually goes hand
in hand with a plan that is larger than the particular mapping project. There
needs to be a more general strategy. For what political processes or frame-
work agreements do you anticipate using the maps? How do you design
the work to be effective in those contexts, while keeping your next move in
mind? How do you minimize the ability of others to use your own research
against your interests?
It is risky to view a use and occupancy project in isolation from a larger
research strategy. No matter how thorough data collection is, the typical
budget cannot produce maps that represent all your community’s cultural
geography. Even if you had funds to do four major mapping projects –
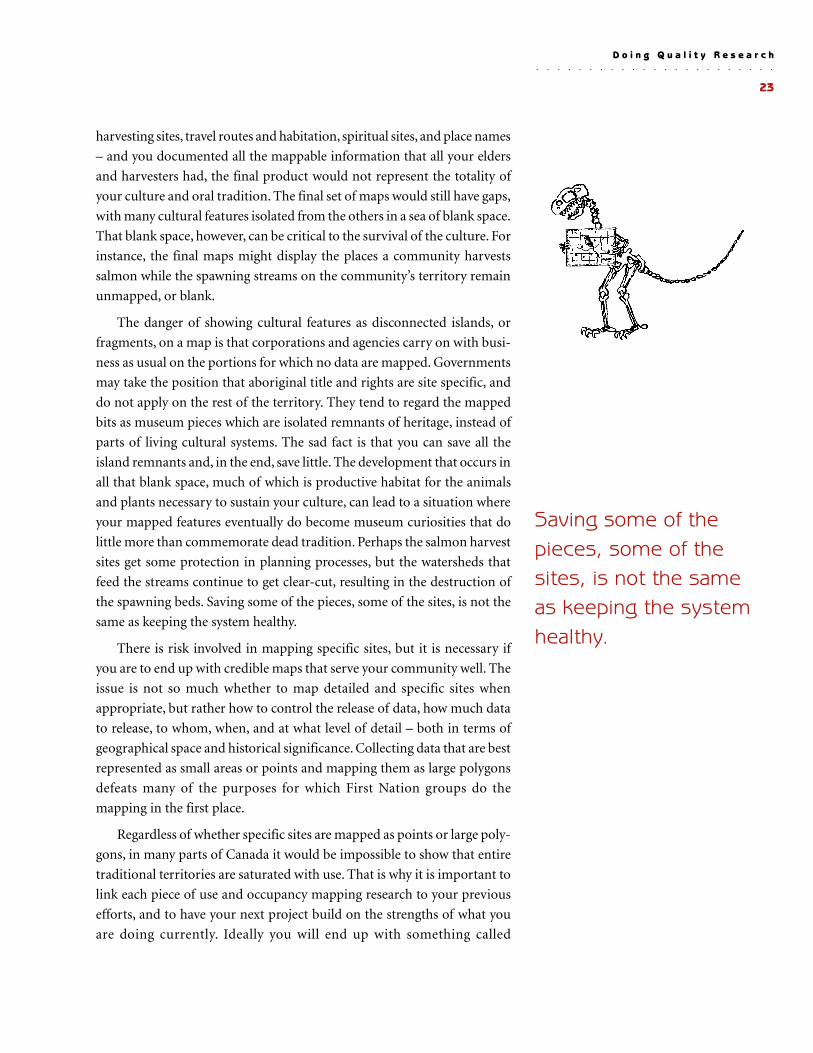
Land use and occupancy mapping studies
sometimes document places where wild foods
are prepared for consumption and storage.
These places are usually but not always located
at habitation sites. Elder Helen Natomagan of
Pinehouse hangs strips of moose meat on a
rack, beneath which a fire will be made to
provide smoke for curing the meat.
Looks do not win pointsat the negotiating table,
substance does.
23
harvesting sites, travel routes and habitation, spiritual sites, and place names
– and you documented all the mappable information that all your elders
and harvesters had, the final product would not represent the totality of
your culture and oral tradition. The final set of maps would still have gaps,
with many cultural features isolated from the others in a sea of blank space.
That blank space, however, can be critical to the survival of the culture. For
instance, the final maps might display the places a community harvests
salmon while the spawning streams on the community’s territory remain
unmapped, or blank.
The danger of showing cultural features as disconnected islands, or
fragments, on a map is that corporations and agencies carry on with busi-
ness as usual on the portions for which no data are mapped. Governments
may take the position that aboriginal title and rights are site specific, and
do not apply on the rest of the territory. They tend to regard the mapped
bits as museum pieces which are isolated remnants of heritage, instead of
parts of living cultural systems. The sad fact is that you can save all the
island remnants and, in the end, save little. The development that occurs in
all that blank space, much of which is productive habitat for the animals
and plants necessary to sustain your culture, can lead to a situation where
your mapped features eventually do become museum curiosities that do
little more than commemorate dead tradition. Perhaps the salmon harvest
sites get some protection in planning processes, but the watersheds that
feed the streams continue to get clear-cut, resulting in the destruction of
the spawning beds. Saving some of the pieces, some of the sites, is not the
same as keeping the system healthy.
There is risk involved in mapping specific sites, but it is necessary if
you are to end up with credible maps that serve your community well. The
issue is not so much whether to map detailed and specific sites when
appropriate, but rather how to control the release of data, how much data
to release, to whom, when, and at what level of detail – both in terms of
geographical space and historical significance. Collecting data that are best
represented as small areas or points and mapping them as large polygons
defeats many of the purposes for which First Nation groups do the
mapping in the first place.
Regardless of whether specific sites are mapped as points or large poly-
gons, in many parts of Canada it would be impossible to show that entire
traditional territories are saturated with use. That is why it is important to
link each piece of use and occupancy mapping research to your previous
efforts, and to have your next project build on the strengths of what you
are doing currently. Ideally you will end up with something called
Saving some of thepieces, some of thesites, is not the sameas keeping the systemhealthy.
○ ○ ○ ○ ○ ○ ○ ○ ○ ○ ○ ○ ○ ○ ○ ○ ○ ○ ○ ○ ○ ○ ○
D o i n g Q u a l i t y R e s e a r c h
○ ○ ○ ○ ○ ○ ○ ○ ○ ○ ○ ○ ○ ○ ○ ○ ○ ○ ○ ○ ○ ○ ○
C H I E F K E R R Y ’ S M O O S E
24
comprehensive research. To date this has been a rare thing, mostly because
indigenous leaders have not seen a need for it. Or if they have, they have
not been presented with any examples of how to accomplish it.
Comprehensive research requires an overall plan that links a number
of key components together. Taken as a whole, it proves that the museum
approach is not valid. Many nations have used something called a harvest
survey to obtain quantitative measures of the amount of food their terri-
tories provide. Many have researched and mapped the ways that industry,
government, and third party interests have restricted their use of their
territories. Comprehensive research also describes the complex system of
use that is the foundation of all the mapped use and occupancy data. That
system of use cannot be portrayed in map form, but it can be put into
words. Traditional ecological knowledge, social customs, organizational
structures, and social institutions are part of the system, and when the maps
are considered in light of these, there are no blank spaces. Everything can
be shown to be interconnected. What appear as blank spaces on the map
can be shown to have meaning and significance to the culture.
A number of communities are successfully pursuing comprehensive
research. They and others are rightly concerned about the damage that can
be done to their resources and territories in the time it takes to do research.
However, numerous groups have discovered that even incomplete (but good
quality) research has been effective in stopping or lessening the impacts
of unwanted development. Indigenous governments are including the
negotiation of interim measures in their long-term strategies. These are
temporary mechanisms that give all cultural resources, whether mapped
or not, some level of protection until such time as a satisfactory manage-
ment plan is in place. Such a plan is one that gives due consideration to the
nation’s entire system of cultural resources, including the unmapped
“empty” areas.
Whether or not interim measures are in place, all maps should display
prominent qualifiers that state their limitations, and put potential users on
notice that the data are not to be abused. Such qualifiers might indicate
that the map is a work in progress and incomplete, and that the data dis-
played in no way lessen anybody’s obligation to consult with the commu-
nity. Restrictions concerning ownership, viewing, replication, and
distribution of the map should also appear.
Indigenous peoples do not have the luxury of doing land use and
occupancy research for the fun of it. This is applied research, not academic
inquiry. Communities want their work to meet concrete practical needs.
Because those needs often involve long-term change, it is necessary to
Indigenous peoplesdo not have the luxury
of doing land useand occupancy
research for the funof it.Communities
want their workto meet concrete
practical needs.
Habitation sites are particularly important
to map, not only because they are concrete
evidence of occupancy, but also because once
you document them, it is much easier to then
map your community’s travel routes. This is
because when people are travelling, they are
usually going from one cabin or camp to
another, or making day trips out from the sites
to harvest resources. The habitation sites are
like the dots on a child’s connect-the-numbers
line drawing.
25
have a research plan that is in step with a long-term political agenda. Your
mapping has to be designed with your big picture in mind. If it is not,
somebody has already designed it for you, as part of their agenda, which
almost always involves the museum approach.
Laying the Groundwork for Good Research
The most important factor that makes or breaks community research is
whether members are willing to participate. An administration can have a
big picture well thought out, and truly want a project to succeed, but still
fail because it does not secure community support. It is the administra-
tion’s responsibility to do whatever is necessary to inform people about
the project, address concerns about things like confidentiality, and develop
a consensus that the project is in the best interests of all families. Ideally,
this is done before the first map session takes place.
Here are two real-life examples that represent the range of community
preparedness for mapping. The two communities, one in Quebec and
one in Ontario, are very close in population size and have territories
that are similar in extent. Data collection involved the same number
of interviewers, asked for the same kinds of information, used similar
interview guides, required the same amount of participants’ time, and
recorded data at the same scale of base map. In both cases, close to 90
participants did map biographies. Data collection took three weeks in
Community A. It took three years in Community B. The band administra-
tion and elders of Community A spent many months publicly discussing
the research, and a strong consensus about the need for it was solidly in
place before the first interview. The chief and council of Community B
endorsed the research from the outset, but the elders were split on the issue
and many adults had no understanding about it when data collection
started. Obtaining a set of map biographies required a dozen trips to the
village at considerable expense, and the research agenda itself became
a divisive issue.
If community consensus is not in place when interviewing commences,
workers will struggle for the entire data collection phase. They will find
themselves spending far too much time explaining the project to people,
and listening to individuals’ concerns about the research itself, the funding
agency, or even gripes about their own politicians. It is not the interview-
er’s job to do damage control when sensitive issues are raised during data
collection. Every local government has its critics who will use a request to
participate as an invitation to criticize. For many data collectors, getting
individuals to sit down with them has been quite frustrating in itself, and
the experience of having prearranged map sessions turn into no-shows
The most importantfactor that makes orbreaks communityresearch is whethermembers are willingto participate.
○ ○ ○ ○ ○ ○ ○ ○ ○ ○ ○ ○ ○ ○ ○ ○ ○ ○ ○ ○ ○ ○ ○
D o i n g Q u a l i t y R e s e a r c h
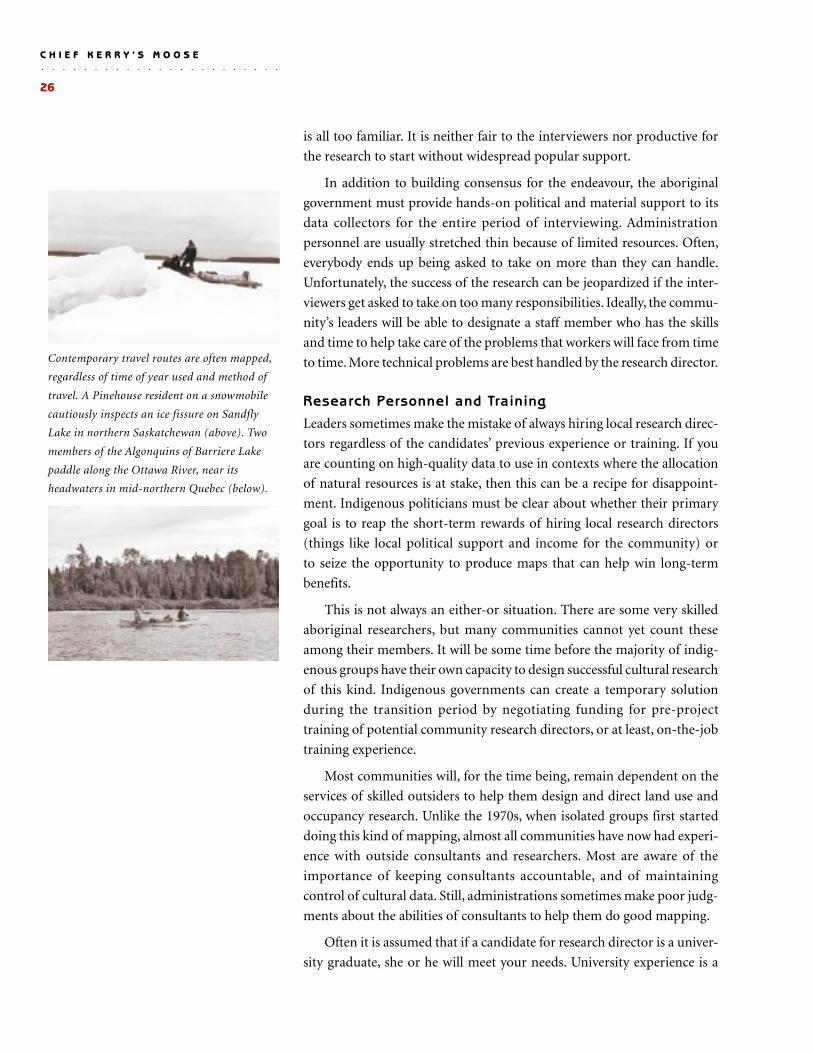
○ ○ ○ ○ ○ ○ ○ ○ ○ ○ ○ ○ ○ ○ ○ ○ ○ ○ ○ ○ ○ ○ ○
C H I E F K E R R Y ’ S M O O S E
26
is all too familiar. It is neither fair to the interviewers nor productive for
the research to start without widespread popular support.
In addition to building consensus for the endeavour, the aboriginal
government must provide hands-on political and material support to its
data collectors for the entire period of interviewing. Administration
personnel are usually stretched thin because of limited resources. Often,
everybody ends up being asked to take on more than they can handle.
Unfortunately, the success of the research can be jeopardized if the inter-
viewers get asked to take on too many responsibilities. Ideally, the commu-
nity’s leaders will be able to designate a staff member who has the skills
and time to help take care of the problems that workers will face from time
to time. More technical problems are best handled by the research director.
Research Personnel and Training
Leaders sometimes make the mistake of always hiring local research direc-
tors regardless of the candidates’ previous experience or training. If you
are counting on high-quality data to use in contexts where the allocation
of natural resources is at stake, then this can be a recipe for disappoint-
ment. Indigenous politicians must be clear about whether their primary
goal is to reap the short-term rewards of hiring local research directors
(things like local political support and income for the community) or
to seize the opportunity to produce maps that can help win long-term
benefits.
This is not always an either-or situation. There are some very skilled
aboriginal researchers, but many communities cannot yet count these
among their members. It will be some time before the majority of indig-
enous groups have their own capacity to design successful cultural research
of this kind. Indigenous governments can create a temporary solution
during the transition period by negotiating funding for pre-project
training of potential community research directors, or at least, on-the-job
training experience.
Most communities will, for the time being, remain dependent on the
services of skilled outsiders to help them design and direct land use and
occupancy research. Unlike the 1970s, when isolated groups first started
doing this kind of mapping, almost all communities have now had experi-
ence with outside consultants and researchers. Most are aware of the
importance of keeping consultants accountable, and of maintaining
control of cultural data. Still, administrations sometimes make poor judg-
ments about the abilities of consultants to help them do good mapping.
Often it is assumed that if a candidate for research director is a univer-
sity graduate, she or he will meet your needs. University experience is a
Contemporary travel routes are often mapped,
regardless of time of year used and method of
travel. A Pinehouse resident on a snowmobile
cautiously inspects an ice fissure on Sandfly
Lake in northern Saskatchewan (above). Two
members of the Algonquins of Barriere Lake
paddle along the Ottawa River, near its
headwaters in mid-northern Quebec (below).
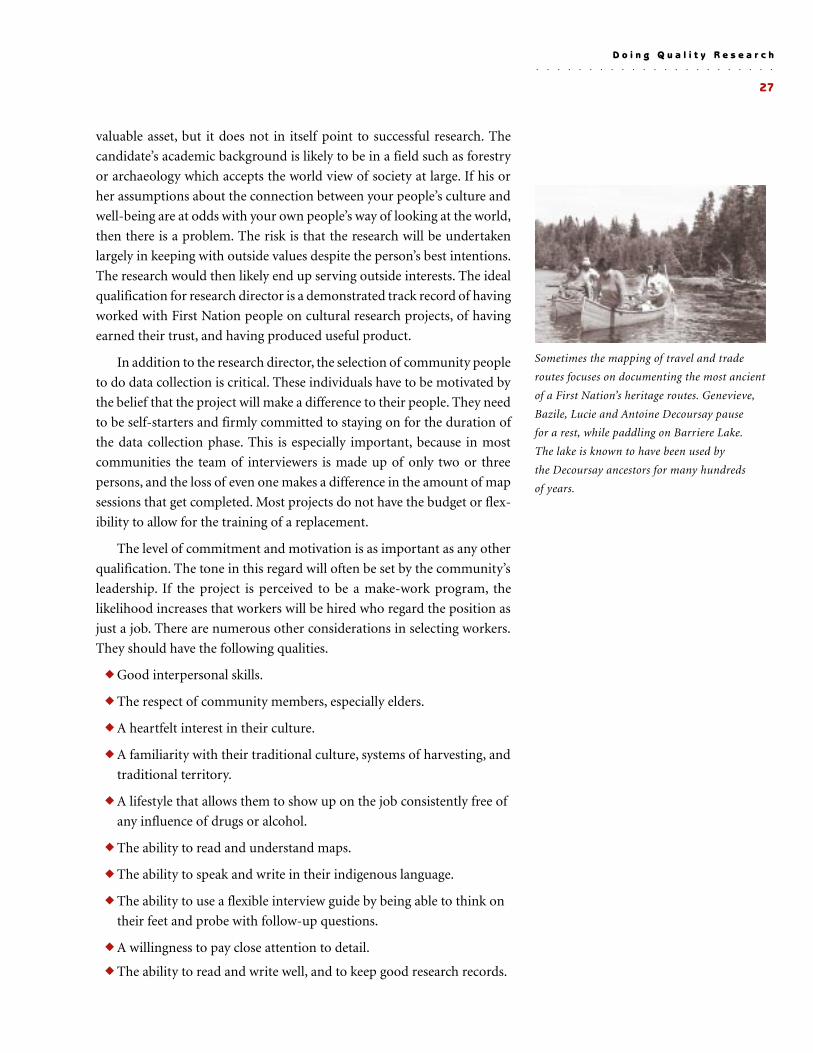
27
valuable asset, but it does not in itself point to successful research. The
candidate’s academic background is likely to be in a field such as forestry
or archaeology which accepts the world view of society at large. If his or
her assumptions about the connection between your people’s culture and
well-being are at odds with your own people’s way of looking at the world,
then there is a problem. The risk is that the research will be undertaken
largely in keeping with outside values despite the person’s best intentions.
The research would then likely end up serving outside interests. The ideal
qualification for research director is a demonstrated track record of having
worked with First Nation people on cultural research projects, of having
earned their trust, and having produced useful product.
In addition to the research director, the selection of community people
to do data collection is critical. These individuals have to be motivated by
the belief that the project will make a difference to their people. They need
to be self-starters and firmly committed to staying on for the duration of
the data collection phase. This is especially important, because in most
communities the team of interviewers is made up of only two or three
persons, and the loss of even one makes a difference in the amount of map
sessions that get completed. Most projects do not have the budget or flex-
ibility to allow for the training of a replacement.
The level of commitment and motivation is as important as any other
qualification. The tone in this regard will often be set by the community’s
leadership. If the project is perceived to be a make-work program, the
likelihood increases that workers will be hired who regard the position as
just a job. There are numerous other considerations in selecting workers.
They should have the following qualities.
◆ Good interpersonal skills.
◆ The respect of community members, especially elders.
◆ A heartfelt interest in their culture.
◆ A familiarity with their traditional culture, systems of harvesting, and
traditional territory.
◆ A lifestyle that allows them to show up on the job consistently free of
any influence of drugs or alcohol.
◆ The ability to read and understand maps.
◆ The ability to speak and write in their indigenous language.
◆ The ability to use a flexible interview guide by being able to think on
their feet and probe with follow-up questions.
◆ A willingness to pay close attention to detail.
◆ The ability to read and write well, and to keep good research records.
○ ○ ○ ○ ○ ○ ○ ○ ○ ○ ○ ○ ○ ○ ○ ○ ○ ○ ○ ○ ○ ○ ○
D o i n g Q u a l i t y R e s e a r c h
Sometimes the mapping of travel and trade
routes focuses on documenting the most ancient
of a First Nation’s heritage routes. Genevieve,
Bazile, Lucie and Antoine Decoursay pause
for a rest, while paddling on Barriere Lake.
The lake is known to have been used by
the Decoursay ancestors for many hundreds
of years.
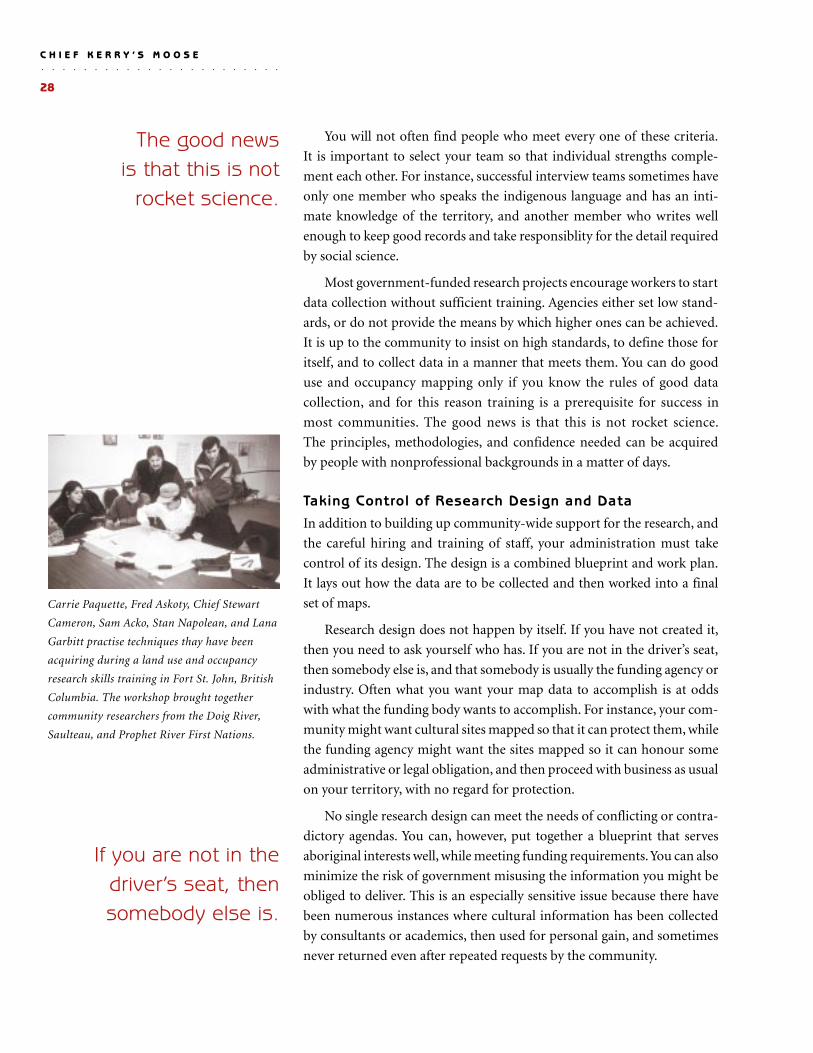
○ ○ ○ ○ ○ ○ ○ ○ ○ ○ ○ ○ ○ ○ ○ ○ ○ ○ ○ ○ ○ ○ ○
C H I E F K E R R Y ’ S M O O S E
28
You will not often find people who meet every one of these criteria.
It is important to select your team so that individual strengths comple-
ment each other. For instance, successful interview teams sometimes have
only one member who speaks the indigenous language and has an inti-
mate knowledge of the territory, and another member who writes well
enough to keep good records and take responsiblity for the detail required
by social science.
Most government-funded research projects encourage workers to start
data collection without sufficient training. Agencies either set low stand-
ards, or do not provide the means by which higher ones can be achieved.
It is up to the community to insist on high standards, to define those for
itself, and to collect data in a manner that meets them. You can do good
use and occupancy mapping only if you know the rules of good data
collection, and for this reason training is a prerequisite for success in
most communities. The good news is that this is not rocket science.
The principles, methodologies, and confidence needed can be acquired
by people with nonprofessional backgrounds in a matter of days.
Taking Control of Research Design and Data
In addition to building up community-wide support for the research, and
the careful hiring and training of staff, your administration must take
control of its design. The design is a combined blueprint and work plan.
It lays out how the data are to be collected and then worked into a final
set of maps.
Research design does not happen by itself. If you have not created it,
then you need to ask yourself who has. If you are not in the driver’s seat,
then somebody else is, and that somebody is usually the funding agency or
industry. Often what you want your map data to accomplish is at odds
with what the funding body wants to accomplish. For instance, your com-
munity might want cultural sites mapped so that it can protect them, while
the funding agency might want the sites mapped so it can honour some
administrative or legal obligation, and then proceed with business as usual
on your territory, with no regard for protection.
No single research design can meet the needs of conflicting or contra-
dictory agendas. You can, however, put together a blueprint that serves
aboriginal interests well, while meeting funding requirements. You can also
minimize the risk of government misusing the information you might be
obliged to deliver. This is an especially sensitive issue because there have
been numerous instances where cultural information has been collected
by consultants or academics, then used for personal gain, and sometimes
never returned even after repeated requests by the community.
The good newsis that this is not
rocket science.
If you are not in thedriver’s seat, thensomebody else is.
Carrie Paquette, Fred Askoty, Chief Stewart
Cameron, Sam Acko, Stan Napolean, and Lana
Garbitt practise techniques thay have been
acquiring during a land use and occupancy
research skills training in Fort St. John, British
Columbia. The workshop brought together
community researchers from the Doig River,
Saulteau, and Prophet River First Nations.
29
Maintaining control of your map data is essential. It can be done, even
in the face of funding requirements to provide some of the data to outsid-
ers. A number of projects have been successful in meeting obligations to
supply information, by providing data that are presented in a way that safe-
guards sensitive sites from violation. For instance, there might be a cat-
egory of sites that is especially vulnerable to vandalism, such as ancestral
burial grounds. The map could show each site as an area covering ten square
kilometres, making them impossible to find on the ground without the
community’s assistance.
Information-sharing agreements can be negotiated to include a vari-
ety of mechanisms that allow the indigenous group to retain sole posses-
sion of the kinds of data most likely to be abused. Under some arrangements,
the community releases data on a case-by-case basis as the need arises, and
only after careful evaluation by a committee of elders and other leaders.
Under other arrangements, the government receives only maps showing
cultural sites, while the aboriginal group retains control of the database,
which contains the detailed information about the history and significance
of each site.
Taking control of your mapping project involves more than the obvi-
ous things such as negotiating a strong information-sharing agreement
and keeping consultants accountable. It also means giving careful thought
to the technical design of the research. Funding arrangements often
include prepackaged research designs, in the form of policy guidelines or
“how-to” manuals, and these usually have big problems. Fortunately, fund-
ing guidelines always leave a lot of room to manoeuvre. But if you do not
take advantage of this flexibility and design the research yourself, some-
body else is already in the driver’s seat by default.
Avoiding Response Burden
Taking control of your research involves avoiding the unintended invita-
tions to fail that are hidden in the instructional material provided by
government and industry. The most common invitation is simply that the
community is asked to take on an overly-ambitious project, one for which
the expectations set by the research design are too high. This appears inno-
cent enough, which makes it difficult to recognize as a potential problem.
Attempting to accomplish too much is probably the number one reason
for research shortcomings, and why map projects fail to produce the
results that are wanted by aboriginal administrations.
When you design research you have to be realistic about what can be
done within a set budget and time frame. Your expectations have to take
into account the skill levels of project personnel and the level of coopera-
tion you can expect from potential participants.
Prepackagedresearch designs,in the form ofpolicy guidelinesor “how-to” manualsusually have bigproblems.
○ ○ ○ ○ ○ ○ ○ ○ ○ ○ ○ ○ ○ ○ ○ ○ ○ ○ ○ ○ ○ ○ ○
D o i n g Q u a l i t y R e s e a r c h
○ ○ ○ ○ ○ ○ ○ ○ ○ ○ ○ ○ ○ ○ ○ ○ ○ ○ ○ ○ ○ ○ ○
C H I E F K E R R Y ’ S M O O S E
30
Suppose you want to design a project to map the content of oral
tradition. You could collect some of the following kinds of information:
harvesting sites; ecology and critical animal habitat; site-specific features
of special cultural significance; travel and trade routes; and place names.
All of these kinds of information, or themes, are mappable. However, it is
impossible to collect the data needed to map them all in a single project,
which is exactly what some guidelines encourage communities to do.
A really good job can be done only when the focus is on one or two of the
themes. It is necessary to be selective in what you are going to ask people
because if you are not, you end up with an interview guide that is complex
and long, which means you run the risk of major response burden.
Response burden occurs when the participant experiences the inter-
view as too much of an effort. People have a range of experiences at map
sessions. Some will find them enjoyable and even fun; others will find them
positive, but somewhat inconvenient. Still others will experience their in-
terview as frustrating. The interview must be structured in such a way that
the majority of participants will be satisfied afterwards, especially the elders.
Those are the people who likely know the most about many kinds of
cultural features. They also tend to experience the most fatigue and frus-
tration when response burden is high. Elders also tend to be listened to by
community members at large, and their opinions about the interview have
considerable impact on final participation rates. What you want is for the
mapping to generate project support by having participants go back into
the community and tell others what a worthwhile endeavour it is. You do
not want people leaving the session annoyed.
Two things happen when response burden is high.
◆ The interview gets a reputation for being tough. When this happens
the data collectors spend much more of their time trying to get
people to participate, and the final number of completed sessions is
low.
◆ People who do agree to do a map are more likely not to provide good
quality data for each of the questions.
Both of these outcomes translate into a weak set of community com-
posites.
One way to look at response burden is as an issue of respect. You want
your workers to respect the basic limitations we all have as human beings.
The participant does not have an unlimited amount of energy, time, or
willingness to concentrate on the task at hand. On average, it seems that
most people are comfortable staying focused up to about one and a half
hours at a sitting, although this varies from one culture to another, and
it certainly varies from one individual to another.
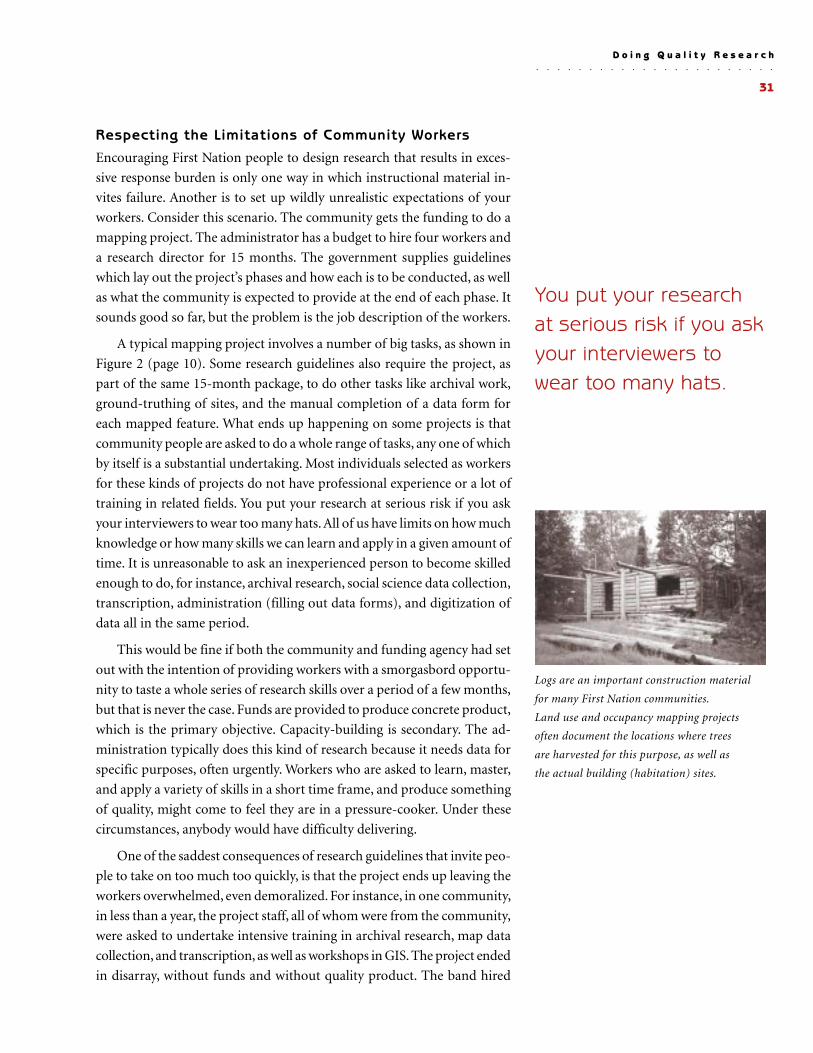
31
Respecting the Limitations of Community Workers
Encouraging First Nation people to design research that results in exces-
sive response burden is only one way in which instructional material in-
vites failure. Another is to set up wildly unrealistic expectations of your
workers. Consider this scenario. The community gets the funding to do a
mapping project. The administrator has a budget to hire four workers and
a research director for 15 months. The government supplies guidelines
which lay out the project’s phases and how each is to be conducted, as well
as what the community is expected to provide at the end of each phase. It
sounds good so far, but the problem is the job description of the workers.
A typical mapping project involves a number of big tasks, as shown in
Figure 2 (page 10). Some research guidelines also require the project, as
part of the same 15-month package, to do other tasks like archival work,
ground-truthing of sites, and the manual completion of a data form for
each mapped feature. What ends up happening on some projects is that
community people are asked to do a whole range of tasks, any one of which
by itself is a substantial undertaking. Most individuals selected as workers
for these kinds of projects do not have professional experience or a lot of
training in related fields. You put your research at serious risk if you ask
your interviewers to wear too many hats. All of us have limits on how much
knowledge or how many skills we can learn and apply in a given amount of
time. It is unreasonable to ask an inexperienced person to become skilled
enough to do, for instance, archival research, social science data collection,
transcription, administration (filling out data forms), and digitization of
data all in the same period.
This would be fine if both the community and funding agency had set
out with the intention of providing workers with a smorgasbord opportu-
nity to taste a whole series of research skills over a period of a few months,
but that is never the case. Funds are provided to produce concrete product,
which is the primary objective. Capacity-building is secondary. The ad-
ministration typically does this kind of research because it needs data for
specific purposes, often urgently. Workers who are asked to learn, master,
and apply a variety of skills in a short time frame, and produce something
of quality, might come to feel they are in a pressure-cooker. Under these
circumstances, anybody would have difficulty delivering.
One of the saddest consequences of research guidelines that invite peo-
ple to take on too much too quickly, is that the project ends up leaving the
workers overwhelmed, even demoralized. For instance, in one community,
in less than a year, the project staff, all of whom were from the community,
were asked to undertake intensive training in archival research, map data
collection, and transcription, as well as workshops in GIS. The project ended
in disarray, without funds and without quality product. The band hired
You put your researchat serious risk if you askyour interviewers towear too many hats.
○ ○ ○ ○ ○ ○ ○ ○ ○ ○ ○ ○ ○ ○ ○ ○ ○ ○ ○ ○ ○ ○ ○
D o i n g Q u a l i t y R e s e a r c h
Logs are an important construction material
for many First Nation communities.
Land use and occupancy mapping projects
often document the locations where trees
are harvested for this purpose, as well as
the actual building (habitation) sites.
○ ○ ○ ○ ○ ○ ○ ○ ○ ○ ○ ○ ○ ○ ○ ○ ○ ○ ○ ○ ○ ○ ○
C H I E F K E R R Y ’ S M O O S E
32
one of the luckless workers to stay on to manually create the composites
that were originally intended to be produced using GIS software.
What are the probable results of a situation like this? Aboriginal lead-
ers, negotiators, educators, lawyers, and resource managers do not end up
with the quality data needed to serve their people. The community ac-
quires a reputation for failure and finds itself out of luck the next time it
applies for funding to do cultural research. Community members become
cynical about research because their efforts did not translate into concrete
benefits. The workers are left doubting their ability to acquire and apply
research skills, and perhaps thinking the project’s outcome was their fault.
These are serious consequences, especially if your people’s vision is to
govern itself and develop the capacity to do its own research, planning,
and resource management. Every research project is an opportunity to build
the skills and confidence that are one of the cornerstones of self-govern-
ment. This can only happen if the expectations put on your researchers are
realistic. Make sure their job descriptions are reasonable and focussed
enough to ensure success.
Aboriginal people embarking on land use and occupancy projects need
to get themselves in the driver’s seat of research design. Being cautious
with the how-to instructional material that often comes with funding dol-
lars, and creative in modifying it to suit your needs, is part of the process.
There is always room to manoeuvre. You can mold the research design so
that it respects both the limitations of your participants and those of your
workers, minimizing response burden and creating a process in which your
workers succeed.
Every research projectis an opportunityto build the skills
and confidence thatare one of the
cornerstones ofself-government.
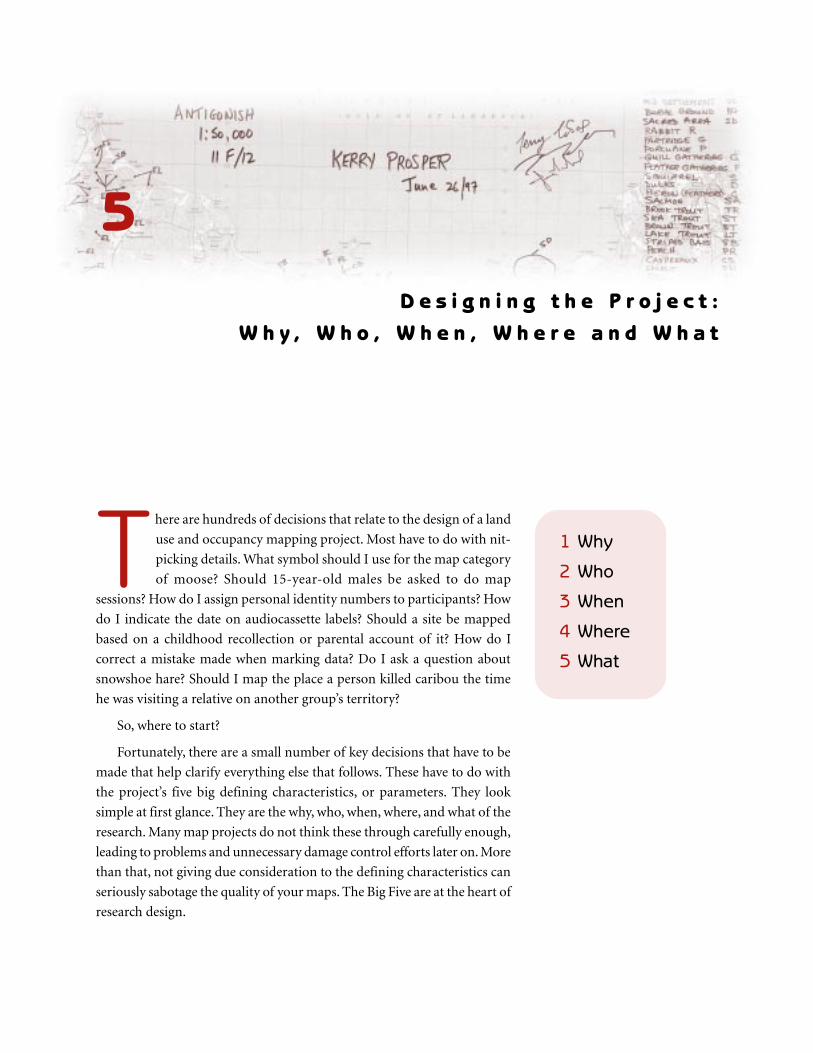
33
T here are hundreds of decisions that relate to the design of a land
use and occupancy mapping project. Most have to do with nit-
picking details. What symbol should I use for the map category
of moose? Should 15-year-old males be asked to do map
sessions? How do I assign personal identity numbers to participants? How
do I indicate the date on audiocassette labels? Should a site be mapped
based on a childhood recollection or parental account of it? How do I
correct a mistake made when marking data? Do I ask a question about
snowshoe hare? Should I map the place a person killed caribou the time
he was visiting a relative on another group’s territory?
So, where to start?
Fortunately, there are a small number of key decisions that have to be
made that help clarify everything else that follows. These have to do with
the project’s five big defining characteristics, or parameters. They look
simple at first glance. They are the why, who, when, where, and what of the
research. Many map projects do not think these through carefully enough,
leading to problems and unnecessary damage control efforts later on. More
than that, not giving due consideration to the defining characteristics can
seriously sabotage the quality of your maps. The Big Five are at the heart of
research design.
1 Why
2 Who
3 When
4 Where
5 What
D e s i g n i n g t h e P r o j e c t :
W h y , W h o , W h e n , W h e r e a n d W h a t
5
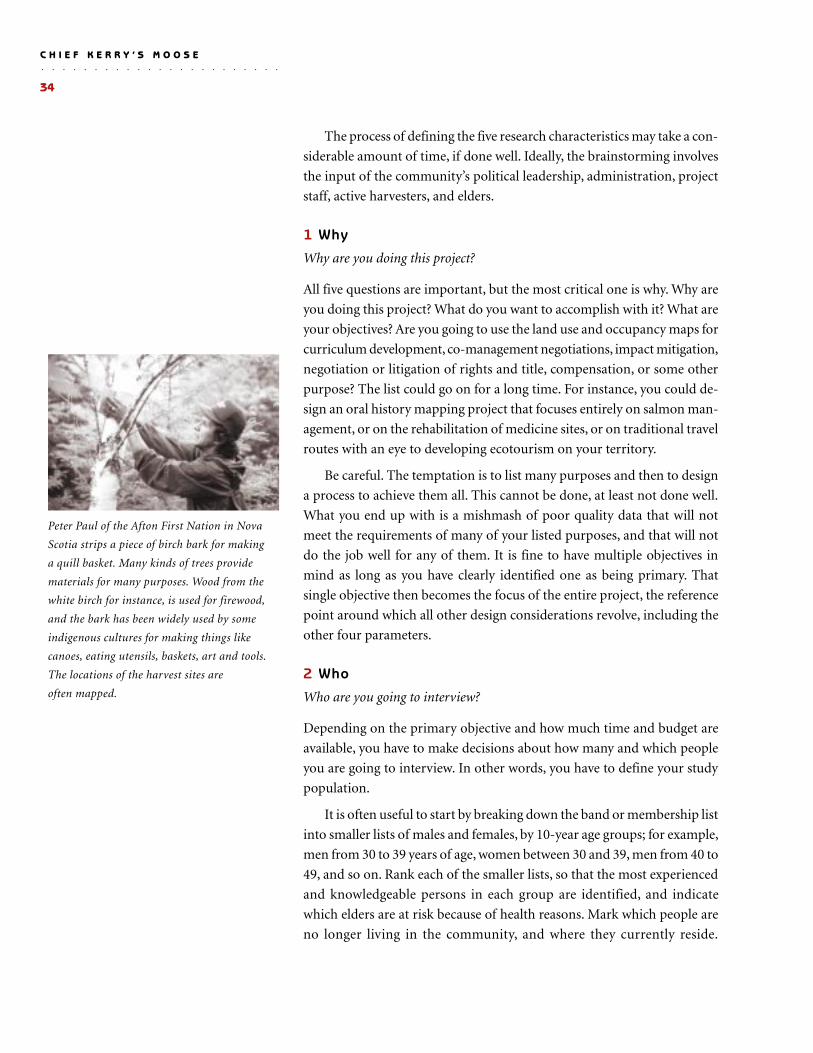
○ ○ ○ ○ ○ ○ ○ ○ ○ ○ ○ ○ ○ ○ ○ ○ ○ ○ ○ ○ ○ ○ ○
C H I E F K E R R Y ’ S M O O S E
34
The process of defining the five research characteristics may take a con-
siderable amount of time, if done well. Ideally, the brainstorming involves
the input of the community’s political leadership, administration, project
staff, active harvesters, and elders.
1 Why
Why are you doing this project?
All five questions are important, but the most critical one is why. Why are
you doing this project? What do you want to accomplish with it? What are
your objectives? Are you going to use the land use and occupancy maps for
curriculum development, co-management negotiations, impact mitigation,
negotiation or litigation of rights and title, compensation, or some other
purpose? The list could go on for a long time. For instance, you could de-
sign an oral history mapping project that focuses entirely on salmon man-
agement, or on the rehabilitation of medicine sites, or on traditional travel
routes with an eye to developing ecotourism on your territory.
Be careful. The temptation is to list many purposes and then to design
a process to achieve them all. This cannot be done, at least not done well.
What you end up with is a mishmash of poor quality data that will not
meet the requirements of many of your listed purposes, and that will not
do the job well for any of them. It is fine to have multiple objectives in
mind as long as you have clearly identified one as being primary. That
single objective then becomes the focus of the entire project, the reference
point around which all other design considerations revolve, including the
other four parameters.
2 Who
Who are you going to interview?
Depending on the primary objective and how much time and budget are
available, you have to make decisions about how many and which people
you are going to interview. In other words, you have to define your study
population.
It is often useful to start by breaking down the band or membership list
into smaller lists of males and females, by 10-year age groups; for example,
men from 30 to 39 years of age, women between 30 and 39, men from 40 to
49, and so on. Rank each of the smaller lists, so that the most experienced
and knowledgeable persons in each group are identified, and indicate
which elders are at risk because of health reasons. Mark which people are
no longer living in the community, and where they currently reside.
Peter Paul of the Afton First Nation in Nova
Scotia strips a piece of birch bark for making
a quill basket. Many kinds of trees provide
materials for many purposes. Wood from the
white birch for instance, is used for firewood,
and the bark has been widely used by some
indigenous cultures for making things like
canoes, eating utensils, baskets, art and tools.
The locations of the harvest sites are
often mapped.
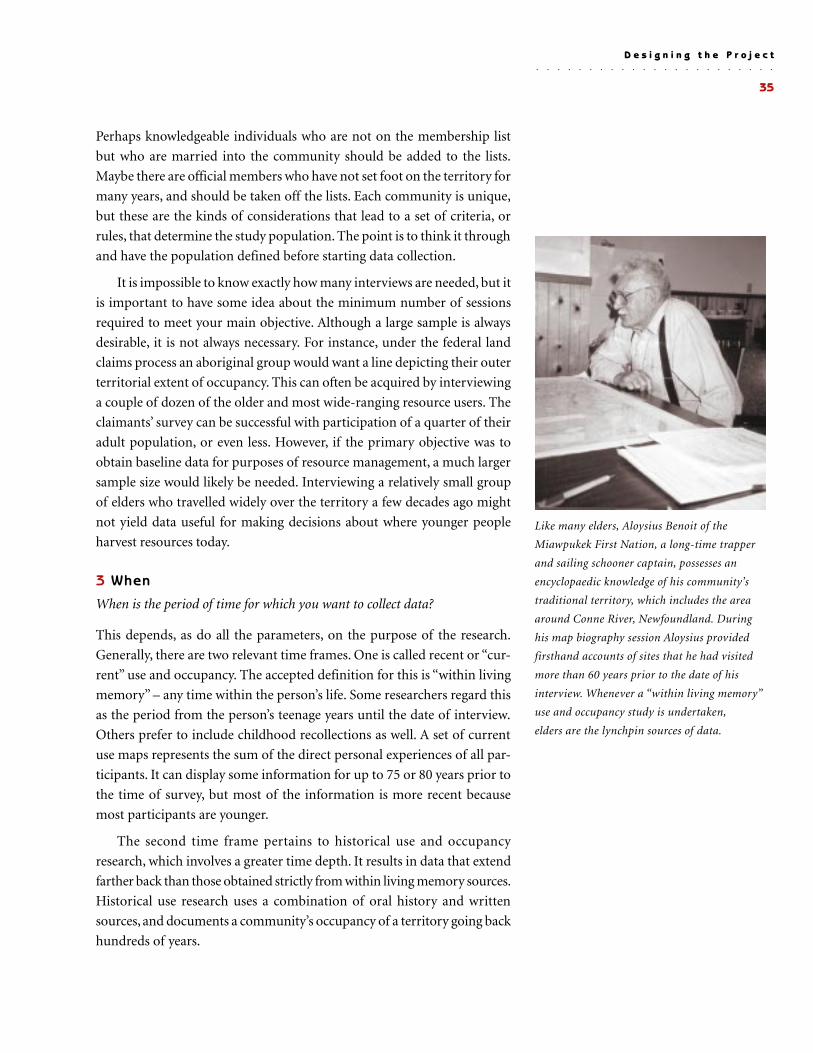
35
Perhaps knowledgeable individuals who are not on the membership list
but who are married into the community should be added to the lists.
Maybe there are official members who have not set foot on the territory for
many years, and should be taken off the lists. Each community is unique,
but these are the kinds of considerations that lead to a set of criteria, or
rules, that determine the study population. The point is to think it through
and have the population defined before starting data collection.
It is impossible to know exactly how many interviews are needed, but it
is important to have some idea about the minimum number of sessions
required to meet your main objective. Although a large sample is always
desirable, it is not always necessary. For instance, under the federal land
claims process an aboriginal group would want a line depicting their outer
territorial extent of occupancy. This can often be acquired by interviewing
a couple of dozen of the older and most wide-ranging resource users. The
claimants’ survey can be successful with participation of a quarter of their
adult population, or even less. However, if the primary objective was to
obtain baseline data for purposes of resource management, a much larger
sample size would likely be needed. Interviewing a relatively small group
of elders who travelled widely over the territory a few decades ago might
not yield data useful for making decisions about where younger people
harvest resources today.
3 When
When is the period of time for which you want to collect data?
This depends, as do all the parameters, on the purpose of the research.
Generally, there are two relevant time frames. One is called recent or “cur-
rent” use and occupancy. The accepted definition for this is “within living
memory” – any time within the person’s life. Some researchers regard this
as the period from the person’s teenage years until the date of interview.
Others prefer to include childhood recollections as well. A set of current
use maps represents the sum of the direct personal experiences of all par-
ticipants. It can display some information for up to 75 or 80 years prior to
the time of survey, but most of the information is more recent because
most participants are younger.
The second time frame pertains to historical use and occupancy
research, which involves a greater time depth. It results in data that extend
farther back than those obtained strictly from within living memory sources.
Historical use research uses a combination of oral history and written
sources, and documents a community’s occupancy of a territory going back
hundreds of years.
○ ○ ○ ○ ○ ○ ○ ○ ○ ○ ○ ○ ○ ○ ○ ○ ○ ○ ○ ○ ○ ○ ○
D e s i g n i n g t h e P r o j e c t
Like many elders, Aloysius Benoit of the
Miawpukek First Nation, a long-time trapper
and sailing schooner captain, possesses an
encyclopaedic knowledge of his community’s
traditional territory, which includes the area
around Conne River, Newfoundland. During
his map biography session Aloysius provided
firsthand accounts of sites that he had visited
more than 60 years prior to the date of his
interview. Whenever a “within living memory”
use and occupancy study is undertaken,
elders are the lynchpin sources of data.
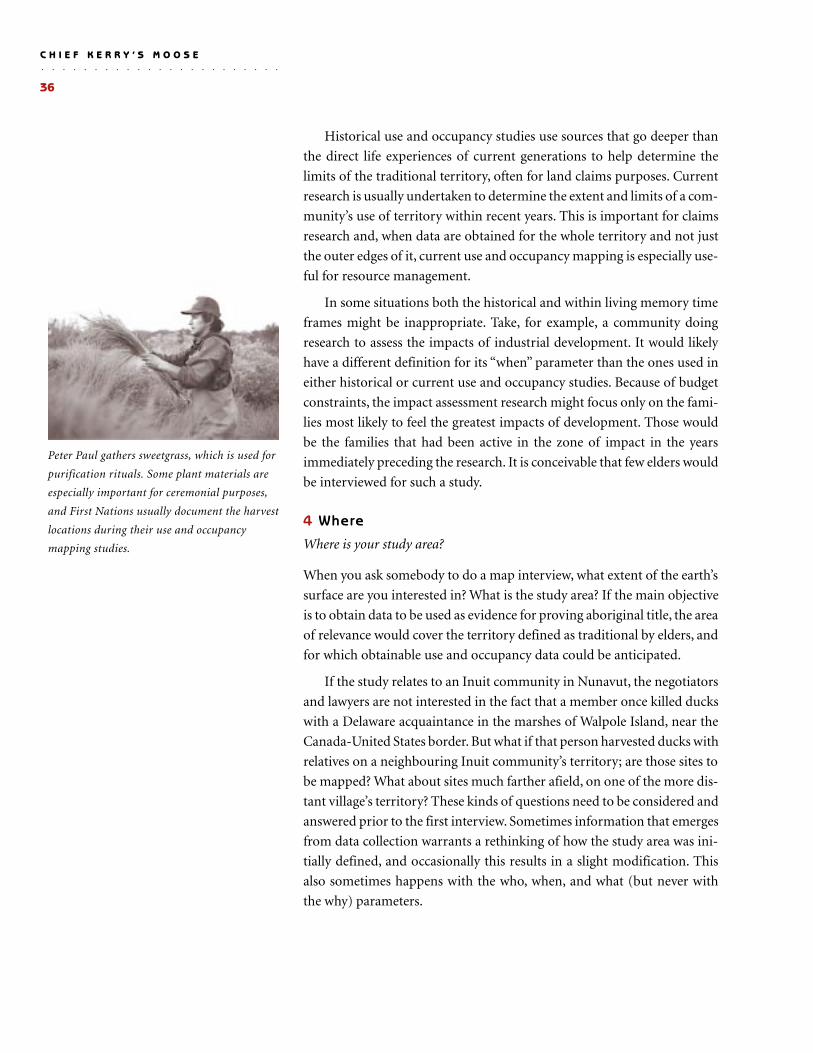
○ ○ ○ ○ ○ ○ ○ ○ ○ ○ ○ ○ ○ ○ ○ ○ ○ ○ ○ ○ ○ ○ ○
C H I E F K E R R Y ’ S M O O S E
36
Historical use and occupancy studies use sources that go deeper than
the direct life experiences of current generations to help determine the
limits of the traditional territory, often for land claims purposes. Current
research is usually undertaken to determine the extent and limits of a com-
munity’s use of territory within recent years. This is important for claims
research and, when data are obtained for the whole territory and not just
the outer edges of it, current use and occupancy mapping is especially use-
ful for resource management.
In some situations both the historical and within living memory time
frames might be inappropriate. Take, for example, a community doing
research to assess the impacts of industrial development. It would likely
have a different definition for its “when” parameter than the ones used in
either historical or current use and occupancy studies. Because of budget
constraints, the impact assessment research might focus only on the fami-
lies most likely to feel the greatest impacts of development. Those would
be the families that had been active in the zone of impact in the years
immediately preceding the research. It is conceivable that few elders would
be interviewed for such a study.
4 Where
Where is your study area?
When you ask somebody to do a map interview, what extent of the earth’s
surface are you interested in? What is the study area? If the main objective
is to obtain data to be used as evidence for proving aboriginal title, the area
of relevance would cover the territory defined as traditional by elders, and
for which obtainable use and occupancy data could be anticipated.
If the study relates to an Inuit community in Nunavut, the negotiators
and lawyers are not interested in the fact that a member once killed ducks
with a Delaware acquaintance in the marshes of Walpole Island, near the
Canada-United States border. But what if that person harvested ducks with
relatives on a neighbouring Inuit community’s territory; are those sites to
be mapped? What about sites much farther afield, on one of the more dis-
tant village’s territory? These kinds of questions need to be considered and
answered prior to the first interview. Sometimes information that emerges
from data collection warrants a rethinking of how the study area was ini-
tially defined, and occasionally this results in a slight modification. This
also sometimes happens with the who, when, and what (but never with
the why) parameters.
Peter Paul gathers sweetgrass, which is used for
purification rituals. Some plant materials are
especially important for ceremonial purposes,
and First Nations usually document the harvest
locations during their use and occupancy
mapping studies.
37
5 What
What questions are you going to ask participants?
Any of the five parameters can be difficult to define. Almost always the one
that is most time-consuming has to do with what. What kinds of data do
you want for your maps? There is a huge range of different kinds of map-
pable oral history data, or themes, that can be relevant to meeting your
primary objective: harvesting areas, habitation sites, travel and trade routes,
place names, and so on. It is important to choose a small number of themes,
usually no more than two. There are two advantages to being so selective.
◆ You can do a thorough job so that the research product is completeenough that subsequent projects can build on it from a position ofstrength.
◆ You can avoid excessive response burden.
If you decide on harvesting sites as a theme, it is necessary to think
about who the consumers of the harvests are. Do you want mapped data
that represent where people obtained resources that were used to feed them-
selves and their community, or that were used for sale on commercial mar-
kets, or for trade with distant kin, or that ended up in tourists’ freezers? Do
you want to map a site where a resource is harvested and a portion feeds
your community and a portion is sold on international markets? These
kinds of considerations need to be resolved carefully. Questions must be
framed in a way that allows participants to know exactly what the inter-
viewer is after.
The interview guide, which is the actual list of questions to be asked, is
the concrete end product of all the decisions made concerning the “what”
parameter. Even a quick look at it can say a lot about a project’s chances of
success because its length and complexity are related to the way people will
likely experience the mapping sessions. The interview guide is where the
overly-ambitious project gets into major trouble by generating too much
response burden. It is also where the more carefully designed project suc-
ceeds. The effective interview guide is carefully constructed and then tested
on a few individuals to see if its wording is clear, and to make sure the
interviews are not going to be too long and difficult. Some changes might
be necessary, after which the guide is finally administered to participants.
The effective interviewguide is carefullyconstructed andthen tested ona few individuals.
○ ○ ○ ○ ○ ○ ○ ○ ○ ○ ○ ○ ○ ○ ○ ○ ○ ○ ○ ○ ○ ○ ○
D e s i g n i n g t h e P r o j e c t
○ ○ ○ ○ ○ ○ ○ ○ ○ ○ ○ ○ ○ ○ ○ ○ ○ ○ ○ ○ ○ ○ ○
C H I E F K E R R Y ’ S M O O S E
38
R esearch has two basic aspects: design and implementation.
You design it, then do it. You construct the blueprint,then
you collect data according to that blueprint.
There are a number of principles that are very helpful when designing
and implementing your work. Projects often take on a life of their own,
going off in this direction today, then pulling you off in a different one
tomorrow. Principles are guidelines that keep you on track, and guarantee
that your project stays manageable. Some are more important than others;
some may apply more to certain kinds of data collection. The principles
discussed below have made a big difference for a number of successful land
use and occupancy projects.
1 Respect
Respect participants in a heartfelt manner, at all times.
Respect is at the top of the list. I have already referred to the need for hon-
ouring the limitations of participants and workers. Most individuals can
sense whether someone respects them, or is faking it. They can also sense
whether the community researcher genuinely honours the experience that
is being shared during an interview, even if that experience comes from a
belief system different from the interviewer’s. Some of the questions asked
during an interview are private and intimate. Elders are often asked to talk
1 Respect
2 Confidentiality
3 Informed Consent
4 Focus
5 Flexibility
6 Consistency
7 Organization
8 Caution
9 Self-Reporting
10 Integrity
11 Data Diamond
12 Fun
P r i n c i p l e s o f R e s e a r c h
D e s i g n a n d I m p l e m e n t a t i o n
6
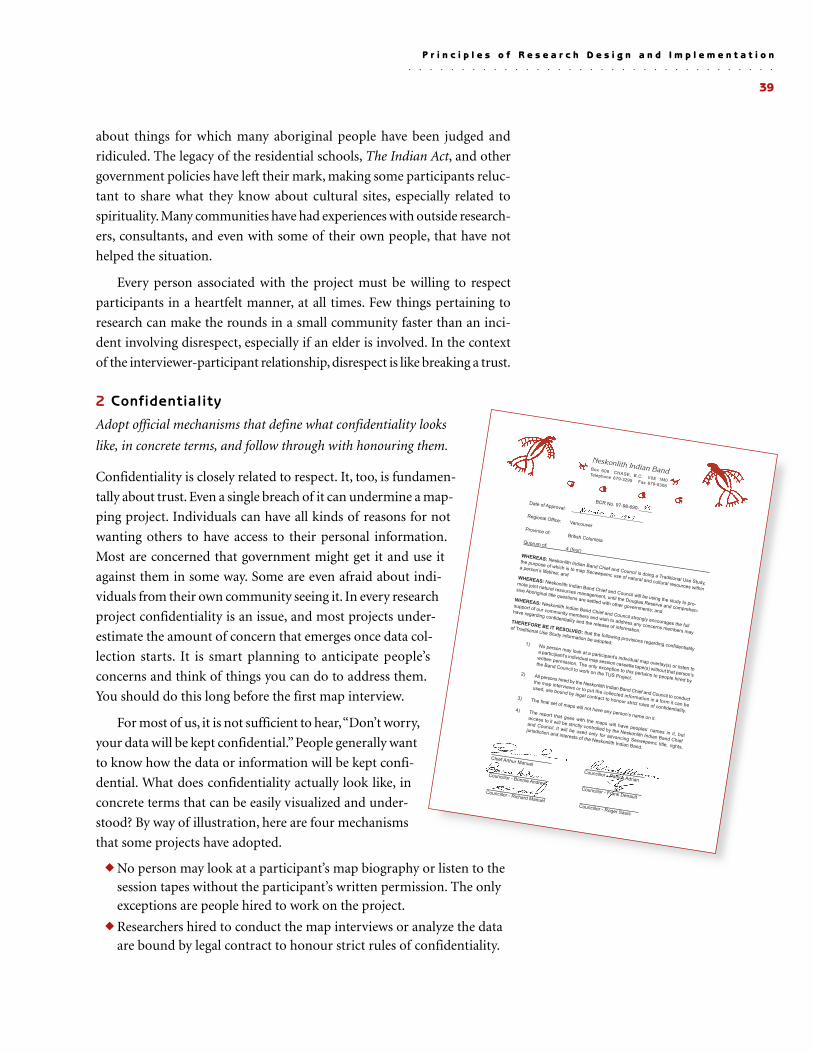
39
about things for which many aboriginal people have been judged and
ridiculed. The legacy of the residential schools, The Indian Act, and other
government policies have left their mark, making some participants reluc-
tant to share what they know about cultural sites, especially related to
spirituality. Many communities have had experiences with outside research-
ers, consultants, and even with some of their own people, that have not
helped the situation.
Every person associated with the project must be willing to respect
participants in a heartfelt manner, at all times. Few things pertaining to
research can make the rounds in a small community faster than an inci-
dent involving disrespect, especially if an elder is involved. In the context
of the interviewer-participant relationship, disrespect is like breaking a trust.
2 Confidentiality
Adopt official mechanisms that define what confidentiality looks
like, in concrete terms, and follow through with honouring them.
Confidentiality is closely related to respect. It, too, is fundamen-
tally about trust. Even a single breach of it can undermine a map-
ping project. Individuals can have all kinds of reasons for not
wanting others to have access to their personal information.
Most are concerned that government might get it and use it
against them in some way. Some are even afraid about indi-
viduals from their own community seeing it. In every research
project confidentiality is an issue, and most projects under-
estimate the amount of concern that emerges once data col-
lection starts. It is smart planning to anticipate people’s
concerns and think of things you can do to address them.
You should do this long before the first map interview.
For most of us, it is not sufficient to hear, “Don’t worry,
your data will be kept confidential.” People generally want
to know how the data or information will be kept confi-
dential. What does confidentiality actually look like, in
concrete terms that can be easily visualized and under-
stood? By way of illustration, here are four mechanisms
that some projects have adopted.
◆ No person may look at a participant’s map biography or listen to thesession tapes without the participant’s written permission. The onlyexceptions are people hired to work on the project.
◆ Researchers hired to conduct the map interviews or analyze the dataare bound by legal contract to honour strict rules of confidentiality.
○ ○ ○ ○ ○ ○ ○ ○ ○ ○ ○ ○ ○ ○ ○ ○ ○ ○ ○ ○ ○ ○ ○ ○ ○ ○ ○ ○ ○ ○ ○ ○ ○ ○ ○
P r i n c i p l e s o f R e s e a r c h D e s i g n a n d I m p l e m e n t a t i o n
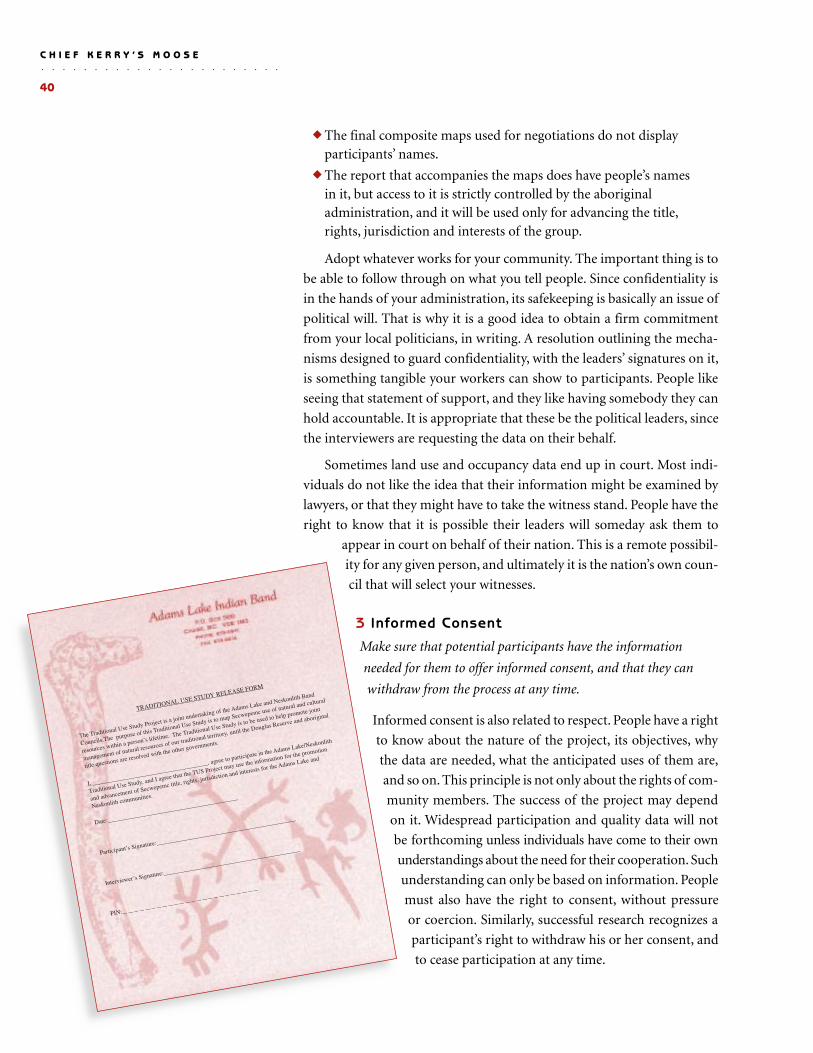
○ ○ ○ ○ ○ ○ ○ ○ ○ ○ ○ ○ ○ ○ ○ ○ ○ ○ ○ ○ ○ ○ ○
C H I E F K E R R Y ’ S M O O S E
40
◆ The final composite maps used for negotiations do not displayparticipants’ names.
◆ The report that accompanies the maps does have people’s namesin it, but access to it is strictly controlled by the aboriginaladministration, and it will be used only for advancing the title,rights, jurisdiction and interests of the group.
Adopt whatever works for your community. The important thing is to
be able to follow through on what you tell people. Since confidentiality is
in the hands of your administration, its safekeeping is basically an issue of
political will. That is why it is a good idea to obtain a firm commitment
from your local politicians, in writing. A resolution outlining the mecha-
nisms designed to guard confidentiality, with the leaders’ signatures on it,
is something tangible your workers can show to participants. People like
seeing that statement of support, and they like having somebody they can
hold accountable. It is appropriate that these be the political leaders, since
the interviewers are requesting the data on their behalf.
Sometimes land use and occupancy data end up in court. Most indi-
viduals do not like the idea that their information might be examined by
lawyers, or that they might have to take the witness stand. People have the
right to know that it is possible their leaders will someday ask them to
appear in court on behalf of their nation. This is a remote possibil-
ity for any given person, and ultimately it is the nation’s own coun-
cil that will select your witnesses.
3 Informed Consent
Make sure that potential participants have the information
needed for them to offer informed consent, and that they can
withdraw from the process at any time.
Informed consent is also related to respect. People have a right
to know about the nature of the project, its objectives, why
the data are needed, what the anticipated uses of them are,
and so on. This principle is not only about the rights of com-
munity members. The success of the project may depend
on it. Widespread participation and quality data will not
be forthcoming unless individuals have come to their own
understandings about the need for their cooperation. Such
understanding can only be based on information. People
must also have the right to consent, without pressure
or coercion. Similarly, successful research recognizes a
participant’s right to withdraw his or her consent, and
to cease participation at any time.
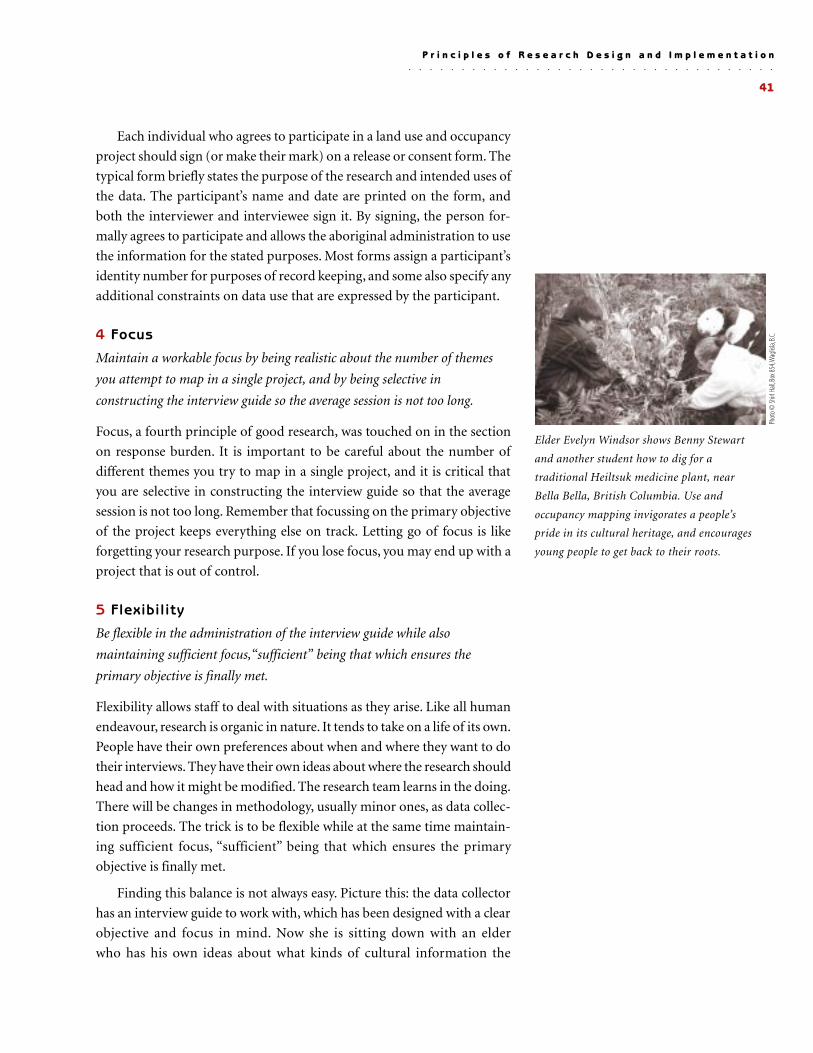
41
Each individual who agrees to participate in a land use and occupancy
project should sign (or make their mark) on a release or consent form. The
typical form briefly states the purpose of the research and intended uses of
the data. The participant’s name and date are printed on the form, and
both the interviewer and interviewee sign it. By signing, the person for-
mally agrees to participate and allows the aboriginal administration to use
the information for the stated purposes. Most forms assign a participant’s
identity number for purposes of record keeping, and some also specify any
additional constraints on data use that are expressed by the participant.
4 Focus
Maintain a workable focus by being realistic about the number of themes
you attempt to map in a single project, and by being selective in
constructing the interview guide so the average session is not too long.
Focus, a fourth principle of good research, was touched on in the section
on response burden. It is important to be careful about the number of
different themes you try to map in a single project, and it is critical that
you are selective in constructing the interview guide so that the average
session is not too long. Remember that focussing on the primary objective
of the project keeps everything else on track. Letting go of focus is like
forgetting your research purpose. If you lose focus, you may end up with a
project that is out of control.
5 Flexibility
Be flexible in the administration of the interview guide while also
maintaining sufficient focus,“sufficient” being that which ensures the
primary objective is finally met.
Flexibility allows staff to deal with situations as they arise. Like all human
endeavour, research is organic in nature. It tends to take on a life of its own.
People have their own preferences about when and where they want to do
their interviews. They have their own ideas about where the research should
head and how it might be modified. The research team learns in the doing.
There will be changes in methodology, usually minor ones, as data collec-
tion proceeds. The trick is to be flexible while at the same time maintain-
ing sufficient focus, “sufficient” being that which ensures the primary
objective is finally met.
Finding this balance is not always easy. Picture this: the data collector
has an interview guide to work with, which has been designed with a clear
objective and focus in mind. Now she is sitting down with an elder
who has his own ideas about what kinds of cultural information the
○ ○ ○ ○ ○ ○ ○ ○ ○ ○ ○ ○ ○ ○ ○ ○ ○ ○ ○ ○ ○ ○ ○ ○ ○ ○ ○ ○ ○ ○ ○ ○ ○ ○ ○
P r i n c i p l e s o f R e s e a r c h D e s i g n a n d I m p l e m e n t a t i o n
Elder Evelyn Windsor shows Benny Stewart
and another student how to dig for a
traditional Heiltsuk medicine plant, near
Bella Bella, British Columbia. Use and
occupancy mapping invigorates a people’s
pride in its cultural heritage, and encourages
young people to get back to their roots.
Phot
o © Sh
irl H
all, B
ox 85
4, W
aglis
la, B.
C.
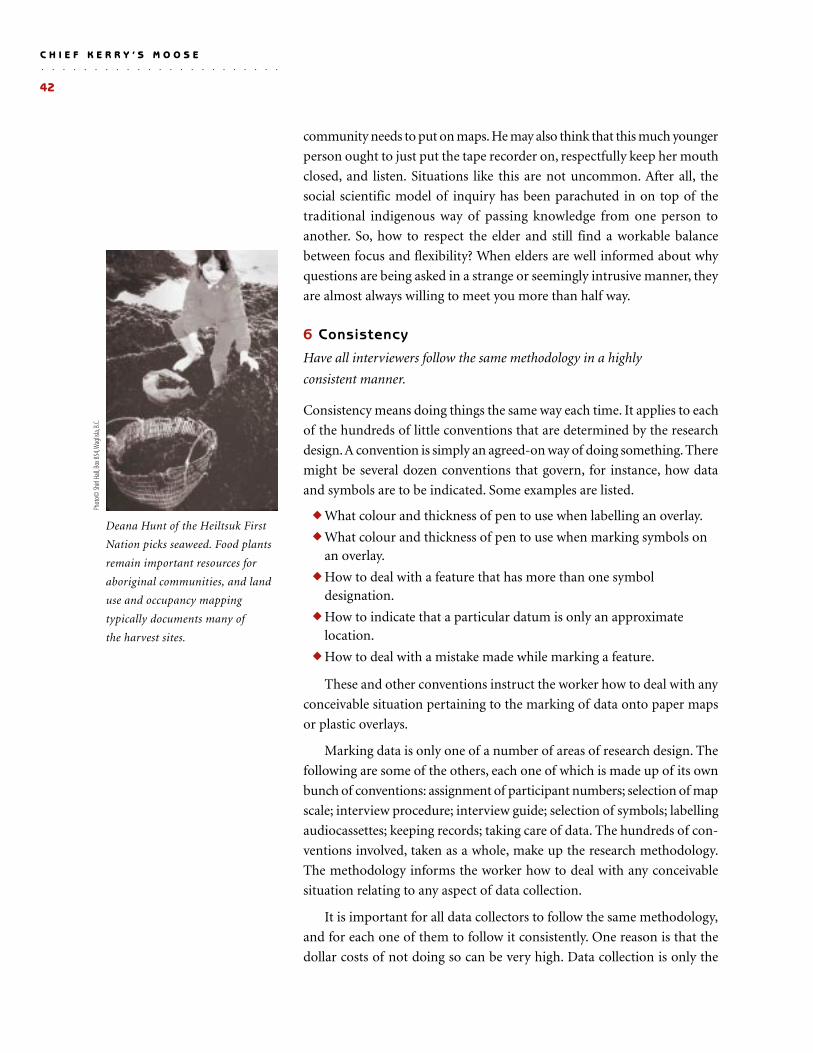
○ ○ ○ ○ ○ ○ ○ ○ ○ ○ ○ ○ ○ ○ ○ ○ ○ ○ ○ ○ ○ ○ ○
C H I E F K E R R Y ’ S M O O S E
42
community needs to put on maps. He may also think that this much younger
person ought to just put the tape recorder on, respectfully keep her mouth
closed, and listen. Situations like this are not uncommon. After all, the
social scientific model of inquiry has been parachuted in on top of the
traditional indigenous way of passing knowledge from one person to
another. So, how to respect the elder and still find a workable balance
between focus and flexibility? When elders are well informed about why
questions are being asked in a strange or seemingly intrusive manner, they
are almost always willing to meet you more than half way.
6 Consistency
Have all interviewers follow the same methodology in a highly
consistent manner.
Consistency means doing things the same way each time. It applies to each
of the hundreds of little conventions that are determined by the research
design. A convention is simply an agreed-on way of doing something. There
might be several dozen conventions that govern, for instance, how data
and symbols are to be indicated. Some examples are listed.
◆ What colour and thickness of pen to use when labelling an overlay.
◆ What colour and thickness of pen to use when marking symbols onan overlay.
◆ How to deal with a feature that has more than one symboldesignation.
◆ How to indicate that a particular datum is only an approximatelocation.
◆ How to deal with a mistake made while marking a feature.
These and other conventions instruct the worker how to deal with any
conceivable situation pertaining to the marking of data onto paper maps
or plastic overlays.
Marking data is only one of a number of areas of research design. The
following are some of the others, each one of which is made up of its own
bunch of conventions: assignment of participant numbers; selection of map
scale; interview procedure; interview guide; selection of symbols; labelling
audiocassettes; keeping records; taking care of data. The hundreds of con-
ventions involved, taken as a whole, make up the research methodology.
The methodology informs the worker how to deal with any conceivable
situation relating to any aspect of data collection.
It is important for all data collectors to follow the same methodology,
and for each one of them to follow it consistently. One reason is that the
dollar costs of not doing so can be very high. Data collection is only the
Phot
o© Sh
irl H
all, B
ox 85
4, W
aglis
la, B.
C.
Deana Hunt of the Heiltsuk First
Nation picks seaweed. Food plants
remain important resources for
aboriginal communities, and land
use and occupancy mapping
typically documents many of
the harvest sites.
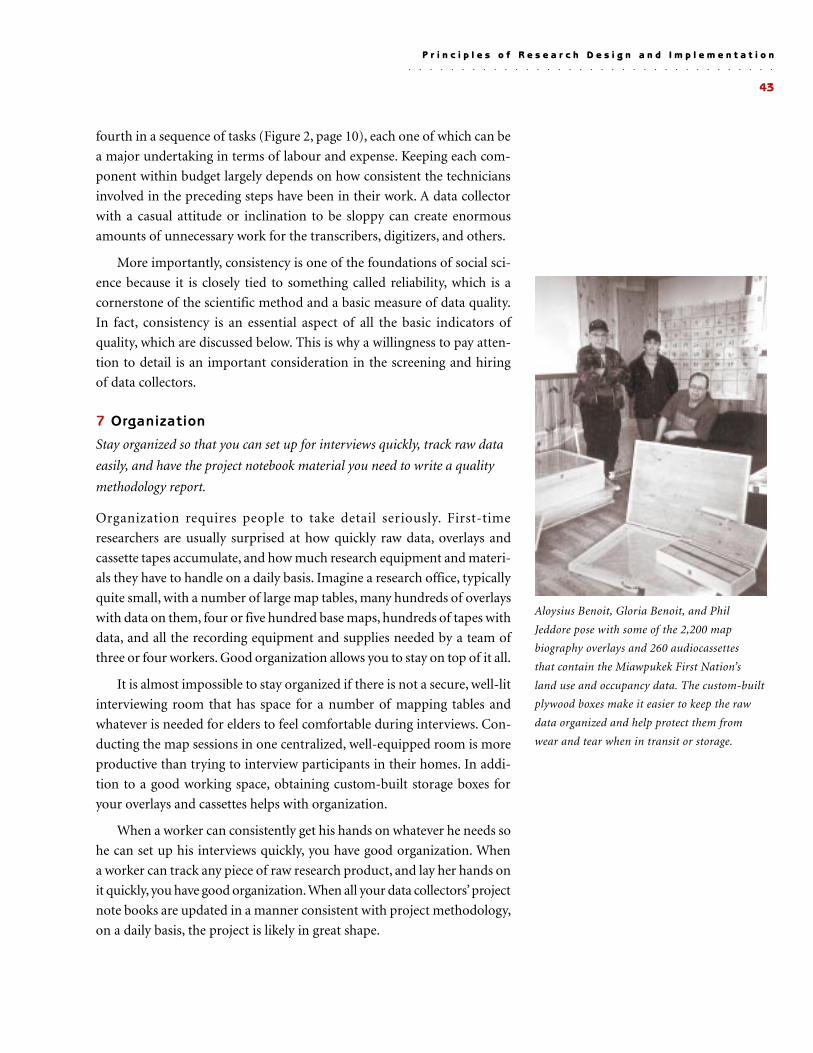
43
fourth in a sequence of tasks (Figure 2, page 10), each one of which can be
a major undertaking in terms of labour and expense. Keeping each com-
ponent within budget largely depends on how consistent the technicians
involved in the preceding steps have been in their work. A data collector
with a casual attitude or inclination to be sloppy can create enormous
amounts of unnecessary work for the transcribers, digitizers, and others.
More importantly, consistency is one of the foundations of social sci-
ence because it is closely tied to something called reliability, which is a
cornerstone of the scientific method and a basic measure of data quality.
In fact, consistency is an essential aspect of all the basic indicators of
quality, which are discussed below. This is why a willingness to pay atten-
tion to detail is an important consideration in the screening and hiring
of data collectors.
7 Organization
Stay organized so that you can set up for interviews quickly, track raw data
easily, and have the project notebook material you need to write a quality
methodology report.
Organization requires people to take detail seriously. First-time
researchers are usually surprised at how quickly raw data, overlays and
cassette tapes accumulate, and how much research equipment and materi-
als they have to handle on a daily basis. Imagine a research office, typically
quite small, with a number of large map tables, many hundreds of overlays
with data on them, four or five hundred base maps, hundreds of tapes with
data, and all the recording equipment and supplies needed by a team of
three or four workers. Good organization allows you to stay on top of it all.
It is almost impossible to stay organized if there is not a secure, well-lit
interviewing room that has space for a number of mapping tables and
whatever is needed for elders to feel comfortable during interviews. Con-
ducting the map sessions in one centralized, well-equipped room is more
productive than trying to interview participants in their homes. In addi-
tion to a good working space, obtaining custom-built storage boxes for
your overlays and cassettes helps with organization.
When a worker can consistently get his hands on whatever he needs so
he can set up his interviews quickly, you have good organization. When
a worker can track any piece of raw research product, and lay her hands on
it quickly, you have good organization. When all your data collectors’ project
note books are updated in a manner consistent with project methodology,
on a daily basis, the project is likely in great shape.
○ ○ ○ ○ ○ ○ ○ ○ ○ ○ ○ ○ ○ ○ ○ ○ ○ ○ ○ ○ ○ ○ ○ ○ ○ ○ ○ ○ ○ ○ ○ ○ ○ ○ ○
P r i n c i p l e s o f R e s e a r c h D e s i g n a n d I m p l e m e n t a t i o n
Aloysius Benoit, Gloria Benoit, and Phil
Jeddore pose with some of the 2,200 map
biography overlays and 260 audiocassettes
that contain the Miawpukek First Nation’s
land use and occupancy data. The custom-built
plywood boxes make it easier to keep the raw
data organized and help protect them from
wear and tear when in transit or storage.
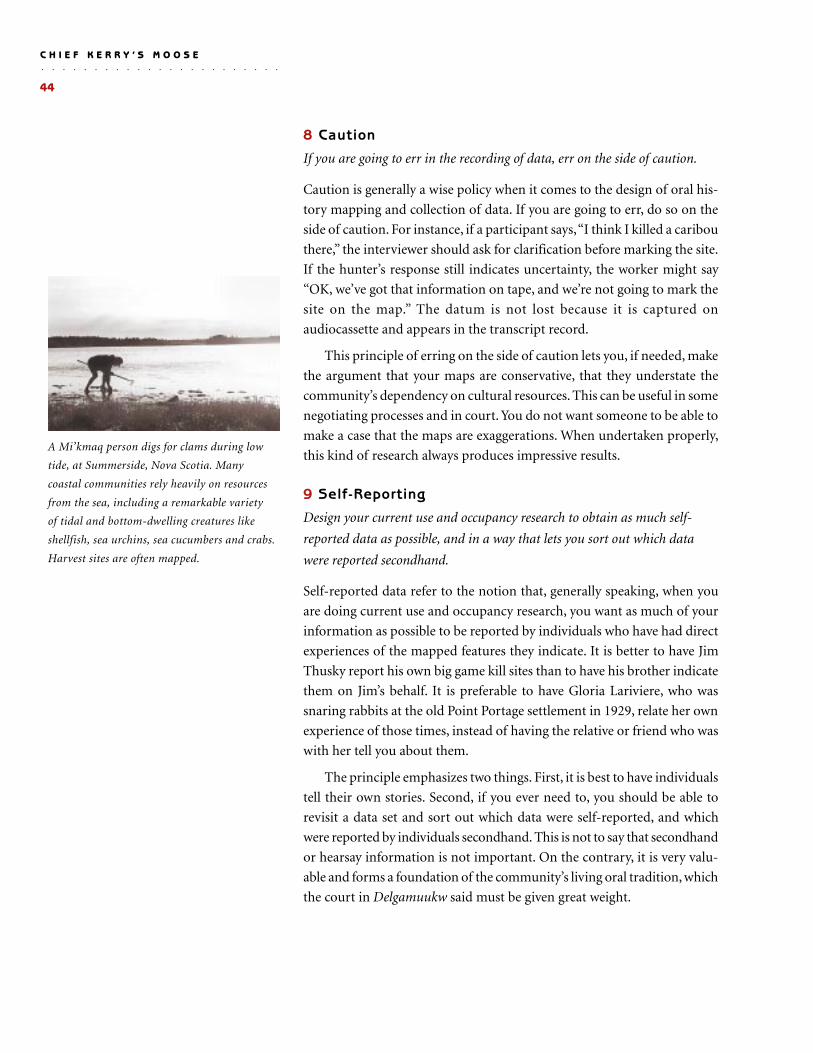
○ ○ ○ ○ ○ ○ ○ ○ ○ ○ ○ ○ ○ ○ ○ ○ ○ ○ ○ ○ ○ ○ ○
C H I E F K E R R Y ’ S M O O S E
44
8 Caution
If you are going to err in the recording of data, err on the side of caution.
Caution is generally a wise policy when it comes to the design of oral his-
tory mapping and collection of data. If you are going to err, do so on the
side of caution. For instance, if a participant says, “I think I killed a caribou
there,” the interviewer should ask for clarification before marking the site.
If the hunter’s response still indicates uncertainty, the worker might say
“OK, we’ve got that information on tape, and we’re not going to mark the
site on the map.” The datum is not lost because it is captured on
audiocassette and appears in the transcript record.
This principle of erring on the side of caution lets you, if needed, make
the argument that your maps are conservative, that they understate the
community’s dependency on cultural resources. This can be useful in some
negotiating processes and in court. You do not want someone to be able to
make a case that the maps are exaggerations. When undertaken properly,
this kind of research always produces impressive results.
9 Self-Reporting
Design your current use and occupancy research to obtain as much self-
reported data as possible, and in a way that lets you sort out which data
were reported secondhand.
Self-reported data refer to the notion that, generally speaking, when you
are doing current use and occupancy research, you want as much of your
information as possible to be reported by individuals who have had direct
experiences of the mapped features they indicate. It is better to have Jim
Thusky report his own big game kill sites than to have his brother indicate
them on Jim’s behalf. It is preferable to have Gloria Lariviere, who was
snaring rabbits at the old Point Portage settlement in 1929, relate her own
experience of those times, instead of having the relative or friend who was
with her tell you about them.
The principle emphasizes two things. First, it is best to have individuals
tell their own stories. Second, if you ever need to, you should be able to
revisit a data set and sort out which data were self-reported, and which
were reported by individuals secondhand. This is not to say that secondhand
or hearsay information is not important. On the contrary, it is very valu-
able and forms a foundation of the community’s living oral tradition, which
the court in Delgamuukw said must be given great weight.
A Mi’kmaq person digs for clams during low
tide, at Summerside, Nova Scotia. Many
coastal communities rely heavily on resources
from the sea, including a remarkable variety
of tidal and bottom-dwelling creatures like
shellfish, sea urchins, sea cucumbers and crabs.
Harvest sites are often mapped.
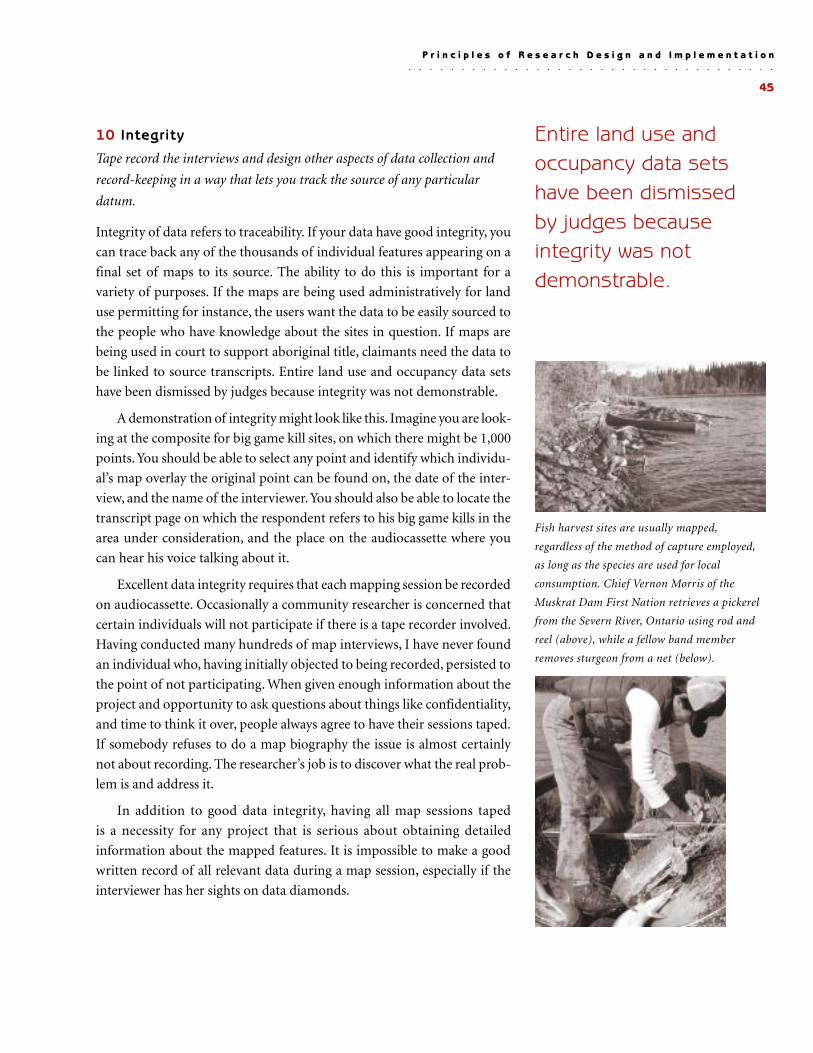
45
10 Integrity
Tape record the interviews and design other aspects of data collection and
record-keeping in a way that lets you track the source of any particular
datum.
Integrity of data refers to traceability. If your data have good integrity, you
can trace back any of the thousands of individual features appearing on a
final set of maps to its source. The ability to do this is important for a
variety of purposes. If the maps are being used administratively for land
use permitting for instance, the users want the data to be easily sourced to
the people who have knowledge about the sites in question. If maps are
being used in court to support aboriginal title, claimants need the data to
be linked to source transcripts. Entire land use and occupancy data sets
have been dismissed by judges because integrity was not demonstrable.
A demonstration of integrity might look like this. Imagine you are look-
ing at the composite for big game kill sites, on which there might be 1,000
points. You should be able to select any point and identify which individu-
al’s map overlay the original point can be found on, the date of the inter-
view, and the name of the interviewer. You should also be able to locate the
transcript page on which the respondent refers to his big game kills in the
area under consideration, and the place on the audiocassette where you
can hear his voice talking about it.
Excellent data integrity requires that each mapping session be recorded
on audiocassette. Occasionally a community researcher is concerned that
certain individuals will not participate if there is a tape recorder involved.
Having conducted many hundreds of map interviews, I have never found
an individual who, having initially objected to being recorded, persisted to
the point of not participating. When given enough information about the
project and opportunity to ask questions about things like confidentiality,
and time to think it over, people always agree to have their sessions taped.
If somebody refuses to do a map biography the issue is almost certainly
not about recording. The researcher’s job is to discover what the real prob-
lem is and address it.
In addition to good data integrity, having all map sessions taped
is a necessity for any project that is serious about obtaining detailed
information about the mapped features. It is impossible to make a good
written record of all relevant data during a map session, especially if the
interviewer has her sights on data diamonds.
Entire land use andoccupancy data setshave been dismissedby judges becauseintegrity was notdemonstrable.
○ ○ ○ ○ ○ ○ ○ ○ ○ ○ ○ ○ ○ ○ ○ ○ ○ ○ ○ ○ ○ ○ ○ ○ ○ ○ ○ ○ ○ ○ ○ ○ ○ ○ ○
P r i n c i p l e s o f R e s e a r c h D e s i g n a n d I m p l e m e n t a t i o n
Fish harvest sites are usually mapped,
regardless of the method of capture employed,
as long as the species are used for local
consumption. Chief Vernon Morris of the
Muskrat Dam First Nation retrieves a pickerel
from the Severn River, Ontario using rod and
reel (above), while a fellow band member
removes sturgeon from a net (below).
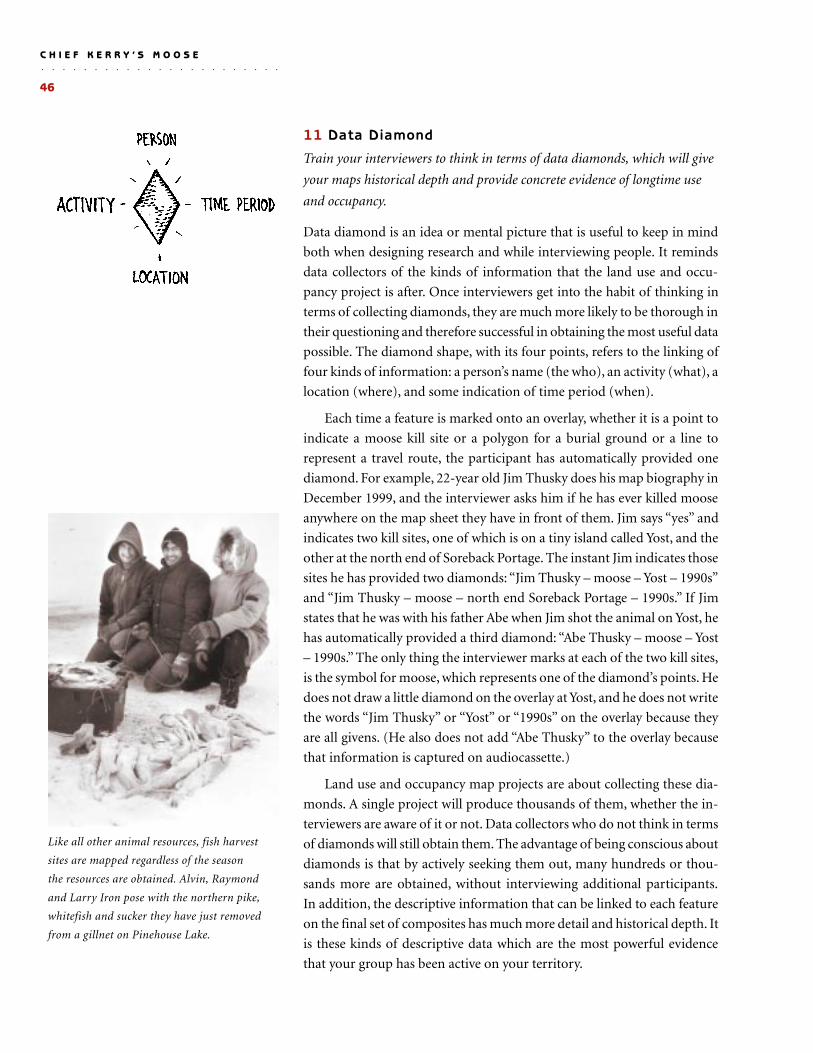
○ ○ ○ ○ ○ ○ ○ ○ ○ ○ ○ ○ ○ ○ ○ ○ ○ ○ ○ ○ ○ ○ ○
C H I E F K E R R Y ’ S M O O S E
46
11 Data Diamond
Train your interviewers to think in terms of data diamonds, which will give
your maps historical depth and provide concrete evidence of longtime use
and occupancy.
Data diamond is an idea or mental picture that is useful to keep in mind
both when designing research and while interviewing people. It reminds
data collectors of the kinds of information that the land use and occu-
pancy project is after. Once interviewers get into the habit of thinking in
terms of collecting diamonds, they are much more likely to be thorough in
their questioning and therefore successful in obtaining the most useful data
possible. The diamond shape, with its four points, refers to the linking of
four kinds of information: a person’s name (the who), an activity (what), a
location (where), and some indication of time period (when).
Each time a feature is marked onto an overlay, whether it is a point to
indicate a moose kill site or a polygon for a burial ground or a line to
represent a travel route, the participant has automatically provided one
diamond. For example, 22-year old Jim Thusky does his map biography in
December 1999, and the interviewer asks him if he has ever killed moose
anywhere on the map sheet they have in front of them. Jim says “yes” and
indicates two kill sites, one of which is on a tiny island called Yost, and the
other at the north end of Soreback Portage. The instant Jim indicates those
sites he has provided two diamonds: “Jim Thusky – moose – Yost – 1990s”
and “Jim Thusky – moose – north end Soreback Portage – 1990s.” If Jim
states that he was with his father Abe when Jim shot the animal on Yost, he
has automatically provided a third diamond: “Abe Thusky – moose – Yost
– 1990s.” The only thing the interviewer marks at each of the two kill sites,
is the symbol for moose, which represents one of the diamond’s points. He
does not draw a little diamond on the overlay at Yost, and he does not write
the words “Jim Thusky” or “Yost” or “1990s” on the overlay because they
are all givens. (He also does not add “Abe Thusky” to the overlay because
that information is captured on audiocassette.)
Land use and occupancy map projects are about collecting these dia-
monds. A single project will produce thousands of them, whether the in-
terviewers are aware of it or not. Data collectors who do not think in terms
of diamonds will still obtain them. The advantage of being conscious about
diamonds is that by actively seeking them out, many hundreds or thou-
sands more are obtained, without interviewing additional participants.
In addition, the descriptive information that can be linked to each feature
on the final set of composites has much more detail and historical depth. It
is these kinds of descriptive data which are the most powerful evidence
that your group has been active on your territory.
Like all other animal resources, fish harvest
sites are mapped regardless of the season
the resources are obtained. Alvin, Raymond
and Larry Iron pose with the northern pike,
whitefish and sucker they have just removed
from a gillnet on Pinehouse Lake.
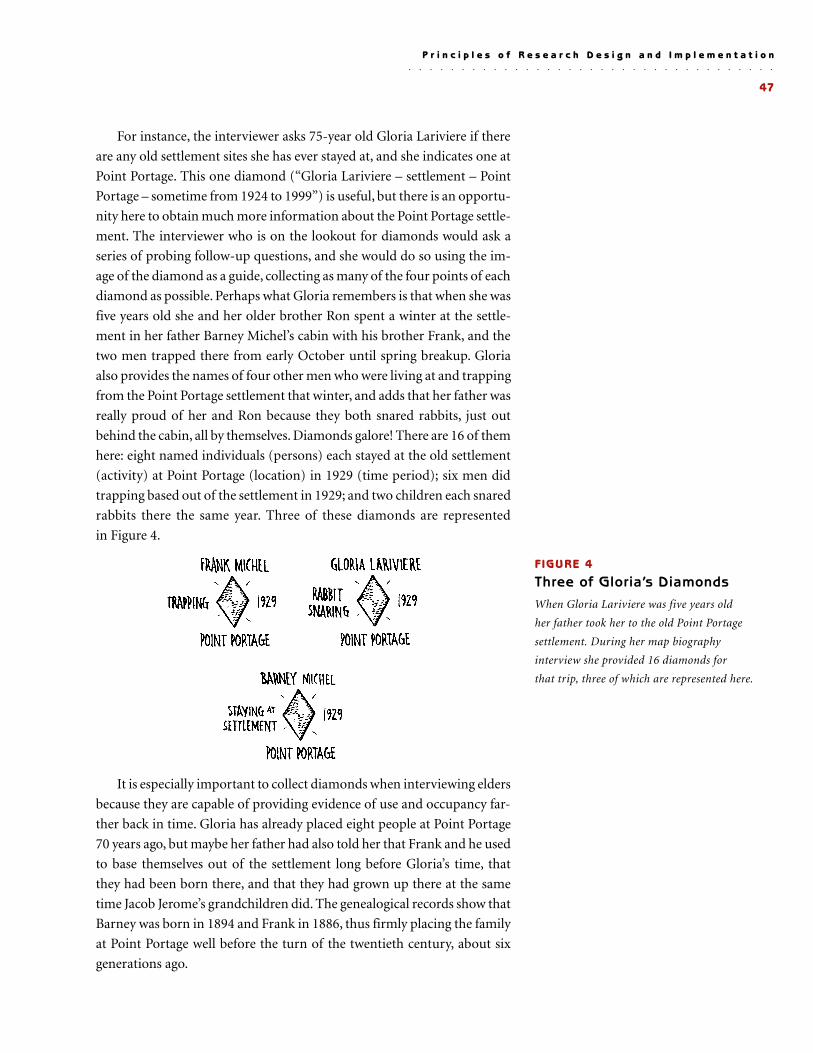
47
FIGURE 4
Three of Gloria’s DiamondsWhen Gloria Lariviere was five years old
her father took her to the old Point Portage
settlement. During her map biography
interview she provided 16 diamonds for
that trip, three of which are represented here.
For instance, the interviewer asks 75-year old Gloria Lariviere if there
are any old settlement sites she has ever stayed at, and she indicates one at
Point Portage. This one diamond (“Gloria Lariviere – settlement – Point
Portage – sometime from 1924 to 1999”) is useful, but there is an opportu-
nity here to obtain much more information about the Point Portage settle-
ment. The interviewer who is on the lookout for diamonds would ask a
series of probing follow-up questions, and she would do so using the im-
age of the diamond as a guide, collecting as many of the four points of each
diamond as possible. Perhaps what Gloria remembers is that when she was
five years old she and her older brother Ron spent a winter at the settle-
ment in her father Barney Michel’s cabin with his brother Frank, and the
two men trapped there from early October until spring breakup. Gloria
also provides the names of four other men who were living at and trapping
from the Point Portage settlement that winter, and adds that her father was
really proud of her and Ron because they both snared rabbits, just out
behind the cabin, all by themselves. Diamonds galore! There are 16 of them
here: eight named individuals (persons) each stayed at the old settlement
(activity) at Point Portage (location) in 1929 (time period); six men did
trapping based out of the settlement in 1929; and two children each snared
rabbits there the same year. Three of these diamonds are represented
in Figure 4.
It is especially important to collect diamonds when interviewing elders
because they are capable of providing evidence of use and occupancy far-
ther back in time. Gloria has already placed eight people at Point Portage
70 years ago, but maybe her father had also told her that Frank and he used
to base themselves out of the settlement long before Gloria’s time, that
they had been born there, and that they had grown up there at the same
time Jacob Jerome’s grandchildren did. The genealogical records show that
Barney was born in 1894 and Frank in 1886, thus firmly placing the family
at Point Portage well before the turn of the twentieth century, about six
generations ago.
○ ○ ○ ○ ○ ○ ○ ○ ○ ○ ○ ○ ○ ○ ○ ○ ○ ○ ○ ○ ○ ○ ○ ○ ○ ○ ○ ○ ○ ○ ○ ○ ○ ○ ○
P r i n c i p l e s o f R e s e a r c h D e s i g n a n d I m p l e m e n t a t i o n
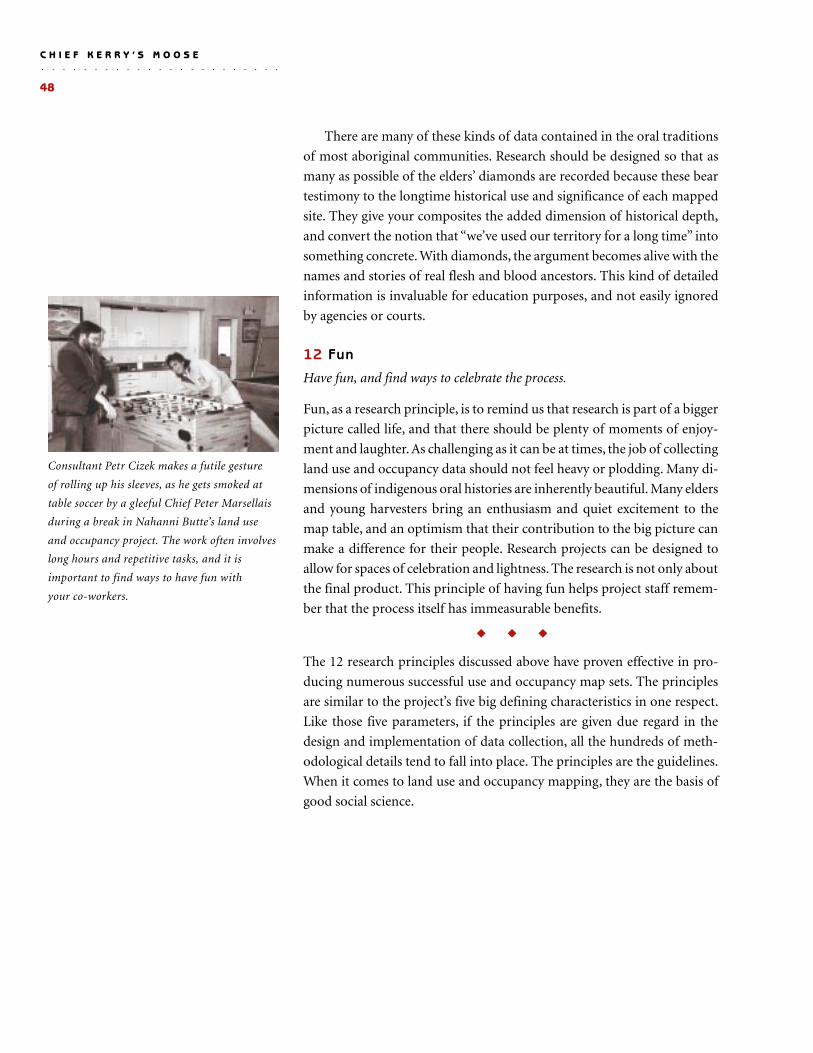
○ ○ ○ ○ ○ ○ ○ ○ ○ ○ ○ ○ ○ ○ ○ ○ ○ ○ ○ ○ ○ ○ ○
C H I E F K E R R Y ’ S M O O S E
48
There are many of these kinds of data contained in the oral traditions
of most aboriginal communities. Research should be designed so that as
many as possible of the elders’ diamonds are recorded because these bear
testimony to the longtime historical use and significance of each mapped
site. They give your composites the added dimension of historical depth,
and convert the notion that “we’ve used our territory for a long time” into
something concrete. With diamonds, the argument becomes alive with the
names and stories of real flesh and blood ancestors. This kind of detailed
information is invaluable for education purposes, and not easily ignored
by agencies or courts.
12 Fun
Have fun, and find ways to celebrate the process.
Fun, as a research principle, is to remind us that research is part of a bigger
picture called life, and that there should be plenty of moments of enjoy-
ment and laughter. As challenging as it can be at times, the job of collecting
land use and occupancy data should not feel heavy or plodding. Many di-
mensions of indigenous oral histories are inherently beautiful. Many elders
and young harvesters bring an enthusiasm and quiet excitement to the
map table, and an optimism that their contribution to the big picture can
make a difference for their people. Research projects can be designed to
allow for spaces of celebration and lightness. The research is not only about
the final product. This principle of having fun helps project staff remem-
ber that the process itself has immeasurable benefits.
◆ ◆ ◆
The 12 research principles discussed above have proven effective in pro-
ducing numerous successful use and occupancy map sets. The principles
are similar to the project’s five big defining characteristics in one respect.
Like those five parameters, if the principles are given due regard in the
design and implementation of data collection, all the hundreds of meth-
odological details tend to fall into place. The principles are the guidelines.
When it comes to land use and occupancy mapping, they are the basis of
good social science.
Consultant Petr Cizek makes a futile gesture
of rolling up his sleeves, as he gets smoked at
table soccer by a gleeful Chief Peter Marsellais
during a break in Nahanni Butte’s land use
and occupancy project. The work often involves
long hours and repetitive tasks, and it is
important to find ways to have fun with
your co-workers.
49
I n addition to the parameters and principles of research, you should
pay close attention to the indicators of data quality. These
are characteristics of data that can be evaluated and measured. They
are the things to which potential users would give consideration when
deciding whether your maps are useful. Critics would look at them closely
when trying to demonstrate that your maps are not up to scratch.
Instead of discussing these five measures of quality in this part of the
guide, I could have talked about some of them in the previous section as
research principles. Likewise, you could legitimately regard some of the
principles – like integrity, self-reported data, and data diamonds –
as indicators of quality because their presence and relative amounts can
be observed and measured. There are many connections among all these
concepts and it is difficult (and unnecesarry) to pigeonhole them.
1 Reliability
Could somebody else do your study over again, using your methodology,
and come up with the same maps?
Reliability is a cornerstone of social science because it has to do with
reproducibility. Can the research results be duplicated? If a fire destroyed
all the map biographies and all the composites, could the project be done
a second time, and produce the same results? To have good reliability
1 Reliability
2 Validity
3 Accuracy
4 Representativeness
5 Consensus
M e a s u r i n g Q u a l i t y
7
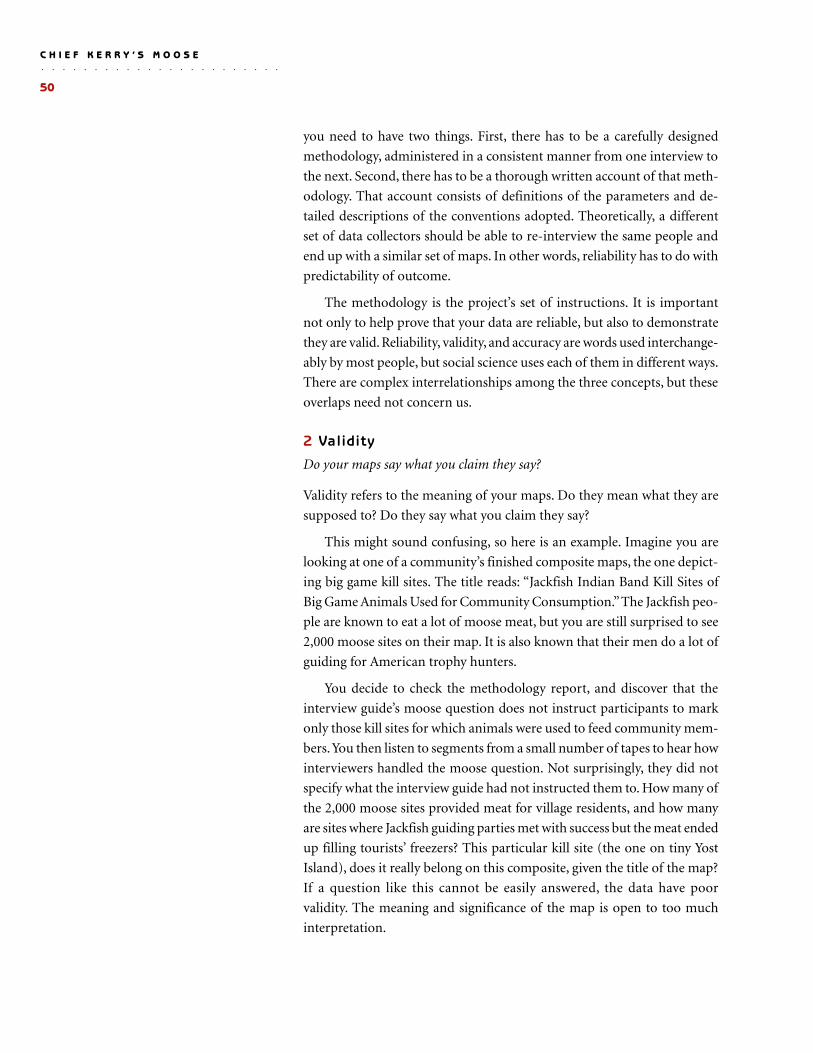
○ ○ ○ ○ ○ ○ ○ ○ ○ ○ ○ ○ ○ ○ ○ ○ ○ ○ ○ ○ ○ ○ ○
C H I E F K E R R Y ’ S M O O S E
50
you need to have two things. First, there has to be a carefully designed
methodology, administered in a consistent manner from one interview to
the next. Second, there has to be a thorough written account of that meth-
odology. That account consists of definitions of the parameters and de-
tailed descriptions of the conventions adopted. Theoretically, a different
set of data collectors should be able to re-interview the same people and
end up with a similar set of maps. In other words, reliability has to do with
predictability of outcome.
The methodology is the project’s set of instructions. It is important
not only to help prove that your data are reliable, but also to demonstrate
they are valid. Reliability, validity, and accuracy are words used interchange-
ably by most people, but social science uses each of them in different ways.
There are complex interrelationships among the three concepts, but these
overlaps need not concern us.
2 Validity
Do your maps say what you claim they say?
Validity refers to the meaning of your maps. Do they mean what they are
supposed to? Do they say what you claim they say?
This might sound confusing, so here is an example. Imagine you are
looking at one of a community’s finished composite maps, the one depict-
ing big game kill sites. The title reads: “Jackfish Indian Band Kill Sites of
Big Game Animals Used for Community Consumption.” The Jackfish peo-
ple are known to eat a lot of moose meat, but you are still surprised to see
2,000 moose sites on their map. It is also known that their men do a lot of
guiding for American trophy hunters.
You decide to check the methodology report, and discover that the
interview guide’s moose question does not instruct participants to mark
only those kill sites for which animals were used to feed community mem-
bers. You then listen to segments from a small number of tapes to hear how
interviewers handled the moose question. Not surprisingly, they did not
specify what the interview guide had not instructed them to. How many of
the 2,000 moose sites provided meat for village residents, and how many
are sites where Jackfish guiding parties met with success but the meat ended
up filling tourists’ freezers? This particular kill site (the one on tiny Yost
Island), does it really belong on this composite, given the title of the map?
If a question like this cannot be easily answered, the data have poor
validity. The meaning and significance of the map is open to too much
interpretation.
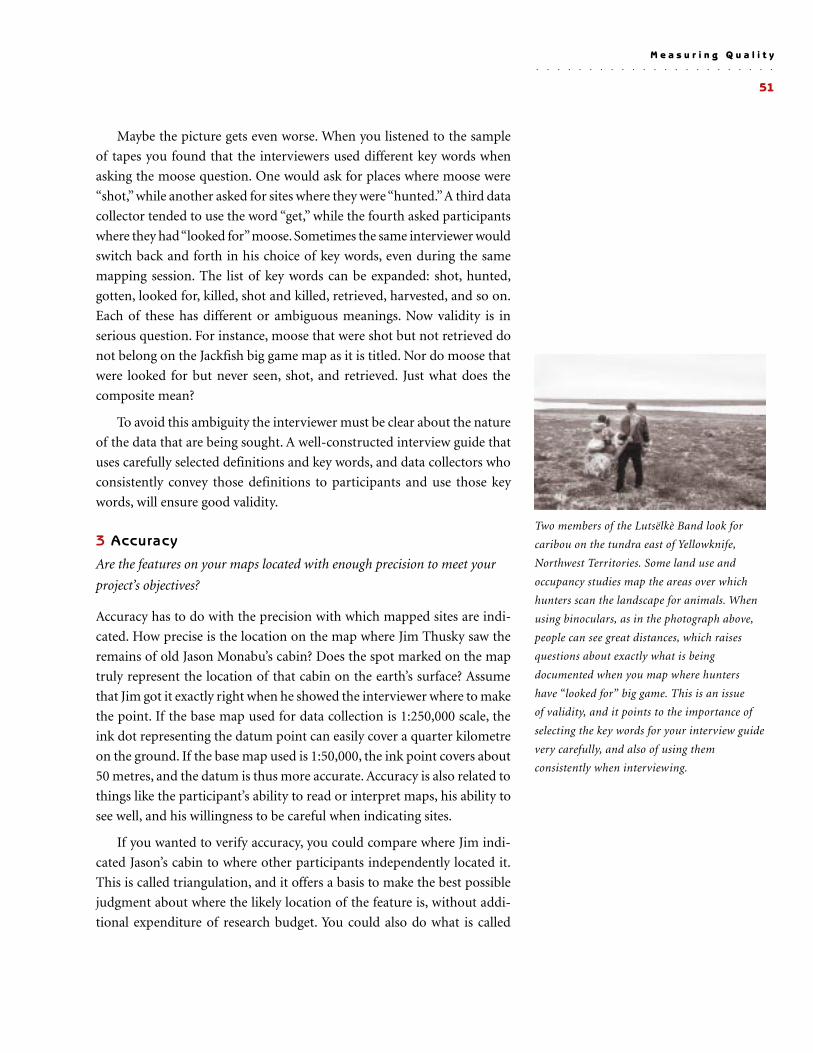
51
Maybe the picture gets even worse. When you listened to the sample
of tapes you found that the interviewers used different key words when
asking the moose question. One would ask for places where moose were
“shot,” while another asked for sites where they were “hunted.” A third data
collector tended to use the word “get,” while the fourth asked participants
where they had “looked for” moose. Sometimes the same interviewer would
switch back and forth in his choice of key words, even during the same
mapping session. The list of key words can be expanded: shot, hunted,
gotten, looked for, killed, shot and killed, retrieved, harvested, and so on.
Each of these has different or ambiguous meanings. Now validity is in
serious question. For instance, moose that were shot but not retrieved do
not belong on the Jackfish big game map as it is titled. Nor do moose that
were looked for but never seen, shot, and retrieved. Just what does the
composite mean?
To avoid this ambiguity the interviewer must be clear about the nature
of the data that are being sought. A well-constructed interview guide that
uses carefully selected definitions and key words, and data collectors who
consistently convey those definitions to participants and use those key
words, will ensure good validity.
3 Accuracy
Are the features on your maps located with enough precision to meet your
project’s objectives?
Accuracy has to do with the precision with which mapped sites are indi-
cated. How precise is the location on the map where Jim Thusky saw the
remains of old Jason Monabu’s cabin? Does the spot marked on the map
truly represent the location of that cabin on the earth’s surface? Assume
that Jim got it exactly right when he showed the interviewer where to make
the point. If the base map used for data collection is 1:250,000 scale, the
ink dot representing the datum point can easily cover a quarter kilometre
on the ground. If the base map used is 1:50,000, the ink point covers about
50 metres, and the datum is thus more accurate. Accuracy is also related to
things like the participant’s ability to read or interpret maps, his ability to
see well, and his willingness to be careful when indicating sites.
If you wanted to verify accuracy, you could compare where Jim indi-
cated Jason’s cabin to where other participants independently located it.
This is called triangulation, and it offers a basis to make the best possible
judgment about where the likely location of the feature is, without addi-
tional expenditure of research budget. You could also do what is called
○ ○ ○ ○ ○ ○ ○ ○ ○ ○ ○ ○ ○ ○ ○ ○ ○ ○ ○ ○ ○ ○ ○
M e a s u r i n g Q u a l i t y
Two members of the Lutsëlkè Band look for
caribou on the tundra east of Yellowknife,
Northwest Territories. Some land use and
occupancy studies map the areas over which
hunters scan the landscape for animals. When
using binoculars, as in the photograph above,
people can see great distances, which raises
questions about exactly what is being
documented when you map where hunters
have “looked for” big game. This is an issue
of validity, and it points to the importance of
selecting the key words for your interview guide
very carefully, and also of using them
consistently when interviewing.
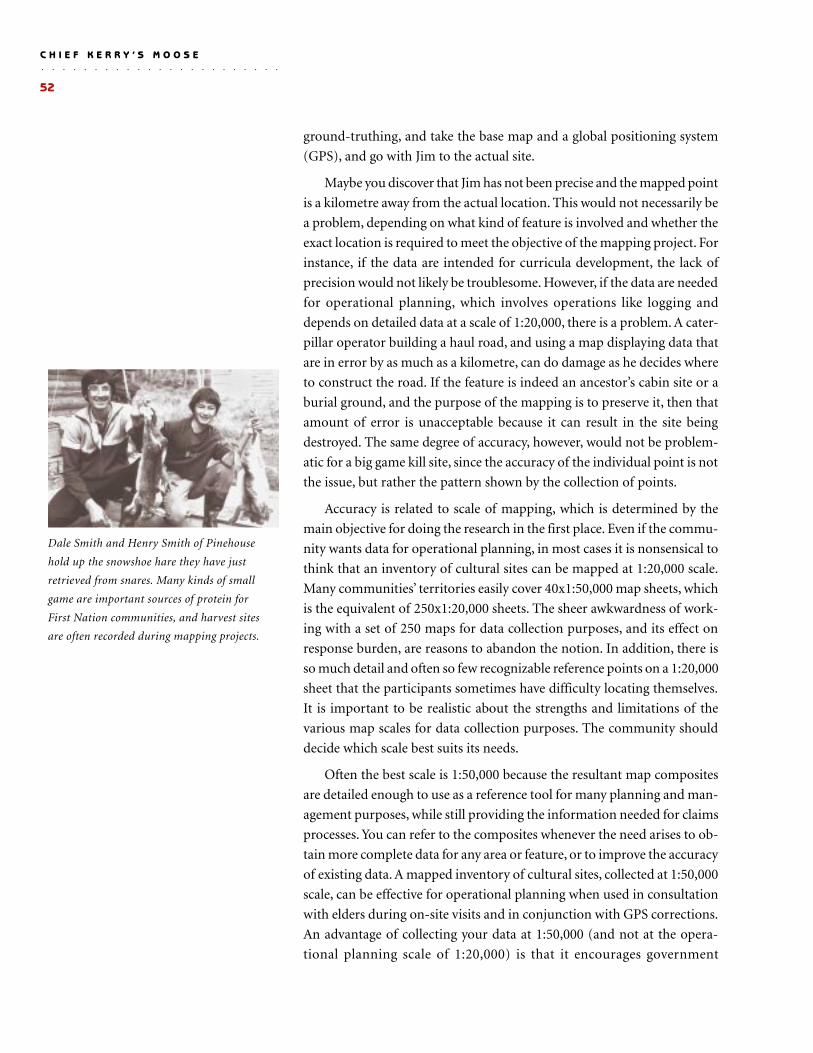
○ ○ ○ ○ ○ ○ ○ ○ ○ ○ ○ ○ ○ ○ ○ ○ ○ ○ ○ ○ ○ ○ ○
C H I E F K E R R Y ’ S M O O S E
52
ground-truthing, and take the base map and a global positioning system
(GPS), and go with Jim to the actual site.
Maybe you discover that Jim has not been precise and the mapped point
is a kilometre away from the actual location. This would not necessarily be
a problem, depending on what kind of feature is involved and whether the
exact location is required to meet the objective of the mapping project. For
instance, if the data are intended for curricula development, the lack of
precision would not likely be troublesome. However, if the data are needed
for operational planning, which involves operations like logging and
depends on detailed data at a scale of 1:20,000, there is a problem. A cater-
pillar operator building a haul road, and using a map displaying data that
are in error by as much as a kilometre, can do damage as he decides where
to construct the road. If the feature is indeed an ancestor’s cabin site or a
burial ground, and the purpose of the mapping is to preserve it, then that
amount of error is unacceptable because it can result in the site being
destroyed. The same degree of accuracy, however, would not be problem-
atic for a big game kill site, since the accuracy of the individual point is not
the issue, but rather the pattern shown by the collection of points.
Accuracy is related to scale of mapping, which is determined by the
main objective for doing the research in the first place. Even if the commu-
nity wants data for operational planning, in most cases it is nonsensical to
think that an inventory of cultural sites can be mapped at 1:20,000 scale.
Many communities’ territories easily cover 40x1:50,000 map sheets, which
is the equivalent of 250x1:20,000 sheets. The sheer awkwardness of work-
ing with a set of 250 maps for data collection purposes, and its effect on
response burden, are reasons to abandon the notion. In addition, there is
so much detail and often so few recognizable reference points on a 1:20,000
sheet that the participants sometimes have difficulty locating themselves.
It is important to be realistic about the strengths and limitations of the
various map scales for data collection purposes. The community should
decide which scale best suits its needs.
Often the best scale is 1:50,000 because the resultant map composites
are detailed enough to use as a reference tool for many planning and man-
agement purposes, while still providing the information needed for claims
processes. You can refer to the composites whenever the need arises to ob-
tain more complete data for any area or feature, or to improve the accuracy
of existing data. A mapped inventory of cultural sites, collected at 1:50,000
scale, can be effective for operational planning when used in consultation
with elders during on-site visits and in conjunction with GPS corrections.
An advantage of collecting your data at 1:50,000 (and not at the opera-
tional planning scale of 1:20,000) is that it encourages government
Dale Smith and Henry Smith of Pinehouse
hold up the snowshoe hare they have just
retrieved from snares. Many kinds of small
game are important sources of protein for
First Nation communities, and harvest sites
are often recorded during mapping projects.
53
and industry to consult with your community. Outsiders are more likely
to acknowledge that real live First Nation people are an ongoing and
necessary complement to the imperfect and always incomplete set of
reference maps.
Having a process in which the mapped data are ground-truthed a few
at a time, on an ongoing basis, is advantageous for another reason. Ground-
truthing large numbers of sites is very expensive and can cripple research
budgets if your are not careful. The community should carefully define its
priorities, and use as much as possible of the available funds to interview
key elders before deaths result in more permanent loss of traditional knowl-
edge. Sometimes immediate ground-truthing of a site is warranted because
the participant may, in extreme cases, be the only person alive who knows
about the site, and there is uncertainty as to its location. It is important for
your community, and not the funding agency, to define how much verifi-
cation of accuracy is needed, and when.
4 Representativeness
Are the mapped data that participants provided characteristic
of the community the participants belong to?
Representativeness refers to whether the data speak for the population the
maps claim to represent. To what extent are the data provided by the par-
ticipants characteristic of the population the participants belong to?
A number of things have to be looked at when answering this question.
How were individuals selected when compiling the list of people to be
interviewed? What were the criteria for defining that study population?
Are those criteria consistent with the primary objective of the project?
How many members of the study population were interviewed, and what
percentage does that number represent? Did participants provide
complete, high quality data?
If the participant selection criteria are valid in terms of the project’s
objective, then two simple statistics, the number of participants and the
coverage rate, provide a good sense of representativeness. For instance,
if 160 individuals complete map biographies, then participation is 160.
If the study population is 200 persons, then the coverage rate is 160 over
200, or 80 per cent, which suggests good representativeness. Coverage of
10 per cent would suggest it is poor.
Whether the objective of the use and occupancy study warrants
widespread participation of all adults or a sizeable subset of adults,
the idea is generally the same: 70 or 80 per cent coverage suggests good
representativeness. However, if the study is dependent on a small number
○ ○ ○ ○ ○ ○ ○ ○ ○ ○ ○ ○ ○ ○ ○ ○ ○ ○ ○ ○ ○ ○ ○
M e a s u r i n g Q u a l i t y
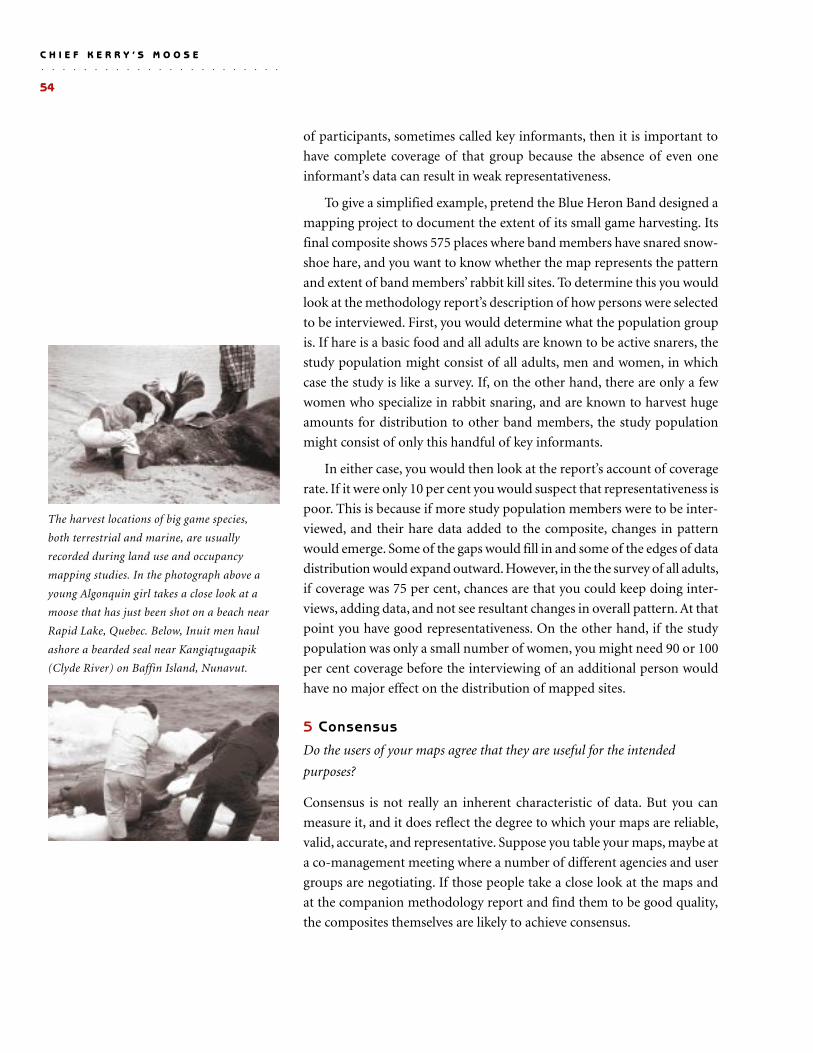
○ ○ ○ ○ ○ ○ ○ ○ ○ ○ ○ ○ ○ ○ ○ ○ ○ ○ ○ ○ ○ ○ ○
C H I E F K E R R Y ’ S M O O S E
54
of participants, sometimes called key informants, then it is important to
have complete coverage of that group because the absence of even one
informant’s data can result in weak representativeness.
To give a simplified example, pretend the Blue Heron Band designed a
mapping project to document the extent of its small game harvesting. Its
final composite shows 575 places where band members have snared snow-
shoe hare, and you want to know whether the map represents the pattern
and extent of band members’ rabbit kill sites. To determine this you would
look at the methodology report’s description of how persons were selected
to be interviewed. First, you would determine what the population group
is. If hare is a basic food and all adults are known to be active snarers, the
study population might consist of all adults, men and women, in which
case the study is like a survey. If, on the other hand, there are only a few
women who specialize in rabbit snaring, and are known to harvest huge
amounts for distribution to other band members, the study population
might consist of only this handful of key informants.
In either case, you would then look at the report’s account of coverage
rate. If it were only 10 per cent you would suspect that representativeness is
poor. This is because if more study population members were to be inter-
viewed, and their hare data added to the composite, changes in pattern
would emerge. Some of the gaps would fill in and some of the edges of data
distribution would expand outward. However, in the the survey of all adults,
if coverage was 75 per cent, chances are that you could keep doing inter-
views, adding data, and not see resultant changes in overall pattern. At that
point you have good representativeness. On the other hand, if the study
population was only a small number of women, you might need 90 or 100
per cent coverage before the interviewing of an additional person would
have no major effect on the distribution of mapped sites.
5 Consensus
Do the users of your maps agree that they are useful for the intended
purposes?
Consensus is not really an inherent characteristic of data. But you can
measure it, and it does reflect the degree to which your maps are reliable,
valid, accurate, and representative. Suppose you table your maps, maybe at
a co-management meeting where a number of different agencies and user
groups are negotiating. If those people take a close look at the maps and
at the companion methodology report and find them to be good quality,
the composites themselves are likely to achieve consensus.
The harvest locations of big game species,
both terrestrial and marine, are usually
recorded during land use and occupancy
mapping studies. In the photograph above a
young Algonquin girl takes a close look at a
moose that has just been shot on a beach near
Rapid Lake, Quebec. Below, Inuit men haul
ashore a bearded seal near Kangiqtugaapik
(Clyde River) on Baffin Island, Nunavut.
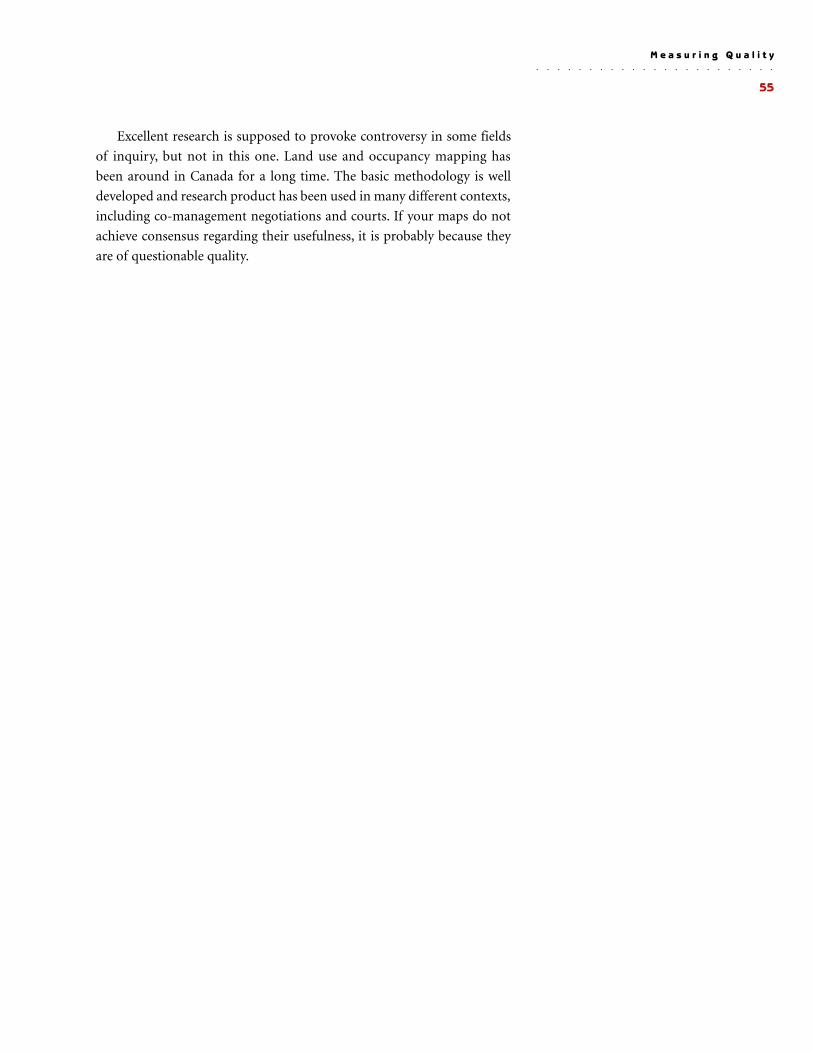
55
Excellent research is supposed to provoke controversy in some fields
of inquiry, but not in this one. Land use and occupancy mapping has
been around in Canada for a long time. The basic methodology is well
developed and research product has been used in many different contexts,
including co-management negotiations and courts. If your maps do not
achieve consensus regarding their usefulness, it is probably because they
are of questionable quality.
○ ○ ○ ○ ○ ○ ○ ○ ○ ○ ○ ○ ○ ○ ○ ○ ○ ○ ○ ○ ○ ○ ○
M e a s u r i n g Q u a l i t y
○ ○ ○ ○ ○ ○ ○ ○ ○ ○ ○ ○ ○ ○ ○ ○ ○ ○ ○ ○ ○ ○ ○
C H I E F K E R R Y ’ S M O O S E
56
The most obvious result of giving insufficient thought to the meas-
ures of quality, principles, and parameters described in this
book is that the research product is likely to fall short of the
project’s immediate objectives. There is a bigger picture to con-
sider though. A community’s experience, positive or negative, of its own
land use and occupancy initiatives contributes to its culture of research.
This is the group’s collective understanding of research and its benefits,
and people’s willingness to contribute to an ongoing research program.
How receptive are community members to the announcement of yet
another study or survey? Does it make people grumpy and elicit comments
like “We’ve been studied to death,” or “It’ll never change anything,” or
“They’ve already asked me those kinds of questions before?” Do people
respond with a sense of optimism and enthusiasm? Is there resistance to
the idea, or openness?
It is critical to ask these kinds of questions while designing any par-
ticular piece of research because the answers are suggestive of the response
burden likely to be encountered, and the participation that can be expected.
It is also important that your government does what it can to encourage a
culture of research that is favourable to future initiatives. The long-term
research needs must be kept in mind, with the goal being that community
members, when called upon, will be willing to support their government’s
call for information and knowledge.
C r e a t i n g a C u l t u r e o f R e s e a r c h
8
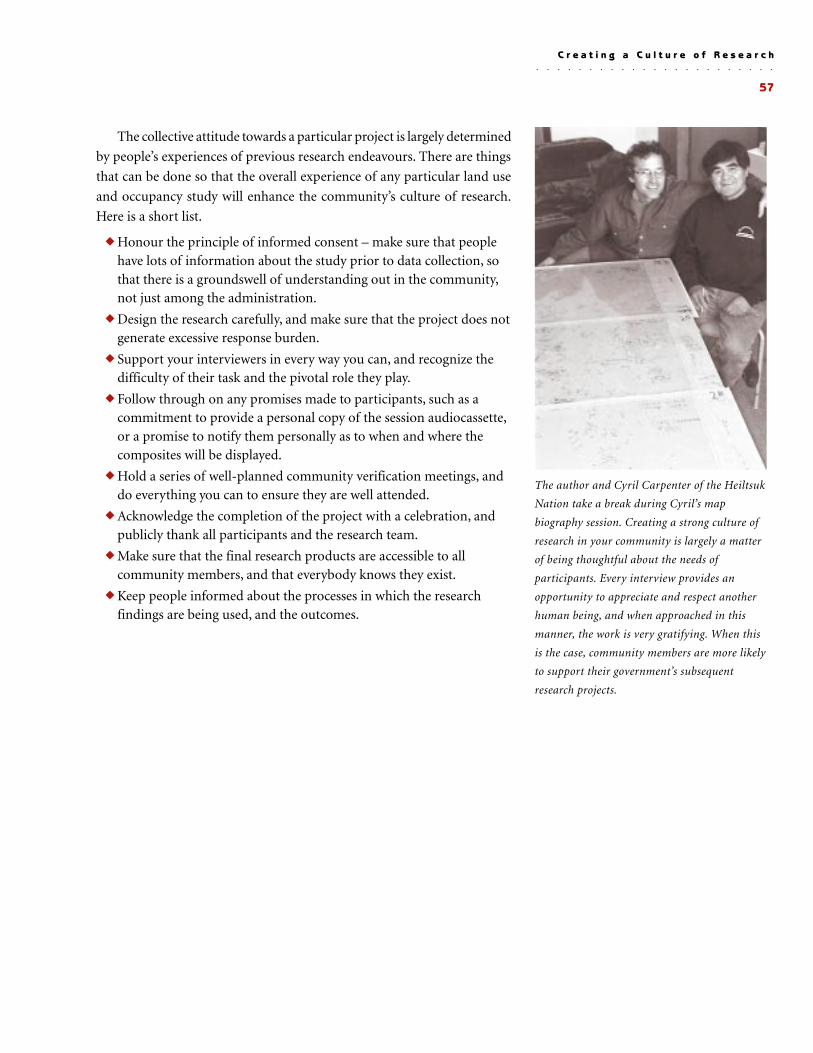
57
The collective attitude towards a particular project is largely determined
by people’s experiences of previous research endeavours. There are things
that can be done so that the overall experience of any particular land use
and occupancy study will enhance the community’s culture of research.
Here is a short list.
◆ Honour the principle of informed consent – make sure that peoplehave lots of information about the study prior to data collection, sothat there is a groundswell of understanding out in the community,not just among the administration.
◆ Design the research carefully, and make sure that the project does notgenerate excessive response burden.
◆ Support your interviewers in every way you can, and recognize thedifficulty of their task and the pivotal role they play.
◆ Follow through on any promises made to participants, such as acommitment to provide a personal copy of the session audiocassette,or a promise to notify them personally as to when and where thecomposites will be displayed.
◆ Hold a series of well-planned community verification meetings, anddo everything you can to ensure they are well attended.
◆ Acknowledge the completion of the project with a celebration, andpublicly thank all participants and the research team.
◆ Make sure that the final research products are accessible to allcommunity members, and that everybody knows they exist.
◆ Keep people informed about the processes in which the researchfindings are being used, and the outcomes.
○ ○ ○ ○ ○ ○ ○ ○ ○ ○ ○ ○ ○ ○ ○ ○ ○ ○ ○ ○ ○ ○ ○
C r e a t i n g a C u l t u r e o f R e s e a r c h
The author and Cyril Carpenter of the Heiltsuk
Nation take a break during Cyril’s map
biography session. Creating a strong culture of
research in your community is largely a matter
of being thoughtful about the needs of
participants. Every interview provides an
opportunity to appreciate and respect another
human being, and when approached in this
manner, the work is very gratifying. When this
is the case, community members are more likely
to support their government’s subsequent
research projects.
○ ○ ○ ○ ○ ○ ○ ○ ○ ○ ○ ○ ○ ○ ○ ○ ○ ○ ○ ○ ○ ○ ○
C H I E F K E R R Y ’ S M O O S E
58
T he following are some recommendations that emerge from the
discussion in this book.
1 If you are going to undertake land use and occupancy mapping, do it
well. An inferior set of maps is unlikely to serve your community’s
interests. Be clear whether the priority is to use the data collection as
an opportunity to produce maps that can help win long-term ben-
efits, or to create short-term employment.
2 Develop a long-term strategic research plan and know where your
land use and occupancy mapping fits into it. Make sure each re-
search project builds on the strengths of previous ones, and pay
attention to database compatibility. Any research component de-
signed and undertaken in isolation from the others is likely to fall far
short of its potential for concrete gains.
3 If you are going to use the data to identify territorial boundaries
for purposes of land claims, consider whether it is in your best
interest that the negotiations focus on maps based on occupancy
data, in contrast to use data.
4 As part of your strategy, do your best to negotiate interim measures
that give some protection to the kinds of features that your mapping
project will cover, and to other categories of cultural features for
which the project will not attempt to collect mapped data. Avoid the
museum approach to mapping.
S u m m a r y
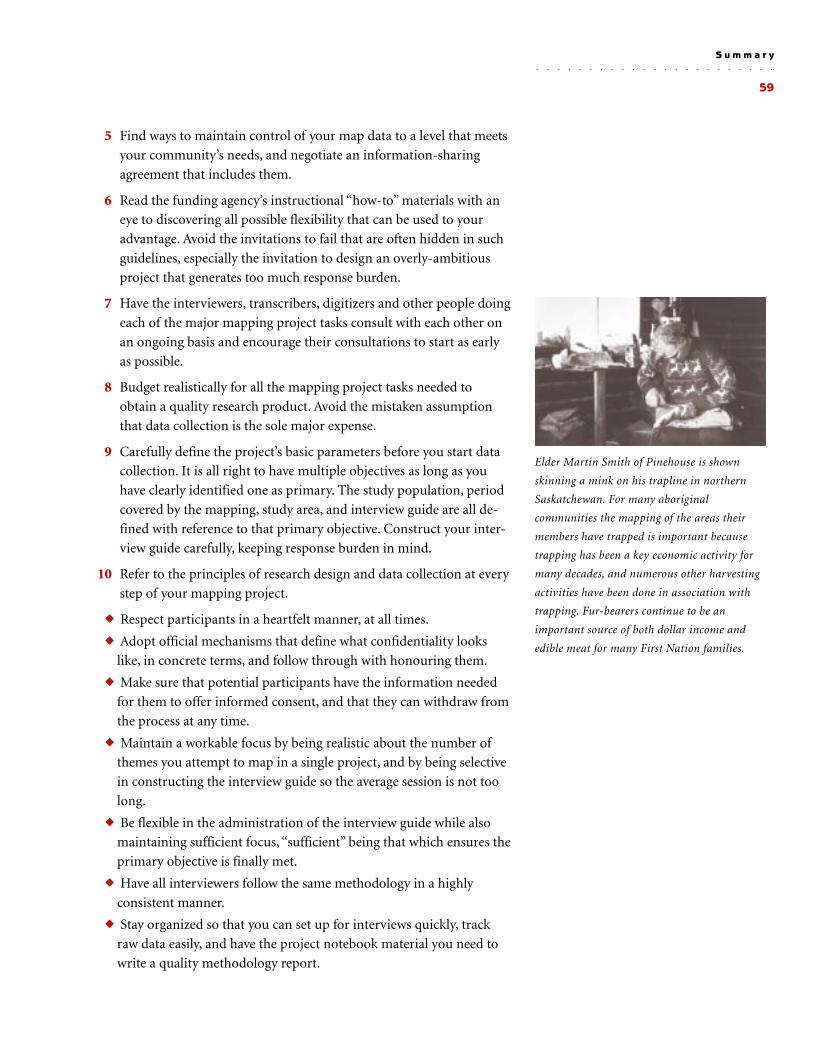
59
5 Find ways to maintain control of your map data to a level that meets
your community’s needs, and negotiate an information-sharing
agreement that includes them.
6 Read the funding agency’s instructional “how-to” materials with an
eye to discovering all possible flexibility that can be used to your
advantage. Avoid the invitations to fail that are often hidden in such
guidelines, especially the invitation to design an overly-ambitious
project that generates too much response burden.
7 Have the interviewers, transcribers, digitizers and other people doing
each of the major mapping project tasks consult with each other on
an ongoing basis and encourage their consultations to start as early
as possible.
8 Budget realistically for all the mapping project tasks needed to
obtain a quality research product. Avoid the mistaken assumption
that data collection is the sole major expense.
9 Carefully define the project’s basic parameters before you start data
collection. It is all right to have multiple objectives as long as you
have clearly identified one as primary. The study population, period
covered by the mapping, study area, and interview guide are all de-
fined with reference to that primary objective. Construct your inter-
view guide carefully, keeping response burden in mind.
10 Refer to the principles of research design and data collection at every
step of your mapping project.
◆ Respect participants in a heartfelt manner, at all times.
◆ Adopt official mechanisms that define what confidentiality looks
like, in concrete terms, and follow through with honouring them.
◆ Make sure that potential participants have the information needed
for them to offer informed consent, and that they can withdraw from
the process at any time.
◆ Maintain a workable focus by being realistic about the number of
themes you attempt to map in a single project, and by being selective
in constructing the interview guide so the average session is not too
long.
◆ Be flexible in the administration of the interview guide while also
maintaining sufficient focus, “sufficient” being that which ensures the
primary objective is finally met.
◆ Have all interviewers follow the same methodology in a highly
consistent manner.
◆ Stay organized so that you can set up for interviews quickly, track
raw data easily, and have the project notebook material you need to
write a quality methodology report.
○ ○ ○ ○ ○ ○ ○ ○ ○ ○ ○ ○ ○ ○ ○ ○ ○ ○ ○ ○ ○ ○ ○
S u m m a r y
Elder Martin Smith of Pinehouse is shown
skinning a mink on his trapline in northern
Saskatchewan. For many aboriginal
communities the mapping of the areas their
members have trapped is important because
trapping has been a key economic activity for
many decades, and numerous other harvesting
activities have been done in association with
trapping. Fur-bearers continue to be an
important source of both dollar income and
edible meat for many First Nation families.
○ ○ ○ ○ ○ ○ ○ ○ ○ ○ ○ ○ ○ ○ ○ ○ ○ ○ ○ ○ ○ ○ ○
C H I E F K E R R Y ’ S M O O S E
60
◆ If you are going to err in the recording of data, err on the side
of caution.
◆ Design your current use and occupancy research to obtain as much
self-reported data as possible, and in a way that lets you sort out
which data were reported secondhand.
◆ Tape record the interviews and design other aspects of data
collection and record-keeping in a way to ensure good integrity of
data, which allows you to track the source of any particular datum.
◆ Train your interviewers to think in terms of data diamonds, which
will give your maps historical depth, and provide concrete evidence
of longtime use and occupancy.
◆ Have fun, and find ways to celebrate the process.
11 Keep the measures of data quality in mind at every step of your project.
◆ Ensure good reliability by carefully designing the methodology,
administering it in a consistent manner, and providing a thorough
written account.
◆ Ensure good validity by having interviewers be clear about the
nature of the data that are being sought, by having a well-constructed
interview guide that uses carefully selected definitions and key words,
and by having data collectors who convey those definitions to
participants and consistently use those key words.
◆ Define what level of accuracy and which data collection scale best
suit your needs, and also how much verification of accuracy is
needed, and when. Be realistic about the strengths and limitations
of the various map scales for data collection purposes.
◆ Ensure good representativeness by making the criteria that
determine who is a member of the study population consistent with
the primary objective of the mapping project, and by achieving a
high coverage rate.
◆ Help achieve your objectives by having composites that are of
demonstrably high quality. Make them a positive factor in
reconciliation processes, by generating understanding and consensus.
Composites that are reliable, valid, accurate, and representative are
not likely to be controversial.
12 Do whatever is necessary to inform your people about the project,
address concerns about issues like confidentiality, and develop
a consensus that the project is in the best interests of all families.
Have this consensus in place before data collection starts.
13 Find a research director who has a track record of having worked
with aboriginal communities on cultural research projects, having
earned their trust, and having produced useful product.
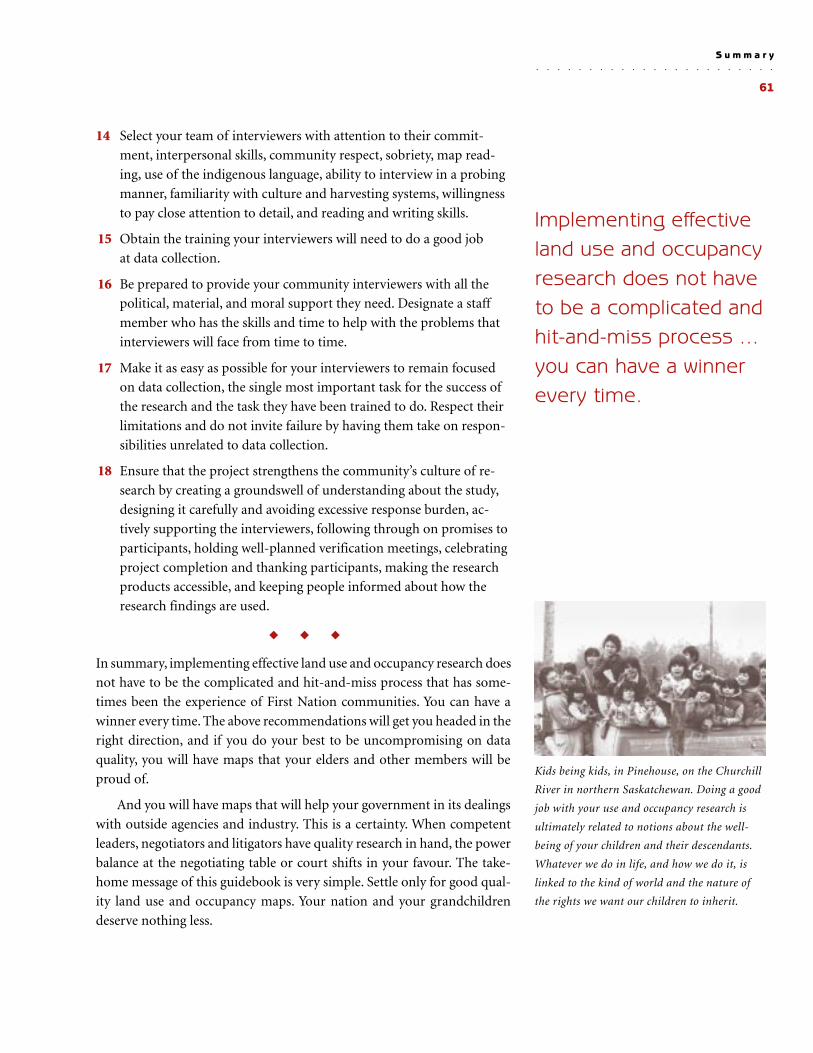
61
14 Select your team of interviewers with attention to their commit-
ment, interpersonal skills, community respect, sobriety, map read-
ing, use of the indigenous language, ability to interview in a probing
manner, familiarity with culture and harvesting systems, willingness
to pay close attention to detail, and reading and writing skills.
15 Obtain the training your interviewers will need to do a good job
at data collection.
16 Be prepared to provide your community interviewers with all the
political, material, and moral support they need. Designate a staff
member who has the skills and time to help with the problems that
interviewers will face from time to time.
17 Make it as easy as possible for your interviewers to remain focused
on data collection, the single most important task for the success of
the research and the task they have been trained to do. Respect their
limitations and do not invite failure by having them take on respon-
sibilities unrelated to data collection.
18 Ensure that the project strengthens the community’s culture of re-
search by creating a groundswell of understanding about the study,
designing it carefully and avoiding excessive response burden, ac-
tively supporting the interviewers, following through on promises to
participants, holding well-planned verification meetings, celebrating
project completion and thanking participants, making the research
products accessible, and keeping people informed about how the
research findings are used.
◆ ◆ ◆
In summary, implementing effective land use and occupancy research does
not have to be the complicated and hit-and-miss process that has some-
times been the experience of First Nation communities. You can have a
winner every time. The above recommendations will get you headed in the
right direction, and if you do your best to be uncompromising on data
quality, you will have maps that your elders and other members will be
proud of.
And you will have maps that will help your government in its dealings
with outside agencies and industry. This is a certainty. When competent
leaders, negotiators and litigators have quality research in hand, the power
balance at the negotiating table or court shifts in your favour. The take-
home message of this guidebook is very simple. Settle only for good qual-
ity land use and occupancy maps. Your nation and your grandchildren
deserve nothing less.
Implementing effectiveland use and occupancyresearch does not haveto be a complicated andhit-and-miss process ...you can have a winnerevery time.
○ ○ ○ ○ ○ ○ ○ ○ ○ ○ ○ ○ ○ ○ ○ ○ ○ ○ ○ ○ ○ ○ ○
S u m m a r y
Kids being kids, in Pinehouse, on the Churchill
River in northern Saskatchewan. Doing a good
job with your use and occupancy research is
ultimately related to notions about the well-
being of your children and their descendants.
Whatever we do in life, and how we do it, is
linked to the kind of world and the nature of
the rights we want our children to inherit.
○ ○ ○ ○ ○ ○ ○ ○ ○ ○ ○ ○ ○ ○ ○ ○ ○ ○ ○ ○ ○ ○ ○
C H I E F K E R R Y ’ S M O O S E
62
Accuracy: A measure of the quality of raw data or re-search product. An accuracy measure indicates howprecisely the location of a mapped feature is known.
Archival research: Research involving the types of recordsheld at archives. An archive is a place where unique,original and unpublished materials (diaries, journals,photographs, maps, files, film and sound footage) arekept.
Baseline information or baseline inventory: A set of useand occupancy data used for comparison with othersets of data, and against which change over time canbe measured.
Co-management: A negotiated arrangement wheregovernment or industry agree to jointly manage theresources of the territory with the First Nation.
Community consensus or consensus: A broad agreementamong community members.
Composite map or composite: A map that combines anddisplays all data for a particular group of interviewguide categories, from the map biographies of a spe-cific group of participants. For example, the big gamekill sites for all community members, or the plant
gathering sites for women over 40 years of age.
Comprehensive research: A research strategy that linksa number of key research projects together to pro-duce data which prove that mapped land use andoccupancy information represents living cultural sys-tems, and that the museum approach to First Nations’cultural research is not valid.
Consistency: The doing of a given task the same way eachtime it is done.
Convention: An agreed-on way of doing each of the hun-dreds of little tasks that, together with the parameters,make up the research methodology.
Coverage rate: A statistic determined by dividing thenumber of participants (participation) by the numberof people in the study population.
Culture of research: The community’s collective experi-ence and understanding of the benefits and risks ofuse and occupancy research, which largely determinescommunity members’ willingness to contribute to thekind of long-term research program necessary forself-government.
Current use and occupancy research: A kind of map-ping study that documents each participant’s use andoccupancy of the territory any time within the partici-pant’s life, or within living memory. These kinds ofstudies record the direct life experiences of currentgenerations, and generally go no farther back than80 years.
Data: See datum.
Database: A collection of data organized according toa structure that describes the characteristics of thedata and the relationships among them. A GIS data-base for instance, includes data about the location andcharacterisitcs of features.
Dataset: A collection of data that is organized arounda common theme, like land use and occupancy forinstance.
Datum: A single fact collected during an interview. Theplural of datum is data.
Diamond or data diamond: The mental image to remindinterviewers of the importance of obtaining four kindsof information (person, activity, location, time period)for each feature mapped during a map biographyinterview.
Digital or digital data: Data that are directly readable bya computer.
Digitizing: The process of converting data marked on amap biography into a digital form using a computerand GIS software. A map is digitized by taping it to aspecial electronic table, pointing at each featuremarked on it with an attached “puck” (a device with aset of crosshairs), and pressing a button.
Feature: A point or line or polygon on a map that repre-sents something in the real world like a mooseharvest site or travel route or burial ground.
G l o s s a r y
63
Geographical information systems (GIS): Computersoftware that deals with mapped information. GISallow the map data to be captured, stored, checked,combined, manipulated, analyzed, displayed onscreen, and printed out.
Global Positioning System (GPS): A satellite based navi-gational system that allows points on the earth’ssurface to be located with a high degree of accuracy.
Ground-truthing: Verification of the location and accu-racy of sites mapped during interviews by going to thesites with the aid of maps and interview participants,and ideally also with a global positioning system.
Harvest survey: A key component of comprehensiveresearch that provides quantitative measures of theamount of food that a community obtains from itsterritory over a defined period of time.
Historical use and occupancy research: A kind of studythat uses a combination of oral history and writtensources to document a community’s use and occupancyof the territory. These kinds of studies record infor-mation that goes much farther back than the directlife experiences of current generations, usuallyhundreds of years.
Informed consent: The principle of research design anddata collection that acknowledges that people have theright to know about the nature of the project, whythe data are needed, and what the anticipated usesof them are, and that people have the right to agreeto participate and to subsequently withdraw theirparticipation.
Integrity of data or data integrity: The principle of re-search design and data collection that allows you totrace any datum found in the research product backto its original source among the raw data.
Interim measure: A negotiated temporary mechanismthat gives all use and occupancy resources, bothmapped and unmapped, some level of protection untilsuch time as a management plan giving due consid-eration to the nation’s entire system of culturalresources is in place.
Interview: A face to face social interaction that resultsin a transfer of data from a survey participant to theinterviewer.
Interview guide: The list of questions that an intervieweruses to guide her or his questioning of the participantduring an interview.
Key informant: A participant who verbally provides in-formation to an interviewer during a research projectwhich has a study population made up of a smallnumber of only the most knowledgeable individuals.
Lines: Geographic features that have length but no area(e.g. political boundaries), or polygon features that aretoo narrow for their boundaries to be seen on a mapof a given scale. See points, polygons.
Map biography: The map or set of maps resulting froma face to face interview during which the individualparticipant indicates the places he or she has used re-sources within living memory, and in some cases, placesthat have never been used or visited personally, butabout which the participant has knowledge.
Methodology: The detailed account of how the useand occupancy data were collected, which includes adefinition of each of the research parameters and adetailed description of the hundreds of researchconventions.
Museum approach: Industry and government’s typicalinterpretation of mapped First Nation cultural fea-tures, which is that they represent isolated remnantsof a dead or dying tradition, instead of representingparts of living cultural systems.
Occupancy: Refers to the area which, as Dr. Peter Usherputs it, a “particular group regards as its own by vir-tue of continuing use, habitation, naming, knowledge,and control.” The mapping of occupancy records sto-ries and legends about places, ecological knowledgeof places, indigenous place names, and habitation siteslike cabins and burial grounds.
Operational planning: Land use planning that involvesthe use of large-scale maps, usually 1:20,000 scalewhich shows a lot of detail, to guide on-the-groundoperations like logging and the construction of roads.
Parameters: The five basic big defining characteristics ofthe research design which have to do with why the re-search is undertaken, who is to be interviewed (studypopulation), what time period data are to be collectedfor (within living memory), what geographic area dataare to be collected for (study area), and what ques-tions the participants are to be asked (interview guide).
Participation: The number of individuals from the studypopulation that complete map biography interviews.
Points: Geographic features that have no area or length(e.g. mountain peaks), or features that are too smallfor their boundaries to be seen on a map of a givenscale. See lines, polygons.
○ ○ ○ ○ ○ ○ ○ ○ ○ ○ ○ ○ ○ ○ ○ ○ ○ ○ ○ ○ ○ ○ ○
G l o s s a r y
○ ○ ○ ○ ○ ○ ○ ○ ○ ○ ○ ○ ○ ○ ○ ○ ○ ○ ○ ○ ○ ○ ○
C H I E F K E R R Y ’ S M O O S E
64
Polygons: Geographic features that cover a land or waterarea and are large enough to be seen on a map of agiven scale. Polygons are defined by a line or lines thatsurround an area. See points, lines.
Population: See Study population.
Principle or research principle: A guideline that helpskeep your research design and data collection on trackand ensures that you end up with good qualityresearch product.
Raw data: The many thousands of individual facts thatare obtained during interviews, and that are recordedon study participants’ map biography overlays or maps,and in their interview audio or videocassettes.
Reliability: The quality measure of the raw data or re-search product that addresses the question as towhether the same results could be reproduced if some-body else took the same methodology and repeated themapping interviews following that methodology.
Representativeness: The quality measure of researchproduct that addresses the question as to whether themap data truly represent the study population that themaps claim to represent, or in other words, whetherthe data provided by the participants are characteris-tic of the population to which the participants belong.
Research design: The strategic plan for a research projectthat sets out the outline and key features of data col-lection methodology and analysis, including a detailedconsideration of the research parameters.
Research product: The concrete end result (such as com-posite maps, reports, and databases) of the research inwhich the raw data are organized, summarized andpresented in a way that is useful.
Response burden: The study participant’s experience ofthe interview as burdensome.
Scale: To show a portion of the earth’s surface on a map,the area must be reduced. Map scale indicates the ex-tent of this reduction. It is expressed as a ratio of dis-tance on the map to distance on the ground. Forinstance, on a map with a scale of 1:50,000, one handlength on the map represents 50,000 hand lengths onthe ground.
Social science: The study of society and social relation-ships.
Study area: The geographic area for which use and occu-pancy data are to be collected.
Study population: The individuals who are eligible tobe interviewed.
Themes: The broad categories that are mapped duringuse and occupancy research, e.g. harvesting sites,critical animal habitat, site-specific features of specialcultural significance, travel routes, and place names.
Transcription: The activity performed by people calledtranscribers which converts the content of the inter-view audio or videocassette into a transcript, whichis a written or typed record of the raw data capturedon tape.
Translation: The activity performed by people calledtranslators which converts the content of interviewsconducted in the indigenous language into Frenchor English.
Triangulation: The process of obtaining a sense of theaccuracy of a mapped feature by comparing where dif-ferent participants indicated it on their individual mapbiographies.
Use: Refers to activities involving the harvest of tradi-tional resources, things like hunting, trapping, fish-ing, gathering of medicinal plants and berry picking,and travelling to engage in these kinds of activities.The mapping of use records the locations where theseactivities occur.
Validity: The quality measure of the raw data or researchproduct that addresses the question as to whether thedata and information mean or signify what you claimthey mean or signify.
Verbatim transcript: The typed record of an interviewtape’s raw data which captures, in exactly the samewords, everything the participant and interviewer areheard to say.
Within living memory: The generally accepted timeframe for most use and occupancy studies, whichcovers any time within the participant’s life.
Word processor: Computer software that allows thecreation, editing, formatting, and printing of textdocuments.
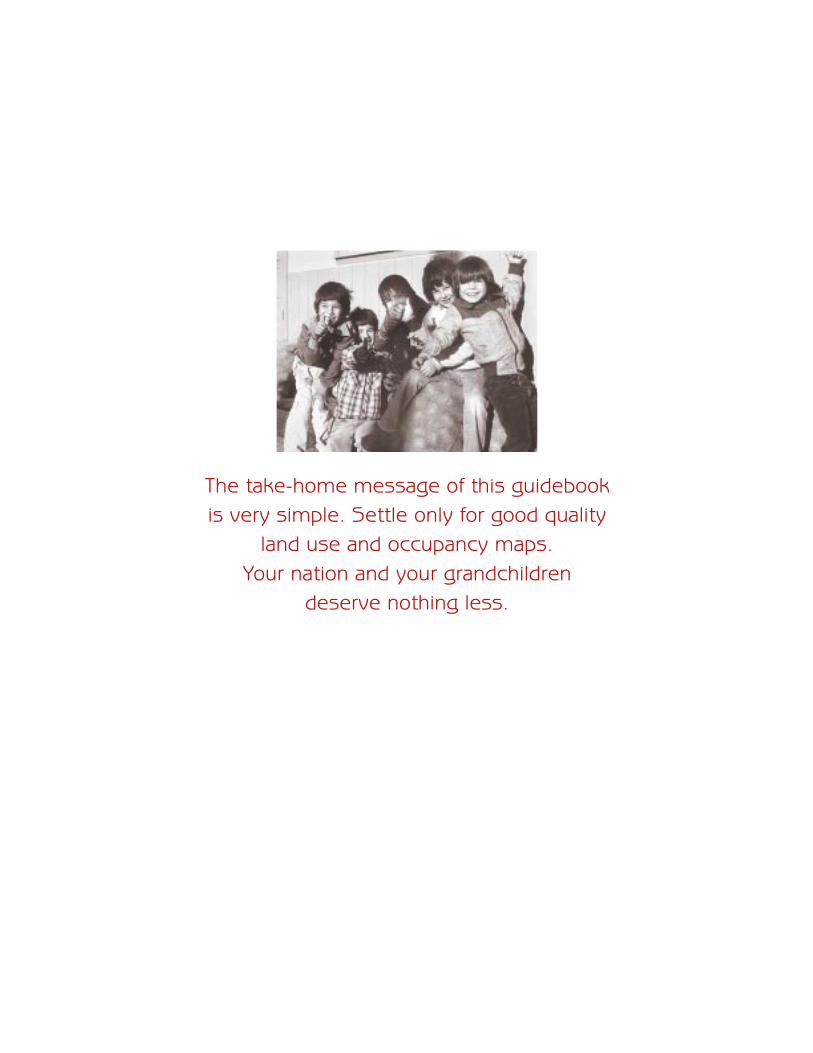
65
The take-home message of this guidebookis very simple. Settle only for good quality
land use and occupancy maps.Your nation and your grandchildren
deserve nothing less.
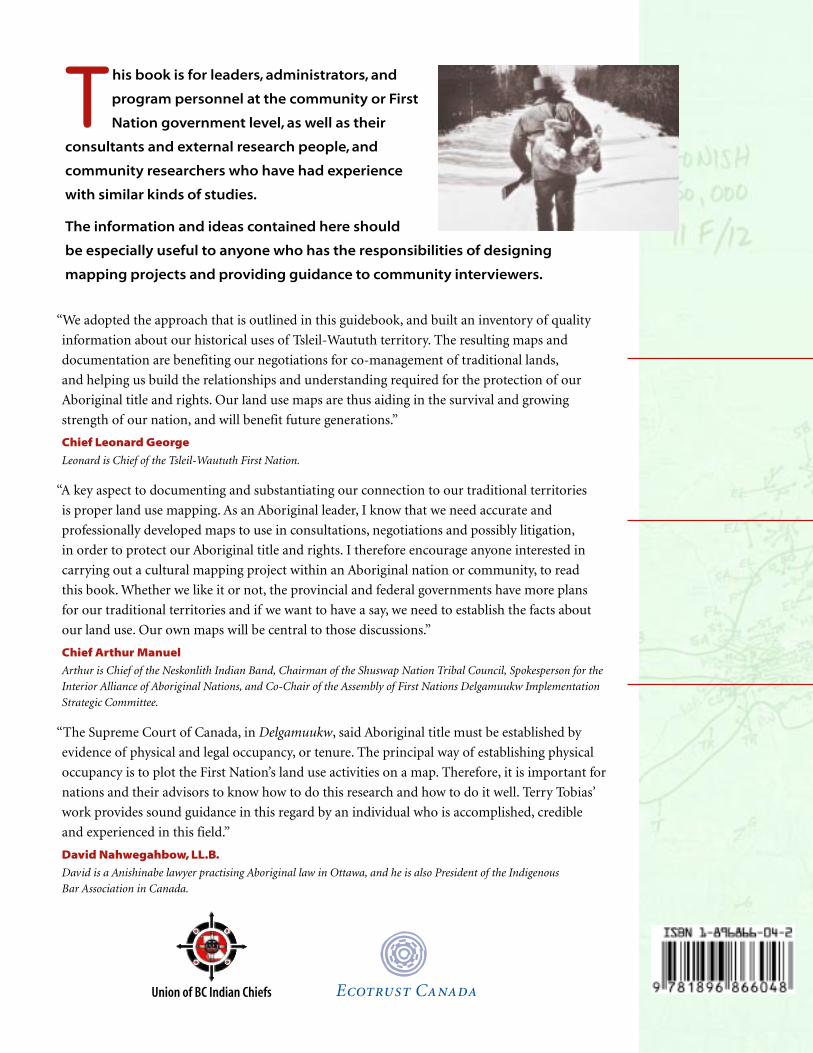
T his book is for leaders, administrators, and
program personnel at the community or First
Nation government level, as well as their
consultants and external research people, and
community researchers who have had experience
with similar kinds of studies.
The information and ideas contained here should
be especially useful to anyone who has the responsibilities of designing
mapping projects and providing guidance to community interviewers.
“We adopted the approach that is outlined in this guidebook, and built an inventory of quality
information about our historical uses of Tsleil-Waututh territory. The resulting maps and
documentation are benefiting our negotiations for co-management of traditional lands,
and helping us build the relationships and understanding required for the protection of our
Aboriginal title and rights. Our land use maps are thus aiding in the survival and growing
strength of our nation, and will benefit future generations.”
Chief Leonard George
Leonard is Chief of the Tsleil-Waututh First Nation.
“A key aspect to documenting and substantiating our connection to our traditional territories
is proper land use mapping. As an Aboriginal leader, I know that we need accurate and
professionally developed maps to use in consultations, negotiations and possibly litigation,
in order to protect our Aboriginal title and rights. I therefore encourage anyone interested in
carrying out a cultural mapping project within an Aboriginal nation or community, to read
this book. Whether we like it or not, the provincial and federal governments have more plans
for our traditional territories and if we want to have a say, we need to establish the facts about
our land use. Our own maps will be central to those discussions.”
Chief Arthur Manuel
Arthur is Chief of the Neskonlith Indian Band, Chairman of the Shuswap Nation Tribal Council, Spokesperson for the
Interior Alliance of Aboriginal Nations, and Co-Chair of the Assembly of First Nations Delgamuukw Implementation
Strategic Committee.
“The Supreme Court of Canada, in Delgamuukw, said Aboriginal title must be established by
evidence of physical and legal occupancy, or tenure. The principal way of establishing physical
occupancy is to plot the First Nation’s land use activities on a map. Therefore, it is important for
nations and their advisors to know how to do this research and how to do it well. Terry Tobias’
work provides sound guidance in this regard by an individual who is accomplished, credible
and experienced in this field.”
David Nahwegahbow, LL.B.
David is a Anishinabe lawyer practising Aboriginal law in Ottawa, and he is also President of the Indigenous
Bar Association in Canada.
Union of BC Indian Chiefs