Embed Size (px)
Citation preview

Chicago New YorkSan Francisco Minneapolis
Emerging Trends in Post Secondary Education –
The View to 2012
Michael T. Moe, CFAThe St. Regis, Washington, D.C.
December 9, 2002

ThinkEquity Partners 2
Healthcare in 1970:
– Huge Market - 8% of GDP
– Highly Fragmented - Cottage Industry
– High Cost
– Low Technology
– Lack of Professional Management
– Negligible Market Capitalization
– Essential Human Service
– Less than 2% of U.S. Capital Markets
Healthcare in 2002:
– Huge Market - 14% of GDP
– Segmented by Category
– Consolidating
– Historically Low Costs
– Implementing Strong Management Controls and Accountability
– $2.3 Trillion, or 23%, of U.S. Capital Markets
The Healthcare and Education Analogy

ThinkEquity Partners 3
Huge Market - 9.5% of GDP
Highly Fragmented - Cottage Industry
Essential Human Service
Very Inefficient
Low Technology
Lack of Professional Management
Total Market Capitalization: $27 Billion
– Small fraction (<0.3%) of the $10 Trillion U.S. Capital Markets
The Education Industry in 2002

ThinkEquity Partners 4
Major Sectors in the U.S. Domestic Economy
(a) Health Care Financing Review, vol. 17, no.3.(b) Defined as pre-kindergarten, post-secondary, consumer products, training/vocational and specialty service markets.
$ Billions
Health(a) $949
Education(b) $740
Social Security $336
Defense $272
Total GDP $7,790
% of GDP
14.1%
9.5%
5.0%
4.0%
100%
Education = $2 trillion global market!

ThinkEquity Partners 5
Size of Global Education & Training Market
Global education & training market: $2 trillion
– U.S. market: $750 billion
U.S. higher education market: $250 billion
– Students: 42 million (1990); 97 million (2010); 150 million (2025)
U.S. online higher education market (2001): $4.5 billion
– U.S. online higher education market (2005): $11 billion
U.S. corporate training market: $100+ billion
– Corporate spending: $65 billion
– Government spending: $40 billion
Global corporate & government learning market: $300 billion
Global corporate & government e-learning market: $18 billion
(a) Source: ThinkEquity Partners, Eduventures.

ThinkEquity Partners 6
The Evolving Higher Education Marketplace
The higher education market is huge…
– Globally, 84 million students and 20,000 colleges and universities; in the U.S., 15 million students and
4,100 colleges and universities
– Higher education is a $250 billion market in the U.S.
…and growing
– Domestic undergraduate enrollments will increase by 13+% in the next decade to 21.2 million by 2010
– Baby Boom echo generation moving into their college years
– College less of a choice and more of a “must-have”
…with significant demand imbalance
– U.S. only 1 of 10 countries providing a college education to 1/3 or more of their college-age
populations
– Group of traditional host countries for foreign students (U.S., France, and England) expanding to
include Japan, Germany, Canada, and Australia
(a) Source: ThinkEquity Partners, National Science Foundation.

ThinkEquity Partners 7
There’s Something Going On Here…
Indexed Performance: March 2000 – Today
(a) Postsecondary Index includes: APOL, CECO, COCO, DV, EDMC, ESI, STRA, UOPX, WIX.
+220%
-75%

ThinkEquity Partners 8
Public Market Value of Learning Companies
Substantial Growth of Public Education Market
(a) Public companies included in 1991: DV, NEWH, NLCI.(b) Public companies included in 1992: FC, SCHL, TUTR, as well as all previous companies.(c) Public companies included in 1993: BTZ, SLVN, as well as all previous companies.(d) Public companies included in 1994: APOL, ESI, as well as all previous companies. (e) Public companies included in 1995: AMIE, LTRE, SMTF, as well as all previous companies. (f) Public companies included in 1996: EDMC, STRA, VCMP, as well as all previous companies. (g) Public companies included in 1997: BFAM, POSO, RLRN, RWDT, as well as all previous companies.(h) Public companies included in 1998: CECO, CLBR, CLKS, POVT, SCHS, as well as all previous companies.(i) Public companies included in 1999: COCO, ECLG, EDSN, ELLG, SCIL, as well as all previous companies. (j) Public companies included in 2000: CTRA, DCNT, DTHK, ELOQ, LSPN, RVDP, SABA, SKIL, UOPX, WEBX, as well as all previous companies.(k) Public companies included in 2001: REVU, as well as all previous companies, with the exception of BTZ, CLBR.
$0.3 $1.1 $1.9 $2.2
$4.5
$7.6
$10.9
$13.7
$11.4
$25.3
$27.7
$0.0
$5.0
$10.0
$15.0
$20.0
$25.0
$30.0
1991 1992 1993 1994 1995 1996 1997 1998 1999 2000 2001
CAGR: 49.4%

ThinkEquity Partners 9
$1 Invested at IPO…
STRA Performance: 7/25/96 to 9/30/02
CAGR: 42.6%$1 @ IPO = $9.02 Today
Strayer

ThinkEquity Partners 10
$1 Invested at IPO…
UOPX Performance: 9/27/00 to 9/30/02
CAGR: 111.6%$1 @ IPO = $4.51 Today
University of Phoenix Online

ThinkEquity Partners 11
$1 Invested at IPO…
EDMC Performance: 10/31/96 to 9/30/02
CAGR: 35.2%$1 @ IPO = $5.98 Today
$0
$10
$20
$30
$40
$50
Jan-96 Jan-98 Jan-00 Jan-02
Education Management

ThinkEquity Partners 12
$1 Invested at IPO…
CECO Performance: 1/29/98 to 9/30/02
CAGR: 71.3%$1 @ IPO = $12.39 Today
$0
$10
$20
$30
$40
$50
$60
Jan-98 Jan-99 Jan-00 Jan-01 Jan-02
Career Education

ThinkEquity Partners 13
$1 Invested at IPO…
DV Performance: 6/21/91 to 9/30/02
CAGR: 28.0%$1 @ IPO = $16.21 Today
$0
$10
$20
$30
$40
$50
Jan-91 Jan-93 Jan-95 Jan-97 Jan-99 Jan-01
DeVry

ThinkEquity Partners 14
$1 Invested at IPO…
APOL Performance: 12/6/94 to 9/30/02
CAGR: 68.6%$1 @ IPO = $59.57 Today
$0
$10
$20
$30
$40
$50
Jan-94 Jan-96 Jan-98 Jan-00 Jan-02
Apollo

ThinkEquity Partners 15
Our Society is Changing…
1800 1880 1900 2000
90% 49% 38% 2%
(a) Source: Department of Labor.
Farmers as a % of the Labor Force
Just 13% of working American adults had a high school education in 1900
Only 3% had college degrees

ThinkEquity Partners 16
U.S. Economy Shifting to Service Jobs
13.7%
35.4%
38.9%
17.7%
0%
5%
10%
15%
20%
25%
30%
35%
40%
45%
2000199019701960 19801950
Services Manufacturing
(a) Source: Department of Labor.

ThinkEquity Partners 17
A Changing ParadigmHuman Capital is Replacing Physical Capital as Primary Productive Asset
0
2
4
6
8
10
12
14
1981 1983 1985 1987 1989 1991 1993 1995 1997 1999
1.2x
12.1x
Price/Book Ratios

ThinkEquity Partners 18
Education Counts
(a) Median earnings in 2000 dollars for all wage and salary workers ages 25-34. Source: National Center for Education Statistics.
Educational Attainment Outcomes
Salary Gap between Male High School and College Graduates

ThinkEquity Partners 19
Education Counts
(a) Source: Michael Milken. Data in 1995 dollars.
Educational Attainment Outcomes
Earning Power of a 30-Year Old Man With a High School Diploma
$35,350
$26,110
$21,620
$0
$10,000
$20,000
$30,000
$40,000
1973 1982 1995

ThinkEquity Partners 20
Fastest Growing Occupations (2000-2010)
Employment
(thousands of jobs)
Occupation 2000 2010 Change
Computer software engineers, apps 380 760 100%
Computer support specialists 506 996 97%
Computer software engineers, systems 317 601 90%
Computer systems administrators 229 416 82%
Data communications analysts 119 211 77%
Desktop publishers 38 63 67%
Database administrators 106 176 66%
Personal and home care aides 414 672 62%
Computer systems analysts 431 689 60%
Medical assistants 329 516 57%
Education Required
Bachelor’s degree
Bachelor’s degree
Bachelor’s degree
Bachelor’s degree
Bachelor’s degree
Long-term OTJ training
Bachelor’s degree
Short-term OTJ training
Bachelor’s degree
Moderate-term OTJ training
(a) Source: Bureau of Labor Statistics.
ThinkEquity Partners 21
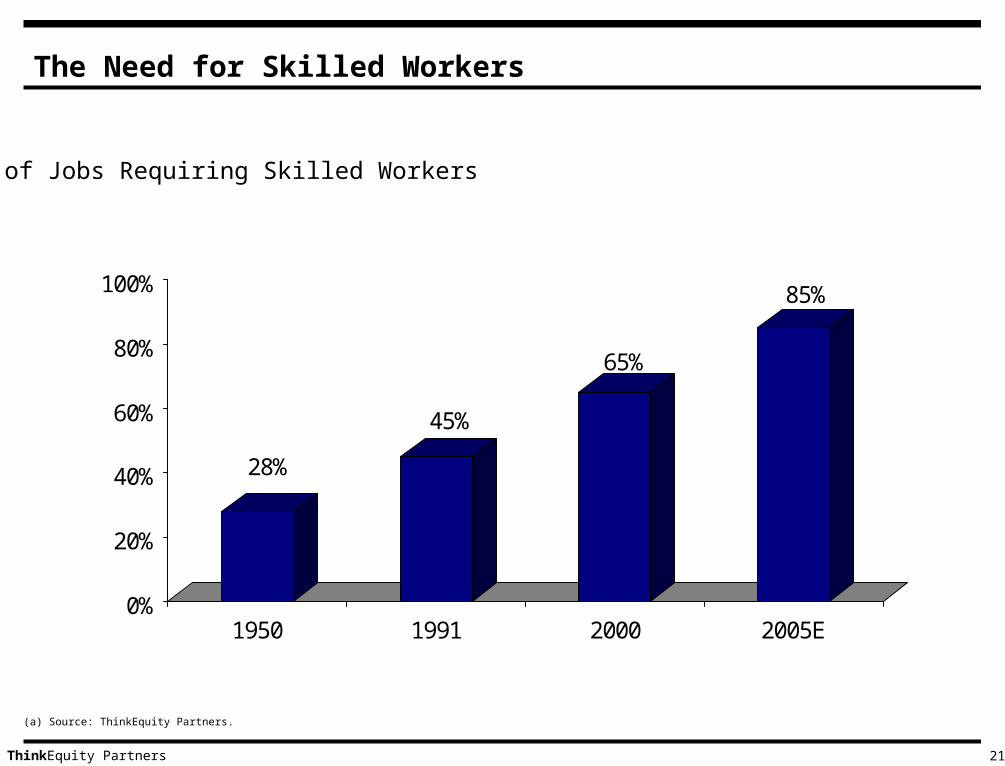
The Need for Skilled Workers
% of Jobs Requiring Skilled Workers
28%
45%
65%
85%
0%
20%
40%
60%
80%
100%
1950 1991 2000 2005E
(a) Source: ThinkEquity Partners.

ThinkEquity Partners 22
The Need for Skilled Workers
Adults with Bachelor’sor Higher Degree
Adults without Bachelor’sor Higher Degree
Less Than 25% of U.S. Adults 25 and Older have a Bachelor’s or Higher Degree

ThinkEquity Partners 23
The Demand for Knowledge Workers is Fundamental
E-Human Capital Solutions
Global Corporations
Demand for Knowledge Workers
Internet-Based Employee Solutions
Transformation of Knowledge
Higher Ed Solutions
Improved K-12 Solutions
Testing and Assessment
E-Corporate Learning
70% of Fortune 500 CEOs say finding knowledge workers is a major issue of growth

ThinkEquity Partners 24
“I skate to where the puck is going to be,not where it has been.”
- Wayne Gretzky

ThinkEquity Partners 25
Four-year degree
Isolated
Just-in-case
Tailored programsOne-size fits all
Global network
Cost
Industrial Economy Knowledge Economy
The New Knowledge Economy
Just-in-time
Virtual learning communities
Forty-year degree
ROI
Local

ThinkEquity Partners 26
ROI
Custom multimedia learning saves 20% in the first year of implementation and 50%
in subsequent years
E-learning produces a 60% faster learning curve than traditional instruction
Examples:
– Motorola: $1 spent on training yielded $30 in productivity gains over 5 years
– IBM’s Basic Blue management training e-learning initiative: 2284% ROI
– Omega Corporation:
100% improvement in hit ratio on sales calls
Improvement of customer commitments from 33% to 93%
Achievement of 50% of yearly sales goal in quarter after training
– Union Pacific Railroad:
Increase in bottom-line performance of 35%+
Implementation of new processes 12 months earlier than with traditional training
Bottom-Line Effects of E-Learning
(a) Source: THINQ.

ThinkEquity Partners 27
Higher Education Landscape
66+ million adults and more than 50% of all employed persons participate in some
form of continuing education
56% of the workforce, or 66 million people, is without an advanced degree
Number of corporate universities skyrocketed from 400 in 1988 to over 2,000 today,
including 40% of Fortune 500 companies
More than 60% of corporate universities have alliances with institutions of higher
education, increasing to 85% by 2003
Executive education particularly salient in light of recent corporate scandals, with
newfound interest in studying “good” corporate governance
(a) Source: ThinkEquity Partners.

ThinkEquity Partners 28
The Corporate Market Opportunity
Number of Corporations Offering Distributed Learning Courses to Employees
U.S. corporate business skills training market projected to reach $18.3 billion by 2006
(CAGR of 13.3%)
Worldwide IT education & training market projected to reach $28.6 billion by 2006
(CAGR of 7.1%)(a) Source: ThinkEquity Partners.

ThinkEquity Partners 29
The Corporate Market OpportunityCorporate Universities Up Tenfold
Over 40% of Fortune 500 companies have implemented a corporate university
As a point of reference, there are 3,700 postsecondary institutions in the U.S.
(a) Source: ThinkEquity Partners.

ThinkEquity Partners 30
Six Megatrends Shaping Higher Education
Demographics
Co
nso
lidat
ion
Outsourcing
Intern
et
GlobalizationBra
nding
Higher EducationMarket

ThinkEquity Partners 31
Eve-o-lution: Woman Power
Women have outnumbered men on college campuses since 1979
60% of distance or online learning are females over the age of 25
Women: Changing the Face of Higher Education
(a) Source: Business Women’s Network, Diversity Best Practices.
1.4
3.5
6.2
7.5
8.6
0.0
2.0
4.0
6.0
8.0
10.0
1960 1970 1980 1990 2000
(in m
illio
ns)
Female Enrollment in Higher Education
41%
56%

ThinkEquity Partners 32
Working for the Weekend
28%
43%
0%
20%
40%
60%
80%
1970 2000
Percentage of College Students Over the Age of 25
Our Students Aren’t Getting Younger

ThinkEquity Partners 33
Working for the Weekend
Level of Education CertificatePrograms
Associate Degree
Programs
Enrollment more than one year after high school 54% 14% 50%
Part-time student 41% 18% 13%
Also worked 1-20 hours per week 75% 42% 51%
Also worked more than 20 hours per week 47% 28% 40%
Bachelor’s Degree
Programs
Completion Rates for Postsecondary Education
As more adults work and attend school, the need for expanding traditional university limits has never been greater
(a) Source: ThinkEquity Partners.

ThinkEquity Partners 34
University Tuition$ Per Year for Residents
Actual In Current $ Today
University of Wisconsin - 1935 $55 $654 $3,408
UC Berkeley - 1964 $203 $1,067 $4,176
Wharton - 1975 $3,430 $9,826 $24,570
A Quality Education Is Becoming Increasingly Expensive
(a) Source: ThinkEquity Partners.
ThinkEquity Partners 35
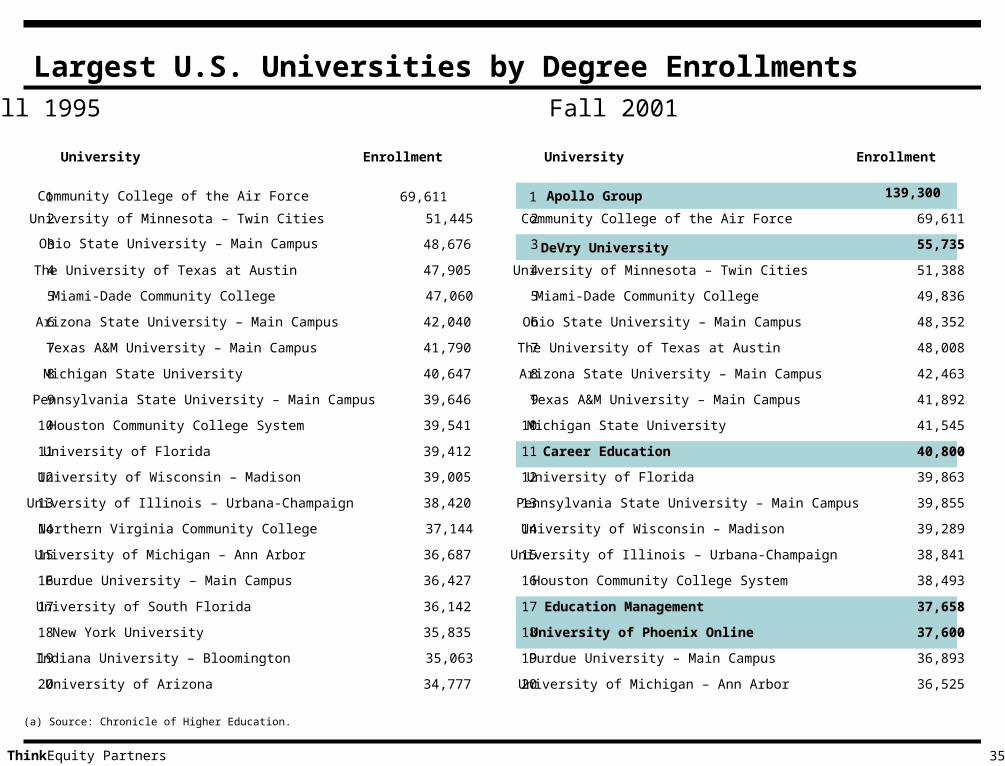
Largest U.S. Universities by Degree EnrollmentsFall 1995 Fall 2001
University Enrollment
1 Community College of the Air Force 69,611
2 University of Minnesota – Twin Cities 51,445
3 Ohio State University – Main Campus 48,676
4 The University of Texas at Austin 47,905
5 Miami-Dade Community College 47,060
6 Arizona State University – Main Campus 42,040
7 Texas A&M University – Main Campus 41,790
8 Michigan State University 40,647
9 Pennsylvania State University – Main Campus 39,646
10 Houston Community College System 39,541
11 University of Florida 39,412
12 University of Wisconsin – Madison 39,005
13 University of Illinois – Urbana-Champaign 38,420
14 Northern Virginia Community College 37,144
15 University of Michigan – Ann Arbor 36,687
16 Purdue University – Main Campus 36,427
17 University of South Florida 36,142
18 New York University 35,835
19 Indiana University – Bloomington 35,063
20 University of Arizona 34,777
University Enrollment
11 Apollo GroupApollo Group 139,300139,300
2 Community College of the Air Force 69,611
33 DeVry UniversityDeVry University 55,735 55,735
4 University of Minnesota – Twin Cities 51,388
5 Miami-Dade Community College 49,836
6 Ohio State University – Main Campus 48,352
7 The University of Texas at Austin 48,008
8 Arizona State University – Main Campus 42,463
9 Texas A&M University – Main Campus 41,892
10 Michigan State University 41,545
1111 Career EducationCareer Education 40,800 40,800
12 University of Florida 39,863
13 Pennsylvania State University – Main Campus 39,855
14 University of Wisconsin – Madison 39,289
15 University of Illinois – Urbana-Champaign 38,841
16 Houston Community College System 38,493
1717 Education Management Education Management 37,658 37,658
1818 University of Phoenix OnlineUniversity of Phoenix Online 37,600 37,600
19 Purdue University – Main Campus 36,893
20 University of Michigan – Ann Arbor 36,525
(a) Source: Chronicle of Higher Education.

ThinkEquity Partners 36
World’s Ten Most Valuable Brands
8
10
Marlboro
Intel
McDonald’s 26.4
7 Disney 29.3
3 IBM 51.2
Mercedes 21.0
9 24.2
Rank Brand2002 Brand Value
($ in billions)
2 Microsoft 64.1
5 30.9
1 Coca-Cola 69.6
4 General Electric 41.3
6 Nokia 30.0
(a) Source: Interbrand Corp., JP Morgan Chase & Co.
WHERE ARE THE EDUCATION COMPANIES?
ThinkEquity Partners 37
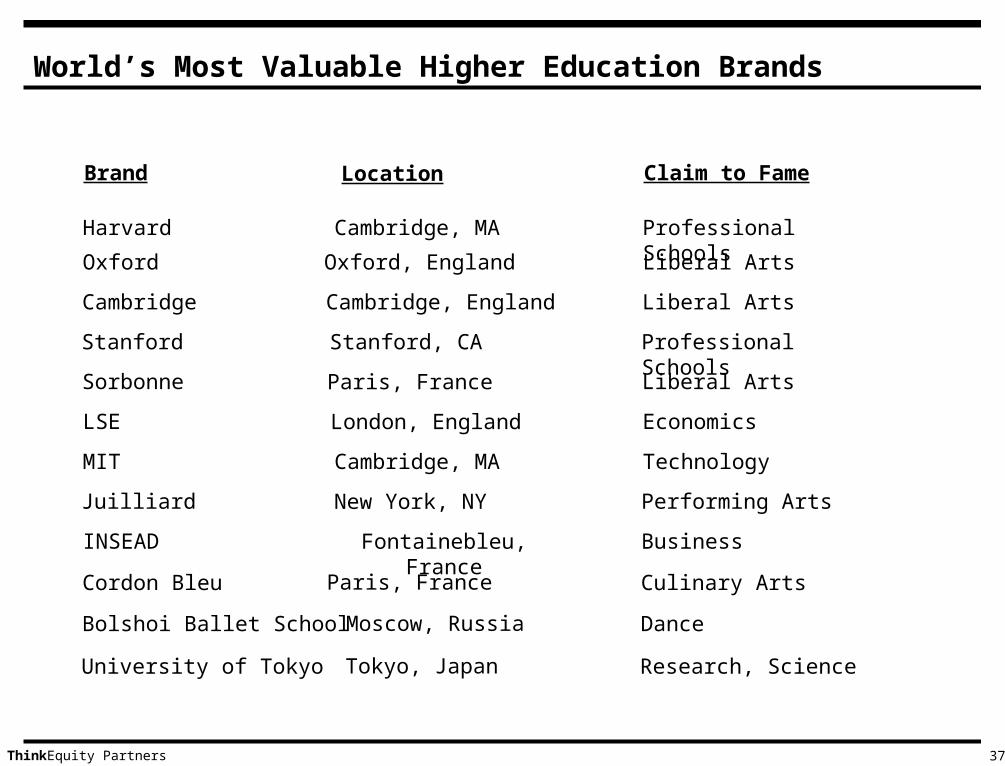
World’s Most Valuable Higher Education Brands
Sorbonne
MIT Cambridge, MA
Cambridge Cambridge, England
Brand Location
Oxford Oxford, England
Paris, France
Harvard Cambridge, MA
Stanford Stanford, CA
LSE London, England
Juilliard New York, NY
Liberal Arts
Technology
Liberal Arts
Claim to Fame
Liberal Arts
Professional Schools
Professional Schools
Economics
Performing Arts
INSEAD Fontainebleu, France Business
Cordon Bleu Culinary ArtsParis, France
Bolshoi Ballet School DanceMoscow, Russia
University of Tokyo Research, ScienceTokyo, Japan
ThinkEquity Partners 38
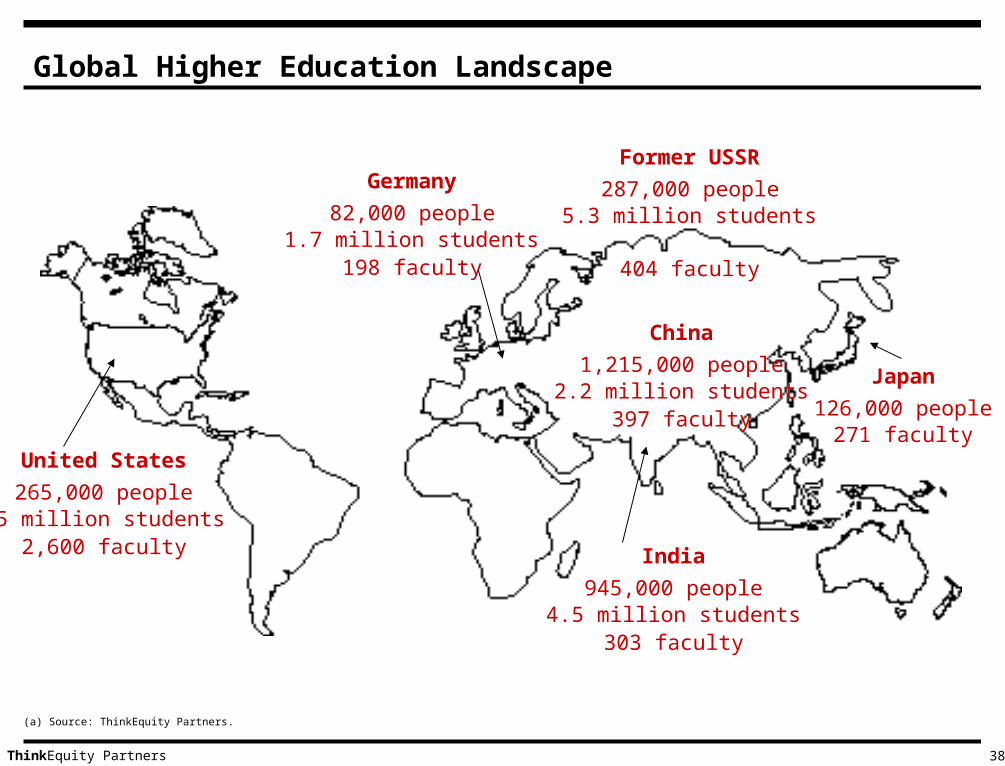
Global Higher Education Landscape
United States
265,000 people15 million students
2,600 faculty India
945,000 people4.5 million students
303 faculty
Japan
126,000 people271 faculty
China
1,215,000 people2.2 million students
397 faculty
Former USSR
287,000 people5.3 million students
404 faculty
Germany
82,000 people1.7 million students
198 faculty
(a) Source: ThinkEquity Partners.
ThinkEquity Partners 39
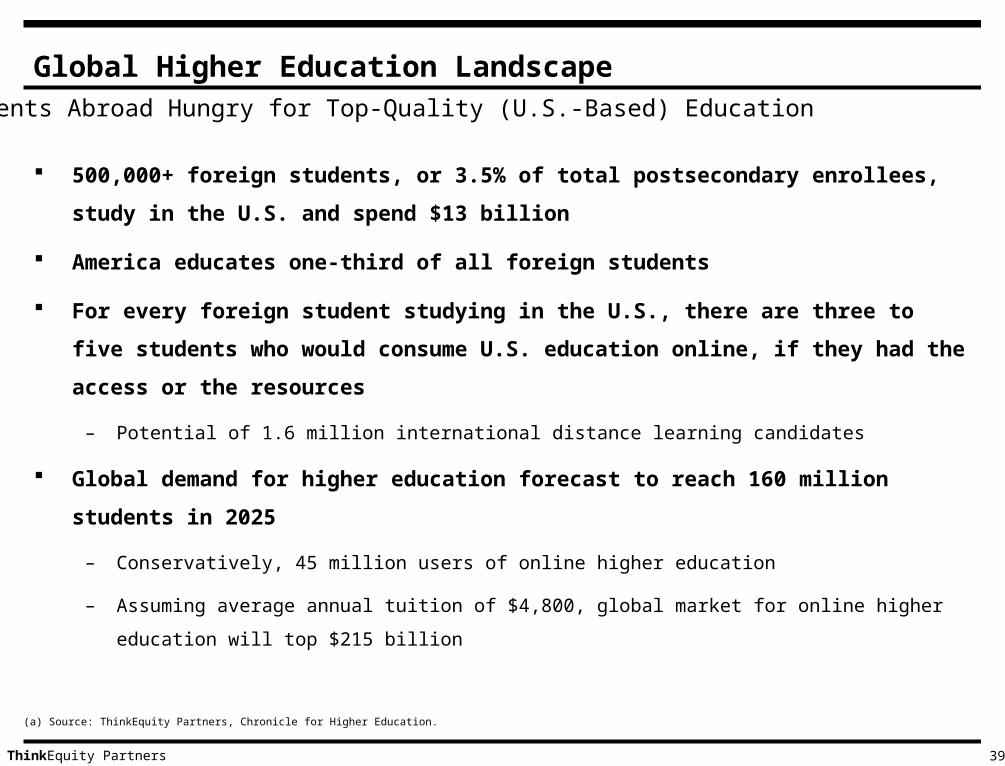
Global Higher Education Landscape
500,000+ foreign students, or 3.5% of total postsecondary enrollees, study in the U.S.
and spend $13 billion
America educates one-third of all foreign students
For every foreign student studying in the U.S., there are three to five students who would
consume U.S. education online, if they had the access or the resources
– Potential of 1.6 million international distance learning candidates
Global demand for higher education forecast to reach 160 million students in 2025
– Conservatively, 45 million users of online higher education
– Assuming average annual tuition of $4,800, global market for online higher education will top $215
billion
Students Abroad Hungry for Top-Quality (U.S.-Based) Education
(a) Source: ThinkEquity Partners, Chronicle for Higher Education.
ThinkEquity Partners 40
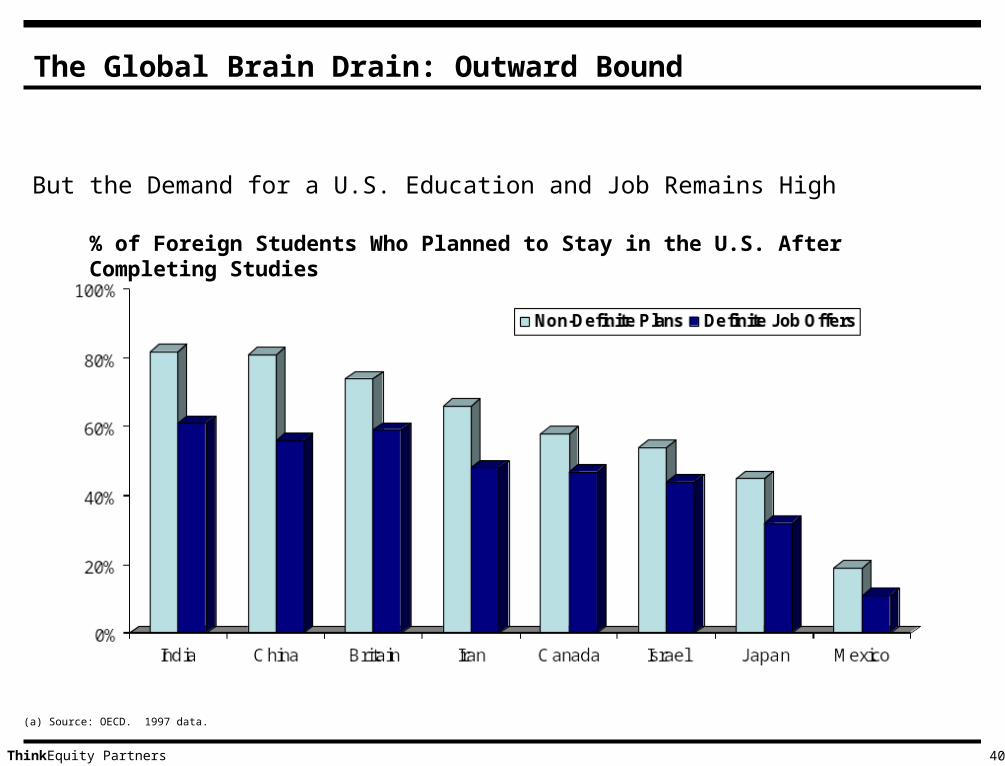
The Global Brain Drain: Outward Bound
% of Foreign Students Who Planned to Stay in the U.S. After Completing Studies
(a) Source: OECD. 1997 data.
But the Demand for a U.S. Education and Job Remains High

ThinkEquity Partners 41
Global Higher Education LandscapeAccess to Higher Education (18-22 Year Old Students)
Current % % of Students # of Students (mm)
China 3% 20% 240.0
Malaysia 14% 40% 8.3
India 4% 8% 11.0
Hong Kong 15% 20% 0.1
US 42% 45% 16.1
Projected by 2020 _______
(a) Source: US Census Bureau, World Bank, Government of Hong Kong.
In Malaysia, for example, an additional 5.4 million higher education slots are needed to get to 40%
Online courses will capture at least half of this growth - $200+ billion opportunity by 2020

ThinkEquity Partners 42
Less than 1/3 of adults outside the U.S. have completed high school, let alone earned a postsecondary degree
The Global Education Gap
Average Years of Schooling
0
2
4
6
8
10
12
14
United States East Asia & Pacific Latin America &Caribbean
Middle East &North Africa
South Asia
0%
20%
40%
60%
80%
By Region, Excluding High Income Countries
Percentage of Adults Enrolled in Postsecondary Education
(a) Source: World Bank. Data as of 1999.

ThinkEquity Partners 43
Global Higher Education LandscapeAsia Is Changing
(a) Source: Asian Demographics Ltd. Includes India, China, Japan, South Korea, Taiwan, Hong Kong, Thailand, Philippines, Malaysia, Singapore, Indonesia.
Current Projected by 2020
Over age 40 31% 40%
Postsecondary graduates 93 million 141 million
Skilled white collar jobs 81 million 103 million
Skilled white collar segment growing in excess of 2% per year in most Asian countries
In the next 20 years there will be 36 million additional skilled white collar workers
Global Demographic Changes Mirror the U.S.’: Aging Populations, Increased Postsecondary Attendance, and Need for Skilled Labor

ThinkEquity Partners 44
Global Higher Education LandscapeAsia Is Changing
(a) Source: Asian Demographics Ltd. Includes India, China, Japan, South Korea, Taiwan, Hong Kong, Thailand, Philippines, Malaysia, Singapore, Indonesia.
% of Workforce with Secondary Education or Better: 2000 vs. 2020
Untapped Potential: Growing Pool of Postsecondary Students…

ThinkEquity Partners 45
Global Higher Education LandscapeAsia Is Changing
(a) Source: Asian Demographics Ltd. Includes India, China, Japan, South Korea, Taiwan, Hong Kong, Thailand, Philippines, Malaysia, Singapore, Indonesia.
% Average Annual Growth Rate 2000 to 2020
Untapped Potential: …Needed to Fill a Labor Force Demanding Skills

ThinkEquity Partners 46
The Blowing Up of a BubbleGrowth & Composition of Venture Capital Investments in Nominal Dollars (1991-2000)
(a) Source: 1991-1994 Venture Economics; 1995-2000 PricewaterhouseCoopers / VentureOne Moneytree Survey.
$2.5 $5.1 $4.9 $5.3 $6.7 $9.8 $12.6$17.4
$46.3
$87.7
$ in
bill
ion
s
32%
83%
ThinkEquity Partners 47
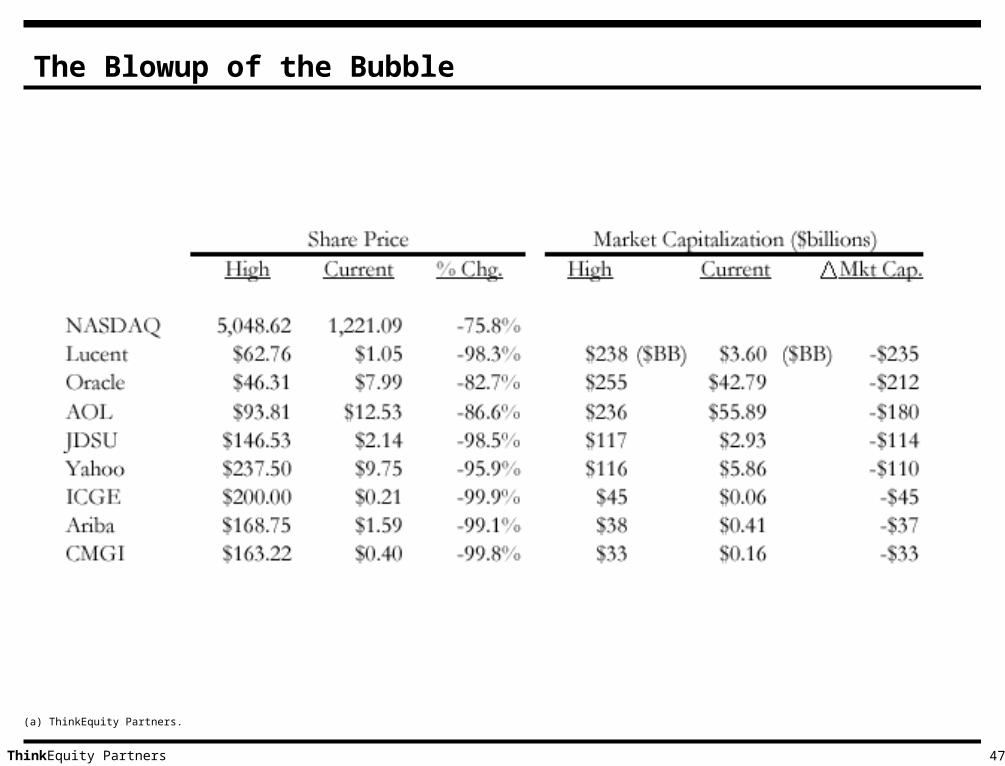
The Blowup of the Bubble
(a) ThinkEquity Partners.

ThinkEquity Partners 48
High Hopes for e-LearningCapital Invested
Company Capital Invested Company Status
Blackboard $103 million Private
Caliber $74 million Bankrupt / Acquired by Sylvan
Campus Pipeline $91 million Acquired by SCT Group
Cognitive Arts $33 million Private
CollegeClub $64 million Bankrupt / Acquired by Student Advantage
DigitalThink* $45 million Public: $90 million equity value
Docent* $80 million Public: $45 million equity value
KnowledgePlanet $67 million Private
Mascot Network $22 million Out of Business
Pensare $38+ million Bankrupt / Acquired by Duke University
Saba Software* $50 million Public: $80 million equity value
WebCT $120 million Private
ZUniversity $15 million Out of Business
$802 million* Money invested through pre-IPO mezzanine level.

ThinkEquity Partners 49
Colleges, Students, and “Average Joes” Have Embraced the WebYears to Attain 25% Market Share
(a) Source: ThinkEquity Partners.
ThinkEquity Partners 50
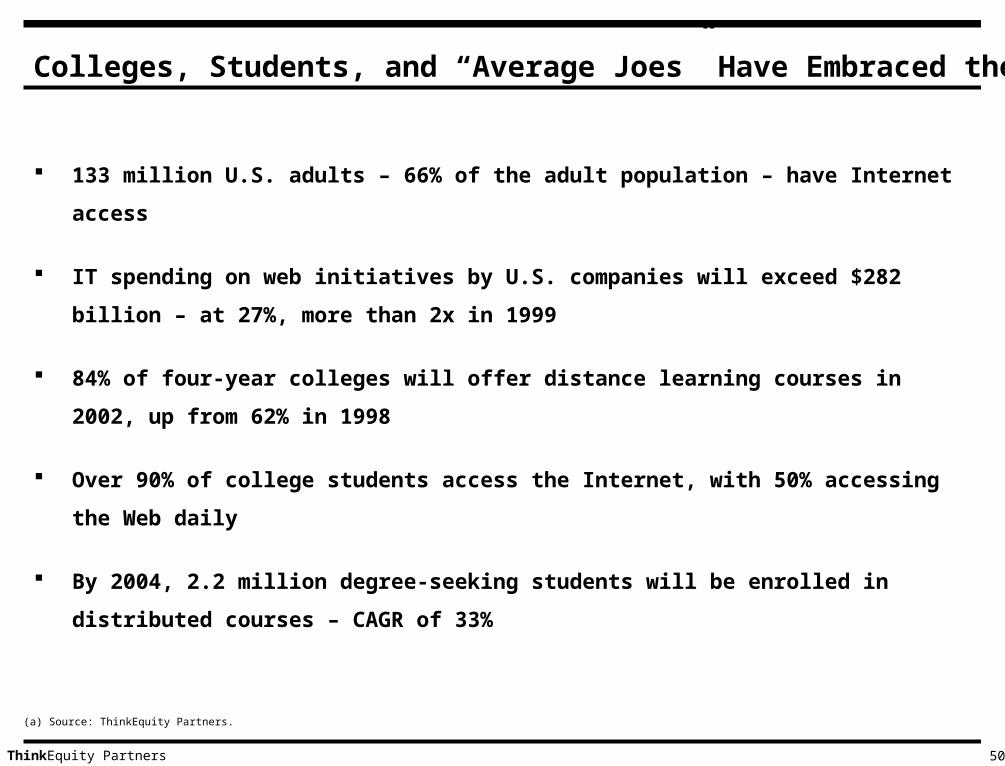
Colleges, Students, and “Average Joes” Have Embraced the Web
133 million U.S. adults – 66% of the adult population – have Internet access
IT spending on web initiatives by U.S. companies will exceed $282 billion – at 27%, more
than 2x in 1999
84% of four-year colleges will offer distance learning courses in 2002, up from 62% in
1998
Over 90% of college students access the Internet, with 50% accessing the Web daily
By 2004, 2.2 million degree-seeking students will be enrolled in distributed courses –
CAGR of 33%
(a) Source: ThinkEquity Partners.

ThinkEquity Partners 51
Embracing the Web: A Global Perspective
Huge global opportunity
– By 2003, 65% of Web users will be international
– Non-U.S. countries will account for over half of worldwide Internet commerce by 2003
– Percentage of American users will drop from one half in 1998 to one third in 2003
Jump in Internet spending outside the U.S.
– Up to $913 billion, two-thirds of the projected $1.64 trillion worldwide 2003 e-commerce total
– Western Europe and Japan: 29% in 1999 47% in 2003, or $764 billion
– Chinese universities project a 5% increase in IT budgets in 2003 (vs. a 5% decline in the U.S.):
800,000 Chinese students online next year
In three years, 1/3 of all Internet users will prefer using a language other than English
– Fastest Internet user growth in the Asia-Pacific region
– Triple to 75.6 million from 19.7 between 1999 and 2003
(a) Source: International Data Corp., World Bank, ThinkEquity Partners.

ThinkEquity Partners 52
The Growing Demand for Online Higher Education(a)
The Higher Education Landscape
(a) Source: IDC, U.S. Department of Education, ThinkEquity Partners.
14.6
14.8
15.0
15.2
15.4
15.6
15.8
16.0
16.2
2000 2001 2002 2003 2004
mill
ions
0.0%
2.0%
4.0%
6.0%
8.0%
10.0%
12.0%
14.0%
16.0%
Total enrollment in degree-granting institutions
Online enrollment as a percent of degree enrollment
CAGR: 33%

ThinkEquity Partners 53
Railroads
– 23 miles of track in 1830 166,703 miles in 1890
– Overexpansion led to bankruptcy: investors lost nearly $2 billion in 1893 alone
– 1,500+ railroads in 1917 / 254,000 miles of track 562 for-hire railroads in 2000 / 173,000 miles
– Today, rail transportation is a $50+ billion industry
Automotives
– Between 1904 and 1908, 240+ firms manufacturing cars were established in the U.S.
– By 1923, there were 108 firms – just 10 accounted for 90% of annual production
– By 1926, there were 43 – no new U.S. manufacturers entered the industry afterwards
– Today, there are 3 – total U.S. market over $630 billion
Commercial Banking
– Between 1860-1921, number of banks in the U.S. increases by over 19x, peaking at 30,000
– Number of insured banks declined annually from 14,413 in 1984 to 8,007 in 2001
– Number of banks dropped by 33% from 1990 to 2000; number of branches grew by 27%
Same Movie, Different Actors
(a) Source: Multiple sources, including AACA.

ThinkEquity Partners 54
South Korea Korea National Open University 206,000
Thailand Sukhothai Thammathirat Open University 210,000
Turkey Anadolu University 630,000
United Kingdom The Open University 200,000
Spain Universidad Nacional de Educacion a Distancia 200,000
South Africa University of South Africa 127,000
Mega Universities: A Global Phenomenon
Country UniversityNo. of
students
China China TV University System 690,000
France Centre National d'Enseignement a Distance 350,000
India Indira Gandhi National Open University 875,000
Indonesia Universitas Terbuka 400,000
Iran Payame Noor University 183,000
Pakistan Allama Iqbal Open University Islamabad 325,000
(a) Source: Best Educational E-Practices, The Open University, UK.
Bangladesh Bangladesh Open University NA
Universities with 100,000+ Students

ThinkEquity Partners 55
Successful Online Initiatives
(a) UMassOnline.net.
FL Comm. Coll. D.L. Consortium: 85,278
Univ. of Maryland Univ. College: 68,250
Florida Virtual Campus: 56,198
Illinois Virtual Campus: 46,678
Georgia Globe: 40,000
Maryland Online: 27,060
Arizona Regents University: 12,353
eArmyU (23 campuses): 12,000
Connecticut D. L. Consortium: 9,683
UMassOnline: 7,824

ThinkEquity Partners 56
Ivy League
Ric
hn
ess
Reach
Higher Education: Combining Richness & Reach on the Internet
StateUniversity
CorrespondenceEducation

ThinkEquity Partners 57
Reconceptualizing Effective Learning
(a) Source: Andersen Consulting.
How People Learn

ThinkEquity Partners 58
University of Phoenix Online: Case Study
Began operations in 1989
Current market cap = $3.7 billion
FY 2002 revenue = $327 million
50,000 degree-seeking students
2,600 faculty members
11 accredited degree programs in business, education, IT and nursing
Recent outperformance:
– $1 invested at IPO is $4.50 today
– CAGR of 112%
The Higher Education Landscape

ThinkEquity Partners 59
University of Phoenix Online: Case Study
The Higher Education Landscape
UOP Online Ending Degree Enrollments
Annual CAGR: 60.5%
-
10,000
20,000
30,000
40,000
50,000
60,000
70,000
80,000
90,000
Nov-97 May-98 Nov-98 May-99 Nov-99 May-00 Nov-00 May-01 Nov-01 May-02 Nov-02 May-03 Nov-03

ThinkEquity Partners 60
Apollo International: Case Study
The Higher Education Landscape
Formed by Apollo Group executives in 1998
Taking educational products & services worldwide – especially to emerging markets
– Leveraging Apollo Group model
1,200+ students in the Netherlands, Brazil, and India
– K-12 feeder system in Brazil – over 250 affiliated schools and 110,000 students
Offers workplace-oriented undergraduate and graduate degrees
– Business, nursing, information technology
Investors include Kaplan and principals in Apollo Group
Led by Chairman and CEO Jorge Klor de Alva

ThinkEquity Partners 61
Capella University: Case Study
Founded in 1993 by former Chairman and CEO of Tonka Corporation
$50 million in revenue in 2002
5,000 enrolled students
Projected annual enrollment growth of 80+%
Seed capital of $2.8 million invested
$35 million Series E financing in 2000 – Forstmann Little and SmartForce
$16.7 million round in 2002 – Forstmann Little and Putnam Investments
Initial strategy: focus on Ph.D.-level online education and Master of Science in business
education and human services
The Higher Education Landscape

ThinkEquity Partners 62
Capella University: Case Study
The Higher Education Landscape
PH.D. MASTER’S BACHELOR’S CONTINUING EDUCATION
PROFESSIONAL DEVELOPMENT
EDUCATION
BUSINESS
HUMAN SERVICES
PSYCHOLOGY
TECHNOLOGY
Programs Offered by School
The Capella Way of Learning
Outcomes and assessment-based curriculum
Relevant, applicable content
Individualized learning approaches
Strong sense of community
Broad program offering
Modular approach to learning delivery
Meaningful student interaction
Exceptional customer service

ThinkEquity Partners 63
Open University: Case Study
The Higher Education Landscape
Britain’s largest university – 200,000+ students
22% of all part-time higher education students
Established by Royal Charter in 1969
Two-thirds of students are between 25 and 45
75% of students are in paid employment; 150,000 are online
Offers 360+ undergraduate and postgraduate courses in arts, languages, social
sciences, science, math and computing, technology, business, education, and law
Average time taken for a degree is 6 years, at an average cost of 4,100 (pounds sterling)

ThinkEquity Partners 64
Sylvan International / Walden University: Case Study
The Higher Education Landscape
Founded in 1970, a pioneer in distance and online learning for adults
Accredited by the North Central Association of Colleges and Schools
Offers Ph.D. and other graduate-level, regionally accredited degree programs in
management, education, and social and behavioral sciences
Walden Institute established in 1998 to provide online certificate and degree programs in
technology and business
Sylvan Ventures acquired 41% stake with a $32.8 million investment in February 2001
– Sylvan acquired an additional 10% interest in FY 2001 for $8 million

ThinkEquity Partners 65
Branding: relationships and content
Accreditation
Impact on traditional universities
Intellectual property
Teaching with technology
Regulation
Sources of funds
Student aid
Student life
Land of Opportunity
(a) Chronicle of Higher Education, ThinkEquity Partners.
Trends and Opportunities
Certification vs. degree
programs
Older students
“Skilled” sectors
Corporate universities /
alliances with corporations
Alliances between universities
Issues
ThinkEquity Partners 66
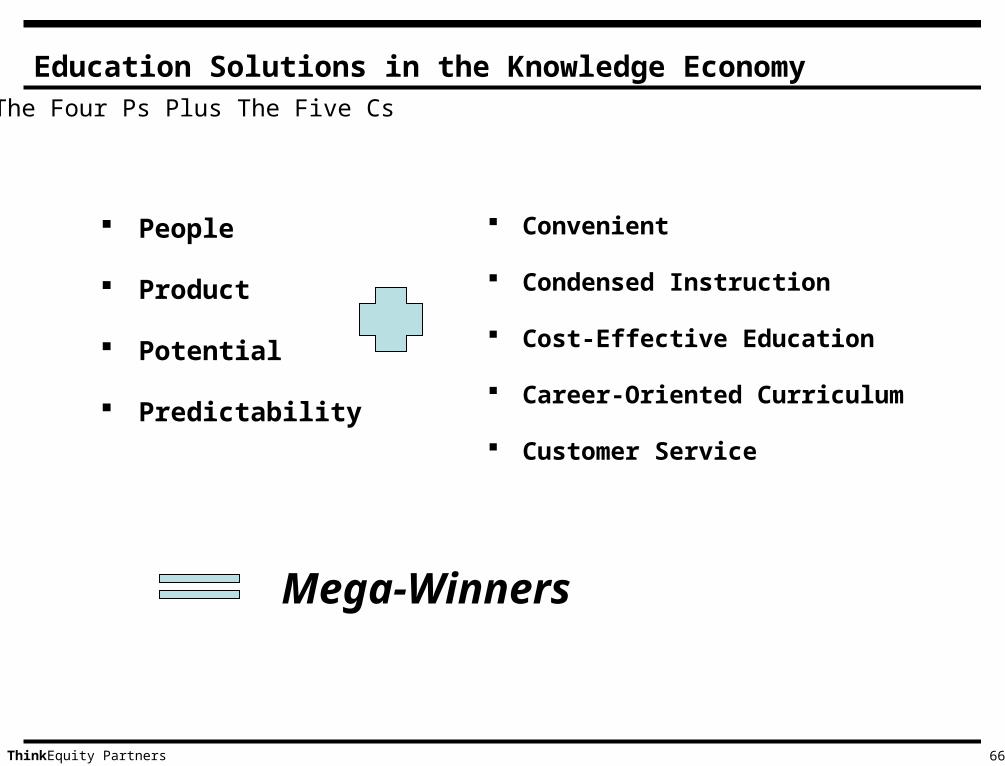
Convenient
Condensed Instruction
Cost-Effective Education
Career-Oriented Curriculum
Customer Service
Education Solutions in the Knowledge Economy The Four Ps Plus The Five Cs
People
Product
Potential
Predictability
Mega-Winners
ThinkEquity Partners 67
The Future Mega-Winners
Access + Cost + Quality = ROI
Seamless solutions & invisible technology
Lifelong learning and career focus
Problem-solving: learn by doing
Distributed, yet integrated, interactive and intimate
Flexible bargaining power of actors
Choice within a consistent framework
Assessment = currency of the Knowledge Economy
Branding is key