Embed Size (px)
Citation preview

© 2016 Chevron Corporation
Chevron 2016 Investor presentation
August 2016

2
light blue 0/157/217
mid blue 0-102-178
dark blue 11-45-113
teal 0-178-189
mid teal 0-112-140
dark teal 0-54-83
light green 178-204-52
mid green 118-146-49
dark green 68-75-13
red 226-24-54
mid red 151-0-46
dark red 88-0-28
light orange 250-171-24
mid orange 229-96-31
dark orange 113-27-0
light purple 186-48-147
mid purple 117-18-105
dark purple 58-13-54
light gray 219-220-221
mid gray 140-143-147
dark gray 107-109-111
warm color family R-G-B
cool color family R-G-B
use the color picker or
type in the RGB values to
select color
do not use tints from the
color palette
© 2016 Chevron Corporation
Cautionary statement CAUTIONARY STATEMENTS RELEVANT TO FORWARD-LOOKING INFORMATION
FOR THE PURPOSE OF “SAFE HARBOR” PROVISIONS OF THE PRIVATE SECURITIES LITIGATION REFORM ACT OF 1995
This presentation of Chevron Corporation contains forward-looking statements relating to Chevron’s operations that are based on management’s current expectations, estimates and
projections about the petroleum, chemicals and other energy-related industries. Words or phrases such as “anticipates,” “expects,” “intends,” “plans,” “targets,” “forecasts,” “projects,”
“believes,” “seeks,” “schedules,” “estimates,” “positions,” “may,” “could,” “should,” “budgets,” “outlook,” “on schedule,” “on track,” “goals,” “objectives” and similar expressions are intended to
identify such forward-looking statements. These statements are not guarantees of future performance and are subject to certain risks, uncertainties and other factors, many of which are
beyond the company’s control and are difficult to predict. Therefore, actual outcomes and results may differ materially from what is expressed or forecasted in such forward-looking
statements. The reader should not place undue reliance on these forward-looking statements, which speak only as of the date of this presentation. Unless legally required, Chevron
undertakes no obligation to update publicly any forward-looking statements, whether as a result of new information, future events or otherwise.
Among the important factors that could cause actual results to differ materially from those in the forward-looking statements are: changing crude oil and natural gas prices; changing refining,
marketing and chemicals margins; the company’s ability to realize anticipated cost savings and expenditure reductions; actions of competitors or regulators; timing of exploration expenses;
timing of crude oil liftings; the competitiveness of alternate-energy sources or product substitutes; technological developments; the results of operations and financial condition of the
company’s suppliers, vendors, partners and equity affiliates, particularly during extended periods of low prices for crude oil and natural gas; the inability or failure of the company’s joint-
venture partners to fund their share of operations and development activities; the potential failure to achieve expected net production from existing and future crude oil and natural gas
development projects; potential delays in the development, construction or start-up of planned projects; the potential disruption or interruption of the company’s operations due to war,
accidents, political events, civil unrest, severe weather, cyber threats and terrorist acts, crude oil production quotas or other actions that might be imposed by the Organization of Petroleum
Exporting Countries or other natural or human causes beyond its control; changing economic, regulatory and political environments in the various countries in which the company operates;
general domestic and international economic and political conditions; the potential liability for remedial actions or assessments under existing or future environmental regulations and
litigation; significant operational, investment or product changes required by existing or future environmental statutes and regulations, including international agreements and national or
regional legislation and regulatory measures to limit or reduce greenhouse gas emissions; the potential liability resulting from other pending or future litigation; the company’s future
acquisition or disposition of assets and gains and losses from asset dispositions or impairments; government-mandated sales, divestitures, recapitalizations, industry-specific taxes, changes
in fiscal terms or restrictions on scope of company operations; foreign currency movements compared with the U.S. dollar; material reductions in corporate liquidity and access to debt
markets; the effects of changed accounting rules under generally accepted accounting principles promulgated by rule-setting bodies; the company’s ability to identify and mitigate the risks
and hazards inherent in operating in the global energy industry; and the factors set forth under the heading “Risk Factors” on pages 21 through 23 of the company’s 2015 Annual Report on
Form 10-K. Other unpredictable or unknown factors not discussed in this presentation could also have material adverse effects on forward-looking statements.
Certain terms, such as “unrisked resources,” “unrisked resource base,” “recoverable resources,” and “oil in place,” among others, may be used in this presentation to describe certain
aspects of the company’s portfolio and oil and gas properties beyond the proved reserves. For definitions of, and further information regarding, these and other terms, see the “Glossary of
Energy and Financial Terms” on pages 50 and 51 of the company’s 2015 Supplement to the Annual Report and available at Chevron.com. As used in this presentation, the term “project”
may describe new upstream development activity, including phases in a multiphase development, maintenance activities, certain existing assets, new investments in downstream and
chemicals capacity, investment in emerging and sustainable energy activities, and certain other activities. All of these terms are used for convenience only and are not intended as a precise
description of the term “project” as it relates to any specific government law or regulation.

3 © 2016 Chevron
Key messages
• Maintain and grow dividend is the priority
• Improve free cash flow by:
− Reducing capital and operating spend
− Growing volume and margin
• Use strong balance sheet to complete
projects under construction
• Positioned to improve returns and
selectively grow in lower price environment

4 © 2016 Chevron
CVX ranking relative to competitors, 1 being the lowest rate
Leading operational excellence performance
Days away from work rate Oil spills to land or water Thousands of barrels
Competitor range: BP, RDS, XOM
Source: Annual company sustainability reports. DAFWR – XOM is lost time incident rates; RDS is lost time
incident rates for injuries only. Oil spills to land or water – when needed, units converted to thousand bbl based
on the following assumptions 1 ton = 7.3 bbl 1 bbl = 0.16 cubic meters 1 bbl = 159 liters
0.05
0.10
2011 2012 2013 2014 2015
1
1 1 1
30
60
2011 2012 2013 2014 2015
CVX ranking relative to competitors, 1 being the lowest rate
Competitor range: BP, RDS, XOM
1 1 2
2 1
1

5 © 2016 Chevron
Competitor average:
BP, RDS, TOT, XOM
100
200
300
2005 2015
S&P 500
Financial priorities
Indexed dividend growth Basis: 2005 = 100
Source: Public information
Chevron Competitor range:
BP, RDS, TOT, XOM
~9% compound annual
growth rate
Maintain and
grow dividend
Fund
capital program
for future earnings
Maintain
strong balance sheet
Return
surplus cash
to stockholders

6 © 2016 Chevron
Financial performance
2Q16 YTD
Earnings $(2.2) billion
Cash flow from operations $ 3.7 billion
C&E spending $ 12.0 billion
Debt ratio ~23%
Dividends paid $4.0 billion
Low price environment
Responding to market
• Completing projects underway
• Capital and operating spend reduction
• Asset sales for value
• Prudently using balance sheet

7 © 2016 Chevron Corporation
Light blue 0-157-217
Mid blue 0-102-178
Dark blue 11-45-113
Light teal 0-178-189
Mid teal 0-112-140
Dark teal 0-54-83
Light green 178-204-52
Mid green 118-146-49
Dark green 68-75-13
Light red 226-24-54
Mid red 151-0-46
Dark red 88-0-28
Light orange 250-171-24
Mid orange 229-96-31
Dark orange 113-27-0
Light purple 186-48-147
Mid purple 117-18-105
Dark purple 58-13-54
Light gray 219-220-221
Mid gray 140-143-147
Dark gray 107-109-111
Warm color family R-G-B
Cool color family R-G-B
Use the color picker or type in the
RGB values to select color.
Do not use tints from the color
palette.
Background gray 237-237-238
(15)
(10)
(5)
0
5
10
Improving free cash flow
Cash flow after dividends* (including asset sales)
$ billions
2015 Actual* $52/bbl
2017* $52/bbl
Reduced
cash C&E
spend
Upstream
TCO
financing/
asset sales DS&C/ Other
Price
recovery
Cash flow from operations
*Cash flow after dividends = estimated cash flow from operations plus asset sales, less cash C&E, less dividends. 2015
includes asset sales proceeds of $5.7B. 2017 at $52/bbl Brent is for illustration purposes only and not indicative of
Chevron’s forecast
Reduced spend
Further flexibility
depending on market
Volume and margin
growth

8 © 2016 Chevron
8.0 5.9 4.4
2013 2014 2015
Chevron Southeast Asia competitor average
Thailand drilling efficiency Average days per 10,000 feet drilled – Rushmore benchmarking
Examples of efficiency gains
Cost and procurement activities
2,622
Sustainable actions
• Organizational activities
‒ ~4,000 through 1Q 2016
– On target to reach ~8,000
• Efficiency gains
– Logistics
– Drilling
• Strategic supplier engagement
2014 2015 2016 Estimate
Number of vessels
Africa logistics efficiency
~40%
- - - - -
- - - - -
- - - - -
~45%
- -

9 © 2016 Chevron
4
6
8
2014avg
2015avg
1Q 2Q 3Q 4Q
4
6
8
10
12
2014avg
2015avg
1Q 2Q 3Q 4Q
Spend momentum
Total capital & exploratory Quarterly
$ billions
Total C&E includes affiliate spend
OPEX and SG&A Quarterly
$ billions
OPEX and SG&A = operating, selling, general and administrative expenses as
reported on income statement (excludes affiliate spend)
Quarterly average
2016 C&E is trending
to lower end of
guidance range
YTD 2016 vs. YTD 2015: -31%
OPEX reductions
continue to be realized
YTD 2016 vs. YTD 2015: -8%
2016 Quarterly average 2016

10 © 2016 Chevron
Total capital & exploratory $ billions
TCO FGP / WPMP
Reducing spend
Total C&E includes affiliate spend. TCO FGP / WPMP = Tengiz Future Growth Project and Wellhead
Pressure Management Project
15
30
2014 2015 2016 2017 2018
OPEX / SG&A $ billions
OPEX / SG&A = operating, selling, general and administrative expenses as reported on income statement
(excludes affiliate spend)
Projects under
construction in 2015 Base & other
20
40
2014 2015 2016 2017 2018
$25-28
guidance
$17-22
guidance

11 © 2016 Chevron
40% 45% 60% 65%
2015 2016 2017 2018
Spend profile
• Increase in shale and tight
• More brownfield opportunities
• Fewer major capital projects
Reduced execution risk
Base and short-cycle
Shorter-cycle, higher return investments
Total capital & exploratory Percentage of capital program
TCO FGP / WPMP Growth MCPs and exploration
Total C&E includes affiliate spend. TCO FGP / WPMP = Tengiz Future Growth Project and Wellhead Pressure
Management Project

12 © 2016 Chevron
Growth
• Major capital projects online
• Shale and tight
Uncertainties / timing
• Divestments
• Price effects
• Spend levels
2015 2016 2017 2018 2019 2020
Growing upstream volume
Projected net production MMBOED
2.62
0-4%
growth*
*Includes estimated impact of divestments

13 © 2016 Chevron
$52/bbl
$60/bbl
$52/bbl
$70/bbl
10
20
30
2015 2017
Growing upstream margin
Projected cash margin* $ per BOE
*Estimated after-tax cash margin based on Chevron’s internal analysis
New barrels accretive
Divestment of
lower margin barrels
Expansion strongly linked
to oil prices
14 © 2016 Chevron
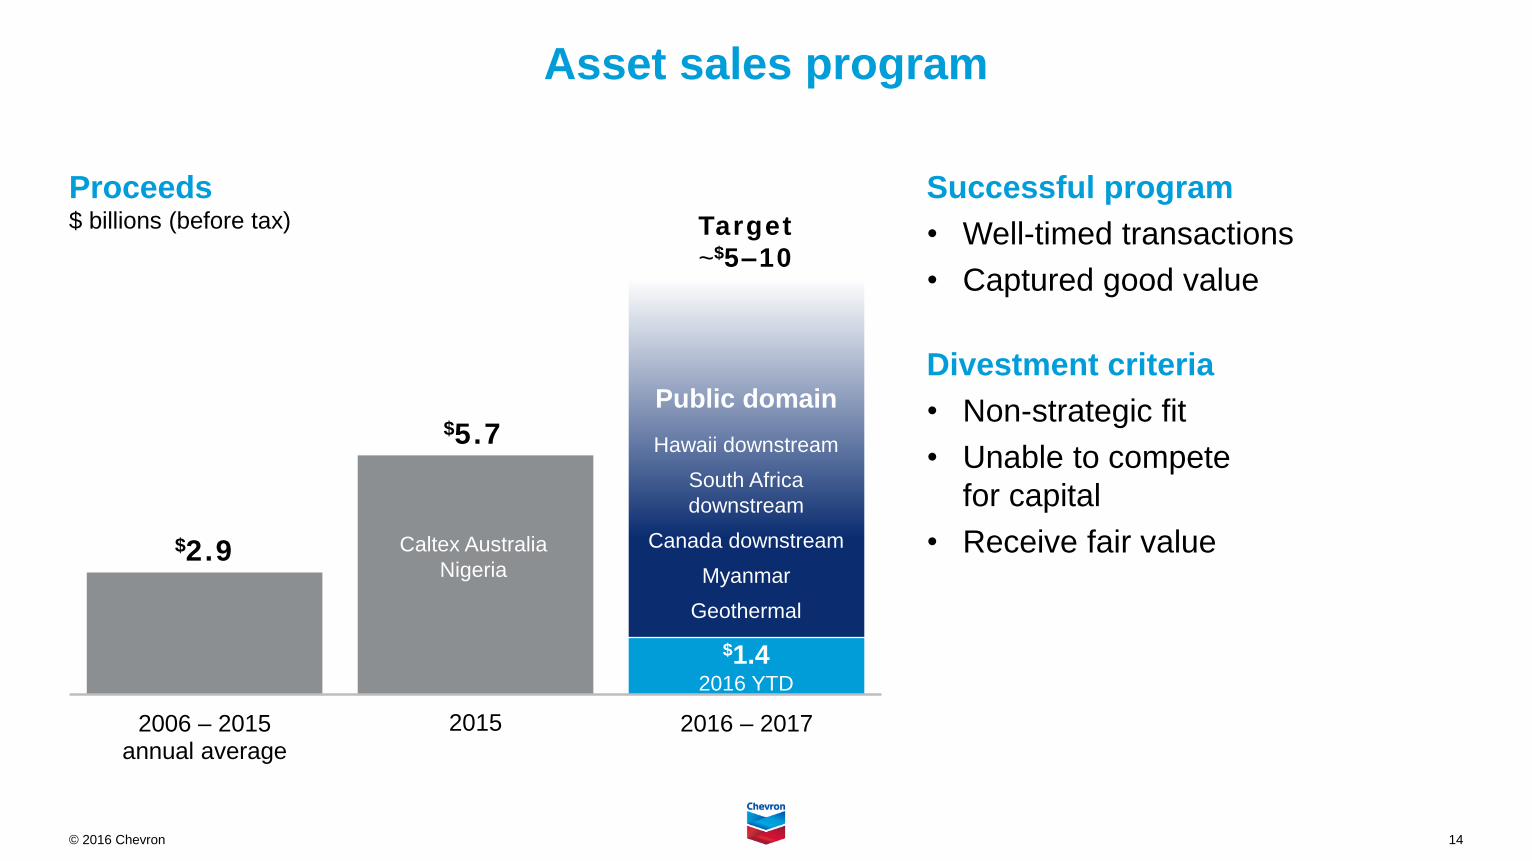
5
10
2006 – 2015 annual average
2015 2016 – 2017
Axis
Tit
le
Asset sales program
Proceeds $ billions (before tax)
Successful program
• Well-timed transactions
• Captured good value
Divestment criteria
• Non-strategic fit
• Unable to compete
for capital
• Receive fair value
Target
~$5–10
Public domain
Hawaii downstream
South Africa
downstream
Canada downstream
Myanmar
Geothermal
$1.4 2016 YTD
$2.9 Caltex Australia
Nigeria
$5.7

15 © 2016 Chevron
BP
XOM
RDS (Post-BG)
TOT
10%
30%
50%
70%
-20 -10 10 20 30 40
Debt capacity: incremental debt capacity to 30% debt ratio ($ billions)
Others: APC, COP, DVN, ENI, EOG, HES, MRO, OXY, STO
Strong balance sheet
Reported annual debt ratio and debt capacity
Source: Public information as of 4Q 2015. ENI based on 3Q 2015 data;
RDS/BG post-deal based on average of analyst estimates
Debt ratio

16 © 2016 Chevron
• Lower pre-productive capital from long-
cycle projects
• More high return, short-cycle and
brownfield spend
• Project execution improvements
• Lower unit operating expense
• Oil-price exposure 5
10
15
5-year 1-year
Source: Adjusted ROCE analysis as of 4Q15 based on Chevron estimates and public information treated on a
consistent basis. Excludes special items. S&P on non-adjusted reported basis.
Pathway to improve returns
Adjusted ROCE Percent
Competitors: BP, RDS, TOT, XOM S&P 500

17 © 2016 Chevron © 2016 Chevron Corporation
Upstream

18 © 2016 Chevron
Source: Wood Mackenzie. Estimate of remaining reserves (on a reported basis) as of 1/1/2016; does not include
sub-commercial resources defined as an estimate of discovered resources not expected to be developed in the
near-term
Upstream portfolio
Strategically positioned geography Percent of total commercial reserve portfolio
Strong, flexible portfolio
• World class legacy assets
• Premier shale positions
• Outstanding mature assets
• Strong deepwater holdings
Competitors: BP, RDS, TOT, XOM CVX
39% 23%
US
7% 12%
Canada
15% 15%
Africa /Latin America
27%
12%
Asia / Oceania
0% 12%
Russia2% 8%
Europe 8% 5%
Caspian
2% 13%
Middle East

19 © 2016 Chevron
Strong reserves performance
Reserve
replacement ratio
107%
1 year
113%
5 year
5 year reserve replacement BBOE
Additions Production
(4.8) 5.6
Asset
sales
10.5 11.2
2010 2015
(0.2)
Numbers do not add due to rounding

20 © 2016 Chevron
2015
Resource
additions
Leading exploration performance
1
2
3
4
$1.22
11.3 BBOE
Resource* adds
10 year total
2006–2015
Unit finding cost
in 2015
62%
Success rate
10 year average
2006–2015
1.8
$1.73
BBOE
Resource* adds
in 2015
57%
Success rate
in 2015
Unit finding cost
10 year average
2006–2015
Source: Wood Mackenzie Company Exploration Benchmarking October 2015 * Recoverable resources as defined in the Supplement to the Annual Report
Competitor range: BP, RDS, TOT, XOM
Discovery costs 2005–2014
$/BOE

21 © 2016 Chevron
Improving efficiency
Deepwater Gulf of Mexico
• Intelligent well completions
enhance economic recovery
• Basin experience and
standardization improving
performance
Technology
• 30% production increase from
artificial intelligence
techniques in California
• 2,000+ critical rotating
machines centrally monitored
Tengiz
• New well stimulation method
reduced costs ~70%
• Debottlenecking increased
production capacity ~16 MBOPD
Average days per 10,000 feet drilled
2013 2014 20152014 2013 2015
Transportation cost reduction
~25%
83 77 59 41
2014 competitor
average 2015
competitor average
2012 2014 2013 2015

22 © 2016 Chevron
Gorgon / Wheatstone
Gorgon
• Train 1
– Current rate ~90 MBOED
– Producing at 70% capacity
– Full capacity expected by 4Q16
• Train 2 first LNG early 4Q16
• Train 3 first LNG 2Q17
Wheatstone
• All 9 wells flow tested and ready for production
• Plant structural, piping and cabling work
currently ahead of plan
• Train 1 first LNG expected mid-2017
• Train 2 first LNG expected 6-8 months after
Train 1

23 © 2016 Chevron
Other 2016 start-ups
Mafumeira Sul • All four platforms installed
• Hook-up & commissioning ongoing
• First production expected 2H 2016
Chuandongbei • All three trains online
Alder • First production
expected 2H 2016
Bangka • First production
expected 2H 2016
Angola LNG • Achieved 75% capacity
• Four LNG cargoes shipped post restart
• Planned shut-down for strainer maintenance is underway
• Sustained production expected 3Q16

24 © 2016 Chevron
Leveraging Permian performance to other shale & tight assets
Duvernay
• Appraisal program advancing
• Best-in-class drilling; days per
well reduced ~35%
• Unit development cost
decreased ~35%
Appalachia
• Pacing investment
• Well costs reduced ~35%
• Cycle time shortened ~45%
• EUR increased ~30%
• Unit development cost
decreased ~40%
Vaca Muerta
• Initiated horizontal factory mode
• Horizontal well costs reduced ~20%
• Improved well designs have
achieved IP rates ~800 BOED
• Unit development cost
decreased ~30%
Appalachia baseline 1Q 2014 Duvernay baseline 2H 2014 Vaca Muerta baseline 4Q 2014

25 © 2016 Chevron
Competitive Permian growth
Advantaged acreage
• ~2 MM acres
‒ 1 MM acres in Delaware Basin
‒ 0.5 MM acres in Midland Basin
• ~85% no or low royalty
• ~9 BBOE resource1
1 Potentially recoverable resources as defined in the Supplement to the Annual Report
2 Figures reflect cumulative well counts for ~30% of operated acreage
Breakevens per Wood Mackenzie definition: 10% rate of return at flat real oil price 3 Per Wood Mackenzie, top eight acreage holders in the Delaware and Midland Basins 4 Reflects CVX shale and tight production only
500 1000 1500 2000
Midland & Delaware net acres3 (1000 acres)
Chevron
Net production4 – Midland & Delaware MBOED
100
200
300
400
2014 2015 2016 2017 2018 2019 2020
Base decline Growth Growth range Actual production
Chevron
2015 2017 2016 2018 2020 2019
1,300
4,000
5,500
<$40 <$50 <$60
Breakevens2 $ WTI

26 © 2016 Chevron
$0
$5
$10
$15
$20
2Q15 3Q15 4Q15 1Q16 2Q16
Chevron operated Non-operated JV
Competitive Permian growth
Well information Total D&C ($MM)
Pad Lateral (ft.) Best Avg
Salado Draw 5,000 3.5 3.7
Bradford Ranch 7,500 5.5 5.6
Greater Bryant G 7,500 4.9 5.6
Greater Bryant G 10,000 6.7 7.2
Recent CVX cost performance2 (YTD 2016)
1 Includes drilling, completion, facilities, and G&A costs 2 Includes drilling and completion costs only
Competitive development costs
• Paced, efficient development of
prioritized queue
• JV and industry best practices have
allowed accelerated learning
• EUR performance on target
Improvements continue
• Cost reductions in both drilling and
completions
• Characterization of our acreage
• Future developments will benefit from
infrastructure investments made today
Average development cost1
$/BOE

27 © 2016 Chevron
Base projects
Well factories
• Gulf of Thailand
• San Joaquin Valley
• Indonesia
Asset enhancements
• Infill drilling
• Debottlenecking and
reliability upgrades
Base deepwater
• Focused on development of
existing assets
• Agbami, Tahiti, Jack / St. Malo,
Caesar Tonga, Mad Dog
Platong II Tahiti Tengizchevroil Second Generation Project

28 © 2016 Chevron
FGP / WPMP
Final investment decision (FID) in July
Wellhead Pressure Management Project
(WPMP)
• Lower back-pressure on wells to maintain
the existing plants at full capacity
Future Growth Project (FGP)
• Increasing capacity ~260 MBOED utilizing
proven technology
• Improves reservoir recovery
• Extends the production plateau by
increasing TCO gas handling capability
Expected incremental recovery ~2 BBOE
Production profile
All figures shown are TCO 100%
Original Plant
Second
Generation Plant WPMP
FGP
Start-up in 2022

29 © 2016 Chevron
FGP / WPMP financials
Project cost
• Total: $36.8 B
– Facilities: $27.1 B
– Wells: $3.5 B
– Contingency / Escalation: $6.2 B
• ~$18/BOE project development cost
Financing in place
Accommodation building construction All figures shown are TCO 100%

30 © 2016 Chevron
FGP / WPMP execution readiness
Project engineers assigned to equipment packages from design
through start-up; Quality Control personnel co-located at main factories
5,300 camp beds available now; dredging ~50% complete;
fabrication starts after 90% model review
Module fabricator involved in early design; integration of owner and
EPC teams; matching scope of work to contractor capabilities
Process design and specifications of major equipment verified;
facilities hazard & operability studies complete at FID
Strengthening design
assurance
Optimizing contracting
strategy
Verifying execution
readiness
Improving quality
management
Engineering > 50% at FID; underground piping, electrical and
foundations in 3D model; 85% of equipment on order at FID
Increasing engineering
maturity at FID
Critical lessons learned incorporated into FGP / WPMP design and planning

31 © 2016 Chevron
FGP / WPMP
Builds on previous successes
• Great partnership
• World class reservoir
• Proven technology
Now is the time
• Reservoir pressure decline
• Capture market opportunities
• Project synergies
Upside potential
• Future infill wells
• Debottlenecking opportunities

32 © 2016 Chevron
Future major
capital project
Shale & tight
Conventional
exploration &
appraisal wells
Liard Basin
Horn River Basin
Duvernay Marcellus
Utica
Bonga SW / Aparo
Captain EOR
TCO FGP / WPMP
Gendalo-Gehem
Midland &
Delaware Basins
Rosebank
Tahiti Vertical Expansion
Mad Dog 2 Wafra
Steamflood
Vaca Muerta
Kurdistan Region of Iraq
Deepwater
Gulf of Mexico Suriname
Republic of Congo
Nigeria
Western Australia
Bight Basin
Kitimat
LNG
Ubon
Tahiti Upper Sands Development
Future opportunity queue
Agbami Infill

33 © 2016 Chevron © 2016 Chevron Corporation
Downstream & Chemicals
34 © 2016 Chevron
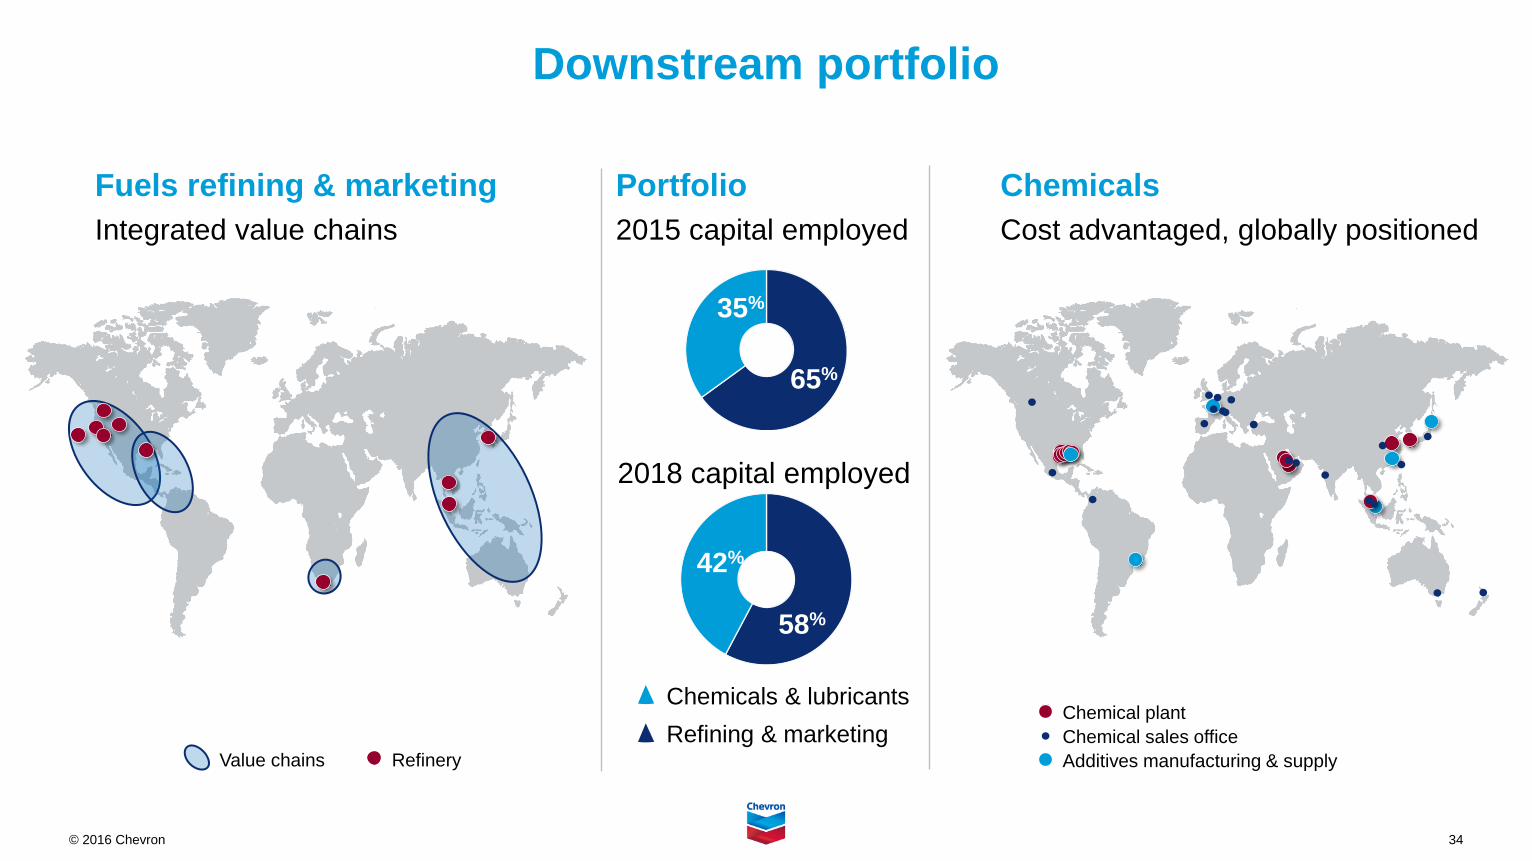
Downstream portfolio
Chemicals
Cost advantaged, globally positioned
Fuels refining & marketing
Integrated value chains
Portfolio
2015 capital employed
Chemicals & lubricants
Refining & marketing
35%
65%
2018 capital employed
42%
58%
Chemical plant
Chemical sales office
Additives manufacturing & supply Value chains Refinery

35 © 2016 Chevron
Strategy focused on competitive returns
Deliver competitive returns and grow
earnings across the value chain
• Improve operational excellence
• Grow higher return segments
– Petrochemicals
– Lubricants and additives
• Focused refining and marketing
• Integration with upstream
• Increase near-term cash

36 © 2016 Chevron
0% 5%
Gasoline
Distillate
Finished Lubricants
Additives
Petrochemicals*
Premium Base Oil
Demand growth points to attractive segments
2015–25 global product demand growth Compound annual growth rate
2015-25 global fuels demand growth MMBD
Distillate Gasoline
Source: NexantThinking™, Kline & Company, Wood Mackenzie and Chevron estimates *Ethylene, propylene, butadiene, benzene, and paraxylene
-2
0
2
4
6
NorthAmerica
Europe /Middle East
LatinAmerica
Asia Pacific

37 © 2016 Chevron
Levels the playing field
• U.S. light-sweet crude gets global
parity pricing
• U.S. heavy coking margins improve
relative to U.S. light cracking margins
• Minimal impact to California refiners
Impact of lifting the U.S. crude export ban
2015 U.S. crude capacity by region
Source: EIA as of November 2015
50%
100%
Chevron Industry
East coast West coast Gulf coast Mid-continent

38 © 2016 Chevron
Chevron Phillips Chemical USGC petrochemicals project
Overview
• 1,500 kMTA ethylene, Baytown, Texas
• 1,000 kMTA polyethylene, Old Ocean, Texas
– 500 kMTA HDPE
– 500 kMTA LDPE
• Advanced proprietary technology
Progress
• ~80% complete (>6,000 people onsite)
• Polyethylene reactors in-place
• Ethylene major compressors in place; furnace
erection in progress
• Projected start-up 2017