Embed Size (px)
Citation preview
Abstract — Although the use of crop residues to enhance soil
fertility has been suggested over the years, little is known about the nutrient composition of these residues as affected by specific nutrient management strategies. A study was conducted at the Soil Research Institute, Kwadaso, Ghana to examine the chemical properties of maize residues after application of different nutrient sources. The study was a field experiment arranged in a randomized complete block design. The treatments considered were application of poultry manure (PM), poultry manure + chemical fertilizer (PM + CF), chemical fertilizer (CF) and a control. Crop residues under CF application recorded the highest total N, P, K contents of 0.90%, 0.14%, and 1.19%, respectively. There were virtually no observable treatment effects on K, Ca and Mg contents of residues. The highest polyphenol (6.90%) and lignin (17.21%) contents were recorded under CF and PM + CF applications, respectively. The polyphenol: N ratios ranged from 7.7 in CF treated residues to 8.3 in residues on control plots. The study indicated that chemical fertilizer treated residues generally have higher nutrients composition and could have faster decomposition rate because of their lower polyphenol: N ratio than residues from all treated and untreated plots.
Index Terms—Crop residues, nutrient sources, polyphenol and soil fertility
I. INTRODUCTION The role of crop residues in soil fertility maintenance is
becoming increasingly important in both organic farming and conventional agriculture. With the current skyrocketing prices of mineral fertilizers, most resource poor farmers would have no other option than to embrace the use of crop residues on their fields. [14] and [5] reported that in agricultural systems in the tropics, there is an increasing interest in using crop residues for improving soil productivity which can reduce the use of external inputs of inorganic fertilizer. These crop residues are in sufficient abundance in farmers' fields at the end of a growing season and play an important role in soil fertility management through their short term effects on nutrient supply and longer term contribution to soil organic matter [10]. However, there is insufficient data on the nutrient composition of these residues following soil amendments. An adequate knowledge of the nutrient composition and other chemical properties of crop residues would not only help to anticipate their contribution to short term release of nutrients but would also go a long way to
Manuscript received July 29, 2011, revised September 14, 2011. This
work was supported by the Ghana Education Trust Fund (GETFUND) through the KNUST Scholarship.
V. Logah, Lecturer, is with Dept. of Crop and Soil Sciences, Kwame Nkrumah University of Science and Technology (KNUST), Kumasi, Ghana. (e-mail: [email protected]; [email protected].)
enhance their better management and discourage their disposal from farms through burning and baling. According to [3], the use of crop residues has not been adopted by most tropical farmers, partly because they are not adequately informed about the nutrient values of these residues. The objective of this study was therefore, to examine the nutrient value of maize residues under different nutrient managements in a tropical climate.
II. MATERIALS AND METHODS
A. Study Site The study was conducted at the Soil Research Institute in
Kwadaso, Kumasi (060.39’ and 060.43’ N, and 010.39’and 010.42’ W). The area is located in the semi – deciduous forest zone of Ghana and is characterized by a bimodal rainfall distribution. The major rainy season starts from March - July whilst the minor season starts from September – November. Generally, the area receives a mean annual rainfall of 1500 mm with an average monthly temperature range of 24 – 28 0C. The soil is a sandy loam classified as Ferric Acrisol according to [4] equivalent to Typic Haplustult in the [15] soil classification system.
B. Experimental Design/Treatments The field experiment was carried out in 2006 and 2007 and
was laid in a randomized complete block design (RCBD) with three replications. The treatments consisted of poultry manure (PM) at 4 t/ha, chemical fertilizer (CF) at 90 -60 -60 kg/ha NPK 15-15-15, complementary application of PM and CF at 2 t/ha PM + 45 – 30 – 30 kg/ha NPK 15-15-15 and a control (No NPK, No PM). The treatments effects were tested under continuous maize cropping system. The maize crop (Dorke SR) was an early maturing variety of 90 days. The seeds were sown at 80 cm x 40 cm at 3 seeds/ hill and were thinned to two per hill one week after germination. The amendments (PM, PM + CF, and CF) were applied by side placement to their respective treatment plots two weeks after planting (WAP). However, the control plots did not receive any amendment. At five WAP, plots amended with PM + CF, and CF were ‘top dressed’ with N.
C. Initial Soil Characterization To assess the nutrient status of the soil before cropping,
soil samples were randomly taken at a depth of 0 – 15 cm from the plots within each block and bulked as three composite samples, representative of the block. These were then subjected to analysis after air – drying, crushing and sieving through a 2 mm sieve. Soil pH was determined in a 1:2.5 soil: water suspension using a H1 9017 Microprocessor
Chemical Properties of Maize Residues under Application of Organic and Inorganic Nutrient Sources
V. Logah
International Journal of Environmental Science and Development, Vol. 2, No. 5, October 2011
344
pH meter. Soil organic carbon and total nitrogen were determined by
the Walkley and Black method and Kjeldahl digestion and distillation procedure, respectively. Available phosphorus was determined by the blue ammonium molybdate method with ascorbic acid as the reducing agent using a spectronic 21 D spectrophotometer at a wavelength of 660 nm.
Exchangeable bases (calcium, magnesium, potassium and sodium) in the soil were determined in 1.0 M ammonium acetate extract. Calcium and magnesium were determined by the method of titrimetry whilst the potassium and sodium were determined by the flame photometry procedure.
D. Poultry Manure Characterization Poultry manure which was applied as an amendment was
obtained from Mfum farms, Mim, along the Nkawie road in the Ashanti region of Ghana. Before application, a representative sample was taken, dried in the oven at 40 oC [2] and ground to pass through a 1 mm sieve. Organic carbon, total nitrogen, phosphorus, potassium, calcium, polyphenol and lignin contents were determined and used to assess the quality of the manure.
E. Sampling and Laboratory Analyses of Maize Residues Leaves were sampled from ten maize plants at harvest. The
ten plants were selected at random from the middle rows of each plot. These were dried in the oven at 70 0C and milled to pass through a 1 mm sieve.
F. Organic Carbon Organic carbon was determined using the dichromate –
acid oxidation method. Ten millilitres (10 ml) each of concentrated sulphuric acid, 0.5 N potassium dichromate solution and concentrated orthophosphoric acid were added to 0.05 g of sample in Erlenmeyer flask. The solution was allowed to stand for 30 minutes after addition of distilled water and was back titrated with 0.5 N ferrous sulphate solution with diphenylamine indicator.
The organic carbon content was calculated from the equation:
%carbon = w
1.3100103)( 3 ××××−× −baN
where N = normality of ferrous sulphate
a = ml ferrous sulphate solution required for sample titration b = ml ferrous sulphate solution required for blank titration
w = weight of oven- dried sample in gram 3 = equivalent weight of carbon 1.3 = compensation factor allowing for incomplete combustion.
G. Total Nitrogen Total N was determined by the Kjeldahl method. Twenty
grams oven-dried maize residue was ground in a stainless steel hammer mill and passed through a 1 mm sieve. A 0.5 g sample was digested in a 10 ml concentrated sulphuric acid with selenium mixture as catalyst. The resulting clear digest was transferred into a 100 ml conical flask and made to
volume with distilled water. A 5 ml aliquot of the sample and a blank were pipetted into the Kjeldahl distillation apparatus separately and 10 ml of 40 % NaOH solution was added followed by distillation. The evolved ammonia gas was trapped in a 25 ml of 2 % boric acid. The distillate was titrated with 0.1 M HCl with bromocresol green-methyl red as indicator [13]. Calculation:
% N/DM = w
f1.4b)(a ×××− M
where a = ml HCl used for sample titration b = ml HCl used for blank titration M = molarity of HCl 1.4 = 14 × 0.001 × 100 % (14 = atomic weight of N) DM = dry matter w = weight of sample f = moisture correcting factor
H. Total P, K, Na, Ca and Mg In the determination of phosphorus, potassium, sodium,
calcium and magnesium, a 0.5 g of the crop residues was ashed in a muffle furnace, after which the ash was dissolved in 1.0 M HCl solution and filtered. The filtrate was diluted to 100 ml with distilled water. For phosphorus determination, a 5 ml aliquot of the filtrate was pipetted into a 25 ml volumetric flask. Five millilitres of ammonium vanadate solution and 2 ml stannous chloride solution were added. The volume was made up to 25 ml with distilled water and allowed to stand for 15 minutes for full colour development. A standard curve was developed concurrently with phosphorus concentrations ranging from 0, 5, 10, 15 to 20 mg P/kg organic material. The absorbance of the sample and standard solutions were read on a spectronic 21D spectrophotometer at a wavelength of 470 nm. The absorbance values of the standard solutions were plotted against their respective concentrations to obtain a standard curve from which phosphorus concentrations of the samples were determined.
Potassium and sodium in the leachate were determined using a Gallenkamp flame analyzer. Standard solutions of potassium and sodium were prepared with concentrations of 0, 20, 40, 60, 80 and 100 mg/litre of solution. The emission values which were read on the flame analyzer were plotted against their respective concentrations to obtain standard curves.
A 10 ml aliquot of the ash solution was pipetted into an Erlenmeyer flask. One millilitre each of potassium cyanide and potassium ferrocyanide solutions was added to complex interfering Cu and Fe. To determine calcium + magnesium concentration, the solution was titrated with 0.01 M EDTA solution in the presence of Eriochrome Black T indicator. In calcium determination, potassium hydroxide solution (5 ml) was added to raise the pH to 12 so as to precipitate magnesium, leaving calcium in solution. The solution was titrated with EDTA using murexide as indicator. The
International Journal of Environmental Science and Development, Vol. 2, No. 5, October 2011
345
difference between the first and second titres represents magnesium concentration in the solution.
I. Polyphenol One gram of dried, milled maize residue was weighed
into 50 ml separate conical flasks. Ethanol (20 ml) was added to the organic material and heated to a temperature of 60 oC to extract the polyphenol. The extraction was repeated after the alcohol extract was decanted into another flask. After the third extraction, the volume of the extract was made to 50 ml by adding ethanol. Standard solutions of tannic acid (with concentrations of 0, 20, 40, 80 and 100 mg tannic acid per litre) were prepared. The samples and tannic acid standards were subjected to colour development. Absorbance values of the standard and sample solutions were read on a spectronic 21D spectrophotometer at a wavelength of 760 nm. A standard curve was obtained by plotting absorbance values against concentrations of the standard solutions and used to determine sample solution concentrations. Calculations:
Polyphenol (mg/kg) = graph reading × sample dilution × aliquot dilution
where sample dilution = final volume/weight of sample = 50/1 aliquot dilution = 50/1 (1 ml of initial 50 ml extract was put in a 50 ml flask and made to the 50 ml mark with ethanol. i.e. 50/1)
J. Soluble organic Fraction and Lignin 1) Soluble organic fraction (lipids and sugars)
One gram of organic residue was extracted for 1 hour with 20 ml of ethanol: benzene (1:1, v: v) in a sealed pyrex tube at a temperature of 60 oC, cooled and centrifuged. This was repeated twice and the combined extract evaporated slightly and made to 50 ml in a flask. Ten mililitres aliquot was taken for dry weight determination which was taken as lipid fraction [8]. The residue was hydrolyzed at 100 oC (for 1 h) with 25 ml of 1.0 N sulphuric acid in a sealed pyrex tube, cooled and centrifuged. The supernatant solution was saved in another container and the process repeated with two washings of distilled water to remove most of the sulphuric acid from the residue. A 10 ml aliquot was taken for dry weight determination which was considered as the sugar fraction. 2) Lignin
After the alcohol and dilute sulphuric acid extraction, 2 ml of 72 % sulphuric acid was added to the residue and shaken for 4 hours. The solution was transferred into a 100 ml Erlenmeyer flask with 40 ml distilled water, and was filtered after having boiled for 2 hours. Sugar which represents cellulose was determined in the hydrolysate. The residue was washed with water, dried at 60 oC for 48 hours, weighed and then ashed in a muffle furnace. The lignin content of the residue was considered as the loss in weight on ignition.
K. Data analysis The experimental data was analysed in ANOVA using the
[7] statistical package. Treatments means were compared using the Least Significant Difference method at P = 0.05.
III. RESULTS
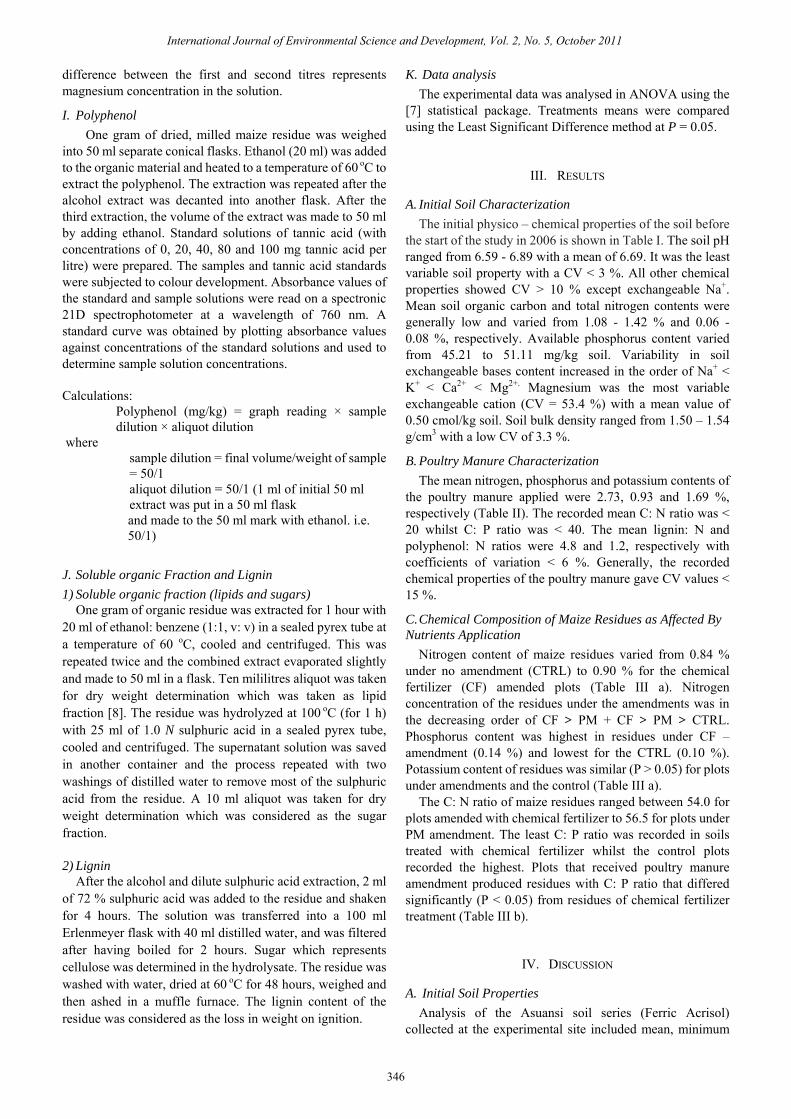
A. Initial Soil Characterization The initial physico – chemical properties of the soil before
the start of the study in 2006 is shown in Table I. The soil pH ranged from 6.59 - 6.89 with a mean of 6.69. It was the least variable soil property with a CV < 3 %. All other chemical properties showed CV > 10 % except exchangeable Na+. Mean soil organic carbon and total nitrogen contents were generally low and varied from 1.08 - 1.42 % and 0.06 - 0.08 %, respectively. Available phosphorus content varied from 45.21 to 51.11 mg/kg soil. Variability in soil exchangeable bases content increased in the order of Na+ < K+ < Ca2+ < Mg2+. Magnesium was the most variable exchangeable cation (CV = 53.4 %) with a mean value of 0.50 cmol/kg soil. Soil bulk density ranged from 1.50 – 1.54 g/cm3 with a low CV of 3.3 %.
B. Poultry Manure Characterization The mean nitrogen, phosphorus and potassium contents of
the poultry manure applied were 2.73, 0.93 and 1.69 %, respectively (Table II). The recorded mean C: N ratio was < 20 whilst C: P ratio was < 40. The mean lignin: N and polyphenol: N ratios were 4.8 and 1.2, respectively with coefficients of variation < 6 %. Generally, the recorded chemical properties of the poultry manure gave CV values < 15 %.
C. Chemical Composition of Maize Residues as Affected By Nutrients Application
Nitrogen content of maize residues varied from 0.84 % under no amendment (CTRL) to 0.90 % for the chemical fertilizer (CF) amended plots (Table III a). Nitrogen concentration of the residues under the amendments was in the decreasing order of CF > PM + CF > PM > CTRL. Phosphorus content was highest in residues under CF – amendment (0.14 %) and lowest for the CTRL (0.10 %). Potassium content of residues was similar (P > 0.05) for plots under amendments and the control (Table III a).
The C: N ratio of maize residues ranged between 54.0 for plots amended with chemical fertilizer to 56.5 for plots under PM amendment. The least C: P ratio was recorded in soils treated with chemical fertilizer whilst the control plots recorded the highest. Plots that received poultry manure amendment produced residues with C: P ratio that differed significantly (P < 0.05) from residues of chemical fertilizer treatment (Table III b).
IV. DISCUSSION
A. Initial Soil Properties Analysis of the Asuansi soil series (Ferric Acrisol)
collected at the experimental site included mean, minimum
International Journal of Environmental Science and Development, Vol. 2, No. 5, October 2011
346
and maximum values of the soil parameters ( 1). The recorded low soil organic C and total N contents were by virtue of high temperatures resulting in rapid organic C decomposition coupled with a generally low input of organic material at the study area. Organic matter is closely associated with the nutrient status of soil because it contributes much to the soil CEC [12]. It is also an important source of inorganic nutrients for production in natural and managed ecosystems [6]. The low ECEC recorded in Table I was due to the low organic carbon content of the soil. The recorded mean pH value was near neutral. This was by virtue of the medium exchangeable calcium content of the soil. [1] reported pH of 6.4 on top soils of Asuansi soil series (Ferric
Acrisol) in Ghana.
B. Poultry Manure The mean C: N ratio of 12.9 recorded for poultry manure
(Table II) was low (less than 20 according to [11]). This indicates that the manure used in this study was of high quality. Another parameter indicating quality of organic materials was the C: P ratio. The higher C: P ratio recorded for the maize residues (Table III b) than for the poultry manure suggested that the poultry manure was of higher quality than the maize residues. An organic material of C: P ratio less than 300 is of high quality [16].
TABLE I: DESCRIPTIVE STATISTICS OF THE INITIAL SOIL PROPERTIES TAKEN AT THE STUDY SITE Soil property Min Max Mean SD CV *
Soil pH 6.59 6.89 6.69 0.17 2.5 SOC (%) 1.08 1.42 1.36 0.42 30.9 Total N (%) 0.06 0.08 0.07 0.01 12.5 Available P (mg/kg soil) 45.21 51.11 45.13 4.69 10.4 Exchangeable cations (cmol/kg ) K+ 0.33 0.43 0.38 0.05 13.4 Ca2+ 5.60 7.04 5.71 1.05 18.4 Mg2+ 0.25 0.87 0.50 0.27 53.4 Na+ 0.11 0.12 0.12 0.01 8.3 Al3+ + H+ 0.10 0.15 0.12 0.02 16.7 ECEC (cmol/kg soil) 6.39 8.61 6.83 0.79 11.6 Bulk density (g/cm3) 1.52 1.54 1.50 0.05 3.3
*Coefficient of variation (CV) expressed in percentage, SD: standard deviation, SOC: soil organic carbon, ECEC: effective cation exchange capacity, values are means of three replications.
TABLE II: CHEMICAL PROPERTIES OF THE POULTRY MANURE USED IN THE STUDY
Chemical property Min Max Mean SD CV*
Total Nutrients (%) N 2.69 2.77 2.73 0.05 1.8 P 0.87 1.00 0.93 0.07 7.5 K 1.60 1.83 1.69 0.12 7.1 Ca 2.00 2.40 2.10 0.26 12.4 Mg 0.94 1.22 1.11 0.15 13.5 Na 0.71 0.92 0.80 0.11 13.8 Polyphenol (%) 3.25 3.53 3.36 0.15 4.4 Lignin (%) 12.70 13.30 13.00 0.30 2.3 OC (%) 34.99 35.00 35.13 0.33 0.9 C:N ratio 12.8 13.0 12.9 0.21 1.6 C:P ratio 35.0 40.7 37.8 2.86 7.6 Lignin:N ratio 4.6 4.8 4.8 0.10 2.0 Polyphenol:N ratio 1.2 1.3 1.2 0.07 5.8
Values are means of three replications, * CV: coefficient of variation expressed in percentage, SD: standard deviation, OC: organic carbon.
International Journal of Environmental Science and Development, Vol. 2, No. 5, October 2011
347
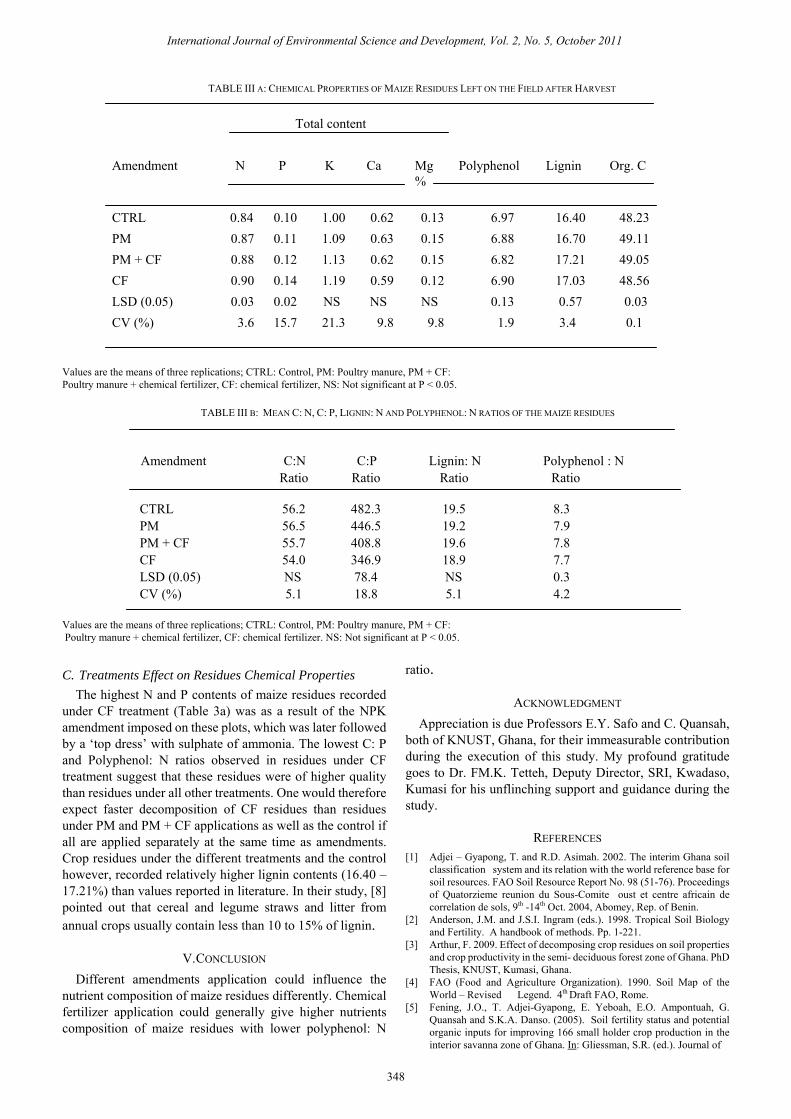
TABLE III A: CHEMICAL PROPERTIES OF MAIZE RESIDUES LEFT ON THE FIELD AFTER HARVEST
Total content Amendment N P K Ca Mg Polyphenol Lignin Org. C % CTRL 0.84 0.10 1.00 0.62 0.13 6.97 16.40 48.23 PM 0.87 0.11 1.09 0.63 0.15 6.88 16.70 49.11 PM + CF 0.88 0.12 1.13 0.62 0.15 6.82 17.21 49.05 CF 0.90 0.14 1.19 0.59 0.12 6.90 17.03 48.56 LSD (0.05) 0.03 0.02 NS NS NS 0.13 0.57 0.03 CV (%) 3.6 15.7 21.3 9.8 9.8 1.9 3.4 0.1
Values are the means of three replications; CTRL: Control, PM: Poultry manure, PM + CF: Poultry manure + chemical fertilizer, CF: chemical fertilizer, NS: Not significant at P < 0.05.
TABLE III B: MEAN C: N, C: P, LIGNIN: N AND POLYPHENOL: N RATIOS OF THE MAIZE RESIDUES
Amendment C:N C:P Lignin: N Polyphenol : N
Ratio Ratio Ratio Ratio CTRL 56.2 482.3 19.5 8.3 PM 56.5 446.5 19.2 7.9 PM + CF 55.7 408.8 19.6 7.8 CF 54.0 346.9 18.9 7.7 LSD (0.05) NS 78.4 NS 0.3 CV (%) 5.1 18.8 5.1 4.2
Values are the means of three replications; CTRL: Control, PM: Poultry manure, PM + CF: Poultry manure + chemical fertilizer, CF: chemical fertilizer. NS: Not significant at P < 0.05.
C. Treatments Effect on Residues Chemical Properties The highest N and P contents of maize residues recorded
under CF treatment (Table 3a) was as a result of the NPK amendment imposed on these plots, which was later followed by a ‘top dress’ with sulphate of ammonia. The lowest C: P and Polyphenol: N ratios observed in residues under CF treatment suggest that these residues were of higher quality than residues under all other treatments. One would therefore expect faster decomposition of CF residues than residues under PM and PM + CF applications as well as the control if all are applied separately at the same time as amendments. Crop residues under the different treatments and the control however, recorded relatively higher lignin contents (16.40 – 17.21%) than values reported in literature. In their study, [8] pointed out that cereal and legume straws and litter from annual crops usually contain less than 10 to 15% of lignin.
V. CONCLUSION Different amendments application could influence the
nutrient composition of maize residues differently. Chemical fertilizer application could generally give higher nutrients composition of maize residues with lower polyphenol: N
ratio.
ACKNOWLEDGMENT Appreciation is due Professors E.Y. Safo and C. Quansah,
both of KNUST, Ghana, for their immeasurable contribution during the execution of this study. My profound gratitude goes to Dr. FM.K. Tetteh, Deputy Director, SRI, Kwadaso, Kumasi for his unflinching support and guidance during the study.
REFERENCES [1] Adjei – Gyapong, T. and R.D. Asimah. 2002. The interim Ghana soil
classification system and its relation with the world reference base for soil resources. FAO Soil Resource Report No. 98 (51-76). Proceedings of Quatorzieme reunion du Sous-Comite oust et centre africain de correlation de sols, 9th -14th Oct. 2004, Abomey, Rep. of Benin.
[2] Anderson, J.M. and J.S.I. Ingram (eds.). 1998. Tropical Soil Biology and Fertility. A handbook of methods. Pp. 1-221.
[3] Arthur, F. 2009. Effect of decomposing crop residues on soil properties and crop productivity in the semi- deciduous forest zone of Ghana. PhD Thesis, KNUST, Kumasi, Ghana.
[4] FAO (Food and Agriculture Organization). 1990. Soil Map of the World – Revised Legend. 4th Draft FAO, Rome.
[5] Fening, J.O., T. Adjei-Gyapong, E. Yeboah, E.O. Ampontuah, G. Quansah and S.K.A. Danso. (2005). Soil fertility status and potential organic inputs for improving 166 small holder crop production in the interior savanna zone of Ghana. In: Gliessman, S.R. (ed.). Journal of
International Journal of Environmental Science and Development, Vol. 2, No. 5, October 2011
348

Sustainable Agriculture 25: (4) 69 – 91. [6] Fritzsche, F., D. Solomon, J. Lehmann, M. Tekalian and W. Zech. 2002.
Soil organic matter dynamics in the sub-humid agroecosystems of the Ethiopian highlands. Soil Science Society of American Journal 66: 969 – 978.
[7] GenStat. 2007. GenStat Release 7.2 DE (PC/Windows XP), Lawes Agricultural Trust (Rothamsted Experimental Station).
[8] Heal, O.W., J.M. Anderson and M.J. Swift. (1997). Plant litter quality and decomposition: An historical overview. In: Cadisch, G. and Giller, K.E. (eds.). Driven by nature, plant litter quality and decomposition. CAB International, Wallingford, UK, pp. 3 − 30.
[9] Kachaka, S., B. Vanlauwe and R. Merckx. 1993. Decomposition and nitrogen mineralization of prunnings of different quality. In: Molungoy, K. and R. Merckx. (eds.). Soil organic matter dynamics and sustainability of tropical agriculture. John Willey and Sons Ltd.
[10] Karanja, N.K., Ajuke, F.O. and Swift, M.J. (2006). Organic resources quality and soil fauna: their role on the microbial biomass,
decomposition and nutrient release patterns in Kenyan soils. Tropical and Subtropical Agroecosystems 6: 73 − 86.
[11] Lloyd, J.E., D.A. Herms, B.R. Stinner and H.A.J. Hoitink. 2003. Organic mulches enhance overall plant growth. Turfgrass Trends Magazine, www.turfgrasstrends.com.
[12] Magdoff, F. and R.J. Bartlett. 1985. Soil pH buffering revisited. Soil Sci. Soc. Am. J. 62: 145-148.
[13] Soils Laboratory Staff. Royal Tropical Institute. 1984. Analytical methods of the service laboratory for soil, plant and water analysis. Part 1: Methods for soil analysis. Royal Tropical Institute. Amsterdam.
[14] Tetteh, F.K.M. 2004. Synchronizing nutrient release from decomposing organic materials with crop nutrient demand in the semi- deciduous forest zone of Ghana. PhD Thesis, K.N.U.S.T, Ghana.
[15] USDA (United States Department of Agriculture). 1998. Year Book of Agriculture, Washington.
[16] White, R.E. and A.T. Ayoub. 1983. Decomposition of plant residues of variable C/P ratio and the effect on soil phosphate availability. Plant and Soil 74: 163-73.
International Journal of Environmental Science and Development, Vol. 2, No. 5, October 2011
349