Embed Size (px)
Citation preview

1 April 2015 – 30 September 2018
ECO2 Final Determination Report ECO2 Final Determination Report 01 April 2015 – 30 September 2018
10 April 2019

2
Foreword
Energy efficiency is a key part of government policies for reducing the United Kingdom’s
greenhouse gas emissions. These policies contribute to the government’s wider commitment to
cut greenhouse gases by at least 34% by 2020 and at least 80% by 20501. The Energy Company
Obligation (ECO), first introduced in 2013, is an energy efficiency scheme for Great Britain and
is the main legislative driver for making British homes more energy efficient.
The Department of Business, Energy, and Industrial Strategy (BEIS) was responsible for setting
the overall targets and designing the policy. We, the Office of Gas and Electricity Markets
Authority (‘Ofgem’2) administered ECO on behalf of the Gas and Electricity Markets Authority
(‘GEMA’) in line with the Electricity and Gas (Energy Company Obligation) Order 2014 (the ‘ECO2
Order’).3
The obligation period known as ‘ECO2’ was split into two phases and ran from 1 April 2015 until
31 March 2017. The last phase, known as ‘ECO2t’, was an extension to the preceding obligation
period that ran from 1 April 2017 until 30 September 2018 and provided elements for the
transition to the next phase of the obligation.
Throughout the scheme, the ECO2 Order required that progress reports were sent to the
Secretary of State each month by the administrator. We also published monthly compliance
reports from July 2015 to March 2019 on our website4. The ECO2 Order also required that a final
report is submitted no later than 31 March 2019 setting out whether suppliers achieved the
overall carbon emissions reduction target, overall carbon saving community target5, and overall
home heating cost reduction target for the whole of ECO26. This report concludes the reporting
requirements placed on us and details the final position of ECO at the end of the obligation
period.
David Fletcher –Deputy Director, E-Serve Policy Hub
1 The Carbon Plan: Delivering our low carbon future, December 2011 https://www.gov.uk/government/publications/the-carbon-plan-reducing-greenhouse-gas-emissions--2. 2 The terms ‘GEMA’, ‘the Authority’ and ‘Ofgem’ are used interchangeably. ‘GEMA’ and ‘the Authority’ are terms to
describe the Gas and Electricity Markets Authority. Ofgem is the Office of the Gas and Electricity Markets Authority 3 As amended by The Electricity and Gas (Energy Company Obligation) (Amendment) Order 2017, (the 'ECO2t Order'). A new Order, referred to as the ‘ECO3 Order’, came into force on 3 December 2018 and runs until 31 March 2022. 4 https://www.ofgem.gov.uk/environmental-programmes/eco/contacts-guidance-and-resources/eco-public-reports-and-data/scheme 5 Energy Company Obligation (ECO2) CSCO final report https://www.ofgem.gov.uk/publications-and-updates/energy-company-obligation-eco2-csco-final-report 6 Article 31(6) of the ECO2 Order.

3
Contents
Foreword ...................................................................................................................... 2
Contents ...................................................................................................................... 3
Associated Documents ................................................................................................... 4
Executive Summary ....................................................................................................... 5
1. Legislative Context ............................................................................................... 9
2. Overall Performance ........................................................................................... 12
3. Energy Supplier Performance ............................................................................... 24
4. Monitoring and Compliance .................................................................................. 39
5. Looking Forward................................................................................................. 50
6. Appendix 1: Supplier Licence Compliance .............................................................. 53

4
Associated Documents
The Electricity and Gas (Energy Company Obligation) Order 2014
http://www.legislation.gov.uk/uksi/2014/3219/contents/made
The Electricity and Gas (Energy Company Obligation) (Amendment) Order 2017
http://www.legislation.gov.uk/uksi/2017/490/contents/made
Energy Company Obligation 2015-17 (ECO2) Guidance: Administration (version 1.1)
https://www.ofgem.gov.uk/publications-and-updates/energy-company-obligation-
2015-17-eco2-guidance-administration
Energy Company Obligation 2015-17 (ECO2) Guidance: Delivery (version 1.1)
https://www.ofgem.gov.uk/publications-and-updates/energy-company-obligation-
2015-17-eco2-guidance-delivery
Energy Company Obligation 2017-18 (ECO2t) Guidance: Administration (version 1.1)
https://www.ofgem.gov.uk/publications-and-updates/energy-company-obligation-
2017-18-eco2t-guidance-administration
Energy Company Obligation 2017-18 (ECO2t) Guidance: Delivery (version 1.1)
https://www.ofgem.gov.uk/publications-and-updates/energy-company-obligation-
2017-18-eco2t-guidance-delivery
Summary of amendments to the ECO2 guidance for ECO2t (April 2017 - September 2018)
https://www.ofgem.gov.uk/publications-and-updates/summary-amendments-eco2-
guidance-eco2t-april-2017-september-2018
Energy Company Obligation (ECO2) CSCO final report
https://www.ofgem.gov.uk/publications-and-updates/energy-company-obligation-eco2-
csco-final-report
Government response to the Energy Company Obligation (ECO): Help to Heat
consultation
https://www.gov.uk/government/consultations/energy-company-obligation-eco-help-
to-heat

5
Executive Summary
i. The Energy Company Obligation (ECO2), which started in 2015, is a government scheme
for Great Britain that places legal obligations on larger energy companies to deliver
energy efficiency and cost saving measures to domestic premises. It was preceded by
ECO17 which ran from 2013 to 20158.
ii. The ECO2 scheme was originally developed to run from 1 April 2015 to 31 March 2017.
iii. There were three main obligations under ECO2 which energy companies were required to
meet. The obligations were the Carbon Emissions Reduction Obligation (CERO), the
Carbon Saving Community Obligation (CSCO)9 and the Home Heating Cost Reduction
Obligation (HHCRO).
iv. Additionally, suppliers were required to deliver a minimum amount of savings through
the delivery of solid wall insulation measures, known as the Provisional Solid Wall
Minimum Requirement (PSWMR) sub-obligation. Solid wall insulation measures delivered
under any of the three main obligations are eligible to count against a supplier’s PSWMR
obligation.
v. The obligation period for ECO2 was subsequently extended to run from 1 April 2017 to
30 September 2018 (referred to as ‘ECO2t’). Both CERO and HHCRO obligations were
extended for ECO2t. The CSCO and CSCO rural sub-obligation were not extended and
ended on 31 March 2017.
vi. Additionally, as part of the ECO2t extension period, new sub-obligations were introduced
under the CERO and HHCRO obligations respectively;
Under CERO, the CERO Rural sub-obligation, this required suppliers to deliver at
least 15% of their CERO obligation through measures installed in rural areas.
Under HHCRO, the Home Heating Minimum Requirement (HHMR), this required
suppliers to deliver a minimum amount of their HHCRO obligation through
measures other than the replacement of mains gas fuelled boilers.
vii. Suppliers’ obligations were determined based on their domestic customer numbers and
the amount of gas and electricity supplied to domestic customers. These were required
to be notified to Ofgem (‘we’, ‘our’ and ‘us’ in this document) during the relevant
notification period for each phase. The obligations are set, and needed to be achieved,
against each individual supply licence although suppliers with multiple licences are
grouped together in this report for ease of understanding.
viii. Suppliers had to achieve their total obligations by the end of the overall obligation period,
the obligations set for each phase were cumulative and were not required to be met
individually.
Overall Supplier Performance
ix. The final position of the ECO2 scheme is summarised below:
All but two suppliers, met their obligations and sub obligations under ECO2.
7 The Energy Companies Obligation (ECO1) Final Report. See: https://www.ofgem.gov.uk/publications-and-updates/energy-companies-obligation-eco1-final-report. 8 For an overview of previous schemes see: https://www.ofgem.gov.uk/environmental-programmes/eco/overview-previous-schemes. 9 CSCO also had a sub-obligation focused on rural areas (the CSCO rural sub-obligation).

6
Utilita failed to deliver their CERO, CERO Rural and PSWMR obligations. They were
also non-compliant on one licence for HHCRO and HHMR. Although they delivered
enough savings overall, these were not properly proportioned across their
licences.
Extra Energy, who ceased trading in November 2018, failed to achieve their CERO,
CERO Rural, HHCRO, HHMR and PSWMR obligations.
Npower were non-compliant on one licence for their CSCO obligation. This means
that while they delivered enough savings overall, these were not properly
proportioned across their licences. We have termed this an administrative non-
compliance10.
x. Despite this, the total delivery across all suppliers meant that the total obligation and
sub-obligation targets set by Government for ECO2 were achieved as follows:
The total lifetime carbon savings11 achieved under CERO were 21.37 MtCO2
including 2.02 MtCO2 under the rural sub-obligation. These constitute 108% of the
CERO target and 185% of the rural sub-obligation target.
The total lifetime carbon savings achieved under CSCO were 6.03 MtCO2 including
1.29 MtCO2 under the rural sub-obligation. These constitute 100% of the CSCO
target and 143% of the rural sub-obligation target. These achievements have
decreased since the CSCO final determination due to suppliers re-electing
measures into other obligations; before re-elections suppliers achieved 121% of
the CSCO target and 174% of the rural sub-obligation.
The total lifetime cost savings12 achieved under HHCRO were £6.89 Billion
including £2.54 Billion under the HHMR sub-obligation. These constitute 107% of
the HHCRO target and 121% of the HHMR target.
The PSWMR obligation delivered 5.76 MtCO2 of carbon savings which constitutes
107% of the target. PSMWR measures could be delivered under any of the ECO
obligations. They are not additional savings, but included in the overall obligation
totals.
xi. Although CSCO closed at the end of phase 2 of ECO2, suppliers were able to re-elect any
excess qualifying actions to other obligations.13
xii. It is possible that the majority of any excess savings delivered under ECO2 will be carried
over into ECO3, provided they meet the relevant criteria, reducing the cost of delivering
this new phase of the scheme.
10 For the purposes of the supplier scorecard, recognising that whilst the requirements of legislation were not met they overachieved on other licences meaning overall their delivery across the group was above their combined licence level obligations . 11 CERO and CSCO obligations are measured in the amount of carbon dioxide emissions that the measures will reduce over their lifetime (i.e. carbon savings). 12 HHCRO obligations are measured in the amount of energy bill savings that the measures will provide to consumers over the measures’ lifetime (i.e. cost savings). 13 See Chapter 9 of the ECO2t Guidance: Administration, for more information on re-election of obligations.
7
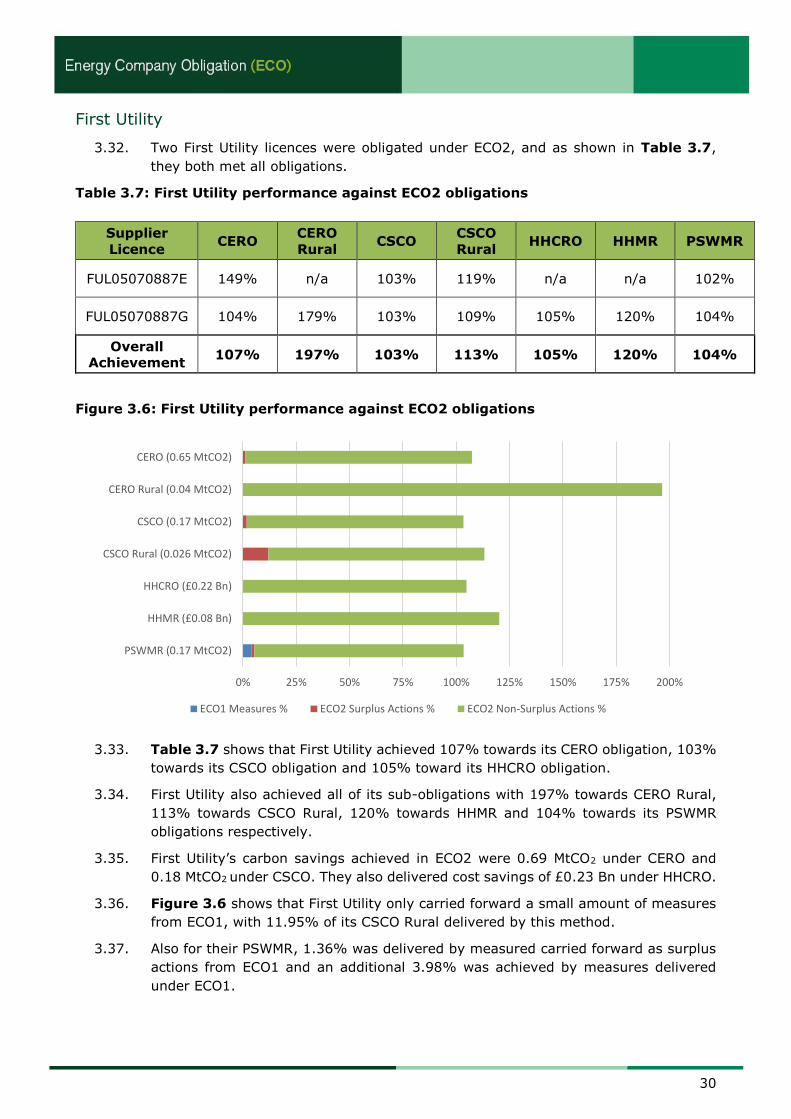
Table 1: Energy supplier performance against ECO2 obligations
*figures in red indicate non-compliance against obligation
Figure 1: Cumulative ECO2 delivery over time
Key Observations
xiii. The most frequently installed measure type under both CERO and CSCO obligations was
cavity wall insulation, followed by loft insulation and solid wall insulation.
xiv. The most frequent measure type installed under HHCRO was the replacement of a
qualifying gas boiler with a new gas boiler, followed by the installation of heating controls.
xv. As expected the majority of measures installed under ECO2 were installed in England,
accounting for 77% of CERO, 83% of HHCRO and 79% of CSCO measures.
CEROCERO
RuralCSCO
CSCO
RuralHHCRO HHMR PSWMR
British Gas 110% 191% 100% 140% 104% 111% 110%
Co-op Energy 108% 107% 106% 106% 110% 124% 100%
EDF 107% 213% 100% 174% 109% 131% 106%
EON 107% 218% 101% 114% 108% 125% 105%
Extra Energy 64% 51% 105% 281% 84% 73% 41%
First Utility 107% 197% 103% 113% 105% 120% 104%
Npower 113% 192% 100% 162% 113% 143% 109%
Ovo Energy 119% 288% 100% 101% 106% 118% 113%
Scottish Power 106% 110% 100% 103% 107% 118% 101%
SSE 108% 169% 100% 182% 107% 122% 110%
Utilita 98% 80% 102% 107% 106% 131% 97%
Utility Warehouse 106% 175% 100% 143% 106% 119% 103%
0%
20%
40%
60%
80%
100%
120%
140%
160%
180%
200%
ECO
1 M
easu
res
ECO
2 S
AM
ay-1
5Ju
n-1
5Ju
l-1
5A
ug-
15
Sep
-15
Oct
-15
No
v-1
5D
ec-1
5Ja
n-1
6Fe
b-1
6M
ar-1
6A
pr-
16
May
-16
Jun
-16
Jul-
16
Au
g-1
6Se
p-1
6O
ct-1
6N
ov-
16
Dec
-16
Jan
-17
Feb
-17
Mar
-17
Ap
r-1
7M
ay-1
7Ju
n-1
7Ju
l-1
7A
ug-
17
Sep
-17
Oct
-17
No
v-1
7D
ec-1
7Ja
n-1
8Fe
b-1
8M
ar-1
8A
pr-
18
May
-18
Jun
-18
Jul-
18
Au
g-1
8Se
p-1
8O
ct-1
8
Notification Period (month after installation)
CERO % CSCO % HHCRO% CSCO Rural % PSWMR % HHMR% CERO Rural%

8
xvi. Scotland received a disproportionate number of measures delivered under CERO,
accounting for 19% of measures delivered, more than double the population share
(approx. 9%). This can be largely attributed to the high number of solid wall measure
delivered in Scotland under CERO.
xvii. Under HHCRO, Wales received a disproportionate number of measures, accounting for
9% of the total number of measures delivered despite a smaller population share (approx.
5%). This can be attributed to high number of boiler replacements delivered in Wales.
xviii. A greater number of measures per household were delivered in England under CERO than
in Scotland or Wales. A greater number of measures per household were delivered in
Wales for both CSCO and HHCRO obligations than were delivered in England or Scotland.
xix. A significant proportion of the suppliers’ CSCO and CSCO Rural obligations was delivered
via measures carried forward from ECO1 as surplus actions (as seen in Figure 1).
xx. A large proportion of measures attributed to the PSWR obligation were delivered under
ECO1 (29.73%).
xxi. Throughout ECO2 we had more communication with energy companies and the supply
chain than we had in previous energy efficiency schemes. We worked together to find
ways to improve the efficiency of the administration of the scheme and introduced an
enhanced technical and score monitoring process to drive improvements in the industry.
By beginning to collect information on the installer of measures we were better able to
target poor compliance with the requirements of the ECO order. The ‘Pathway to
Compliance’ framework required energy companies to concentrate provide greater
assurance with specific delivery partners to demonstrate measures were installed to the
correct technical standards and were scored accurately.

9
1. Legislative Context
Chapter Overview
This chapter describes the background to the ECO2 legislation.14 It also summarises
the legislative changes that occurred during the obligation period and how they
affected delivery of measures.
Introduction
1.1. ECO2 placed a legal obligation on larger energy companies to deliver energy
efficiency measures to domestic premises.15 Energy companies with more than
250,000 customers and that supplied more than a minimum amount of gas or
electricity in a specific period were obligated under ECO2.16 The obligation period for
ECO2 began on 1 April 2015 and ended on 30 September 2018.
1.2. The ECO2 scheme was originally established under the ‘ECO2 Order’, and developed
to run from 1 April 2015 to 31 March 2017. The obligation period for ECO2 was
subsequently extended to run from 1 April 2017 to 30 September 2018 (referred to
as ‘ECO2t’).17
1.3. The overall obligation period for ECO2 ran from 1 April 2015 to 30 September 2018
and was split into three phases. We were required to determine a supplier’s
obligations for each of these phases:
phase 1: 1 April 2015 to 31 March 2016,
phase 2: 1 April 2016 to 31 March 2017, and
phase 3 (ECO2t): 1 April 2017 to 30 September 2018.
1.4. The overall cost and carbon savings that suppliers had to achieve per obligation were:
19.7 MtCO218 under CERO, focused primarily on the installation of wall
and roof insulation measures and connections to district heating
systems,
6 MtCO2 under CSCO, focused primarily on properties in low income
areas, 15% of which was to be in rural areas and to consumers on
certain benefits, and
£6.46 billion under HHCRO, focused primarily on reducing heating costs
for consumer on certain benefits as a way of targeting vulnerable
households.
1.5. Two additional sub-obligations were introduced for ECO2t:
CERO Rural, 15% of an eligible supplier’s phase 3 CERO measures should be
delivered in rural areas, and
14The Electricity and Gas (Energy Company Obligation) (Amendment) Order 2017 http://www.legislation.gov.uk/uksi/2017/490/contents/made 15 Under the ECO2 Order, obligations were imposed on individual gas or electricity licence holders (referred to as ‘suppliers’) rather than on the parent company of a group of licence holders. The analysis presented throughout this report is aggregated at a group level (referred to as an ‘energy company’). 16 See Chapter 2 of our ECO2t Guidance: Administration for information on when a gas or electricity licence-holder will meet the definition of a ‘supplier’. 17 By the ECO2 Order as amended by the Electricity and Gas (Energy Company Obligation) (Amendment) Order 2017. 18 A minimum carbon saving of 5.4 MtCO2 must be achieved through the delivery of solid wall insulation measures (SWI), known as the provisional solid wall minimum requirement (PSWMR).

10
Home Heating Minimum Requirement (HHMR), 76% of an eligible supplier’s phase
3 HHCRO obligation should be delivered through measures which are not the
replacement of qualifying gas boilers fuelled by main gas.
1.6. Under phase 1 of ECO2, 11 energy companies were obligated, including the nine
obligated suppliers from ECO1; British Gas, The Co-operative Energy, EDF Energy,
E.ON, First Utility, Npower, Scottish Power, SSE and Utility Warehouse. Two
suppliers, OVO Energy and Utilita, became obligated for the first time. Extra Energy
were obligated for phase 2 from 1 April 2016. Economy Energy, Spark Energy Supply
Ltd. and Flow Energy were obligated from 1 April 2017 for phase 3 (ECO2t).
1.7. Suppliers had to achieve their total obligations by the end of the overall obligation
period, the obligations set for each phase were cumulative and were not required to
be met individually.
Amendments introduced under ECO2t
1.8. This section summarises some of the main changes introduced for phase three of
ECO2.
Obligation trading
1.9. One of the changes introduced under ECO2t was to allow suppliers to trade
obligations between one another or between their own licences. Only obligations
under CERO, CERO Rural, HHCRO, HHMR and PSWMR19 could be traded; CSCO
obligations could not.
1.10. Suppliers were permitted to trade all or part of their obligations (phases 1 to 3
inclusive). The trading of obligations could occur between licences held by the same
or different companies. We received a total of 100 trading requests of which we
approved 78. The remaining 22 were withdrawn by the supplier. The majority of
approved trades (74%) occurred between licences held by the same energy company
in order to consolidate their licences. The remaining trades (26%) were between
different energy companies to assist in meeting obligations.
1.11. All three newly obligated suppliers under ECO2t, Economy Energy, Flow Energy and
Spark Energy Supply Ltd., traded their obligations to another obligated supplier.
Scoring
1.12. One of the main changes under ECO2t was the introduction of deemed scores20 as
the method of determining savings. Before this carbon and cost savings were
calculated using the Standard Assessment Procedure (SAP)21 which required a whole
house survey in order to collect numerous data inputs relating to the property where
a measure would be installed. This approach resulted in a cost or carbon savings
score which were bespoke to each property. Deemed scores determine the
contribution certain measures make towards a supplier’s CERO or HHCRO target.
Deemed scores are fixed scores for each measure type that are determined using
three or four variables.
19 See paragraphs 2.29-2.37 for more information on PSWMR 20 See Chapter 7 of the ECO2t Guidance: Delivery for more information on deemed scores. 21 http://www.bre.co.uk/filelibrary/SAP/2012/SAP-2012_9-92.pdf

11
1.13. For insulation measures the variables are,
a) the type of property,
b) the number of bedrooms in the property, and
c) the main heating source of the property.
1.14. For heating measures, the main wall type of the property is also considered.
1.15. The legislation set out that Ofgem would set out these deemed scores in accordance
with principles of RdSAP, for more information on this work please see the guidance
and consultations on deemed scores (link)
Flexible eligibility
1.16. The introduction of local authority flexible eligibility measures (LA Flex) under HHCRO
was introduced during phase 3 of ECO2. Measures delivered to private domestic
premises were eligible where they were included on a Local Authority (LA) declaration
stating that the households were either:
a) Living in fuel poverty (FP),
b) Living on a low income and vulnerable to the effects of living in a
cold home (LIVC), or
c) Non-fuel poor but located in an immediately adjacent building to, in
the same building as, or in the same terrace as households identified
by an LA as FP or LIVC (solid wall insulation (SWI) in-fill)
1.17. A supplier could deliver up to 10% of its phase 3 HHCRO through this route, including
any SWI in-fill. There was no minimum requirement for suppliers to deliver flexible
eligibility measures, it was an alternative means of delivery that was capped.
1.18. HHCRO measures could also be delivered to social housing with an energy
performance certificate (EPC) energy efficiency rating of E, F or G (or unrated), where
the premises were let below market rate. Only insulation measures and first time
central heating systems were eligible under this route.
1.19. There are other more detailed changes explained in our guidance documents22, such
as the revision to PAS2030 installation standards, please refer to the guidance
documents for further details.
22 ECO2t Guidance: Administration & ECO2t Guidance: Delivery

12
2. Overall Performance
Chapter Overview
This chapter gives a summary of the overall performance of energy companies against their
ECO2 CSCO, CERO and HHCRO obligations and CSCO Rural, CERO Rural, HHMR and PSWMR
sub-obligations.
A final determination of CSCO was made at the end of phase 2 of ECO2, however as suppliers
were able to re-elect any eligible excess measures we have included CSCO data in this report to
highlight any changes.
Introduction
2.1. Each obligation had specific eligibility requirements for measures delivered against
the obligation. Measures meeting those requirements, had their carbon and cost
savings attributed towards suppliers’ obligations. Here we present the combined
performance of all energy companies towards all ECO2 obligations.
2.2. The ECO2 Order also set out limits which the energy companies could not exceed.
These were the proportion of boiler repairs and electric storage heater repairs
conducted under HHCRO and the amount of local authority flexible measures also
under HHCRO. Under CSCO there was a limit on the amount of measures that could
be installed in adjoining areas23.
Figure 2.1: Overall achievement by energy companies of ECO2 obligation and sub-
obligation targets
23 Adjoining areas are those that share a border with an area of low income. In England and Wales areas are described as lower super output areas (LSOA). In Scotland, areas are described as data zones. Suppliers could use the ECO tool, or an equivalent system, to identify adjoining areas.
0% 20% 40% 60% 80% 100% 120% 140% 160% 180% 200%
CERO (19.70 MtCO2)
CERO Rural (1.09 MtCO2)
CSCO (6.0 MtCO2)
CSCO Rural (0.9 MtCO2)
HHCRO (£6.46 Bn)
HHMR (£2.10 Bn)
PSWMR (5.40 MtCO2)
ECO1 Measures % ECO2 Surplus Actions % ECO2 Non-Surplus Actions %

13
2.3. Figure 2.1 above shows achievement against the ECO2 obligation and sub-obligation
targets set for all energy suppliers. All targets were exceeded and it’s possible that
any excess savings will be carried over into ECO3 as surplus actions.
2.4. As previously mentioned, the final CSCO position has changed from the CSCO
closedown report.24 This is due to suppliers moving eligible measures not needed to
comply with their CSCO into other obligations. Additionally, there were some post
CSCO closedown rejections, however the majority of the of the reduction was due to
re-elections.
Figure 2.2: ECO2 delivery over time
2.5. Figure 2.2 shows the delivery profile of measures in each of the main obligations. It
shows that overall the delivery of CERO and HHCRO measures were evenly split
month to month, with CERO being energy suppliers’ main focus at the beginning and
end of the overall obligation period. Delivery of CSCO measures gradually decreased
until closedown in April 2017. The sharp increase of measures attributed to
September 2018 relates to the use of extensions to deal with missing information or
revised contractual arrangements with the suppliers.
Delivery Mechanisms
2.6. Whilst Energy suppliers were obligated to promote measures, they used a variety of
mechanisms to do this. Whilst there was some delivery directly by suppliers, the
most widely used methods were to contract work directly with installers or to
employ managing agents who represented a number of different installers.
24Energy Company Obligation (ECO2) CSCO final report: https://www.ofgem.gov.uk/publications-and-updates/energy-company-obligation-eco2-csco-final-report
0
5,000
10,000
15,000
20,000
25,000
Ap
r-15
May
-15
Jun
-15
Jul-
15
Au
g-15
Sep
-15
Oct
-15
No
v-15
Dec
-15
Jan
-16
Feb
-16
Mar
-16
Ap
r-16
May
-16
Jun
-16
Jul-
16
Au
g-16
Sep
-16
Oct
-16
No
v-16
Dec
-16
Jan
-17
Feb
-17
Mar
-17
Ap
r-17
May
-17
Jun
-17
Jul-
17
Au
g-17
Sep
-17
Oct
-17
No
v-17
Dec
-17
Jan
-18
Feb
-18
Mar
-18
Ap
r-18
May
-18
Jun
-18
Jul-
18
Au
g-18
Sep
-18
No
. of
ap
pro
ved
me
asu
res
Month of Installation
CERO CSCO HHCRO

14
2.7. Energy suppliers could also use another mechanism called ‘ECO brokerage’.
Brokerage was a blind auction platform developed by the Department for Business,
Energy and Industrial Strategy (BEIS), where suppliers could buy forward contracts
for the delivery of carbon or cost savings by participating sellers. Installers could
sell ‘lots’ of savings which they would then have to deliver for the obligated supplier
who successfully bid for the lot. This system was created in response to requests
from the energy efficiency industry to help smaller and newer installers access the
market. 24,866 (2.42%) of ECO2 measures were delivered through this
mechanism.
2.8. Energy suppliers could identify low income, adjoining and rural areas that may have
been eligible for energy efficiency measures under CSCO by referring to the 2014 low
income and rural document25. We updated and made our ECO tool26 software
available so this could be used to identify areas that may be eligible under CSCO and
the rural elements of CSCO and CERO.
Measures delivered per country
Figure 2.3: Approved ECO2 measures by obligation and country of installation
2.9. Figure 2.3 shows that in England the proportion of measures delivered was split
fairly evenly across CERO and HHCRO obligations.
2.10. In Scotland, measures delivered under CERO were more popular than under HHCRO
and CSCO. This is reflected by the large proportion of solid wall insulation measures
delivered in Scotland.
25 Low income and rural document: https://assets.publishing.service.gov.uk/government/uploads/system/uploads/attachment_data/file/48405/5536-carbon-saving-community-obligation-rural-and-low-.pdf 26Ofgem ECO tool: https://eco.locationcentre.co.uk/
0.00%
10.00%
20.00%
30.00%
40.00%
50.00%
60.00%
70.00%
80.00%
90.00%
100.00%
England Installations Scotland Installations Wales Installations
CERO HHCRO CSCO

15
2.11. In Wales, measures delivered under HHCRO were more popular that under CERO and
CSCO. This is reflected by the large proportion of boiler measures delivered in Wales.
CERO
2.12. The Carbon Emissions Reduction Obligation (CERO) focused on the installation of wall
and roof insulation measures and connections to district heating systems. For CERO,
these measures are referred to as ‘primary measures’. Other insulation measures
such as glazing and draught proofing are also eligible as ‘secondary measures’
provided relevant requirements are met.
2.13. Some of a supplier’s overall CERO must be achieved by promoting solid wall insulation
measures. This is known as a supplier’s solid wall minimum requirement (PSWMR).
2.14. A total of 498,609 measures were delivered under CERO in ECO2 with an additional
170,598 carried over from ECO1.
2.15. Of the twelve obligated suppliers two failed to achieve their CERO obligation, Utilita
and Extra Energy, however as shown in Figure 2.1, the overall CERO target was
achieved 108.49%
2.16. There were concerns around Extra Energy’s compliance. As Extra Energy ceased
trading during the obligation period, no further action was taken.
Figure 2.4 Measure types in CERO
2.17. Figure 2.4 shows that the main measure type installed under CERO was cavity wall
insulation, accounting for just over half (51.78%) of the total CERO obligation.
2.18. The delivery of cavity wall insulation measures in England (57%) was much higher
in proportion to Scotland and Wales (36% and 28%) respectively. The proportion of
solid wall insulation measures delivered in Scotland and Wales (32% and 35%) was
significantly higher than in England (8%).
2.19. Cavity wall insulation (57%) was the most popular measure type delivered in
England, followed by Loft insulation (27%).
2.20. Cavity wall insulation (36%) was also the most popular measure type delivered in
Scotland, followed by solid wall insulation (32%).
Cavity Wall Insulation51.78%
Loft Insulation22.02%
Solid Wall Insulation
13.69%
Room-in-Roof Insulation6.37%
District Heating System 5.48%
Other Insulation0.61%
Park Home External Wall Insulation
0.04%

16
2.21. In Wales, solid wall insulation (35%) was the most popular measure type delivered,
followed by loft insulation (30%).
2.22. The remaining measures installed under CERO were generally consistent across the
different countries. There were no park home insulation measures installed in
Wales.
CERO rural sub-obligation
2.23. The rural sub-obligation introduced under ECO2t required that at least 15% of a
supplier’s CERO delivery was promoted to members of the affordable warmth group
(AWG) living in a rural area.
2.24. As with CERO, two of the obligated suppliers failed to deliver their CERO rural
obligation, Utilita and Extra Energy. However, as shown in Figure 2.1, the overall
CERO rural target was achieved and almost doubled with suppliers achieving
184.59% of the target.
2.25. A total of 37,477 measures were delivered to rural areas under CERO.
Figure 2.5 Measure types in CERO rural sub-obligation
2.26. Figure 2.5 shows that, similar to the overall CERO obligation, the main measure
type installed under CERO Rural was cavity wall insulation (48.60%).
2.27. The proportion of measures installed in rural areas is consistent with the overall CERO
obligation. There was a higher number of Room-in-roof measures installed in rural
areas under CERO.
2.28. The proportion of room-in-roof insulation measures delivered in rural Scotland (28%)
was significantly higher than in England and Wales (4% and 8%)
PSWMR sub-obligation
2.29. The Provisional Solid Wall Minimum Requirement (PSWMR) states that energy
suppliers must achieve a percentage of their ECO2 obligations through the installation
of Solid Wall Insulation (SWI) measures.
2.30. The PSWMR target was not in addition to the carbon savings to be achieved under
CERO, CSCO and HHCRO, but rather is a requirement on how some of ECO2 is
Cavity Wall Insulation48.60%
Loft Insulation22.17%
Solid Wall Insulation
12.04%
Room-in-Roof Insulation11.87%
District Heating System 4.51%
Other Insulation0.58%
Park Home External Wall Insulation
0.22%

17
delivered – i.e. at least 5.4 MtCO2 savings had to be achieved through the installation
of SWI measures under any or all of the three obligations (CERO, CSCO and HHCRO).
2.31. A supplier’s PSWMR was used to determine supplier’s solid wall minimum requirement
(SWMR). The SWMR was a proportion of the PSWMR that related specifically to CERO
and represented the amount of carbon savings which a supplier must achieve through
the delivery of CERO SWI surplus actions27 and ECO2 CERO SWI measures. For a
supplier to achieve its CERO, it must meet its SWMR.
2.32. The PSWMR is a minimum carbon savings target, therefore, suppliers were able to
deliver above their requirement. Suppliers had to achieve their PSWMR by the end of
the obligation period (before 1 October 2018).
2.33. Although PSWMR was an ECO2 requirement, carbon savings achieved by SWI
measures delivered in both ECO1 and ECO2 could contribute towards a supplier’s
PSWMR.
2.34. A total of 85,910 solid wall insulation measures were delivered during ECO2, with
35,031 carried over from ECO1 as surplus actions. Additionally, 46,627 measures
that were delivered in ECO1 were eligible to count towards suppliers ECO2 PSWMR
obligation.
2.35. Two of the twelve obligated suppliers, Utilita and Extra Energy, failed to achieve their
PSWMR, however as shown in Figure 2.1, the overall PSWMR target was achieved
106.69%
Figure 2.6 PSWMR measures by country
2.36. Figure 2.6 above, shows that England received the highest proportion of PSWMR
measures (58.12%).
2.37. The 33.46% proportion of solid wall measures delivered in Scotland is significant
given that Scotland accounts for approx. 9% of the population. This is in part due to
27 A surplus action is where a supplier has achieved savings that exceed its ECO1 obligations, and applies to credit the excess measure or ‘surplus action’ towards its ECO2 obligations. For more information on surplus actions see our ECO2 Guidance: Administration (v1.1).
England58.12%
Scotland33.46%
Wales8.42%

18
the higher prevalence of solid-walled properties in Scotland, and also because ECO
was used alongside the Scottish Government’s own domestic insulation programme.
HHCRO
2.38. The Home Heating Cost Reduction Obligation (HHCRO) focused on reducing heating
costs for low income and vulnerable householders living in private housing and who
receive specific benefits (the ‘affordable warmth group’).
2.39. HHCRO focused on the repair and replacement of boilers and electric storage heaters,
however additional measures such as heating controls and insulation were eligible.
2.40. Suppliers could choose to deliver measures at private domestic premises which are
non-gas fuelled, and would receive an increased cost score for certain measures
installed at these premises.
2.41. A total of 437,358 measures were delivered under HHCRO in ECO2, with a further
109,051 measures carried over from ECO1.
2.42. One of the obligated suppliers, Extra Energy, failed to achieve their HHCRO
obligation, and Utilita failed on one of their licences. However as shown in Figure
2.1, the overall HHCRO target was exceeded.
Figure 2.7 Measure types in HHCRO
2.43. Figure 2.7 above shows that replacement boilers was the main measure type
delivered under HHCRO, accounting for just over half (53.09%) of the total HHCRO
obligation.
2.44. The second highest proportion of measures delivered under HHCRO, other heating,
is the delivery of heating controls, these are normally delivered as a secondary
measure alongside boiler replacements.
2.45. There was a 5% limit to the proportion of a supplier’s HHCRO that could be achieved
through the repair of qualifying boilers and qualifying electric storage heaters.
However, no boiler repairs or electric storage heating repair measures were
delivered.
Boiler Replacement53.09%
Other Heating28.29%
Cavity Wall Insulation8.03%
Loft Insulation3.99%
Room-in-Roof Insulation2.94%
Electric Storage Heater2.51%
Other Insulation1.12% Micro-generation
0.03%

19
HHMR sub-obligation
2.46. The Home Heating Minimum Requirement (HHMR) was introduced as part of phase 3
of ECO2 as a sub-obligation of HHCRO. This requires a supplier to deliver a minimum
amount of its HHCRO target through measures other than the replacement of a
qualifying boiler fuelled by mains gas.
2.47. A total of 166,052 measures delivered under HHCRO were eligible to count against
the HHMR sub-obligation.
2.48. As with the overall HHCRO obligation, Extra Energy failed to achieve its HHMR
obligation, and Utilita failed on one of their licences, however as shown in Figure
2.1, the overall HHMR obligation was achieved 121.17%.
2.49. HHMR measures accounted for 92.09% of the phase 3 HHCRO obligation, which
was above the 76% minimum target.
Figure 2.8 Measure types in HHMR
2.50. Figure 2.8 above shows that the installation of heating controls (other heating) was
the most popular measure delivered under HHMR.
2.51. Under HHMR, Wales accounted for the largest proportion of boiler replacements with
52.03% of measures delivered being boiler replacements compared to 18.46% in
England and 26.09% in Scotland. A significant number of these were the replacement
of oil boilers. This potentially explains the lower volumes in England, where larger
numbers of properties are connected to mains gas.
2.52. Although the proportion of Boiler replacements in Wales accounted for such a large
proportion of its HHMR obligation, this amounted to 26.74% of total boiler
replacements under HHMR. England accounted for 60.38% and Scotland 12.88%.
2.53. Conversely, insulation measures such as cavity wall and loft insulation were more
prominent in England and Scotland under HHMR than they were in Wales. In England
they accounted for a combined 35.05% of all measures delivered and in Scotland for
28.46%. In Wales cavity wall and loft insulation accounted for a combined 7.59% of
all measures delivered under HHCRO.
Other Heating31.62%
Boiler Replacement23.38%
Cavity Wall Insulation19.31%
Loft Insulation9.95%
Electric Storage Heater6.52%
Room-in-Roof Insulation6.24%
Solid Wall Insulation2.17%
Other0.81%

20
Local Authority Flexible Eligibility
2.54. During phase 3 of ECO2, under HHCRO, suppliers were able to deliver measures to
private domestic premises where they were included on a Local Authority (LA)
declaration stating householder were either:
a) Living in fuel poverty (FP),
b) Living on a low income and vulnerable to the effects of living in a
cold home (LIVC), or
c) Non-fuel poor but located in an immediately adjacent building to, in
the same building as, or in the same terrace as households identified
by an LA as FP or LIVC (solid wall insulation (SWI) in-fill).
2.55. Delivery of measures using this method was capped at 10% of a supplier’s phase 3
HHCRO obligation. There was no minimum requirement to deliver measures via this
method, it was another means of delivery.
Figure 2.9: LA Flex delivery by supplier
2.56. Figure 2.9 above shows that EDF, E.ON, First Utility and Scottish Power all
exceeded their 10% LA Flex Limit.
2.57. The excess measures that were delivered in phase 3 of ECO2 will not be eligible to
count towards each suppliers HHCRO obligation, however suppliers will be able to
carry over eligible excess measures to ECO3.
2.58. Also for ECO3, the LA Flex limit has been increased, allowing suppliers to deliver
25% of their HHCRO obligation via this method.
CSCO
2.59. The Carbon Savings Community Obligation (CSCO) focused on the installation of
insulation measures and connections to district heating systems at domestic premises
0% 20% 40% 60% 80% 100% 120% 140% 160% 180% 200% 220%
British Gas (0.08 £Bn)
Co-op Energy (0.003 £Bn)
EDF (0.03 £Bn)
EON (0.04 £Bn)
Extra Energy (0.003 £Bn)
First Utility (0.01 £Bn)
Npower (0.03 £Bn)
OVO Energy (0.008 £Bn)
Scottish Power (0.03 £Bn)
SSE (0.04 £Bn)
Utilita (0.003 £Bn)
Utility Warehouse (0.006 £Bn)
Approved %

21
in low income, adjoining28 or rural areas. A total of 92,334 measures were delivered
under CSCO in ECO2, with an additional 130,443 measures carried over from ECO1.
2.60. CSCO was not extended into phase 3 of ECO2 (ECO2t) and therefore closed on 31
March 2017. A final report29 which detailed our determinations on energy companies’
achievement against their CSCO and CSCO rural obligations was published on 28
September 2017.
2.61. As suppliers were able to re-elect measures from CSCO to other ECO2 obligations
and we rejected measures initially used in CSCO the figures in this report differ from
those published in the CSCO final report.
2.62. All obligated suppliers achieved their overall CSCO obligations.
2.63. However, Npower were administratively non-compliant on one of their CSCO licences.
This means that while they delivered enough savings overall to meet their aggregated
CSCO obligation, these were not balanced across their licences.
2.64. The underachievement on this licence was a very small amount (13 tonnes) and
counterbalanced by over delivery on their other licences in terms of meeting their
overall CSCO obligation.
2.65. The overall target from CSCO was originally exceeded with suppliers achieving 121%
of the original target, however after re-elections to other ECO2 obligations and post
CSCO closedown rejections, the final overall achievement of CSCO is 100.48%, as
can be seen in Figure 2.1.
Figure 2.10 Measure types in CSCO
2.66. The overall proportion of measure types delivered under CSCO is shown in Figure
2.10. The most frequently installed measure type in CSCO was cavity wall insulation
(41.49%) followed by loft insulation (18.74%) and solid wall insulation (17.29%).
The remainder (22.49%) consisted of connections to district heating systems as well
28 See page 23 for more information on adjoining areas. 29 Energy Company Obligation (ECO2) CSCO final report: https://www.ofgem.gov.uk/system/files/docs/2017/09/eco2_csco_final_compliance_report_280917.pdf
Cavity Wall Insulation41.49%
Loft Insulation18.74%
Solid Wall Insulation17.29%
District Heating System 10.63%
Room-in-Roof Insulation6.97%
Other Insulation4.89%

22
as much smaller numbers of other insulation measure types (including draught
proofing, under floor insulation and window glazing).
2.67. These figures differ from the CSCO closedown report as suppliers chose to re-elect
eligible excess savings from CSCO into the other ECO2 obligations. At CSCO
closedown cavity wall insulation accounted for 45% of the measures notified under
CSCO. Generally, the proportion of measure types has remained the same.
CSCO Rural sub-obligation
2.68. The rural sub-obligation required that at least 15% of a supplier’s CSCO delivery was
promoted to members of the affordable warmth group (AWG) living in a rural area.
All obligated suppliers met their rural sub-obligation.
2.69. A total of 14,580 measures were delivered under CSCO Rural in ECO2, with an
additional 26,004 measures carried over from ECO1.
2.70. Similar to the main CSCO obligation, the overall achievement of CSCO Rural reduced
after post CSCO closedown rejections and re-elections of measures to other ECO2
obligations. At CSCO closedown the rural obligation achievement was 174%, as
shown in Figure 2.1, this figure is now 143.02%
Figure 2.11 Measure types in CSCO rural sub-obligation
2.71. Figure 2.11 shows that, as with the main CSCO obligation, cavity wall insulation was
the main measure installed under CSCO rural (37.06%), however this was only
slightly ahead of loft insulation (35.86%).
2.72. Under CSCO rural, district heating systems saw a significant decrease from the main
obligation and only accounted for 0.34% of measures delivered in rural areas.
Adjoining Areas
2.73. Under CSCO, adjoining areas were those that shared a border with an area of low
income. As set out in the ECO2 Order30, the total carbon savings of measures carried
out in CSCO adjoining areas could not exceed 25% of the total savings achieved in
30 Article 15 of the ECO2 Order.
Cavity Wall Insulation
37.06%
Loft Insulation35.86%
Solid Wall Insulation
14.92%
Room-in-Roof Insulation
10.84%
Other Insulation0.98%
District Heating System 0.34%

23
the related low income area. Any savings which exceeded the 25% limit could not
contribute to a supplier’s CSCO obligation.
2.74. Several energy suppliers did not engage in the delivery of measures in adjoining
areas. For those that did, we conducted indicative assessments of notified adjoining
installations in November 2016, March 2017, and June 2017. This early analysis
helped energy suppliers to identify if the 25% limit had been exceeded. Suppliers
could then make adjustments to the number of measures in adjoining areas or related
low income areas to mitigate the amount of carbon savings at risk of rejection ahead
of the final deadline.
2.75. In September 2017, we conducted our final assessment of those suppliers that
participated in the delivery of measures in adjoining areas. A total of 109 measures
were installed as adjoining installations and as such were subject to this assessment.
No suppliers who notified measures in adjoining areas exceeded the 25% limit.
Measures in adjoining areas accounted for 0.1% of CSCO savings.

24
3. Energy Supplier Performance
Chapter Overview
This chapter presents each energy supplier’s achievement against their obligations and sub-
obligations in ECO2.
Introduction
3.1. Each of the energy supplier’s ECO2 obligations was calculated using the amount of
energy they supplied to their domestic customers (i.e. market share) in the year
preceding each phase. As supplier obligations were set at individual licence level,
here we present licence level performance alongside delivery at the group energy
company level.
Table 3.1: Energy company performance index reference
Energy Company Index
British Gas Table 3.2 and Figure 3.1
Co-op Energy Table 3.3 and Figure 3.2
EDF Table 3.4 and Figure 3.3
EON Table 3.5 and Figure 3.4
Extra Energy Table 3.6 and Figure 3.5
First Utility Table 3.7 and Figure 3.6
Npower Table 3.8 and Figure 3.7
Ovo Energy Table 3.9 and Figure 3.8
Scottish Power Table 3.10 and Figure 3.9
SSE Table 3.11 and Figure 3.10
Utilita Table 3.12 and Figure 3.11
Utility Warehouse Table 3.13 and Figure 3.12
3.2. The carbon savings achieved by each energy company include any savings that were
carried over from ECO1 as surplus actions, and in the case of PSWMR this also
includes solid wall measures delivered during ECO1.
3.3. The majority of suppliers re-elected excess CSCO savings and credited them against
different obligations during phase 3 (ECO2t).
3.4. Throughout ECO2 we sought to provide information to stakeholders by engaging with
suppliers and the wider supply chain to clarify scheme requirements and resolve
issues. We provided additional information and guidance through stakeholder events
and working level bilateral meetings to support delivery of eligible measures and to
improve data quality. We also worked with various industry groups to standardise
documentation and made available our ECO Tool to help suppliers identify eligible
rural areas, and to assist in the verification of ECO2 measures.

25
British Gas
3.5. Two British Gas licences were obligated under ECO2, and as shown in Table 3.2,
they both met all obligations.
Table 3.2: British Gas performance against ECO2 obligations
Supplier
Licence CERO
CERO
Rural CSCO
CSCO
Rural HHCRO HHMR PSWMR
BGT03078711E 100% n/a 100% 148% n/a n/a 100%
BGT03078711G 111% 191% 100% 135% 104% 111% 113%
Overall
Achievement 110% 191% 100% 140% 104% 111% 110%
Figure 3.1: British Gas performance against ECO2 obligations
3.6. Table 3.2 shows that British Gas achieved 110% towards its CERO obligation, 100%
towards its CSCO obligation and 104% toward its HHCRO obligation.
3.7. British Gas also achieved all of its sub-obligations with 191% towards CERO Rural,
140% towards CSCO Rural, 111% towards HHMR and 110% towards its PSWMR
obligations respectively.
3.8. British Gas’s carbon savings achieved in ECO2 were 6.29MtCO2 under CERO and 1.77
MtCO2 under CSCO. They also delivered cost savings of £1.95 Bn under HHCRO.
3.9. Figure 3.1 shows that a large part of British Gas’s CSCO Rural obligation was
achieved through measures carried over from ECO1 (63.13%)
3.10. The majority of British Gas’s PSWMR obligation was achieved through measures
delivered during ECO1, 57.35%.
0% 25% 50% 75% 100% 125% 150% 175% 200%
CERO (5.72 MtCO2)
CERO Rural (0.31 MtCO2)
CSCO (1.77 MtCO2)
CSCO Rural (0.27 MtCO2)
HHCRO (£1.88 Bn)
HHMR (£0.60 Bn)
PSWMR (1.51 MtCO2)
ECO1 Measures % ECO2 Surplus Actions % ECO2 Non-Surplus Actions %

26
The Co-operative Energy
3.11. Two Co-op Energy licences were obligated under ECO2, and as shown in Table 3.3,
they both met all obligations. Table 3.3: Co-op Energy performance against ECO2 obligations
Supplier
Licence
CERO CERO
Rural CSCO
CSCO
Rural HHCRO HHMR PSWMR
COP06993470E 103% 107% 106% 105% 111% 121% 100%
COP06993470G 127% n/a 105% 106% 104% n/a 101%
Overall
Achievement 108% 107% 106% 106% 110% 124%31 100%
Figure 3.2: Co-op Energy performance against ECO2 obligations
3.12. Table 3.3 shows that Co-op Energy achieved 108% towards its CERO obligation,
106% towards its CSCO obligation and 110% toward its HHCRO obligation.
3.13. Co-op Energy also achieved all of its sub-obligations with 107% towards CERO Rural,
106% towards CSCO Rural, 124% towards HHMR and 100% towards its PSWMR
obligations respectively.
3.14. Co-op’s carbon savings achieved in ECO2 were 0.16 MtCO2 under CERO and 0.04
MtCO2 under CSCO. They also delivered cost savings of £0.06 Bn under HHCRO.
3.15. Figure 3.2 shows that almost all of Co-op’s savings were delivered under ECO2, with
only minimal amounts carried forward from ECO1, much less than the other suppliers.
This is likely because Co-op was not obligated under ECO1 until April 2014.32
31 Overall achievement of HHMR is greater than the individual licence achievement as some savings were approved against the non-obligated licence. 32 See: https://www.ofgem.gov.uk/publications-and-updates/energy-companies-obligation-eco1-final-report
0% 25% 50% 75% 100% 125% 150%
CERO (0.15 MtCO2)
CERO Rural (0.01 MtCO2)
CSCO (0.04 MtCO2)
CSCO Rural (0.006 MtCO2)
HHCRO (£0.05 Bn)
HHMR (£0.02 Bn)
PSWMR (0.04 MtCO2)
ECO1 Measures % ECO2 Surplus Actions % ECO2 Non-Surplus Actions %

27
EDF Energy
3.16. Two EDF licences were obligated under ECO2, and as shown in Table 3.4, they both
met all obligations.
Table 3.4: EDF Energy performance against ECO2 obligations
Supplier
Licence CERO
CERO
Rural CSCO
CSCO
Rural HHCRO HHMR PSWMR
EDF02228297E 107% 237% 100% 181% 108% 127% 104%
EDF02228297G 108% 180% 100% 164% 110% 136% 109%
Overall
Achievement 107% 213% 100% 174% 109% 131% 106%
Figure 3.3: EDF performance against ECO2 obligations
3.17. Table 3.4 shows that EDF achieved 107% towards its CERO obligation, 100%
towards its CSCO obligation and 109% toward its HHCRO obligation.
3.18. EDF also achieved all of its sub-obligations with 213% towards CERO Rural, 174%
towards CSCO Rural, 131% towards HHMR and 106% towards its PSWMR obligations
respectively.
3.19. EDF’s carbon savings achieved in ECO2 were 2.41 MtCO2 under CERO and 0.69 MtCO2
under CSCO. They also delivered cost savings of £0.80 Bn under HHCRO.
3.20. Figure 3.3 shows that a large proportion of EDF’s CSCO Rural obligation was
achieved through measures carried over from ECO1 (58.91%).
3.21. Also, the majority of EDF’s PSWMR obligation was achieved from the combination of
measures carried forward as surplus actions from ECO1 to ECO2 (59.97%) and
measures that were delivered during ECO1 (21.51%).
0% 25% 50% 75% 100% 125% 150% 175% 200% 225%
CERO (2.24 MtCO2)
CERO Rural (0.12 MtCO2)
CSCO (0.69 MtCO2)
CSCO Rural (0.10 MtCO2)
HHCRO (£0.73 Bn)
HHMR (£0.23 Bn)
PSWMR (0.62 MtCO2)
ECO1 Measures % ECO2 Surplus Actions % ECO2 Non-Surplus Actions %
28
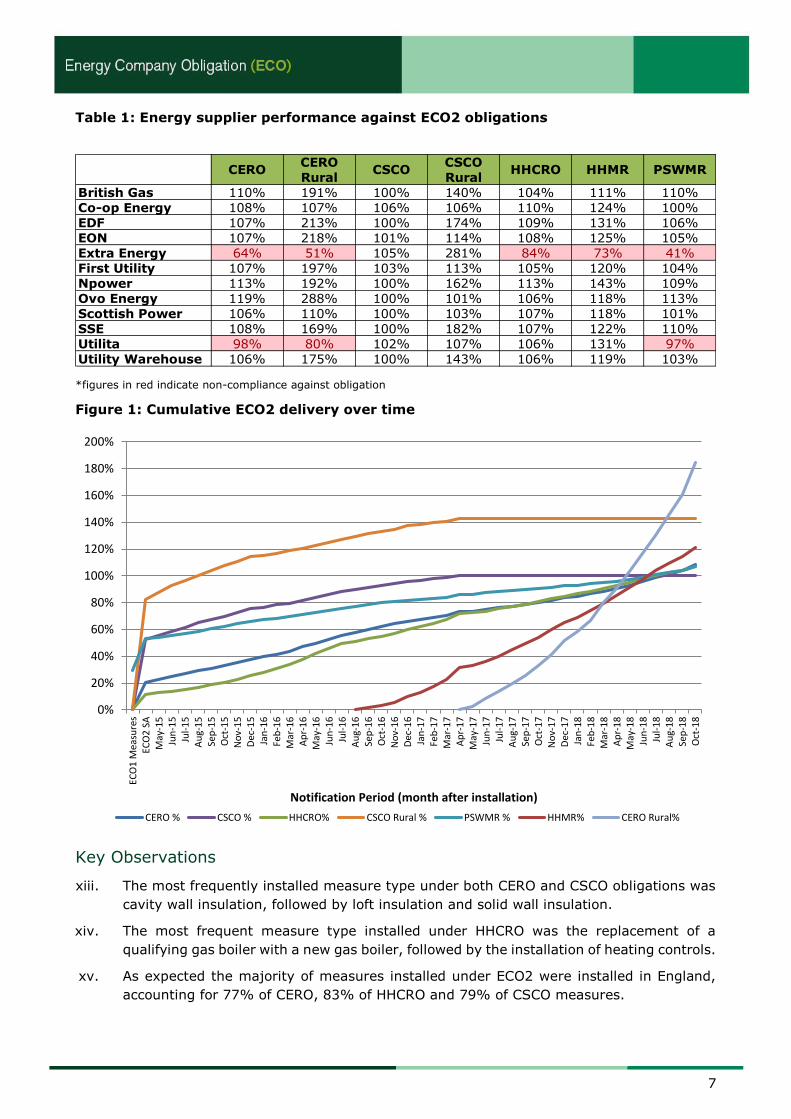
E.ON
3.22. Two EON licences were obligated under ECO2, and as shown in Table 3.5, they both
met all obligations.
Table 3.5: E.ON Energy performance against ECO2 obligations
Supplier
Licence CERO
CERO
Rural CSCO
CSCO
Rural HHCRO HHMR PSWMR
EON03407430E 107% 195% 102% 101% 108% 125% 100%
EON03407430G 100% n/a 101% 131% n/a n/a 143%
Overall
Achievement 107% 218%33 101% 114% 108% 125% 105%
Figure 3.4: E.ON performance against ECO2 obligations
3.23. Table 3.5 shows that E.ON achieved 107% towards its CERO obligation, 101%
towards its CSCO obligation and 108% toward its HHCRO obligation.
3.24. E.ON also achieved all of its sub-obligations with 218% towards CERO Rural, 114%
towards CSCO Rural, 125% towards HHMR and 105% towards its PSWMR obligations
respectively.
3.25. E.ON’s carbon savings achieved in ECO2 were 3.05 MtCO2 under CERO and 0.89
MtCO2 under CSCO. They also delivered cost savings of £1.00 Bn under HHCRO.
3.26. Figure 3.4 shows that the majority of E.ON’s CSCO and CSCO Rural obligations were
achieved through measures carried over as surplus action from ECO1 (81.66% and
92.66%).
33 Overall achievement of CERO Rural is greater than the individual licence achievement as some savings were approved against the non-obligated licence.
0% 25% 50% 75% 100% 125% 150% 175% 200% 225%
CERO (2.86 MtCO2)
CERO Rural (0.15 MtCO2)
CSCO (0.88 MtCO2)
CSCO Rural (0.13 MtCO2)
HHCRO (£0.93 Bn)
HHMR (£0.29 Bn)
PSWMR (0.81 MtCO2)
ECO1 Measures % ECO2 Surplus Actions % ECO2 Non-Surplus Actions %

29
Extra Energy
3.27. Two Extra Energy licences were obligated under ECO2, and as shown in Table 3.6,
they failed to meet all but their CSCO and CSCO Rural obligations. In November
2018, Extra Energy ceased trading.
3.28. Both of Extra Energy’s licences were revoked after they announced they would cease
trading.
Table 3.6: Extra Energy performance against ECO2 obligations
Supplier
Licence CERO
CERO
Rural CSCO
CSCO
Rural HHCRO HHMR PSWMR
XEN08053154E 74% 54% 100% 295% 90% 83% 51%
XEN08053154G 44% 48% 135% 197% 73% 58% 19%
Overall
Achievement 64% 51% 105% 281% 84% 73% 41%
Figure 3.5: Extra Energy performance against ECO2 obligations
3.29. Figure 3.6 shows that Extra Energy achieved only their CSCO (105%) and CSCO
Rural (281%) obligations.
3.30. They failed to achieve all other ECO2 obligations, but did deliver some measures in
each obligation. This contributed to the overall ECO2 targets being delivered. 3.31. Extra Energy’s carbon savings achieved in ECO2 were 0.07 MtCO2 under CERO and
0.01 MtCO2 under CSCO. They also delivered cost savings of £0.03 Bn under HHCRO.
0% 25% 50% 75% 100% 125% 150% 175% 200% 225% 250% 275% 300%
CERO (0.11 MtCO2)
CERO Rural (0.01 MtCO2)
CSCO (0.01 MtCO2)
CSCO Rural (0.002 MtCO2)
HHCRO (£0.04 Bn)
HHMR (£0.02 Bn)
PSWMR (0.02 MtCO2)
ECO1 Measures % ECO2 Surplus Actions % ECO2 Non-Surplus Actions %
30
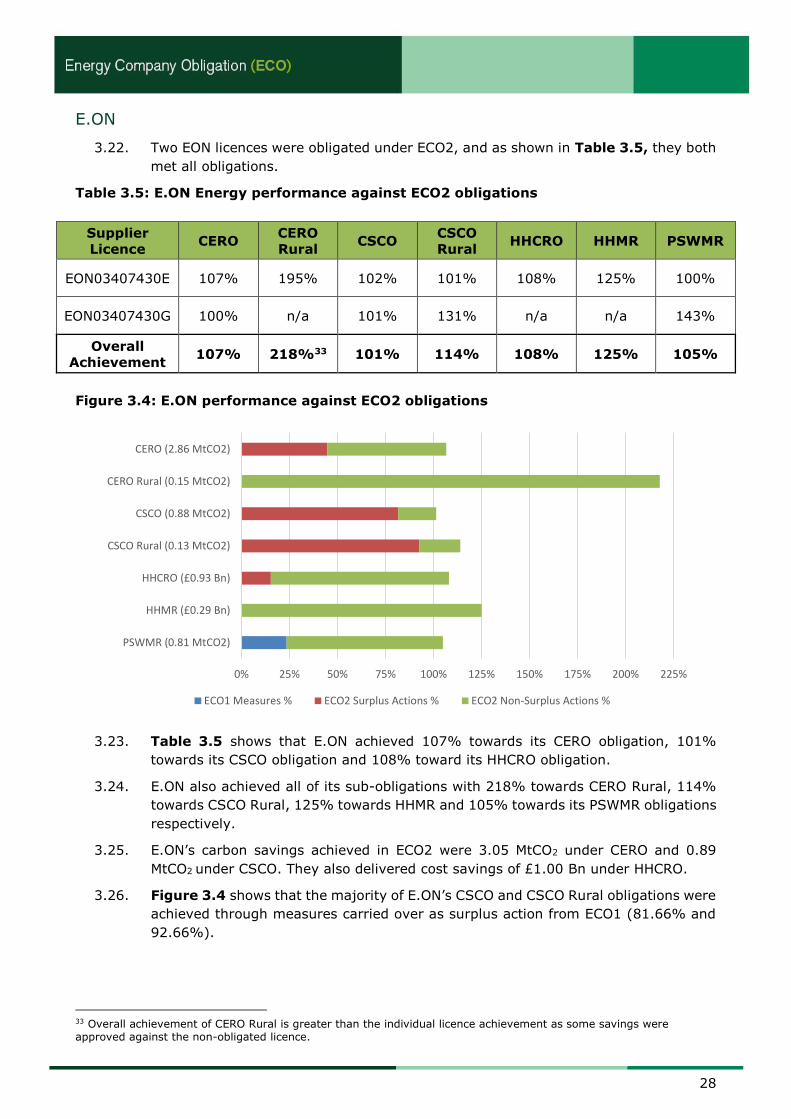
First Utility
3.32. Two First Utility licences were obligated under ECO2, and as shown in Table 3.7,
they both met all obligations.
Table 3.7: First Utility performance against ECO2 obligations
Supplier
Licence CERO
CERO
Rural CSCO
CSCO
Rural HHCRO HHMR PSWMR
FUL05070887E 149% n/a 103% 119% n/a n/a 102%
FUL05070887G 104% 179% 103% 109% 105% 120% 104%
Overall
Achievement 107% 197% 103% 113% 105% 120% 104%
Figure 3.6: First Utility performance against ECO2 obligations
3.33. Table 3.7 shows that First Utility achieved 107% towards its CERO obligation, 103%
towards its CSCO obligation and 105% toward its HHCRO obligation.
3.34. First Utility also achieved all of its sub-obligations with 197% towards CERO Rural,
113% towards CSCO Rural, 120% towards HHMR and 104% towards its PSWMR
obligations respectively.
3.35. First Utility’s carbon savings achieved in ECO2 were 0.69 MtCO2 under CERO and
0.18 MtCO2 under CSCO. They also delivered cost savings of £0.23 Bn under HHCRO.
3.36. Figure 3.6 shows that First Utility only carried forward a small amount of measures
from ECO1, with 11.95% of its CSCO Rural delivered by this method.
3.37. Also for their PSWMR, 1.36% was delivered by measured carried forward as surplus
actions from ECO1 and an additional 3.98% was achieved by measures delivered
under ECO1.
0% 25% 50% 75% 100% 125% 150% 175% 200%
CERO (0.65 MtCO2)
CERO Rural (0.04 MtCO2)
CSCO (0.17 MtCO2)
CSCO Rural (0.026 MtCO2)
HHCRO (£0.22 Bn)
HHMR (£0.08 Bn)
PSWMR (0.17 MtCO2)
ECO1 Measures % ECO2 Surplus Actions % ECO2 Non-Surplus Actions %

31
Npower
3.38. Npower delivered enough savings to meet all of their overall obligations and sub-
obligations.
3.39. Nine Npower licences were obligated under ECO2. Obligations were met on eight of
these, as shown in Table 3.8.
3.40. Npower under-delivered on one licence under CSCO (NPW03653277E). This was a
very small amount of 13 tonnes, resulting in licence-level achievement of 99.986%.
This is counterbalanced by over-delivery on their other CSCO licences.
3.41. We consider this administrative non-compliance as it represents a failure to balance
delivery across licences, as opposed to under-achievement of their overall obligation.
Table 3.8: Npower performance against ECO2 obligations
Supplier
Licence CERO
CERO
Rural CSCO
CSCO
Rural HHCRO HHMR PSWMR
NPW02845740E 111% 161% 100% 118% 110% 131% 114%
NPW02999919G 108% 185% 100% 316% 110% 135% 104%
NPW03432100G 116% 232% 100% 156% 120% 161% 107%
NPW03653277E 108% 168% 99.986% 156% 110% 133% 107%
NPW03768856G 516% 396% 142% 660% 129% 158% 205%
NPW03782443E 115% 171% 100% 131% 112% 139% 107%
NPW03782443G 364% 203% 111% 742% 113% 133% 1743%
NPW03937808G 113% 169% 100% 145% 113% 143% 107%
NPW04212116E 114% 189% 100% 154% 112% 139% 107%
Overall
Achievement 113% 192% 100% 162% 113% 143% 109%

32
Figure 3.7: Npower performance against ECO2 obligations
3.42. Table 3.8 shows that Npower achieved 113% towards its CERO obligation, 100%
towards its CSCO obligation and 113% toward its HHCRO obligation.
3.43. Npower also achieved all of its sub-obligations with 192% towards CERO Rural, 162%
towards CSCO Rural, 143% towards HHMR and 109% towards its PSWMR obligations
respectively.
3.44. Npower’s carbon savings achieved in ECO2 were 2.23 MtCO2 under CERO and 0.62
MtCO2 under CSCO. They also delivered cost savings of £0.73 Bn under HHCRO.
3.45. Figure 3.7 shows that Npower achieved all of their CSCO Rural obligation with
measures carried forward from ECO1, accounting for 118.83% of their total
achievement. They also delivered 72.29% of their main CSCO obligation in the same
manner.
0% 25% 50% 75% 100% 125% 150% 175% 200%
CERO (1.98 MtCO2)
CERO Rural (0.10 MtCO2)
CSCO (0.62 MtCO2)
CSCO Rural (0.09 MtCO2)
HHCRO (£0.65 Bn)
HHMR (£0.20 Bn)
PSWMR (0.55 MtCO2)
ECO1 Measures % ECO2 Surplus Actions % ECO2 Non-Surplus Actions %
33
OVO Energy
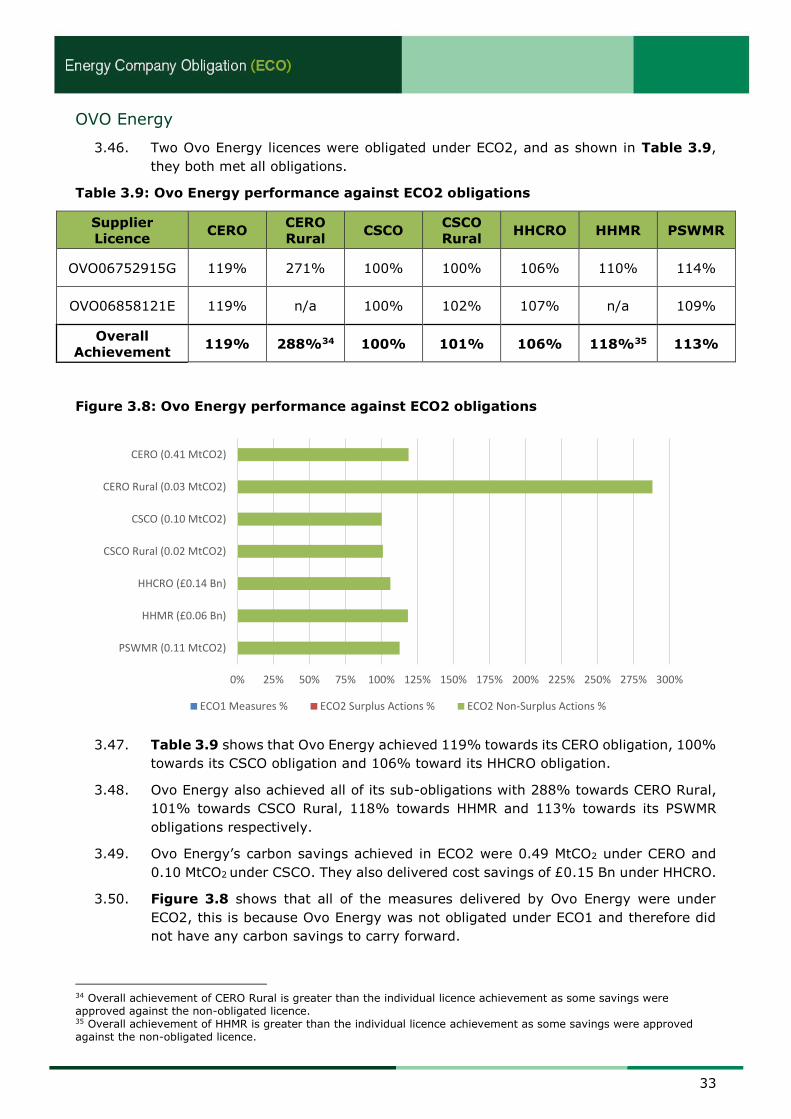
3.46. Two Ovo Energy licences were obligated under ECO2, and as shown in Table 3.9,
they both met all obligations.
Table 3.9: Ovo Energy performance against ECO2 obligations
Supplier
Licence CERO
CERO
Rural CSCO
CSCO
Rural HHCRO HHMR PSWMR
OVO06752915G 119% 271% 100% 100% 106% 110% 114%
OVO06858121E 119% n/a 100% 102% 107% n/a 109%
Overall
Achievement 119% 288%34 100% 101% 106% 118%35 113%
Figure 3.8: Ovo Energy performance against ECO2 obligations
3.47. Table 3.9 shows that Ovo Energy achieved 119% towards its CERO obligation, 100%
towards its CSCO obligation and 106% toward its HHCRO obligation.
3.48. Ovo Energy also achieved all of its sub-obligations with 288% towards CERO Rural,
101% towards CSCO Rural, 118% towards HHMR and 113% towards its PSWMR
obligations respectively.
3.49. Ovo Energy’s carbon savings achieved in ECO2 were 0.49 MtCO2 under CERO and
0.10 MtCO2 under CSCO. They also delivered cost savings of £0.15 Bn under HHCRO.
3.50. Figure 3.8 shows that all of the measures delivered by Ovo Energy were under
ECO2, this is because Ovo Energy was not obligated under ECO1 and therefore did
not have any carbon savings to carry forward.
34 Overall achievement of CERO Rural is greater than the individual licence achievement as some savings were approved against the non-obligated licence. 35 Overall achievement of HHMR is greater than the individual licence achievement as some savings were approved against the non-obligated licence.
0% 25% 50% 75% 100% 125% 150% 175% 200% 225% 250% 275% 300%
CERO (0.41 MtCO2)
CERO Rural (0.03 MtCO2)
CSCO (0.10 MtCO2)
CSCO Rural (0.02 MtCO2)
HHCRO (£0.14 Bn)
HHMR (£0.06 Bn)
PSWMR (0.11 MtCO2)
ECO1 Measures % ECO2 Surplus Actions % ECO2 Non-Surplus Actions %
34
Scottish Power
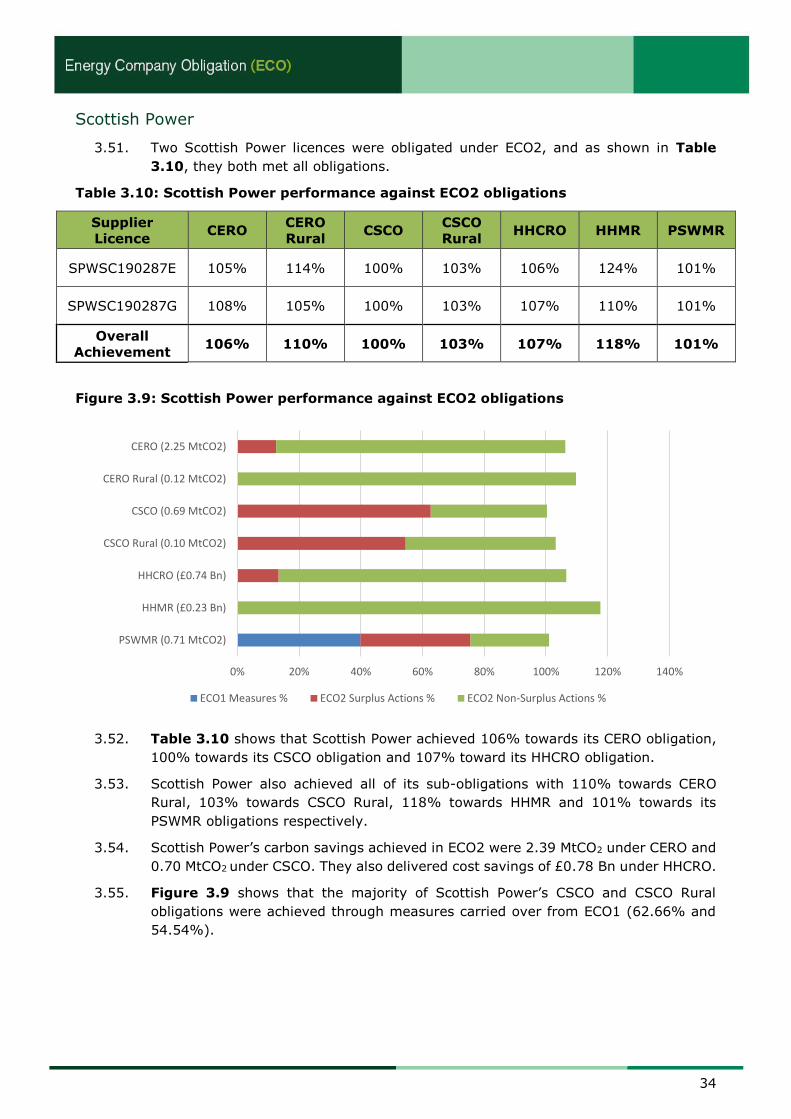
3.51. Two Scottish Power licences were obligated under ECO2, and as shown in Table
3.10, they both met all obligations.
Table 3.10: Scottish Power performance against ECO2 obligations
Supplier
Licence CERO
CERO
Rural CSCO
CSCO
Rural HHCRO HHMR PSWMR
SPWSC190287E 105% 114% 100% 103% 106% 124% 101%
SPWSC190287G 108% 105% 100% 103% 107% 110% 101%
Overall
Achievement 106% 110% 100% 103% 107% 118% 101%
Figure 3.9: Scottish Power performance against ECO2 obligations
3.52. Table 3.10 shows that Scottish Power achieved 106% towards its CERO obligation,
100% towards its CSCO obligation and 107% toward its HHCRO obligation.
3.53. Scottish Power also achieved all of its sub-obligations with 110% towards CERO
Rural, 103% towards CSCO Rural, 118% towards HHMR and 101% towards its
PSWMR obligations respectively.
3.54. Scottish Power’s carbon savings achieved in ECO2 were 2.39 MtCO2 under CERO and
0.70 MtCO2 under CSCO. They also delivered cost savings of £0.78 Bn under HHCRO.
3.55. Figure 3.9 shows that the majority of Scottish Power’s CSCO and CSCO Rural
obligations were achieved through measures carried over from ECO1 (62.66% and
54.54%).
0% 20% 40% 60% 80% 100% 120% 140%
CERO (2.25 MtCO2)
CERO Rural (0.12 MtCO2)
CSCO (0.69 MtCO2)
CSCO Rural (0.10 MtCO2)
HHCRO (£0.74 Bn)
HHMR (£0.23 Bn)
PSWMR (0.71 MtCO2)
ECO1 Measures % ECO2 Surplus Actions % ECO2 Non-Surplus Actions %

35
SSE
3.56. Two SSE licences were obligated under ECO2, and as shown in Table 3.11, they
both met all obligations.
Table 3.11: SSE performance against ECO2 obligations
Supplier
Licence CERO
CERO
Rural CSCO
CSCO
Rural HHCRO HHMR PSWMR
SSE02716495G 108% 169% 100% 200% 107% 122% 109%
SSE03757502E 121% n/a 100% 167% n/a n/a 120%
Overall
Achievement 108% 169% 100% 182% 107% 122% 110%
Figure 3.10: SSE performance against ECO2 obligations
3.57. Table 3.11 shows that SSE achieved 108% towards its CERO obligation, 100%
towards its CSCO obligation and 107% toward its HHCRO obligation.
3.58. SSE also achieved all of its sub-obligations with 169% towards CERO Rural, 182%
towards CSCO Rural, 122% towards HHMR and 110% towards its PSWMR obligations
respectively.
3.59. SSE’s carbon savings achieved in ECO2 were 3.08 MtCO2 under CERO and 0.89 MtCO2
under CSCO. They also delivered cost savings of £0.99 Bn under HHCRO.
3.60. Figure 3.10 shows that SSE’s achieved more than 100% of their CSCO Rural
obligation through measures carried over from ECO1, these account for 156.22% of
the total CSCO Rural achievement.
3.61. In addition, the majority of measures delivered by SSE under CSCO and PSWMR were
also carried forward as surplus actions from ECO1, accounting for 72.87% and
0% 20% 40% 60% 80% 100% 120% 140% 160% 180% 200%
CERO (2.85 MtCO2)
CERO Rural (0.15 MtCO2)
CSCO (0.89 MtCO2)
CSCO Rural (0.13 MtCO2)
HHCRO (£0.93 Bn)
HHMR (£0.29 Bn)
PSWMR (0.74 MtCO2)
ECO1 Measures % ECO2 Surplus Actions % ECO2 Non-Surplus Actions %

36
52.01% of the respective obligations. A further 5.78% of their PSWMR was achieved
from measures delivered under ECO1.
Utilita
3.62. Two Utilita licences were obligated under ECO2, and as shown in Table 3.12, they
failed to meet their CERO, CERO Rural and PSWMR obligations.
3.63. Utilita also under-delivered on one licence under HHCRO and HHMR
(UTA04849181G), however this was counterbalanced by over-delivery on their other
HHCRO and HHMR licence.
3.64. We consider this administrative non-compliance as it represents a failure to balance
delivery across licences, as opposed to under-achievement of their overall HHCRO
and HHMR obligations. Table 3.12: Utilita performance against ECO2 obligations
Supplier
Licence CERO
CERO
Rural CSCO
CSCO
Rural HHCRO HHMR PSWMR
UTA04849181E 102% 99% 102% 107% 110% 146% 100%
UTA04849181G 82% 33% n/a n/a 92% 94% 80%
Overall
Achievement 98% 80% 102% 107% 106% 131% 97%
Figure 3.11: Utilita performance against ECO2 obligations
3.65. Table 3.12 shows that Utilita achieved 98% towards its CERO obligation, 102%
towards its CSCO obligation and 106% toward its HHCRO obligation.
3.66. Utilita achieved its CSCO Rural and HHMR sub-obligations with 107% towards CSCO
Rural and 131% towards HHMR.
3.67. Utilita fell short of its CERO rural target by 20%, and also fell slightly short of its
PSMWR by delivering 97% of its savings target.
0% 20% 40% 60% 80% 100% 120% 140%
CERO (0.09 MtCO2)
CERO Rural (0.01 MtCO2)
CSCO (0.01 MtCO2)
CSCO Rural (0.002 MtCO2)
HHCRO (£0.03 Bn)
HHMR (£0.02 Bn)
PSWMR (0.02 MtCO2)
ECO1 Measures % ECO2 Surplus Actions % ECO2 Non-Surplus Actions %

37
3.68. Utilita’s carbon savings achieved in ECO2 were 0.09 MtCO2 under CERO and 0.01
MtCO2 under CSCO. They also delivered cost savings of £0.04 Bn under HHCRO.
3.69. Figure 3.11 shows that all of the measures delivered by Utilita were under ECO2,
this is because Utilita was not obligated under ECO1 and therefore did not have any
carbon savings to carry forward.
3.70. We will consider what action might be necessary to address this non-compliance.
Utility Warehouse
3.71. Two Utility Warehouse licences were obligated under ECO2, and as shown in Table
3.13, they both met all obligations.
Table 3.13: Utility Warehouse performance against ECO2 obligations
Supplier
Licence CERO
CERO
Rural CSCO
CSCO
Rural HHCRO HHMR PSWMR
UTW05199935G 108% 185% 100% 142% 106% 118% 103%
UTW05199936E 105% 163% 100% 145% 107% 120% 103%
Overall
Achievement 106% 175% 100% 143% 106% 119% 103%
Figure 3.12: Utility Warehouse performance against ECO2 obligations
3.72. Table 3.13 shows that Utility Warehouse achieved 106% towards its CERO
obligation, 100% towards its CSCO obligation and 106% toward its HHCRO
obligation.
3.73. Utility Warehouse also achieved all of its sub-obligations with 175% towards CERO
Rural, 143% towards CSCO Rural, 119% towards HHMR and 103% towards its
PSWMR obligations respectively.
0% 25% 50% 75% 100% 125% 150% 175% 200%
CERO (0.39 MtCO2)
CERO Rural (0.02 MtCO2)
CSCO (0.12 MtCO2)
CSCO Rural (0.02 MtCO2)
HHCRO (£0.13 Bn)
HHMR (£0.04 Bn)
PSWMR (0.10 MtCO2)
ECO1 Measures % ECO2 Surplus Actions % ECO2 Non-Surplus Actions %

38
3.74. Utility Warehouse’s carbon savings achieved in ECO2 were 0.41 MtCO2 under CERO
and 0.12 MtCO2 under CSCO. They also delivered cost savings of £0.13 Bn under
HHCRO.
3.75. Figure 3.12 shows that the majority of Utility Warehouses’ CSCO Rural obligation
was achieved through measures carried over from ECO1 (75.64%).
3.76. Also, the majority of Utility Warehouse’s PSWMR obligation was achieved from the
combination of measures carried forward as surplus actions from ECO1 to ECO2
(29.79%) and measures that were delivered during ECO1 (30.33%).

39
4. Monitoring and Compliance
Chapter Overview
This chapter explains the activities undertaken by us to support ECO compliance. It includes an
overview of the monitoring and compliance activities we required and administered, along with
the results and actions taken.
Introduction
4.1. To ensure that all measures under ECO2 were valid and notified accurately, we
undertook a number of core compliance activities over the lifetime of the scheme.
These included the review of measures to ensure they complied with the legislation
and our guidance, requiring energy suppliers to conduct technical monitoring of
installations, auditing of energy companies, investigating suspected fraudulent
activity and verifying savings attributed to measures.
Measure Processing
4.2. Each month, after measures had been notified to us, we assessed the information
provided by the energy companies to check whether the measures met the
requirements set out in the legislation as well as our guidance. Checks were
conducted across all aspects of the information notified, including in relation to the
eligibility requirements for each obligation, notified carbon and costs scores, and
technical requirements.
4.3. Errors in notification were sent back to energy companies for correction each month.
These related to either missing or incorrect information provided for a measure and
were often caused by administrative oversight. Error rates were initially high, as was
expected for the start of a new scheme period, but settled to an average of 3.83%.
4.4. Figure 4.1 highlights the 5 fields or categories with the highest volumes of errors in
notification.
Figure 4.1: Notification error categories with the highest volumes under ECO2
Field/Category Total number of
errors
Percentage of
total errors
Name and Version of Scoring Tool Used 15,923 32.65%
Wall Guarantee 6,722 13.79%
DWP Reference Number 4,375 8.97%
Carbon Score TCO2 3,654 7.49%
Post Main Heating Source For the Property 2,908 5.96%
4.5. Whilst energy companies were required to notify measures to us the month after
they had been installed, there was a mechanism which allowed an extension of this
monthly deadline. Energy companies were granted an extension if they were not able
to notify a measure on time due to unforeseen circumstances (excluding
administrative oversight).

40
4.6. In ECO2t automatic extensions were introduced where up to 5% of the number of
measures installed in a particular calendar month, and notified on time, could be
given an automatic extension of three months to the notification deadline (the
automatic 5%). The first 5% of late measures notified to us for a particular calendar
month without an extension request were given this automatic extension.
4.7. We received 132 extension requests covering 6,015 measures. 87% of these
requests were approved. In ECO2t 5,479 measures were notified as automatic
extensions.
4.8. Another mechanism available to energy companies to manage compliance with their
obligations was transfer requests. The transfer of measures could occur between
licences held by the same or different companies. We received a total of 260 transfer
requests, of which we approved 249. The remaining 11 transfer requests were
withdrawn by suppliers. The majority of approved transfers (77%) occurred between
licences held by the same energy company in order to balance or optimise their
savings. Some were between energy companies to meet obligations (23%). Out of
the 249 approved, 52 of these transfer requests involved Utility Warehouse and
another company, enabling Utility Warehouse to meet their obligations.
Refused or Revoked Savings
4.9. Measures could only count towards a supplier’s ECO2 obligation if they met all the
relevant requirements under the ECO2 Order.
4.10. Following all of our compliance checks, when we determined that measures had not
met all the relevant requirements of the ECO2 Order, we refused or revoked savings
attributed to these measures. Suppliers also identified non-compliant measures
through their own internal processes.
4.11. We refused or revoked savings for 11,742 measures (including surplus actions), this
accounted for 0.81% of total measures notified. These measures accounted for
0.69% or all CERO measures notified; 1.07% of all HHCRO measures notified; and
0.53% of all CSCO measures notified. Since CSCO final determination we have
rejected an additional 245 CSCO measures. This was a result of various non-
compliance issues being identified after CSCO final determination, such as duplicate
measures and measures not being installed. Figure 4.2 below highlights the five
main reasons for refusing or revoking savings.
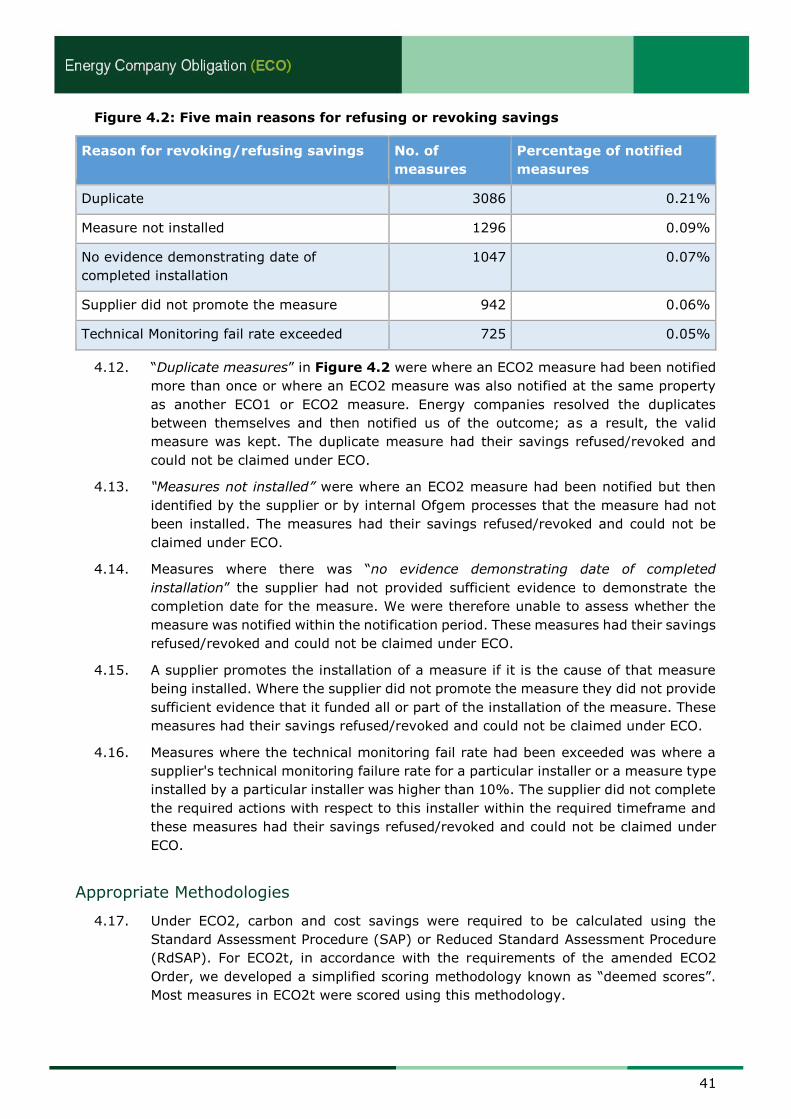
41
Figure 4.2: Five main reasons for refusing or revoking savings
Reason for revoking/refusing savings No. of
measures
Percentage of notified
measures
Duplicate 3086 0.21%
Measure not installed 1296 0.09%
No evidence demonstrating date of
completed installation
1047 0.07%
Supplier did not promote the measure 942 0.06%
Technical Monitoring fail rate exceeded 725 0.05%
4.12. “Duplicate measures” in Figure 4.2 were where an ECO2 measure had been notified
more than once or where an ECO2 measure was also notified at the same property
as another ECO1 or ECO2 measure. Energy companies resolved the duplicates
between themselves and then notified us of the outcome; as a result, the valid
measure was kept. The duplicate measure had their savings refused/revoked and
could not be claimed under ECO.
4.13. “Measures not installed” were where an ECO2 measure had been notified but then
identified by the supplier or by internal Ofgem processes that the measure had not
been installed. The measures had their savings refused/revoked and could not be
claimed under ECO.
4.14. Measures where there was “no evidence demonstrating date of completed
installation” the supplier had not provided sufficient evidence to demonstrate the
completion date for the measure. We were therefore unable to assess whether the
measure was notified within the notification period. These measures had their savings
refused/revoked and could not be claimed under ECO.
4.15. A supplier promotes the installation of a measure if it is the cause of that measure
being installed. Where the supplier did not promote the measure they did not provide
sufficient evidence that it funded all or part of the installation of the measure. These
measures had their savings refused/revoked and could not be claimed under ECO.
4.16. Measures where the technical monitoring fail rate had been exceeded was where a
supplier's technical monitoring failure rate for a particular installer or a measure type
installed by a particular installer was higher than 10%. The supplier did not complete
the required actions with respect to this installer within the required timeframe and
these measures had their savings refused/revoked and could not be claimed under
ECO.
Appropriate Methodologies
4.17. Under ECO2, carbon and cost savings were required to be calculated using the
Standard Assessment Procedure (SAP) or Reduced Standard Assessment Procedure
(RdSAP). For ECO2t, in accordance with the requirements of the amended ECO2
Order, we developed a simplified scoring methodology known as “deemed scores”.
Most measures in ECO2t were scored using this methodology.
42
4.18. In cases where SAP, RdSAP or deemed scores could not be used to calculate the
savings, then energy companies could apply to use an alternative methodology.
4.19. One alternative methodology was submitted to us, which we approved as meeting
the requirements set out in the Order. This methodology enabled the calculation of
carbon savings achieved by measures installed in multiple occupancy premises, for
example, student halls or hostels, where these premises meet the ECO2 definition of
domestic premises. These premises could not be modelled in SAP, RdSAP or deemed
scores, therefore we approved the Simplified Building Energy Model (SBEM) to be
used to calculate savings in these types of properties.
4.20. Under ECO2 4.5% of measures were scored using SAP, 73.8% were scored using
RdSAP and 21.4% were scored using deemed scores. The remaining 0.3% were
scored using SBEM.
4.21. After the introduction of deemed scores during phase 3, this became the most
common scoring method for measures with 94.46% of ECO2t measures being
scored this way.
Score Verification
4.22. As part of our checks to ensure the savings notified were accurate, we conducted
score verification during ECO2, which assessed the carbon savings calculated using
SAP and RdSAP and focused on identifying abnormally high/low carbon scores and
abnormally high/low floor areas. This allowed us to identify scores that fell outside
an expected range for a measure, property and fuel type mix. We required suppliers
to verify the scores for these measures and re-notify the corrected inputs if errors
were identified.
4.23. On 1 April 2017, deemed scores were introduced, replacing the approach of
calculating bespoke carbon savings for all measure types. As a result, score
verification had ceased in this form.
4.24. In total, 20,041 ECO2 measures were identified for score verification, this was split
between 12,271 in CERO, 3,172 in CSCO and 4,598 in HHCRO. 34.5% of these
measures were rejected as part of the score verification checks. The remaining 65.5%
of the measures required the suppliers or third parties to investigate further. This
resulted in measures requiring amendments to measure notifications after
investigations found measures were incorrectly notified or in some cases the supplier
found no issues with the measures and therefore required no further investigation.
4.25. A range of measure types were part of score verification, including solid wall
insulation, cavity wall insulation, loft insulation, room in roof insulation, under floor
insulation, window glazing, flat roof insulation and district heating systems.
Technical and Score Monitoring
4.26. Technical and Score monitoring was a requirement placed on energy companies by
Ofgem to ensure that ECO measures were installed to the required standards and
scored accurately. It consisted of on-site inspections conducted by independent,
suitably qualified technical monitoring agents.
4.27. Energy companies were required to commission monitoring on a 5% sample of the
measures that they had delivered. Additionally, to ensure that the monitoring
conducted by a supplier is representative of both the installers used by that supplier,
and the measure types notified by the supplier, there are two further requirements.
A supplier was required to:

43
Monitor 5% of measures of each measure type notified in a quarter, and;
Monitor at least 3% of measures notified as being installed by a single installer
in a quarter
Monitor at least 1 measure of installers who have notified fewer than 100
measures in the quarter (‘small installers’).
4.28. Where measures failed monitoring we required the energy companies to resolve any
issues discovered.
4.29. Monitoring agents, independent of any parties involved in the installation of the
measure, assessed the standard of installation and ECO scoring inputs against a
standard questionnaire provided by us. The results were reported to us by energy
companies on a quarterly basis.
4.30. All energy companies achieved at least the 5% required monitoring rate. Figure 4.3
below shows the total technical and score monitoring fail rate by each energy
company.
Figure 4.3: Technical and Score Monitoring fail rate by energy company
Energy Company Technical Monitoring Fail
Rate (%)
Score Monitoring Fail
Rate (%)
British Gas 5.87 4.85
The Co-operative Energy 6.22 6.25
EDF Energy 7.07 8.14
E.ON 12.48 9.41
Extra Energy 12.93 1.02
First Utility 2.87 3.20
Npower 6.85 3.59
OVO 5.78 3.41
Scottish Power 6.34 7.21
SSE 9.40 5.26
Utilita 13.77 7.69
Overall 5.87 5.92
4.31. Figure 4.4 below shows the technical and scoring installation failure rates over time.
The quarters shown relate to the quarter in which the monitoring was conducted.
These failure rates exclude any reported fails that were subsequently overturned.
The technical monitoring fail rate is higher in ECO2t than ECO2. The technical
monitoring fail rate for small installers in ECO2t was 12.21% compared to a fail rate
of 9.81% for large installers.

44
Figure 4.4: Monitoring failure rates over time.
4.32. If a measure failed monitoring based on the standard of installation, energy
companies were required to remediate (i.e. correct) the measure. Once this
remediation had taken place, a further inspection had to be passed to ensure any
fault with the measure had been properly remediated. Of the 7440 measures that
failed technical monitoring based on the standard of installation 7426 (94.54%) were
remediated and passed re-inspection.
4.33. If a measure failed monitoring because of an inaccuracy in a scoring input, the energy
companies were required to review and provide a revised, accurate score for the
measure. Of the total 5133 scoring fails, 4985 (97.12%) were rescored.
4.34. Where energy companies were unable to resolve an issue identified through technical
monitoring (e.g. they were unable to gain access to a property or could not accurately
re-score the measure) and did not meet our requirements, we did not attribute
savings to the measure. This meant that the measure could not be attributed towards
an energy company’s obligation.
4.35. Where we did not attribute savings to a measure, we still expected the energy
company to seek to remedy any failures for the benefit of the consumer.
Pathways to compliance
4.36. Where an installer did not inspect the minimum required number of measures, or
breached set failure rate tolerances (20% for score monitoring and 10% for technical
monitoring in ECO2, 10% for score and technical monitoring in ECO2t) it was placed
on a “Pathway to Compliance”. This meant that an installer’s measures, notified by a
particular supplier and within a set quarter, were placed at risk of rejection until
appropriate action was undertaken to satisfy us that the installer could meet the
relevant requirements. In the first instance this meant performing additional
inspections to either meet the required monitoring rate or to confirm or refute the
original reported failure rate.
4.37. Where the failure rate remained above the tolerance, suppliers were required to
submit additional assurances (including actions such as root cause analyses and
0%
2%
4%
6%
8%
10%
12%
14%
May-Jul2015
Aug-Oct2015
Nov-Jan2016
Feb-Apr2016
May-Jul2016
Aug-Oct2016
Nov-Jan2017
Feb-Apr2017
May-Jul2017
Aug-Oct2017
Nov-Jan2018
Feb-Apr2018
May-Jul2018
Aug-Oct2018
% F
ailu
re R
ate
Monitoring Quarter
Score Monitoring Fail Rate Technical Monitoring Fail Rate Total Fail Rate

45
improvement plans) to provide Ofgem with assurance that installation and scoring
issues were addressed. This was intended to give Ofgem increased confidence in the
quality of that installer’s measures moving forward.
4.38. In ECO2 we opened 1,104 pathways to compliance. In ECO2t we opened 2,514
pathways to compliance. The increase is mainly due to a high amount of small
installers being placed on a pathway to compliance for insufficient monitoring. This
reflects a change in the ECO2t supply chain with suppliers choosing to partner with
more small installers.
4.39. Pathways were only closed once we had received the results of additional monitoring
and assurance that gave us sufficient confidence over the quality and accuracy of an
installer’s installations. Where there was insufficient evidence to support the eligibility
of any measure, approval was refused or revoked. Insufficient monitoring or
assurance resulted in measures on 91 pathways to compliance being refused or
revoked.
Audit
4.40. A key aspect of our ECO2 administration was developing and managing an effective
auditing framework. The aim of the framework was to minimise the risk and impact
of non-compliance with scheme requirements on consumers. We worked with all
energy companies to detect and mitigate this risk.
4.41. A number of audit activities were conducted during ECO2. These included a mixture
of process-based and measure-specific audits. Initial ‘health checks’ were conducted
at the beginning of the scheme or when an energy company became obligated. These
assessed the readiness of energy companies for delivering ECO and notifying
measures to us. Following these, annual process-based audits assessed the
procedures and compliance checks for measures in place by energy companies. These
were complimented by measure-specific audits, which included a mix of
documentation reviews and on-site monitoring activity.
Process Audits
4.42. Our process audits focussed on the controls energy companies had in place to ensure
they notified compliant measures. For some audits, an independent external auditing
company was commissioned. For others, specific suppliers were permitted to self-
audit provided they met relevant criteria and conducted checks according to the
Terms of Reference (ToR) provided by Ofgem. The reviews were consistent and
benchmarked energy companies against good practice. We made recommendations
where relevant and worked with energy companies to ensure they were implemented.
Discretionary Audits
Wall Guarantees
4.43. In October 2017 we instigated an audit into ECO Appropriate Guarantees claimed for
solid wall insulation (SWI), cavity wall insulation (CWI) and park home insulation
(PHI) measures notified under ECO. Concern was triggered when discrepancies were
identified between the number of ECO guarantees issued by ECO guarantee
providers, and the number of SWI, CWI and PHI measures being notified under ECO2
by suppliers.
4.44. Four out of the then six ECO2 guarantee providers agreed to participate in the audit.
The audit checked whether relevant measures being claimed under ECO2 had ECO2
appropriate guarantees in place. Guarantee providers were issued with a sample of

46
measures notified under ECO2 as having their appropriate guarantee in place and we
requested they identify any inaccuracies.
4.45. The audit produced an overall fail rate of 19%, i.e. 19% of measures claimed with a
particular guarantee did not have that guarantee in place.
4.46. EWI high rise measures stood out as having a particularly high fail rate (69%).
Therefore, all EWI high rise measures were investigated by suppliers. Most of those
that failed did so as a result of the wrong guarantee code being notified to Ofgem.
These were re-notified correctly.
4.47. A number of those without guarantees managed to obtain suitable protection via
alternative assurances as afforded by the WING policy36. The remainder were
rejected if they were HHCRO measures and rescored to zero if they were CERO
measures, in accordance with our WING policy.
4.48. The average failure rates for CWI measures (5%) and non-high rise EWI measures
(11%) were notably high however varied considerably between suppliers. We decided
a blanket approach as an outcome would not be appropriate given this variance.
Instead, we provided each supplier with their own results, giving them the
opportunity to investigate further.
4.49. The suppliers were able to demonstrate that the wrong guarantee code had been
notified for the majority of measures. These were re-notified correctly. Where
guarantees hadn’t been issued the suppliers investigated the relevant installers
further in order to provide appropriate assurance on the remaining measures.
4.50. Where no assurance could be provided that a guarantee was in place, the relevant
measures were rejected if they were HHCRO measures and rescored to zero if they
were CERO measures, in accordance with our WING policy.
4.51. Suppliers with notification errors were also required to conduct an internal review of
their guarantee notification process and provide us with assurance that this issue
would not persist.
Room-in-roof Insulation (RIRI)
4.52. Over the course of 2016, concerns were raised in relation to the standards of
installation on some room-in-roof insulation (RIRI) measures. As a result, we
published a clarification on 29th July 201637 confirming that, where feasible, 100% of
a RIRI measure must be insulated.
4.53. We conducted an investigation of RIRI measures installed before this clarification was
published. We asked obligated suppliers to commission site inspections on a sample
of relevant measures. The purpose of this was to determine whether the measures
were installed to the level claimed in the notification to us; and if not, to establish
the level of difference between the insulation actually installed and that notified to
us.
4.54. As a result of this activity, we found that 52% of ECO2 RIRI measures installed before
our clarification was published had not been installed to the level notified to us. On
average, the percentage of measure actually installed was 17% less than claimed on
36https://www.ofgem.gov.uk/system/files/docs/2016/02/technicalrequirementsconsultationresponse_2.pdf 37 https://www.ofgem.gov.uk/publications-and-updates/room-roof-insulation-riri-measures-under-energy-company-obligation-eco
47
the notification to us. This figure was arrived at excluding the party wall (i.e. by
assuming that none of the RIRI measures had a party wall element to them).
4.55. Based on the concerning findings, we took action to ensure the notified scores for all
RIRI measures were an accurate reflection of the actual installations. With agreement
from suppliers, a correction to the percentage of measure installed was applied to all
RIRI measures installed before 29th July 2016. The scale of the correction was 17%,
or the observed difference for each supplier (whichever was the lesser). We also
encouraged suppliers to discuss this activity with their delivery partners to ensure
measures were compliant going forward. Further information about this investigation
can be found in the RIRI Investigation Update on our website.38
Qualifying Boilers
4.56. Under ECO2, in order for a boiler measure installed under HHCRO to be a qualifying
boiler replacement, the pre-existing boiler at the premises had to meet specific
criteria of a qualifying boiler: 1) not functioning efficiently or has broken down; or 2)
has a seasonal efficiency of below 86%, or above 86% and unable to be economically
repaired. To determine whether or not the pre-existing boiler is a qualifying boiler,
Ofgem requires suppliers to complete a Boiler Assessment Checklist (BACL), or
equivalent document, for the pre-existing boiler. This should record whether the pre-
existing boiler meets the criteria for a qualifying boiler and whether it is suitable to
be replaced.
4.57. This area was identified as a potential compliance risk following poor audit results in
ECO1. We commissioned independent audits between October and December 2015
on qualifying boiler measures submitted by obligated energy suppliers. This focused
on the eligibility of pre-existing boilers at premises where qualifying boiler
replacement measures were to be installed. They were based on both blind audits
and a comparative review of the BACL.
4.58. The results of the audit were generally good, with an overall failure rate of 9%. Where
boilers were found to not be qualifying, the installations went ahead so the consumer
was not disadvantaged. We then discussed further action in terms of ECO notification
with suppliers on an individual basis.
U-Values
4.59. In June 2016, Ofgem introduced a new policy for cavity wall insulation (CWI)
measures with overwritten U-values in order to provide additional assurance over the
savings attributed to these measures. This was based on the compliance risk that
some U-values were overstated to increase the savings scores for measures.
4.60. In order to provide assurance over the savings attributed to these measures, we
commissioned independent desk-based audits to specifically target CWI measures
that were scored with a bespoke calculated U-value that was different from the SAP
default value. There were two elements to the audit activity:
1) retrospective audit of ECO2 CWI measures with overwritten U-values
which were installed between April 2015 and May 2016 (from the start of
ECO2 until when the new policy was implemented). The purpose of this was
to identify measures with incorrectly calculated U-values and establish how
frequently this occurred.
38 https://www.ofgem.gov.uk/publications-and-updates/room-roof-insulation-investigation-update

48
2) CWI measures installed after the new policy was implemented. The
purpose of this was to determine whether these measures complied with the
updated requirements.
4.61. Overall, limited evidence of U-value manipulation was found. A small number of
measures were identified as having implausible inputs to the U-value calculation
which suppliers were required to rescore correctly. There is more information about
this audit and its results in U-value report on our website.39
Fraud Prevention
4.62. The supply chain for ECO delivery can consist of a number of different elements. Over
our administration of ECO we have identified aspects of this supply chain which may
be vulnerable to fraudulent activity. We require that energy companies have robust
controls in place for detecting and mitigating fraud within their supply chains.
4.63. We regard fraudulent activity as covering any dishonesty or intentional
misrepresentation in the context of the ECO2 Order or our guidance. We also
scrutinised behaviour which may have undermined the government’s policy intent or
our administration of the scheme.
4.64. Throughout ECO2 we took the following steps in order to mitigate the risk of fraud:
Taking a zero tolerance approach to fraud by investigating all cases of
suspected fraud, reporting matters to Action Fraud and any relevant
accreditation bodies when suspected fraudulent activity is found. As a result,
we have developed relationships with external stakeholders who can assist us
with investigations into suspected fraud.
Chairing the quarterly forum of the ECO Industry Fraud Prevention and
Compliance Committee to engage with suppliers and discuss fraud risks and
drive best practice.
Reviewing the energy company’s fraud strategies, alongside Ofgem’s ECO
Fraud prevention strategy, to ensure they are effective and robust and offering
guidance on where they could be strengthened.
Primary Areas of Concern
4.65. Forty-five percent of suspected fraud cases with ECO2 measures looked at
documentation issues, for example misrepresentation of installation date and the
provision of appropriate signatures. These two examples make up the vast majority
of the measures investigated with falsified signature concerns coming to light on both
householder documentation and landlord or management company permission
forms. This will continue to be monitored by requesting and reviewing supporting
documents in line with Ofgem guidance.
4.66. Thirty-seven percent of suspected fraud measures investigated were focused on
manipulation of property information to inflate scores for measures. EPCs were a
target for manipulation in particular with ECO2 measures; 81% of measures
investigated for potential score inflation are in that group. The move to deemed
scoring in ECO2t saw score inflation investigations reduce and the 19% of measures
in this group looked at concerns around misrepresentation of bedroom numbers,
main heating type and ‘Percentage of Property Treated’ (POPT).
4.67. Sixteen percent of measures investigated were looking into the concern of non-
installation. Falsified documentation would also be an issue with non-installed
measures uncovered as considerable documentary evidence will have been fabricated
including the likelihood of stock photography use. We have provided advice to
suppliers on using online tools to help these investigations and documentation checks
39 https://www.ofgem.gov.uk/publications-and-updates/retrospective-u-value-audit

49
including the encouragement of increased customer contact exercises after
installation. Such activity is beneficial as it provides the opportunity to expose a
potential concern of non-install early.
Investigations
4.68. As a result of our suspected fraud investigations into 17,403 measures, 12,796 (73%)
measures were retained as unchanged as the concerns were proven not to be
suspicious through investigation or could not be verified, 1,865 (11%) were amended
and 2,733 (16%) were refused savings.
4.69. At the time of our final determination, a total of 1,212 ECO2 measures remained
under investigation relating to suspected fraud which could not be resolved before
31 March 2019. The associated savings would not currently cause any energy
company to fail in achieving their obligations.
Room-in-roof Insulation (RIRI) Investigation
4.70. In September 2017 we conducted an investigation into Room-in-roof insulation
(RIRI) measures after concerns were raised about;
1) the installation methods used for sloping ceiling elements, and
2) increased risk of condensation where a RIRI measure is installed to less
than 100% and this has not been accounted for in the design of the measure
4.71. In relation to the first concern, after thorough engagement with industry and in-depth
research we concluded that the technique, often referred to as ‘enveloping’, is in fact
an acceptable method under PAS 2030:2014 with the majority of certification bodies
approving the technique.
4.72. In relation to the second concern, we concluded that PAS 2030:2014 was not clear
on this topic and it would therefore be inappropriate to take any action in relation to
this.
Care Homes Investigation
4.73. In April 2018 we began an investigation into the installation of district heating
systems (DHS) to care homes. It was discovered that in some cases these premises
did not meet the definition of DHS as defined in the ECO2 Order40 because it could
not be demonstrated that the system was delivering heat to multiple domestic
premises.
4.74. Where evidence could not be provided to demonstrate a care home was in fact
comprised of multiple domestic premises, we did not consider the heating system
installed there to be a DHS.
4.75. In the majority of cases it was determined the definition of DHS was met.
40 Article 2(1) of the ECO2 Order.
50
5. Looking Forward
Chapter Overview
In this section we look forward to the implementation of ECO3 outlining some key changes
following on from the completion of ECO2t. ECO3 came into force on 3 December 2018 and will
run in four “phases” until 31 March 2022. The ECO3 Order recognises that there is a gap between
ECO2 and ECO3. Measures that are completed on or after 1 October 2018 and before 3 December
2018 can contribute towards the achievement of supplier’s ECO3 obligations. These measures
must be completed in compliance with ECO3 scheme rules.
The below represents a brief summary of some key policy developments looking forward.41
Home Heating Cost Reduction Obligation (HHCRO)
5.1. Previously ECO consisted of three main obligations which suppliers had to deliver
measures and demonstrate compliance against, these being CSCO, CERO and
HHCRO. ECO2t rationalised this down to two obligations as CSCO ended. Moving into
ECO3 the key change with regards to the structure of the scheme is that ECO3 will
be a HHCRO only scheme (i.e. CERO will cease to exist and CSCO ended at the end
of phase 2 of ECO2).
5.2. As such the requirement will be for obligated parties to demonstrate cost savings
alone - there will no longer be carbon saving targets. The requirement on suppliers
to demonstrate the cost savings of measures is not new, as this was previously
undertaken for all HHCRO measures. Whilst the focus in ECO3 will be on savings to
consumer bills, assumed carbon savings flow from this, in that energy efficiency
measures resulting in lower energy usage achieve cost-savings as well as carbon
savings.
5.3. Whilst the impact of this on the consumer will be limited, it is anticipated that this
will simplify some aspects of scheme administration for suppliers and Ofgem, as there
will only be one over-arching obligation to achieve, albeit with sub-obligations. There
was evidence that some suppliers found challenges in tracking their various
obligations under ECO2. The move to a HHCRO only scheme simplifies obligations,
making them easier to track and monitor delivery of.
5.4. Another scheme administrative benefit is that by having all measure savings
presented in the same manner (i.e. cost savings) this negates the need to rescore
measures from carbon savings to cost savings, or vice-versa, as part of the previously
operated process to re-elect measures between CERO and HHCRO.
Targeting and eligibility
5.5. With the move to a HHCRO only scheme, ECO3 eligibility is now focused on those
households that are in, or at risk of, fuel poverty. This brings ECO into close alignment
with eligibility under the Warm Home Discount (WHD) scheme which also focusses
on providing support to households in or at risk of fuel poverty.
5.6. The eligibility routes for HHCRO in ECO3 will be similar to those for HHCRO under
ECO2t, with some alterations. Routes of eligibility can be summarised as:
41 For further details see the ECO3 Supplier Administration, Delivery and Innovation Guidance documents www.ofgem.gov.uk/environmental-programmes/eco/contacts-guidance-and-resources/eco-guidance-and-associated-documents.

51
Help to Heat Group (10 new benefits have been added through which eligibility
can be demonstrated)
Local authority declarations will continue as a route (and those which meet the
associated ‘in-fill’ criteria)
Social housing with an EPC energy efficiency rating of E, F or G (or D for
innovation)
Private domestic premises as Affordable Warmth (AW) “in-fill” measures -
linked to two other eligible properties. Previously “in-fill” only operated as a
route to eligibility as part of a local authority declaration
5.7. Private rented sector (PRS) – new regulations establish a minimum level of energy
efficiency standards. The specific measures that can be installed in a PRS property is
dependent on the EPC rating as follows:
EPC A-E any measure except replacement of broken heating
EPC F or G, SWI or renewable heating inc. first time central heating (FTCH)
(DHS)
Changes to measures in ECO3
5.8. The types of measures that are permitted to be installed under ECO3 will broadly
overlap with those that were permitted in ECO2. Some changes that have been
implemented are:
FTCH – First Time Central Heating is a measure to any eligible property which
has never had a central heating system
Primary insulation/secondary heating – as part of the inefficient heating
systems upgrades, a primary insulation measure is installed followed by a
secondary measure
AW In-fill – for every two ECO-eligible premises which are treated with SWI or
a DHS connection, a third premises (neighbour) can also receive support
Interaction with RHI – Only ground source heating pumps (GSHP) can receive
funding from both ECO and RHI (Renewable Heat Incentive), and only under
specific conditions relating to assignment of rights on the RHI scheme.
5.9. A cap on repairing broken heating systems will be in place and the distinction between
“qualifying” and “non-qualifying” boilers will cease to exist.
5.10. With regards to measures potentially overlapping with RHI, there is the intention to
ensure declarations are obtained stating that measures have not been/will not be
accredited under RHI (for all cases except GSHP).
Innovation
5.11. ECO3 will has seen the introduction of a formal innovation process with regards to
measures installed. As the name suggests, the focus here is on suppliers
demonstrating innovative approaches to current measure types or new materials that
can exceed in performance or installation standards to those normally installed. The
aim here is to seek new and better materials and methods, through which enhanced
savings and quality of installations can be achieved. Where this is successfully
demonstrated higher cost saving scorings may be allocated. In brief, there are three
strands to innovation:

52
Demonstration Actions: These are measures that may have been tested in
lab conditions but need further large scale testing.
Innovation Measures: Measures that are different to those previously
delivered. These could be using an improved material that can demonstrate
either enhanced energy efficiency performance, or improved installation
technique.
Monitored Measures: This is referred to as “in-situ performance”. Under this
strand suppliers can use modern monitoring technology to measure the actual
energy efficiency obtained by a measure. This in effect tests the deemed score
and where the measure can demonstrate higher performance, a score uplift
can be applied.
Changes to obligation thresholds and newly obligated suppliers
5.12. Over the period through which ECO1, ECO2 and ECO2t have operated we have seen
an increase in the number of obligated suppliers as market conditions have changed.
ECO3 looks to be no exception. In Phase 1 of ECO3 two suppliers became obligated
for the first time. Furthermore, in Phase 2 (commencing 1 April 2019) there will be a
further four new participants in the scheme. With each new phase comes a reduction
in the obligation thresholds that will likely result in greater number of suppliers being
required to participate in the scheme as it progresses.
5.13. This presents challenges to the scheme as these new participants are unfamiliar with
delivering obligations under ECO and the various processes and requirements that
underpin it. In order to facilitate ongoing effective administration, Ofgem will continue
to act to support these new participants in understanding the scheme and their
obligations.
5.14. We will support suppliers through a variety of means including induction sessions,
monthly bi-laterals and regular reporting to keep track of suppliers’ delivery of
obligations. It is useful to note that obligated suppliers have until the end of Phase 4
to demonstrate compliance with their obligations and as such, will have time to adjust
to the requirements of the ECO scheme. We also recognise that some suppliers will
opt to trade away their obligations in a similar manner to ECO2t.

53
6. Appendix 1: Supplier Licence Compliance
Supplier Licence
CERO CERO Rural
CSCO CSCO Rural
HHCRO HHMR PSWMR
British Gas:
BGT03078711E 100.00% n/a 100.01% 147.96% n/a n/a 100.00%
BGT03078711G 110.63% 191.28% 100.01% 135.23% 103.50% 111.25% 112.66%
Co-op Energy:
COP06993470E 102.68% 106.56% 105.80% 105.23% 110.99% 121.21% 100.37%
COP06993470G 126.59% n/a 105.26% 105.89% 103.76% n/a 100.73%
EDF:
EDF02228297E 107.01% 236.52% 100.06% 181.15% 108.11% 127.18% 103.75%
EDF02228297G 107.71% 179.58% 100.10% 163.91% 109.73% 135.50% 108.58%
EON:
EON03407430E 106.90% 195.24% 101.87% 100.54% 108.03% 125.07% 100.00%
EON03407430G 100.02% n/a 100.81% 130.53% n/a n/a 143.08%
First Utility:
FUL05070887E 149.39% n/a 103.46% 118.94% n/a n/a 102.46%
FUL05070887G 104.38% 178.80% 103.33% 108.55% 104.77% 120.02% 103.85%
Npower:
NPW02845740E 111.34% 161.32% 100.09% 117.71% 109.66% 130.69% 113.63%
NPW02999919G 108.47% 184.63% 100.16% 315.91% 110.46% 135.47% 104.11%
NPW03432100G 116.32% 231.64% 100.27% 156.33% 119.62% 161.42% 106.82%
NPW03653277E 108.44% 168.27% 99.99% 156.34% 109.93% 133.01% 106.66%
NPW03768856G 516.11% 395.68% 141.83% 660.31% 128.70% 158.48% 204.66%
NPW03782443E 115.46% 171.23% 100.03% 130.60% 111.68% 138.83% 107.18%
NPW03782443G 363.93% 202.90% 111.29% 741.96% 113.00% 132.85% 1743.37%
NPW03937808G 112.75% 169.07% 100.01% 144.61% 112.77% 142.95% 107.43%
NPW04212116E 114.00% 189.46% 100.00% 154.20% 111.68% 138.92% 107.14%
Ovo Energy:
OVO06752915G 118.82% 271.31% 100.01% 100.01% 106.14% 109.77% 114.33%

54
OVO06858121E 119.21% n/a 100.47% 102.13% 106.62% n/a 109.27%
Scottish Power:
SPWSC190287E 104.55% 114.12% 100.31% 103.38% 106.23% 124.13% 100.70%
SPWSC190287G 108.22% 104.76% 100.28% 102.88% 106.99% 110.37% 101.41%
SSE:
SSE02716495G 108.02% 169.18% 100.32% 200.45% 106.66% 121.71% 109.44%
SSE03757502E 120.68% n/a 100.46% 166.60% n/a n/a 120.17%
Utilita:
UTA04849181E 101.84% 99.19% 102.00% 107.40% 110.23% 145.80% 100.16%
UTA04849181G 82.31% 32.77% n/a n/a 91.51% 93.74% 79.77%
Utility Warehouse:
UTW05199935G 107.53% 185.18% 100.00% 141.74% 106.03% 118.08% 103.37%
UTW05199936E 105.19% 163.17% 100.00% 145.23% 106.61% 119.71% 102.94%
Extra Energy:
XEN08053154E 74.42% 53.86% 100.30% 294.50% 89.73% 83.32% 50.61%
XEN08053154G 44.35% 47.59% 134.64% 197.08% 73.23% 57.98% 18.59%