Embed Size (px)
Citation preview
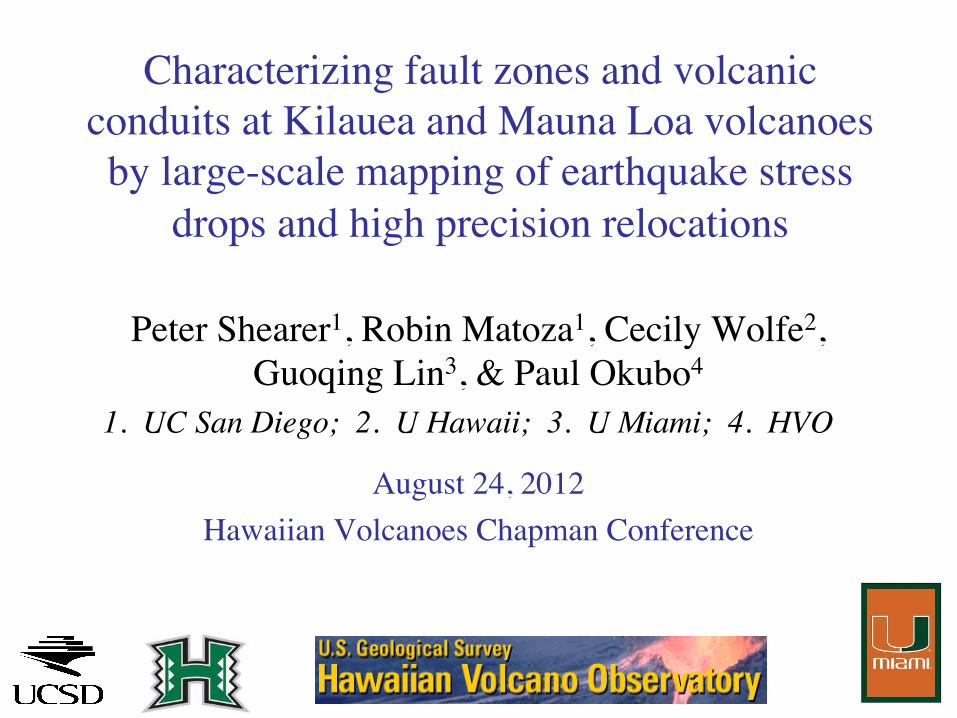
Characterizing fault zones and volcanic conduits at Kilauea and Mauna Loa volcanoes by large-scale mapping of earthquake stress
drops and high precision relocations
Peter Shearer1, Robin Matoza1, Cecily Wolfe2, Guoqing Lin3, & Paul Okubo4
1. UC San Diego; 2. U Hawaii; 3. U Miami; 4. HVO
August 24, 2012 Hawaiian Volcanoes Chapman Conference
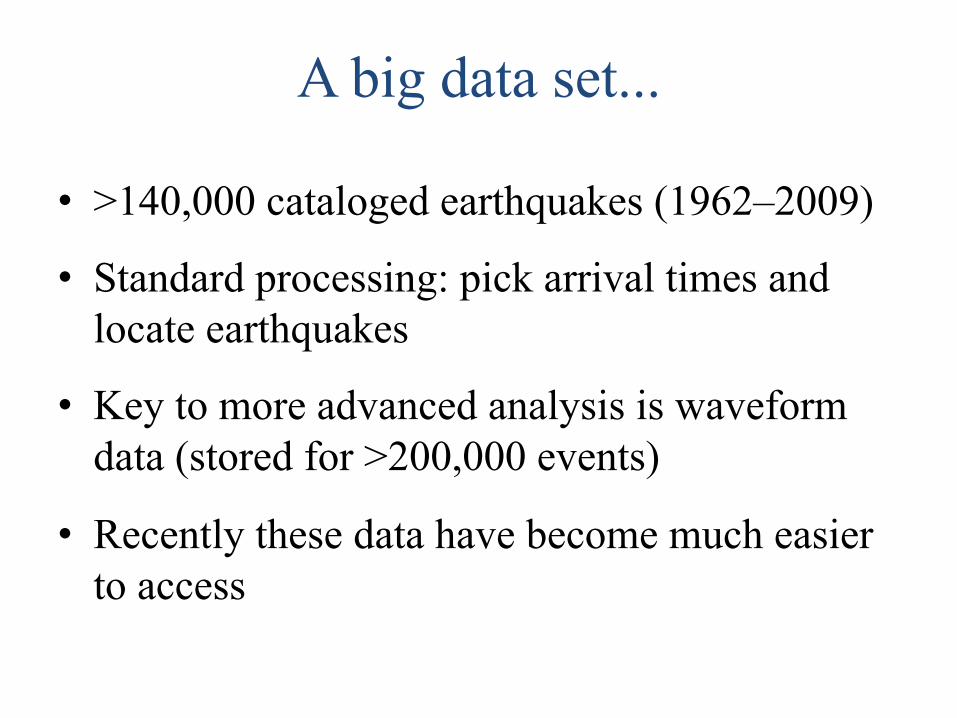
A big data set...
• >140,000 cataloged earthquakes (1962–2009)
• Standard processing: pick arrival times and locate earthquakes
• Key to more advanced analysis is waveform data (stored for >200,000 events)
• Recently these data have become much easier to access
Our project goals
• Improve location accuracy for entire catalog
• Estimate earthquake stress drops for entire catalog
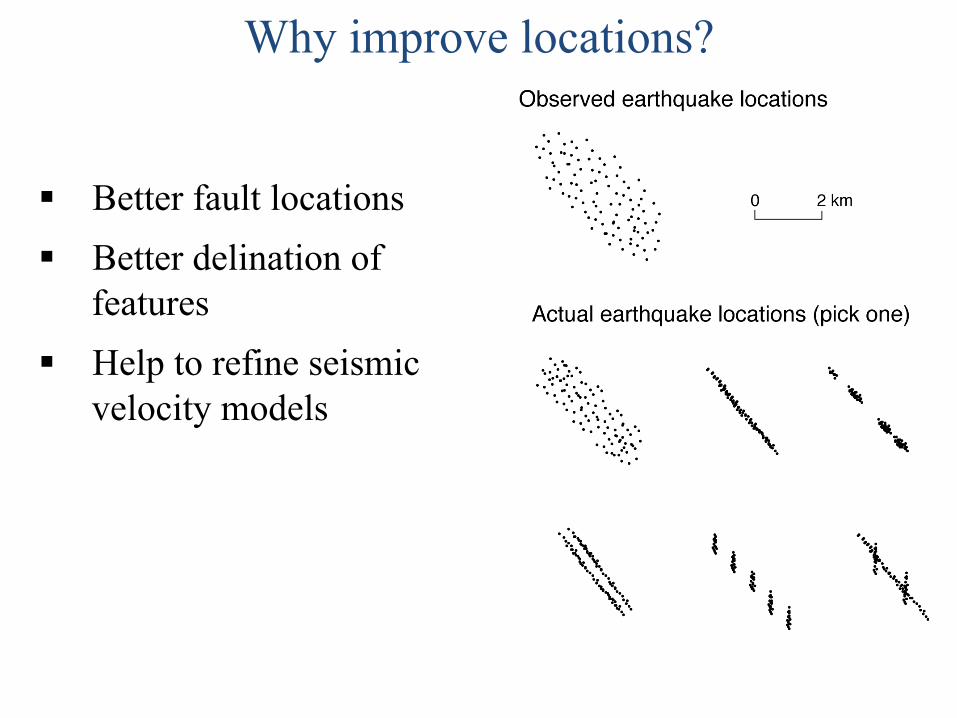
Why improve locations?
§ Better fault locations § Better delination of
features § Help to refine seismic
velocity models
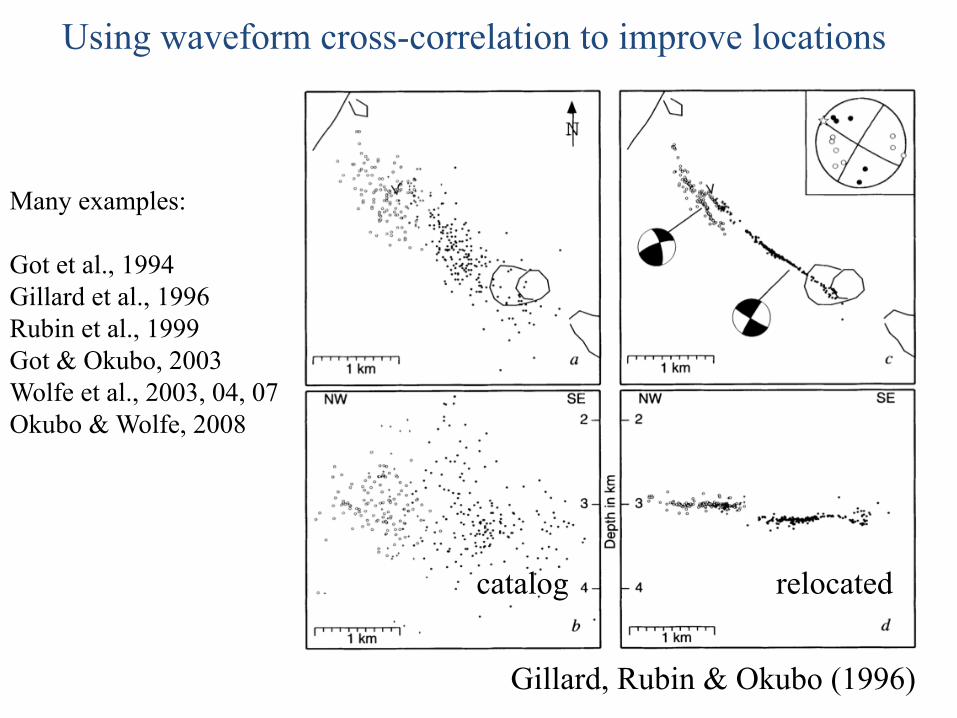
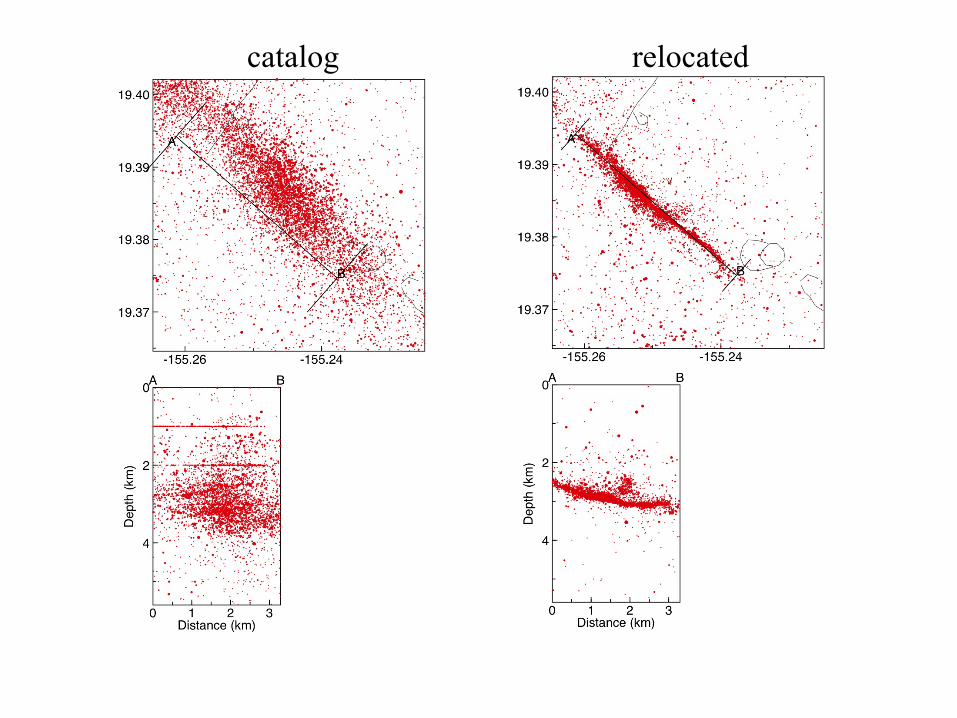
Using waveform cross-correlation to improve locations
catalog relocated
Gillard, Rubin & Okubo (1996)
Many examples: Got et al., 1994 Gillard et al., 1996 Rubin et al., 1999 Got & Okubo, 2003 Wolfe et al., 2003, 04, 07 Okubo & Wolfe, 2008
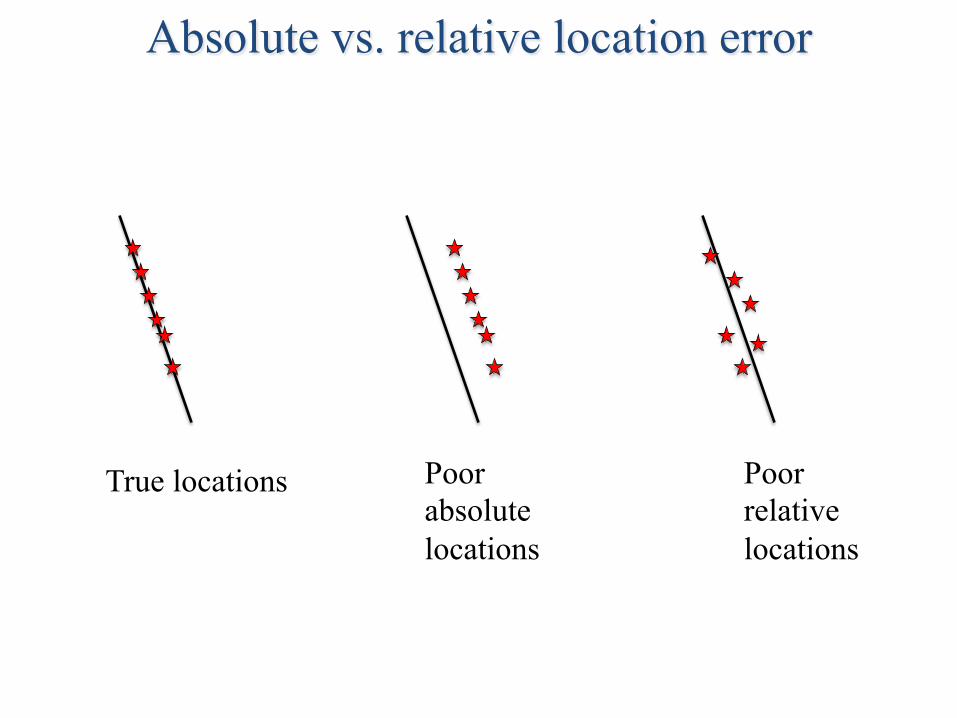
Absolute vs. relative location error
True locations Poor relative locations
Poor absolute locations
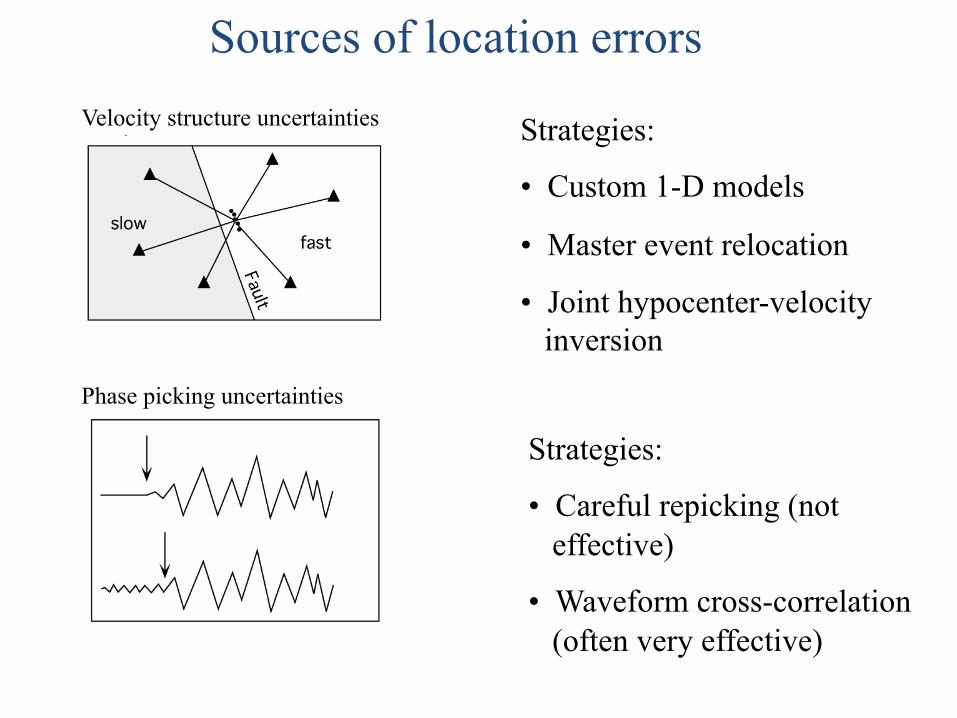
Sources of location errors Velocity structure uncertainties
Phase picking uncertainties
Strategies:
• Custom 1-D models
• Master event relocation
• Joint hypocenter-velocity inversion
Strategies:
• Careful repicking (not effective)
• Waveform cross-correlation (often very effective)
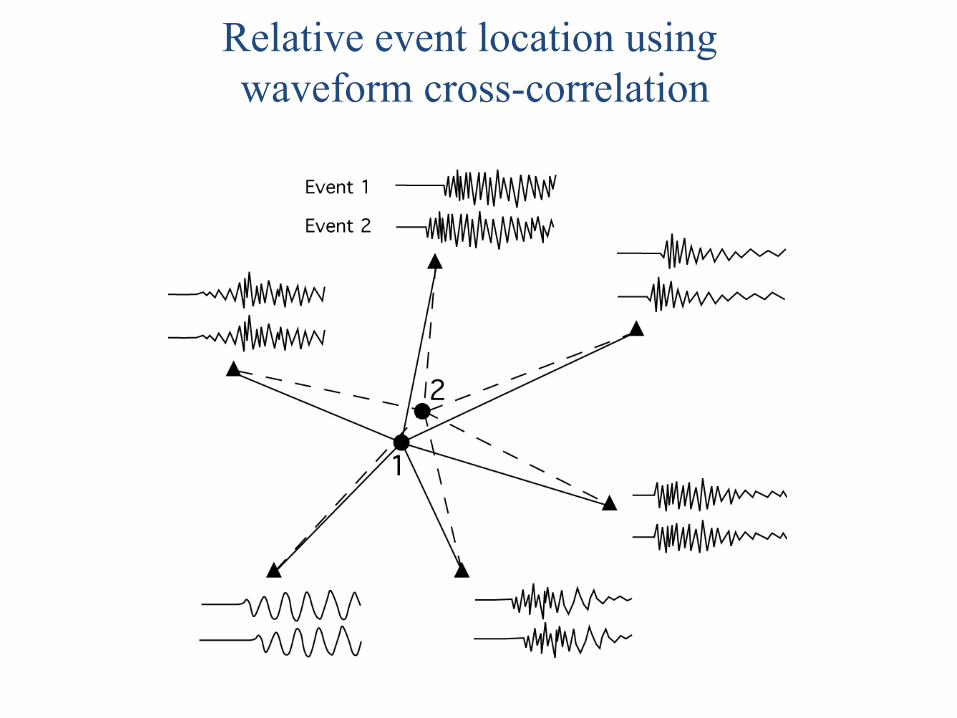
Relative event location using waveform cross-correlation
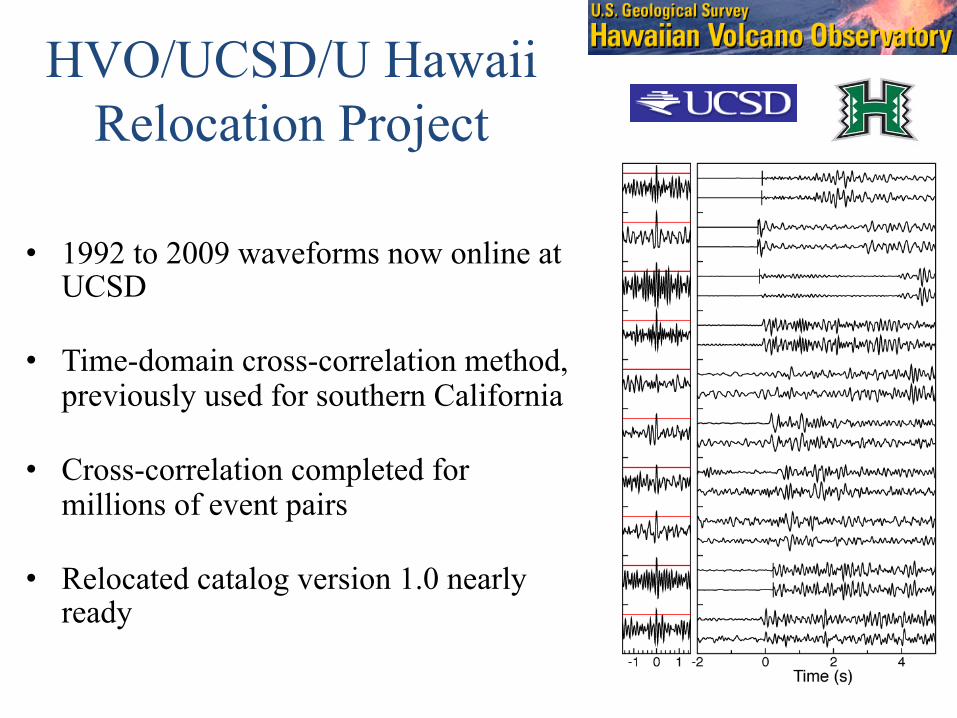
HVO/UCSD/U Hawaii Relocation Project
• 1992 to 2009 waveforms now online at UCSD
• Time-domain cross-correlation method, previously used for southern California
• Cross-correlation completed for millions of event pairs
• Relocated catalog version 1.0 nearly ready
Poster yesterday had many plots and examples: TH-14 Robin S. Matoza | Systematic Re-Analysis of Seismicity on Hawai'i Island from 1992 to 2009
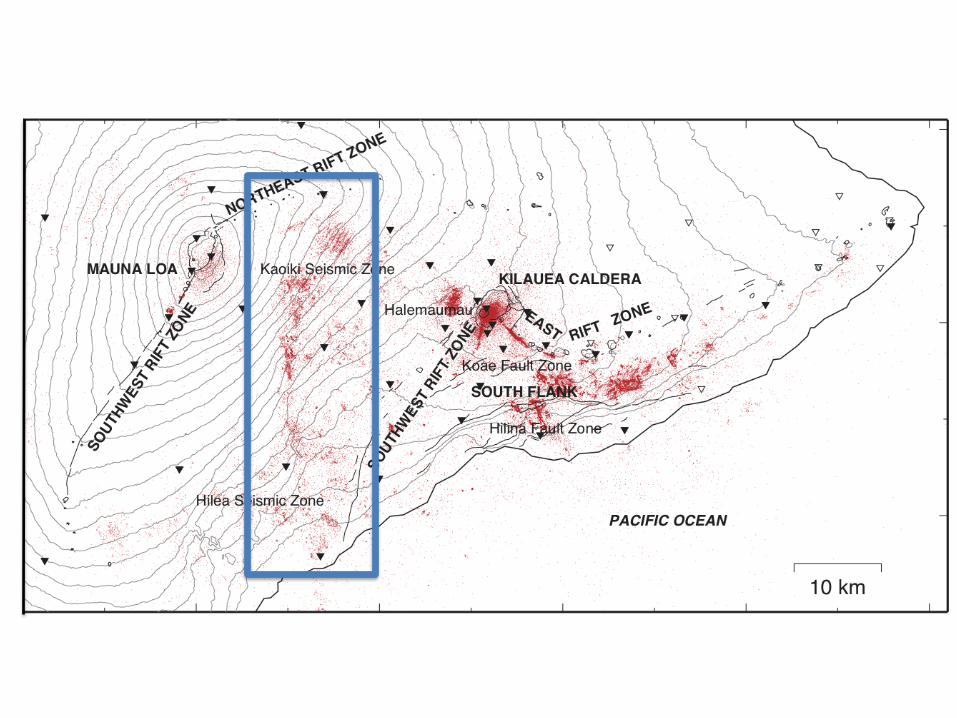
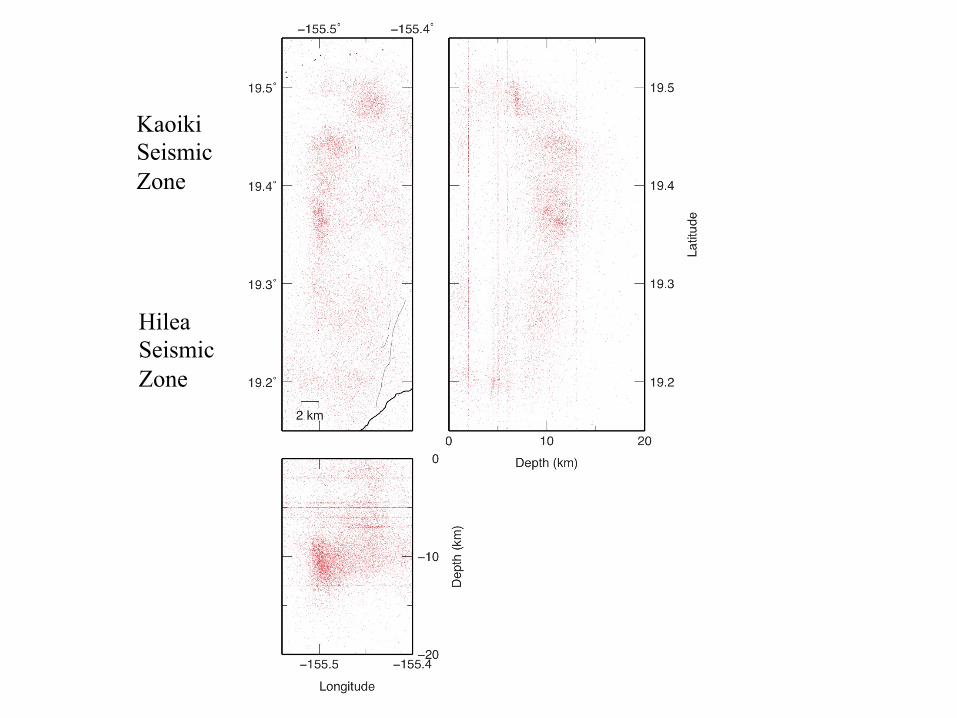
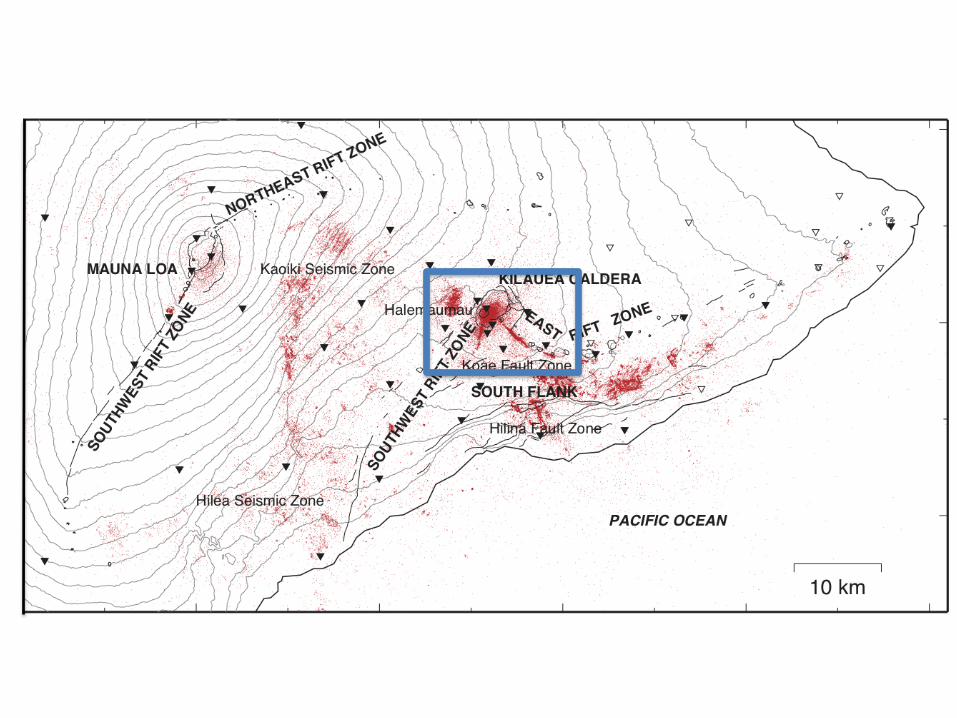
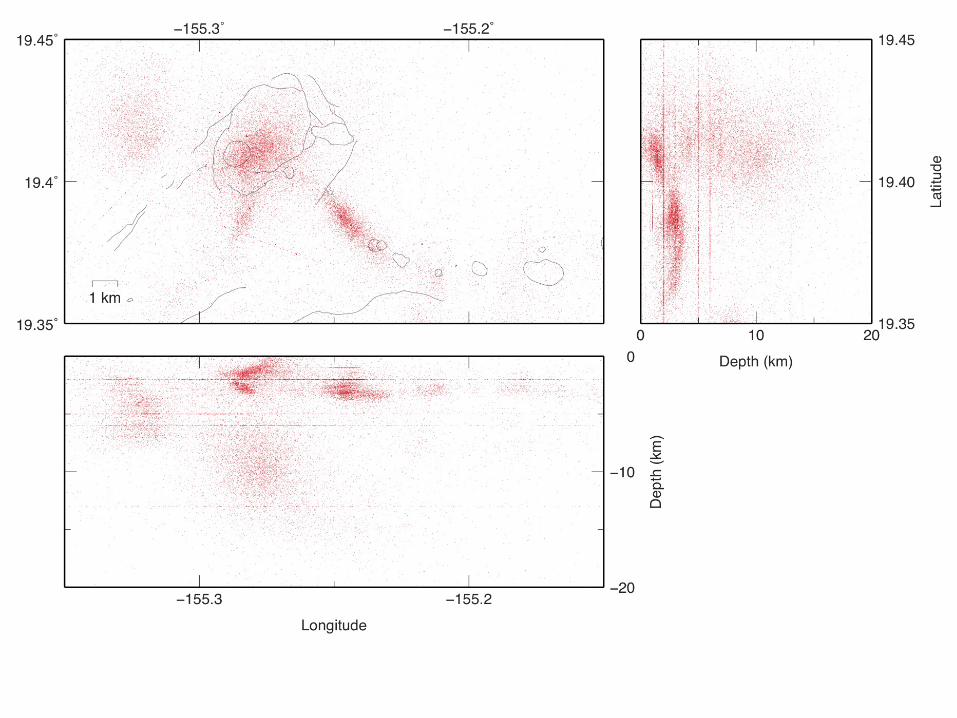
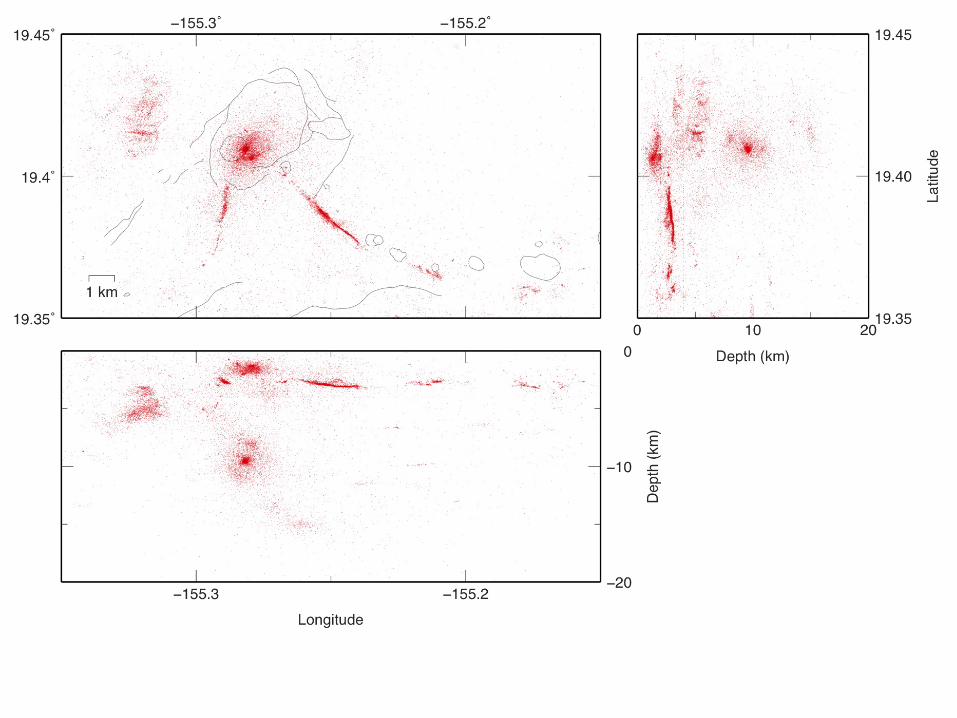
Kaoiki Seismic Zone
Hilea Seismic Zone
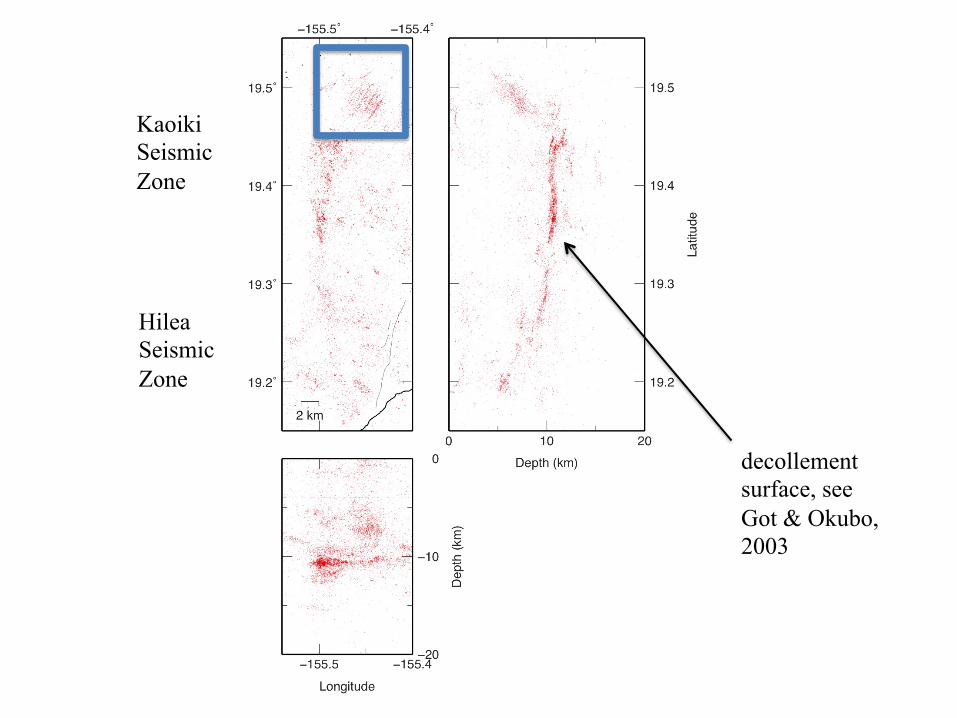
decollement surface, see Got & Okubo, 2003
Kaoiki Seismic Zone
Hilea Seismic Zone
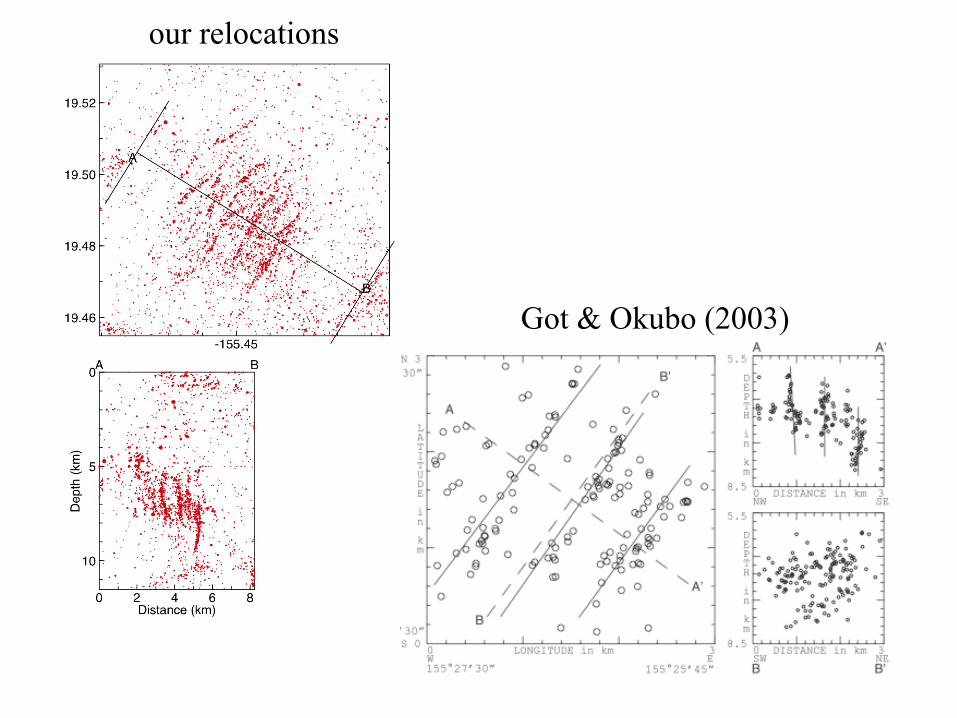
our relocations
Got & Okubo (2003)
catalog relocated
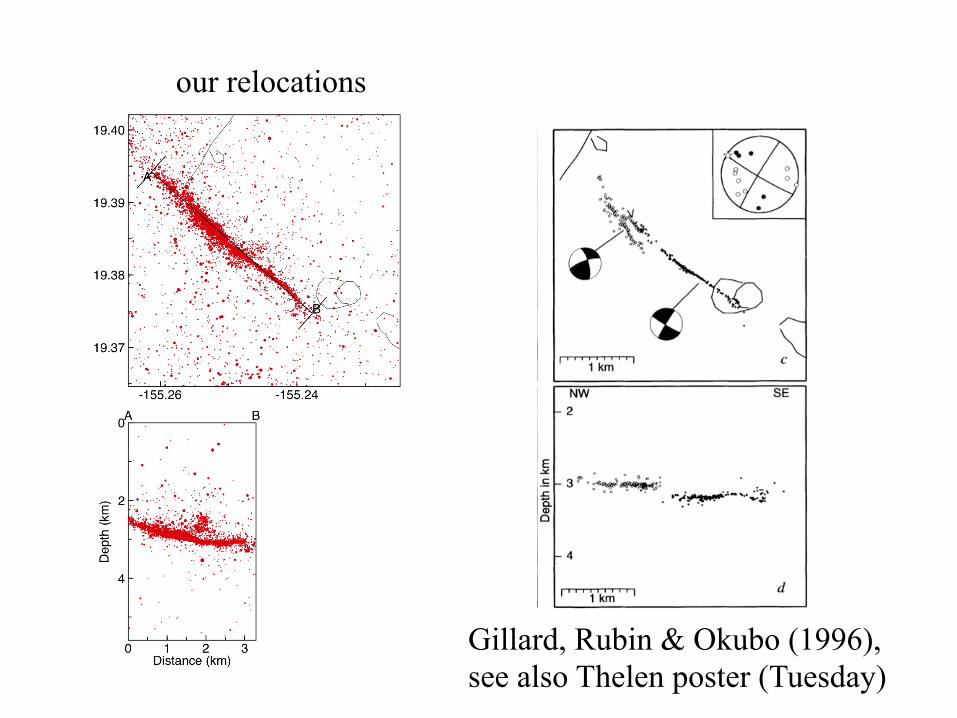
our relocations
Gillard, Rubin & Okubo (1996), see also Thelen poster (Tuesday)
New catalog almost finished...
• Still in QC stage, comparing to older results to validate approach.
• Many parameter choices. Is it better to separately relocate many smaller clusters versus a few larger clusters? How far apart can events be and still have useful cross-correlations?
• How to best characterize absolute and relative location error bars?
Our project goals
• Improve location accuracy for entire catalog
• Estimate earthquake stress drops for entire catalog
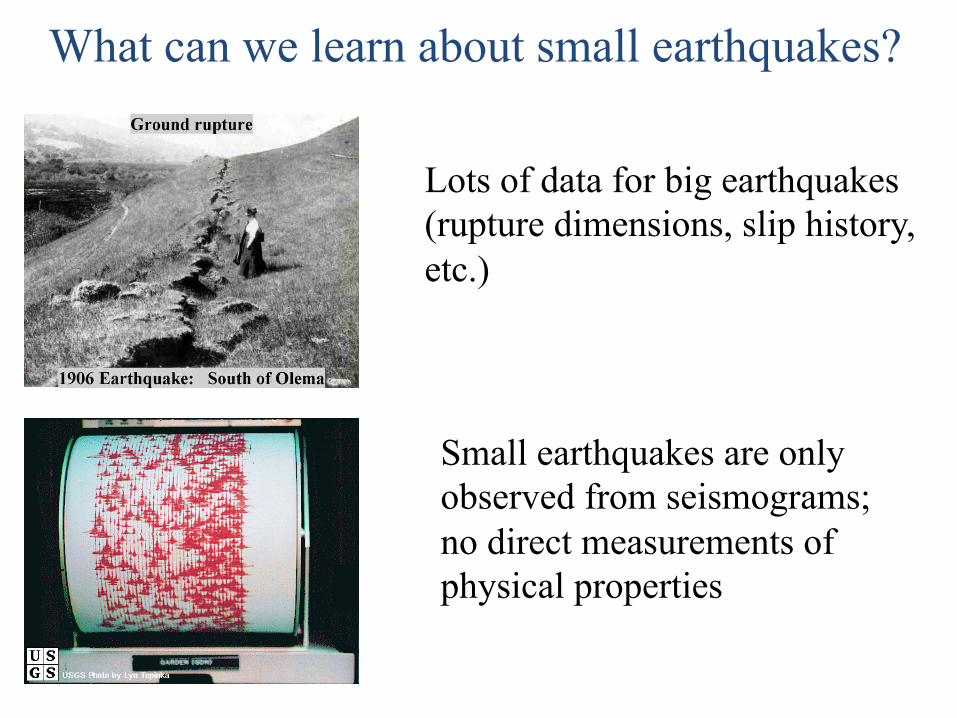
Lots of data for big earthquakes (rupture dimensions, slip history, etc.)
Small earthquakes are only observed from seismograms; no direct measurements of physical properties
What can we learn about small earthquakes?
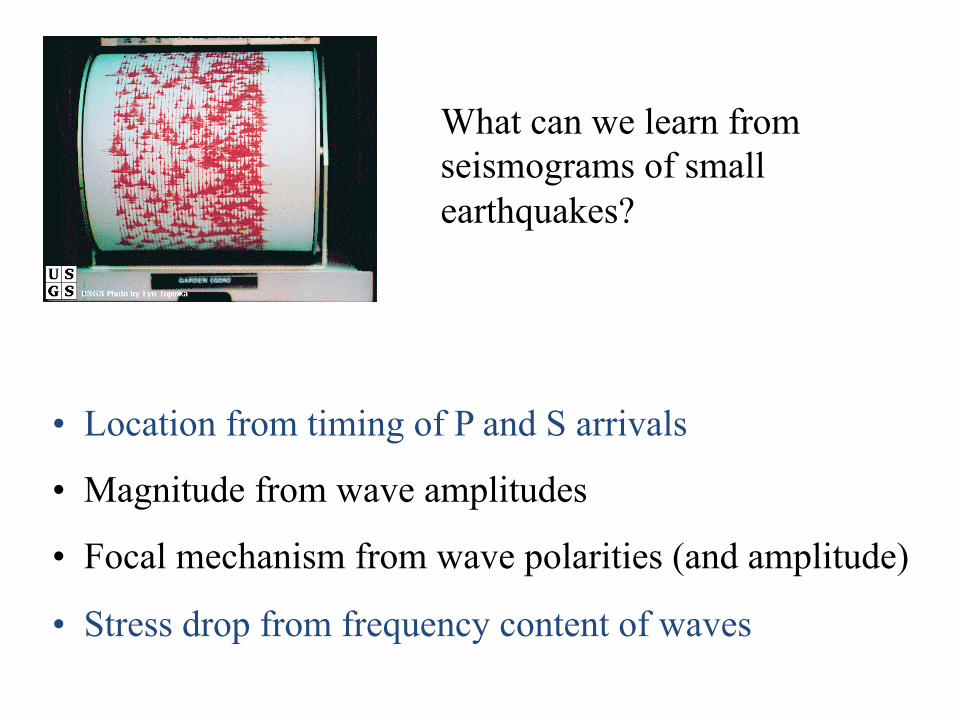
What can we learn from seismograms of small earthquakes?
• Location from timing of P and S arrivals
• Magnitude from wave amplitudes
• Focal mechanism from wave polarities (and amplitude)
• Stress drop from frequency content of waves
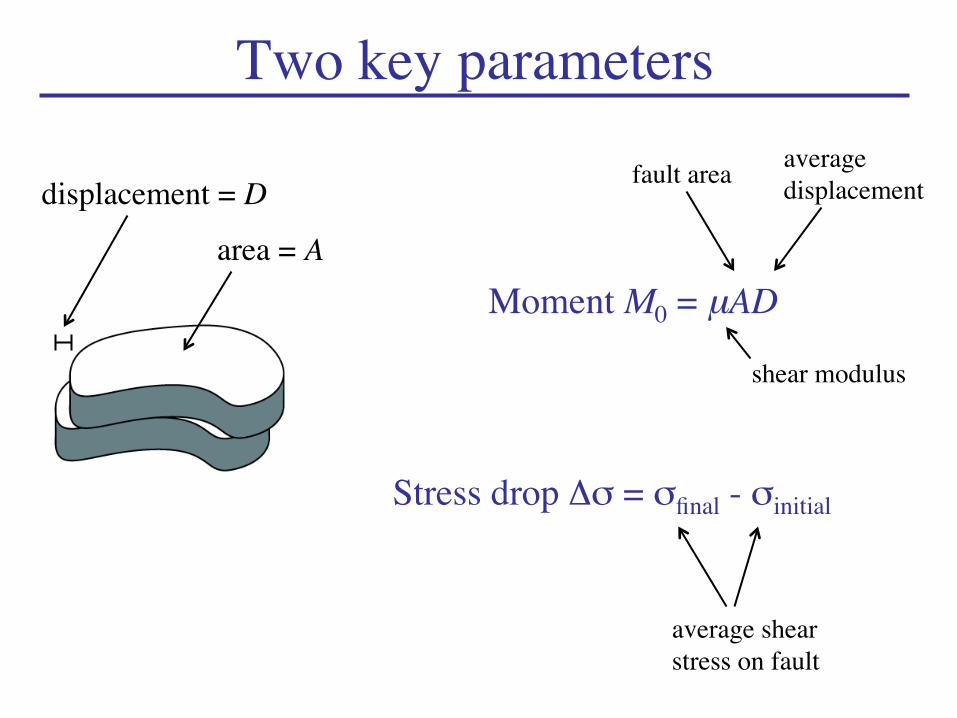
Two key parameters
area = A
displacement = D
Moment M0 = µAD
shear modulus
fault area average displacement
Stress drop Δσ = σfinal - σinitial
average shear stress on fault
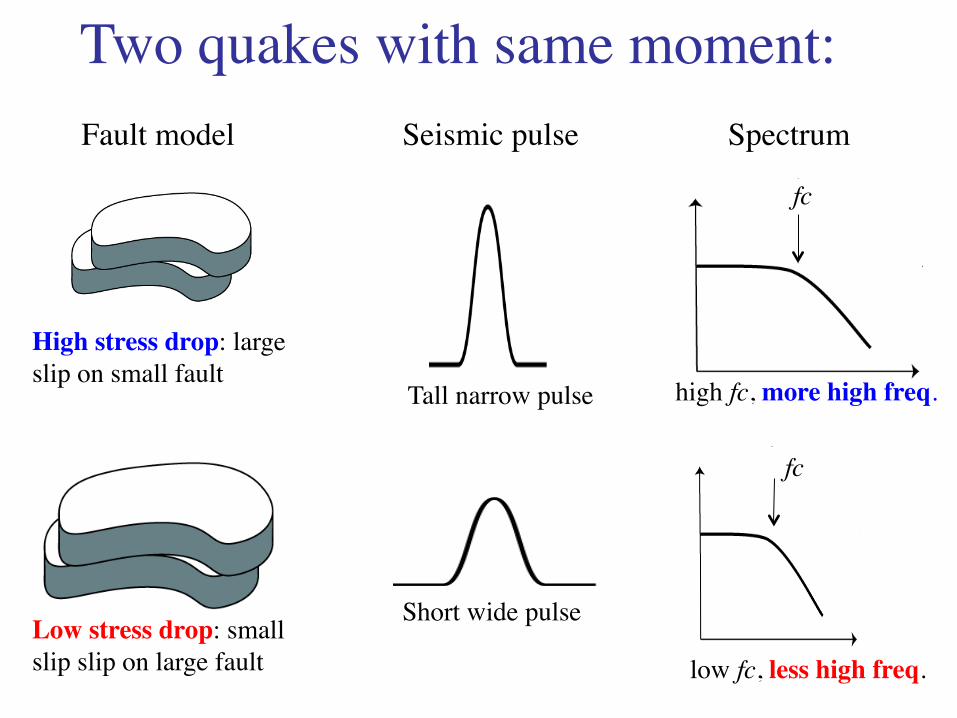
Two quakes with same moment:
High stress drop: large slip on small fault
Low stress drop: small slip slip on large fault
Tall narrow pulse
Short wide pulse
Fault model Seismic pulse Spectrum
low fc, less high freq.
fc
fc
high fc, more high freq.
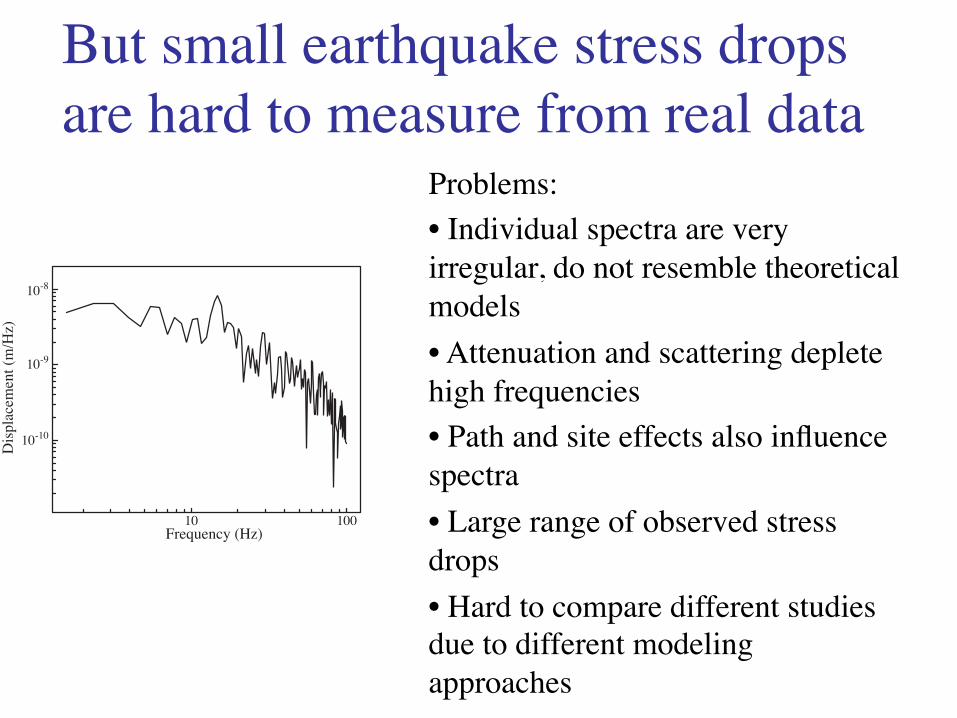
But small earthquake stress drops are hard to measure from real data
10 100
10-10
10-9
10-8
Frequency (Hz)
Disp
lacem
ent (m
/Hz)
Problems: • Individual spectra are very irregular, do not resemble theoretical models • Attenuation and scattering deplete high frequencies • Path and site effects also influence spectra • Large range of observed stress drops • Hard to compare different studies due to different modeling approaches
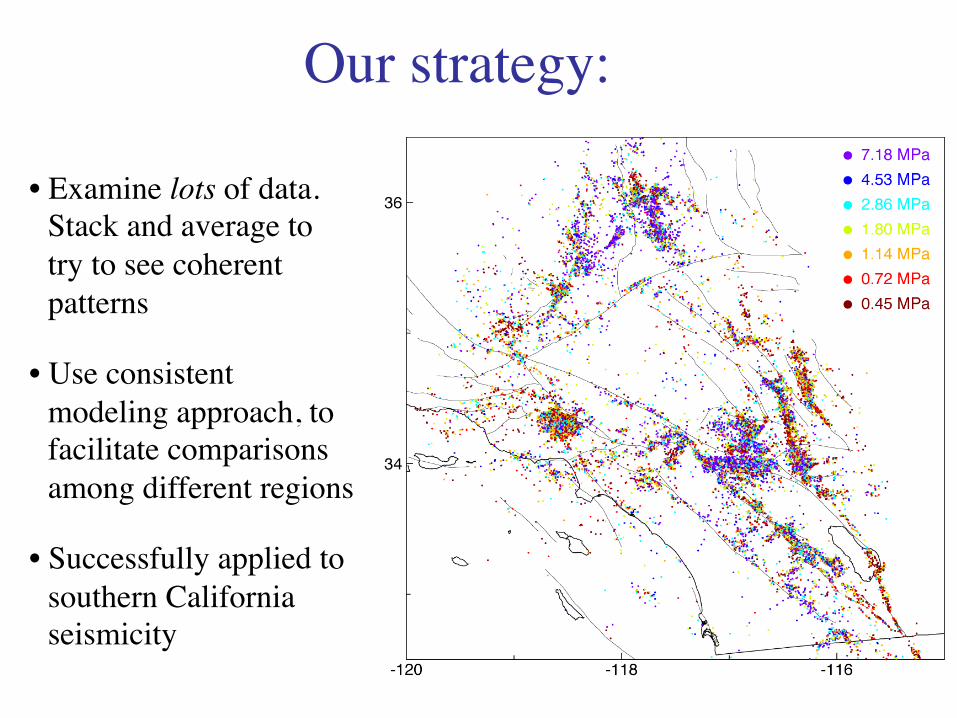
Our strategy:
• Examine lots of data. Stack and average to try to see coherent patterns
• Use consistent modeling approach, to facilitate comparisons among different regions
• Successfully applied to southern California seismicity
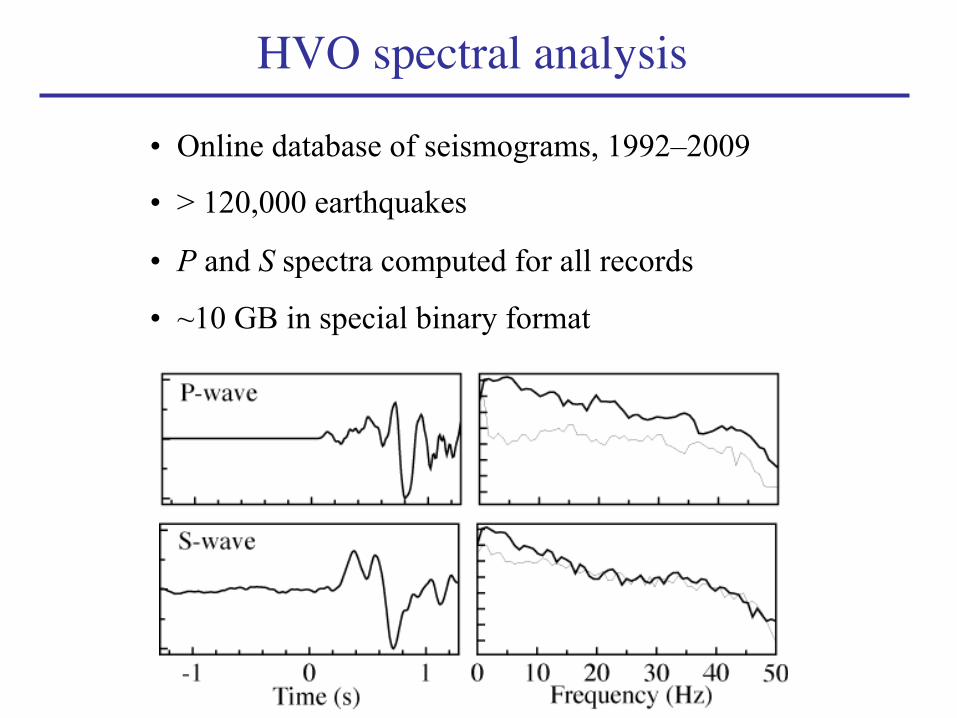
HVO spectral analysis
• Online database of seismograms, 1992–2009
• > 120,000 earthquakes
• P and S spectra computed for all records
• ~10 GB in special binary format
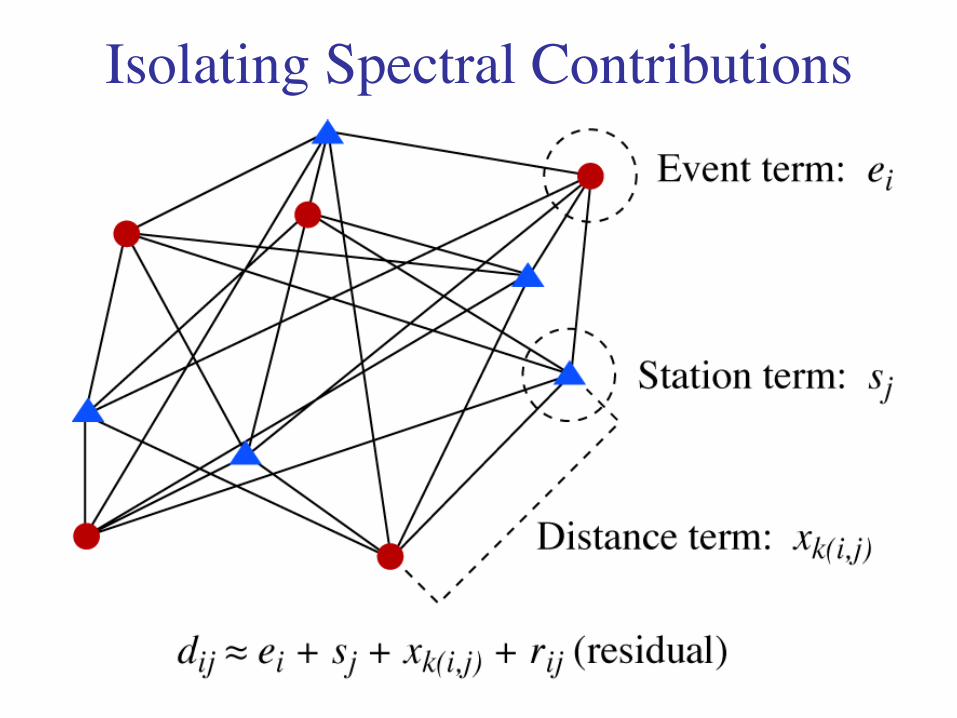
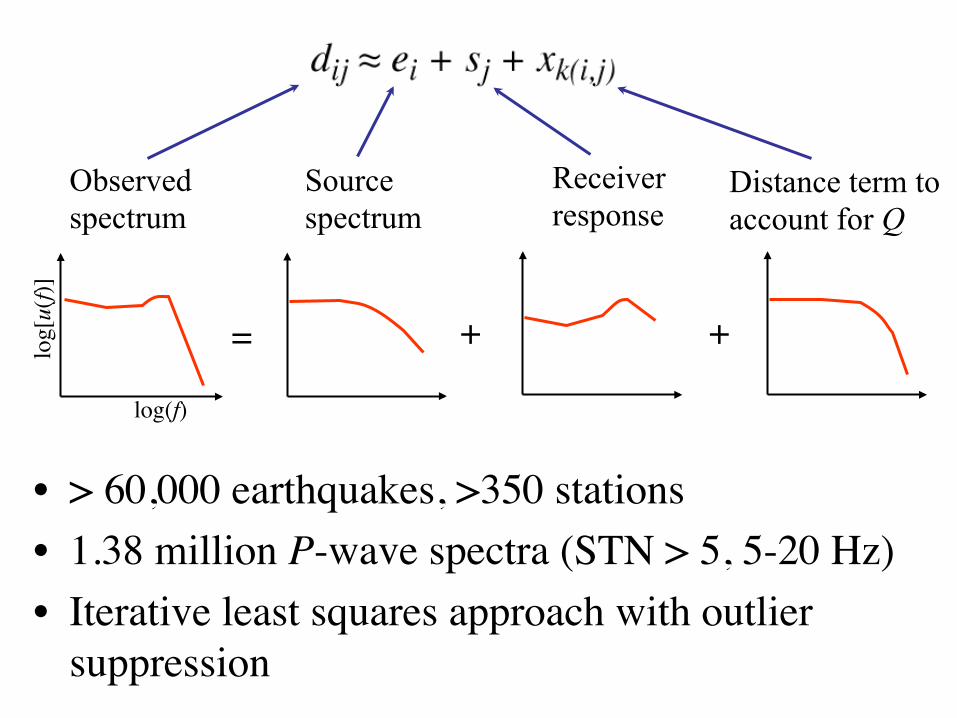
Isolating Spectral Contributions
log(f)
log[
u(f)]
= + +
Observed spectrum
Source spectrum
Receiver response
Distance term to account for Q
• > 60,000 earthquakes, >350 stations • 1.38 million P-wave spectra (STN > 5, 5-20 Hz) • Iterative least squares approach with outlier
suppression
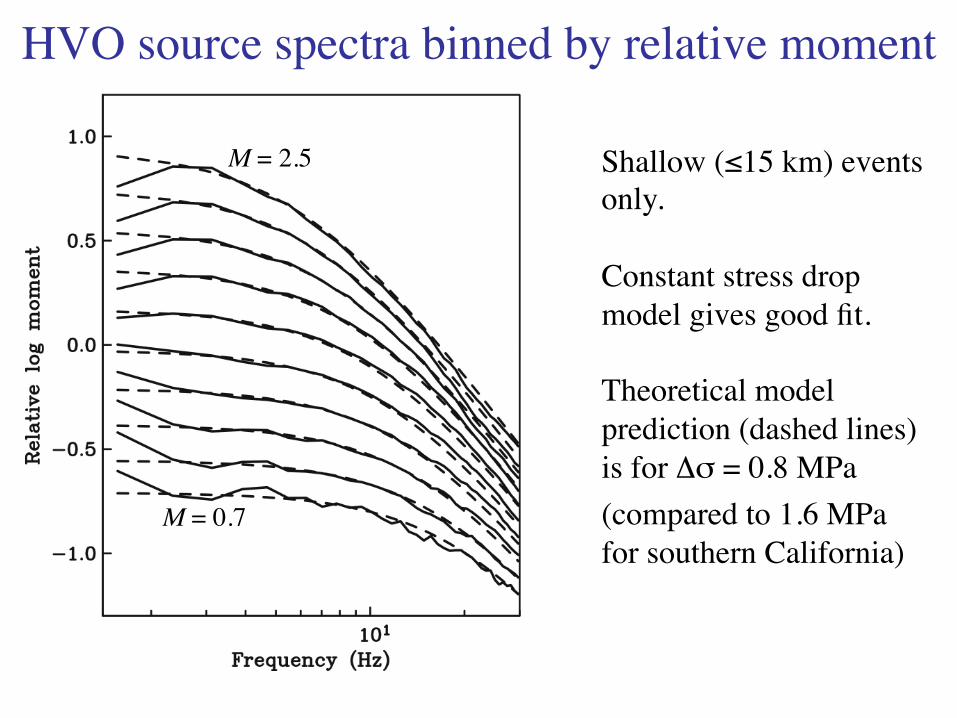
HVO source spectra binned by relative moment
Shallow (≤15 km) events only. Constant stress drop model gives good fit. Theoretical model prediction (dashed lines) is for Δσ = 0.8 MPa (compared to 1.6 MPa for southern California)
M = 0.7
M = 2.5
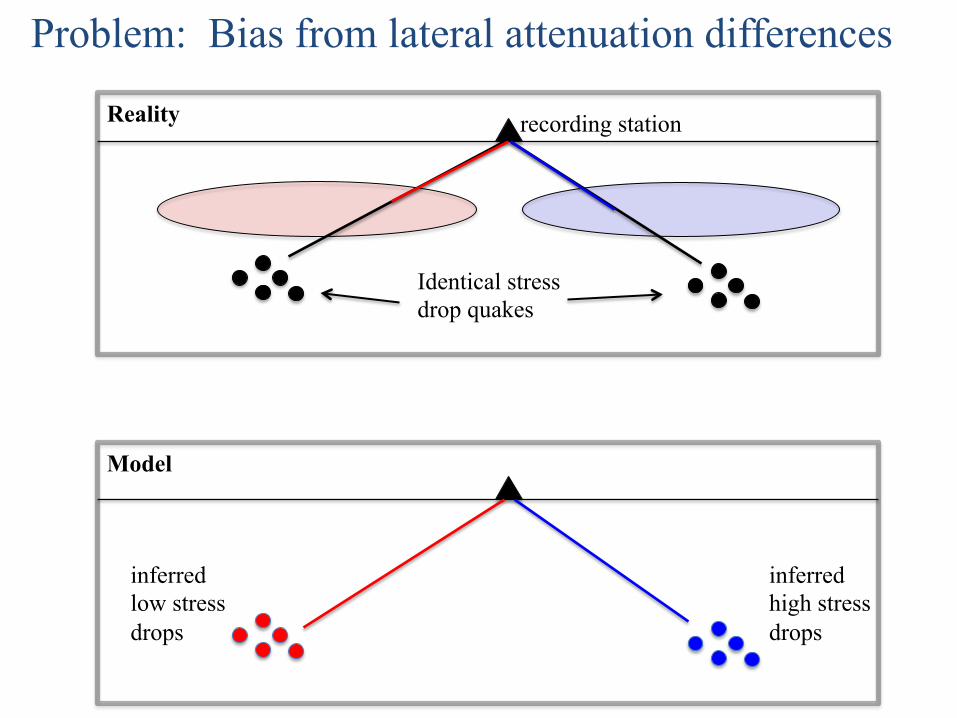
Problem: Bias from lateral attenuation differences
Identical stress drop quakes
inferred low stress drops
inferred high stress drops
recording station Reality
Model
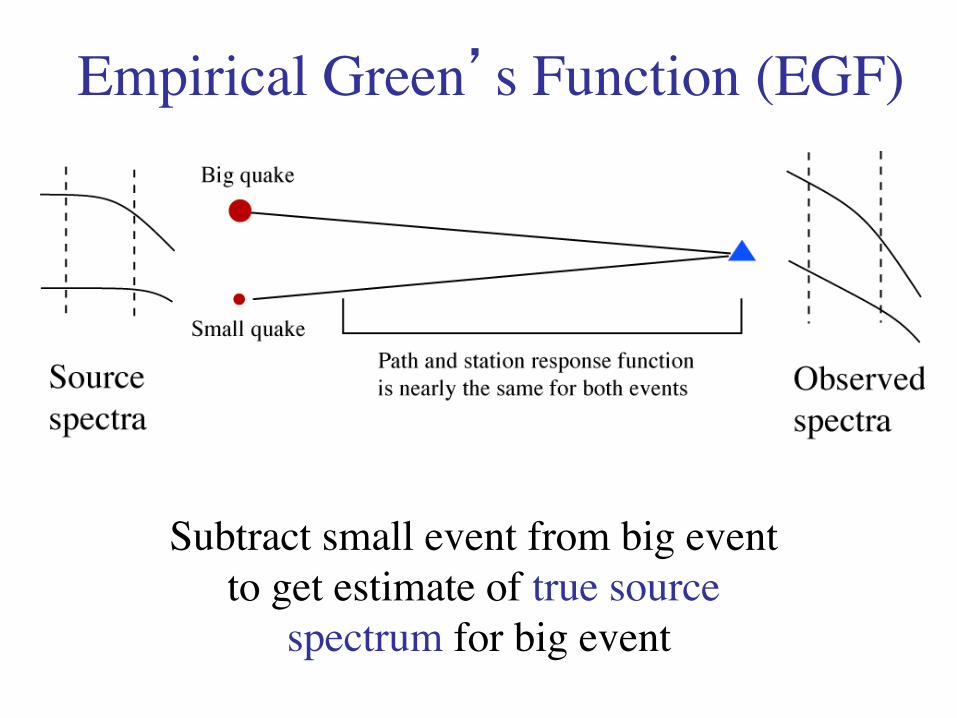
Empirical Green’s Function (EGF)
Subtract small event from big event to get estimate of true source
spectrum for big event
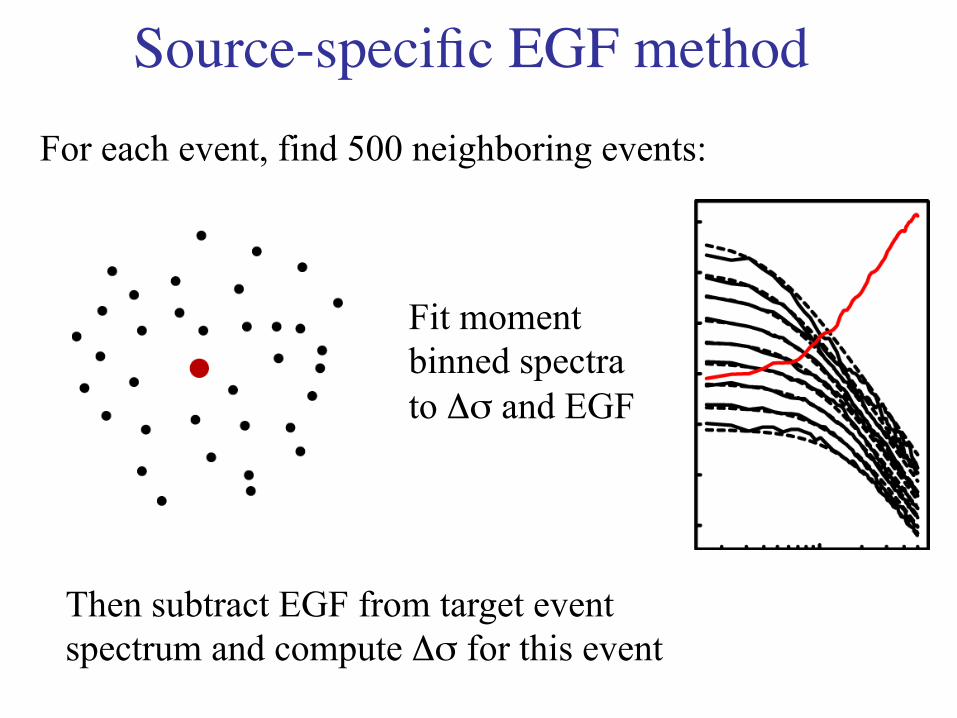
Source-specific EGF method For each event, find 500 neighboring events:
Fit moment binned spectra to Δσ and EGF
Then subtract EGF from target event spectrum and compute Δσ for this event
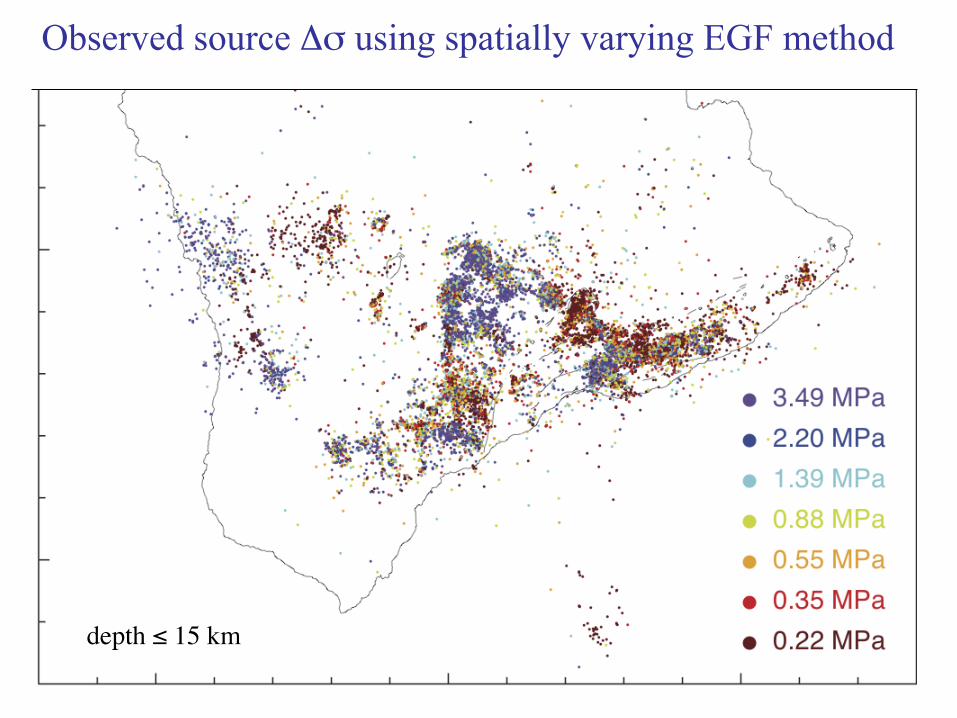
Observed source Δσ using spatially varying EGF method
depth ≤ 15 km
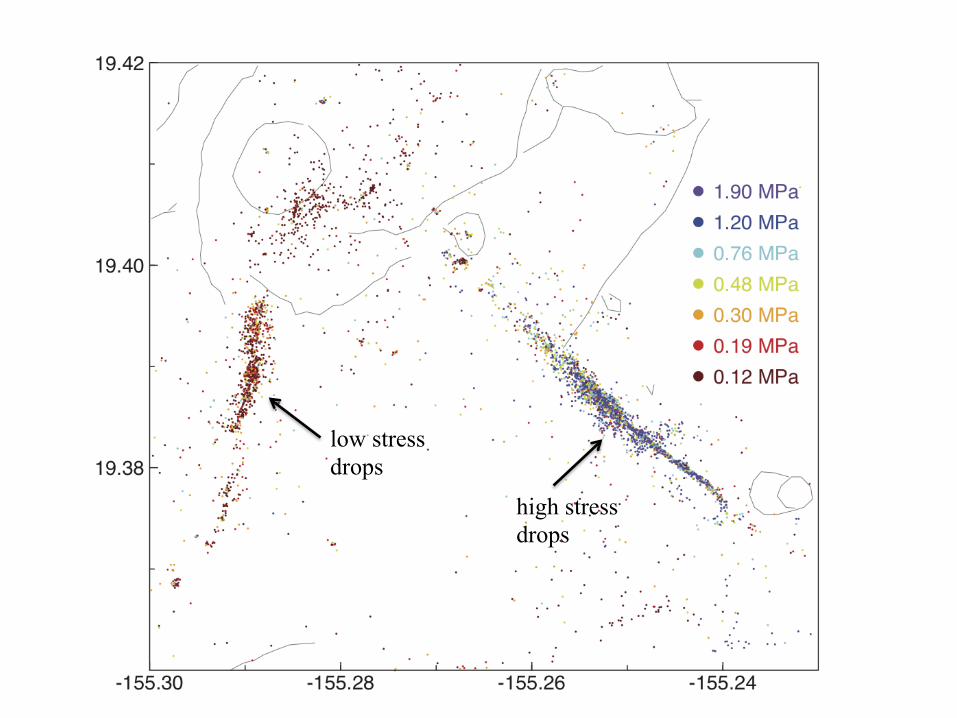
low stress drops
high stress drops
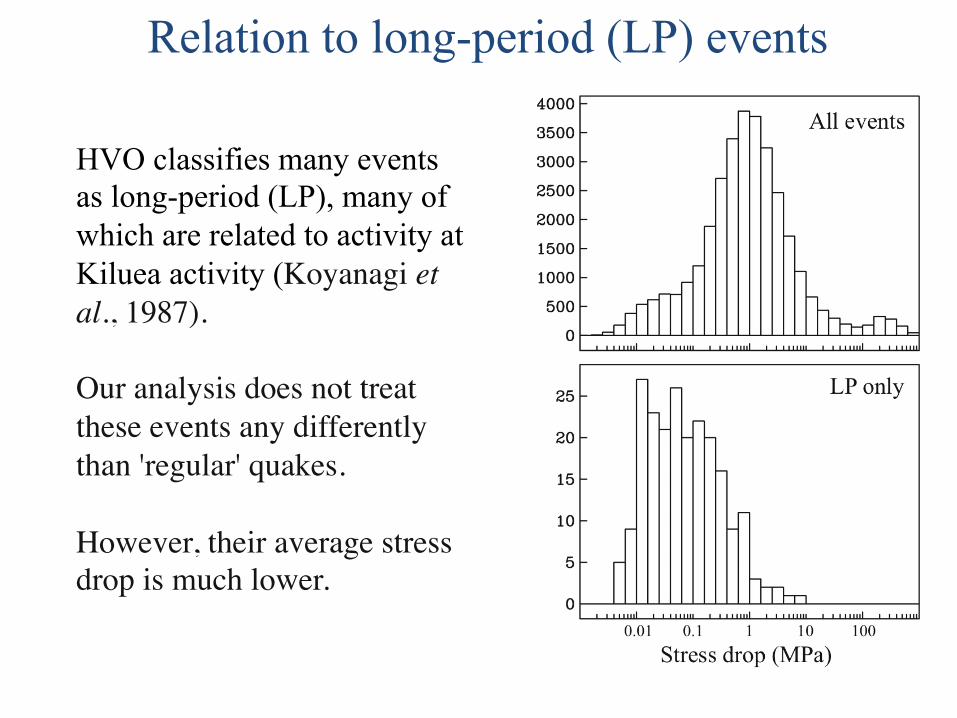
Relation to long-period (LP) events
HVO classifies many events as long-period (LP), many of which are related to activity at Kiluea activity (Koyanagi et al., 1987). Our analysis does not treat these events any differently than 'regular' quakes. However, their average stress drop is much lower.
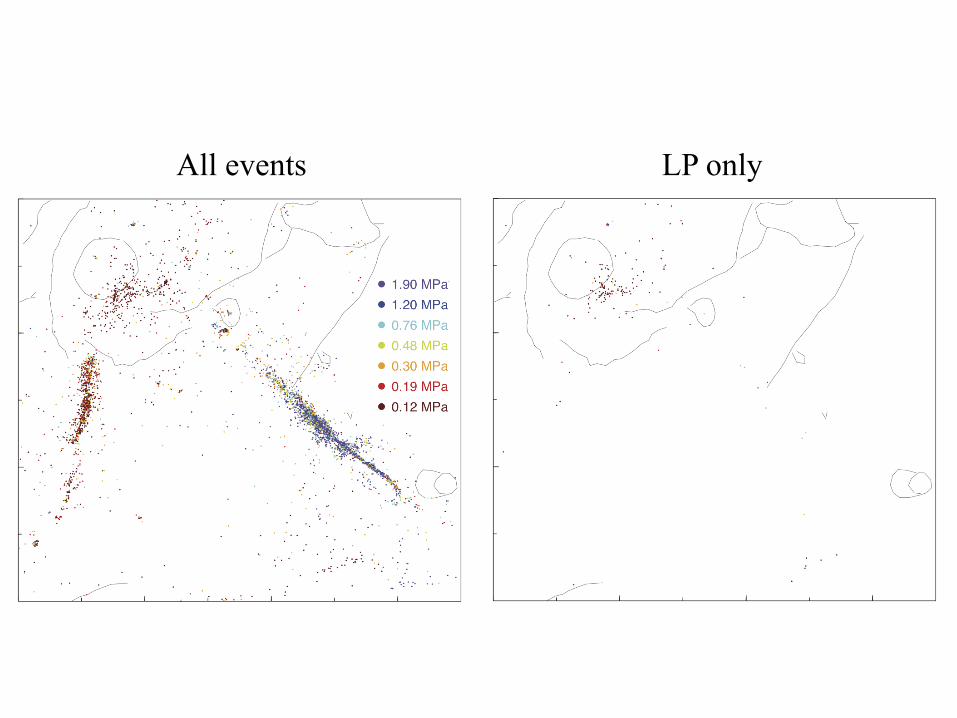
All events LP only
The future Short term for our project:
• Complete and release relocated catalog and stress drop estimates
• Integrate with other data sets to better characterize fault zones and volcanic conduits
Longer term:
• Continue long-term monitoring of Hawaii using seismology and other methods
• Improve access to large data sets and develop tools for community use