Embed Size (px)
Citation preview

P O S I V A O Y
O l k i l u o t o
F I -27160 EURAJOKI , F INLAND
Tel +358-2-8372 31
Fax +358-2-8372 3809
Mal in Bomberg
Mar i Nyyssönen
Mer ja I tävaara
June 2012
Work ing Repor t 2011 -31
Characterization of Olkiluoto Bacterial andArchaeal Communities by 454 Pyrosequencing
2012
Working Reports contain information on work in progress
or pending completion.
The conclusions and viewpoints presented in the report
are those of author(s) and do not necessarily
coincide with those of Posiva.
Mal in Bomberg
Mar i Nyyssönen
Mer ja I tävaara
V T T
Work ing Report 2011 -31
Characterization of Olkiluoto Bacterial andArchaeal Communities by 454 Pyrosequencing
Base maps: ©National Land Survey, permission 41/MML/12
ABSTRACT Recent advancement in sequencing technologies, ‘Next Generation Sequencing’, such as FLX 454 pyrosequencing has made it possible to obtain large amounts of sequence data where previously only few sequences could be obtained. This technique is especially useful for the study of community composition of uncultured microbial populations in environmental samples. In this project, the FLX 454 pyrosequencing technique was used to obtain up to 20 000 16S rRNA sequences or 10 000 mRNA sequences from each sample for identification of the microbial species composition as well as for comparison of the microbial communities between different samples. This project focused on the characterization of active microbial communities in the groundwater at the final disposal site of high radioactive wastes in Olkiluoto by FLX 454 pyrosequencing of the bacterial and archaeal ribosomal RNA as well as of the mRNA transcripts of the dsrB gene and mcrA gene of sulphate reducing bacteria and methanogenic archaea, respectively. Specific emphasis was put on studying the relationship of active and latent sulphate reducers and methanogens by qPCR due to their important roles in deep geobiochemical processes connected to copper corrosion. Seven packered boreholes were sampled anaerobically in Olkiluoto during 2009-2010. Groundwater was pumped from specific depths and the microbial cells werecollected by filtration on a membrane. Active microbial communities were studied based on RNA extracted from the membranes and translated to copy DNA, followed by sequencing by 454 Tag pyrosequencing. A total of 27 different bacterial and 17 archaeal taxonomic groups were detected. The diversity of microbial communities changed with depth and varied considerably between the boreholes. However, some similarity was found between the samples from similar depths, although the deepest sample from 798 m depth below surface level (m bsl) was clearly different from the others. The bacterial communities were affected by salinity, mainly by increasing concentration of Na2+, K+, Ca2+ and Cl-. Epsilon-proteobacteria dominated at depths between 296 m and 347 m bsl and were only detected where S2- and SO4
2- concentrations were high. In samples between 415 to 572 m bsl, Gamma-proteobacteria, of which most were putative nitrate reducers, dominated. The sulphate concentration in these samples was low, although organic carbon was present, which indicates that the microbial communities probably have depleated the sulphate by oxidation of organic carbon. The archaeal populations were also affected by the salinity in the groundwater. In the most dilute samples (between 296 and 347 m bsl), populations consisting of Methanosarcinales and Methanococcales prevailed. As the salinity gradient increased with depth, the archaeal communities changed towards Thermoplasmatales-like archaea and Methanobacteria to a Methanosarcinales dominated population in the deepest sample. An active sulphate reducing population, as confirmed by mRNA based 454 pyrosequence analysis, was present at all other depths except the deepest sample (798 m bsl). Geochemisty data demonstrated that there was an exceptionally high concentration of methane at this depth, which affected the SRB population. The mRNA based pyrosequencing analysis of methanogens showed that active methanogenic communities

were present in four borehole samples where the concentrations of Mg2+ was high. The majority of the mcrA sequences belonged to Methanosarcinales. This group of methanogens often show tolerance to high salt concentrations leaving them active while other methanogens are not. Quantification of sulphate reducers and methanogens demonstrated that the diversity of these species is greater than the active microbial populations causing a potential for higher activity due to changes in environmental conditions. As conclusion, 454 pyrosequencing provided an opportunity to obtain deeper insight into microbial communities and especially active populations. Combining the qPCR method with DNA and RNA based analysis provided quantitative information of active and dormant sulphate reducers and methanogens. Keywords: RNA, Pyro Sequensing, Microbial Diversity, Microbial Community, Methanogen, Sulphate Reducer, Groundwater, Qpcr.

OLKILUODON BAKTEERI- JA ARKKIYHTEISÖJEN KARAKTERISOINTI 454 PYROSKVENSOINNIN AVULLA TIIVISTELMÄ Uusien sekvensointiteknologioiden, kuten FLX 454 pyrosekvensoinnin kehittyminen on mahdollistanut suurien sekvenssimäärien tuottamisen. Menetelmä on erityisen hyödyllinen tuntemattomien ympäristömikrobien tutkimisessa. Tässä tutkimuksessa tuotettiin 20 000 ribosomaalista RNA sekvenssiä ja jopa 10 000 lähetti-RNA sekvenssiä jokaista näytettä kohden, joiden avulla tutkittiin mikrobiyhteisöjen rakennetta sekä vertailtiin eri näytteiden mikrobiyhteisöjä keskenään. Projektin tavoitteena oli Olkiluodon pohjavedessä esiintyvien aktiivisten bakteerien ja arkkien tutkiminen. Tutkimuksessa hyödynnettiin mikrobien ribosomaalista RNAta sekä mcrA- ja dsrB-geenien lähetti-RNAta sekä FLX 454 pyrosekvensointitekniikkaa. Lisäksi tutkittiin kvantitatiivisella PCR menetelmällä (qPCR) aktiivisten ja latenttien sulfaatin-pelkistäjien- ja metanogeenien yhteisöjä, sillä näillä mikrobiryhmillä on tärkeä rooli syväbiosfäärin geobiokemiallisissa prosesseissa ja kuparin korroosioon. Olkiluodon ydinjätteiden tulevalla loppusijoitusalueella otettiin anaerobisesti näytteitä seitsemästä kairareiästä. Mikrobisolut suodatettiin kalvolle, josta mikrobiyhteisöjen RNA eristettiin, käännettiin kopio DNA:ksi ja sekvensoitiin 454 Tag pyrosekven-soinnilla. Sekvensointi tehtiin 16S rRNA bakteeri- ja arkkialukkeiden lisäksi myös dsrB ja mcrA alukkeilla sulfaatinpelkistäjien ja metanogeenien tunnistamiseksi. Sekvenssiaineiston tuloksena tunnistettiin 27 erilaista bakteeri- ja 17 arkkiryhmää. Mikrobiyhteisöjen koostumus muuttui syvyyssuunnassa ja lajistot vaihtelivat huomat-tavasti eri kairarei’issä. Mikrobiyhteisöt, jotka olivat syvyydeltään lähempänä toisiaan, olivat myös lajistoltaan samankaltaisempia, kun taas syvimmän näytteen (798 m syvyydessä maanpinnalta) mikrobilajisto poikkesi huomattavasti muista. Suolaisuus, syvyyden mukaan lisääntyvä Na2+, K+, Ca2+ and Cl- pitoisuus, näytti vaikuttavan eniten mikrobiyhteisöihin. Epsilon-proteobakteerit esiintyivät päälajistona 296-347 m syyvydessä maanpinnalta ja niiden esiintyminen oli yhteydessä korkeisiin S2- and SO4
2- pitoisuuksiin. Gamma-proteobakteereja, jotka todennäköisesti olivat nitraatinpelkistäjiä, dominoivat 415-572 m syvyydessä maanpinnalta. Näiden näytteiden sulfaattipitoisuudet olivat matalat, mutta niissä esiintyi orgaanista ainesta, joten on todennäköistä, että mikrobit ovat orgaanisen hiilen hapetuksen yhteydessä kuluttaneet vedessä olevan sulfaatin. Suolaisuuden lisääntyessä arkkiyhteisöt muuttuivat Methanococcales ja Methanosar-cinales heimoista koostuvista yhteisöistä (296-347 m syvyydessä maanpinnalta) Thermoplasma, Methanobacteriales ja Methanosarcinales tyyppisistä arkeista koostu-viin yhteisöihin. Aktiivinen sulfaattiapelkistävä populaatio esiintyi kaikissa paitsi syvimmässä näytteessä 798 m syvyydessä maanpinnalta. Geokemian tulosten perus-teella syvimmässä näytteessä esiintyi korkeita metaanipitoisuuksia, joka on vaikuttanut sulfaatinpelkistäjä-populaatioiden esiintymiseen. Metanogeenien mcrA geenien lähetti-RNAn 454-pyrosekevensoinnin tulokset osoittivat, että neljässä kairareikänäytteessä seitsemästä esiintyi aktiivinen metanogeenilajisto. Tähän liittyi myös samanaikainen
korkea Mg2+-pitoisuuden esiintyminen. Suurin osa lajistoista kuuluu Methanosarcinales ryhmään. Aktiivisen ja dormantin sulfaatinpelkistäjä- ja metanogeenilajistojen vertaaminen kvantitatiivisella PCR-menetelmällä (qPCR, DNA, mRNA) osoitti, että huomattava osa lajeista esiintyi pohjavesinäytteissä lepotilassa. Lepotilaisten mikrobien esiintyminen mahdollistaa kuitenkin tulevaisuudessa korkeamman aktiivisuuden kuin mitä näytteissä esiintyi. Olosuhteiden muutos esim. ravinteiden kuten orgaanisen aineksen ja/tai sulfaattipitoisuuden muutos voi aktivoida lepotilassa esiintyvän populaation. Johtopäätöksenä voidaan todeta, että 454-pyrosekvensointi mahdollistaa mikrobi-yhteisöjen yksityiskohtaisen vertailun ja myös aktiivisten lajien esiintymisen tutkimisen. Kvantitatiivinen PCR (qPCR) mahdollisti sulfaatinpelkistäjien ja metanogeenien aktiivisen ja lepotilaisen populaation tutkimisen. Avainsanat: RNA, pyrosekvensointi, mikrobien monimuotoisuus, mikrobiyhteisö, metanogeeni, sulfaatinpelkistäjä, pohjavesi, qPCR.
1
TABLE OF CONTENT ABSTRACT TIIVISTELMÄ GLOSSARY .................................................................................................................... 3
PREFACE ....................................................................................................................... 7
1 INTRODUCTION ....................................................................................................... 9
1.1 The deep biosphere .......................................................................................... 91.2 Deep subsurface microbial communities .......................................................... 91.3 Microbial taxonomy and identification of uncultured microbial species ........... 111.4 Sequencing methods ...................................................................................... 131.5 High throughput Tag encoded Pyrosequencing ............................................. 151.6 Description of terms used in diversity studies ................................................. 151.7 Description of the site ..................................................................................... 18
2 MATERIAL AND METHODS ................................................................................... 19
2.1 Sampling ......................................................................................................... 212.2 Geochemistry .................................................................................................. 232.3 Nucleic acid isolation ...................................................................................... 232.4 Total Number of Cells (TNC) .......................................................................... 242.5 Amplification library preparation ..................................................................... 242.6 Sequence processing and analysis ................................................................ 252.7 Real-time quantitative PCR (qPCR) ............................................................... 25
3 RESULTS ................................................................................................................ 27
3.1 Total Number of Cells (TNC) .......................................................................... 273.2 Bacterial diversity ............................................................................................ 273.3 Archaeal diversity ........................................................................................... 333.4 Sulphate reducing bacteria ............................................................................. 373.5 Methanogens .................................................................................................. 413.6 Negative controls ............................................................................................ 423.7 Geochemistry .................................................................................................. 423.8 The microbial communities in relation to environmental parameters .............. 43
4 CONCLUSIONS ...................................................................................................... 49
5 FUTURE CONCIDERATIONS ................................................................................ 53
REFERENCES ............................................................................................................. 55
APPENDICES ............................................................................................................... 63 Appendix A: Geochemical analysis results Appendix B: Geochemical analysis methods Appendix C: Dendograms Appendix D: Rarefaction analysis Appendix E: The distribution of bacterial 16S rRNA OTUsin relation to depth

2

3
GLOSSARY
ACE Species richness estimator, approximates the total number of species in an environment based on the relationship of OTUs containing one to four sequences to the total number of OTUs obtained
Amplification increasing the number of copies of a gene fragment of transcript
by PCR Amplification library PCR product produced for the high-throughput sequencing
containing sequence identifiers, tags. ANME ANaerobic MEthane-oxidizing Archaea Archaea one of the three domains of life, methanogens belong to this
group Bacteria the other of the single celled primary domains of living
organisms bsl below surface level CHAO Species richness estimator, approximates the total number of
species in an environment based on the relationship of OTUs containing one or two sequences to the total number of OTUs obtained
Distance in phylogenetic analyses describes the dissimilarity between
sequences, i.e. at a distance of 0.1 two sequences have 10% difference in their sequences compared with each other, and hence 90 % similarity
Diversity or biodiversity, the degree of variation of species within a given
ecosystem Diversity index A statistically calculated measure for describing the differences
in the composition of species between different environments or samples.
DNA a nucleic acid that contains the genetic instructions used in the
development and functioning of all known living organisms dsrB a fragment of a gene involved in sulphate reduction, used as a
marker gene for the detection of sulphate reducing bacteria
4
High-throughput sequencing new sequencing technology for obtaining large numbers of short
sequences mcrA gene involved in the production of methane and used as a
marker gene for the detection of methanogens Methanogen anaerobic microorganism, which produce methane nested PCR a two round PCR for the detection of genes present at low
numbers OTU Operational taxonomic unit, concept used in any kind of
hierarchical classification when pre-defined groups are being compared. In this case, used to indicate groups of sequences or species, which share a defined degree of similarity.
Observed diversity Observed diversity describes the number of species or OTUs
observed in a sampling. PCR polymerase chain reaction, amplification method for fragments
of DNA Primer oligonucleotides used to target the amplicon of interest, specific
detection of gene fragments qPCR quantitative polymerase chain reaction Rarefaction function of the number of species observed in relation to the
number of individuals sampled or sequences obtained from a certain sample
RNA ribonucleic acid, the constituent of e.g. ribosomes and
messenger-RNA (mRNA) Sequence the specific order of nucleic acid bases in RNA or DNA Sequence read individual sequence produced by high-throughput sequencing
techniques Shannon diversity index Index describing the biodiversity of an environment. A high
Shannon diversity value indicates high diversity Simpson diversity index Index describing the biodiversity of an environment. A high
Simpson diversity value indicates low diversity
5
Species evenness Description of the distribution of species in an environment or a community.
Species richness Description of the total number of different species in an
environment. Species richness estimators Approximations of the total number of taxonomic units (species
or OTUs) based on the amount of units observed in analysis. SRB Sulphate reducing bacteria, a versatile group of bacteria, with
members from both Firmicutes and delta-proteobacteria phyla. Anaerobic microorganisms, which oxidize carbon compounds with sulphate producing sulphide
Tag sequencing the sequencing of PCR products containing a pre-defined DNA
identifier, used in the high-throughput sequencing Transcript the mRNA copy of a gene

6
7
PREFACE
This is an update from the Posiva Working Report 2011-31: Characterization of Olkiluoto Bacterial and Archaeal Communities by 454 Pyrosequencing and replaces the version that was released in March 2012. Due to the great number of sequence reads handled in this study, the representative sequence of the most abundant bacterial group was accidentally changed to the representative sequence of a minor bacterial group. This effect for the results, conclusions and discussion and therefore Posiva Oy decided to re-print the report. The work was carried out at VTT Technical Research Centre of Finland during 1.1.2010 and 30.12.2010. The contact person at Posiva Oy was Anne Lehtinen and the work was coordinated by Merja Itävaara, VTT. The research work at VTT was done by research scientists Malin Bomberg and Mari Nyyssönen. MSc Lotta Purkamo (VTT) ans MSc Maija Nuppunen-Puputti (VTT) assisted in the sampling campaigns. Anne Lehtinen, Petteri Pitkänen and Posiva field personnel, especially Jari Siltanen, are much thanked for interesting discussions, comments and facilitating sampling campaigns. The project aimed to provide deeper insight to active microbial communities and their taxonomy at the final disposal site in Olkiluoto by using high through-put 454 pyrosequencing technology.

8

9
1 INTRODUCTION
1.1 The deep biosphere
A great part of life on earth, as much as 50 %, is estimated to be located underground out of reach of the direct impact of the sun (Whitman et al. 1998). These life forms are mainly microbial, but they are of great importance for the cycling of nutrients on Earth and microorganisms were responsible for oxygenating Earth’s atmosphere. Depending on their physiology the microorganisms have different effects on their surroundings. For instance, most microorganisms are dependent on carbon compounds produced during decaying processes or secreted by other microorganisms, such as acetate or formate. These are the so called heterotrophic microorganisms. Other microorganisms, the autotrophs, are not dependent on compounds produced by other microorganisms, but are able to utilize the most simple inorganic carbon compounds, such as CO2, and hydrogen in order to produce higher carbon compounds, which serve as substrates for other microorganisms. By producing acetate or methane from H2 and CO2, the autotrophic microorganisms of a community may have the power to drive the whole microbial ecosystem even though carbon compounds derived from photosynthesis never reaches the subsurface environment. The Fennoscandian shield subsurface environment at Olkiluoto is characteristically anaerobic with a salinity gradient increasing with depth (Posiva 2009). The sulphate reducing and methane producing communities in groundwater samples to a vertical depth of 565 m has been characterized and quantified by both enrichment techniques (e.g. Pedersen 2007) and qPCR (Itävaara et al. 2008; Bomberg et al. 2010). These microorganisms are commonly found in both shallow and deep groundwater. Their numbers are generally low compared to the total number of microbial cells, but their functional activities make them significant for the safe long-term storage of nuclear waste. 1.2 Deep subsurface microbial communities
Life on Earth is divided into three major Domains of Life; the Bacteria, the Archaea and the Eukaryota (Figure 1). The two former domains contain the single celled microorganisms, while the latter one contains the organisms with defined intracellular structures, such as the cell nucleus, organelles, and generally more than one chromosome. The microbial communities of terrestrial deep subsurface environments have been characterized by molecular tools in several locations (Takai et al. 2001; Baker et al. 2003). The species diversity of microbial communities varies considerably between locations. In ultra deep mines and coal deposits (Onstott et al. 2003; Fry et al. 2009) the bacterial communities consisted mostly of alfa-, beta- and gamma-proteobacteria, and to some extent of delta-proteobacteria and firmicutes belonging to the Clostridia. The archaeal communities in both studies were less diverse than the bacterial ones, and a great part of the communities consisted of Crenarchaeota. The Euryarchaeota detected mostly belonged to Methanobacteriales. In South Aftican gold mines, the archaeal communities consisted of taxa belonging to both Crenarchaeota and Euryarchaeota, which formed their own phylogenetic groups not found elsewhere (Takai et al. 2001).

10
Figure 1. A phylogenetic tree representing the relationship between the three domains of life, the Bacteria, Archaea and the Eucarya based on the small subunit ribosomal RNA sequence. Major phyla of each domain are presented. The archaeal phyla Crenarchaeota and Euryarchaeota are shown in more detail. (Bomberg 2008). The situation in the deep subsurface of the Fennoscandian shield appears to be different. In studies both in Sweden and Finland, the archaeal communities appear to consist only of different euryarchaeotal taxa. In Äspö, Sweden, it has been found that both archaea and bacteria are present in these environments. A study on the microbial communities at two depths of the Outokumpu deep drill hole in Eastern Finland, showed by high-throughput pyrosequencing that the bacterial community at 200-300 m depth was dominated by proteobacteria, while that at 1000-1100 m depth was dominated by Firmicutes (Itävaara et al. 2011). It was also shown that the archaeal populations at the same depths were less diverse and consisted mainly of archaea related to Methanobacteriales.
Methanogenesis and sulphate reduction are key terminal processes in the anaerobic degradation of organic material in anaerobic environments, such as terrestrial subsurface (Winfrey and Zeikus 1977; Winfrey et al. 1981). However, also other microorganisms are present. Pedersen and co-workers have for a long time characterized communities of microorganisms with varying physioloy, such as acetate producing microorganisms, metal reducing and methane oxidizing microorganisms from deep Fennoscandian groundwater (Kalyuzhnaya et al. 1999; Pedersen et al. 2008). It has also been demonstrated that the diversity of these different physiological groups

11
differ at different depth and generally decline with depth (Haveman et al. 1999; Hallbeck and Pedersen 2008; Pedersen et al. 2008). During recent years, cultivation based techniques for the detection of microorganisms in natural habitats have given way to molecular detection methods. Several studies have shown considerable diversity of the microbial populations in deep subsurface environments (Akob et al. 2007; Fry et al. 2009; Gihrling et al. 2006). With more extensive screening methods, new microbial groups present at only low numbers, such as microbes belonging to Bacteroidetes, Green non-sulphur bacteria, Candidate Divisions JS1, TM7 and OP3, OP8, OP10, OP11, Deinococcus/Thermus, and even Cyanobacteria have been detected in deep subsurface environments. New archaeal phylotypes mainly found in deep marine and terrestrial subsurfaces have also been found due to molecular techniques (Takai et al. 2001; Fry et al. 2009). Most of these microorganisms have not yet been cultivated, but by use of different incubation and enrichment studies, some of their functions have been revealed. For instance, it has been shown by stable isotope probing (SIP) that members of the Candidate Division JS1 utilize acetate (Webster et al. 2006). 1.3 Microbial taxonomy and identification of uncultured microbial
species
Taxonomy is the hierarchical classification of units into defined groups. As an example, a Scots pine tree belongs to the Domain Eukaryota Kingdom Plantae (Plants) Phylum Pinophyta (Conifers) Class Pinopsida Order Pinales Family Pinaceae (Pines) Genus Pinus (>100 species) Species Pinus sylvestris (Scots pine). In contrast, the conifer tree Norway spruce (Picea abies) belongs to the Family Pinaceae, but to the Genus Picea (ca 35 species). Microorganisms are divided in a similar way. The microorganisms belong to two domains, the Archaea and the Bacteria. Generally, bacteria are more common, and depending on the method for characterization, it has been proposed, that the bacterial domain contain up to 25 recognized phyla (Garrity et al. 2006), while the Archaea only contains three to five (Brochier-Armanet et al. 2008; Huber et al. 2002). However, only those groups with cultured members can be assigned the status of Phylum. It is not known how many different Phyla exist of which no cultured species has yet been obtained. Certain microbial phyla are of special importance in the deep subsurface. The archaeal Phylum Euryarchaeota contains all the methanogenic archaea found to date, and members of this phylum are widespread in the environment, and found in the intestines, soil, anaerobic water and sediments, groundwater, bioreactors etc. Of the bacterial Phyla, the Firmicutes and the Proteobacteria are the most commonly found bacteria. The Firmicutes are distinct from other bacteria in that they generally have a rigid and thick cell wall and that many of the species produce resting spores, which can survive viable in the environments for hundreds of thousands of years. These bacteria are also very universal. Many of the genera within the Phylum Firmicutes belonging to the order Clostridiales are able to perform sulphate reduction. The order Actinobacteria are common in both terrestrial and aquatic environments, where they are important in decomposition of organic materials. The other very common bacterial Phylum is the Proteobacteria. The proteobacteria have thinner cell walls, but have an extra outer
12
membrane protecting the cell. They do not form resting spores. Several of the proteobacterial Classes are of interest. For example, the delta-proteobacteria contains species that reduce sulphate. The alfa-proteobacteria contains most of the phototrophic bacterial genera, but also methylotrophic (C1-utilizing) genera. Beta-proteobacteria contains many genera that fix nitrogen or oxidize ammonia and even other chemolithotrophic genera. They are common degraders of complex compounds. Gamma-proteobacteria contain many of the most common intestinal bacterial genera, but also many methane oxidizing genera. The epsilon-proteobacteria is one of the least known proteobacterial classes. It contains species that have been found in deep sea hydrothermal vents and have been shown to oxidize H2, different sulfur compounds and ammonia, and to fix CO2. When uncultured microbial groups are investigated and communities characterized, certain marker genes can be used for identification of the groups present. The gene for the ribosomal 16S RNA subunit is one of the most commonly used. This gene is highly conserved and present in all cellular life forms. This gene can be used for the identification of all groups of microorganisms present in a sample by PCR amplifying this gene with suitable primers. The obtained PCR product contains the amplified gene fragments of all microbial groups present in the sample. The PCR amplification is followed by different methods, such as DGGE or cloning, to separate these gene fragments from each other. This is subsequently followed by sequencing of these separated gene fragments. The obtained sequences are compared to sequences deposited in global gene banks and the groups present in the original sample can be identified. Usually, however, the sequences are not readily identified, because most of the sequences deposited in the sequence banks originate from environmental samples and have only been obtained by molecular methods. To be able to assign the sequence of an uncultured microorganism to a taxonomic group, phylogenetic analyses must be performed. In these analyses, the sequences from the sample as well as reference sequences from both known taxa and uncultured taxa are aligned and their similarities are compared. Based on this alignment, a phylogenetic tree is calculated in which sequences sharing a certain degree of similarity are collected into groups. In deep subsurface environments, bacterial groups generally dominate the microbial communities. Different groups of Proteobacteria or Firmicutes are often the dominating types. Beta- and delta-proteobacteria were shown to be common in a shallow (around 100 m depth) aquifers, while in a deep aquifer (800-1000 m depth) the bacterial community was dominated by delta-proteobacteria and Firmicutes (Detmers et al. 2001; Shimizu et al. 2006; Kruger et al. 2008; Fry et al. 2010). More uncommon bacterial groups, such as the Candidate Division JS1 (Newberry et al. 2004), and the Chloroflexi, Actinobacteria and Bacteroidetes have lately been detected in deep subsurface environments (Teske and Biddle 2008; Onstott et al. 2003; Fry et al. 2010). The archaeal communities have generally been smaller and less diverse than the bacterial ones. The archaea found in deep subsurface environment belong to different groups of methanogens (Methanosarcina, Methanobacteria, Methanomicrobia), ANME archaea, Thermoplasma, and different groups of novel Eury- and Crenarchaeota (Kotelnikova and Petersen 1997; Takai et al. 2001; Onstott; Fry et al. 2009). Certain archaeal groups with no cultured representatives are also more commonly found in
13
marine and terrestrial subsurface, such as the MCG (Miscellaneous Crenarchaeotal Group), the SAGMEG (South African Gold Mine Euryarchaeotal Group), and the TMEG (Terrestrial Miscellaneous Euryarchaeotal Group) (Takai et al. 2001; Jiang et al. 2007). The 16S rRNA gene does not reveal function of the detected microbial communities. For this purpose, genes encoding enzymes involved in specific functions, such as methanogenesis or sulphate reduction, may be used. Methanogens have successfully been detected by their genes for methyl Co-enzyme M reductase (mcrA) in many different environments (Hales et al. 1996; Luton et al. 2002; Juottonen et al. 2006; Bomberg et al. 2010) while sulphate reducers by their dissimilatory sulphite reductase (dsrAB) genes (Karkhoff-Schweizer et al. 1995, Karr et al. 2005; Bomberg et al. 2010). The mcrA gene is with only a few exceptions, present only in methanogenic archaea and can be used in targeted studies. The dsrAB gene is highly conserved across the sulphate-reducing bacteria and archaea and are present in micro-organisms able to convert SO4
2 to H2S (Karkhoff-Schweizer et al. 1995, Karr et al. 2005). However,
microorganisms are involved in many more functional processes in the deep subsurface. Archaea, for example, are known to reduce iron and oxidize H2 (Miroshnichenko and Bonch-Osmolovskaya, 2006). Bacterial functions include lithoautotrophy using H2, S0, S2 or S2O3
2 as energy sources and NO3 , or S0 as electron acceptors (certain Epsilon-proteobacteria) (Yamamoto et al. 2010), iron reduction (certain Delta-proteobacteria) (Cummings et al. 2000). 1.4 Sequencing methods
DNA sequencing is the process of determining the nucleotide order of a certain fragment of DNA. Most DNA sequencing has been performed using the chain termination method developed by Sanger et al (1977) (Figure 2a). In this technique, PCR is used to produce sequence specific products. Nucleotides are added to the end of the nucleotide strand being synthesized. At random pace, modified nucleotides having a fluorescent label are added to the end of the synthesized nucleotide chain. These fluorescently labeled nucleotides are modified in a way that new nucleotides cannot be added to the chain any more. The result is a multitude of single stranded DNA fragments of different length bearing a fluorescent label at the end. This label is different for each nucleotide. The nucleotide sequence is obtained when the produced single stranded fragments are separated by capillary electrophoresis according to length. The shortest fragments move fastest through the capillary. As the fragments move through the capillary, they pass a beam of UV light which lights up the fluorescent end label of the fragment. The color of the light signal from the fluorescent label is registered by a detector and the sequence of the whole fragment is obtained as fragments with increasing lengths pass by the detector. New sequencing technologies such as 454 FLX Pyrosequencing have been developed, which are able to produce a multitude of sequence data in a much shorter time than what the chain terminator sequencing can provide. In the 454 pyrosequencing, the sequencing is performed in an array-based method. Basically, single-stranded DNA products are annealed to beads and amplified via emulsion PCR (EmPCR). The beads are placed into wells on a fiber-optic chip along with enzymes which produce light in the presence of

14
ATP. Nucleotides are subsequently washed over the chip. As the nucleotides join the complementary template chain, ATP is generated and thus a light signal is produced (Figure 2b). Nucleotides are added one at a time, and each time the produced light signal, or the lack there of, is detected by a CCD camera, and a sequence is obtained.
Figure 2a and b. Schematic presentation of the a) chain terminator sequencing and b) pyrosequencing techniques. In a) a PCR produced with chain terminating nucleotides with a different fluorochrome for each terminating nucleotide produces single stranded DNA fragments of different lengths. These fragments are equipped with the fluorescing label at the end. The DNA fragments are run through a polymer matrix, which order the fragments according to length. The fragments pass a detector and the order in which they pass is registered and converted into a chromatogram from which a sequence can be read. In b) the incorporation of nucleotides to an extending PCR product is detected as a signal of light. If a light signal is detected when a certain nucleotide has been introduced to the reaction that particular nucleotide has been incorporated to the growing strand of the PCR product. If no light is registered after introduction of a nucleotide to the PCR mixture the nucleotide has not been incorporated and thus is not present in that location of the sequence. The strength of the light emission reveals the number of nucleotides that have been incorporated at each time. This data is converted into a program from which a sequence can be obtained.

15
1.5 High throughput Tag encoded Pyrosequencing
The number of different microbial species inhabiting Earth have been estimated to be in the magnitude of 106 or more (Hughes et al. 2001). However, the number of cultured and characterized microbial species is only around 104 according to the database of the Ribosomal Database Project, University of Michigan (http://rdp.cme.msu.edu/). For example, Amann et al. (1995) showed in their review that of all microbial cells seen by microscopy, only 0.001-0.1 %, 0.25 % and 0.3 % of the cells in seawater, freshwater and soil, respectively, grew on any known laboratory media. This means that the biological diversity of microbial species in nature is much greater than what is known today. It also means that functions and roles are known for only a small fraction of all microorganisms detected by different molecular methods, which is a major limitation for the study of microbial processes in different environments. It is often assumed that the most common microbial species in a sample has the highest impact on the microbial community and ecosystem of a certain habitat. However, also microbial groups present as minorities may play important roles in the sustenance of the total community. If the community structure can be revealed and compared to e.g. geochemical parameters, the putative roles of certain microbial groups may be suggested and further tested. The development of high through-put sequencing methods has given the opportunity to comprehensively characterize microbial communities by their ribosomal genes, or specific functional groups of microorganisms by targeting specific marker genes, such as dsrB for the sulphate reducers or mcrA for the methanogens. With this method, also microbial taxa present at only low cell numbers will be detected. Due to the fact that many intermediate steps can be excluded between the preparation of the sample and the delivery of the sequence results, the results are also likely to be less biased by biological incompatibility factors, such as differences in cloning efficiency between genetic material of uncultured microorganisms. This method may reveal the relative species composition of the community better than methods relying on clone libraries and DGGE. The results are analyzed with a special software designed for pyrotag sequence analysis, such as Mothur (Schloss et al. 2009), which employs generally used comparative, alignment and classification tools as well as many calculations used for the characterization and comparison of environments based on biological diversity and ecology. 1.6 Description of terms used in diversity studies
Environments are described and compared by different estimators of biological factors. One of the most commonly used descriptions of the biological contents of an environment is the diversity of the environment. The biological diversity of a certain environment describes the total number of different biological species in that environment, without regard to which species are present. E.g. microbial diversity describes the total number of microbial species or groups in a given environment. Most of the microbial species in the environment are not culturable in laboratory conditions and have thus not been scientifically characterized and described. The presence of these species has only been detected as gene fragments obtained from the total microbial DNA or RNA pool in different environmental samples. As they have no cultured close relatives, these uncultured microorganisms are often referred to belong to certain operational taxonomic units, or OTUs (Figure 3).

16
Figure 3. Schematic description of the division of units into OTUs depending on pre-defined characteristics. Picture A. describes the total community of species (red, green and blue squares and circles). In Picture B. the different species have roughly been identified and determined to belong to certain groups according to similarity, i.e. into operational taxonomic units according to similarity in colour. Picture C. shows a finer degree of division, where the OTUs of picture B. have further been classified according to both colour and shape. An OTU consists of a group of sequences which have a pre-defined sequence similarity. Depending on the demands of the research or the nature of the data, sequences that share e.g. more than 90 % similarity may be defined to belong to a specified OTU. OTU is used to classify sequence data so that it can be compared between samples or treatments. Because OTU can be defined at any level of similarity, it is an artificial unit. As a result, an OTU is not the same as a microbial species, but is instead a group of similar sequences. The biological diversity of a sample or environment may be characterized by the actual number of species or OTUs observed in a sample. For instance, if 20 different species or OTUs are detected in a sampling, the observed number of species (or OTUs) is 20. It is also described by the species evenness. The different observed species may be evenly of unevenly represented numerically, i.e. a community with 20 cats and 20 dogs is even whereas a community with 2 cats and 38 dogs is uneven, although they have the same number of observed species. The species richness in a certain environment describes the total number of different species in that environment. The higher the number of species the higher is the species richness. The species richness between samples of different sizes may be compared by the use of rarefaction curves (Figure 4). In a rarefaction calculation, the species richness of a sample is plotted as a function of the number of individuals sampled, or sequence reads obtained. If the slope of the plotted curve is steep, it indicates that a higher number of species is likely to be

17
obtained with more intensive sequencing (or sampling). If the slope of the curve is low more intensive sampling is likely to yield only few additional species. One critical issue when sampling different environments with different species in a community is that the larger the number of individuals sampled, or sequence reads obtained, the more species will be found. The species richness of a sample may be estimated by using various species richness estimators that approximate the total number of species or OTUs based on the amount of units observed in the analysis. There are different estimators available. The CHAO diversity estimate approximates the total number of different species based on the relationship of OTUs that contain only one or two sequences to the total number of OTUs. The ACE diversity estimate performs the same approximation but instead of using OTUs containing only one or two sequences, it also uses OTUs that contain three and four sequences to calculate the relationship. Environments are given so called diversity indexes which take into account both the number of observed species or OTUs as well as the amount of individuals (or sequence reads) belonging to each of these species or OTUs and uses this combined information to estimate diversity in terms of species abundance and evenness. The Shannon diversity index is high in samples that have a large number of species and/or in samples where the species are evenly distributed. The Simpson diversity index, in contrast, gives lower values for samples were diversity is high.
Figure 4. Schematic description of the rarefaction analysis, which determines the degree of sampling of an environment. Picture A. describes the total community of individuals which is being randomly sampled. The community contains 6 different species, which are represented by different numbers of individuals (red, green and blue squares and circles). In a random sampling, the likelihood that an individual of a new species is identified is higher in the beginning of the sampling, but the likelihood to catch an individual of a new species decreases with more extensive sampling. This is described by Picture B. where the sampled individuals are shown below the x-axis and the number of detected species is displayed by the y-axis. When all species have been identified by at least one individual, the plot reaches equilibrium, and flattens out, which indicates that the sampling has been thorough.

18
1.7 Description of the site
The groundwater in Olkiluoto is stratified due to physicochemical parameters (Posiva 2009). The surface water to a depth of 30 m is fresh to brackish and of meteoric origin. The uppermost water strata have high concentrations of dissolved inorganic carbon (bicarbonate). The salinity gradient (concentration of TDS and Cl-) grows with depth. At the depth between 100 and 400 meters the salinity is similar to that of present day Baltic, but below 400 mbsl, the salinity significantly increases. The salinity of the deepest groundwaters in Olkiluoto has been reported to be as high as 84 g TDS/l. Between the depths of 100 – 300 m, the concentration of SO4 is elevated as the water originates from the Littorina Sea. Below this layer, the methane concentrations in the water increases. The deepest water, below 300 m, is dominated by Cl-, whereas SO4 is almost absent. Sulphate reducing microorganisms use sulphate for oxidation of organic carbon compounds. However, due to this high concentration of sulphate, the deep groundwaters usually lack high concentrations of organic carbon because the organic carbon compounds have probably already been oxidized. At the interface between the deep methane rich and the overlying SO4
2 rich waters, the concentration of H2S in the water increases. It has been proposed, that this is due to the anaerobic oxidation of methane with the simultaneous reduction of SO4
2 to H2S. In the anaerobic oxidation of methane, compounds such as nitrate (Raghoebarsing et al. 2006; Ettwig et al. 2010), manganese and iron compounds (Beal et al. 2009) are needed for the oxidation of methane to HCO3
-. These compounds can be found in many rock types, such as rhodocrosite and birnessite (Mn) and ferrihydrite (Fe), and have been shown to stimulate anaerobic oxidation of methane (Beal et al. 2009). However, in oceans it has been estimated that the anaerobic oxidation of methane with sulfate as the final electron acceptor is the major process (Knittel and Boetius 2010). The temperature of the groundwater at Olkiluoto rises linearly with depth, and ranges from around 5-6 C at a depth of 50 m to approximately 20 C at a depth of 1000 m (Ahokas et al. 2008). The pH in the water throughout the depth is slightly alkaline (Appendix A). Several of the deeper samples included in this study span through the same hydrogeological zones, HZ20 or HZ21 (Appendix A) This study focused on seven boreholes in Olkiluoto and the samples were obtained from vertical depths ranging from 296 m to 798 m bsl. The samples represented brackish sulphate waters and saline waters (as classified in Posiva 2009)
19
2 MATERIAL AND METHODS
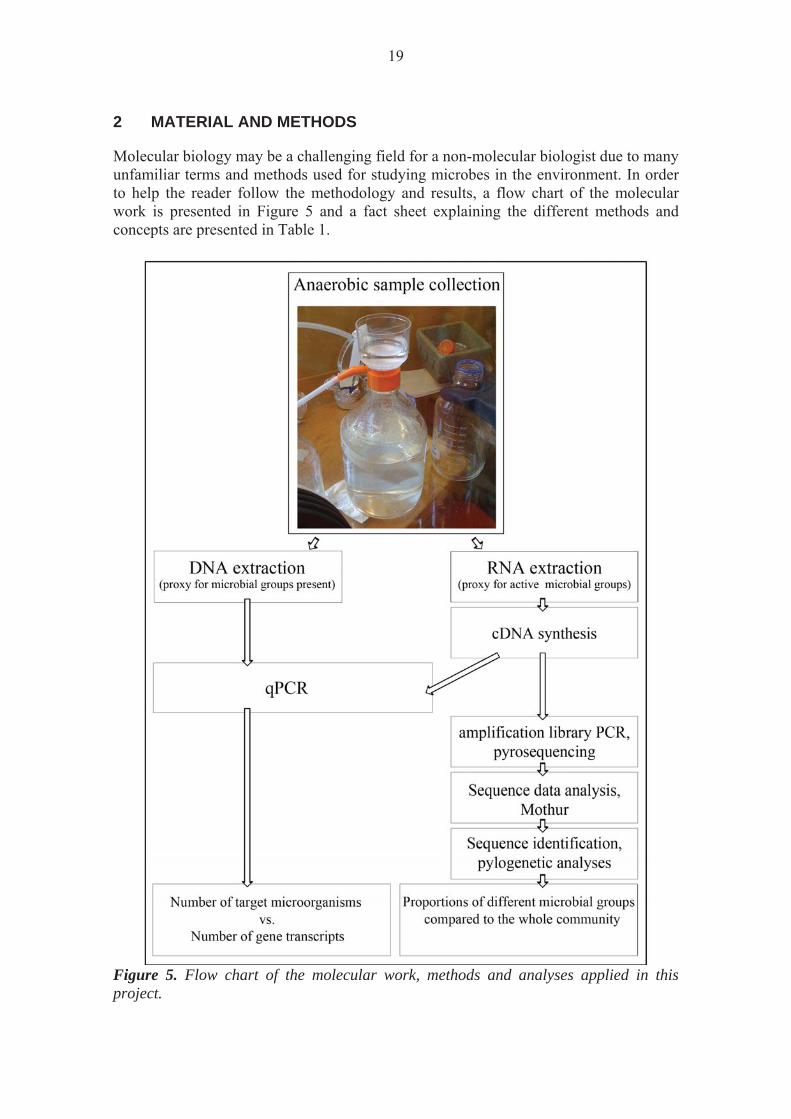
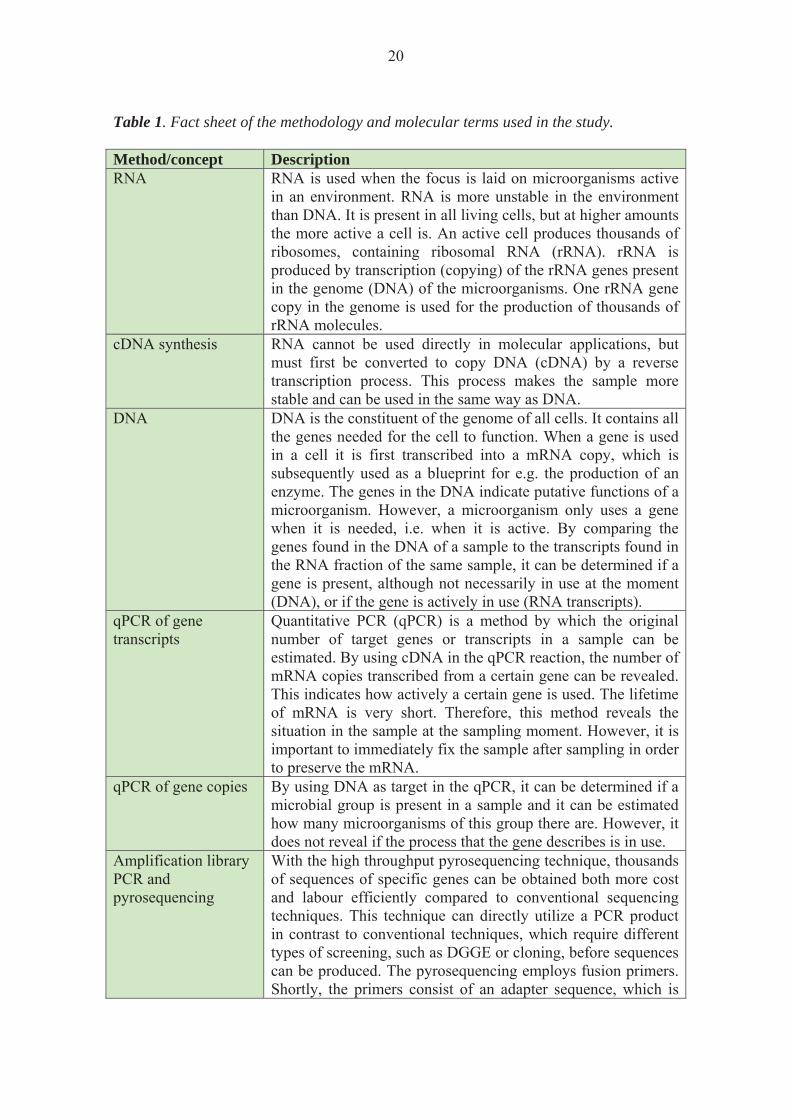
Molecular biology may be a challenging field for a non-molecular biologist due to many unfamiliar terms and methods used for studying microbes in the environment. In order to help the reader follow the methodology and results, a flow chart of the molecular work is presented in Figure 5 and a fact sheet explaining the different methods and concepts are presented in Table 1.
Figure 5. Flow chart of the molecular work, methods and analyses applied in this project.
20
Table 1. Fact sheet of the methodology and molecular terms used in the study. Method/concept Description RNA RNA is used when the focus is laid on microorganisms active
in an environment. RNA is more unstable in the environment than DNA. It is present in all living cells, but at higher amounts the more active a cell is. An active cell produces thousands of ribosomes, containing ribosomal RNA (rRNA). rRNA is produced by transcription (copying) of the rRNA genes present in the genome (DNA) of the microorganisms. One rRNA gene copy in the genome is used for the production of thousands of rRNA molecules.
cDNA synthesis RNA cannot be used directly in molecular applications, but must first be converted to copy DNA (cDNA) by a reverse transcription process. This process makes the sample more stable and can be used in the same way as DNA.
DNA DNA is the constituent of the genome of all cells. It contains all the genes needed for the cell to function. When a gene is used in a cell it is first transcribed into a mRNA copy, which is subsequently used as a blueprint for e.g. the production of an enzyme. The genes in the DNA indicate putative functions of a microorganism. However, a microorganism only uses a gene when it is needed, i.e. when it is active. By comparing the genes found in the DNA of a sample to the transcripts found in the RNA fraction of the same sample, it can be determined if a gene is present, although not necessarily in use at the moment (DNA), or if the gene is actively in use (RNA transcripts).
qPCR of gene transcripts
Quantitative PCR (qPCR) is a method by which the original number of target genes or transcripts in a sample can be estimated. By using cDNA in the qPCR reaction, the number of mRNA copies transcribed from a certain gene can be revealed. This indicates how actively a certain gene is used. The lifetime of mRNA is very short. Therefore, this method reveals the situation in the sample at the sampling moment. However, it is important to immediately fix the sample after sampling in order to preserve the mRNA.
qPCR of gene copies By using DNA as target in the qPCR, it can be determined if a microbial group is present in a sample and it can be estimated how many microorganisms of this group there are. However, it does not reveal if the process that the gene describes is in use.
Amplification library PCR and pyrosequencing
With the high throughput pyrosequencing technique, thousands of sequences of specific genes can be obtained both more cost and labour efficiently compared to conventional sequencing techniques. This technique can directly utilize a PCR product in contrast to conventional techniques, which require different types of screening, such as DGGE or cloning, before sequences can be produced. The pyrosequencing employs fusion primers. Shortly, the primers consist of an adapter sequence, which is
21
adhered to a streptavidin-coated bead. The adapter sequence is followed by a sample-specific ‘Multiplex Identifier’ (MID) sequence, which enables identification and separation of simultaneously produced sequences of several samples. The identifier sequence is followed by a gene specific primer sequence in order to produce an amplification library of a certain gene.
Sequence data analysis
In order to handle the great number of sequences produced by pyrosequencing, the sequences must first be separated from each other into groups according to the MID sequence, or sample. This step is followed by grouping similar sequences into Operational Taxonomic Units (OTUs) and obtaining representative sequences of each OTU for further analysis. Each OTU contains different amounts of sequences depending on how common a certain sequence has been in the sample.
Phylogenetic analyses The representative sequences of each OTU are submitted to phylogenetic analyses in order to identify which microbial group the sequence originated from. Sequences are compared to sequence data deposited in sequence databases and by use of mathematical calculation matrices the likelihood of a sequence to belong to a specific microbial group is calculated.
2.1 Sampling
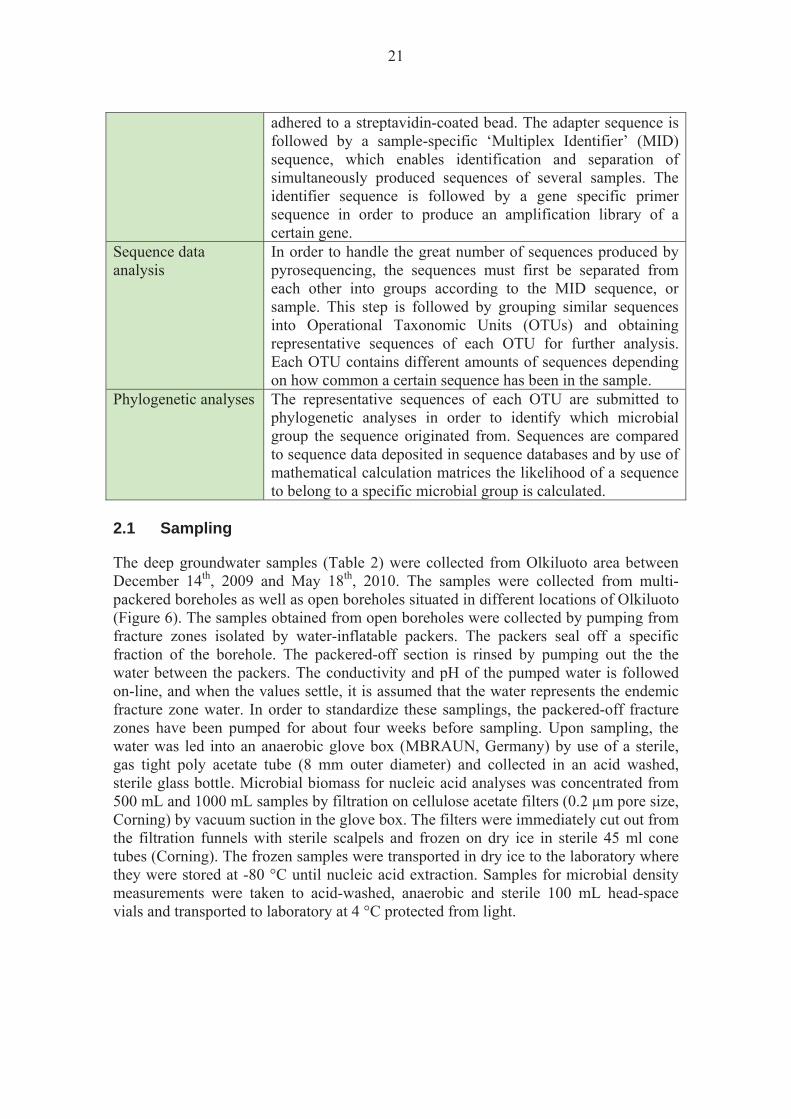
The deep groundwater samples (Table 2) were collected from Olkiluoto area between December 14th, 2009 and May 18th, 2010. The samples were collected from multi-packered boreholes as well as open boreholes situated in different locations of Olkiluoto (Figure 6). The samples obtained from open boreholes were collected by pumping from fracture zones isolated by water-inflatable packers. The packers seal off a specific fraction of the borehole. The packered-off section is rinsed by pumping out the the water between the packers. The conductivity and pH of the pumped water is followed on-line, and when the values settle, it is assumed that the water represents the endemic fracture zone water. In order to standardize these samplings, the packered-off fracture zones have been pumped for about four weeks before sampling. Upon sampling, the water was led into an anaerobic glove box (MBRAUN, Germany) by use of a sterile, gas tight poly acetate tube (8 mm outer diameter) and collected in an acid washed, sterile glass bottle. Microbial biomass for nucleic acid analyses was concentrated from 500 mL and 1000 mL samples by filtration on cellulose acetate filters (0.2 μm pore size, Corning) by vacuum suction in the glove box. The filters were immediately cut out from the filtration funnels with sterile scalpels and frozen on dry ice in sterile 45 ml cone tubes (Corning). The frozen samples were transported in dry ice to the laboratory where they were stored at -80 °C until nucleic acid extraction. Samples for microbial density measurements were taken to acid-washed, anaerobic and sterile 100 mL head-space vials and transported to laboratory at 4 °C protected from light.
22
Figure 6. The different boreholes sampled in this study are shown on the map. The arrows present the direction of the boreholes.
23
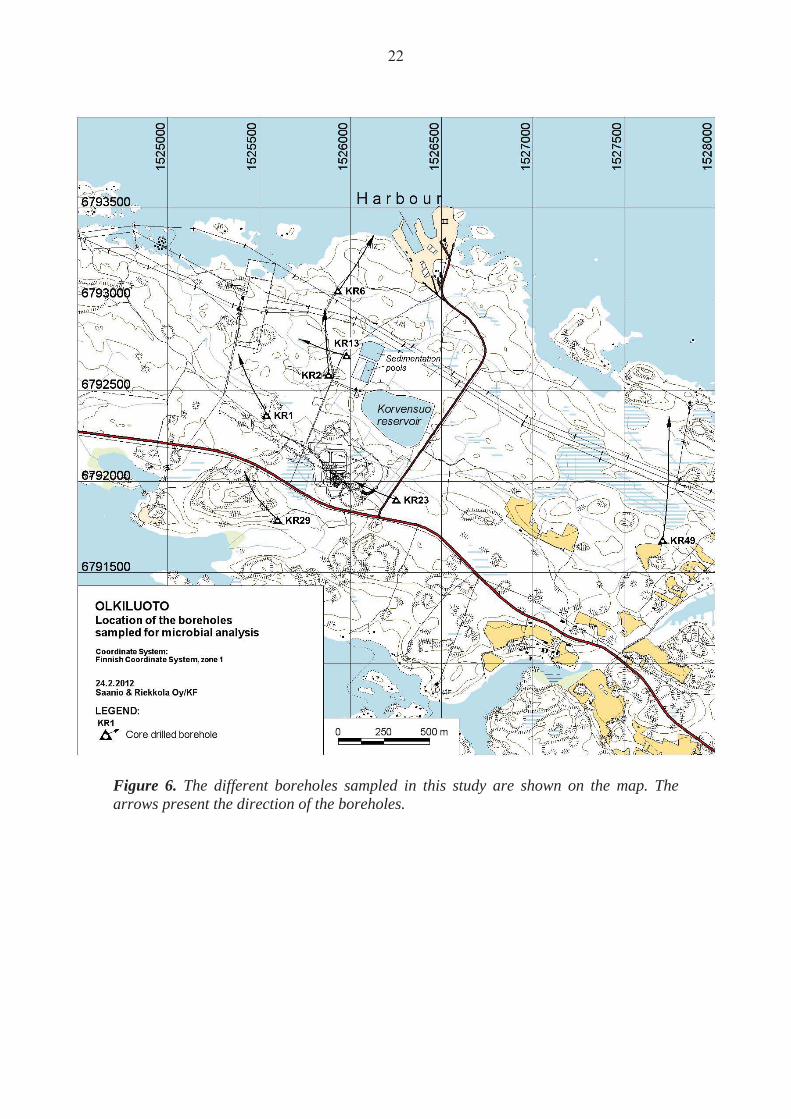
Table 2. Groundwater samples used in this study. Sample
Vertical depth (z)
Sampling date
Borehole type Sampling
OL-KR13/360-365 m 296 m 9.3.2010 Multi packered
borehole Pumping
OL-KR6/422-425 m 328 m 18.5.2010 Open borehole Pumping
OL-KR23/425-460.3 m 347 m 15.12.2009 Multi packered
borehole Pumping
OL-KR49/532-537 m 415 m 14.12.2009 Open borehole Pumping
OL-KR2/596.5-609.5 m 559 m 27.1.2010 Multi packered
borehole Pumping
OL-KR1/609.4-626.8 m 572 m 26.1.2010 Multi packered
borehole Pumping
OL-KR29/801-867 m 798 m 18.5.2010 Multi packered
borehole Pumping
2.2 Geochemistry
Analysis methods are presented in Appendix B. The data was obtained from Posiva. 2.3 Nucleic acid isolation
Total DNA was isolated directly from the frozen cellulose-acetate filters. The filters were cut to pieces with sterile scalpels in a laminar flow hood, and the DNA was extracted with the PowerSoil DNA extraction kit (MoBio Laboratories, Inc., Solana Beach, CA). The isolation was performed according to the manufacturer’s instructions except that the microbial cells were lysed by bead beating with a Ribolyser (Hybaid) device for 30 s at 6 m s-1. Three replicate filters were used for total DNA isolation. Negative DNA isolation controls were isolated from clean cellulose-acetate filter units. The isolated and purified DNA was then stored frozen at -80°C until use. Total RNA was isolated directly from the frozen cellulose-acetate filter with the PowerWater RNA isolation kit (MoBio Laboratories, Inc., Solana Beach, CA). The filters were thawed on ice and care was taken to minimize the time of thawing. The intact filters were inserted into the bead tubes with flame sterilized forceps and the RNA extraction was performed according to the manufacturer’s instructions. Negative RNA isolation controls were isolated from clean cellulose-acetate filter units. DNA contamination of the RNA extracts was checked by PCR with the relevant primers. If no PCR product was obtained, no DNA contamination was assumed and the RNA extract was submitted to cDNA synthesis. If a PCR product was obtained, the RNA extract was first treated with DNase (Promega) according to the manufacturer’s instructions. The RNA was subsequently submitted to cDNA synthesis. Aliquots of 11.5 μl of RNA was incubated together with 250 ng random hexamers (Promega) and 0.83 mM final concentration dNTP (Finnzymes, Espoo, Finland) at 65 °C for 5 minutes and cooled on ice for 1 minute. The cDNA was synthezised with the Superscript III kit (Invitrogen), by adding 4 μl 5 × First strand buffer, 40 u DTT and 200 u Superscript III to the cooled reactions. To protect the RNA template from degradation, 40 u recombinant RNase inhibitor, RNaseOut (Promega), was used. The reactions were incubated at 25 °C for 5
24
minutes, 50 °C for 1 h and 70 °C for 15 min. Three parallel reactions per sample as well as no template controls were performed. The parallel reactions were subsequently pooled. RT-PCR was also performed on the negative RNA extraction controls as well as negative reagent RT-PCR controls to ensure that these steps have remained uncontaminated during the process. 2.4 Total Number of Cells (TNC)
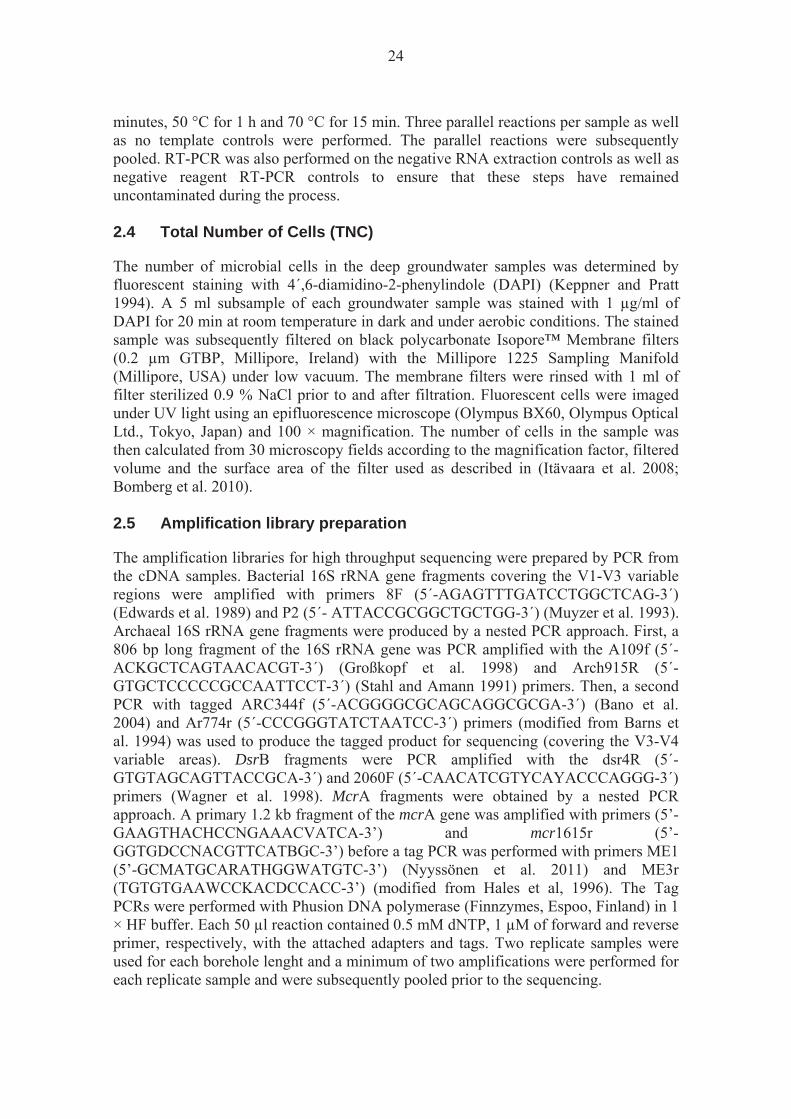
The number of microbial cells in the deep groundwater samples was determined by fluorescent staining with 4´,6-diamidino-2-phenylindole (DAPI) (Keppner and Pratt 1994). A 5 ml subsample of each groundwater sample was stained with 1 μg/ml of DAPI for 20 min at room temperature in dark and under aerobic conditions. The stained sample was subsequently filtered on black polycarbonate Isopore™ Membrane filters (0.2 μm GTBP, Millipore, Ireland) with the Millipore 1225 Sampling Manifold (Millipore, USA) under low vacuum. The membrane filters were rinsed with 1 ml of filter sterilized 0.9 % NaCl prior to and after filtration. Fluorescent cells were imaged under UV light using an epifluorescence microscope (Olympus BX60, Olympus Optical Ltd., Tokyo, Japan) and 100 × magnification. The number of cells in the sample was then calculated from 30 microscopy fields according to the magnification factor, filtered volume and the surface area of the filter used as described in (Itävaara et al. 2008; Bomberg et al. 2010). 2.5 Amplification library preparation
The amplification libraries for high throughput sequencing were prepared by PCR from the cDNA samples. Bacterial 16S rRNA gene fragments covering the V1-V3 variable regions were amplified with primers 8F (5´-AGAGTTTGATCCTGGCTCAG-3´) (Edwards et al. 1989) and P2 (5´- ATTACCGCGGCTGCTGG-3´) (Muyzer et al. 1993). Archaeal 16S rRNA gene fragments were produced by a nested PCR approach. First, a 806 bp long fragment of the 16S rRNA gene was PCR amplified with the A109f (5´-ACKGCTCAGTAACACGT-3´) (Großkopf et al. 1998) and Arch915R (5´-GTGCTCCCCCGCCAATTCCT-3´) (Stahl and Amann 1991) primers. Then, a second PCR with tagged ARC344f (5´-ACGGGGCGCAGCAGGCGCGA-3´) (Bano et al. 2004) and Ar774r (5´-CCCGGGTATCTAATCC-3´) primers (modified from Barns et al. 1994) was used to produce the tagged product for sequencing (covering the V3-V4 variable areas). DsrB fragments were PCR amplified with the dsr4R (5´-GTGTAGCAGTTACCGCA-3´) and 2060F (5´-CAACATCGTYCAYACCCAGGG-3´) primers (Wagner et al. 1998). McrA fragments were obtained by a nested PCR approach. A primary 1.2 kb fragment of the mcrA gene was amplified with primers (5’-GAAGTHACHCCNGAAACVATCA-3’) and mcr1615r (5’-GGTGDCCNACGTTCATBGC-3’) before a tag PCR was performed with primers ME1 (5’-GCMATGCARATHGGWATGTC-3’) (Nyyssönen et al. 2011) and ME3r (TGTGTGAAWCCKACDCCACC-3’) (modified from Hales et al, 1996). The Tag PCRs were performed with Phusion DNA polymerase (Finnzymes, Espoo, Finland) in 1 × HF buffer. Each 50 μl reaction contained 0.5 mM dNTP, 1 μM of forward and reverse primer, respectively, with the attached adapters and tags. Two replicate samples were used for each borehole lenght and a minimum of two amplifications were performed for each replicate sample and were subsequently pooled prior to the sequencing.

25
2.6 Sequence processing and analysis
The sequences obtained from the amplification libraries were trimmed with the Mothur software (Schloss et al. 2009) to remove the adapter, barcode and primer sequences and to remove all sequences that did not match the quality criteria (No mismatches in tag and primer sequences, no ambiguous nucleotides, maximum eight nucleotide long homopolymer stretches and minimum length of 200 to 300 bp depending on the transcript). The minimum length was 300 bp for bacterial 16 rRNA sequences, 200 bp for archaeal 16S rRNA sequences, 300 bp for dsrB sequences and 200 bp for mcrA sequences. The bacterial and archaeal 16S rRNA sequences were aligned with Mothur using a Silva reference alignment (Preusse et al. 2007) for bacterial 16S rRNA gene sequences (14 956 sequences) and archaeal 16s rRNA gene sequences (2 297 sequences), respectively. The dsrB sequences were aligned with the Geneious Pro software (Biomatters Ltd, New Zealand) using a dsrAB model alignment (Zverlov et al. 2005) (97 sequences). The mcrA sequences were aligned with Mothur using a mcrA gene sequenced alignment (this study) (213 sequences). The obtained alignments from the amplification libraries were checked and manually corrected in Geneious Pro software (Biomatters Ltd, New Zealand) before further analysis with Mothur. The sequences were divided into groups of similar sequences, i.e. Operational Taxonomic Units (OTUs). Each OTU contained sequences sharing 90 % (bacterial and archaeal 16S sequences) or 97 % (dsrB and mcrA sequences) similarity. The representativeness of the sequencing was tested by rarefaction analysis of the obtained OTUs. The estimated Chao and ACE species richness was analyzed for each sample and gene and the Shannon and Simpson diversity indices were calculated for each gene and sample. The similarities between the structures of the populations in the different samples were calculated using the Jaccard, Morisita-Horn and the Yue & Clayton (thetayc) calculation models included in the Mothur software. 2.7 Real-time quantitative PCR (qPCR)
The abundances of bacterial dsrB genes and archaeal mcrA genes were calculated by qPCR (as in Bomberg et al. 2010). The qPCR was performed with KAPA™ SYBR® Fast 2× Master mix for Roche LightCycler 480 (Kapa Biosystems, Inc., Boston, MA, USA). Triple reactions were performed for each sample. Each reaction contained 5 pmol of forward and reverse primers, respectively. As template, 1 μl extracted DNA or cDNA was used. The amount of DNA used as template corresponded to 10 ml of groundwater, and the amount of cDNA used corresponded to 11.5 ml (1000 ml samples) and 5.75 ml (500 ml samples) groundwater. The qPCR was performed on a Roche LightCycler 480 (Roche) on white 96-well plates (Roche) sealed with transparent adhesive seals (Roche). The qPCR conditions consisted of an initial denaturation at 95 ºC for 10 minutes followed by 45 amplification cycles consisting of denaturation for 15 seconds at 95 ºC, annealing of primers for 30 seconds at 55 ºC and elongation at 72 ºC for 30 seconds with a quantification measurement at the end of each elongation. A final extension step at 72 ºC for three minutes was performed prior to a melting curve analysis. The melting curve analysis consisted of a denaturation step for 10 seconds at 95 ºC followed by an annealing step at 65 ºC for one minute before the final continuous heating to 95 ºC at a rate of 0.11 ºC per second and 5 acquisitions per 1 ºC. The possible

26
inhibition of the qPCR by the template used was tested by adding 5x10⁶ copies of mcrA in reactions containing template DNA or cDNA and comparing the amplification success of the added mcrA to a standard curve using the qPCR conditions described for the mcrA qPCR above.

27
3 RESULTS
3.1 Total Number of Cells (TNC)
The number of microbial cells ml-1 groundwater varied between 4.2 × 10⁵ cells ml-1 in sample OL-KR13/360-365 m to 1.5 × 10⁴ in sample OL-KR49/532-537 m with a general decline with depth (Table 3). 3.2 Bacterial diversity
Bacterial diversities were studied based on RNA extractions providing information of active microbial communities in the bedrock aquifers. Bacterial 16S rRNA gene sequences were obtained from all the samples. A total of 375 different operational taxonomic units (OTUs) belonging to 27 different families of bacteria were detected. The most diverse bacterial community was observed in the sample OL-KR1/609.4-626.8 m with 169 identified operational taxonomic units (OTUs) of bacterial 16S rRNA gene sequences. The sample OL-KR1/609.4-626.8 m also had the highest estimated species richness (Chao and ACE, Table 4). Interestingly, the majority of the bacterial 16S rRNA sequences obtained from this sample (97.7 %) belonged to one family of Clostridia. The rest of the sequences appeared only as one or two sequences/OTU. Generally, between 46 and 52 % of the total estimated OTU richness was obtained by the high through-put sequencing of the bacterial 16S rRNA. However, two of the samples were less well covered. In samples OL-KR13/360-365 m and OL-KR6/422-425 m, only 28 % and 15.6 % respectively of the estimated Chao species richness was recovered. This may be due to the rather low number of high quality sequences obtained from these samples, although in comparison, sample OL-KR29/801-867 m produced a similar number of sequences, but the estimated species richness was covered to 47 %. Based on both the frequency of the appearance of bacterial 16S rRNA sequences as well as on the distribution of the sequences and OTUs in the samples, the bacterial communities of OL-KR13/360-365 m, OL-KR6/422-425 m and OL-KR23/425-460.3 m were more similar to each other, than to any of the other samples. Likewise, samples OL-KR49/532-537 m, OL-KR2/596.5-609.5 m and OL-KR1/609.4-626.8 m had similar bacterial communities. Sample OL-KR29/801-867 m, on the other hand, had a completely different bacterial community than the other samples. Dendrograms showing the groupings of the samples based on their similarities are shown in Appendix C.
28
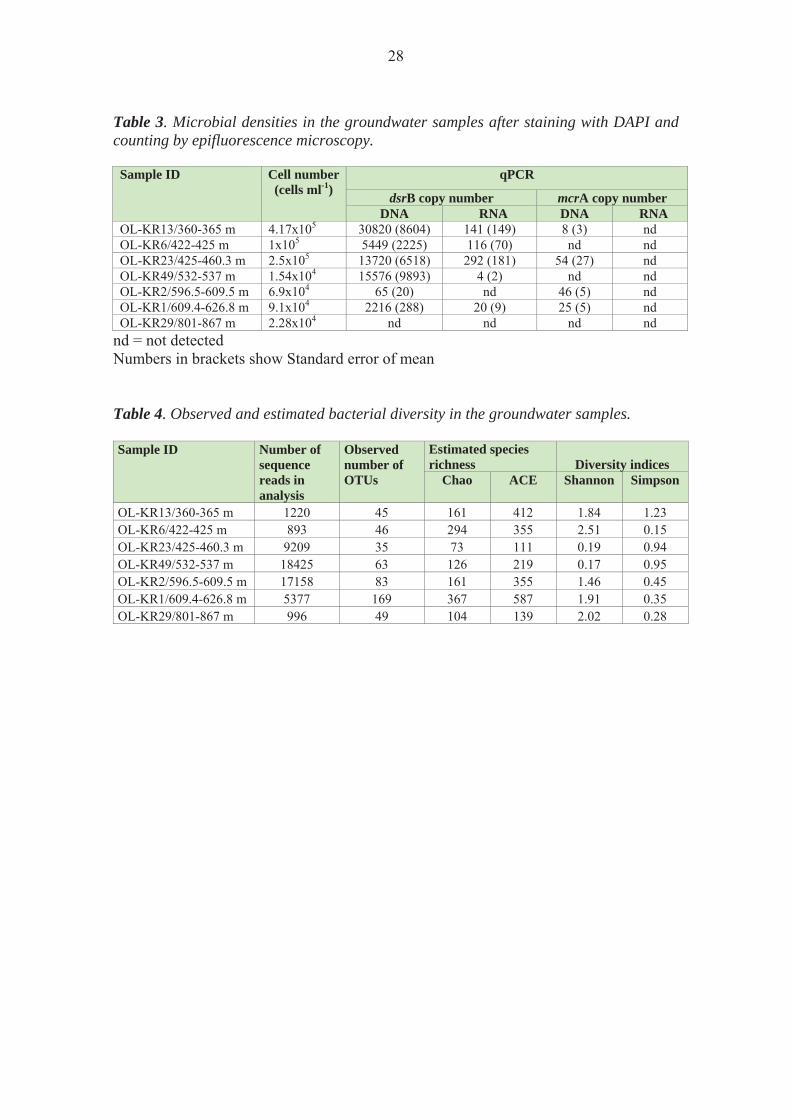
Table 3. Microbial densities in the groundwater samples after staining with DAPI and counting by epifluorescence microscopy.
nd = not detected Numbers in brackets show Standard error of mean Table 4. Observed and estimated bacterial diversity in the groundwater samples. Sample ID
Number of sequence reads in analysis
Observed number of OTUs
Estimated species richness Diversity indices
Chao
ACE
Shannon
Simpson
OL-KR13/360-365 m 1220 45 161 412 1.84 1.23 OL-KR6/422-425 m 893 46 294 355 2.51 0.15 OL-KR23/425-460.3 m 9209 35 73 111 0.19 0.94 OL-KR49/532-537 m 18425 63 126 219 0.17 0.95 OL-KR2/596.5-609.5 m 17158 83 161 355 1.46 0.45 OL-KR1/609.4-626.8 m 5377 169 367 587 1.91 0.35 OL-KR29/801-867 m 996 49 104 139 2.02 0.28
Sample ID Cell number (cells ml-1)
qPCR
dsrB copy number mcrA copy number DNA RNA DNA RNA
OL-KR13/360-365 m 4.17x10⁵ 30820 (8604) 141 (149) 8 (3) nd OL-KR6/422-425 m 1x10⁵ 5449 (2225) 116 (70) nd ndOL-KR23/425-460.3 m 2.5x10⁵ 13720 (6518) 292 (181) 54 (27) ndOL-KR49/532-537 m 1.54x10⁴ 15576 (9893) 4 (2) nd ndOL-KR2/596.5-609.5 m 6.9x10⁴ 65 (20) nd 46 (5) ndOL-KR1/609.4-626.8 m 9.1x10⁴ 2216 (288) 20 (9) 25 (5) ndOL-KR29/801-867 m 2.28x10⁴ nd nd nd nd
29
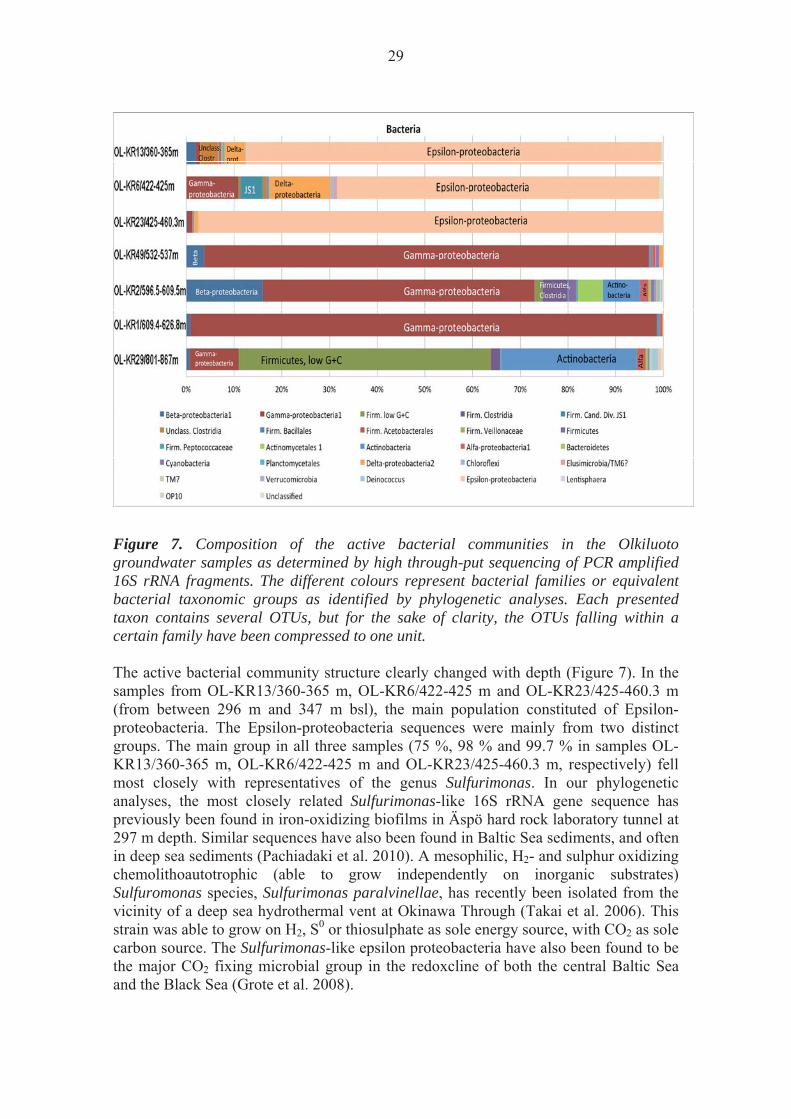
Figure 7. Composition of the active bacterial communities in the Olkiluoto groundwater samples as determined by high through-put sequencing of PCR amplified 16S rRNA fragments. The different colours represent bacterial families or equivalent bacterial taxonomic groups as identified by phylogenetic analyses. Each presented taxon contains several OTUs, but for the sake of clarity, the OTUs falling within a certain family have been compressed to one unit. The active bacterial community structure clearly changed with depth (Figure 7). In the samples from OL-KR13/360-365 m, OL-KR6/422-425 m and OL-KR23/425-460.3 m (from between 296 m and 347 m bsl), the main population constituted of Epsilon-proteobacteria. The Epsilon-proteobacteria sequences were mainly from two distinct groups. The main group in all three samples (75 %, 98 % and 99.7 % in samples OL-KR13/360-365 m, OL-KR6/422-425 m and OL-KR23/425-460.3 m, respectively) fell most closely with representatives of the genus Sulfurimonas. In our phylogenetic analyses, the most closely related Sulfurimonas-like 16S rRNA gene sequence has previously been found in iron-oxidizing biofilms in Äspö hard rock laboratory tunnel at 297 m depth. Similar sequences have also been found in Baltic Sea sediments, and often in deep sea sediments (Pachiadaki et al. 2010). A mesophilic, H2- and sulphur oxidizing chemolithoautotrophic (able to grow independently on inorganic substrates) Sulfuromonas species, Sulfurimonas paralvinellae, has recently been isolated from the vicinity of a deep sea hydrothermal vent at Okinawa Through (Takai et al. 2006). This strain was able to grow on H2, S0 or thiosulphate as sole energy source, with CO2 as sole carbon source. The Sulfurimonas-like epsilon proteobacteria have also been found to be the major CO2 fixing microbial group in the redoxcline of both the central Baltic Sea and the Black Sea (Grote et al. 2008).
30
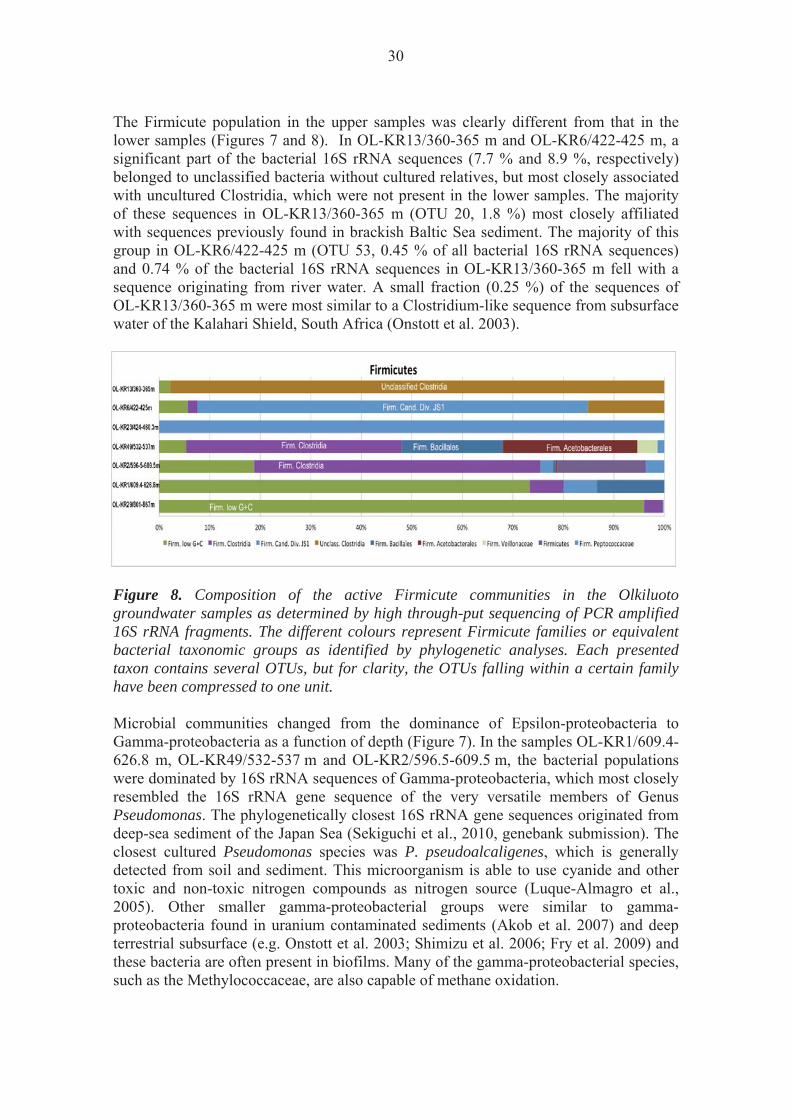
The Firmicute population in the upper samples was clearly different from that in the lower samples (Figures 7 and 8). In OL-KR13/360-365 m and OL-KR6/422-425 m, a significant part of the bacterial 16S rRNA sequences (7.7 % and 8.9 %, respectively) belonged to unclassified bacteria without cultured relatives, but most closely associated with uncultured Clostridia, which were not present in the lower samples. The majority of these sequences in OL-KR13/360-365 m (OTU 20, 1.8 %) most closely affiliated with sequences previously found in brackish Baltic Sea sediment. The majority of this group in OL-KR6/422-425 m (OTU 53, 0.45 % of all bacterial 16S rRNA sequences) and 0.74 % of the bacterial 16S rRNA sequences in OL-KR13/360-365 m fell with a sequence originating from river water. A small fraction (0.25 %) of the sequences of OL-KR13/360-365 m were most similar to a Clostridium-like sequence from subsurface water of the Kalahari Shield, South Africa (Onstott et al. 2003).
Figure 8. Composition of the active Firmicute communities in the Olkiluoto groundwater samples as determined by high through-put sequencing of PCR amplified 16S rRNA fragments. The different colours represent Firmicute families or equivalent bacterial taxonomic groups as identified by phylogenetic analyses. Each presented taxon contains several OTUs, but for clarity, the OTUs falling within a certain family have been compressed to one unit. Microbial communities changed from the dominance of Epsilon-proteobacteria to Gamma-proteobacteria as a function of depth (Figure 7). In the samples OL-KR1/609.4-626.8 m, OL-KR49/532-537 m and OL-KR2/596.5-609.5 m, the bacterial populations were dominated by 16S rRNA sequences of Gamma-proteobacteria, which most closely resembled the 16S rRNA gene sequence of the very versatile members of Genus Pseudomonas. The phylogenetically closest 16S rRNA gene sequences originated from deep-sea sediment of the Japan Sea (Sekiguchi et al., 2010, genebank submission). The closest cultured Pseudomonas species was P. pseudoalcaligenes, which is generally detected from soil and sediment. This microorganism is able to use cyanide and other toxic and non-toxic nitrogen compounds as nitrogen source (Luque-Almagro et al., 2005). Other smaller gamma-proteobacterial groups were similar to gamma-proteobacteria found in uranium contaminated sediments (Akob et al. 2007) and deep terrestrial subsurface (e.g. Onstott et al. 2003; Shimizu et al. 2006; Fry et al. 2009) and these bacteria are often present in biofilms. Many of the gamma-proteobacterial species, such as the Methylococcaceae, are also capable of methane oxidation.
31
The abundance of beta-proteobacterial 16S rRNA sequences belonging to the Acidovorax increased with depth, from 0.8 % of the total number of bacterial 16S rRNA sequence reads in OL-KR1/609.4-626.8 m to 15.8 % in OL-KR2/596.5-609.5 m. They were absent in the three upper samples and in OL-KR29/801-867 m. Similar sequences have been detected in deep biosphere from 445-470 m below ground surface in an aquifer in Japan (Shimizu et al. 2006), in a carbon leader in ultradeep mines at 3000 m below ground surface (Onstott et al. 2003) and associated with and actively metabolizing in 150 Ma old lignite (coal) deposits in basement rock (Fry et al. 2009). The bacterial community in the deepest sample, OL-KR29/801-867 m, was clearly different from that of the other six samples. More than 52.8 % of the bacterial 16S rRNA sequence found belonged to low G+C Firmicutes-bacteria. Of these sequences, 80 % fell into a specific group (OTU4) of low G+C Firmicutes with the closest known related sequence belonging to Staphylococcus aureus and different Enterococcus-species (OTU57). These are most commonly part of the normal flora on skin and in the intestines. However, low G+C Firmicutes in the sample OL-KR2/596.5-609.5 m, 16S rRNA sequences were also found to some extent, which were most similar to sequences obtained from the Kalahari Shield subsurface, South Africa. The second largest group of bacterial 16S rRNA sequences in this sample were closely related to Micrococcus luteus, a bacterium belonging to the Phylum Actinomycetales. These bacteria are commonly found in soil, water, air and dust, and as part of the microbial communities normally found on human skin. The known Micrococcus-species are obligately aerobic bacteria, which live chemoheterotrophically by extra-cellular digestion involved in the processing of dead or decayed organic matter. However, they have also been found in extreme environments and to survive for at least 170 000 years embedded in amber (Greenblatt et al. 2004). Micrococcus-like sequences were also present in OL-KR2/596.5-609.5 m and constituted more than half (7.78 % of the total bacterial 16S rRNA sequences in the sample) of the detected Actinomycetales sequences in that sample. The remaining Actinomycetales-like sequences (5.2 % of the total number) belonged to a different group of actinomycetes most closely related to the Microbacteria. The cell-size of these bacteria is only 0.5 μm in length. Bacterial 16S rRNA gene sequences resembling the Microbacteria have been found in different freshwater habitats (Hahn et al. 2003) and even to have survived in glacier ice for tens of thousands of years (Christner et al. 2000). Delta-proteobacteria constituted 4 % and 12.75 % of the bacterial 16S rRNA sequences obtained from samples OL-KR13/360-365 m and OL-KR6/422-425 m, respectively, but below 1 % of the bacterial 16S rRNA sequences in the other samples (Figure 7). The most abundant bacterial 16S sequence in samples OL-KR13/360-365 m and OL-KR6/422-425 m belonged to Desulfobulbaceae-like delta-proteobacteria, which constituted more than half and almost all delta-proteobacteial 16S rRNA sequences in samples OL-KR6/422-425 m and OL-KR13/360-365 m, respectively. In OL-KR23/425-460.3 m, the delta-proteobacteria only constituted 0.8 % of all bacterial 16S rRNA gene sequences, and the majority of these sequences belonged to uncultured Syntrophaceae-like delta-proteobacteria detected in tar-contaminated aquifer sediments (Winderl et al. 2008) and in methane seeps of the North Sea (Wegener et al. 2008). These were also

32
present as a minority (0.06 % of all bacterial 16S rRNA sequences) in OL-KR1/609.4-626.8 m. OL-KR1/609.4-626.8 m had 0.16 % delta-proteobacterial 16S rRNA sequences. The majority of the delta-proteobacteria in OL-KR49/532-537 m (0.82 % of the total 16S rRNA sequences) belonged to Desulfovibrio-like delta-proteobacteria, which have been found in sediment, where the anoxic degradation of long chain alkanes was coupled to the formation of methane (Zengler et al. 1999). Related delta-proteobacteria (OTU 35) detected in natural gas storage at a depth of 800 m and in Baltic Sea sediment were found in OL-KR1/609.4-626.8 m, OL-KR49/532-537 m and OL-KR2/596.5-609.5 m, but only as a minority of the sequences (0.02 %, 0.08 % and 0.1 %, respectively). Delta-proteobacterial 16S rRNA sequences were present only at 0.16 %, 0.82 % and 0.13 % in OL-KR1/609.4-626.8 m, OL-KR49/532-537 m and OL-KR2/596.5-609.5 m, respectively. Although the relative amount of proteobacterial 16S rRNA sequences decreased in the deeper samples, the alfa-proteobacterial fraction increased from 0.1 % in the upper samples (except OL-KR13/360-365 m, which had 0.57 %) to 1.9 % in OL-KR29/801-867 m. Caulobacter sp. related sequences were one of the major groups of alfa-proteobacteria present in the samples (OTU 17, 0.25 %, 0.15 %, 0.16 %, 0.72 % and 0.3 % in samples OL-KR13/360-365 m, OL-KR23/425-460.3 m, OL-KR1/609.4-626.8 m, OL-KR2/596.5-609.5 m and OL-KR29/801-867 m, respectively). However, in OL-KR49/532-537 m, the most common alfa-proteobacterial sequence was most similar to Maize chloroplast 16S rRNA sequences (OTU 14, 0.34 % of the sequences). This particular sequence was not present in any other sample, but two other sequences (OTU 91 and OTU 275, 0.017 % and 0.005 %, respectively) were found in OL-KR49/532-537 m, and one closely related sequence (OTU 90, 0.2 % of the sequences) also in OL-KR29/801-867 m. The most prominent alfa-proteobacteria in OL-KR29/801-867 m (OTU 32, 0.7 %) and one of the most common in OL-KR1/609.4-626.8 m (0.18 %), OL-KR49/532-537 m (0.15 %) and OL-KR2/596.5-609.5 m (0.48 %) belonged to Sphingomonas bacteria isolated from drinking water. The common features for these bacteria are that the known species are commonly aerobic and heterotrophic, i.e. able to utilize a broad range of carbon substrates. However, these types of bacteria have recently been found in deep anaerobic biospheres (Onstott et al. 2003; Shimizu et al. 2006; Fry et al. 2009). Clostridia were most prominent in sample OL-KR2/596.5-609.5 m, where they contributed with more than 5 % of the total active bacterial community (Figures 7 and 8). Similar Clostridia have previously been found in terrestrial unconsolidated sediment from the Waikato Basin, New Zealand, in a rock core from 135 m depth (Fry et al. 2009). The microorganisms in the rock core at this depth were seen to be mostly actively metabolizing. Active sulphate reduction was detected, and the microbial communities were found to utilize lignite (coal) for growth. Similar sequences have also been detected in different aquatic environments, such as the sediment of the Baltic Sea and on the roots of marine water plants, as well as in deep subsurface environments. No closely related cultured relative is known. Low numbers of these Clostridia-like sequences were also obtained from the other samples, but in much lower abundances. A considerable part of the bacterial 16S rRNA sequences obtained from OL-KR13/360-365 m (5.55 %) belonged to Candidate division JS1 (Firmicutes). These bacteria are
33
often abundant in marine deep biosphere (Webster et al. 2006; 2007; Inagaki et al. 2003), but are usually absent in terrestrial deep biospheres (Fry et al. 2009). Candidate division JS1 has no cultured species thus far, and was first found in deep sediments of the Japan Sea (JS) (Rochelle et al. 1994). They have lately been found in a number of other anoxic sedimentary environments, such as methane hydrate bearing sediments (Reed et al. 2002; 2006), marine and terrestrial thermal subsurface environments (Alain et al. 2006; Niemann et al. 2006; Teske et al. 2002), and in brackish sediments (Webster et al. 2004). It has been shown by Stable Isotope Probing (SIP) that JS1 bacteria in marine sediments utilize acetate and glucose (Webster et al. 2006), and that they occur in anaerobic sediments with elevated TOC and DOC, but that sulphate does not appear to be crucial for the occurrence of JS1 bacteria. Candidate Division JS1 bacteria usually prefer muddy, shallow, subsurface sediments with reduced sulphate. In shallow, sandy subsurface sediments Chloroflexi may out-compete JS1. Deinococcus-like sequences were present in the deepest sample OL-KR29/801-867 m (1.4 %). Deinococci are known to be extremely resistant to ionizing radiation and to be able to oxidize nuclear waste and other toxic materials. They survive desiccation in desert soils and the vacuum of space and are able to withstand extremes of heat and cold as well as acid. The known Deinococci are chemoorganotrophic, using a variety of high-molecular weight organic substances for growth. 3.3 Archaeal diversity
The high through-put RNA based pyro-tag sequencing revealed altogether 82 archaeal 16S rRNA OTUs belonging to 6 archaeal families or taxonomic groups (Figure 9). The sequence analyses demonstrated that the archaeal diversity was highest in samples recovered at vertical depths from 296 to 415 m, samples OL-KR13/360-365 m, OL-KR23/425-460.3 m, OL-KR49/532-537 m. In these samples the number of observed archaeal OTUs ranged from 26 in OL-KR23/425-460.3 m to 41 in OL-KR49/532-537 m (Table 4). The highest species richness was estimated in OL-KR13/360-365m where the sequence data covered on average only 30 % of the whole archaeal diversity estimated in that sample. Also in OL-KR49/532-537 m the observed 41 archaeal OTUs were estimated to represent only half of the total diversity present in the samples. In OL-KR2/596.5-609.5 m and OL-KR1/609.4-626.8 m that were between the vertical depths of 559-572 m bsl, the number of observed archaeal groups decreased to 18 and the sequence data recovered 58 to 83 % of the total archaeal diversity. The smallest amount of different archaeal OTUs was observed at the depth of 798 m bsl m in borehole OL-KR29/801-867 m. In this sample the whole archaeal diversity was represented among the obtained sequence reads revealing that only four different archaeal groups formed the active archaeal community in OL-KR29/801-867 m. The only exception to this change in the number of observed OTUs with increasing sampling depth was observed in sample OL-KR6/422-425 m where only 13 different archaeal groups were observed. In this sample, however, the high through-put sequencing produced only 250 good quality sequence reads which most likely explains the difference to other shallow samples. Although the samples recovered between 296 and 415 m bsl harbored increased archaeal diversity in comparison to deeper samples, the archaeal species richness, the
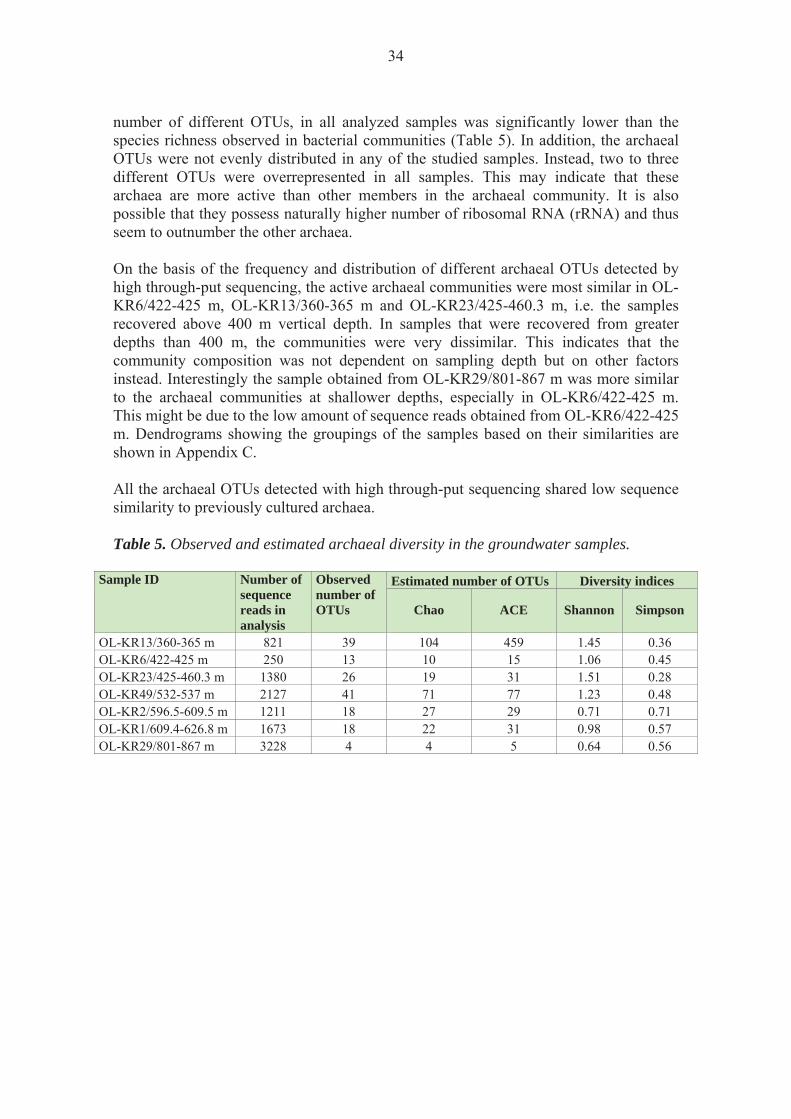
34
number of different OTUs, in all analyzed samples was significantly lower than the species richness observed in bacterial communities (Table 5). In addition, the archaeal OTUs were not evenly distributed in any of the studied samples. Instead, two to three different OTUs were overrepresented in all samples. This may indicate that these archaea are more active than other members in the archaeal community. It is also possible that they possess naturally higher number of ribosomal RNA (rRNA) and thus seem to outnumber the other archaea. On the basis of the frequency and distribution of different archaeal OTUs detected by high through-put sequencing, the active archaeal communities were most similar in OL-KR6/422-425 m, OL-KR13/360-365 m and OL-KR23/425-460.3 m, i.e. the samples recovered above 400 m vertical depth. In samples that were recovered from greater depths than 400 m, the communities were very dissimilar. This indicates that the community composition was not dependent on sampling depth but on other factors instead. Interestingly the sample obtained from OL-KR29/801-867 m was more similar to the archaeal communities at shallower depths, especially in OL-KR6/422-425 m. This might be due to the low amount of sequence reads obtained from OL-KR6/422-425 m. Dendrograms showing the groupings of the samples based on their similarities are shown in Appendix C. All the archaeal OTUs detected with high through-put sequencing shared low sequence similarity to previously cultured archaea. Table 5. Observed and estimated archaeal diversity in the groundwater samples.
Sample ID
Number of sequence reads in analysis
Observed number of OTUs
Estimated number of OTUs Diversity indices
Chao
ACE
Shannon
Simpson
OL-KR13/360-365 m 821 39 104 459 1.45 0.36 OL-KR6/422-425 m 250 13 10 15 1.06 0.45 OL-KR23/425-460.3 m 1380 26 19 31 1.51 0.28 OL-KR49/532-537 m 2127 41 71 77 1.23 0.48 OL-KR2/596.5-609.5 m 1211 18 27 29 0.71 0.71 OL-KR1/609.4-626.8 m 1673 18 22 31 0.98 0.57 OL-KR29/801-867 m 3228 4 4 5 0.64 0.56

35
Figure 9. Composition of active archaeal communities in the Olkiluoto groundwater samples as determined with high throug-put pyrosequencing of 16S rRNA fragments. The numbers represent different OTUs. Each OTU is a group of 16S rRNA sequence reads that share over 90 % sequence similarity. Only OTUs that represent more than 1 % of the sequence reads are presented. The most prominent archaeal OTU that was detected in all analyzed groundwater samples grouped closely with archaeal 16S rRNA genes detected in deep marine sediments and terrestrial subsurface, including a storage zone for liquid radioactive waste (Thermoplasmatales OTU 1, Figure 9). Highly similar 16S rRNA gene fragment was also previously reported from Olkiluoto in borehole OL-KR13/360-365 m at depth of 297 m bsl by Pedersen and coworkers. All of these uncultured archaea are only distantly related to any cultured representatives but, when compared to cultured archaea, they group together with Thermoplasma and Aciduliprofundum species. Both Thermoplasma and Aciduliprofundum species are generally found in thermal and acidic environments. Thermoplasma species are heterotrophs that in absence of oxygen can obtain energy from reduction of elemental sulphur. Aciduliprofundum boonei was isolated from deep hydro-thermal vent under sulphur reducing and heterotrophic conditions. Although present in all samples, this archaeal OTU was most active in OL-KR1/609.4-626.8 m. Some OTUs were detected in most of the analyzed samples but were missing in one of them. Archaea that shared highest sequence similarity to uncultured archaea in marine sediments and sulfidic spring were mostly detected in OL-KR23/425-460.3 m but were also present in small numbers in other samples except in OL-KR2/596.5-609.5 m or

36
OL-KR49/532-537 m (Methanosarcinales OTUs 7 and 9, Figure 9) whereas archaea similar to uncultured archaea in oil-degrading methane producing microcosm were found in all samples except in OL-KR29/801-867 m (OTU 15, Figure 9). The OTUs that were observed in all analyzed samples were, however, not very common in the data set. Instead, most of the archaeal OTUs detected by high through-put sequencing were specifically associated with certain boreholes or similar sampling depths in different boreholes. In OL-KR13/360-365 m, where diversity indices estimated highest archaeal diversity, the archaeal sequence reads were dominated by two different OTUs (OTUs 2 and 5 in Figure 9). One of these OTUs (OTU 2 in Figure 9) was most similar to archaeal 16S rRNA gene sequences associated with anaerobic methane oxidation and sulphate-methane transition zones and gas hydrates in marine sediments. This OTU was also found in all other samples except in OL-KR49/532-537 m but it dominated the archaeal community only in the other shallow samples OL-KR6/422-425 m and OL-KR23/425-460.3 m as well as in the deepest sample OL-KR29/801-867 m. The other OTU (OTU 5 in Figure 9) that was detected in OL-KR13/360-365 m was also detected in OL-KR23/425-460.3 m and OL-KR6/422-425 m but not in deeper samples. In OL-KR23/425-460.3 m it was present in increased numbers. This OTU grouped with uncultured archaea detected in thermal or saline marine sediments as well as with archaea that have been shown to live in association with sulphur cycling bacteria. Other OTUs that were present only in OL-KR13/360-365 m were related to uncultured archaea in different types of sediments (also methanogenesis) (OTU 12) as well as in river sediment (sequences published in NCBI, e.g. accession number HM159360) and mud volcano (Omoregie et al. 2009) (OTU 18). In OL-KR6/422-425 m the sample-specific archaea were most similar to uncultured archaea in diverse environments ranging from hypersaline microbial mats to hydrothermal marine sediment (OTUs 29 and 35). In OL-KR23/425-460.3 m, the OTU only found in this sample was similar to OTU 5 in OL-KR49/532-537 m (OTU 17). In comparison to other samples recovered above 500 m bsl, OL-KR49/532-537 m showed significantly different archaeal composition. Neither of the OTUs that were predominant in other samples was detected in OL-KR49/532-537 m. In contrast, over 60 % of the sequence reads obtained from this sample fell in the OTU 4 (Figure 9). This OTU was closely similar to OTU 2 that was detected in the shallower samples, and also grouped in the same cluster with the thermophilic cultivated archaea and uncultivated archaea from marine sediments characterized by sulphate-methane transition zones and gas hydrates. OTU 4 was detected in low amounts also at 600 m depth but in none of the other samples. Other OTUs that were specifically associated with OL-KR49/532-537 m (and OL-KR2/596.5-609.5 m) grouped with uncultured archaea detected in low-temperature biodegraded oil reservoir and deep subsurface water (OTU 6), cultured thermoacidophilic archaea (OTU 8) and uncultured archaea in thermal or saline marine sediments (OTU 11). Archaea that clustered with Methanobacterium species were detected in only two samples, OL-KR2/596.5-609.5 m and OL-KR1/609.4-626.8 m. In OL-KR2/596.5-609.5 m this Methanobacterium-related archaeon dominated the archaeal community representing over 80 % of the sequence reads. Methanobacteria are archaea that produce methane from hydrogen and CO2. However, as the sequence similarity to any cultured

37
or uncultured Methanobacterial sequences was low it is possible that the archaea in OTU 1 may posses other types of metabolism. The same methanogenic OTU as well as another OTU sharing highest similarity to H2 and CO2 utilizing methanogenic archaeon were detected also in OL-KR1/609.4-626.8 m. However, both of these Methanobacterium-related OTUs were present at low densities whereas more than 70 % of the obtained sequence reads grouped to OTU 1 associated with deep marine sediments and terrestrial subsurface. The least diverse archaeal community was observed in OL-KR29/801-867 m where the community was dominated by only two OTUs (OTUs 1 and 2 in Figure 9). OTU 1 was detected in similar proportions as in all other analyzed samples except in OL-KR1/609.4-626.8 m where it dominated the community. OTU 2, on the other hand, was detected in similarly increased amounts only in samples that were recovered above 400 m vertical depth. And even in these samples the sequence coverage did not increase to 65 % as in OL-KR29/801-867 m. 3.4 Sulphate reducing bacteria
The presence of all sulphate reducing bacteria (SRB) in the samples were determined by DNA based dsrB gene (gene involved in sulphate reduction) targeted qPCR. The highest amount of SRB was detected in the samples recovered above vertical depth of 500 m. In these samples the amount of dsrB gene copies ranged from 103 gene copies mL-1 in OL-KR6/422-425 m to 104 gene copies mL-1 in OL-KR13/360-365 m, OL-KR23/425-460.3 m and OL-KR49/532-537 m. A significant amount of SRB, 2 × 10³ dsrB gene copies mL-1, was also detected in OL-KR1/609.4-626.8 m. In OL-KR2/596.5-609.5 m less than a hundred SRB were detected mL-1 sample water and in OL-KR29/801-867 m, no dsrB genes were detected. The absence of SRB in the deep saline water (OL-KR29/801-867 m) was in good agreement with geochemical measurements according to which sulphate, an essential electron acceptor for SRB during sulphate reduction, has not previously been detected in this fracture. The organic carbon content is also low and thus does not support fermentative growth of SRB. In order to determine the level of active transcription of dsrB genes in the microbial communities of the boreholes, qPCR analysis was performed, which targeted the mRNA transcripts of the dsrB genes. The results indicate that the genes involved in sulphate reduction were being actively used and sulphate reduction is most likely an active microbial process in the studied fracture waters. However, when comparing qPCR based on DNA to demonstrate the whole microbial community the amount of dsrB transcripts was one to two orders of magnitude lower than the amount of dsrB gene copies in all the samples where SRB were detected. This may indicate that, although SRBs are present in the deep groundwater, the prevailing environmental conditions (i.e. low dissolved organic carbon concentration or low amount of essential nutrients), limit the process. It is known that fermenting SRB constitutively express their dsrAB genes (Neretin et al. 2003), even though they would not be reducing sulphate, which may account for the low amount of drsB transcripts found in comparison to the drsB gene copies. However, when a process, e.g. sulphate reduction, is steadily ongoing and a sufficient amount of the functional enzymes have been produced, the microorganisms might not have the need to express the genes for this
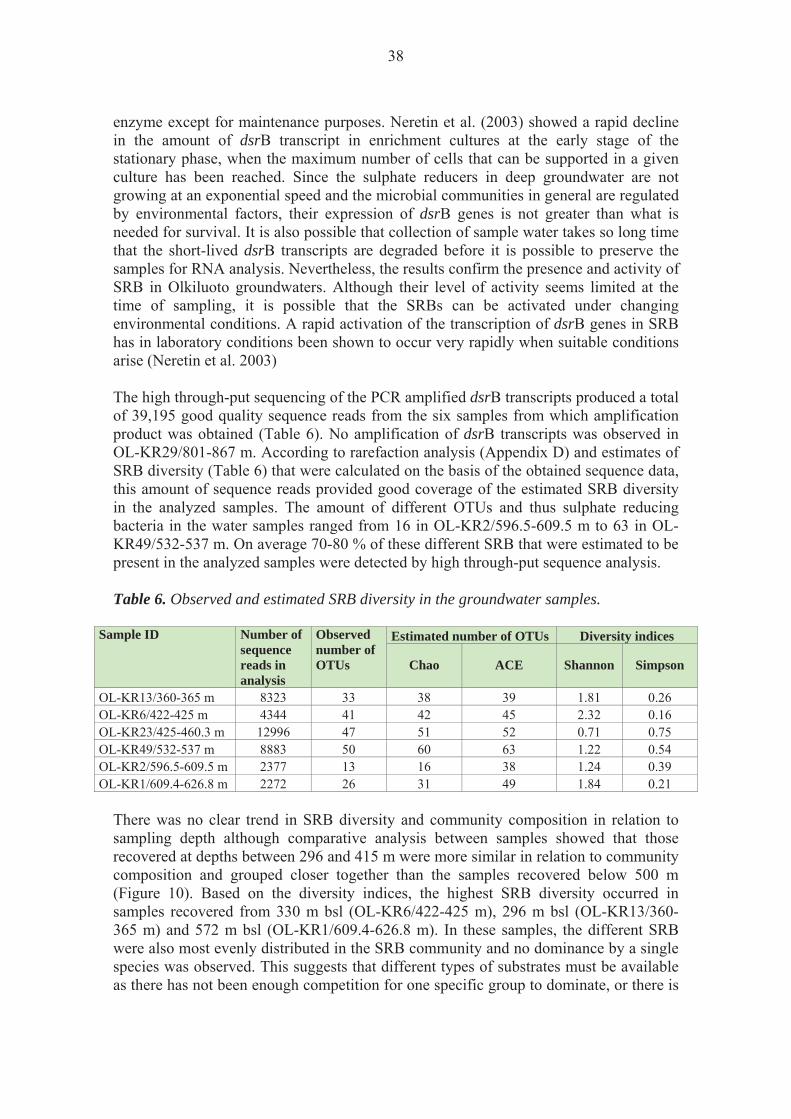
38
enzyme except for maintenance purposes. Neretin et al. (2003) showed a rapid decline in the amount of dsrB transcript in enrichment cultures at the early stage of the stationary phase, when the maximum number of cells that can be supported in a given culture has been reached. Since the sulphate reducers in deep groundwater are not growing at an exponential speed and the microbial communities in general are regulated by environmental factors, their expression of dsrB genes is not greater than what is needed for survival. It is also possible that collection of sample water takes so long time that the short-lived dsrB transcripts are degraded before it is possible to preserve the samples for RNA analysis. Nevertheless, the results confirm the presence and activity of SRB in Olkiluoto groundwaters. Although their level of activity seems limited at the time of sampling, it is possible that the SRBs can be activated under changing environmental conditions. A rapid activation of the transcription of dsrB genes in SRB has in laboratory conditions been shown to occur very rapidly when suitable conditions arise (Neretin et al. 2003) The high through-put sequencing of the PCR amplified dsrB transcripts produced a total of 39,195 good quality sequence reads from the six samples from which amplification product was obtained (Table 6). No amplification of dsrB transcripts was observed in OL-KR29/801-867 m. According to rarefaction analysis (Appendix D) and estimates of SRB diversity (Table 6) that were calculated on the basis of the obtained sequence data, this amount of sequence reads provided good coverage of the estimated SRB diversity in the analyzed samples. The amount of different OTUs and thus sulphate reducing bacteria in the water samples ranged from 16 in OL-KR2/596.5-609.5 m to 63 in OL-KR49/532-537 m. On average 70-80 % of these different SRB that were estimated to be present in the analyzed samples were detected by high through-put sequence analysis. Table 6. Observed and estimated SRB diversity in the groundwater samples.
Sample ID
Number of sequence reads in analysis
Observed number of OTUs
Estimated number of OTUs Diversity indices
Chao
ACE
Shannon
Simpson
OL-KR13/360-365 m 8323 33 38 39 1.81 0.26 OL-KR6/422-425 m 4344 41 42 45 2.32 0.16 OL-KR23/425-460.3 m 12996 47 51 52 0.71 0.75 OL-KR49/532-537 m 8883 50 60 63 1.22 0.54 OL-KR2/596.5-609.5 m 2377 13 16 38 1.24 0.39 OL-KR1/609.4-626.8 m 2272 26 31 49 1.84 0.21
There was no clear trend in SRB diversity and community composition in relation to sampling depth although comparative analysis between samples showed that those recovered at depths between 296 and 415 m were more similar in relation to community composition and grouped closer together than the samples recovered below 500 m (Figure 10). Based on the diversity indices, the highest SRB diversity occurred in samples recovered from 330 m bsl (OL-KR6/422-425 m), 296 m bsl (OL-KR13/360-365 m) and 572 m bsl (OL-KR1/609.4-626.8 m). In these samples, the different SRB were also most evenly distributed in the SRB community and no dominance by a single species was observed. This suggests that different types of substrates must be available as there has not been enough competition for one specific group to dominate, or there is

39
no excess of specific substrate that would allow dominance of any specific group of SRB. The lowest estimated diversity, in contrast, was observed in samples recovered from 425 m bsl (OL-KR23/425-460.3 m) and 415 m bsl (OL-KR49/532-537 m). In both of these samples the SRB community was dominated by a single OTU that represented over 70 % of the obtained sequence reads. The rest of the SRB community was, however, very different between these two samples. Although the SRB communities in different water samples were rather dissimilar, there were several OTUs that were detected in all or most of the samples from which amplification product was obtained. These common OTUs were generally very abundant and, although detected in all analyzed samples, they were detected in increased numbers only in certain fractures. SRB most related to Desulfobacula species were detected in all samples but were specifically detected in OL-KR13/360-365 m and OL-KR2/596.5-609.5 m where these two different OTU represented 44 % (OTU 2) and 57.5 % of the obtained sequence reads (OTU 8), respectively. In OL-KR6/422-425m, SRB closely related to Desulfotomaculum species and uncultured SRB detected in gold mines and terrestrial subsurface covered 30 % of the obtained sequence reads (OTU 5) where as in other samples this OTU formed less than 1.5 % of the community. In addition, dsrB fragments similar to those found in deep marine sediments increased in abundance in OL-KR6/422-425 m OL-KR6/422-425m (21 %, OTU 4, belonging to delta-proteobacterial genus Desulfosarcina) in comparison to 5 % in OL-KR13/360-365 m and less than 1 % in rest of the samples. There were also SRB that were associated with specific sampling depths. SRB that were distantly similar to uncultured SRB described in paddy soil were only detected in samples recovered above the depth of 400 m bsl, with the highest abundance, 11 %, observed in OL-KR6/422-425 m (OTU 12, belonging to delta-proteobacterial genus Desulfatibacillus). Paddy soils are found at flooded rice fields where large quantities of methane is produced under anaerobic conditions (Liu et al. 2009). Other SRB that increased in abundance when sampling fractures above 400 m bsl were related to uncultured SRB found in groundwater from oil fields and uranium mill tailings site (OTU 14, delta-proteobacterial genera Desulfobulbus/Desulfovibrio). Similar, but not the same, SRBs were detected in increased abundance (3.7 to 9.4 %) also in OL-KR6/422-425 m and OL-KR1/609.4-626.8 m (OTUs 15, 16 and 17, belonging to delta-proteobacterial genus Desulfobulbus). At 347-415 m bsl (OL-KR23/425-460.3 m and OL-KR49/532-537 m) SRB lineages were detected that were similar to SRB found in methane-oxidizing and sulphate-reducing microbial community in Norwegian marine sediment (Lazar et al. 2011). In the Olkiluoto samples from 347-415 m bsl they dominated the community with over 70 % sequence coverage (OTU 1, Firmicute genus Desulfotomaculum). Similar, but not the same, SRB were also detected in OL-KR1/609.4-626.8 m (28 %, OTU 7, delta-proteobacterial genus Desulfatiferula). In OL-KR49/532-537 m, SRB grouping with uncultured SRB in anaerobic sludge and paddy soil were also detected (OTU 13, delta-proteobacterial genus Desulfurivibrio). An OTU grouping with uncultured SRB from deep marine sediments was detected at 572 m bsl (OTU 6, delta-proteobacterial genus Desulfurivibrio). At the same depth also OTU related to delta-proteobacterial genus Desulfofaba species and uncultured SRB in polluted water and marine aquaculture biofilter formed 14-23 % of the communities (OTU 9).

40
Some of the OTUs were detected in one sample only. In OL-KR13/360-365 m, an OTU most closely related to uncultured SRB in deep sea marine sediments represented 19 % of the obtained sequence reads (OTU 3, delta-proteobacterial genus Desulfobulbus). Other OL-KR13/360-365 m specific OTUs included dsrB fragments that grouped to the same cluster with Thermodesulfovibrio species (Class Nirospira) and uncultured SRB in paddy soil (OTU 11, delta-proteobacterial genus Desulfobulbus) or Desulfotalea (delta-proteobacteria) species and uncultured SRB in leachate polluted aquifers (OTU 22). In OL-KR23/425-460.3 m, an OTU most similar to uncultured SRB in polluted water and marine aquaculture biofilter formed 3 % of the sequence reads (OTU 10, delta-proteobacterial genus Desulfobacterium). In OL-KR49/532-537 m, the sample specific OTUs were most similar to uncultured SRB in mudflat and marine sediment (OTU 20, delta-proteobacterial genus Desulfobacterium), in soil and polluted groundwater (OTU 21, delta-proteobacterial genus Desulfobulbus) and in leachate-polluted aquifer (OTU 25), all of these are environments where organic carbon is available. In OL-KR1/609.4-626.8 m, an OTU similar to uranium mill or paddy soil (3.7 %, OTU 19, delta-proteobacterial genus Desulfobotulus).
Figure 10. Composition of active SRB communities in the Olkiluoto groundwater
samples as determined with high through-put sequencing of PCR amplified dsrB fragments. The numbers represent different OTUs. Each OTU is a group of dsrB sequence reads that share over 90 % sequence similarity. Only OTUs that represent more than 1 % of the sequence reads are presented. SRBs were not detected in OL-KR29/801-867m.

41
Table 7. The number of dsrB and mcrA gene copies (DNA) and transcripts (cDNA) ml-1 groundwater.
Sample drsB mcrA DNA cDNA DNA cDNA OL-KR13/360-365 m 30820 (8604)* 141 (149) 7.5 (2.5) 0 (0) OL-KR6/422-425 m 5449 (2225) 116 (70) 0 (0) 0 (0) OL-KR23/425-460.3 m 13720 (6518) 292 (181) 54 (27) 0 (0) OL-KR49/532-537 m 15576 (9893) 3.7 (1.6) 0 (0) 0 (0) OL-KR2/596.5-609.5 m 65 (20) 0 (0) 45.8 (5.2) 0 (0) OL-KR1/609.4-626.8 m 2216 (288) 20 (9) 25 (4.8) 0 (0) OL-KR13/360-365 m 0 (0) 0 (0) 0 (0) 0 (0)
* numbers in parenthesis describe standard error of mean. 3.5 Methanogens
The number of methanogens in the groundwater samples was low. Methanogens were detected by mcrA gene targeted qPCR in four of the seven samples, OL-KR13/360-365 m, OL-KR23/425-460.3 m, OL-KR2/596.5-609.5 m and OL-KR1/609.4-626.8 m (Table 7). The lowest number (7.5 methanogens mL-1) was detected in the OL-KR13/360-365 m, and an order of magnitude higher numbers were detected in the other samples. The number of mcrA transcripts was below the detection limit for the one round qPCR although mcrA transcripts were detected from 4 samples by nested PCR. This may be due to low transcriptional activity of the mcrA gene. It may also be due to the fact that the half life of mcrA transcripts is only approximately 15 min (Hennigan and Reeve 1994), and the transportation of the sample from the sampling depth of several hundred meters is slow. McrA PCR products for pyrosequencing were obtained from the RNA fraction of four of the seven studied Olkiluoto groundwater samples, OL-KR6/422-425 m, OL-KR23/425-460.3 m, OL-KR1/609.4-626.8 m and OL-KR29/801-867 m (Figure 11). The mcrA gene sequences obtained from the mRNA samples belonged to four different phylogenetic groups. The majority of the sequences (>99 %) in all four samples belong to Methanosarcinales, an order of archaea including groups utilizing methylated carbon compounds and acetate. Another group present in all four samples was the Methanobacteriales, which generally consists of CO2-H2 consuming methanogens. In the three uppermost samples, OL-KR6/422-425 m, OL-KR23/425-460.3 m and OL-KR1/609.4-626.8 m two other methanogenic groups were present, Methanomicrobiales and a group without cultured representatives. The Methanomicrobiales methanogens utilize CO2-H2 for their methanogenesis. No substrate utilization patterns are known for the uncultured methanogens detected in the groundwater samples from Olkiluoto. The three last mentioned groups constituted less than 0.5 % of all mcrA gene reads obtained from the studied samples. The high through-put sequencing of the mcrA gene transcripts showed that the methanogenic communities were well covered by the number of sequence reads obtained from each samples. As presented in Table 8, both the obtained and the estimated species richness were in agreement with each other, and no more mcrA sequences would have been likely to be obtained by more extensive sequencing.

42
Table 8. Observed and estimated methanogen diversity in the groundwater samples. Sample ID
Number of sequence reads in analysis
Observed number of OTUs
Estimated number of OTUs Diversity indices
Chao
ACE
Shannon
Simpson
OL-KR13/360-365 m OL-KR6/422-425 m 4188 4 4 5 0.12 0.95 OL-KR23/425-460.3 m 4184 2 2 0 0.36 0.79 OL-KR49/532-537 m OL-KR2/596.5-609.5 m OL-KR1/609.4-626.8 m 6676 2 2 0 0.61 0.58 OL-KR29/801-867 m 2324 1 1 0 0 1
Figure 11. Composition of the active methanogenic communities in the Olkiluoto groundwater samples as determined with high through-put sequencing of PCR amplified mcrA gene transcripts. The colours in the diagram represent different groups of methanogens, blue – Methanosarcionales, red – Methanobacteriales, green – uncultured group, purple – Methanomicrobiales. Each group contains sequences that share at least 97 % sequence similarity. Note the scale. 3.6 Negative controls
The DNA extraction controls showed no amplification when tested by qPCR with both the mcrA and dsrB specific primers. The same was observed for the cDNA of the RNA extraction controls and the RT-PCR reagent controls. 3.7 Geochemistry
Results from geochemical measurements are presented in Appendix A.

43
3.8 The microbial communities in relation to environmental parameters
The composition of the microbial communities changed in relation to sampling depth. According to the hydrogeochemistry of the groundwater, the factor most clearly affecting the bacterial community composition was the salinity, especially the concentration of Na2+, K+, Ca2+ and Cl-. The concentration of these compounds increased considerably with depth (Figure 12, Appendix A).
Figure 12. The concentrations of total dissolved solids (TDS), Sodium (Na+), Calcium (Ca2+), Chloride (Cl-), Potassium (K+) and Magnesium (Mg2+) in the samples studied in this project in relation to depth. The concentration of SO4
2- or carbon did not appear to have a great effect on the general community composition of bacteria. However, the epsilon-proteobacterial Sulfurimonas-like rRNA sequences were only detected in the three uppermost samples, where the concentrations of S2- and SO4
2- were highest.
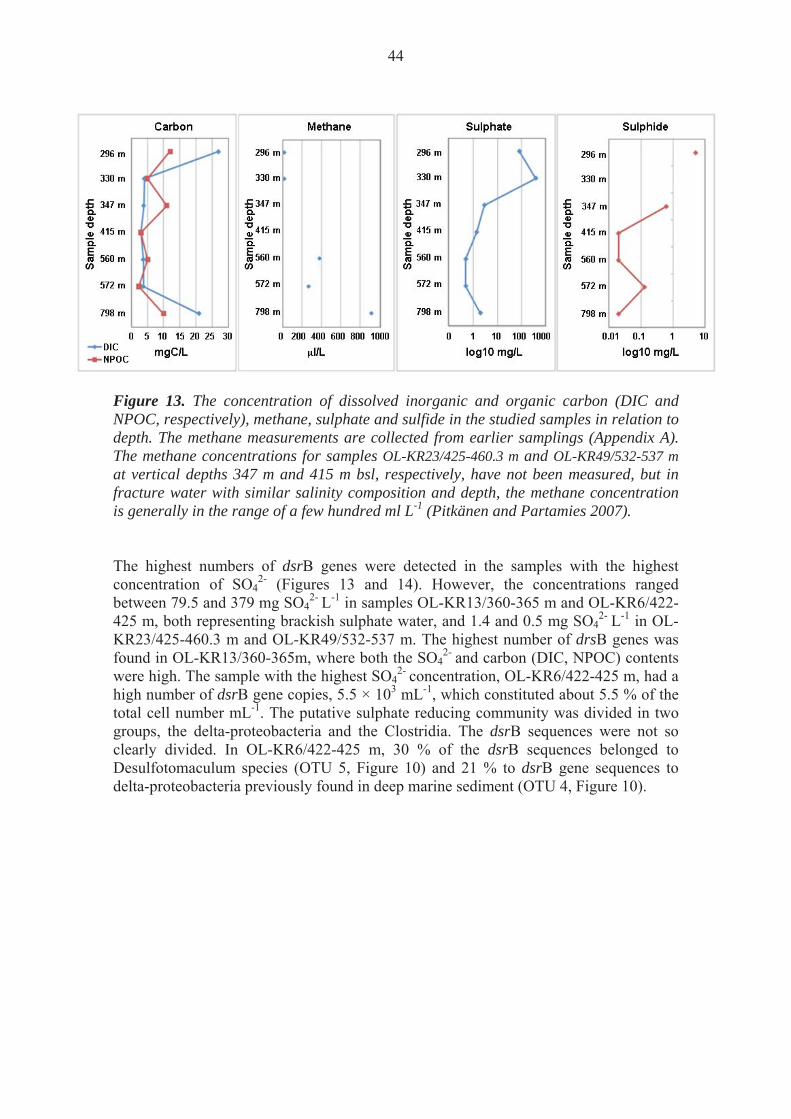
44
Figure 13. The concentration of dissolved inorganic and organic carbon (DIC and
NPOC, respectively), methane, sulphate and sulfide in the studied samples in relation to depth. The methane measurements are collected from earlier samplings (Appendix A). The methane concentrations for samples OL-KR23/425-460.3 m and OL-KR49/532-537 m at vertical depths 347 m and 415 m bsl, respectively, have not been measured, but in fracture water with similar salinity composition and depth, the methane concentration is generally in the range of a few hundred ml L-1 (Pitkänen and Partamies 2007).
The highest numbers of dsrB genes were detected in the samples with the highest concentration of SO4
2- (Figures 13 and 14). However, the concentrations ranged between 79.5 and 379 mg SO4
2- L-1 in samples OL-KR13/360-365 m and OL-KR6/422-425 m, both representing brackish sulphate water, and 1.4 and 0.5 mg SO4
2- L-1 in OL-KR23/425-460.3 m and OL-KR49/532-537 m. The highest number of drsB genes was found in OL-KR13/360-365m, where both the SO4
2- and carbon (DIC, NPOC) contents were high. The sample with the highest SO4
2- concentration, OL-KR6/422-425 m, had a high number of dsrB gene copies, 5.5 × 10³ mL-1, which constituted about 5.5 % of the total cell number mL-1. The putative sulphate reducing community was divided in two groups, the delta-proteobacteria and the Clostridia. The dsrB sequences were not so clearly divided. In OL-KR6/422-425 m, 30 % of the dsrB sequences belonged to Desulfotomaculum species (OTU 5, Figure 10) and 21 % to dsrB gene sequences to delta-proteobacteria previously found in deep marine sediment (OTU 4, Figure 10).

45
Figure 14. The total number of cells (TNC) ml-1 groundwater and the number of dsrB and mcrA gene copies ml-1 groundwater. In sample OL-KR49/532-537 m, most of the bacterial 16S sequences obtained belonged to Gammaproteobacteria, more specifically to the very versatile Genus Pseudomonas. Pseudomonas pseudoalcaligenes was the closest cultured relative, and has been shown to use cyanide and other toxic and non-toxic nitrogen compounds as nitrogen source (Luque-Almagro et al., 2005). As the total number of cells in this sample was approximately 1.54 × 10⁴ ml-1 and the dsrB targeted DNA based qPCR showed that the concentration of dsrB genes in the sample also was around 1.5 × 10⁴ copies ml-1 it is highly likely that this specific OTU is involved in sulphate reduction. The dsrB sequence analyses also showed that one dsrB type (OTU1, Figure 10) dominated the dsrB community, and that this sequence has previously detected in marine sediment, where methane oxidation and sulphate reduction was observed. This dsrB sequence belonged to the genus Desulfofaba (Deltaproteobacteria). It has recently been shown that alao certain groups of non-sulphate reducing bacteria may have the necessary genes and enzymes used in sulphate reduction (e.g. reviewed by Meyer and Kuevert, 2007; Yamamoto and Takai, 2011). However, these microorganisms use this machinery for the reverse sulphate reduction, i.e. sulphide oxidation. Whether the dominating gamma-proteobacteria detected in Olkiluoto groundwater also have this ability is not yet known. The concentration of dissolved inorganic carbon (DIC) in sample OL-KR13/360-365 m is 27 mg C L-1, but in the deeper samples the concentration decreases to 4.1 mg C mL-1 and below. The organic carbon (NPOC) is also highest in OL-KR13/360-365 m (10 mg

46
C L-1, and decreases to between 2 and 5 mg C L-1 in the deeper layers, with exception of OL-KR2/596.5-609.5 m, where the NPOC is high (11 mg C L-1). All archaeal 16S rRNA sequences obtained from the studied samples belonged to euryarchaeotal taxa. The majority of the sequences in most samples belonged to methanogenic archaea, between 67.5 % to over 90 %. Two samples were exceptions, OL-KR49/532-537 m and OL-KR1/609.4-626.8 m, for which the majority of the archaeal 16S rRNA sequences, 87.9 % and 74.6 %, respectively, belonged to the archaeal order Thermoplasmatales. These two samples had the highest concentration of Fe2+, 0.53 and 0.4 mg L-1. Members of the heterotrophic Thermoplasmatales have previously been found in geothermal deep aquifers (Kimura et al. 2005). The greatest part of the 16S rRNA sequences of methanogenic archaea belonged to Methanosarcinales and Methanococcales (genus Methanotorris) archaea. These sequences were in majority on samples OL-KR13/360-365 m, OL-KR6/422-425 m and OL-KR23/425-460.3 m. In OL-KR29/801-867 m the population of methanogens was solely represented by Methanosarcinales. The salinity (TDS) in sample OL-KR29/801-867m was approximatey 5 to 10 fold higher than in the upper samples, which may have an effect on the methanogenic community. The DIC and NPOC concentrations of these samples were high. Methanococcales archaea were present mainly in the three uppermost samples, which had the lowest salinity, but highest sulphate concentrations. Methanococcales archaea are generally found in marine environments, but the one isolated Methanotorris species is hyperthermophilic, and have been found in a shallow submarine hydrothermal vent system (Whitman and Jeanthon 2006). Methanotorris archaea are autotrophic methanogens, which produce methane from H2 and CO2, and reduce sulphur to H2S in the presence of CO2. Although the temperature at the vertical depth of 296 m to 347 m bsl in Olkiluoto is not very high (only between 10 and 12 °C) (Ahokas et al. 2008), the presence of S2- in the water at this depth may be crucial for this species, and explain why it was not detected in the deeper samples. The fact that the salinity drastically increases in the deeper samples may also restrict the distribution of Methanotorris in these samples. Different Methanosarcinales archaea were detected at all depths. Methanosarcinales contain the most halotolerant methanogenic species. Most of the genera within Methanosarcinales are obligately methylotrophic, i.e. utilize only methylated substrates, such as methylamines, and methanol for methanogenesis. This is due to the fact that coping with the salt stress of saline environments is very energy consuming. The energy obtained by hydrolysis of methylated substrates is considerably greater (78.2 – 191.1 kJ mol-1) than that obtained from H2/CO2 (34 kJ mol-1) or acetate (31 kJ mol-1), and is sufficient to manage the excess energy cost caused by increased osmoregulatory processes necessary for the microbial cells to survive in high salt concentrations (Waldron et al. 2007). Methanobacteria was the most common archaeal 16S rRNA sequence obtained from sample OL-KR2/596.5-609.5 m. Methanobacteria are usually not found in saline environments, because they utilize only H2/CO2 for methanogenesis. However, in the

47
deep saline groundwater at Äspö, Methanobacterium subterraneum was the most common methanogen (Kotelnikova and Pedersen 1997). Methanogens were detected by one round mcrA targeted qPCR from the DNA fraction of four samples, OL-KR13/360-365 m, OL-KR23/425-460.3 m, OL-KR2/596.5-609.5 m and OL-KR1/609.4-626.8 m, but not from the RNA fractions. The number of mcrA copies in the samples were always low, only between 0 and <50 copies ml-1. The mcrA tag PCRs from the RNA fractions were, on the other hand, obtained by nested PCR from OL-KR6/422-425 m, OL-KR23/425-460.3 m, OL-KR1/609.4-626.8 m and OL-KR29_T801_1. The RNA transcripts of the genes are very labile, and it has been shown that the half life of mcrA transcripts is very short (Hennigan and Reeve, 1994). Because of the low number of methanogens in the samples, and the lability of the mcrA transcripts, it is likely that the transcripts have been destroyed already while the samples were pumped up from the different depths. The nested PCR was, however, able to detect even these low numbers of mcrA transcript and a good amount of sequence reads were obtained from four of the samples. These four samples all had the highest concentration of Mg2+ (Appendix A). Mg2+ has been shown to especially important for the growth of Methanosarcinales archaea while Methanobacteria were shown to prefer conditions with low concentrations of Mg2+ (Schmidt et al. 1992). The combination of both K+ and Mg2+ has been used in bioreactors to decrease the toxicity of Na2+ on methanogens (Bashir and Matin, 2004). In our experiment, Methanosarcinales archaea comprised the majority of the archaeal 16S rRNA reads in samples were the Mg2+ content was the highest and the Mg2+ concentration was between 4 and 8 times higher than the K+ concentration. In samples were the Mg2+ concentration was 1 to 2.6 times that of the K+ concentration, the archaeal rRNA sequences were dominated by Thermoplasmatales (OL-KR49/532-537 m and OL-KR1/609.4-626.8 m) and Methanobacteria (OL-KR2/596.5-609.5 m). That mcrA transcripts were nevertheless detected in four of the samples may mean that the methanogens in these samples were either more active (i.e. produced more transcripts of the mcrA gene) than in the other samples, or that the RNA in these samples were better protected due to the higher concentration of ions, such as Mg2+ in these samples compares to the others. Mg2+ has been shown to stabilize and protect RNA (Misra and Draper 1998).

48
49
4 CONCLUSIONS
Active microbial communities analyzed by RNA based Tag pyrosequencing (454) showed that the bacterial community composition differed in relation to depth of the groundwater. A total of 25 to 27 different families of bacteria (covered by 375 different OTUs) were detected from the ribosomal RNA obtained from the seven different borehole samples. Between the depths of 296 m and 347 m bsl (OL-KR13/360-365 m, OL-KR6/422-425 m, OL-KR23/425-460.3 m) the bacterial 16S rRNA sequences mainly belonged to epsilon-proteobacteria, most closely related to Sulfurimonas species (Figure 7). These bacteria are autotrophic and may use hydrogen, elemental sulphur or thiosulphate as sole source of energy with CO2 as only carbon source. These bacteria were dominant in the samples with highest concentrations of different sulphur compounds. At depths between 415 m and 572 m bsl (OL-KR49/532-537 m, OL-KR2/596.5-609.5 m, OL-KR1/609.4-626.8 m) the bacterial 16S rRNA fraction mostly belonged to gamma-proteobacteria, which most likely were nitrate reducers. In the deepest sample, at 798 m bsl (OL-KR29/801-867 m), the main 16S rRNA sequence detected belonged to low G+C % gram positive bacteria and Micrococcus like bacteria. A similar division between the samples was seen in the archaeal populations of the same samples. At the depth between 296 m and 347 m bsl (OL-KR13/360-365 m, OL-KR6/422-425 m, OL-KR23/425-460.3 m), three different archaeal groups dominated. One group (OTU 1) belonged to non-methanogenic was distantly related to the Thermoplasmatales, which are heterotrophic and often found in thermal and acidic conditions. The second most common archaeal group in the three uppermost samples (OTU 2, Figure 9) belonged to Methanosarcina-like methanogens, which have been associated with anaerobic methane oxidation. The third most common archaeal group (OTU 5, Figure 9) fell with Methanococcales-like methanogens that are typically found in marine environments and have been shown to live in association with sulphur cycling bacteria. The archaeal OTU 1 was most common in samples OL-KR49/532-537 m and OL-KR1/609.4-626.8 m, while the sample OL-KR2/596.5-609.5 m, which is vertically situated between the former two samples, was dominated by Methanobacteria-like 16S rRNA sequences. The dominating archaea in the deepest sample (OL-KR29/801-867 m) belonged to Methanosarcina. The diversity of SRB investigated by the high through-put sequencing of dsrB transcripts was high and was divided on 27 different OTUs (Figure 10). These OTUs belonged to two different bacterial phyla, the delta-proteobacteria and the Firmicutes. Delta-proteobacterial dsrB transcript sequences dominated in all but two samples. In these samples (OL-KR23/425-460.3 m and OL-KR49/532-537 m) the dsrB transcripts belonged to Desulfotomaculum species (Firmicutes, order Clostridiales). The delta-proteobacterial sulphate reducers in the two uppermost samples, which also had the highest carbon and sulphate concentrations (OL-KR13/360-365 m and OL-KR6/422-425 m) consisted of generally heterotrophic groups (belonging to Desulfomicrobiaceae, Desulfobacteraceae and Desulfobulbaceae), which require organic carbon as electron donors (Rabus et al. 2006; Muyzer and Stams 2008; Dias et al. 2008). Many of the species of these groups also produce acetate or other small molecular weight organic acids, which may be used by other microorganisms in the environment. The Desulfobulbaceae group also contains some species that fix nitrogen. The delta-

50
proteobacterial SRB communities detected in the deeper samples with much lower carbon and sulphate content (OL-KR2/596.5-609.5 m and OL-KR1/609.4-626.8 m) consisted of halotolerant groups of sulphate reducers. In the deepest sample (OL-KR29/801-867 m), which had high concentrations of methane, no dsrB transcripts were detected. The number of dsrB gene copies varied between 0 and 3.0 × 10⁴ mL-1 (Table 7). The number of dsrB gene copies followed the concentration of both carbon and sulphate in the samples, with the highest numbers detected in the samples with the highest concentration of these compounds. The relative abundance of SRB in the microbial communities of the different samples varied from 0 % to 7.4 % of the whole community, but in sample OL-KR49/532-537 m the qPCR analyses showed that up to 100 % of the community had the dsrB gene, which is used for sulphate reduction or sulfide oxidation. Transcripts of mcrA genes, indicating active use of the mcrA genes of methanogens, were detected from four of the seven samples used in the RNA based tag encoded pyrosequencing contained active methanogens (OL-KR6/422-425 m, OL-KR23/425-460.3 m, OL-KR1/609.4-626.8 m, OL-KR29/801-867 m). The methanogens belonged to the same four phylogenetic groups as previously detected in Olkiluoto (Bomberg et al. 2010), but the majority of the sequences (>99 %) in all four samples belong to methylotrophic Methanosarcinales (Figure 11). Methanobacteriales and Methano-microbiales, which utilize CO2-H2, and a group of methanogens without cultured representatives, were detected at very low concentrations, less than 0.5 % of all mcrA gene reads obtained from the studied samples. The methanogenic archaea generally constituted only a small fraction, between 0 and 0.3 % of the total microbial communities in the samples (Table 7). This is close to the detection limit of the qPCR assay and may only be viewed qualitatively. The 16S rRNA targeted pyrosequence data showed clearly that the microbial communities changed with depth, following hydrogeochemical properties of the groundwater. The bacterial communities appeared to be mostly affected by salinity, especially by the concentration of Na2+, K+, Ca2+ and Cl-. The concentration of these compounds increased with depth. The concentration of SO4
2- or carbon did not appear to have a great effect on the general community composition of bacteria, except that the epsilon-proteobacteria dominating at depths between 296 m and 347 m bsl were only detected where the concentrations of S2- and SO4
2- were high. In samples between the depths 415 m and 560 m bsl, putative nitrate reducing and sulfide oxidizing delta-proteobacteria dominated the bacterial communities. The sulphate concentrations in these samples were low, although organic carbon was present, which indicates that the microbial communities would have utilized the sulphate for the oxidation of organic carbon. The archaeal populations were mostly affected by the salinity of the groundwater. In the most dilute samples (between 296 and 346 m bsl), populations consisting of Methanosarcinales and Methanococcales prevailed. As the salinity gradient increased with depth, the archaeal communities changed towards Thermoplasma-like archaea and

51
Methanobacteria to a Methanosarcinales dominated population in the deepest sample. The Methanosarcinales archaea are methylotrophic, i.e. utilize methylated compounds from which sufficient energy is obtained to withstand the stress caused by the salinity. In comparison, the autotrophic Methylococcales methanogens were only detected in the most dilute samples. In Olkiluoto bedrock fracture waters, an active sulphate reducing population, as confirmed by mRNA based 454 pyrosequence analysis, was present at all other depths except in the deepest sample (798 m bsl). Geochemisty data demonstrated that there was an exceptionally high concentration of methane at this depth, which may have consumed the available sulphate in anaerobic processes where methane is oxidized and hence SRB could not be detected. Active SRB populations were most clearly affected by the concentration of sulphate as well as the TDS of the samples. The mRNA based pyrosequencing analysis of methanogens showed that active methanogenic communities were present in four borehole samples. These coincided with the presence of high concentrations of Mg2+. The apparent domination of mcrA gene transcripts belonging to Methanosarcinales may be due to the fact that they can tolerate high salt concentrations because, unlike the methanogens that can utilize only acetate or CO2-H2, the Methanosarcinales archaea obtain the required energy to uphold the osmoregulatory processes needed for the cells to survive the stress caused by increased salinity. Other methanogenic groups were also detected in the 16S rRNA sequencing, but it is also possible that they are not as efficiently methanogenic as the Methanosarcinales in these environments. It is also possible that the mcrA transcripts of these other methanogens did not survive the sample retrieval from the boreholes. As conclusion, a combination of several molecular methods is needed to obtain conclusive answers to the questions raised in risk assessment of the final disposal of nuclear waste. Cultivation and molecular techniques could be combined in the future in order to design experiments to provide better understanding of the bedrock aquifer microbial communities and their functions and interactions with both the biotic and abiotic surroundings. To be able to obtain statistically reliable results, a greater number of samples should be examined with the tools introduced in this report. The results from the seven samples studied here show that the high through-put pyro sequencing is able to provide a great amount of sequence data compared to other methods. This enables us to examine the uncultured microbial communities thoroughly and to even reach microbial groups that are present at only low concentrations in the groundwater. However, these small populations may be of great importance if environmental conditions change. By studying more samples from different and same depths a more reliable and whole picture of the Olkiluoto groundwater microbiology may be obtained. In conclusion 16S rRNA targeted 454 pyrosequencing provided insight into active microbial
communities in the bedrock aquifers of Olkiluoto. Epsilon-proteobacteria dominated at depths between 296 m and 347 m bsl, and Gamma-proteobacteria at 415 m and 560 m depth bsl. The archaeal communities were less diverse than the bacterial
52
ones, and Methanosarcinales dominated in the mRNA based tag pyrosequencing of seven borehole samples.
Microbial community composition varied in different boreholes and the communities changed with depth.
Based on the community composition, the different samples grouped according to similarity of the communities; samples from 296 m and 347 m bsl were more similar between each other than with samples from between 415 m and 572 m bsl, and vice versa. The community composition of the deepest sample (798 m bsl) was clearly different from the others. The highest diversity was detected in OL-KR1/609.4-626.8 m (572 m bsl)
Active sulphate reducing bacteria were detected in all samples, except for the deepest sample at 798 m bsl.
The abundance of active sulphate reducing bacteria was lower than the total sulphate reducing population, indicating the potential for sulphate reduction in changing environmental conditions
Active methanogens were successfully detected in 4 out of 7 samples by mRNA based 454 pyrosequencing.
The diversity of active methanogens by 454 pyrosequencing revealed that the majority of the species belonged to Methanosarcinales.
The abundance of sulphate reducers varied from 0 to 7.4 % in the samples, with the exceptiption of sample OL-KR49/532-537 m, which population based on qPCR nearly completely comprised of bacteria containing the necessary genes for sulphate reduction.
The abundance of methanogens was generally low, and varied from 0 to 0.1 % of the total microbial community based on qPCR,

53
5 FUTURE CONCIDERATIONS
These results show a great diversity of microorganisms in the different aquifers of Olkiluoto. These microorganisms are functionally very diverse. For example, the epsilon-proteobacteria dominating the three uppermost samples of this study may have a great effect on the microbial processes in the groundwater and microbial processes connected to this microbial taxon (hydrogen fixation, sulphur oxidation) are some of the important subjects of future studies. Our results also showed that lineages of methanogens putatively involved in the anaerobic oxidation of methane comprise most of the archaeal communities at many depths. Anaerobic methane oxidation has been shown to enhance sulphate reduction, which may have an impact on the safe storage of the nuclear waste capsules due to the corrosive effects of the produced sulphides. Additionally, elemental cycles including sulphur, iron, nitrogen and carbon, as well as the leaching of minerals and organic compounds from different types of rock and additives used in the repository should be further studied. Due to the small number of samples studied with the presented molecular techniques, the results presented here can only be considered as preliminary. If samples could be obtained from the same depths from different boreholes and several depths from the same borehole, this would provide systematic information of microbial communities in the bedrock aquifers. Future studies should also combine other geobiochemical cycles and pathway analysis based on molecular techniques in order to get a better view of other ongoing deep subsurface processes.

54
55
REFERENCES
Ahokas H, Tammisto E and Lehtimäki T (2008) Baseline Head in Olkiluoto. Eurajoki, Finland: Posiva Oy. 191 p. Working Report 2008-69. Akob DM, Heath J. Mills and Kostka JE (2007) Metabolically active microbial communities in uranium contaminated subsurface sediments. FEMS Microbiol Ecol 59: 95–107. Alain K, Holler T, Musat F, Elvert M, Treude T and Krüger M (2006) Microbiological investigations of methane- and hydrocarbon- discharging mud volcanoes in the Carpathian Mountains, Romania. Environ Microbiol 8: 574–590. Baker BJ, Moser DP, MacGregor BJ, Fishbain S, Wagner M, Fry NK, Jackson B, Speolstra N, Loos S, Takai K, Sherwood-Lollar B, Fredrickson J, Balkwill D, Onstott TC, Wimpee CF and Stahl DA (2003) Related assemblages of sulphate-reducing bacteria associated with ultradeep gold mines of South Africa and deep basalt aquifers of Washington State. Environ Microbiol 5: 267–277. Bano N, Ruffin S, Ransom B, Hollibaugh JT (2004) Phylogenetic composition of Arctic ocean archaeal assemblages and comparison with Antarctic assemblages. Appl Environ Microbiol 70: 781-789. Barns SM, Fundyga RE, Jeffries MW, Pace NR (1994) Remarkable archaeal diversity detected in Yellowstone National Park hot spring environment. Proc. Natl. Acad. Sci. USA 91: 1609–1613. Basharat BH and Martin A (2004) Combined effect of Potassium and Magnesium on Soduim toxicity in anaerobic treatment processes, Electron. J. Environ. Agric. Food Chem. 4: 827-834. Beal EJ, House CH and Orphan VJ (2009) Manganese- and Iron-Dependent Marine Methane Oxidation. Science 325: 184-187. Bomberg M (2008) Archaea in the mycorrhizospheres of boreal forest trees. Dissertationes bioscientiarum molecularium Universitatis Helsingiensis in Viikki. Yliopistopaino, Helsinki. Bomberg M, Nyyssönen M, and Itävaara M (2010) Quantitation and identification of methanogens and sulphate reducers in olkiluoto groundwater. Posiva Working Report 2010-59. Brochier-Armanet C, Boussau B, Gribaldo S, Forterre P (2008). Mesophilic crenarchaeota: proposal for a third archaeal phylum, the Thaumarchaeota. Nat Rev Microbiol 6: 245-252.
56
Christner BC, Mosley-Thompson E, Thompson LG, Zagorodnov V, Sandman K. and Reeve JN. (2000) Recovery and Identification of Viable Bacteria Immured in Glacial Ice. Icarus 144: 479–485. Cummings DE, March AW, Bostick B, Spring S, Caccavo F, JR., Fendorf S and Rosenzweig RF (2000) Evidence for Microbial Fe(III) Reduction in Anoxic, Mining- Impacted Lake Sediments (Lake Coeur d’Alene, Idaho). Appl Environ Microbiol 66: 154–162. Detmers J, Schulte U, Strauss H and Kuever J (2001) Sulfate Reduction at a Lignite Seam: Microbial Abundance and Activity. Microb Ecol 42: 238-247. Edwards U, Rogall T, Blöcker H, Emde M, Böttger EC (1989) Isolation and direct complete nucleotide determination of entire genes. Characterization of a gene coding for 16S ribosomal RNA. Nucleic Acids Res 17: 7843-53. Ettwig KF, Butler MK, Le Paslier D, Pelletier E, Mangenot S, Kuypers MMM, Schreiber F, Dutilh BE, Zedelius J, de Beer D, Gloerich J, Wessels HJCT, van Alen T, Luesken F, Wu ML, van de Pas-Schoonen KT, Op den Camp HJM, Janssen-Megens EM, Francoijs K-J, Stunnenberg H, Weissenbach J, Jetten MSM and Strous M (2010) Nitrite-driven anaerobic methane oxidation by oxygenic bacteria. Nature 464: 543–548. Fry JC, Horsefield B, Sykes R, Cragg BA, Heywood C, Kim GT, Mangelsdorf K, Mildenhall DC, Rinna J, Vieth A, Zink KG, Sass H, Weightman AJ and Parkes RJ (2009) Prokaryotic populations and activities in an interbedded coal deposit, including a previously buried section (1.6 - 2.3 km) above ~150 Ma basement rock. Geomicrobiol. J. 26: 163-178. Garrity GM, Lilburn TG, Cole JR, Harrison SH, Euzéby J, and Tindall BJ (2006) Taxonomic Outline of the Bacteria and Archaea, Release 7.7 http://www.taxonomicoutline.org/ Gihring TM, Moser PD, Lin L-H, Davidson M, Onstott TC, Morgan L, Milleson M, Kieft TL, Trimarco E, Balkwill DL and Dollhopf ME (2006) The Distribution of Microbial Taxa in the Subsurface Water of the Kalahari Shield, South Africa. Geomicrobiol Jour 23: 415–430. Gotelli NJ and Colwell RK (2001) Quantifying biodiversity: procedures and pitfalls in the measurement and comparison of species richness. Ecology Letters 4: 379-39. Greenblatt CL, Baum J, Klein BY, Nachshon S, Koltunov V and Cano RJ (2003) Micrococcus luteus - Survival in Amber, Microbial Ecology 48: 120–127, Greenblatt CL, Baum J, Klein BY, Nachshon S, Koltunov V and Cano RJ (2004) Micrococcus luteus - Survival in Amber. Microb Ecol 48: 120–127. Großkopf R, Janssen PH and Liesack W (1998) Diversity and structure of the methanogenic community in anoxic rice paddy soil microcosms as examined by cultivation and direct 16S rRNA gene sequence retrieval. Appl Environ Microbiol 64: 960-969.
57
Grote J, Jost G, Labrenz M, Herndl GJ and Jürgens K (2008) Epsilonproteobacteria Represent the Major Portion of Chemoautotrophic Bacteria in Sulfidic Waters of Pelagic Redoxclines of the Baltic and Black Seas. Appl. Environ. Microbiol 74: 7546–7551. Hahn MW, Lünsdorf H, Wu Q, Schauer M, Höfle MG, Boenigk J and Stadler P (2003) Isolation of Novel Ultramicrobacteria Classified as Actinobacteria from Five Freshwater Habitats in Europe and Asia. Appl Environ Microbiol 69: 1442–1451. Hales BA, Edwards C, Ritchie DA, Hall G, Pickup RW and Saunders JR (1996) Isolation and identification of methanogen-specific DNA from blanket bog peat by PCR amplification and sequence analysis. Appl Environ Microbiol 62: 668–675. Hallbeck L and Pedersen K (2008) Characterization of microbial processes in deep aquifers of the Fennoscandian Shield. Appl Geochem 23: 1796-1819. Haveman SA, Pedersen K and Ruotsalainen R (1999) Distribution and metabolic diversity of microorganisms in deep igneous rock aquifers of Finland. Geomicrobiol Jour 6: 277–294. Huber H, Hohn MJ, Rachel R, Fuchs T, Wimmer VC, and Stetter KO (2002) A new phylum of Archaea represented by a nanosized hyperthermophilic symbiont. Nature 417: 27 – 8 Inagaki F, Takai K, Hirayama H, Yamato Y, Nealson KH and Horikoshi K (2003) Distribution and phylogenetic diversity of the subsurface microbial community in a Japanese epithermal gold mine. Extremophiles 7: 307–317. Itävaara M, Vehkomäki M-L and Nousiainen A (2008) Sulphate-Reducing Bacteria in Ground Water Samples from Olkiluoto - Analyzed by Quantitative PCR. Posiva Working Report 2008-82. Itävaara M, Nyyssönen M, Bomberg M, Nousiainen M, Kapanen A, Ahonen L, Hultman J, Paulin L, Auvinen P, Kukkonen I (2011) Microbiological sampling and analysis of Outokumpu Deep Borehole biosphere in 2007-2008. Outokumpu Deep Drilling Project (2004-2010), Geological Survey of Finland, Special Paper 51: 199-206. Juottonen H, Galand PE, Yrjälä K. (2006) Detection of methanogenic Archaea in peat: comparison of PCR primers targeting the mcrA genes. Research in Microbiology 157: 914-921. Kalyuzhnaya MG, Khmelenina VN, Kotelnikova S, Holmquist L, Pedersen K and Trotsenko YA (1999) Methylomonas scandinavica sp. nov., a new methanotrophic psychrotrophic bacterium isolated from deep igneous rock ground water of Sweden. Syst Appl Microbiol. 22: 565-72.
58
Karkhoff-Schweizer RR, Huber DPW and Voordouw G (1995) Conservation of the genes for dissimilatory sulfite reductase from Desulfovibrio vulgaris and Archaeglobus fulgidus allows their detection by PCR. Appl Environ Microbiol 61: 290-296. Karr EA, Sattley WM, Rice MR, Jung DO, Madigan MT and Achenbach LA (2005) Diversity and Distribution of Sulfate-Reducing Bacteria in Permanently Frozen Lake Fryxell, McMurdo Dry Valleys, Antarctica. Appl Environ Microbiol 71: 6353-6359. Kepner RL and Pratt JR (1994) Use of fluorochromes for direct enumeration of total bacteria in environmental samples: past and present. Microbiol Rev 58: 603–615. Kimura H, Sugihara M, Yamamoto H, Patel BKC, Kato K and Hanada S (2005) Microbial community in a geothermal aquifer associated with the subsurface of the Great Artesian Basin, Australia. Extremophiles 9: 407-414. Knittel K and Boetius A (2010) Anaerobic Methane Oxidizers. In: Handbook of hydrocarbon and lipid microbiology (eds.) Part 19: 2023-2032. Kotelnikova S and Pedersen K (1997) Evidence for methanogenic archaea and homoacetogenic bacteria in deep granitic rock aquifers. FEMS Microbiol Rev 20: 339-349. Krüger M, Wolters H, Gehre M, Joye SB and Richnow H-H (2008) Tracing the slowgrowth ofanaerobicmethane-oxidizing communities by15N-labelling techniques. FEMS Microbiol Ecol 63: 401–411. Lazar CS, Dinasquet J, L'Haridon S, Pignet P, Toffin L (2011) Distribution of anaerobic methane-oxidizing and sulfate-reducing communities in the G11 Nyegga pockmark, Norwegian Sea. Antonie Van Leeuwenhoek 100: 639-53. Liu X-Z, Zhang L-M, Prosser JI, He J-Z (2009) Abundance and community structure of sulfate reducing prokaryotes in a paddy soil of southern China under different fertilization regimes, Soil Biol Biochem 41: 687-694. Luton PE, Wayne JM, Sharp RJ and Riley PW (2002) The mcrA gene as an alternative to 16S rRNA in the phylogenetic analysis of methanogen populations in landfill. Microbiology 148: 3521–3530.
Luque-Almagro VM, Huertas M-J, Martínez-Luque M Moreno-Vivián C, Roldán M. D, García-Gil LJ, Castillo F and Blasco R (2005) Bacterial degradation of cyanide and its metal complexes under alkaline conditions. Appl Environ Microbiol 71: 940-947.
Meyer B and Kuever J (2007) Phylogeny of the alpha and beta subunits of the dissimilatory adenosine-5'-phosphosulfate (APS) reductase from sulfate-reducing prokaryotes--origin and evolution of the dissimilatory sulfate-reduction pathway. Microbiology 153: 2026-44.

59
Miroshnichenko ML and Bonch-Osmolovskaya EA (2006) Recent developments in the thermophilic microbiology of deep-sea hydrothermal vents. Extremophiles 10: 85–96. Misra VK and Draper DE (1998) On the role of magnesium ions in RNA stability. Biopolymers 48: 113–135. Muyzer G, Dewaal EC and Uitterlinden AG (1993) Profiling of complex microbial populations by denaturing gradient gel electroforesis (DGGE) and temperature gradient gel electroforese (TGGE) in microbial ecology, Int Jour Gen Mol Microbiol 73: 127–141. Neretin LN, Schippers A, Pernthaler A, Hamann K, Amann R, and Jørgensen BB (2003) Quantification of dissimilatory (bi) sulphite reductase gene expression in Desulfobacterium autotrophicum using real-time RT-PCR. Environ Microbiol 5: 660–671. Newberry CJ, Webster G, Cragg BA, Parkes RJ, Weightman, AJ and Fry JC (2004) Diversity of prokaryotes and methanogenesis in deep subsurface sediments from the Nankai Trough, Ocean Drilling Program Leg 190. Environ Microbiol gy 6: 274–287. Niemann H, Duarte J, Hensen C, Omoregie E, Magalhães VH, Elvert M, Pinheiro LM, Kopf A and Boetius A (2006) Microbial methane turnover at mud volcanoes of the Gulf of Cadiz. Geochim Cosmochim Acta 70: 5336–5355. Nyyssönen M, Bomberg M, Kapanen A, Nousiainen A, Pitkänen P and Itävaara M (2011) Methanogenic and sulphate-reducing microbial communities in deep groundwater of crystalline rock fractures in Olkiluoto, Finland. Geomicrobiology Journal, in press. Omoregie EO, Niemann H, Mastalerz V, de Lange GJ, Stadnitskaia A, Mascle J, Foucher J-P, Boetius A (2009) Microbial methane oxidation and sulfate reduction at cold seeps of the deep Eastern Mediterranean Sea. Marine Geol 261: 114–12. Onstott TC, Moser DP, Pfiffner SM, Fredrickson JK, Brockman FJ, Phelps TJ, White DC, Peacock A, Balkwill D, Hoover R, Krumholz LR, Borscik M, Kieft TL, Wilson R (2003) Indigenous and contaminant microbes in ultradeep mines. Environ Microbiol 5: 1168–1191. Pachiadaki MG, Lykousis V, Stefanou EG and Kormas KA (2010) Prokaryotic community structure and diversity in the sediments of an active submarine mud volcano (Kazan mud volcano, East Mediterranean Sea). FEMS Microbiol Ecol 72;: 429–444 Posiva 2009. Olkiluoto Site Description 2008, part 1, Posiva Oy, POSIVA 2009-01. Pedersen K (2007) Microbiology of Transitional Groundwater of the Porous Overburden and Underlying Shallow Fractured Bedrock Aquifers in Olkiluoto, Finland. Working Report 2007-20.

60
Pedersen K, Arlinger J, Erikson S, Hallbeck M, Johansson J, Jägevall S and Karlsson L (2008) 2008-34 Microbiology of Olkiluoto Groundwater, Results and Interpretations 2007. Working Report 2008-34. Pitkänen P and Partamies S (2007) Origin and Implications of Dissolved Gases in Groundwater at Olkiluoto. Posiva report 2007-4. Pruesse E, Quast C, Knittel K, Fuchs B, Ludwig W, Peplies J and Glöckner FO (2007) SILVA: a comprehensive online resource for quality checked and aligned ribosomal RNA sequence data compatible with ARB. Nuc Acids Res 35: 7188-7196. Raghoebarsing AA, Pol A, van de Pas-Schoonen KT, Smolders AJP, Ettwig KF, Rijpstra WIC, Schouten S, Sinninghe Damsté JS, Op den Camp HJM, Jetten MSM and Strous M (2006) A microbial consortium couples anaerobic methane oxidation to denitrification. Nature 440: 918-921. Reed DW, Fuji AY, Delwiche ME, Blackwelder DB, Sheridan PP, Uchida T and Colwell FS (2002) Microbial communities from methane hydrate-bearing deep marine sediments in a forearc basin. Appl Environ Microbiol 68: 3759–3770. Reed AJ, Lutz RA and Vetriani C (2006) Vertical distribution and diversity of bacteria and archaea in sulphide and methane-rich cold seep sediments located at the base of the Florida Escarpment. Extremophiles 10: 199–211. Rochelle PA, Cragg BA, Fry JC, Parkes RJ and Weightman AJ (1994) Effect of sample handling on estimation of bacterial diversity in marine sediments by 16S rRNA gene sequence diversity. FEMS Microbiol Ecol 15: 215–226. Sanger F, Nickeln S and Coulson AR (1977) DNA sequencingwithchain-terminatinginhibitors. Proc Nati Acad Sci USA 74: 5463-5467. Schloss PD, Westcott SL, Ryabin T, Hall JR, Hartmann M, Hollister EB, Lesniewski RA, Oakley BB, Parks DH, Robinson CJ, Sahl JW, Stres B, Thallinger GG, Van Horn DJ and Weber CF (2009) Introducing mothur: Open-source, platform-independent, community-supported software for describing and comparing microbial communities. Appl Environ Microbiol 75: 7537-41. Schmidt J, Macario AL, Ahring BK and Conway de Macario E (1992) Effect of Magnesium on Methanogenic Subpopulations in a Thermophilic Acetate-Degrading Granular Consortium. Appl Environ Microbiol 58: 862-868. SekiguchiT, SatoT, Enoki M, Kanehiro H. and Kato C. (2010) Isolation and characterization of biodegradable plastic degrading bacteria from deep-sea environments. Genebank submission.
Stahl DA and Amann R (1991) Development and application of nucleic acid probes in bacterial systematics. In: Stackebrandt E, Goodfellow M, editors. Nucleic acid techniques in bacterial systematics. 1st ed. New York, NY: John Wiley and Sons. p. 205-248.
61
Shimizu S, Akyama M, Ishijima Y, Hama K, Kunimaru T and Naganuma T (2006) Molecular characterization of microbial communities in fault-bordered aquifers in the Miocene formation of northernmost Japan. Geobiol 4: 203–213. Takai K, Moser DP, Deflaun M, Onstott TC and Fredrickson JK (2001) Archaeal Diversity in Waters from Deep South African Gold Mines. Appl Environ Microbil 67: 5750–5760. Takai K, Suzuki M, Nakagawa S, Miyazaki M, Suzuki Y, Inagaki F and Horikoshi K (2006) Sulfurimonas paralvinellae sp. nov., a novel mesophilic, hydrogen- and sulfur-oxidizing chemolithoautotroph within the Epsilon-proteobacteria isolated from a deep-sea hydrothermal vent polychaete nest, reclassification of Thiomicrospira denitrificans as Sulfurimonas denitrificans comb. nov. and emended description of the genus Sulfurimonas. Int Jour Syst Evol Microbiol 56: 1725–1733. Teske A, Hinrichs K-U, Edgcomb V, de Vera Gomez A, Kysela D, Sylva SP, Sogin ML and Jannasch HW (2002) Microbial Diversity of Hydrothermal Sediments in the Guaymas Basin: Evidence for Anaerobic Methanotrophic Communities. Appl Environ Microbiol 69: 1994–2007. Teske A and Biddle JF (2008) Analysis of Deep Subsurface Microbial Communities by Functional Genes andGenomics. In : Dilek Y, Furnes H and Muehlenbachs K (eds.) Modern Approaches in Solid Earth Sciences 4 : 159-176. Yamamoto M, Nakagawa S, Shimamura S, Takai K and Horikoshi K (2010) Molecular characterization of inorganic sulfur-compound metabolism in the deep-sea epsilonproteobacterium Sulfurovum sp. NBC37-1. Environ Microbiol 12 : 1144–1153. Wagner M, Roger AJ, Flax JL, Brusseau GA and Stahl DA (1998) Phylogeny of dissimilatory sulfite reductases supports an early origin of sulfate respiration. Jour Bacteriol 180: 2975–2982. Waldron PJ, Petsch TS, Martini AM and Nüsslein K (2007) Salinity Constraints on Subsurface Archaeal Diversity and Methanogenesis in Sedimentary Rock Rich in Organic Matter. Appl Environ Microbiol 73: 4171–4179. Webster G, Yarram L, Freese E, Köster J, Sass H, Parkes RJ and Weightman AJ (2007) Distribution of Candidate Division JS1 and other Bacteria in tidal sediments of the German Wadden Sea using targeted 16S rRNA gene PCR-DGGE. FEMS Microbiol Ecol 62: 78–89. Webster G, Watt LC, Rinna J, Fry JC, Evershed RP, Parkes RJ & Weightman AJ (2006) A comparison of stable-isotope probing of DNA and phospholipid fatty acids to study prokaryotic functional diversity in sulphate-reducing marine sediment enrichments. Environ Microbiol 8: 1575–1589. Wegener G, Shovitri M, Knittel K, Niemann H, Hovland M and Boetius A (2008) Biogeochemical processes and microbial diversity of the Gullfaks and Tommeliten methane seeps (Northern North Sea). Biogeosci Discuss 5: 1127-1144.

62
Winfrey MR, Marty DG and Bianchi AJM (1981) Vertical distribution of sulfate reduction, methane production, and bacteria in marine sediments. Geomicrobiol Jour 2: 341–362. Winfrey MR and Zeikus JG (1977) Effect of sulfate on carbon and electron flow during microbial methanogenesis in freshwater sediments. Appl Environ Microbiol 33: 275–281. Whitman WB and Jeanthon C (2006) Methanococcales. In: The Prokaryotes 3: 257–273. Whitman WB, Coleman DC and Wiebe WJ (1998) Prokaryotes: The unseen majority. Proc Natl AcadSci USA 95: 6578–6583. Winderl C, Anneser B, Griebler C, Meckenstock RU and Lueders T (2008) Depth-resolved quantification of anaerobic toluene degraders and aquifer microbial community patterns in distinct redox zones of a tar oil contaminant plume. Appl Environ Microbiol 74: 792-801. Yamamoto M and Takai K (2011) Sulfur metabolisms in epsilon- and gamma-Proteobacteria in deep-sea hydrothermal fields. Front Microbiol 2; 1-8. Zengler K, Richnow HH, Rossello-Mora R, Michaelis W and Widdel F (1999) Methane formation from long-chain alkanes by anaerobic microorganisms. Nature 401: 266-269. Zverlov V, Klein M, Lücker S, Friedrich MW, Kellermann J, Stahl DA, Loy A and Wagner M (2005) Lateral gene transfer of dissimilatory (bi)sulfite reductase revisited. Jour Bacteriol 187: 2203-2208.

APP
END
ICIE
S
App
endi
x A
: Geo
chem
ical
ana
lysi
s re
sults
Sa
mpl
e ID
O
L-K
R13
/ 36
0-36
5 m
O
L-K
R6/
42
2-42
5 m
O
L-K
R23
/ 42
5-46
0.3
m
OL-
KR
49/
532-
537
m
OL-
KR
2/
596.
5-60
9.5
m
OL-
KR
1/
609.
4-62
6.8
m
OL-
KR
29/
801-
867
m
Sam
plin
g ty
pe
mpb
h m
pbh
mpb
h m
pbh
mpb
h m
pbh
mpb
h V
ertic
al d
epth
(m)
-296
.11
-328
.37
-346
.52
-415
.45
-559
.15
-572
.24
-797
.81
Wat
er ty
pe
Bra
ckis
h SO
4 B
rack
ish
SO4
Salin
e Sa
line
Salin
e Sa
line
Salin
e T
(m2 s-1
) 5.
86 x
10-8
1.
31 x
10-7
6.
48 x
10-7
4.
37 x
10-7
4.
33 x
10-7
5.
50 x
10-7
bd
l (<1
0-9)
Hyd
roge
olog
ical
zon
e H
Z001
HZ2
0A
H
Z21
HZ2
1
Pum
p ra
te (m
l min
-1)
22
104
20
172
23.9
62
.1
6.1
Cum
ulat
ive
volu
me
(L)
1129
54
86
971
7509
12
51
4492
49
6 Sa
mpl
ing
date
Mic
robi
olog
y 9.
3.20
10
18.5
.201
0 15
.12.
2009
14
.12.
2010
27
.1.2
010
26.1
.201
0 18
.5.2
010
Sam
plin
g da
te C
hem
istry
1.
3.20
10
10.5
.201
0 7.
12.2
009
1.12
.200
9 18
.1.2
010
18.1
.201
0 3.
5.20
10
Sam
plin
g da
te C
H4
6.3.
2006
3.
8.20
05
18.3
.200
3 13
.5.2
003
4.4.
2005
Te
mpe
ratu
re (º
C)
19.6
11
.6
17.6
11
14
.8
12
17.7
pH
7.
9 7.
9 7.
5 8.
1 8.
6 7.
8 7.
3 Eh
(Pt) (
mV
) N
A
NA
-2
49
-284
N
A
NA
N
A
Ec (m
S m
-1)
897
1832
21
90
2670
41
10
3770
78
20
DIC
(mgC
L-1
) 27
4.
1 3.
9 <3
<3
.75
<3.7
5 <2
1 N
POC
(mgC
L-1
) 10
<2
.4
5.1
<3
11
5 <1
2 TD
S (m
g L-1
) 49
94
1065
5 12
733
1589
9 25
459
2326
1 53
205
Alk
(m) m
eq L
-1
2.19
0.
37
0.28
0.
16
0.29
0.
23
0.13
SO
42- (m
g L-1
) 79
.5
379
2.9
1.4
0.5
0.5
<2
S2- (m
g L-1
) 5.
10
NA
0.
62
0.02
<0
.02
0.13
<0
.02
PO4
- (mg
L-1)
NA
N
A
NA
<0
.10
NA
N
A
NA
N
O3 (m
g L-1
) <0
.01
<0.0
1 <0
.01
<0.0
1 <0
.01
<0.0
1 <0
.01
NH
4 (m
g L-1
) 0.
07
0.03
<0
.02
<0.0
2 <0
.02
0.04
0.
08
Fe2+
(mg
L-1)
<0.0
2 N
A
0.08
0.
53
<0.0
2 0.
40
0.46
N
a2+ (m
g L-1
) 13
20
2800
25
30
3110
49
80
4720
91
50
K+ (m
g L-1
) 8.
2 9.
3 8.
3 9.
6 19
20
27
C
a2+ (m
g L-1
) 46
0 11
00
2100
27
00
4600
37
00
1000
0 M
g2+ (m
g L-1
) 35
77
55
19
18
52
13
6 M
n2+ (μ
g L-1
) N
A
NA
N
A
0 N
A
NA
N
A
Cl- (m
g L-1
) 29
20
6230
79
30
9940
15
700
1460
0 33
500
CH
4 (m
l L-1
) 22
22
N
A
NA
38
6 27
2 92
0 N
A D
ata
not a
vaila
ble
63
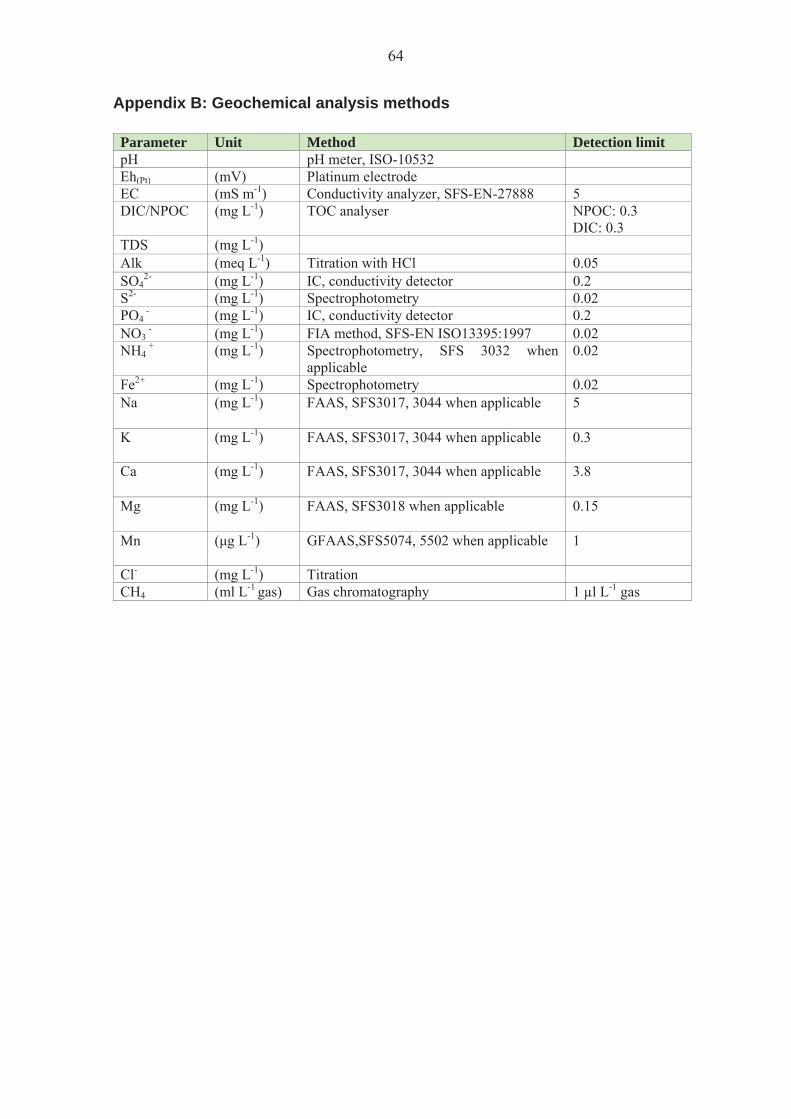
64
Appendix B: Geochemical analysis methods
Parameter Unit Method Detection limit pH pH meter, ISO-10532 Eh(Pt) (mV) Platinum electrode EC (mS m-1) Conductivity analyzer, SFS-EN-27888 5 DIC/NPOC (mg L-1) TOC analyser NPOC: 0.3
DIC: 0.3 TDS (mg L-1) Alk (meq L-1) Titration with HCl 0.05 SO4
2- (mg L-1) IC, conductivity detector 0.2 S2- (mg L-1) Spectrophotometry 0.02 PO4
- (mg L-1) IC, conductivity detector 0.2 NO3
- (mg L-1) FIA method, SFS-EN ISO13395:1997 0.02
NH4 + (mg L-1) Spectrophotometry, SFS 3032 when
applicable 0.02
Fe2+ (mg L-1) Spectrophotometry 0.02 Na (mg L-1) FAAS, SFS3017, 3044 when applicable
5
K (mg L-1) FAAS, SFS3017, 3044 when applicable
0.3
Ca (mg L-1) FAAS, SFS3017, 3044 when applicable
3.8
Mg (mg L-1) FAAS, SFS3018 when applicable
0.15
Mn ( g L-1) GFAAS,SFS5074, 5502 when applicable
1
Cl- (mg L-1) Titration CH4 (ml L-1 gas) Gas chromatography 1 μl L-1 gas

65
Appendix C: Dendrograms
Dendrograms showing the similarity between a) the bacterial communities and b) the archaeal communities between the different samples. The dendrograms were calculated using the Morisita-Horn model using OTUs containing sequences sharing 90 % sequence homology.
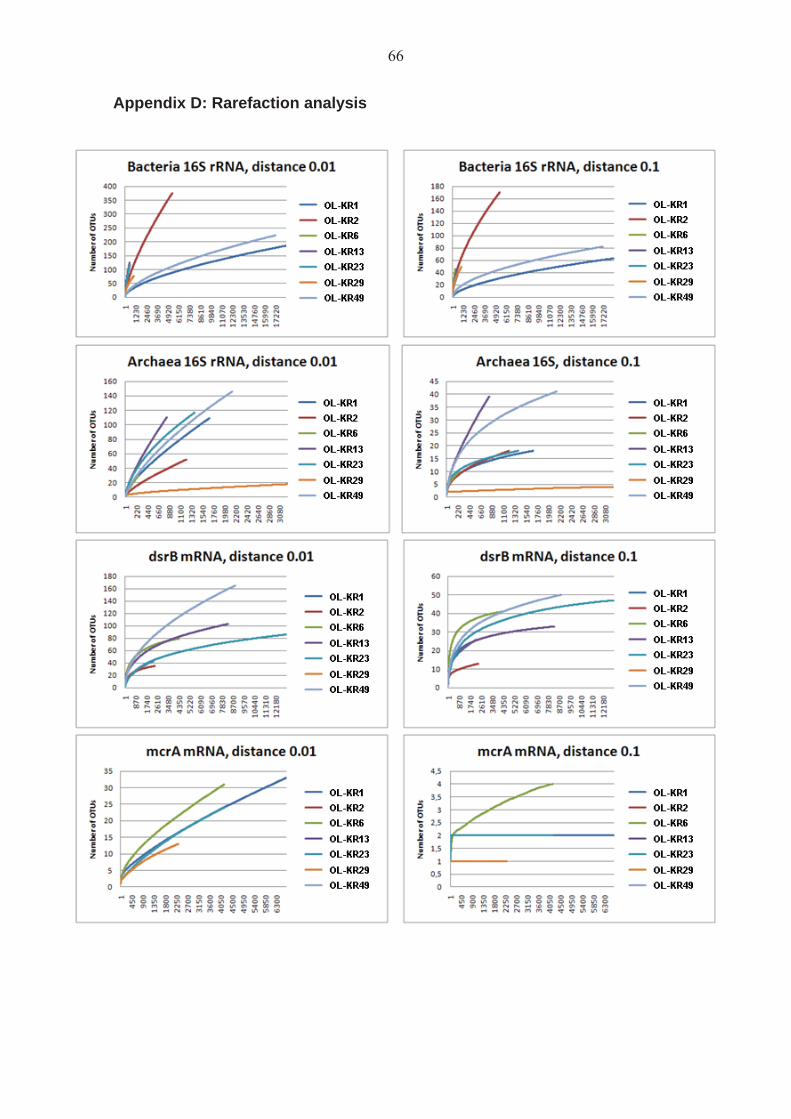
66
Appendix D: Rarefaction analysis
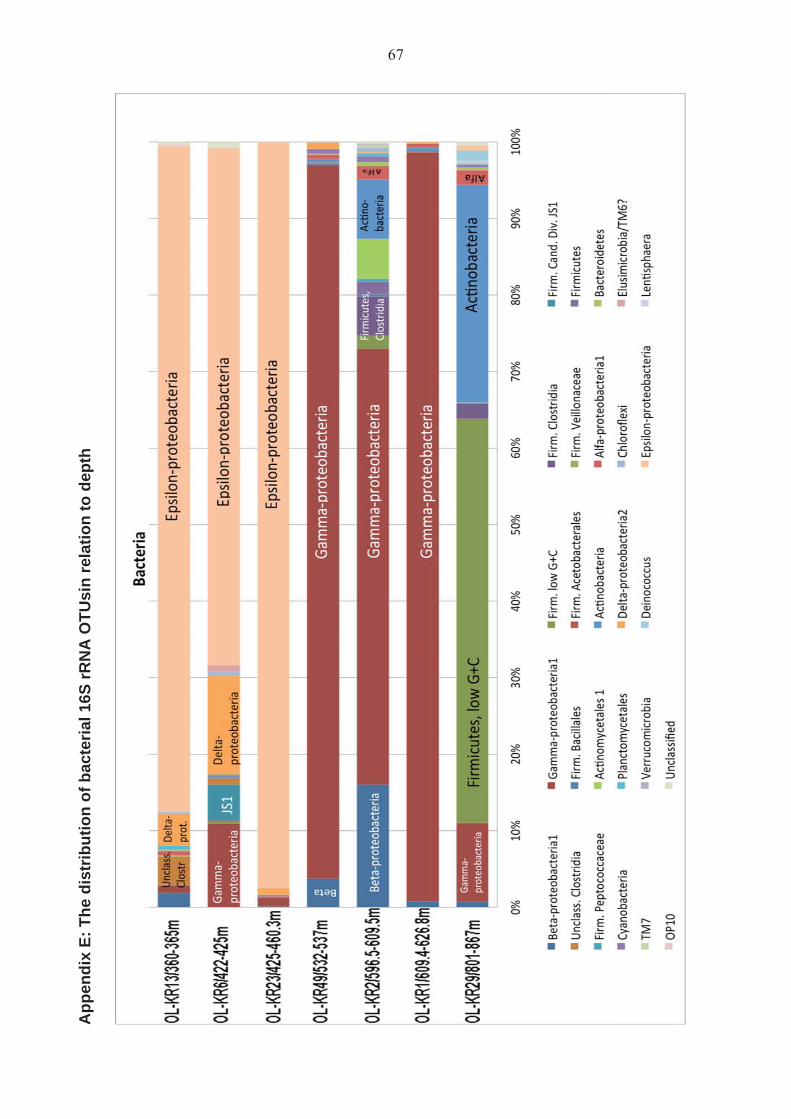
App
endi
x E:
The
dis
trib
utio
n of
bac
teria
l 16S
rRN
A O
TUsi
n re
latio
n to
dep
th