Embed Size (px)
Citation preview

ISBN 978-951-42-8783-1
ISBN 978-951-42-8784-8 (PDF)
ISSN 1239-4327
CHARACTERIZATION OF LIQUID CRYSTALS IN
POROUS MATERIALS BY MEANS OF NMR OF PROBE
ATOMS AND MOLECULES
PEKKA TALLAVAARA
REPORT SERIES IN PHYSICAL SCIENCES
Report No. 49 (2008)
PEKKA TA
LLAVAARA 2
008

CHARACTERIZATION OF LIQUID CRYSTALS IN POROUS
MATERIALS BY MEANS OF NMR OF PROBE ATOMS AND
MOLECULES
PEKKA TALLAVAARA
Department of Physical Sciences
University of Oulu
Finland
Academic dissertation to be presented, with the permission of the
Faculty of Science of the University of Oulu, for public discussion in the
Auditorium L10 (Raahensali), Linnanmaa, on May 23th, 2008, at 12
o’clock noon.
REPORT SERIES IN PHYSICAL SCIENCES Report No. 49
OULU 2008 ● UNIVERSITY OF OULU

Opponent
Prof. (em.) Rainer Kimmich, Universität Ulm, Ulm, Germany
Reviewers
Prof. (em.) Rainer Kimmich, Universität Ulm, Ulm, Germany
Associate Prof. Marija J. Vilfan, Josef Stefan Institute, Ljubljana, Slovenia
Custos
Prof. Jukka Jokisaari, University of Oulu, Finland
ISBN 978-951-42-8783-1
ISBN 978-951-42-8784-8 (PDF)
ISSN 1239-4327
Oulu University Press
Oulu 2008

i
Tallavaara, Pekka: Characterization of liquid crystals in porous materials by means of NMR of probe atoms and molecules Department of Physical Sciences, University of Oulu, P.O.Box 3000, FI-90014 University of Oulu, Finland Report Series in Physical Sciences No. 49 (2008)
Abstract The present thesis describes a method for characterization of liquid crystals in confined spaces by means of NMR of probe atoms and molecules. 129Xe isotope enriched xenon gas and 13C isotope enriched methyl iodide and methane were used as probes. Behavior of solutes and liquid crystals confined to porous materials was investigated using 129Xe and 13C NMR spectroscopy. Uniaxial nematic liquid crystals Phase 4 and ZLI 1115 were used as a medium. Controlled pore glass with well defined and known properties was used as a porous material. The behavior of liquid crystals and solutes in various different size pores, temperatures and magnetic fields at different solute concentrations was explained. The average pore diameter of the material varied from mesopores to macropores. The studied temperature range covered solid, nematic and isotropic phases of bulk liquid crystals, and the highest magnetic field was 2.5 times stronger than the lowest one used (4.70 T). The chemical shifts, intensities, and line shapes of the resonance signals from the solutes were observed to contain lots of information about the effect of confinement on the state of the liquid crystals. Especially the line shape of the 13C resonances of methyl iodide was observed to be very sensitive to the liquid crystal orientation distribution in the pores. By varying experimental conditions the relative contribution of field and the surface forces of pore walls to the orientation of liquid crystal molecules inside the pores was seen to change quite drastically. In addition, it was also observed that when the sample is cooled very rapidly, xenon atoms do not squeeze out from the freezing medium but they are occluded inside the solid lattice, and their chemical shift is very sensitive to crystal structure. Furthermore, because solutes experienced on average isotropic environment inside the smallest pores, isotropic value of the shielding tensor could be determined at exactly the same condition and temperature as anisotropic counterpart between the pore particles. Thus, for the first time in the solution state, shielding anisotropies could be determined as a function of temperature. Keywords: nuclear magnetic resonance spectroscopy, liquid crystal, porous material, CPG, 129Xe, shielding anisotropy, chemical shift anisotropy, methyl iodide, methane

ii
Acknowledgements The present work has been carried out in the NMR Research Group at the Department of Physical Sciences of the University of Oulu. I am very grateful to the department itself and its Head Professor Jukka Jokisaari for placing the facilities at my disposal. I feel great privileged to say that I have been working in the NMR Research Group under the proficient supervision of Professor Jukka Jokisaari. Professor Jokisaari is also the Head of the Group and the original idea to investigate things presented in this thesis came from him. I want to thank him for giving me an opportunity to work in the group and his pleasant guidance. Ph.D. Ville-Veikko Telkki was in great help when teaching me to write scientifically and analyzing results presented in the first paper. I want to thank Ph.Lic. Jani Saunavaara for his help and guidance to the experimental work at NMR spectroscopy. The present NMR laboratory manager Anu Kantola and former Susanna Ahola have been in great aid in solving experimental difficulties and ensuring that measuring instruments operate properly in the NMR laboratory. The metal workshop of our department has also been in help during these projects from which they are acknowledged. In addition to persons mentioned above, I would like to thank the present and the former colleagues of mine for creating satisfying work environment: Anne, Ari, Harri, Henri, Joonas, Jouni, Juhani, Matti, Nanna, Perttu, Päivi, Sampo, Teemu and Tuomas.
The work was financially supported by the Research Foundation of Orion Corporation, the Tauno Tönning Foundation, the Vilho, Yrjö and Kalle Väisälä Foundation, the Oskar Öflunds Stiftelse, the Emil Aaltonen Foundation, the Alfred Kordelin Foundation, the Magnus Ehrnrooth Foundation and the Graduate School of Computational Chemistry and Molecular Spectroscopy (LASKEMO). I would like express my grateful acknowledgements to all financial supporters.
Last but definitely not least I want to thank my parents, my grandparents and both of my siblings for caring and support. Oulu, May 2008 Pekka Tallavaara

iii
List of original papers The present thesis consists of an introductory part and the following papers, which are referred to in the text by their Roman numerals.
I Tallavaara P, Telkki V-V & Jokisaari J (2006) Behavior of a Thermotropic Nematic Liquid Crystal Confined to Controlled Pore Glasses as Studied by 129Xe NMR Spectroscopy. The Journal of Physical Chemistry B 110: 21603-21612.
II Tallavaara P & Jokisaari J (2006) 2D 129Xe EXSY of Xenon Atoms in a
Thermotropic Liquid Crystal Confined to a Controlled Pore Glass. Physical Chemistry Chemical Physics 8: 4902-4907.
III Tallavaara P & Jokisaari J (2008) Behavior of Liquid Crystals Confined to
Mesoporous Materials as Studied by 13C NMR Spectroscopy of Methyl Iodide and Methane as Probe Molecules. The Journal of Physical Chemistry B 112: 764-775.
IV Tallavaara P & Jokisaari J (2008) An Alternative NMR Method to Determine
Nuclear Shielding Anisotropies in Liquid-Crystalline Solutions with 13C Shielding Anisotropy of Methyl Iodide as an Example. Physical Chemistry Chemical Physics 10: 1681-1687.
In these papers, the present author has performed all the experimental work, including sample preparation, measurements on NMR spectrometers and analyses of the spectra. In addition, the initial versions of the manuscripts were written by the author but they were finished as teamwork. In addition, the author has also performed all the experimental work and written the initial manuscript of the following paper that is not included in this thesis.
1. Tallavaara P & Jokisaari J (2006) An Easy Way to Prepare Pressurized Glass Inserts for MAS Rotors, The Journal of Magnetic Resonance 181: 229-232.

iv
Abbreviations 129Xe xenon-129 isotope 13C carbon-13 isotope 2H hydrogen-2 isotope = deuterium 2D two dimensional 3D three dimensional AC alternating current CPG controlled pore glass CSA chemical shift anisotropy DNMR deuterium nuclear magnetic resonance EXSY exchange spectroscopy FID free induction decay FWHM full width at half maximum LC (uniaxial) liquid crystal MAS magic angle spinning MRI magnetic resonance imaging NMR nuclear magnetic resonance Phase 4 eutectic mixture of p-methoxy-p´-butylazoxy-benzenes, a commercial
liquid crystal material ppm part per million T1 spin lattice relaxation time VAS variable angle spinning ZLI 1115 trans-4-(4-heptyl-cyclohexyl)-benzonitrile, a commercial liquid crystal
material Å Ångström = 10-10 m

v
Contents
Abstract............................................................................................................................... i
Acknowledgements ........................................................................................................... ii
List of original papers...................................................................................................... iii
Abbreviations ................................................................................................................... iv
1. Introduction................................................................................................................... 1 1.1 Outline of the thesis .................................................................................................. 2
2. NMR spectroscopy........................................................................................................ 3 2.1 Basics of NMR spectroscopy.................................................................................... 4 2.2 Xenon NMR.............................................................................................................. 5 2.3 Chemical exchange ................................................................................................... 6
3. Liquid crystals............................................................................................................... 8 3.1 Classification of liquid crystals................................................................................. 8 3.2 Liquid crystals in electric and magnetic field ......................................................... 10 3.3 Solvent induced shielding of solute ........................................................................ 11
4. Porous materials.......................................................................................................... 13 4.1 Controlled pore glass .............................................................................................. 14
5. Liquid crystals in porous materials........................................................................... 15 5.1 Methods to characterize liquid crystals in pores..................................................... 17
5.1.1 2H NMR spectroscopy ................................................................................. 17 5.1.2 Calorimetry .................................................................................................. 17
6. Small solutes as probes to characterize liquid crystals in pores............................. 18 6.1 Sample..................................................................................................................... 18 6.2 Xenon NMR studies................................................................................................ 20
6.2.1 Spectra.......................................................................................................... 20 6.2.2 Line shape .................................................................................................... 23 6.2.3 Chemical shift .............................................................................................. 26
6.3 Heteronuclear spin systems as probe molecules..................................................... 27 6.3.1 Spectra.......................................................................................................... 27 6.3.2 Line shape .................................................................................................... 29 6.3.3 Chemical shift .............................................................................................. 30
6.4 Shielding anisotropy determination ........................................................................ 32
7. Conclusions.................................................................................................................. 33
References........................................................................................................................ 36
Original papers................................................................................................................ 39


1
1. Introduction The most well-known states of matter are solid, liquid and gas. Some materials, however, possess states which have properties both of solid and liquid. It is then said, that material has a liquid crystal (LC) state. This means that molecules are ordered but they can move with respect to each other more freely than in the crystal state. The first observations from these intermediate states of matter were made already at the 1880s1, but the actual breakthrough in the LC research took place only after their importance in the applications of electronic display units and in living organisms were figure out. In everyday life LCs are used among other things in TFT-displays and other digital displays, for example in calculators and mobile phones. Their role in technologing society increases day after day and different kind of practical applications can be found from almost every technical device. The most important type of LCs in different kind of applications are uniaxial thermotropic nematic LCs. In most appliances they are in confined space, for example, between two conducting plates as in liquid crystal displays. Their understanding is a fundamental problem in condensed matter physics and important for electro-optical applications of LCs. The properties of LCs in confined spaces were investigated in the present thesis by means of nuclear magnetic resonance (NMR) spectroscopy. In a typical NMR spectroscopy experiment sample is placed in a very strong magnetic field generated by electric current circulating in a superconducting coil2-4. The strong magnetic field generates macroscopic nuclear magnetization to the sample which is parallel with the applied field. The macroscopic magnetization is tilted for detection from its thermal equilibrium state by means of properly tuned radiofrequency pulse after which the magnetization vector starts to precess around the field direction. The precession frequency is unique to each NMR active nucleus and it also depends on the surroundings of the nuclei. Consequently, information about nuclei type and their environment is obtainable from the NMR spectrum which makes NMR spectroscopy valuable tool in structural chemistry, physics and material sciences. It can be applied to a wide variety of samples both in solid, liquid and gas states. For example, NMR is the only method for determining the molecular structure of a substance in solution. The most familiar NMR application is the magnetic resonance imaging (MRI) technique used in medicine to visualize the structure and function of the body. One advantage of MRI technique compared to other imaging techniques is that it is harmless to the patient and detailed three dimensional images from any part of the body can be obtained. In this thesis the main focus is on the characterization of thermotropic uniaxial nematic liquid crystals in confined spaces by means of probe atoms and molecules. Studied LCs were confined inside the commercial silica based controlled pore glass (CPG) porous material, and 129Xe isotope enriched xenon gas as well as 13C enriched methyl iodide and methane were used as probes. From these, 129Xe isotope of xenon is extremely suitable candidate for LC NMR studies because its chemical shift is extremely sensitive to the changes taking place in its local environment. The measurements were performed on a wide temperature range covering solid, nematic and isotropic phases of studied LCs. In addition, in order to visualize competing forces of applied magnetic field and surface interactions of pore walls to the orientation of LC molecules inside the pores,

2
measurements were performed in different magnetic fields using different size average pore diameters of the materials. The present method to characterize LCs in confined geometries is quite novel, because before this only one brief paper has appeared where solutes are used as spies to characterize LCs in restricted spaces5. Traditionally LCs have been studied by labeling them with deuterium in one or several positions, and measuring 2H NMR spectrum. At the end, this thesis proves that information about LC orientation behavior in the pores is obtainable when LCs are indirectly studied using solute molecules and that this method has some benefits compared to the traditional one.
1.1 Outline of the thesis This thesis is an introduction to the method where liquid crystals are studied in porous materials by using NMR of probe atoms and molecules. The most significant part of the present work is examined in papers I - IV. The key aspects necessary to properly understand the details in the papers are gone through in the following chapters. In chapter 2 basics of NMR spectroscopy are considered on a very general level. In addition, also xenon NMR as well as chemical exchange phenomena are inspected in more detail. Chapter 3 focuses on liquid crystals; their physical properties, how they behave in electric and magnetic field and how they change shielding of solute dissolved to them. Because liquid crystals were confined to porous material it is necessary to properly understand their physical properties and manufacturing method in order to interpret results from NMR measurements more reliably. Consequently chapter 4 is devoted to porous materials and especially to controlled pore glasses, which were used as a porous matrix in the present studies. In order to understand benefits of the present method to study liquid crystals in the pores (described in chapter 6), some conventional methods for the characterization of liquid crystals in the pores are described in chapter 5. In the last chapter (chapter 7) conclusion of the present method is given. Paper I describes the first experiments where enriched 129Xe gas was used as a probe to characterize nematic liquid crystals in the pores. Thermotropic nematic uniaxial Phase 4 from Merck was used as a LC and controlled pore glass was used as a porous material. The average pore diameter of the material varied from 81 to 2917 Å, and the measurements were performed within wide temperature range. It was observed that 129Xe NMR spectra from xenon gas dissolved in LCs gives versatile information about the orientation distribution of LCs confined to the pores. The spectra indicated that xenon experiences on average an isotropic environment inside the smallest pores, and no first order nematic-isotropic phase transition was observed. Whereas inside the larger pores both anisotropic nematic phase as well as nematic-isotropic phase transition was seen. In the smallest pores LC molecules orientate parallel with the pore axis but in larger pores deviation of LC director as a function of temperature to the direction of the external magnetic field was clearly seen from the spectra. In addition, it was also observed that when the sample is cooled very rapidly by immersing it in liquid nitrogen, xenon atoms do not squeeze out from the solid but they are occluded inside the solid lattice, and their chemical shift is very sensitive to crystal structure. Several different solid phases were observed both from the bulk LC as well as LC confined inside the largest pores.

3
Paper II concentrates on the investigation of the exchange process of xenon atoms in the smallest pore diameter sample used in Paper I using two-dimensional exchange spectroscopy NMR measurements. The experiments were performed both in nematic and isotropic phases of bulk LC and the exchange rate constants of xenon atoms were determined in both states. The exchange rate process was observed to be very slow compared to typical NMR time scale which is a consequence of the slow diffusion rate of xenon atoms in the LC. Consequently, depending upon the length of the pore segments, the chemical shift of a xenon atom is characteristic to the many different pores and LC orientation distributions therein if the length of the pore segments is short, whereas the chemical shift reflects the local orientation in the pores if the pore segments are long enough. This is the case in the largest pore diameter samples used. In Paper III, investigation of the behavior of nematic LCs confined to controlled pore glass materials was continued by using carbon-13 enriched methyl iodide and methane gas as probe molecules. Merck Phase 4 and ZLI 1115 liquid crystals were used, and the average pore diameters of the materials varied from 81 to 375 Å. Chemical shift, intensity, and line shape of the resonance signals in the spectra revealed again lots of information about the effect of confinement on the state of the LCs. Especially the line shape of the 13C resonances of methyl iodide in LCs confined into the pores was observed to be very sensitive to the LC orientation distribution. The effect of the magnetic field on the orientation of LC molecules inside the pores was examined in four different magnetic fields varying from 4.70 to 11.74 T. The field was found to have significant contribution to the orientation of LC molecules in the largest pores close to the nematic-isotropic phase transition temperature. Part of the observed phenomena supported the results obtained from the 129Xe NMR measurements in Paper I in similar environment, but some results are not completely clear and consequently need further investigation. For example, for the first time, a first-order nematic-isotropic phase transition was detected to take place inside such restrictive hosts, phenomenon that was not observed in respectively 129Xe NMR studies. In Paper IV an alternative NMR method to determine nuclear shielding anisotropies for molecules in liquid-crystalline solutions is proposed. Because methyl iodide molecules experience on average an isotropic environment inside the smallest pores on the whole temperature range studied, ranging from bulk solid to isotropic phase, it is possible to determine isotropic value of the shielding tensor at exactly the same temperature as the anisotropic counterpart is determined between the pore particles. Thus, for the first time in the solution state, shielding anisotropies can easily be determined as a function of temperature. 13C shielding tensor of methyl iodide was observed to be temperature dependent.
2. NMR spectroscopy Atoms are basic building blocks of material and they consist of dense nuclei surrounded by electron cloud. The nucleus consists of positively charged protons and electronically neutral neutrons which together are known as nucleons. If the electron cloud covers more than one nucleus the ensemble is called a molecule. In a molecule, the motion of the

4
electrons forces nuclear system to a specific geometrically stable configuration in which the system is in its minimum potential energy. Bond angles of molecules are consequently well defined. The mass of atomic nuclei determines largely the mass of bulk material and its thermal properties. The chemical properties of atoms and strong electrostatic interactions that bound atoms and molecules together are a consequence of oppositely charged protons and electrons. In addition of mass and electric charge, each atomic nucleus has also magnetism and spin. The magnetism simply means that the nucleus interacts with the magnetic field. The spin is very abstract concept in nature but it is, as we will see in the next chapter, very crucial in NMR spectroscopy. Simply speaking spin is only some basic physical property of atom nucleus and it is either integer or half-integer. For a nucleus for which the number of protons and neutrons are both even, spin is zero. If both are odd, the spin is integer larger than zero. On the other hand, if the sum of protons and neutrons is even the spin is integer, while it is half-integer if the sum is odd. In this study we studied only spin systems with spin one half, and consequently after this point on we are going to focus mainly on them.
2.1 Basics of NMR spectroscopy As stated above, magnetic materials interact with the magnetic field2-4,6. This interaction is typically expressed in terms of a magnetic moment which may be permanent, such as in bar magnets, or induced, meaning that the magnetic moment appears only when an applied magnetic field is also present. The induced magnetic moment is directly proportional to the product of applied field strength and the magnetic susceptibility of the material. The latter one expresses the degree of magnetization of a material in response to the applied magnetic field and it may be either positive or negative in sign. Materials with a positive magnetic susceptibility are called paramagnetic and they tend to pull the magnetic field into the material. Whereas materials, that hold negative magnetic susceptibility, are called diamagnetic and they tend to push the magnetic field out of the material. The circulation of the electrons around the nucleus and their magnetic moments cause the majority of the magnetism of the material. In diamagnetic materials, however, to a good approximation, the pairing of the electron spins cancels out the electron magnetism. Thus the magnetism of the material arises mainly from the permanent magnetism of the nuclei. In the nuclei the magnetic moments point to all possible directions if the magnetic field is absent. If the magnetic field is put on or if the nuclei is brought to the magnetic field (to the NMR spectrometer, for example) the field induces torque to the magnetic moments and causes them to spin around the field. This motion is called Larmor precession. The precession frequency depends on the magnetic flux density at the site of the nucleus and the gyromagnetic ratio of the nucleus. The gyromagnetic ratio is a specific quantity to each nucleus and it is the magnetic moment of the nucleus divided by its angular momentum. For a nucleus with zero spin quantum number or spin the magnetic moment and the angular momentum are zero and consequently these kinds of nuclei are useless in NMR spectroscopy.

5
Because of thermal energy, each atom and molecule constantly perform vigorous motion in the sample. They rotate, vibrate and change their relative orientation and position all the time. The magnetic materials (electrons and nuclei) produce tiny magnetic fields. Both the direction and magnitude of these microscopic fields change constantly because of random thermal motion of the molecules. Each magnetic moment in the nuclei precess around the direction of the effective local magnetic field. The direction of the effective local magnetic field is the sum of static external field and constantly varying microscopic field. These small fluctuating fields eventually lead to that the magnetic moments sample all possible orientations as time goes by. If the temperature of the sample is finite, as it is in normal experiments and conditions, then it is slightly more probable that the magnetic moments eventually end up orientating more toward the direction of low magnetic energy i.e. toward the external field than any other directions. This stable anisotropic orientation distribution of magnetic moments is called thermal equilibrium and it generates macroscopic nuclear magnetization to the sample. By applying a radiofrequency pulse with appropriate frequency and duration to the sample, the macroscopic nuclear magnetization can be tilted from its thermal equilibrium state to the perpendicular surface. This transverse magnetization starts to precess around the external field with the same frequency as individual magnetic moments precessed before excitation pulse. The precessing magnetization generates a rotating magnetic field which in turn generates changing electric field. If a wire coil is placed close enough to the sample, then the electric field puts the electrons in motion in the coil. This oscillating electric current can be measured and it is called free-induction decay (FID). By changing time domain axis to frequency domain by simple mathematical operation, known as Fourier transform, obtained information from the sample changes to more easily readable form. Fourier transform of FID is generally known as NMR spectrum. The NMR spectroscopy is currently the only method to obtain detailed molecular information. It is, however, quite insensitive method because the excess of magnetic moments in the direction of applied magnetic field in thermal equilibrium is almost one in a million at room temperature and consequently a vast amount of nucleus is needed to make NMR experiments feasible.
2.2 Xenon NMR At room temperature and pressure xenon is a gas and it has nine stable isotopes of which only 129Xe and 131Xe have nonzero spin quantum number. External electronic orbital of xenon is fully occupied, which makes it chemically very stable and puts it into the group of noble gases in the periodic table. Due to the large and highly polarisable electron cloud (xenon has 54 electrons) the shielding of xenon nucleus is extremely sensitive to the structure and temperature of the environment. Especially the chemical shift of 129Xe nucleus (spin quantum number I = ½) is very sensitive to interactions with its chemical environment7,8. The total solvent effect on the resonance frequency may namely be over 250 ppm9 (ppm = part per million), much larger than for most of other NMR active nuclei. Interest in 129Xe nucleus in NMR studies is also increased by the fact that its relative receptivity is about 32 times greater than that of 13C 9. Its natural abundance is

6
also relative high; natural xenon contains 26.4 % 129Xe isotope and 21.2 % 131Xe isotopes which is quadrupolar with spin quantum number I = 3/2. The relative sensitivity of NMR is quite low, because in thermal equilibrium the excess of magnetic moments in the direction of external magnetic field is only slightly larger than in any other direction as stated above. It is said, that the polarisation of nuclei is small. Because the spin-lattice relaxation time, T1, of gaseous 129Xe gas is relatively long, it may be even 3 hours for bulk gas10, it is possible to optically polarize these nuclei prior to NMR experiments. The optical polarisation means, that angular momentum is transferred from circularly polarised laser light to the nuclei. Since the polarisation degree obtained by this method is much larger than the thermal polarization, these gases are therefore sometimes called as hyperpolarised gases11. Increased sensitivity can be used in many applications; perhaps one of the most interesting ones is its use in magnetic resonance imaging (MRI) to obtain images from the human lungs12. In 129Xe NMR experiments chemical shifts are usually expressed with respect to the chemical shift of zero pressure 129Xe gas. The shielding of 129Xe in pure gas depends upon gas density and temperature according to13,14
( ) ( ) ( ) ( ) ,, 33
2210 ρσρσρσσρσ TTTT +++= (1)
where 0σ is the shielding in vacuo and ρ is the density of a gas in amagat unitsa. The virial coefficients 321 and, σσσ are temperature dependent but at low densities last two one of these are negligible and consequently the shielding depends linearly on the density.
2.3 Chemical exchange One of the most powerful aspects of NMR is its ability to detect molecular motions from one chemical region of space to another over a wide range of timescales, even when the system is in dynamic equilibrium. In most of other techniques this is not possible but the system has to put into an initial non-equilibrium state in order to observe its return back to equilibrium.15 In NMR, macroscopic diffusion can be determined by field encoding the nuclear spins by using field gradients, method in which the NMR imaging is based on. On the other hand, if the sample itself contains regions with different magnetic susceptibilities in which the resonance frequency of the nuclear spins is different, then externally generated inhomogeneous magnetic field is not needed at all2. Let’s consider a situation in which the system contains two different chemical sites. If the populations of the sites are different, then the nuclear spins tend to diffuse from one site to another because of some chemical or physical process. The rate constant, which is also known as transition probability per unit time, describes this motion and it illustrates the probability of an isolated nuclear spin to diffuse to another chemically different site within a short time interval. If the exchange rate constant is smaller than
a 1 amagat is the density of a gas at standard temperature and pressure (T = 273.15 K and p = 1.013·105 Pa)

7
half of the magnitude of the frequency difference in the two sites, the process is said to be in the slow intermediate exchange regime. In the NMR spectrum this is seen as separate signals from both sites. If the diffusion rate increases and consequently also the rate constant increases, then the lines first broaden because of motional broadening and step by step they coalesce to one signal whose resonance frequency is weighted average of resonance frequencies of these two sites. After this crossover point spins experience only averaged chemical shift and motional narrowing causes the peak to become narrower16. It is said that the exchange rate is in fast intermediate region. The slow exchange can be studied by NMR using two dimensional method known as EXSY. EXSY is an abbreviation from the words exchange spectroscopy and its information content is highest if the exchange is slow on the NMR time scale and fast on the longitudinal relaxation time scale. The basic pulse sequence is shown in Figure 1 and it consists of three 90° pulses separated by delays t1 and τm. The first delay t1 is the evolution period during which the macroscopic magnetization vectors are frequency labeled. The second delay is known as mixing period during which the spins may diffuse from one site to other and consequently exchange their sites. In the 2D NMR spectra the exchange process is seen as cross peaks which are also known as off-diagonal signals. Usually mixing period is much longer than the evolution or detection t2 periods and consequently exchange that takes place during these two periods is relatively small compared to that occurring during τm if the exchange rate is slow. Transverse magnetization that is left after the second excitation pulse is destroyed by the field gradient or proper phase cycling. In addition of exchange process, intensities of cross peaks reflect also cross relaxation rates of spins between two sites. Intensities of diagonal peaks in turn express specific relaxation rates. It should also be mentioned that any phenomenon that contributes to longitudinal magnetization transfer during the mixing time (quadrupolar relaxation, cross-relaxation, fast chemical reaction) will also modify the intensities of cross peaks. 17
Figure 1. 2D exchange spectroscopy (EXSY) pulse sequence.

8
3. Liquid crystals In general the different states of matter are classified as solid, liquid and gas. In addition to these the most common state of matter is plasma which covers more than 99 percent of visible universe (stars and galaxies). Boundaries between the different classes are not, however, very well defined. In the solid phase molecules are regularly positioned and oriented and their mass centers form a three-dimensional periodic lattice called the crystal structure. In the liquid phase, due to high thermal energy of molecules, molecules are randomly positioned and oriented and they appear physically to be the same from any perspective. That’s why ordinary fluids are called isotropic. The crystal structure can be distinguished from the isotropic liquid by its X-ray diffraction pattern which shows sharp Bragg reflections peaks characteristic of the lattice. In addition, in the isotropic liquids molecules can translate, tumble and rotate freely whereas in crystal solid strong chemical bonds between the molecules hold them in fixed position relative to each other. Because of some thermal energy molecules vibrate around their equilibrium position but this movement is very small and very fast, and cannot be observed by NMR spectroscopy. In 1888 a distinct state of matter was observed between the crystalline solid and isotropic liquid1. Material had some of the ordering properties of crystal but it flew like a liquid. Because it possessed properties both from crystal and liquid it was started to call liquid crystal (LC). Other nowadays used nomenclatures are mesomorphic, mesophase and crystalline liquid. In general, LCs are more like liquids than solids. Namely, the amount of energy needed for a phase transition to occur from solid to the LC state is larger than the respective energy needed for phase transition from LC to ordinary liquid state.
3.1 Classification of liquid crystals Typically LCs are divided into thermotropic, which exhibit the liquid crystalline state at certain temperature interval, and lyotropic, that exhibit liquid-crystalline properties at certain concentration and also temperature ranges. Some materials that exhibit both thermotropic and lyotropic LC properties are called amphotropic. 18-24 Thermotropic LC molecules are strongly anisometric in shape: they are elongated and symmetric like a cigar (called calamitic LCs), disk-shaped (discotic LCs), or curved (pyramidal or banana-shaped). Mean length of molecules is typically from 20 to 50 Å and usually molecules consist of rigid aromatic part (one or more benzene rings adhered unbendingly to each other) end of which flexible hydrocarbon chains are attached. At high temperatures molecules are randomly oriented without any long-range positional or orientational order. LC is then said to be in isotropic phase where it macroscopically appears to be like any other isotropic liquid such as water (see Fig. 2a). In microscopically, however, short-range order persists over scales of tens of Ångströms and this distance is called nematic correlation length. As temperature is decreased elongated calamitic molecules gain long-range orientational order but no long-range positional order. LC is said to be in nematic phase (Fig. 2b). Long axes of LC molecules are consequently, on average, aligned preferentially along one direction within a large
9
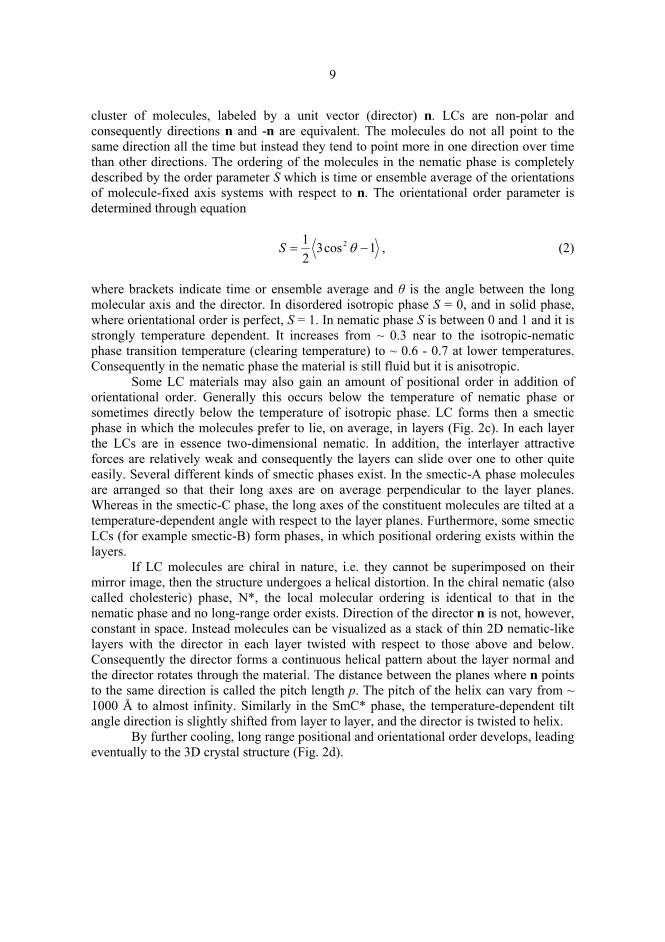
cluster of molecules, labeled by a unit vector (director) n. LCs are non-polar and consequently directions n and -n are equivalent. The molecules do not all point to the same direction all the time but instead they tend to point more in one direction over time than other directions. The ordering of the molecules in the nematic phase is completely described by the order parameter S which is time or ensemble average of the orientations of molecule-fixed axis systems with respect to n. The orientational order parameter is determined through equation
1cos321 2 −= θS , (2)
where brackets indicate time or ensemble average and θ is the angle between the long molecular axis and the director. In disordered isotropic phase S = 0, and in solid phase, where orientational order is perfect, S = 1. In nematic phase S is between 0 and 1 and it is strongly temperature dependent. It increases from ~ 0.3 near to the isotropic-nematic phase transition temperature (clearing temperature) to ~ 0.6 - 0.7 at lower temperatures. Consequently in the nematic phase the material is still fluid but it is anisotropic. Some LC materials may also gain an amount of positional order in addition of orientational order. Generally this occurs below the temperature of nematic phase or sometimes directly below the temperature of isotropic phase. LC forms then a smectic phase in which the molecules prefer to lie, on average, in layers (Fig. 2c). In each layer the LCs are in essence two-dimensional nematic. In addition, the interlayer attractive forces are relatively weak and consequently the layers can slide over one to other quite easily. Several different kinds of smectic phases exist. In the smectic-A phase molecules are arranged so that their long axes are on average perpendicular to the layer planes. Whereas in the smectic-C phase, the long axes of the constituent molecules are tilted at a temperature-dependent angle with respect to the layer planes. Furthermore, some smectic LCs (for example smectic-B) form phases, in which positional ordering exists within the layers. If LC molecules are chiral in nature, i.e. they cannot be superimposed on their mirror image, then the structure undergoes a helical distortion. In the chiral nematic (also called cholesteric) phase, N*, the local molecular ordering is identical to that in the nematic phase and no long-range order exists. Direction of the director n is not, however, constant in space. Instead molecules can be visualized as a stack of thin 2D nematic-like layers with the director in each layer twisted with respect to those above and below. Consequently the director forms a continuous helical pattern about the layer normal and the director rotates through the material. The distance between the planes where n points to the same direction is called the pitch length p. The pitch of the helix can vary from ~ 1000 Å to almost infinity. Similarly in the SmC* phase, the temperature-dependent tilt angle direction is slightly shifted from layer to layer, and the director is twisted to helix. By further cooling, long range positional and orientational order develops, leading eventually to the 3D crystal structure (Fig. 2d).
9
cluster of molecules, labeled by a unit vector (director) n. LCs are non-polar and consequently directions n and -n are equivalent. The molecules do not all point to the same direction all the time but instead they tend to point more in one direction over time than other directions. The ordering of the molecules in the nematic phase is completely described by the order parameter S which is time or ensemble average of the orientations of molecule-fixed axis systems with respect to n. The orientational order parameter is determined through equation
1cos321 2 −= θS , (2)
where brackets indicate time or ensemble average and θ is the angle between the long molecular axis and the director. In disordered isotropic phase S = 0, and in solid phase, where orientational order is perfect, S = 1. In nematic phase S is between 0 and 1 and it is strongly temperature dependent. It increases from ~ 0.3 near to the isotropic-nematic phase transition temperature (clearing temperature) to ~ 0.6 - 0.7 at lower temperatures. Consequently in the nematic phase the material is still fluid but it is anisotropic. Some LC materials may also gain an amount of positional order in addition of orientational order. Generally this occurs below the temperature of nematic phase or sometimes directly below the temperature of isotropic phase. LC forms then a smectic phase in which the molecules prefer to lie, on average, in layers (Fig. 2c). In each layer the LCs are in essence two-dimensional nematic. In addition, the interlayer attractive forces are relatively weak and consequently the layers can slide over one to other quite easily. Several different kinds of smectic phases exist. In the smectic-A phase molecules are arranged so that their long axes are on average perpendicular to the layer planes. Whereas in the smectic-C phase, the long axes of the constituent molecules are tilted at a temperature-dependent angle with respect to the layer planes. Furthermore, some smectic LCs (for example smectic-B) form phases, in which positional ordering exists within the layers. If LC molecules are chiral in nature, i.e. they cannot be superimposed on their mirror image, then the structure undergoes a helical distortion. In the chiral nematic (also called cholesteric) phase, N*, the local molecular ordering is identical to that in the nematic phase and no long-range order exists. Direction of the director n is not, however, constant in space. Instead molecules can be visualized as a stack of thin 2D nematic-like layers with the director in each layer twisted with respect to those above and below. Consequently the director forms a continuous helical pattern about the layer normal and the director rotates through the material. The distance between the planes where n points to the same direction is called the pitch length p. The pitch of the helix can vary from ~ 1000 Å to almost infinity. Similarly in the SmC* phase, the temperature-dependent tilt angle direction is slightly shifted from layer to layer, and the director is twisted to helix. By further cooling, long range positional and orientational order develops, leading eventually to the 3D crystal structure (Fig. 2d).

10
Figure 2. Different LC phases: (a) isotropic, (b) nematic, (c) smectic-A, (d) solid. In addition of rod-shaped molecules also disk-like molecules or discotics may form mesophases. They usually have flat or nearly flat rigid aromatic core surrounded by flexible chains which are crucial to the formation of discotic LCs. If the core is not flat but more like cone-shaped substances forming LC phases are called bowlic or pyramidic. These LCs may be classified substantially into three types: columnar, nematic and lamellar. Usually molecules stack one on top of other forming columns in which the cores are arranged periodically or aperiodically within each column. Columnar LCs are liquid-like along the columns and solid like in other two dimensions. The director is the preferred direction of disc normals and columns itself are arranged in a two-dimensional network leading hexagonal, rectangular or oblique symmetry. Also tilted variants in which molecular cores are tilted with respect to the column axis are quite common. In the discotic nematic phase partly the same physical properties apply as in the nematic phase of calamatic LCs described above. Namely LC molecules are orientationally ordered without long-range translational order. Molecules may also stack in layers forming lamellar or smectic phases.
3.2 Liquid crystals in electric and magnetic field The local director distributions in uniaxial nematic phase can be aligned along a common direction to create macroscopic order for example by confining the sample between glass plates, by spinning the sample or by applying a sufficient strong electric or magnetic field. In the most common liquid crystal display type (twisted nematic) nematic liquid crystals are sandwiched between two pieces of glass in which the surface alignments are perpendicular to each other, and so the molecules arrange themselves in a helical structure. Sample spinning is used among other things in MAS (magic angle spinning) and VAS (variable angle spinning) NMR experiments to orientate LC director along some certain direction with respect to the external magnetic field. Electric field alignment occurs because the field exerts a torque force on the molecules. Nematic liquid crystals with positive dielectric anisotropy ∆ε tend to orientate parallel with the applied field whereas minimum free energy density is obtained for nematics with negative ∆ε when director orientates perpendicular to the field direction. Similarly, magnetic torque acts on

11
local directors and orientate them parallel with the field if diamagnetic anisotropy ∆χ of liquid crystals is positive and perpendicular to it if ∆χ is negative.
3.3 Solvent induced shielding of solute The resonance frequency of a bare nucleus in the magnetic field is different from that surrounded by electron cloud. The electrons around the nucleus change the local magnetic field experienced by the nuclei by a two-step process. First, the external magnetic field induces currents to the electronic ground states and these currents, which arise dominantly from the core electrons, tend to attenuate the external magnetic field. This is called diamagnetic term. Second, the electron circulation in the excited electronic states in turn generates a magnetic field which is parallel with the applied field and thus tends to increase it. This is called paramagnetic term. Together diamagnetic and paramagnetic terms determine what is the resonance frequency of the nuclei surrounded by electrons, i.e. what is its chemical shift. In addition of surrounding electrons, also solvent molecules contribute to the shielding of nuclei residing in a solute25. These solvent effects can be divided into two classes. First, because of the external magnetic field, every diamagnetic or paramagnetic solvent molecule bears an induced magnetic moment and all these moments naturally affect the local magnetic field experienced by the nuclei of solute. The solvent molecules that situate far enough from the solute nuclei produce the so called bulk susceptibility correction, bσ , which is the field correction from all the solvent molecules that can be treated as a continuum. On the other hand, solvent molecules that locate close to the solutes cause so called local anisotropy contribution, aσ , which is strongly influenced by motional averaging and depends on shape geometry of molecules, their motion as well as magnetic anisotropy. The second class of solvent effects comprises contributions from the intermolecular currents between the electron clouds of solute and solvent. These interactions are relative short range and they alter the electronic configuration of the solute molecules26. The effect on the shielding depends on the properties of the solutes and, for example, in the 129Xe shielding of xenon nuclei they are dominating term. If all these different shielding contributions except aσ are summed together, the nuclear magnetic shielding of noble gas atoms as well as for example methane dissolved in LC can be explained by using pairwise additivity approximation27. According to the model, the average of shielding tensor element in anisotropic phase becomes

12
( )[ ]
( )[ ] ( )[ ] ( )
⎪⎭
⎪⎬⎫
⎥⎥⎦
⎤
⎢⎢⎣
⎡⎟⎟⎠
⎞⎜⎜⎝
⎛−Δ+
−⎪⎩
⎪⎨⎧
⎟⎟⎠
⎞⎜⎜⎝
⎛−−−Δ+−−
×⎭⎬⎫
⎩⎨⎧ Δ
+−−=
z
z
anisoZZ
TTy
M
TTyPTTTT
TT
0
02020010
000
132
31
1cos1321
1
χχ
θβσβσ
ρραρσ
(3)
The first curly brackets describe the temperature dependence of the density of the used LC, 0ρ is the density of LC at the reference temperature T0 and α is the isobaric thermal expansion coefficient. Usually the density of LC changes a little bit at nematic-isotropic phase transition and term Δρ / ρ0 describes this. Here Δρ represents the density jump. Term which starts with symbol 0σ describes the isotropic part of the shielding, and term
0σΔ is respectively anisotropic part. Symbol 0σ is the shielding constant divided by density at reference temperature and 0σΔ is its anisotropy. Coefficients 1β and 2β represents assumed linear temperature dependence of shielding and shielding anisotropy, respectively. ( ) ( )1cos3½cos2 −= θθP is the second-order Legendre polynomial, where θ is the angle between the LC director and the external magnetic field. The temperature dependence of the second-rank orientational order parameter ( )TS can be modeled by the Haller function ( ) ( )zTyTTS 0/1−= , where y and z are adjustable parameters. The last row in the Eq. (3) describes macroscopic bulk susceptibility correction bσ for a long cylindrical sample parallel with the external magnetic field. The factor χ is diamagnetic susceptibility of LC, Δχ is its anisotropy, and M is the molar mass of LC. The experimental 13C chemical shift, expδ , of methyl iodide or any molecule possessing at least a 3-fold symmetry axis can be written as28
( )θσδδ cos32
2exp PS zz
iso Δ−= . (4)
In the Eq. (4), isoδ is the isotropic value of the chemical shift, σΔ is the anisotropy of the shielding tensor in the molecule fixed coordinate system (x, y, z) and Szz is the order parameter of the molecule symmetry axis. For methyl iodide Szz is obtained from the experimental 1H-13C dipolar coupling DCH:
CHCH
HCCH S
rD 32
0
8πγγμ h
−= , (5)
where ( ) zzCH SPS αcos2= is the orientational order parameter of the C-H bond, with α being the angle between the C-H bond and the symmetry axis of molecule, rCH is the C-H bond length and the other symbols have their usual meaning.

13
4. Porous materials Porous materials are, as their name implicates, porous. They are solid substances, inside of which are free spaces – holes, caves and slots, which are more generally called pores or voids29-31. They are ubiquitous in the nature, in the technology and in everyday life. For example soil, stones, woods, concrete, bricks, bones, skin, fabrics, papers, leathers, snow and many other natural as well as technical products contain pores. In fact only metals, some dense rocks and some plastics are non-porous. Many physical and chemical properties of the materials are based on the properties of porous media and consequently understanding them, help us to understand many other physical as well as chemical phenomena. Porous materials act a very important role in many different areas of technology. Hydrology and petroleum engineering are two areas of technology that are the most interested in the properties of porous materials. Namely, for example purification of drinking water and sewage is based on the porous material in filter beds. In chemical engineering heterogeneous catalysis, chromatography and especially gel permeation chromatography, filtering of gases and fluids as well as drying of bulk items are things where porous materials are utilized. In medicine and biochemistry, biological filters and membranes, the flow of blood in organism and electro osmosis are couple of examples, where the knowledge of porous media is vital.32 Annual markets are worth of over one billion US dollar per year33. In everyday life porous attend in many ways. We breathe partly through the pores in our skin, lungs and bones have curious and complex pore structure and even hairs are porous. Breathability and thermal insulation capacity of textures and leathers are based on pores on them. Absorption capacity of paper towels originates from their large porosity. Many building materials, such as bricks, concrete and timber are better heat insulators because their pores can trap large amount of air. Plants take water they need from water absorbed in pores in the soil. Porous soil works also as a filter to clean water and that’s why wells fill from purified water. Good thermal insulation capability of snow is based on its airy, porous structure. Construction steel used in concrete structures for example in bridges to reinforce them get rust, because ice-control salt can penetrate to the surface of the steel through the small pores and micro cracks in the concrete. In addition, as the water freezes in the pores of concrete or rock, it makes them crack and crumble. Porous materials are usually characterized according to their average pore size, pore size distribution, porosity and surface-area. According to their pore size they are used to be divided into four different classes34. Macroporous are those, whose average pore diameter is over 500 Å, in mesopores average pore diameter is between 20 and 500 Å and in micropores between 7 and 20 Å. In the smallest pores, called ultra-micropores, the pores are less than 7 Å in diameter. Boundaries are not rigorous but are not, however, either arbitrary: namely each pore size class has its own kind of adsorption properties and when studying them different kind of adsorption techniques are used.35
The pore size announces the average size of the pore, the most probable value or part of the pore size distribution. Usually to make theoretical calculations easier and to reduce changing parameters in the model that describe geometry of the pores, pores are assumed to be either shape of the gap between two parallel plates or cylindrical. Then the only changing parameter is the distance between the pore walls or radius of the cylinder.

14
In order to characterize porous materials more quantitatively pore size distribution is usually used instead of the pore size. By definition it is the probability density function giving the distribution of the pore volume by a characteristic pore size. It tells how regular pore sizes are, in other words how narrow is the pore size distribution.
The porosity of the material is the volume of the pores divided by the volume of the material. Easy sounding definition involves, however, some hands-on complications. First, part of empty spaces of the pores may be difficult to reach by extrinsic gas or liquid molecules. There may be bottle necks in the pores which are so small that parts of the pores are out of reach. This so called dead space is not included in the true porosity of the material but it involves its own contribution to the porosity if it is reported in the volume/mass units. Another complication arises from the fact that the volume of the pores that are size of the atoms is not exactly specified because the location of the atom surface can not be specified unambiguously. It is quite clear, that the solid material that consists of small particles possess larger surface area than the material made of larger units. Specific surface area is characteristic to each porous material and it is usually defined as the total surface area per unit of mass in units of square meter per gram. The surface of the solid material is, however, hardly ever planar when considered in atomistic scales. Especially the surface area of micropores is multi-valued because the surface of molecules is not unambiguously determined and in addition surface of molecules is heavily crinkly if it is examined on atomic scale. Also, almost every time there are cracks and splits, part of which may extend very deeply from the surface of the matter. That is the reason why an arbitrary agreement is made to divide specific surface area into two categories; outer and inner surface. All cuts and grooves, whose width is larger than their depth, are determined as the outer surface. To inner surface are included all walls of cracks, pores and holes which are greater in their deep than in width. For most of porous materials the inner surface is several orders larger than the outer surface and this can be considered as a definition of porous materials. Because of manufacturing methods of porous materials, pores usually form irregularly shaped channel networks inside of which different sized cavities and holes crisscross to all possible directions. Then the properties of material, which are calculated for example using assumption that the pores are shaped of ideal cylinder, do not necessarily tell the whole truth from the system. In the next section we are going to focus on the manufacturing methods and special properties of the porous material, controlled pore glass, which was used in this study.
4.1 Controlled pore glass Nowadays various different kinds of porous materials are commercially available and consequently there exist many different kinds of methods to manufacture them. In this thesis controlled pore glass (CPG) was used as a porous material and therefore this chapter is devoted to describe its physical properties and manufacturing procedure.
Porous materials can be manufactured by removing part of solid substance so, that inside of material holes and empty spaces are created. There exist several different

15
methods to do this. Solid substance may have composite structure and one or many components can be removed by dissolving or vaporizing when material becomes porous. Increasing specific surface of the material is also possible. For example, burning coal of material, which is partly changed into graphite in a controlled way, produces pores on it. Enough deep cracks on the surface of the material can also be regarded as the pores as described in the previous chapter. Consequently, porous material can be prepared by scratching the surface of the solid substance. Porous material forms also when solid substance crumbles and breaks apart into smaller pieces.
CPG porous material is prepared from a composition of three substances: RO, B2O3 and SiO2, where the first one RO means either alkaline earth, alkali metal or heavy metal oxides36,37. In the present case RO was sodium oxide Na2O. By selecting proper amount of each substance and by heat treating the mixture, i.e. raising temperature above some critical temperature, the mixture will form a substantially homogeneous liquid. By lowering the temperature two phases will separate. The sodium borate phase (NaBO2), is easily decomposable while the other, silicon oxide (SiO2) framework, is chemically more durable. Before NaBO2 phase is leached away with an acid treatment the substance is comminuted mechanically to smaller pieces. The particle size or the size of the granules was in the present case 125-177 μm. The pore size and the pore size distribution can effectively be controlled by monitoring and adjusting the thermal history of the mixture. The pore size depends both on the duration of thermal treatment and its temperature and the average size of the pores productable by this method ranges from a couple of tens to several thousands Ångströms. Formed rigid silicon oxide framework has a narrow pore size distribution (at least 80 % of the pores are within ± 10 % of the mean pore diameter), it is inert to substances with which it comes into contact, it is spectroscopically transparent and as an inorganic material it tolerates excellently strong cleaning agents and sterilization. Consequently purification process does not change physical or chemical properties of CPG material. The formed porous network is three dimensional with randomly oriented and connected pores. The superior properties of CPG compared to porous materials manufactured for example by gelling make it ideal medium in chromatographic applications in which macromolecular substances, for example, virus particles and cell components are separated38.
5. Liquid crystals in porous materials When liquid crystals are confined to porous materials, their physical as well as chemical properties deviate quite a lot of that observed in the bulk phase39. In a high magnetic field, in the NMR spectrometer for example, the minimum energy density of the bulk LC system is reached when the director is oriented parallel with the external field in the case where the anisotropy of diamagnetic susceptibility is positive (and perpendicular if Δχ is negative), as already described in the chapter 3.2. In the pores, however, the director distribution is more complex because it depends from the overall interactions between the external field, surfaces of pore walls, 3D space geometry of pore network, size of cavities and elastic forces of LCs.

16
The atomic force microscopy measurements have revealed that the outer surface of CPG grains is smooth if it is inspected on the nanometer scale40. Because no direct information about the surface geometry of pore walls is obtainable we therefore assume that it is similar to that of CPG grains. Smooth, untreated silica surface is expected to enforce axial orientational anchoring of LC molecules41 which means that molecules are oriented parallel with the symmetry axis of pores. On the other hand, silane treatment of porous material is known to enforce homeotropic orientational anchoring42 in which case LC molecules are oriented perpendicular with respect to the pore surface. In the present studies, however, no silane treatment was used. The surface induced ordering, called orientational wetting43, decreases as a function of distance but close to the surface it is so strong that even in isotropic phase there is a surface-induced residual nematic order39. It has also been observed to cause layering in the case of a normal isotropic liquid (not liquid crystal) when supported by a sufficiently smooth surface in thin films44. The surface forces, however, decrease as a function of distance and consequently LC molecules behave like in bulk far enough from the pore walls. This distance is called magnetic coherence length, ξM, and it is determined through the equation18
⎟⎟⎠
⎞⎜⎜⎝
⎛Δ
=χ
μξ
KBM
01 (6)
where B is the external magnetic flux density, μ0 is permeability of vacuum and K is elastic constant of LC. Usually ξM is on the order of 1 μm in the magnetic field of 11.74 T but both K and Δχ are proportional to the orientational order parameter S of LC. K has square-law dependence21 and Δχ is directly proportional22 to S. In bulk nematic phase S decreases with increasing temperature and thus also the magnetic coherence length decreases as temperature increases. The spaces between CPG grains are so large that the external magnetic field dominates there as an orienting force, and consequently LC molecules behave there as in bulk phase. The pore structure of CPG porous material is fundamentally the same as in an other porous material known as Vycor glass. They both are prepared in the same way and only the final treatment procedures of the CPG material differ slightly from that in Vycor glass45. These minor differences in the manufacturing process may only make surface irregularities smaller in CPG material which means that we can assume CPG and Vycor glass to be quite similar in physical properties. Vycor glass has been modeled as a 3D network of randomly connected pore segments with the ratio of segment length to the pore diameter being about four46. The same value can also be regarded valid for CPG because of the above mentioned reasons. Consequently, the pore network of CPG can be imagined to consist of cylindrical pore segments which are arbitrarily connected. The director distribution is not unambiguously determined in these connection points, where several pore segments join together which may lead to isotropic like environment40. Furthermore it is also possible that if the pores are sufficiently small in diameter the nematic like phase does not build at all inside the pores47.

17
5.1 Methods to characterize liquid crystals in pores The behavior of liquid crystals in various kinds of porous materials has been studied by using numerous different techniques. Most common ones of these are deuterium NMR spectroscopy (DNMR) and calorimetry studies. In 2H NMR spectroscopy, LC molecules are labeled from one or several positions with deuterium nuclei and measured 2H NMR spectra have revealed information about LC orientation and dynamic. An alternating current (AC) and relaxation mode calorimetries in turn are usually used for phase transition studies.
5.1.1 2H NMR spectroscopy In 2H NMR spectroscopy LC molecules are selectively deuterated from one or several positions and 2H NMR spectrum is measured from the sample40,48,49. 2H NMR is very powerful technique in LC studies because 2H-spectra reveal orientational order, director configuration and molecular dynamics of molecules. This is because the observed quadrupolar line splitting (spin of 2H is one) is directly proportional to the product of the local orientational order parameter and the angle between the local director and the external magnetic field θ. If the orientational order parameter and θ are spatially dependent then the spectrum, of course, consists of a superposition of all contributions. In addition, also the distance that the molecules migrate during an NMR measurement, known as translational self-diffusion motion of the molecules, causes motional averaging of the quadrupolar splitting and the line shape of the spectra. In the isotropic phase where LC molecules are randomly oriented, the splitting should merge into a single narrow line. In sufficiently restrictive hosts, with small enough pores for example, small splitting is, however, observed even above nematic-isotropic phase transition temperature. This is due to orientational order caused by the surface interactions of the pore walls. Usually this small splitting is observed to decrease as a function of increasing temperature indicating, that relative surface interactions decrease. Even though line-shape analysis of 2H-spectrum has proven to give versatile information about LC orientation and phase behavior of LC molecules in the pores both in smectic, nematic, and isotropic phases, its chemical shift is, however, quite insensitive to the different chemical environments and temperatures. In addition it also requires special labeling process of molecules in order to work.
5.1.2 Calorimetry Calorimetry is a method of measuring heat capacity or heat of chemical reactions or physical changes in the system49-51. Basically a very simple calorimeter consists only of a heat insulated container and a thermometer which is used to register initial and final temperatures of the sample in the container. In LC studies usually two different kinds of calorimeters are used; AC and relaxation mode. In the AC mode calorimetry sample is

18
periodically heated, for example with resistive heater, and a temperature modulation of the sample is then registered with thermometer or thermo-sensor. The amplitude of temperature modulation is inversely proportional to the heat capacity of the sample. In the relaxation mode, the heater power supplied to the sample is not oscillating but it is linearly ramped which makes it much more sensitive to latent heat than the AC mode. In the specific heat versus temperature curves phase transitions of bulk LCs are seen as sharp peaks. When phase transitions are examined in the porous materials the specific heat peak maxima are commonly damped, broadened and shifted relative to that observed in the bulk phase. The suppression of the specific heat peak maximum and its broadening are attributed to the surface anchoring of pore walls. Namely only LC molecules that are in the middle of the pores express phase transition at the same temperature as in bulk whereas molecules close to walls remain ordered even deep into the isotropic phase as described above. Consequently phase transition in the pores takes place gradually as a function of temperature. Shifting of the peak maximum temperature originates from the surface anchoring and finite size effects. The surface anchoring effects are known to raise the phase transition temperature whereas finite size effects lower it.
6. Small solutes as probes to characterize liquid crystals in pores
In this chapter, the basic idea of using solute molecules and atoms as probes to study LCs in porous material is summarized. The main concept is the following: xenon atoms and methyl iodide molecules are used as probes to indirectly characterize LCs in the pores. The 129Xe isotope of xenon gas is an extremely suitable candidate for LC NMR studies because its chemical shift is extremely sensitive to the changes taking place in its local environment as stated already above. When methyl iodide was used as a probe molecule, 13C NMR spectroscopy was utilized. The main difference between 129Xe atom and 13CH3I molecule is that originally the electron cloud distribution of xenon is spherically symmetric but anisotropic forces acting in LC phases deform it and consequently change the chemical shift of xenon nucleus. Whereas methyl iodide is a heteronuclear spin system whose symmetry axis orientates parallel with the local LC director and anisotropic contributions from environment are seen both in chemical shift and dipolar coupling between carbon and proton nuclei.
6.1 Sample The sample geometry used in the present experiments is illustrated in Figure 3. It consists of three components: porous material, liquid crystal and small atoms or molecules that are used as probes. Porous material was controlled pore glass (CPG), obtained from CPG Inc. (Lincoln Park, New Jersey). Use of CPGs in the present kind of studies is favorable, because the pore size distribution of CPG material is quite narrow. In addition, CPG materials are commercially available on various pore sizes ranging from meso- to

19
macropores which makes studies as a function of pore diameter feasible. Furthermore, because the CPG grains are spherical in shape and because the size of the grains is large compared to molecular dimensions, liquid behaves as in bulk between the particles. Consequently, reference from the liquid in the bulk state is obtained simultaneously as a spectrum from the liquid confined inside the pores is measured. This naturally makes interpretation of the spectra easier because only changes that take place between these two states need to be considered. Neither separate reference sample nor interface layer to the coil region is therefore needed. The medium, liquid crystal used in this case, is warmed into isotropic phase and mixed completely with the porous material in order to make certain that LC is properly penetrated into the pores. Thermotropic nematic uniaxial Phase 4 (also known as N4, eutectic mixture of p-methoxy-p´-butylazoxy-benzenes) and ZLI 1115 (S1115, trans-4-(4-heptyl-cyclohexyl)-benzonitrile) were used as LCs, both were obtained from Merck (Darmstadt, Germany). In this thesis to focus is only on the orientation behavior of LC Phase 4 in various environments. Penetration of LCs into the pores occurs via capillary forces and consequently medium should be a wetting liquid so that all pores become filled up. In general, with a few exceptions, any non-nematic solute that is added to the sample decreases the nematic-isotropic phase transition temperature of LC and also changes its orientational order52-54. Changes are the bigger the bigger is the non-nematic concentration and therefore the amount of probe atoms and molecules should be kept as low as possible. This means that it is recommended to use isotope enriched probe substances, such as 129Xe isotope enriched xenon gas or 13C enriched methyl iodide and methane. Small amounts of enriched non-nematic solutes do not affect substantially the properties of LCs but will make experimental times reasonable.

20
Figure 3. The sample geometry used in present studies. The sample consists of controlled pore glass, liquid crystal and solute molecules. Solutes were either 129Xe gas (about 3 atm) or methyl iodide (10 mol %) and methane gas (2 atm). The amount of porous material was so big that it covered the whole region of NMR coil.
6.2 Xenon NMR studies In this chapter results and the basic idea from the studies where 129Xe isotope of xenon gas was used as a probe atom to characterize LC Phase 4 in the CPG porous material are summarized. The average pore diameter of the CPG material varied from 81 to 2917 Å. The sample was slowly frozen in the NMR spectrometer before actual measurements that were performed from low to high temperature.
6.2.1 Spectra The experiments were performed in four different magnetic fields (B0 = 4.70, 7.05, 9.39 and 11.74 T) on solid, nematic and isotropic phases of bulk LC mainly from low to high temperature to avoid the super cooling effect of the LC. The spectra observed from the sample can be divided into three different classes according to the phases of the bulk medium in the studied temperature range (see Figure 4).
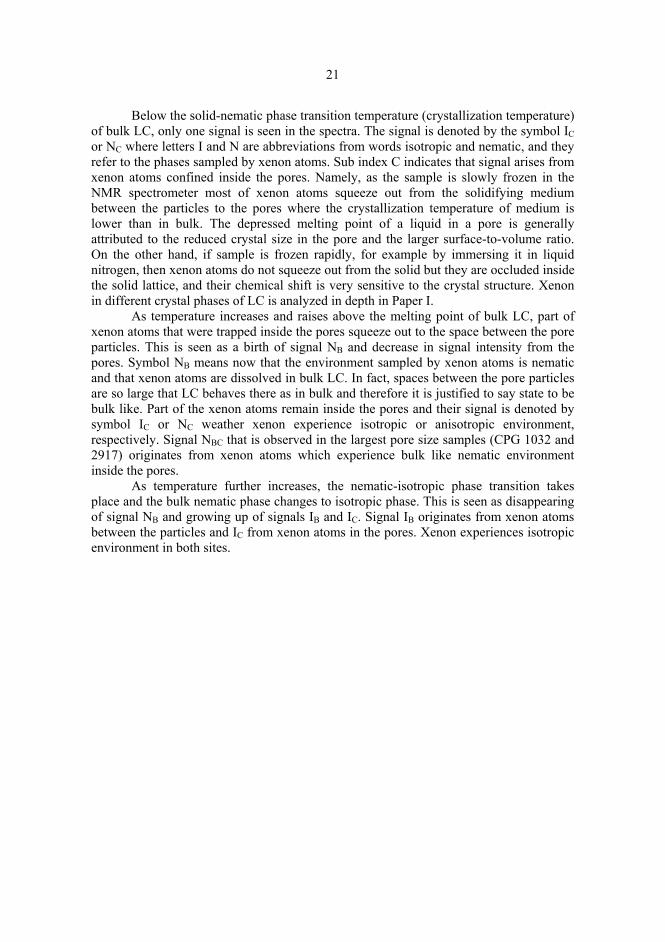
21
Below the solid-nematic phase transition temperature (crystallization temperature) of bulk LC, only one signal is seen in the spectra. The signal is denoted by the symbol IC or NC where letters I and N are abbreviations from words isotropic and nematic, and they refer to the phases sampled by xenon atoms. Sub index C indicates that signal arises from xenon atoms confined inside the pores. Namely, as the sample is slowly frozen in the NMR spectrometer most of xenon atoms squeeze out from the solidifying medium between the particles to the pores where the crystallization temperature of medium is lower than in bulk. The depressed melting point of a liquid in a pore is generally attributed to the reduced crystal size in the pore and the larger surface-to-volume ratio. On the other hand, if sample is frozen rapidly, for example by immersing it in liquid nitrogen, then xenon atoms do not squeeze out from the solid but they are occluded inside the solid lattice, and their chemical shift is very sensitive to the crystal structure. Xenon in different crystal phases of LC is analyzed in depth in Paper I. As temperature increases and raises above the melting point of bulk LC, part of xenon atoms that were trapped inside the pores squeeze out to the space between the pore particles. This is seen as a birth of signal NB and decrease in signal intensity from the pores. Symbol NB means now that the environment sampled by xenon atoms is nematic and that xenon atoms are dissolved in bulk LC. In fact, spaces between the pore particles are so large that LC behaves there as in bulk and therefore it is justified to say state to be bulk like. Part of the xenon atoms remain inside the pores and their signal is denoted by symbol IC or NC weather xenon experience isotropic or anisotropic environment, respectively. Signal NBC that is observed in the largest pore size samples (CPG 1032 and 2917) originates from xenon atoms which experience bulk like nematic environment inside the pores. As temperature further increases, the nematic-isotropic phase transition takes place and the bulk nematic phase changes to isotropic phase. This is seen as disappearing of signal NB and growing up of signals IB and IC. Signal IB originates from xenon atoms between the particles and IC from xenon atoms in the pores. Xenon experiences isotropic environment in both sites.

22
Figure 4. 129Xe NMR spectra from the 129Xe dissolved in LC Phase 4 confined to three different pore sized CPG materials as a function of reduced temperature T* = T / TNI, where TNI is nematic-isotropic phase transition temperature of bulk LC. Measurements were performed in the magnetic field of 7.05 T and the average pore diameters were (a) 81, (b) 538 and (c) 2917 Å. The effect of the magnetic field on the orientation of the LC molecules inside the largest pores (CPG 2917) is illustrated in Figure 5 where 129Xe NMR stack plots measured in the fields of 7.05 T and 11.74 T are presented.
Figure 5. 129Xe NMR spectra from 129Xe dissolved in LC Phase 4 confined to CPG porous material of average pore diameter 2917 Å as a function of reduced temperature T*. Measurements were performed in the magnetic fields of 7.05 T (a) and 11.74 T (b).

23
6.2.2 Line shape At the lowest temperatures below the bulk solid-nematic phase transition temperature only one signal is seen in CPG 81 sample (Fig. 4a). It arises from xenon atoms confined inside the pores. Because the signal is Lorentzian and relatively narrow, the phase surrounded by xenon atoms seems to be isotropic or xenon senses on average an isotropic environment inside the pores. Therefore, the signal has been denoted by symbol IC. As is seen, signal IC is observed on the whole temperature range studied. This was also the case when CPG 156 was used as a porous material. In fact, 129Xe NMR spectra measured from the CPG 81 and 156 samples did not deviated substantially from each other, and consequently explanations given below for the phenomena observed in CPG 81 sample are valid also for the CPG 156 sample in all studied magnetic fields.
It is possible that because of diffusion averaging xenon experiences on average isotropic environment inside the randomly oriented and connected pores. Terms
( )θcos2P and ( )TS in Eq. (3) would then average to zero. In a similar systems of deuterated LCs the local environment has, however, been found weakly anisotropic. These apparently dissimilar results can be explained by the fact that the self-diffusion coefficient of xenon is about one order larger than that of LC molecules55 and that faster diffusion of xenon averages out the weak local orientational order. In addition, connection points, where randomly connected pore segments join together, are closer to each other in smaller pores than in larger ones and they consequently cause more distortions to the local orientational order and director distribution in smaller pores. As bulk LC between the pore particles melts, part of xenon atoms trapped inside the pores squeeze to the bulk state between the particles producing signal NB into the spectra. Its line shape as well as chemical shift behavior as a function of temperature is similar to that observed from the sample containing only LC and 129Xe gas. This confirms that the LC between the particles behaves like in bulk. During the nematic-isotropic phase transition signal NB disappears and signal IB grows up at smaller chemical shift value. Both are symmetric and Lorentzian which indicates that xenon experiences an isotropic environment both between the pore particles as well as inside the pores. Chemical shift difference between these two sites occurs most likely from susceptibility effects. As the average pore diameter increases to 538 Å (Fig. 4b), part of the signals remains the same as in CPG 81 and 156 samples. This is not surprising because the particle size is the same in each sample, and consequently LC molecules behave similarly between the pore particles. In this case they behave like in bulk and orientate parallel with the external magnetic field in nematic phase producing signal NB into the spectra. In isotropic phase, signal IB from xenon atoms dissolved in bulk LC is seen. The line shape of the signal NC originating from xenon atoms confined inside the pores below nematic-isotropic phase transition temperature is, however, quite different from that in smaller pores inspected above. The line shape of the signal is now CSA powder pattern. The same line shape was also observed in the measurements performed in other magnetic fields. Pores are consequently large enough in diameter so that the nematic like phase can build up inside the pores. As the director of the nematic phase is parallel with the symmetry axis of pores and because there is an isotropic distribution of the pores in the sample, the resonance frequencies of the xenon atoms in different pores form an axially

24
symmetric anisotropic line shape. Magnetic field thus seems to have insignificant influence to the LC orientation inside the pores and each 129Xe nucleus experiences only one kind or a couple of different kinds of orientation distributions of LC molecules. Diffusion of xenon atoms is consequently quite slow. In addition, the effect of the connection points on the line shape of the signal seems to be quite small which is impending because their relative portion from whole pore volume is not significant. In isotropic phase, signals from two different sites now coalesce because susceptibility differences between sites are not so great anymore. When the line shape of the signal originating from xenon atoms confined inside the largest pores (CPG 1032 and 2917) is inspected in more detail, the first observation is that below the melting point of bulk LC the signal almost completely fades to the baseline of the spectra. This means, that LC starts to freeze inside the pores. As the temperature increases closer to the melting point of bulk LC, the line shape of the signal begins to take form. The line shape now consists of two parts; a CSA powder pattern denoted by symbol NC and a symmetric Lorenzian like signal NBC. Both signals were again seen also in measurements performed in higher or lower magnetic fields. The CSA powder pattern spectrum originates most probably from xenon atoms situated in the LC layer next to the pore walls. Namely, close to the surface the effect of the magnetic field on the orientation of LC molecules is minimal and consequently LC molecules are oriented parallel with the symmetry axis of pore as in CPG 538 sample producing CSA powder pattern spectra. There are three possibilities where the symmetric signal NBC could come from. Its chemical shift between chemical shifts of CSA powder pattern and Lorenzian signal from the bulk LC state indicates that there is an excess portion of LC molecules that are oriented toward applied magnetic field more than to any other direction. Signal NBC can therefore originate from xenon atoms in the middle of pores where surface forces of pore walls are smaller and where LC molecules are consequently oriented more toward the direction of external field. Diffusion rate of xenon atoms inside the pores should then be very slow in order to see separate signals from xenons in the middle of pore and at the surface of pores. Another possibility is that the signal arises from xenon atoms situated in the pores that are oriented more or less toward external field. Namely, because magnetic field and surface forces of pores orientate LC molecules to the same direction may average orientation distribution of LC molecules deviate from spherically symmetric producing observed line shape of the signal. This would naturally destroy the line shape of CSA powder pattern spectra. Third option is that the signal originates from xenon in the connection points of pore segments. As was explained above the director distribution is not unambiguously determined in the points where the pore segments join together. This could lead to isotropic like director distribution and produce symmetric isotropic-like signal. The chemical shift of xenon that experiences isotropic environment inside the pores is, however, as we will see from Fig. 7, the same as the chemical shift of CSA spectra. This means that signal NBC can not originate from xenon atoms in the connection points of pores. Most probably the signal originates from some average state of two first mentioned options.
The proportion of signal intensities of NBC and NC remains first roughly constant but as temperature increases the relative portion of NBC begins to increase (see Fig. 5). This occurs about 18 K below the bulk nematic-isotropic phase transition temperature

25
inside the largest pores (CPG 2917) in the fields of 9.39 and 11.74 T. This is a consequence of decreased magnetic coherence length and thickness of oriented surface layer as a function of temperature. In addition, as is seen from Fig. 5, signal NBC stands out from signal NC more clearly in higher fields than in lower ones which supports explanations given above for origin of signals. The width of powder pattern spectra i.e. span δδδ Δ=−=Ω ⊥|| decreases also in CPG 1032 and 2917 samples as temperature increases as it did in CPG 538 sample. The span of 129Xe powder pattern spectra observed from the CPG 2917 pores at different fields is presented as a function of reduced temperature in Fig. 6. The decrease of span as temperature is increased arises from decreasing orientational order parameter S and possible temperature dependence of chemical shift anisotropy Δδ of xenon. At the same temperature where the intensity of signal NBC starts to increase relative to signal NC the span of spectra starts to decrease because LC molecules tend to orientate more to the direction of external field inside the pores. Field-dependence of magnetic coherence length was seen the shift of temperature where the span rapidly decreases to lower values in higher fields.
0,80 0,85 0,90 0,95 1,000
2
4
6
8
10
12
14
NC
Nematic
Ω (p
pm)
T*
B0 = 7.05 T B0 = 9.39 T B0 = 11.74 T
Solid
NC
Figure 6. Span of the 129Xe powder patterns observed from the CPG 2917 pores at three different magnetic field as a function of reduced temperature T*. Vertical dash lines illustrate solid-nematic and nematic-isotropic phase transition temperatures of bulk LC.

26
6.2.3 Chemical shift The chemical shifts of 129Xe nucleus from the samples examined in Figures 4 - 5 are presented as a function of reduced temperature in Fig. 7. Chemical shifts were referenced to zero pressure xenon gas. In the case of powder pattern line shape spectra, the isotropic chemical shift value has been used.
0,80 0,85 0,90 0,95 1,00 1,05
188
192
196
200
204
208
212
216
NB
IB IsotropicNematic
NC
NC
IC
IC
IC
NBC
Che
mic
al sh
ift δ
(ppm
)
T*
CPG 81 CPG 538 CPG 2917
Solid
(a)
0,80 0,85 0,90 0,95 1,00 1,05
188
192
196
200
204
208
212
216
IsotropicNematic
NB
NBC
IC
IB
NC
Che
mic
al sh
ift δ
(ppm
)
T*
B0 = 7.05 T B0 = 9.39 T B0 = 11.74 T
NC
Solid
(b)
Figure 7. 129Xe chemical shifts of xenon dissolved in LC Phase 4 confined to CPG porous materials as a function of reduced temperature T*. The chemical shifts in (a) figure were obtained from the measurements performed in the magnetic field of 7.05 T for three different CPG porous materials (average pore diameters 81, 538, and 2917 Å). Chemical shifts obtained from the largest pore size sample (CPG 2917) in three different magnetic fields are presented in (b). Vertical dash lines illustrate solid-nematic and nematic-isotropic phase transition temperatures of bulk LC.
The chemical shift of the signal originating from CPG 81 changes very linearly as a function of temperature in the whole temperature region. This is also the case when CPG 156 is used as a porous material. This supports the earlier interpretation that the phase inside the pores remains isotropic-like below bulk isotropic-nematic phase transition temperature. In addition, no first-order nematic-isotropic phase transition was seen. Partly similar results were obtained when CPG 538 was used as a porous material. The chemical shift of the signal NC changes also linearly as a function of temperature and in the nematic-isotropic phase transition small jump in the chemical shift curve was detected. The small discontinuation point in the curve stems from the fact that in the isotropic phase signals IC and IB can not be resolved and therefore observed chemical shift of the signal is average of these two. In even larger pore systems (CPG 1032 and 2917) signal NBC emerges in addition to signal NC in nematic phase. The chemical shift behavior of signal NC does not deviated from that observed in CPG 538, but small field-dependence was observed in the chemical shift behavior of signal NBC. Especially, close to nematic-isotropic phase transition temperature the chemical shifts of the signal NBC started to curve toward values observed from the bulk LC state in CPG 2917 sample indicating remarkable changes in the orientation distribution of LC molecules toward external field. The same phenomenon was also observed in the chemical shift of signal NC. In addition, the bulk like first-order nematic-isotropic phase transition was detected to take place inside the pores in the largest field.

27
6.3 Heteronuclear spin systems as probe molecules In this chapter, results from the experiments where 13C NMR spectroscopy and methyl iodide molecules were used as probe molecules to characterize liquid crystals in porous material are summarized. Used LC was the same as in 129Xe NMR studies described in the previous chapter, but in this case, the average pore diameter of the CPG material varied between 81 and 375 Å.
6.3.1 Spectra In Fig. 8 three 13C NMR stack plots from the samples containing CPG porous material, LC, 13CH3I and 13CH4 is presented as a function of reduced temperature T*. The average pore diameters are 81, 237 and 375 Å. The measurements were performed in the magnetic field of 4.70 T from low to high temperature. In the assignment procedure of the signals, the same model has been used as in the respective xenon studies described in chapter 6.2.1. Again inspection can be divided into three different categories according to the phases of bulk LC at the studied temperature range. At the lowest temperatures bulk LC is frozen between the pore particles and methyl iodide as well as methane molecules are squeezed inside the pores from the solidifying medium. Consequently, the only signal that is seen in the spectra below the melting point of bulk LC originates from methyl iodide (and methane) molecules confined inside the pores. This signal is labeled by symbol IC or NC in Fig. 8. As bulk LC melts, part of solute molecules trapped inside the pores, squeezes to the liquid state between the pore particles and produce signal NB to the spectra. As the methyl iodide concentrations inside the pores decreases naturally intensities of signals IC and NC decrease as well. Above clearing point, signal NB disappears and in isotropic phase two signals are seen, one from methyl iodide confined inside the pores (IC) and another one from molecules between the particles (IB). The chemical shift difference between these signals is, however, so small that they cannot be resolved in Fig. 8 but separate signals can easily be observed from the proton decoupled spectra. The effect of the magnetic field on the orientation of the LC molecules inside the largest pores is illustrated in Fig. 9 where 13C NMR stack plots from the CPG 375 sample measured in the fields of 4.70 T and 11.74 T are presented.

28
Figure 8. 13C NMR spectra from the 13CH3I dissolved in LC Phase 4 confined to three different pore sized CPG materials as a function of reduced temperature T*. Measurements were performed in the magnetic field of 4.70 T and the average pore diameters were (a) 81, (b) 237 and (c) 375 Å.
Figure 9. 13C NMR spectra from 13CH3I dissolved in LC Phase 4 confined to CPG porous material of average pore diameter 375 Å as a function of reduced temperature T*. Measurements were performed in the magnetic fields of 4.70 T (a) and 11.74 T (b).

29
6.3.2 Line shape At the lowest temperatures, the spectrum arising from the methyl iodide confined to the smallest pores (CPG 81) is a quartet, where the spacing between the adjacent peaks is equal and about 150 Hz. This value is within error limits the same as the 13C – 1H spin-spin coupling constant of methyl iodide56,57. Consequently, we can conclude that the phase sampled by methyl iodide molecules below the bulk solid-nematic phase transition temperature inside the smallest pores is on average isotropic. In fact, as can be seen from Fig. 8a, the same quartet denoted by the symbol IC, is observed over the whole temperature range studied. This was also the case when CPG 156 was used as a porous material. As bulk LC melts and part of methyl iodide molecules squeezes from the pores to the liquid state between the particles, they produce a new signal, denoted by the symbol NB, to the spectra. The signal NB is also a quartet and the spacing between the peaks is now |2DCH + JCH| where DCH is dipolar coupling and JCH is the spin-spin coupling between carbon and proton in methyl iodide. The nonzero DCH confirms that there is a preferential molecular orientation and that environment is anisotropic. As temperature increases, JCH seems to stay practically constant but DCH decreases because it is directly proportional to the second-rank orientational order parameter Szz of methyl iodide. As bulk nematic phase changes to isotropic, signal NB disappears and two isotropic quartets that partly coalesce in the spectra are seen from methyl iodide in two different sites. When spectra measured from the methyl iodide confined to CPG 237 porous material (Fig. 8b) are compared to those obtained from CPG 81 sample, a lot of similarities are seen. This is quite impending because particle sizes are equal and consequently also the spaces between the particles are of the same size. Therefore, LC as well as methyl iodide molecules behave similarly between the pore particles in each sample. The line shape of the signal originating from methyl iodide confined inside the pores below the bulk nematic-isotropic phase transition temperature, denoted by symbol NC, is, however, quite different from the corresponding signal observed in CPG 81 sample (signal IC). Most probably the average length of the pore segments is sufficiently long so that the environment sampled by methyl iodide molecules during the NMR measurements is not isotropic but anisotropic. Consequently, observed line shape of the signal would resemble a 13C powder pattern of methyl iodide. As the average pore diameter increases to 375 Å (Fig. 8c) the line shape of the signal NC changes to even more complex than it was in CPG 237 sample. The line shape may be affected by an increased orientation distribution of LC molecules to the direction of external magnetic field in the pores. Fig. 9, where 13C NMR stack plots from CPG 375 sample measured in the fields of 4.70 T and 11.74 T are presented, seems to support this assumption. Namely, as can be seen from the figure, the line shape of the signal NC changes remarkably as the field strength is altered. High magnetic field thus has a significant contribution to the orientation of LC molecules inside the pores. Furthermore, the evolution of the line shape of the signal as a function of temperature is quite intensive. That is, in the field of 11.74 T and about 12 K below nematic-isotropic phase transition temperature, a smaller quartet comes up in the spectra. Emergence of the quartet indicates that all LC molecules are not oriented parallel with the pore axis, but there is a significant portion of LC molecules that are oriented toward applied magnetic

30
field. This is a clear evidence of the decrease of the magnetic coherence length at higher temperatures. In the smaller fields, where the magnetic coherence length is longer, the quartet arises about 6 K and 3 K below the nematic-isotropic phase transition temperature in the fields of 9.40 T and 7.05 T, respectively.
6.3.3 Chemical shift The 13C chemical shifts of 13CH3I obtained from the proton-decoupled spectra from the samples examined in Figures 8 - 9 are presented as a function of reduced temperature in Fig. 10. A proton decoupling was applied in chemical shift determination measurements. This improves the signal-to-noise ratio, reduces measurement time and enables to pick signal position more accurately, especially if part of the signals overlap in nondecoupled spectrum. Interpretation of the chemical shift data supports the explanations given above for the behavior of LCs in CPG porous material. Linear chemical shift versus temperature behavior of signals IC from CPG 81 and 156 samples in nematic phase together with the isotropic quartet observed in the nondecoupled carbon spectra confirms that the effect of the magnetic field on the orientation of LC molecules inside the pores is relatively small and that the solute molecules experience on average isotropic environment inside the pores. Chemical shift of the signal NC from CPG 237 sample changes also linearly when temperature is changed in nematic phase, but asymmetric line shape indicates that the average orientational order parameter of the methyl iodide is not zero. Pore segments are consequently sufficiently long so that Szz does not completely average out due to diffusion averaging or irregularities, caused by the surface deformations are smaller in larger pores. Curving of the chemical shift of the signal from the CPG 375 sample slightly upward in the field of 4.70 T indicates that the torque of the magnetic field is strong enough to slightly orientate the director toward the field in the pores (Fig. 10a). In the higher field strengths clear curving of the chemical shift toward the values observed from methyl iodide in bulk LC state is seen. Curving starts at lower temperatures in higher fields because magnetic coherence length is inversely proportional to the field strength (Fig. 10b). Surprisingly, unlike in 129Xe NMR studies, a clear discontinuity point in the chemical shift curve is seen to take place in all samples at the bulk nematic-isotropic phase transition temperature. The discontinuity seems to be the bigger the bigger is the average pore size and it was also observed when measurements were performed from isotropic to nematic phase. This means that a bulk like first order nematic-isotropic phase transition takes place inside the pores, phenomenon that has not been observed earlier in such restrictive hosts. The pore diameter should be larger than the nematic correlation length to see first-order nematic-isotropic transition and typically this length is around 150 Å. One possible explanation for the observed phenomenon could be bigger relative concentration of methyl iodide compared to that of xenon in the sample. Bigger solute concentration affects also the phase transition temperatures of bulk LC. Namely, according to the LC manufacturer, the nematic range of Phase 4 is 293-347 K, but in our measurements solid-nematic phase transition temperature shifts 4-6 K to lower
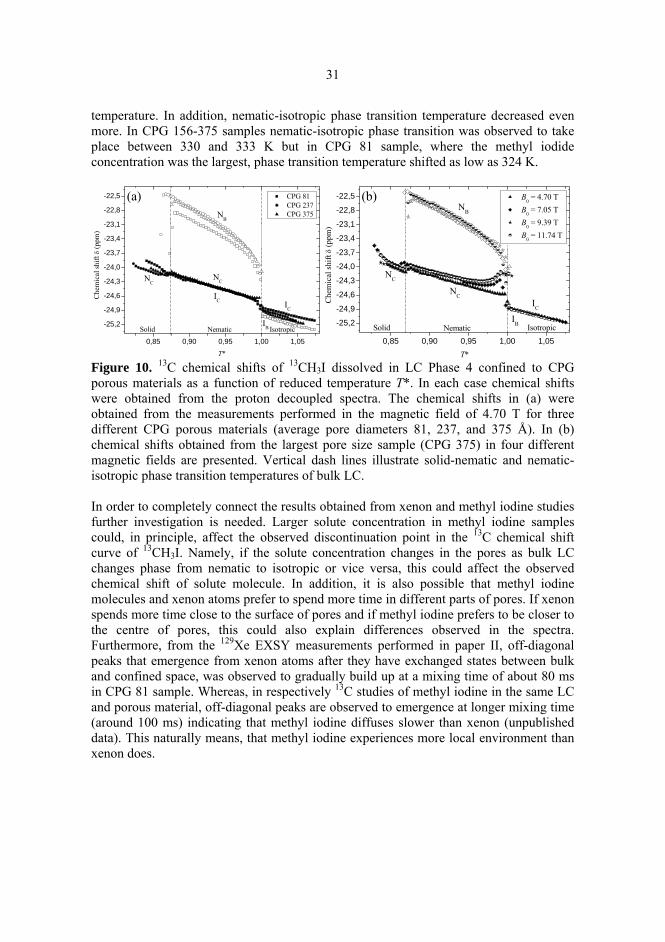
31
temperature. In addition, nematic-isotropic phase transition temperature decreased even more. In CPG 156-375 samples nematic-isotropic phase transition was observed to take place between 330 and 333 K but in CPG 81 sample, where the methyl iodide concentration was the largest, phase transition temperature shifted as low as 324 K.
0,85 0,90 0,95 1,00 1,05
-25,2
-24,9
-24,6
-24,3
-24,0
-23,7
-23,4
-23,1
-22,8
-22,5
IB
IC
NB
NCNC
IsotropicNematic
Che
mic
al sh
ift δ
(ppm
)
T*
CPG 81 CPG 237 CPG 375
Solid
IC
(a)
0,85 0,90 0,95 1,00 1,05
-25,2
-24,9
-24,6
-24,3
-24,0
-23,7
-23,4
-23,1
-22,8
-22,5
IB
IC
NC
NC
IsotropicNematicC
hem
ical
shift
δ (p
pm)
T*
B0 = 4.70 T B0 = 7.05 T B0 = 9.39 T B0 = 11.74 T
Solid
NB
(b)
Figure 10. 13C chemical shifts of 13CH3I dissolved in LC Phase 4 confined to CPG porous materials as a function of reduced temperature T*. In each case chemical shifts were obtained from the proton decoupled spectra. The chemical shifts in (a) were obtained from the measurements performed in the magnetic field of 4.70 T for three different CPG porous materials (average pore diameters 81, 237, and 375 Å). In (b) chemical shifts obtained from the largest pore size sample (CPG 375) in four different magnetic fields are presented. Vertical dash lines illustrate solid-nematic and nematic-isotropic phase transition temperatures of bulk LC. In order to completely connect the results obtained from xenon and methyl iodine studies further investigation is needed. Larger solute concentration in methyl iodine samples could, in principle, affect the observed discontinuation point in the 13C chemical shift curve of 13CH3I. Namely, if the solute concentration changes in the pores as bulk LC changes phase from nematic to isotropic or vice versa, this could affect the observed chemical shift of solute molecule. In addition, it is also possible that methyl iodine molecules and xenon atoms prefer to spend more time in different parts of pores. If xenon spends more time close to the surface of pores and if methyl iodine prefers to be closer to the centre of pores, this could also explain differences observed in the spectra. Furthermore, from the 129Xe EXSY measurements performed in paper II, off-diagonal peaks that emergence from xenon atoms after they have exchanged states between bulk and confined space, was observed to gradually build up at a mixing time of about 80 ms in CPG 81 sample. Whereas, in respectively 13C studies of methyl iodine in the same LC and porous material, off-diagonal peaks are observed to emergence at longer mixing time (around 100 ms) indicating that methyl iodine diffuses slower than xenon (unpublished data). This naturally means, that methyl iodine experiences more local environment than xenon does.
31
temperature. In addition, nematic-isotropic phase transition temperature decreased even more. In CPG 156-375 samples nematic-isotropic phase transition was observed to take place between 330 and 333 K but in CPG 81 sample, where the methyl iodide concentration was the largest, phase transition temperature shifted as low as 324 K.
0,85 0,90 0,95 1,00 1,05
-25,2
-24,9
-24,6
-24,3
-24,0
-23,7
-23,4
-23,1
-22,8
-22,5
IB
IC
NB
NCNC
IsotropicNematic
Che
mic
al sh
ift δ
(ppm
)
T*
CPG 81 CPG 237 CPG 375
Solid
IC
(a)
0,85 0,90 0,95 1,00 1,05
-25,2
-24,9
-24,6
-24,3
-24,0
-23,7
-23,4
-23,1
-22,8
-22,5
IB
IC
NC
NC
IsotropicNematic
Che
mic
al sh
ift δ
(ppm
)
T*
B0 = 4.70 T B0 = 7.05 T B0 = 9.39 T B0 = 11.74 T
Solid
NB
(b)
Figure 10. 13C chemical shifts of 13CH3I dissolved in LC Phase 4 confined to CPG porous materials as a function of reduced temperature T*. In each case chemical shifts were obtained from the proton decoupled spectra. The chemical shifts in (a) were obtained from the measurements performed in the magnetic field of 4.70 T for three different CPG porous materials (average pore diameters 81, 237, and 375 Å). In (b) chemical shifts obtained from the largest pore size sample (CPG 375) in four different magnetic fields are presented. Vertical dash lines illustrate solid-nematic and nematic-isotropic phase transition temperatures of bulk LC. In order to completely connect the results obtained from xenon and methyl iodine studies further investigation is needed. Larger solute concentration in methyl iodine samples could, in principle, affect the observed discontinuation point in the 13C chemical shift curve of 13CH3I. Namely, if the solute concentration changes in the pores as bulk LC changes phase from nematic to isotropic or vice versa, this could affect the observed chemical shift of solute molecule. In addition, it is also possible that methyl iodine molecules and xenon atoms prefer to spend more time in different parts of pores. If xenon spends more time close to the surface of pores and if methyl iodine prefers to be closer to the centre of pores, this could also explain differences observed in the spectra. Furthermore, from the 129Xe EXSY measurements performed in paper II, off-diagonal peaks that emergence from xenon atoms after they have exchanged states between bulk and confined space, was observed to gradually build up at a mixing time of about 80 ms in CPG 81 sample. Whereas, in respectively 13C studies of methyl iodine in the same LC and porous material, off-diagonal peaks are observed to emergence at longer mixing time (around 100 ms) indicating that methyl iodine diffuses slower than xenon (unpublished data). This naturally means, that methyl iodine experiences more local environment than xenon does.

32
6.4 Shielding anisotropy determination It became evident from the previous chapter that methyl iodide molecules experience on average an isotropic environment in LCs confined inside the smallest pores of CPG material within the whole temperature range studied. In contrast, in the spaces between the pore particles, LCs behave as in bulk. Consequently, isotropic value of the shielding tensor can be determined at exactly the same temperature and experimental condition as anisotropic counterpart is detected. Thus this method enables, for the first time in the solution state, the determination of shielding anisotropy of solute molecule as a function of temperature. In conventional LC NMR methods information of the possible variation of the tensorial properties with temperature can hardly be obtained for heteronuclear spin systems in anisotropic phase because the anisotropic and isotropic tensorial properties sum up and they can not be separated without some assumptions. For example, the spin-spin coupling constant between a heteronuclear pair (K, L) may substantially depend upon solvent and temperature. Then because only quantity |2DKL + JKL| is obtainable from the NMR spectrum at anisotropic phase, possible uncertainty in JKL value affects the DKL value which is used to determination of orientational order parameter of dissolved molecule (see Eq. (5)). Another inconvenience arises from the reliable determination of the isotropic chemical shift, which is usually temperature dependent. Both of these are needed in the determination of the anisotropy of shielding tensor. Consequently, in order to get more ‘correct’ shielding anisotropy values one should be able to measure all the relevant quantities in the same solution and at the same temperature. 13C shielding anisotropies of 13CH3I dissolved in Phase 4 confined to CPG 81, 156 and 237 porous materials, are presented as a function of reduced temperature T* in Fig. 11. Shielding anisotropies were determined with respect to internal 13C reference of 13CH4 methane gas because the chemical shift difference of the methane signals from the anisotropic and isotropic phases changed as a function of temperature. By using internal 13C chemical shift reference majority of the bulk effects and also part of the local effects were eliminated. Shielding anisotropy values are mainly within -25 to -35 ppm and in good agreement with values obtained by other means. Symbol (A) in Fig. 11 refers to the shielding anisotropy value obtained from the ENEMIX method (mixture of Phase 4 and ZLI 1167)56, symbol (B) to the value obtained from the mixture of Phase 4 and ZLI 113258, and symbol (C) is computed theoretical value (multiconfiguration self-consistent field, MCSCF)59. Shielding tensor was observed to be temperature dependent. Shielding anisotropy became less negative as temperature increased and the growth rate was 0.12-0.18 ppmK-1. Larger methyl iodide concentration in CPG 81 sample affected also the shielding anisotropy value obtained from 13CH3I.

33
0,86 0,88 0,90 0,92 0,94 0,96 0,98 1,00-40
-35
-30
-25
-20
-15
(C)
(B)
Shie
ldin
g an
isot
ropy
Δσ
(ppm
)
T*
CPG 81 CPG 156 CPG 237
(A)
Figure 11. 13C shielding anisotropy of 13CH3I confined to CPG 81-237 porous materials in Phase 4 LC as a function of reduced temperature T*. All shielding anisotropy values were determined by using internal 13CH4 methane reference. Symbols (A), (B) and (C) refer to the shielding anisotropy values obtained by other means, see the text.
7. Conclusions The present thesis shows that solute molecules dissolved in a liquid crystal medium can give versatile information about the behavior of liquid crystals in confined spaces by means of nuclear magnetic resonance spectroscopy. 129Xe isotope enriched xenon gas and 13C isotope enriched methyl iodide were used as probes to characterize liquid crystals in controlled pore glasses by utilizing 129Xe and 13C NMR spectroscopy. Liquid crystal medium inside the pores slows down diffusion of xenon and methyl iodide molecule, and consequently the observed resonance signal from the probe nucleus is characteristic to the local properties of the material. The sum of all resonances in the region of the NMR coil reflects therefore distribution of certain properties of the sample. In this work, specific attention has been placed on explanations how pore size, space geometry of porous material, magnetic field strength, solvent concentration and temperature affect the director distribution and orientation order of liquid crystal molecules inside the pores. The average pore diameter of the materials varied from 81 to 2917 Å. Measurements were performed in four different magnetic field strengths from 4.70 to 11.74 T and studied temperature range covered solid, nematic and isotropic phases of bulk liquid crystal. Uniaxial Merck Phase 4 thermotropic liquid crystal was used. The chemical shifts, intensities and line shapes of the resonances from the solutes contain lots of information about the effect of confinement on the state of the liquid crystal. Both 129Xe NMR studies of xenon gas as well as 13C NMR studies of methyl iodide indicate that liquid crystal molecules do not form nematic phase inside the

34
smallest pores (average pore diameter 81 or 156 Å) but the state remains isotropic like. In fact, the state of liquid crystals inside the pores was observed to be isotropic-like on the whole temperature range studied, also below the crystallization temperature of bulk liquid crystal. Both methods also confirmed that liquid crystal molecules behave like in bulk between the pore particles on the whole temperature range studied. 129Xe NMR experiments show that liquid crystals in the pores of average pore diameter 538 Å nematic phase builds up inside the pores. Line shape of the signal is a CSA powder pattern which indicates that liquid crystal molecules are oriented parallel with the pore axis and that orientation distribution of pores is isotropic in the sample. Neither chemical shift nor line shape of the spectra indicated any significant influence of external magnetic field to the orientation of liquid crystal molecules. Instead, in larger pores where the average pore diameter of the material is 1032 and 2917 Å the effect of the magnetic field on the orientation of liquid crystal molecules inside the pores was seen as a separate, well resolved signal in the spectra. In addition, also the line shapes and chemical shifts of signals originating from xenon atoms in the pores changed as a function of temperature and the changes were the greater the greater was the magnetic field used. Furthermore, in the largest pore size sample at the largest magnetic field used first-order nematic-isotropic phase transition was detected to take place inside the pores. According to 13C NMR measurements methyl iodide molecules seem to be much more sensitive to the local environment than xenon atoms. Namely, changes taking place in liquid crystal orientation distribution in the pores were clearly seen in the chemical shift and line shape of the signal. By varying experimental conditions the relative contribution of the field and the surface forces of pore walls to the orientation of liquid crystal molecules inside the pores were seen to change quite drastically. What was surprising is that these drastic changes were observed to occur as a function of temperature and magnetic field in the pores which were as small as 375 Å in average diameter. In addition, at the nematic-isotropic phase transition temperature first-order nematic-isotropic phase transition was observed to take place inside the pores of all studied samples with the average pore diameter of the material varying from 81 to 375 Å. Properties of liquid crystals always change to some extent when non-nematic solutes are added to it. This is seen in shifting of the phase transition temperatures and decrease in orientation order of liquid crystal. In the present case, both solid-nematic as well as nematic-isotropic phase transition temperatures of bulk liquid crystal were shifted about 4 K to lower values when xenon gas was added to the sample. The bulk solid-nematic phase transition temperature was the same also when methyl iodide and methane were used as solutes. The nematic-isotropic phase transition temperatures were, however, shifted much more than in the respective xenon studies. Namely, phase transitions occurred generally at about 15 K lower temperature than announced by liquid crystal manufacturer. In the smallest pore diameter sample, where the concentration of solutes was slightly larger, clearing temperature shifted about 23 K to lower values. Consequently, special attention has to put on amount of solutes added to the sample in order to keep perturbation effects as small as possible. As an extra observation, because methyl iodide experienced isotropic environment inside the smallest pores and anisotropic environment between the pore particles, shielding anisotropy could be determined as a function of temperature for first time in solution state.

35
In summary, this thesis proves that versatile information about liquid crystal orientation behavior inside the pores can be obtained by using solute molecules and atoms as probes. Consequently deuterated liquid crystals are not necessarily needed any more in this kind of studies. Further investigation is, however, needed in order to completely connect the present results derived by two different probes and to find answers to remaining open questions. Similar studies, for example, in Anopore systems in which all pores are parallel with each other, would most probably help to understand the observed phenomena in more detail. In addition, it would be of great help in developing theoretical models for line shape simulations.

36
References 1 F. Reinitzer, Monatsch. Chem., 9 (1888) 421. English translation of this paper: Liq. Cryst., 5 (1989) 7. 2 M. H. Levitt, Spin Dynamics: Basics of Nuclear Magnetic Resonance, John Wiley & Sons, Chichester, (2001). 3 A. Abragam, The Principles of Nuclear Magnetism, Oxford University Press, San Diego (1961). 4 R. R. Ernst, G. Bodenhausen and A Wokaun, Principles of Nuclear Magnetic Resonance in One and Two Dimensions, Oxford University Press, Oxford (1987). 5 H. W. Long, M. Luzar, H. C. Gaede, R. G. Larsen, J. Kritzenberger, A. Pines and G. P. Crawford, J. Phys. Chem., 99 (1995) 11989. 6 J. Cavanagh, Protein NMR Spectroscopy: Principles and Practise, Academic press, San Diego, (1996). 7 J. Jokisaari in: NMR of Ordered Liquids, Eds. E. E. Burnell and C. A. de Lange, Kluwer Academic Publishers, 109, (2003). 8 D. Raftery, Annu. Rep. NMR Spectrosc., 57 (2006) 205. 9 J. Jokisaari, Prog. in NMR Spec., 26 (1994) 1. 10 C. I. Ratcliffe, Annu. Rep. NMR Spectrosc., 36 (1998) 124. 11 A. Cherubini and A. Bifone, Prog. in NMR Spec., 42 (2003) 1. 12 E. Klarreich, Nature, 424 (2003) 873. 13 C. J. Jameson, J. Chem. Phys., 63 (1975) 5296. 14 A. K. Jameson, C. J. Jameson and H. S. Gutowsky, J. Chem. Phys., 53 (1970) 2310. 15 J. Jeener, B. H. Meier, P. Bachmann and R. R. Ernst, J. Chem. Phys., 71 (1979), 4546. 16 J. Kärger and D. M. Ruthven, Diffusion in Zeolites and Other Microporous Solids, John Wiley & Sons, New York, (1992). 17 J. J. Delpuech, Dynamics of Solutions and Fluid Mixtures by NMR, John Wiley & Sons, Chichester, (1995). 18 P. G. de Gennes, The Physics of Liquid Crystals, Clarendon Press, Oxford, (1974). 19 D. Demus, J. Goodby, G. W. Gray, H.-W. Spiess and V. Vill, Handbook of Liquid Crystals: Vol 1: Fundamentals, Wiley-VCH, Weinheim, (1998). 20 A. Jákli and A. Saupe, One- and Two-Dimensional Fluids: Properties of Smectic, Lamellar and Columnar Liquid Crystals, Taylor & Francis, New York, (2006). 21 S. Chandrasekhar, Liquid Crystals, Cambridge University Press, Cambridge, (1977). 22 H. Stegemeyer and Guest ed., Liquid Crystals, Springer, Darmstadt, (1994). 23 R. Y. Dong, Nuclear Magnetic Resonance of Liquid Crystals, Springer-Verlag, New York, (1994). 24 W. H. de Jeu, Physical Properties of Liquid Crystalline Materials, Gordon and Breach Science Publishers, New York, (1980). 25 A. D. Buckingham, T. Schaefer and W. G. Schneider, J. Chem. Phys., 32 (1960) 1227. 26 F. H. A. Rummens, Van der Waals Forces and Shielding Effects. In: P. Diehl, E. Fluck and R. Kosfeld (eds) NMR Basic Principles and Progress 10, Springer-Verlag, Berlin (1975). 27 M. Ylihautala, J. Lounila and J. Jokisaari, J. Chem. Phys., 110 (1999) 6381. 28 J. Jokisaari, Y. Hiltunen and J. Lounila, J. Chem. Phys., 85 (1986) 3198.
37
29 F. A. L. Dullien, Porous Media: Fluid Transport and Pore Structure, Academic Press, New York (1979). 30 F. Rouquerol, J. Rouquerol and K. Sing, Adsorption by Powders & Porous Solids, Academic Press, London (1999). 31 S. J. Gregg, Adsorption, Surface Area and Porosity, Academic Press, London (1967). 32 F. A. L. Dullien, Porous Media, Fluid Transport and Pore Structure, 1st edition, Academic Press, New York, (1979). 33 G. Q. Lu, Nanoporous Materials: Science and Engineering, Imperial College Press London (2004). 34 International Union of Pure and Applied Chemistry Physical Chemistry Division Commission on Colloid and Surface Chemistry, Subcommittee on Characterization of Porous Solids: “Recommendations for the characterization of porous solids (Technical Report)”, Pure Appl. Chem., 66 (1994) 1739. 35 P. A. Webb and C. Orr, Analytical Methods in Fine Particle Technology, Micromeritics Instrument Corporation, Norcross, GA USA, (1997). 36 W. Haller, J. Chem. Phys., 42 (1965) 686. 37 C. J. Brinker and G. W. Scherer, Sol-Gel Science, Academic Press, San Diego (1990). 38 W. Haller, Nature, 4985 (1965) 693. 39 G. P. Crawford and S. Žumer, Liquid Crystals in Complex Geometries Formed by Polymer and Porous Networks, Taylor & Francis, London (1996). 40 S. Kralj, A. Zidanšek, G. Lahajnar, I. Muševič, S. Žumer, R. Blinc and M. M. Pintar, Phys. Rev. E, 53 (1996) 3629. 41 A. Zidanšek, G. Lahajnar and S. Kralj, Appl. Magn. Reson., 27 (2004) 1. 42 A. Zidanšek, S. Kralj, R. Repnik, G. Lahajnar, M. Rappolt, H. Amenitsch and S. Berndtroff, J. Phys.: Condens. Matter, 12 (2000) 431. 43 T. J. Sluckin and A. Poniewierski In: Fluid Interfacial Phenomena, Ed. C. A. Croxton, Wiley, New York, (1986). 44 C.-J. Yu, A. G. Richter, A. Datta, M. K. Durbin and P. Dutta, Phys. Rev. Lett., 82 (1999) 2326. 45 Y. Guo, K. H. Langley and F. E. Karasz, Phys. Rev. B, 50 (1994) 3400. 46 G. S. Iannacchione, G. P. Crawford, S. Žumer, J. W. Doane and D. Finotello, Phys. Rev. Lett, 71 (1993) 2595. 47 G. S. Iannacchione, S. Qian, D. Finotello and F. M. Aliev, Phys. Rev. E, 56 (1997) 554. 48 S. Kralj, G. Lahajnar, A. Zidanšek, N. Vrbančič-Kopač, M. Vilfan, R. Blinc and M. Kosec, Phys. Rev. E, 48 (1993) 340. 49 G. S. Iannacchione, G. P. Crawford, S. Qian, J. W. Doane and D. Finotello, Phys. Rev. E, 53 (1996) 2402. 50 G. S. Iannacchione and S. Qian, D. Finotello, Phys. Rev. E, 50 (1994) 4780. 51 Z. Kutnjak, S. Kralj, G. Lahajnar and S. Žumer, Phys. Rev. E, 68 (2003), 21705. 52 B. Kronberg, D. F. R. Gilson and D. Patterson, J. Chem. Soc., Faraday Trans. 2, 72 (1976) 1673. 53 D. E. Martire, In: The Molecular Physics of Liquid Crystals, eds. G. R. Luckhurst and G. W. Gray, Academic Press, Kent (1979). 54 A. S Taggar, C. J. Campbell, A. Yethiraj and E. E. Burnell, J. Phys. Chem. B, 110 (2006) 1363.

38
55 M. Vilfan, T. Apih, A. Gregoroviè, B. Zalar, G. Lahajnar, S. Zumer, G. Hinze, R. Böhmer and G. Althoff, Magn. Res. Im., 19 (2001) 433. 56 Y. Hiltunen, Molec. Phys. 62 (1987) 1187. 57 T. Väänänen, J. Jokisaari and M. Seläntaus, J. Magn. Reson., 72 (1987) 414. 58 A. Kantola, personal communication. 59 J. Vaara, K. Oikarinen, J. Jokisaari and J. Lounila, Chem. Phys. Lett., 253 (1996) 340.

39
Original papers
I Reproduced with permission from the Journal of Physical Chemistry B, Tallavaara P, Telkki V-V & Jokisaari J. Behavior of a Thermotropic Nematic Liquid Crystal Confined to Controlled Pore Glasses as Studied by 129Xe NMR Spectroscopy. 110: 21603-21612. Copyright (2006) American chemical society.
II Reproduced with permission from Physical Chemistry Chemical Physics,
Tallavaara P & Jokisaari J. 2D 129Xe EXSY of Xenon Atoms in a Thermotropic Liquid Crystal Confined to a Controlled Pore Glass. 8: 4902-4907. Copyright (2006) Royal Society of Chemistry.
III Reproduced with permission from the Journal of Physical Chemistry B,
Tallavaara P & Jokisaari J. Behavior of Liquid Crystals Confined to Mesoporous Materials as Studied by 13C NMR Spectroscopy of Methyl Iodide and Methane as Probe Molecules. 112: 764-775. Copyright (2008) American chemical society.
IV Reproduced with permission from Physical Chemistry Chemical Physics,
Tallavaara P & Jokisaari J. An Alternative NMR Method to Determine Nuclear Shielding Anisotropies in Liquid-Crystalline Solutions with 13C Shielding Anisotropy of Methyl Iodide as an Example. 10: 1681-1687. Copyright (2008) Royal Society of Chemistry.


![NMR imaging of moisture inside heated porous building ... · neutron-beam attenuation [11{15], and Nuclear Magnetic Resonance imaging (NMR) [6, 16, 17] are examples of these methods](https://img.pdfslide.us/doc/110x75/5fa056d7c4ecc408e7045662/nmr-imaging-of-moisture-inside-heated-porous-building-neutron-beam-attenuation.jpg)