Embed Size (px)
Citation preview
1
© 2
017
Bak
er H
ughe
s In
corp
orat
ed. A
ll R
ight
s R
eser
ved.
© 2017 BAKER HUGHES INCORPORATED. ALL RIGHTS RESERVED. TERMS AND CONDITIONS OF USE: BY ACCEPTING THIS DOCUMENT, THE RECIPIENT AGREES THAT THE DOCUMENT TOGETHER WITH ALL INFORMATION INCLUDED THEREIN IS THE
CONFIDENTIAL AND PROPRIETARY PROPERTY OF BAKER HUGHES INCORPORATED AND INCLUDES VALUABLE TRADE SECRETS AND/OR PROPRIETARY INF ORMATION OF BAKER HUGHES (COLLECTIVELY " INFORMATION"). BAKER HUGHES RETAINS ALL RIGHTS
UNDER COPYRIGHT LAWS AND TRADE SECRET LAWS OF THE UNITED STATES OF AMERICA AND OTHER COUNTRIES. THE RECIPIENT FURTHER AGREES TH AT THE DOCUMENT MAY NOT BE DISTRIBUTED, TRANSMITTED, COPIED OR REPRODUCED IN WHOLE OR
IN PART BY ANY MEANS, ELECTRONIC, MECHANICAL, OR OTHERWISE, WITHOUT THE EXPRESS PRIOR WRITTEN CONSENT OF BAKER HUGHES, AND MA Y NOT BE USED DIRECTLY OR INDIRECTLY IN ANY WAY DETRIMENTAL TO BAKER HUGHES’ INTEREST.
Understanding NMR Geoff Page
Baker Hughes Region Petrophysics Advisor
2
© 2
017
Bak
er H
ughe
s In
corp
orat
ed. A
ll R
ight
s R
eser
ved.
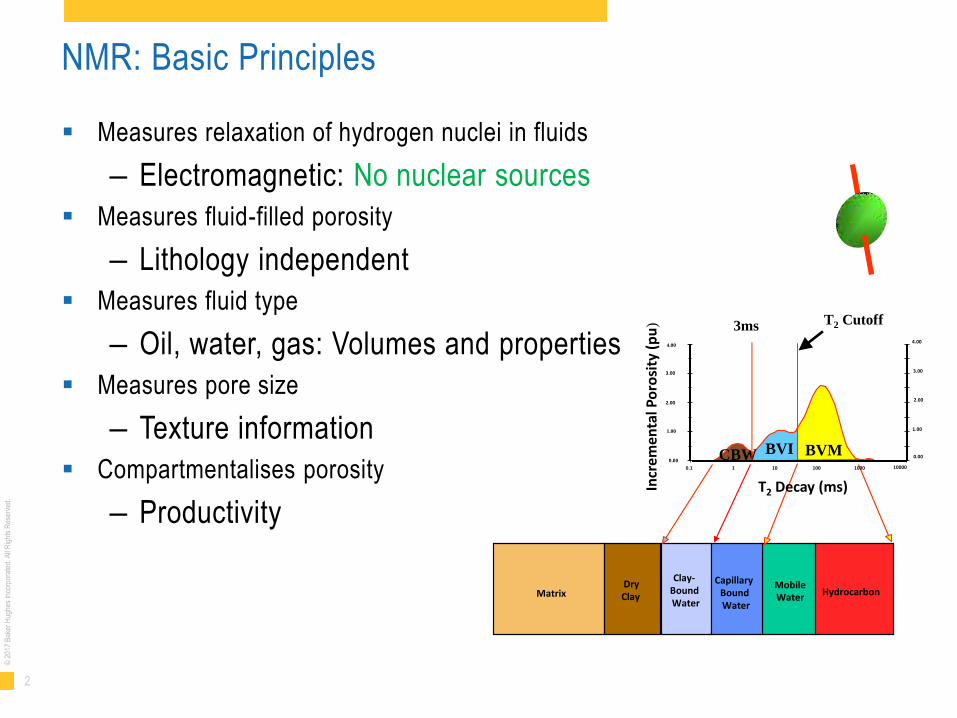
NMR: Basic Principles
Measures relaxation of hydrogen nuclei in fluids
– Electromagnetic: No nuclear sources
Measures fluid-filled porosity
– Lithology independent
Measures fluid type
– Oil, water, gas: Volumes and properties
Measures pore size
– Texture information
Compartmentalises porosity
– Productivity
Matrix
Dry
Clay
Clay- Bound
Water
Mobile
Water
Capillary
Bound
Water
Hydrocarbon
BVI BVM
4.00
0.00
1.00
2.00
3.00
0.00
1.00
2.00
3.00
4.00
Incr
emen
tal P
oro
sity
(p
u)
CBW 10000 0.1 1 10 100 1000
T2 Decay (ms)
T2 Cutoff 3ms

3
© 2
017
Bak
er H
ughe
s In
corp
orat
ed. A
ll R
ight
s R
eser
ved.
Magnetic Resonance
4
© 2
017
Bak
er H
ughe
s In
corp
orat
ed. A
ll R
ight
s R
eser
ved.
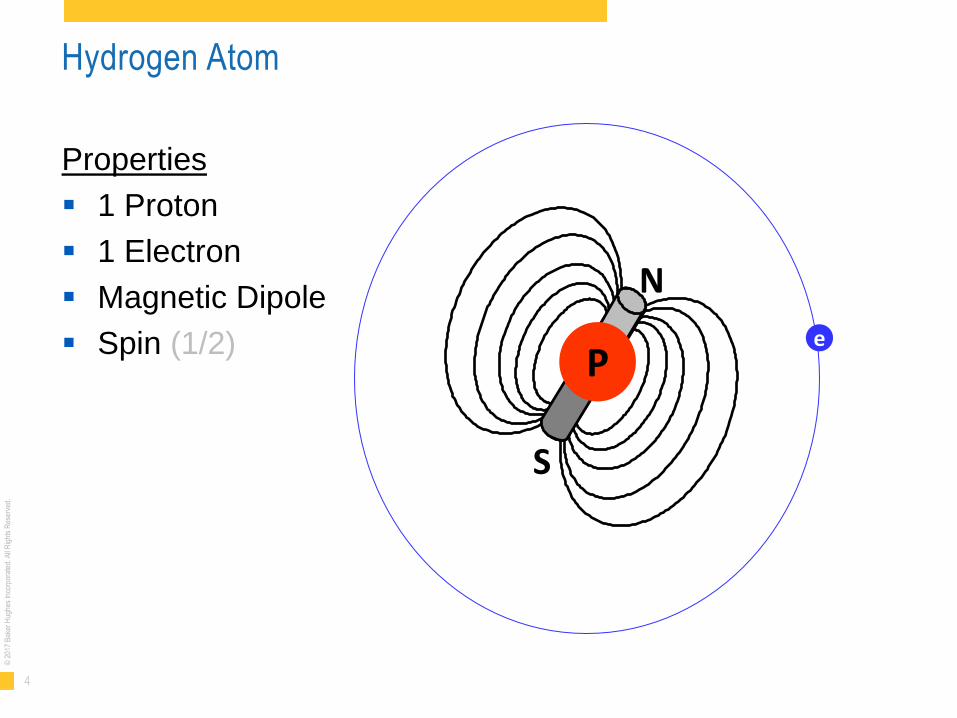
Hydrogen Atom
N
S
P e
Properties
1 Proton
1 Electron
Magnetic Dipole
Spin (1/2)
5
© 2
017
Bak
er H
ughe
s In
corp
orat
ed. A
ll R
ight
s R
eser
ved.
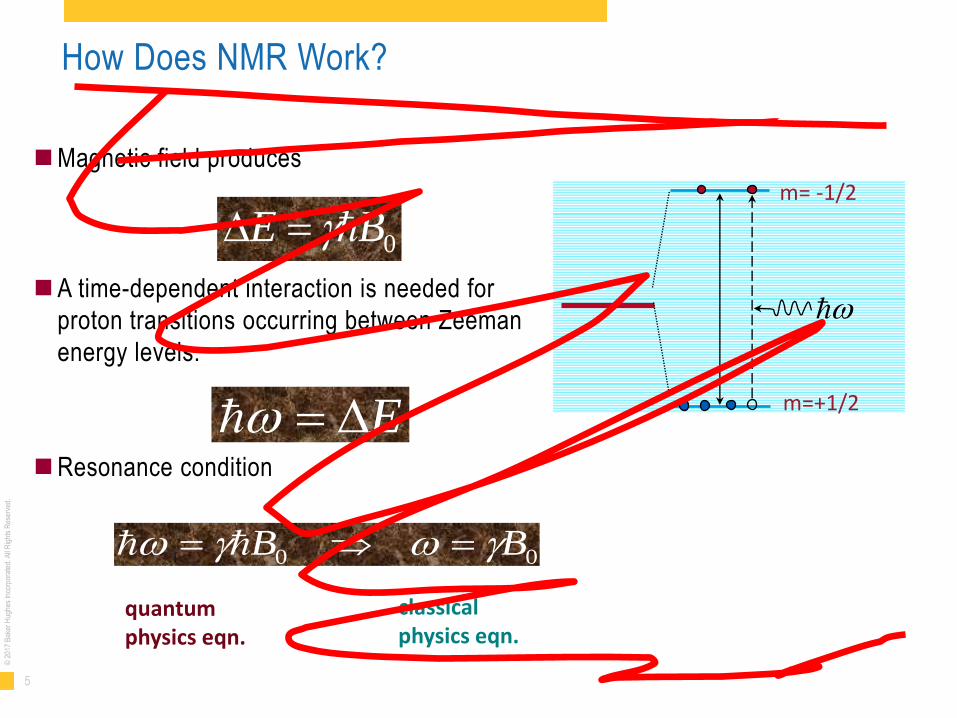
How Does NMR Work?
Magnetic field produces
A time-dependent interaction is needed for
proton transitions occurring between Zeeman
energy levels:
Resonance condition
0BE
E
B B0 0
quantum physics eqn.
classical physics eqn.
m= -1/2
m=+1/2
6
© 2
017
Bak
er H
ughe
s In
corp
orat
ed. A
ll R
ight
s R
eser
ved.
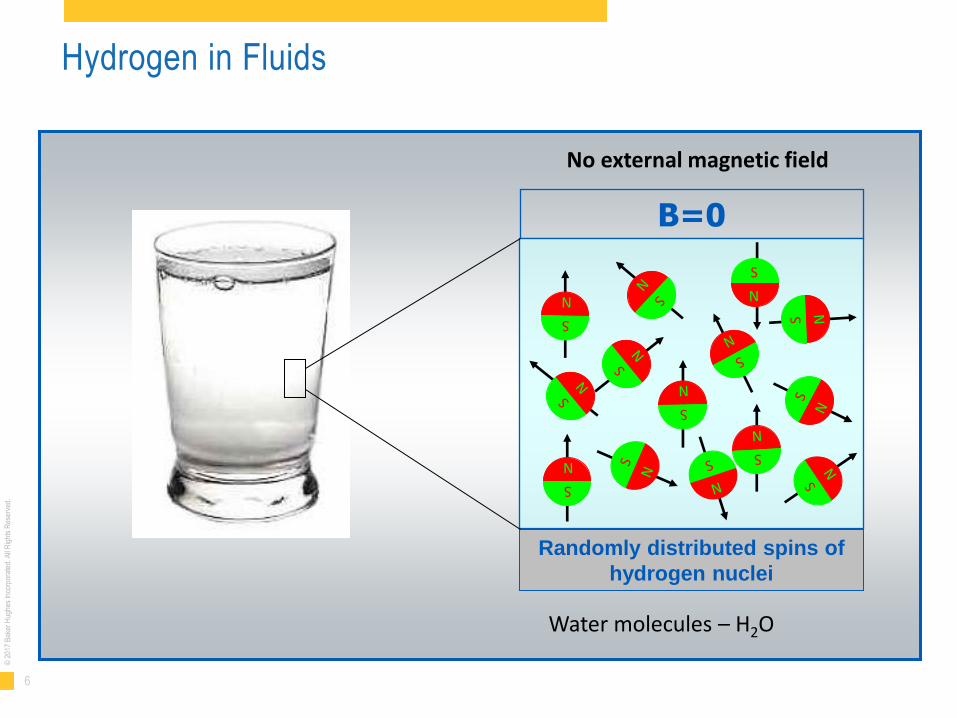
Hydrogen in Fluids
Randomly distributed spins of
hydrogen nuclei
B=0
No external magnetic field
Water molecules – H2O
7
© 2
017
Bak
er H
ughe
s In
corp
orat
ed. A
ll R
ight
s R
eser
ved.
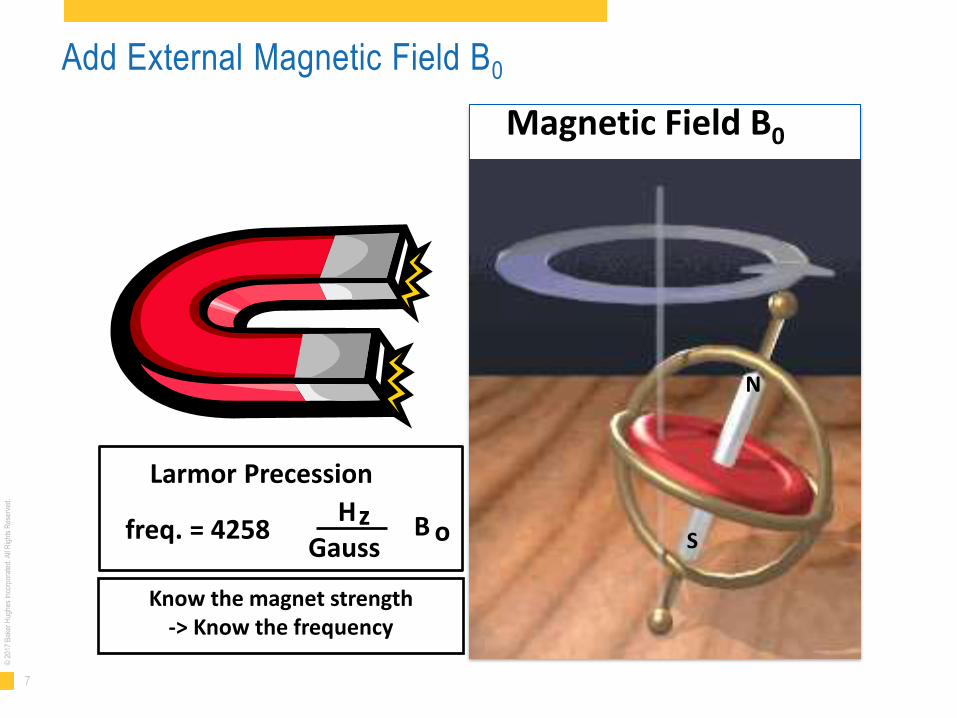
Add External Magnetic Field B0
Larmor Precession
freq. = 4258 H
Gauss z B o
Magnetic Field B0
Know the magnet strength -> Know the frequency
N
S
8
© 2
017
Bak
er H
ughe
s In
corp
orat
ed. A
ll R
ight
s R
eser
ved.
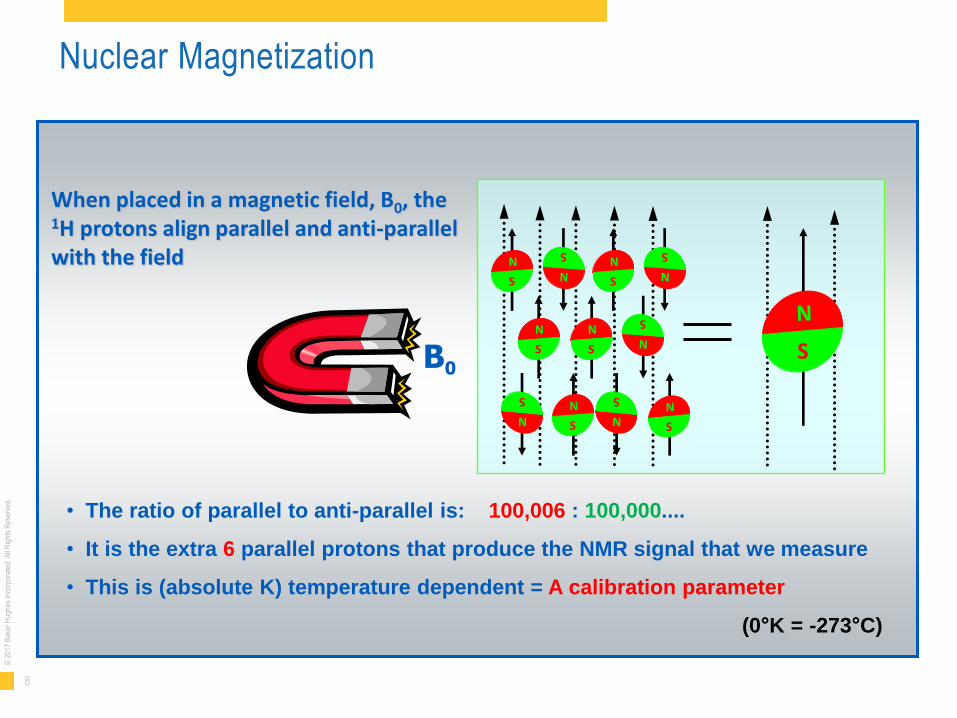
Nuclear Magnetization
• The ratio of parallel to anti-parallel is: 100,006 : 100,000....
• It is the extra 6 parallel protons that produce the NMR signal that we measure
• This is (absolute K) temperature dependent = A calibration parameter
(0°K = -273°C)
When placed in a magnetic field, B0, the 1H protons align parallel and anti-parallel with the field
B0
9
© 2
017
Bak
er H
ughe
s In
corp
orat
ed. A
ll R
ight
s R
eser
ved.
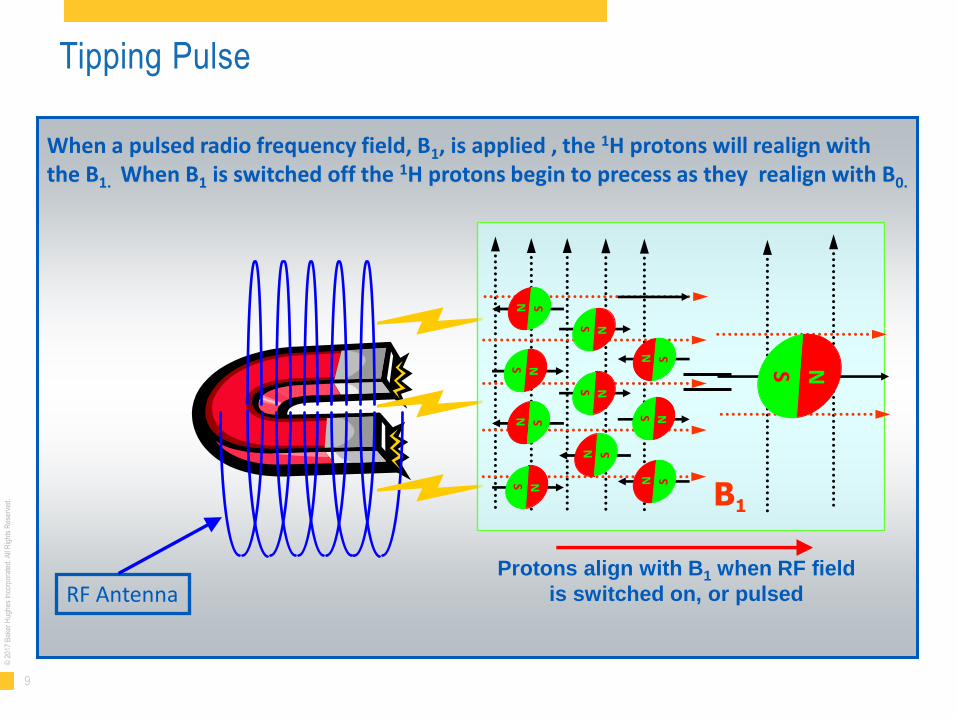
Tipping Pulse
Protons align with B1 when RF field
is switched on, or pulsed
When a pulsed radio frequency field, B1, is applied , the 1H protons will realign with the B1. When B1 is switched off the 1H protons begin to precess as they realign with B0.
RF Antenna
B1
S N
10
© 2
017
Bak
er H
ughe
s In
corp
orat
ed. A
ll R
ight
s R
eser
ved.
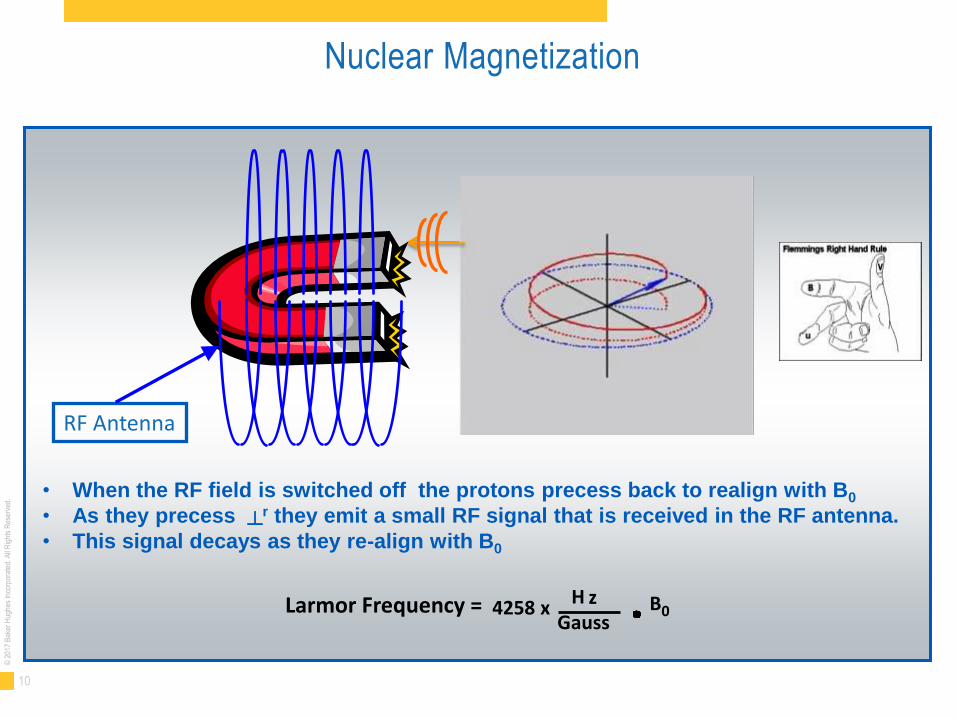
Nuclear Magnetization
Larmor Frequency = 4258 x H
Gauss z B0
• When the RF field is switched off the protons precess back to realign with B0
• As they precess ┴r they emit a small RF signal that is received in the RF antenna.
• This signal decays as they re-align with B0
RF Antenna

11
© 2
017
Bak
er H
ughe
s In
corp
orat
ed. A
ll R
ight
s R
eser
ved.
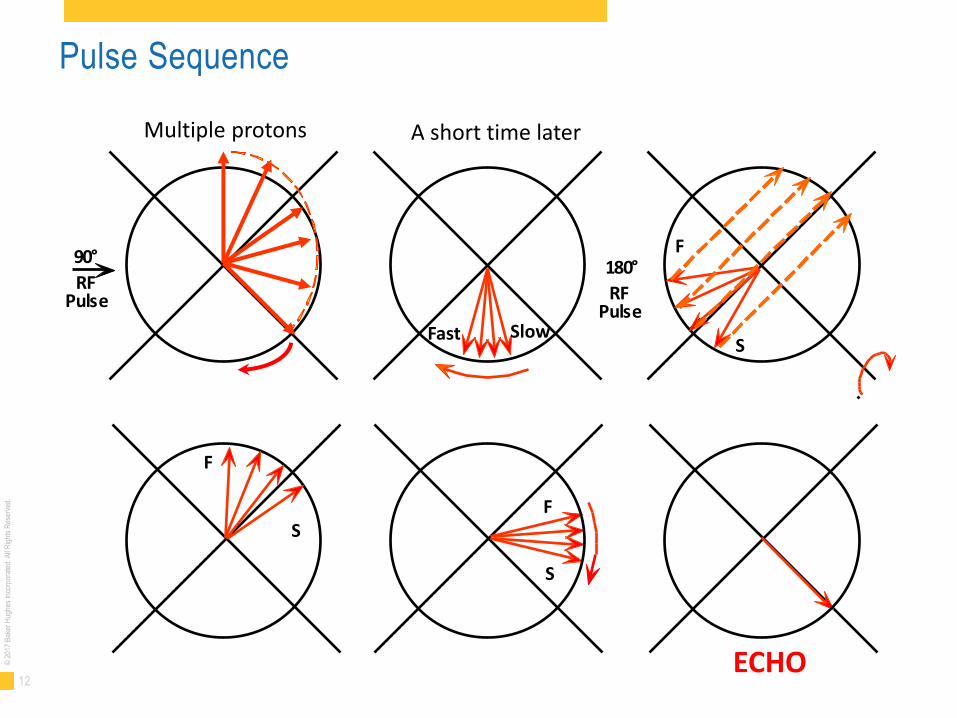
Pulse Sequence
12
© 2
017
Bak
er H
ughe
s In
corp
orat
ed. A
ll R
ight
s R
eser
ved.
Pulse Sequence
F
S
9 0 °
R F P u l s e
F
S
F
S
Slow Fast
1 8 0 °
R F u l s e P
A short time later
ECHO
Multiple protons
13
© 2
017
Bak
er H
ughe
s In
corp
orat
ed. A
ll R
ight
s R
eser
ved.
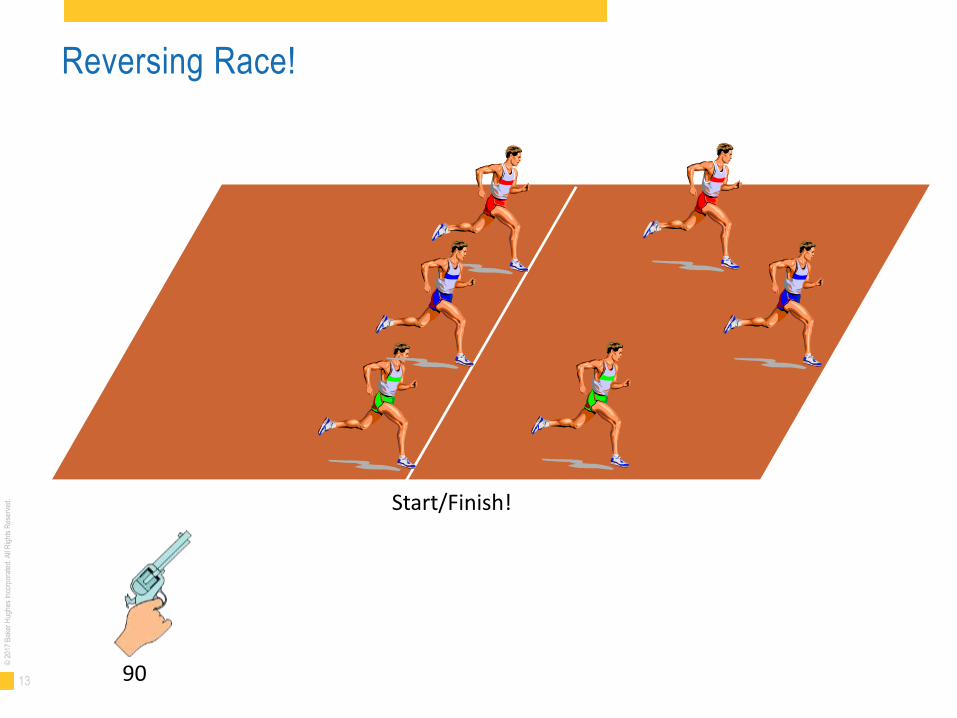
Reversing Race!
Start/Finish!
90
14
© 2
017
Bak
er H
ughe
s In
corp
orat
ed. A
ll R
ight
s R
eser
ved.
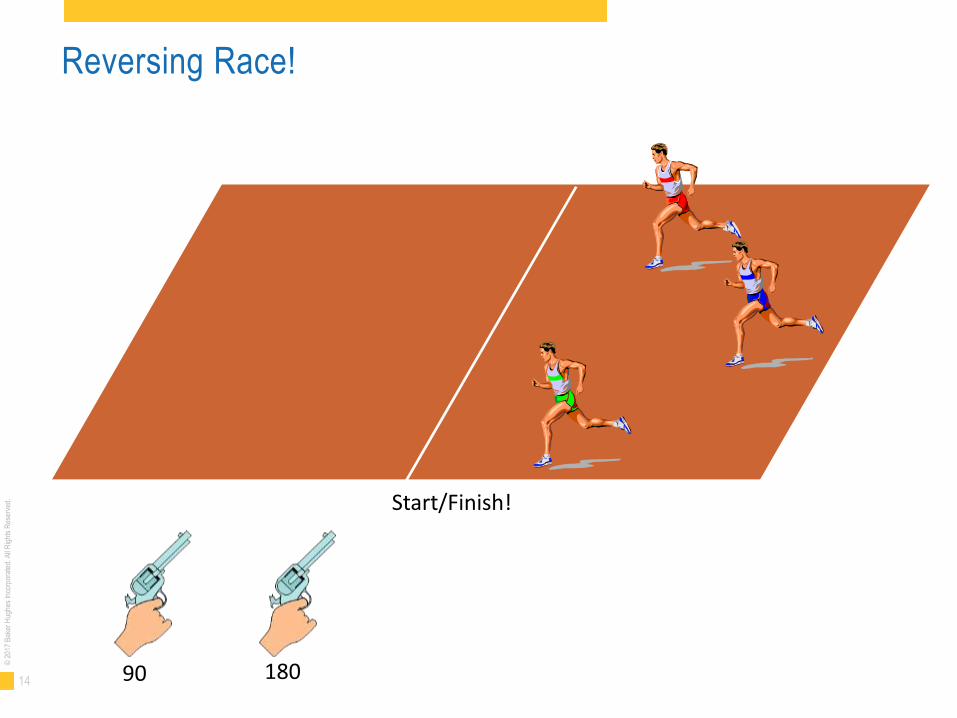
Reversing Race!
Start/Finish!
180 90
15
© 2
017
Bak
er H
ughe
s In
corp
orat
ed. A
ll R
ight
s R
eser
ved.
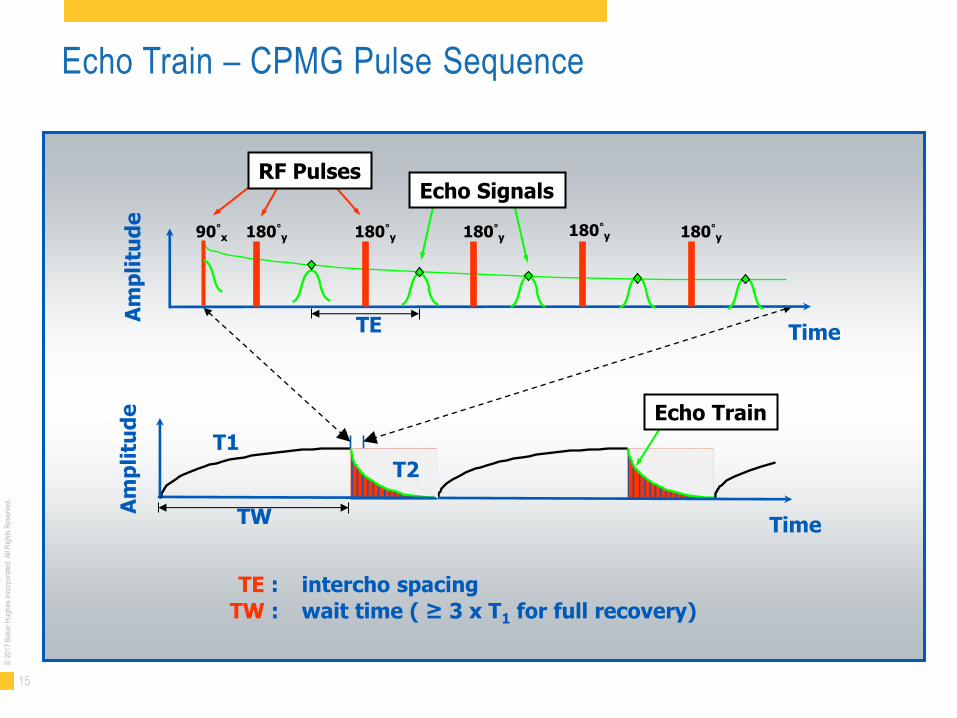
TE : intercho spacing
TW : wait time ( ≥ 3 x T1 for full recovery)
TW Time
Am
pli
tud
e
Echo Train
TE Time
90°x 180°
y 180°y 180°
y 180°y 180°
y
Am
pli
tud
e
Echo Signals RF Pulses
Echo Train – CPMG Pulse Sequence
T2
T1

16
© 2
017
Bak
er H
ughe
s In
corp
orat
ed. A
ll R
ight
s R
eser
ved.
Porosity
17
© 2
017
Bak
er H
ughe
s In
corp
orat
ed. A
ll R
ight
s R
eser
ved.
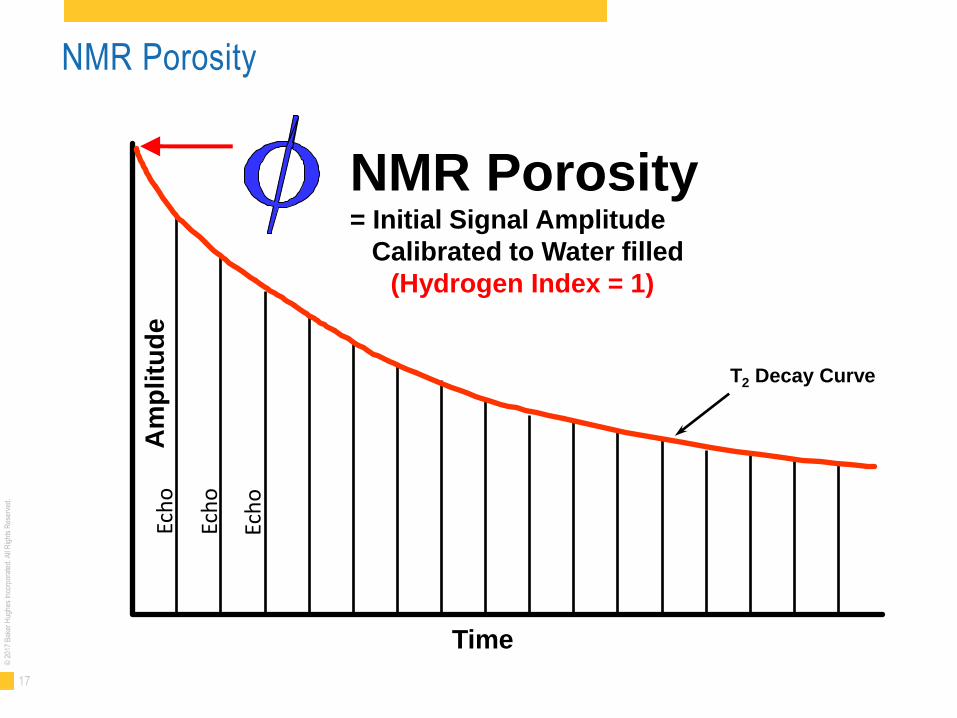
NMR Porosity
Am
plitu
de
T2 Decay Curve
Time
NMR Porosity = Initial Signal Amplitude
Calibrated to Water filled
(Hydrogen Index = 1)
Ech
o
Ech
o
Ech
o
18
© 2
017
Bak
er H
ughe
s In
corp
orat
ed. A
ll R
ight
s R
eser
ved.
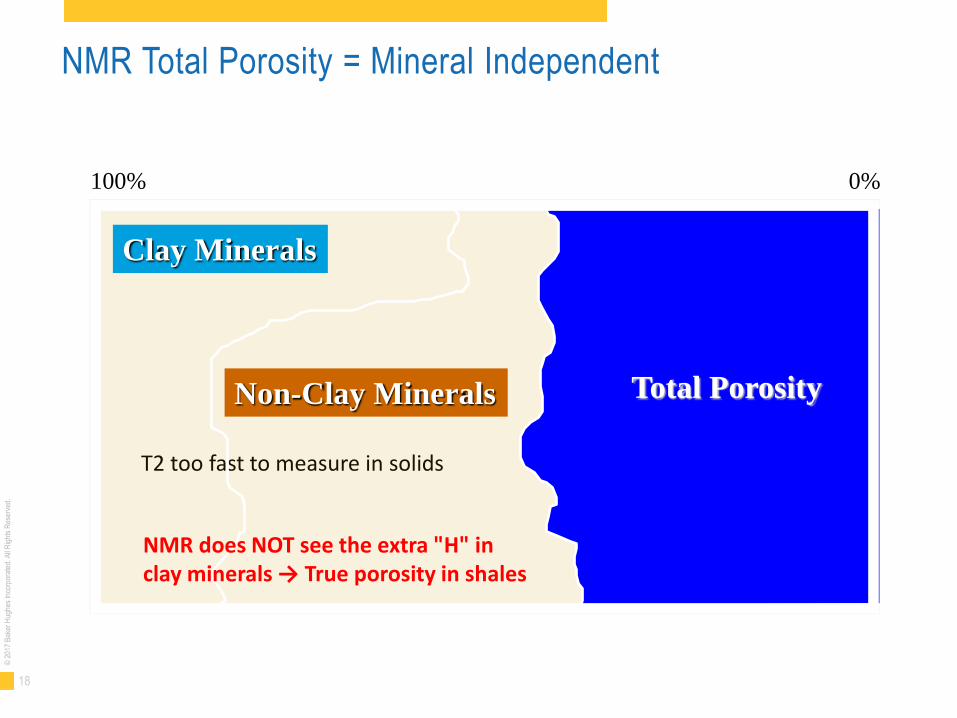
T2 too fast to measure in solids
Clay Minerals
Non-Clay Minerals
0% 100%
Total Porosity
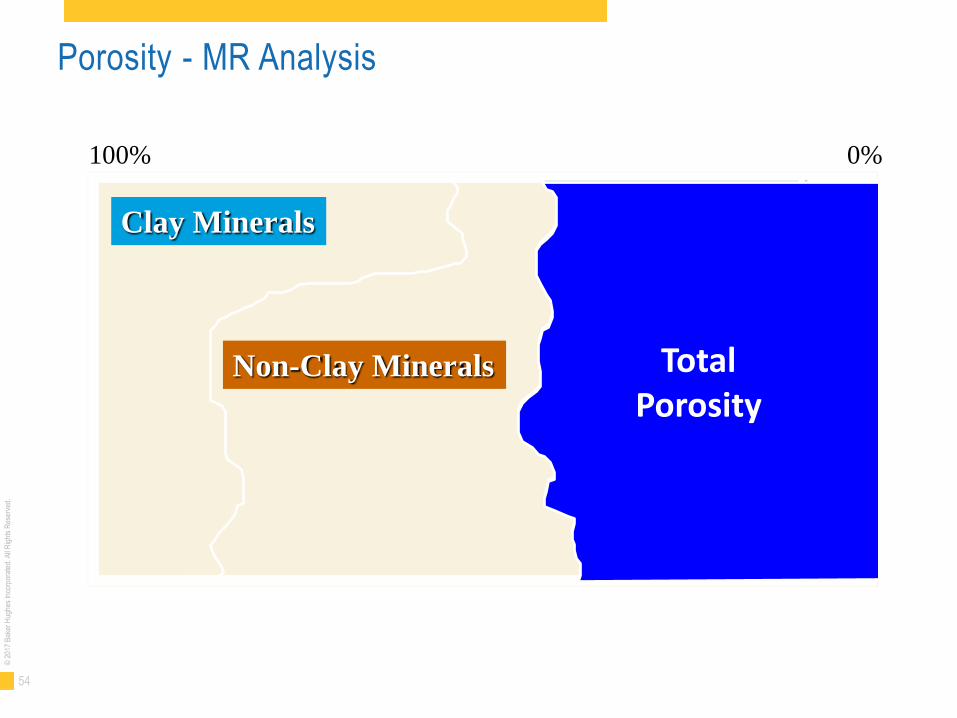
NMR Total Porosity = Mineral Independent
NMR does NOT see the extra "H" in clay minerals → True porosity in shales
19
© 2
017
Bak
er H
ughe
s In
corp
orat
ed. A
ll R
ight
s R
eser
ved.
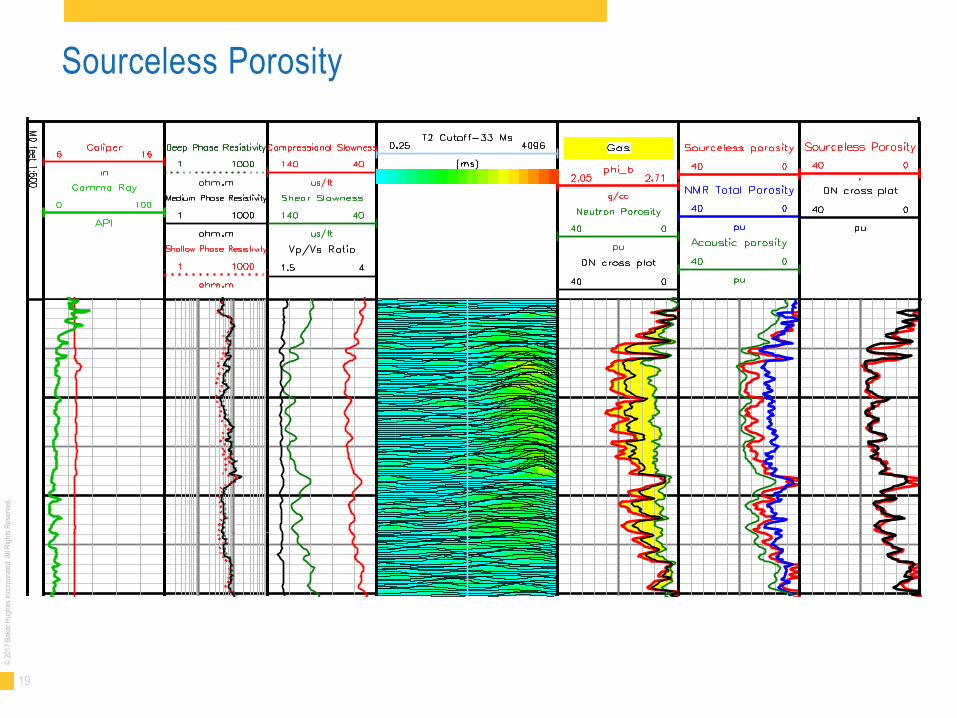
Sourceless Porosity
20
© 2
017
Bak
er H
ughe
s In
corp
orat
ed. A
ll R
ight
s R
eser
ved.
T2 Distribution
21
© 2
017
Bak
er H
ughe
s In
corp
orat
ed. A
ll R
ight
s R
eser
ved.
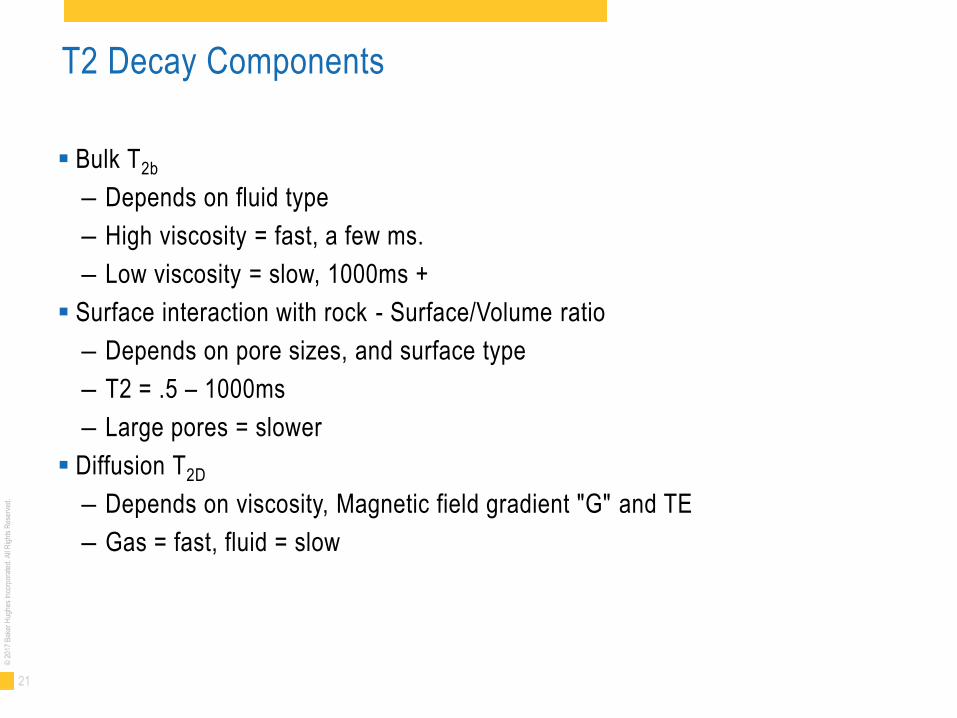
T2 Decay Components
Bulk T2b
– Depends on fluid type
– High viscosity = fast, a few ms.
– Low viscosity = slow, 1000ms +
Surface interaction with rock - Surface/Volume ratio
– Depends on pore sizes, and surface type
– T2 = .5 – 1000ms
– Large pores = slower
Diffusion T2D
– Depends on viscosity, Magnetic field gradient "G" and TE
– Gas = fast, fluid = slow
22
© 2
017
Bak
er H
ughe
s In
corp
orat
ed. A
ll R
ight
s R
eser
ved.
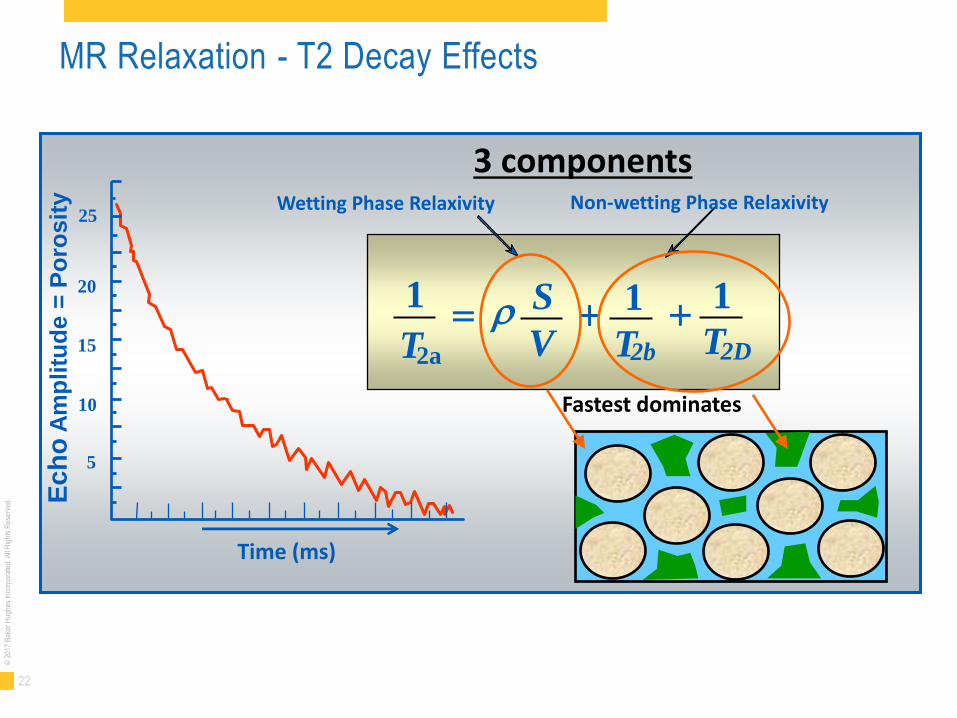
MR Relaxation - T2 Decay Effects E
ch
o A
mp
litu
de
= P
oro
sit
y
Time (ms)
25
20
15
10
5
1
2a T r + S
V
+ 1
T 2D
1
T 2b
3 components
Fastest dominates
Wetting Phase Relaxivity Non-wetting Phase Relaxivity
23
© 2
017
Bak
er H
ughe
s In
corp
orat
ed. A
ll R
ight
s R
eser
ved.
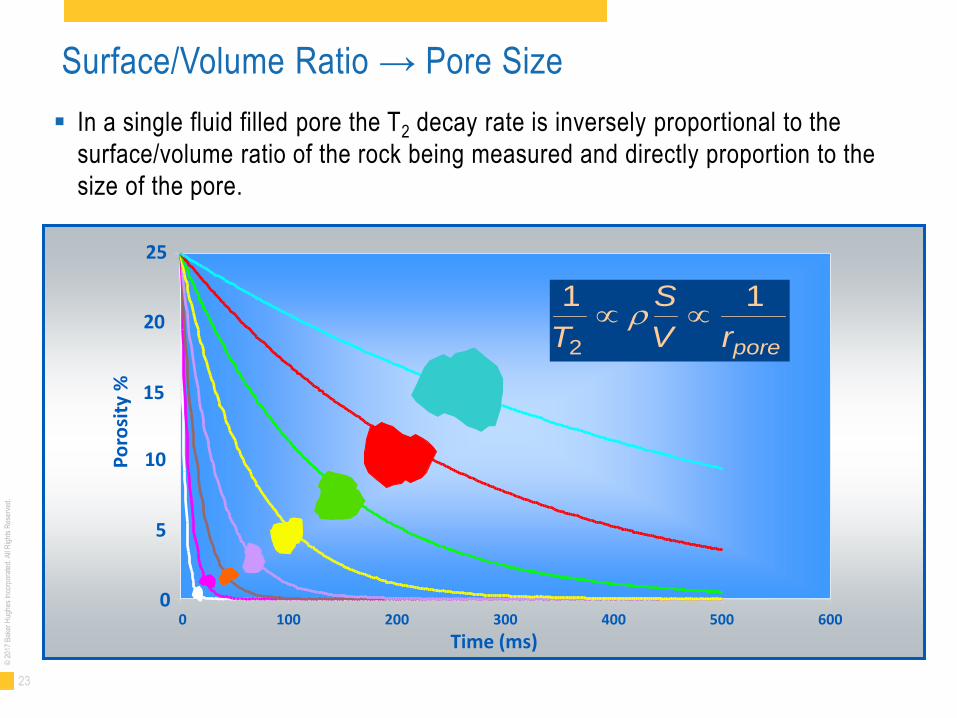
In a single fluid filled pore the T2 decay rate is inversely proportional to the
surface/volume ratio of the rock being measured and directly proportion to the
size of the pore.
0 100 200 300 400 500 600
Time (ms)
Po
rosi
ty %
1 1
2T
S
V rpore
r
25
20
15
10
5
0
Surface/Volume Ratio → Pore Size
24
© 2
017
Bak
er H
ughe
s In
corp
orat
ed. A
ll R
ight
s R
eser
ved.
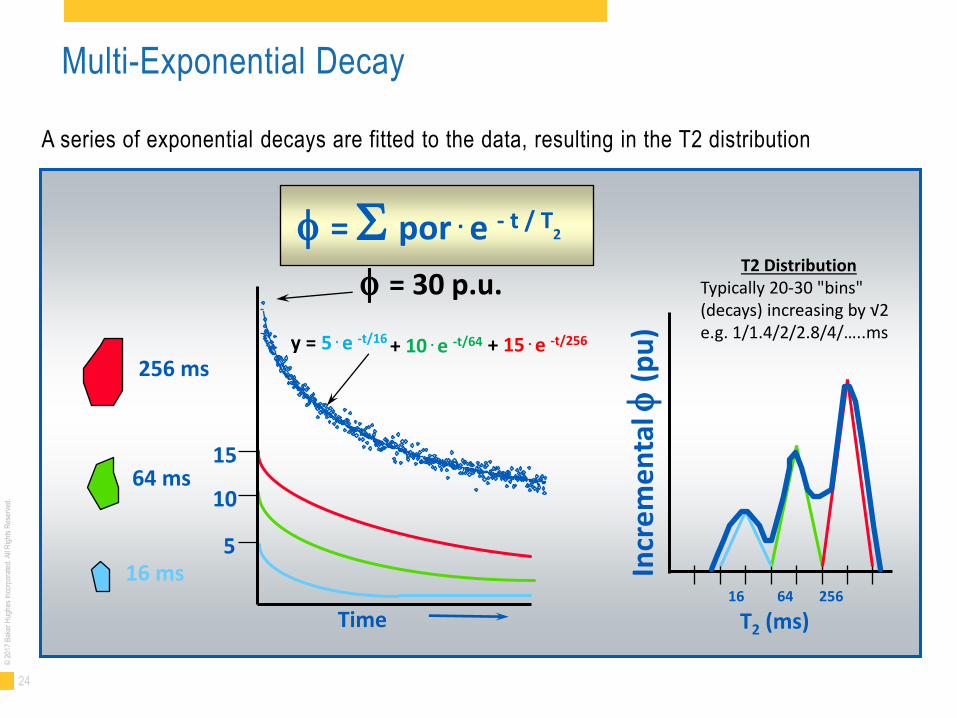
= S por . e - t / T2
16 64 256
T2 (ms)
64 ms
Incr
em
en
tal
(pu
)
16 ms 5
256 ms
10
15
Time
y = 5 . e -t/16
= 30 p.u.
Multi-Exponential Decay
A series of exponential decays are fitted to the data, resulting in the T2 distribution
+ 10 . e -t/64 + 15 . e -t/256
T2 Distribution Typically 20-30 "bins" (decays) increasing by √2 e.g. 1/1.4/2/2.8/4/…..ms
25
© 2
017
Bak
er H
ughe
s In
corp
orat
ed. A
ll R
ight
s R
eser
ved.
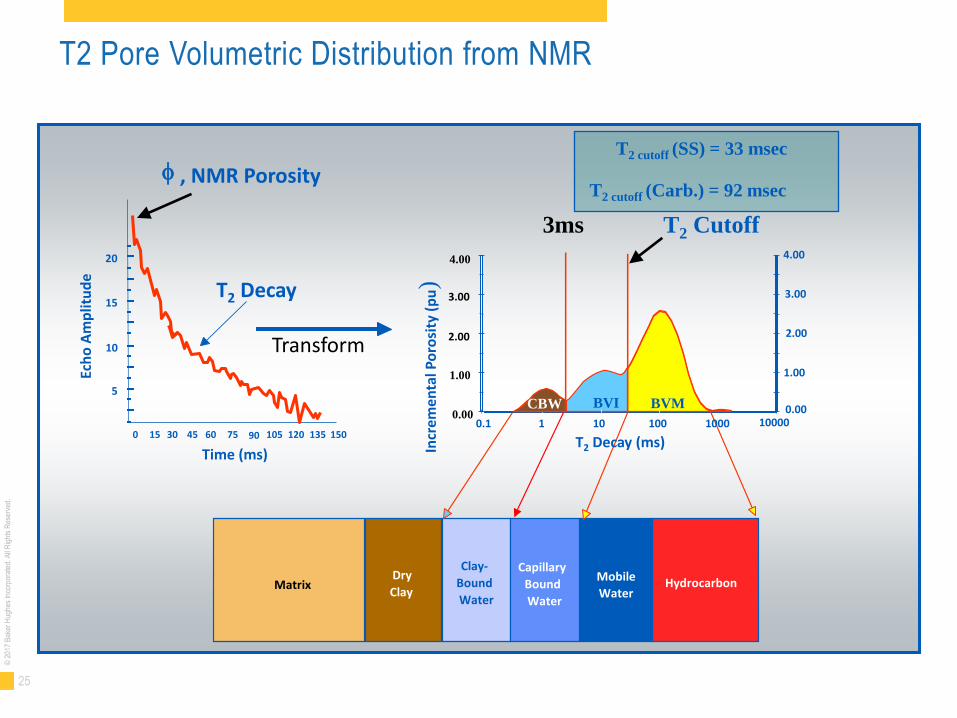
T2 Pore Volumetric Distribution from NMR
Ec
ho
Am
plit
ud
e
0 15 150 135 120 105 90 75 60 45 30
Time (ms)
20
15
10
5
4.00
0.00
1.00
2.00
3.00
0.00
1.00
2.00
3.00
4.00
Incr
emen
tal P
oro
sity
(p
u)
Matrix Dry
Clay
Clay-
Bound
Water Water
Mobile Capillary
Bound
Water
Hydrocarbon
T2 Decay
, NMR Porosity
10000 0.1 1 10 100 1000
T2 Decay (ms)
Transform
T2 cutoff (SS) = 33 msec
T2 cutoff (Carb.) = 92 msec
CBW
3ms T2 Cutoff
BVI BVM

26
© 2
017
Bak
er H
ughe
s In
corp
orat
ed. A
ll R
ight
s R
eser
ved.
Clay Minerals
Non-Clay Minerals
CBW
BVM
BVI
0% 100%
Porosity - MR Analysis
Total Porosity
27
© 2
017
Bak
er H
ughe
s In
corp
orat
ed. A
ll R
ight
s R
eser
ved.
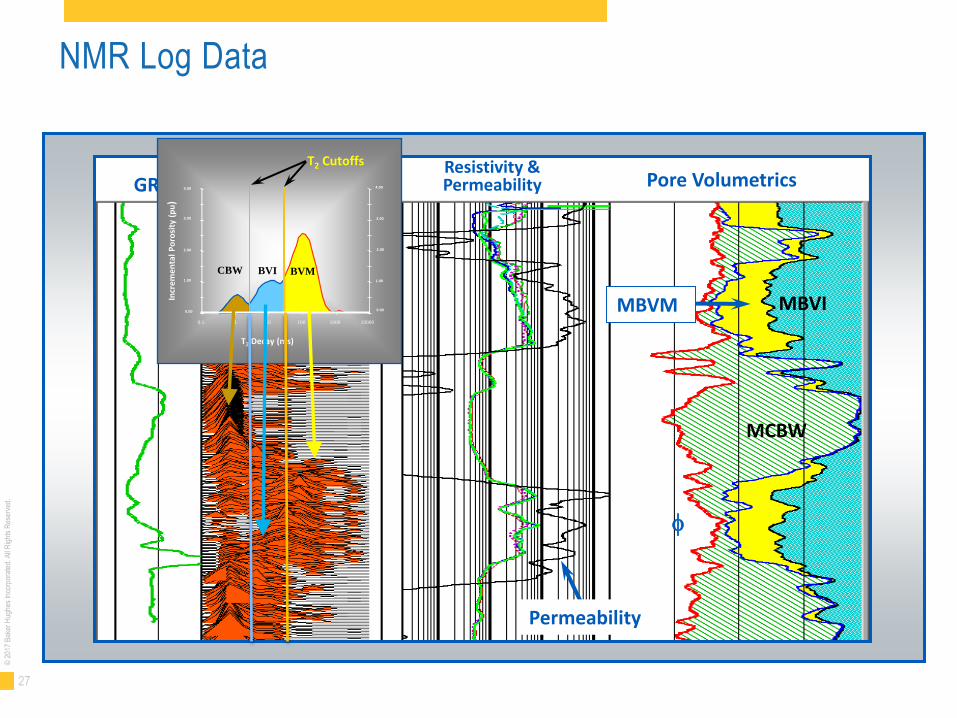
NMR Log Data
Permeability
MCBW
MBVI MBVM
GR T2 Spectra Resistivity & Permeability Pore Volumetrics
0.00
1.00
2.00
3.00
4.00
0.1 1 10 100 1000 10000
BVI BVM
4.00
0.00
1.00
2.00
3.00
Incr
em
enta
l P
oro
sity
(p
u)
CBW
T2 Decay (ms)
T2 Cutoffs
28
© 2
017
Bak
er H
ughe
s In
corp
orat
ed. A
ll R
ight
s R
eser
ved.
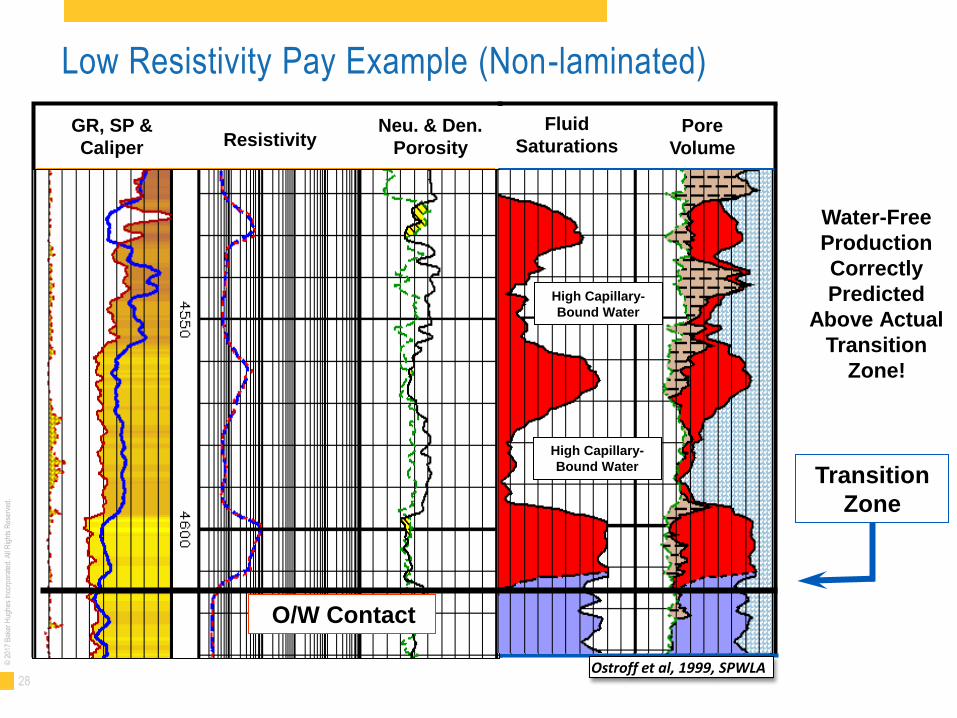
Neu. & Den.
Porosity Resistivity GR, SP &
Caliper
Fluid
Saturations Pore
Volume
Transition
Zone
O/W Contact
Water-Free
Production
Correctly
Predicted
Above Actual
Transition
Zone!
High Capillary-
Bound Water
High Capillary-
Bound Water
Low Resistivity Pay Example (Non-laminated)
Ostroff et al, 1999, SPWLA
29
© 2
017
Bak
er H
ughe
s In
corp
orat
ed. A
ll R
ight
s R
eser
ved.
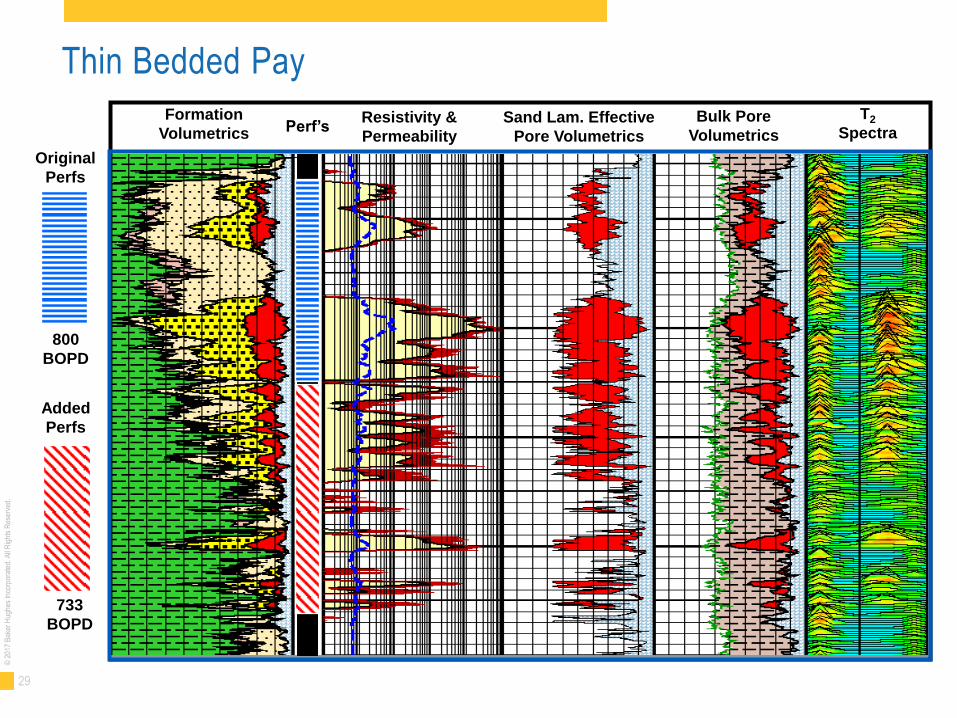
Thin Bedded Pay
Resistivity &
Permeability
Formation
Volumetrics Sand Lam. Effective
Pore Volumetrics
Bulk Pore
Volumetrics
T2
Spectra
Original
Perfs
800
BOPD
Added
Perfs
733
BOPD
Perf’s

30
© 2
017
Bak
er H
ughe
s In
corp
orat
ed. A
ll R
ight
s R
eser
ved.
Permeability
31
© 2
017
Bak
er H
ughe
s In
corp
orat
ed. A
ll R
ight
s R
eser
ved.
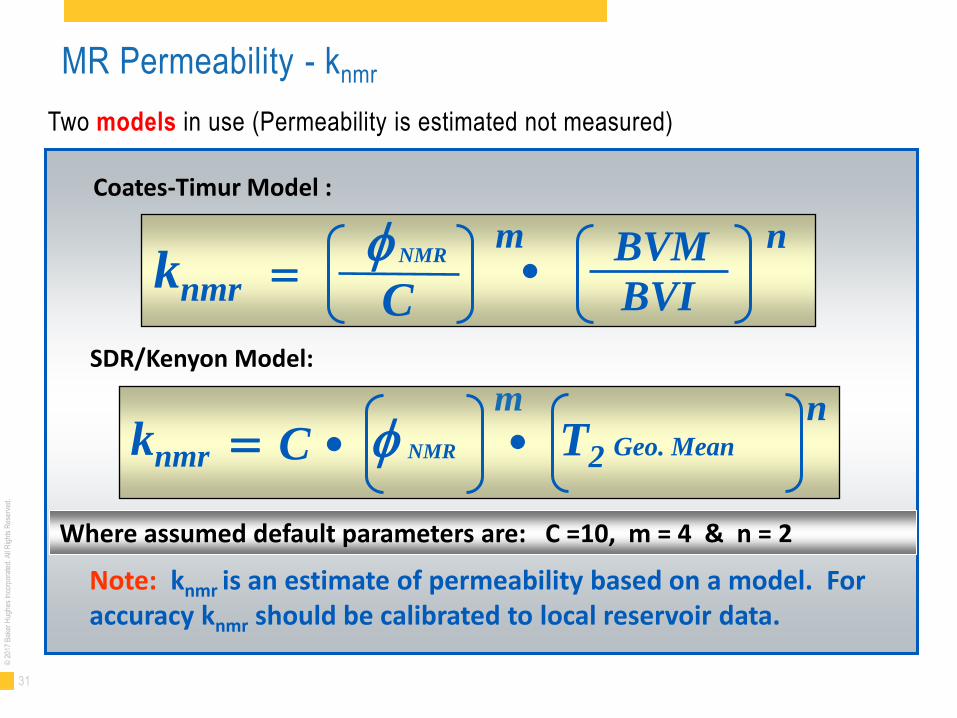
MR Permeability - knmr
Two models in use (Permeability is estimated not measured)
Where assumed default parameters are: C =10, m = 4 & n = 2
Coates-Timur Model :
Note: knmr is an estimate of permeability based on a model. For accuracy knmr should be calibrated to local reservoir data.
n m NMR
BVI
BVM
C knmr
SDR/Kenyon Model:
a n C knmr T2 Geo. Mean NMR
m
32
© 2
017
Bak
er H
ughe
s In
corp
orat
ed. A
ll R
ight
s R
eser
ved.
0
0.5
1
1.5
2
2.5
Pa
rt Ø
[fr
ac
]
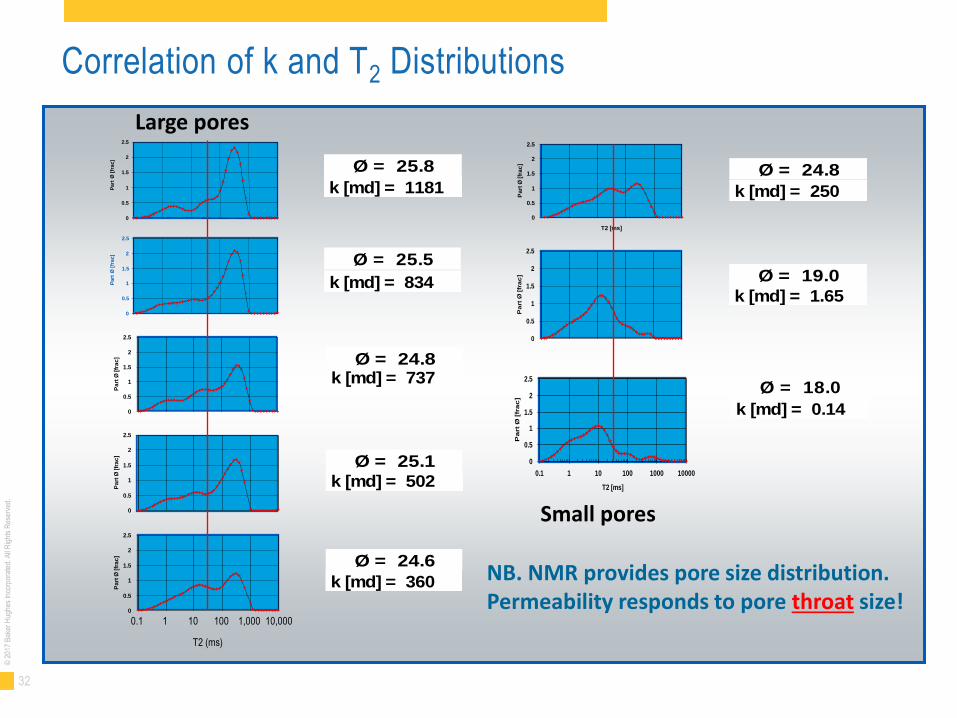
Correlation of k and T2 Distributions
Ø = 25.8
k [md] = 1181
Ø = 25.5
k [md] = 834
Ø = 24.8k [md] = 737
0
0.5
1
1.5
2
2.5
Pa
rt Ø
[fr
ac
]
Ø = 25.1
k [md] = 502
0
0.5
1
1.5
2
2.5
Pa
rt Ø
[fr
ac
]
Ø = 24.6
k [md] = 360
0
0.5
1
1.5
2
2.5
T2 [ms]
Pa
rt Ø
[fr
ac
]
Ø = 24.8
k [md] = 250
0
0.5
1
1.5
2
2.5
Pa
rt Ø
[fr
ac
] Ø = 19.0
k [md] = 1.65
0
0.5
1
1.5
2
2.5
0.1 1 10 100 1000 10000
T2 [ms]
Pa
rt
Ø [
fra
c]
Ø = 18.0
k [md] = 0.14
0
0.5
1
1.5
2
2.5
Part
Ø [
frac]
0
0.5
1
1.5
2
2.5
Part
Ø [
frac]
1 10 100 1,000 10,000 0.1
T2 (ms)
Large pores
Small pores
NB. NMR provides pore size distribution. Permeability responds to pore throat size!
33
© 2
017
Bak
er H
ughe
s In
corp
orat
ed. A
ll R
ight
s R
eser
ved.
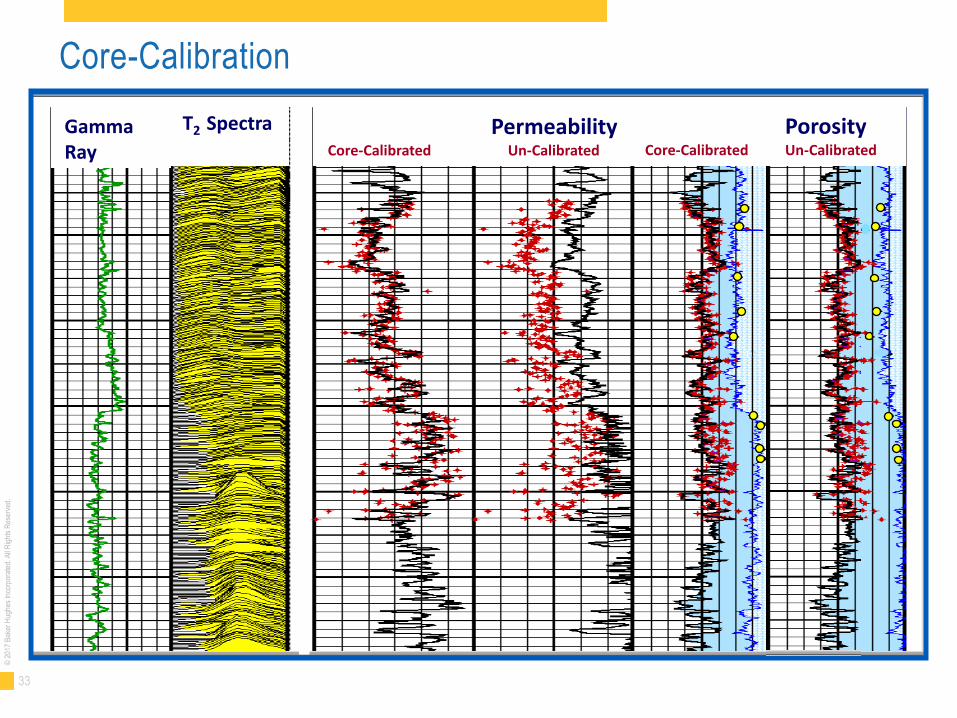
Core-Calibration
Calibrated Uncalibrated Permeability Core-Calibrated Un-Calibrated
Gamma Ray
T2 Spectra Calibrated Uncalibrated Porosity Core-Calibrated Un-Calibrated
34
© 2
017
Bak
er H
ughe
s In
corp
orat
ed. A
ll R
ight
s R
eser
ved.
T1 Distribution
35
© 2
017
Bak
er H
ughe
s In
corp
orat
ed. A
ll R
ight
s R
eser
ved.
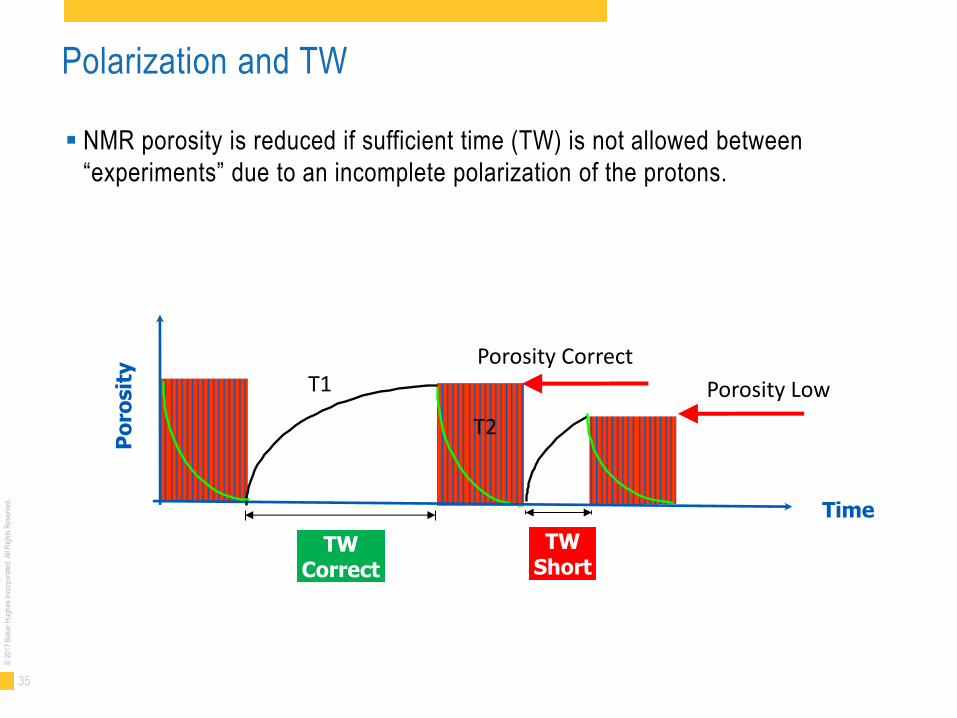
Polarization and TW
NMR porosity is reduced if sufficient time (TW) is not allowed between
“experiments” due to an incomplete polarization of the protons.
TW Correct
Time
Po
rosit
y
TW Short
Porosity Correct
Porosity Low T1
T2
36
© 2
017
Bak
er H
ughe
s In
corp
orat
ed. A
ll R
ight
s R
eser
ved.
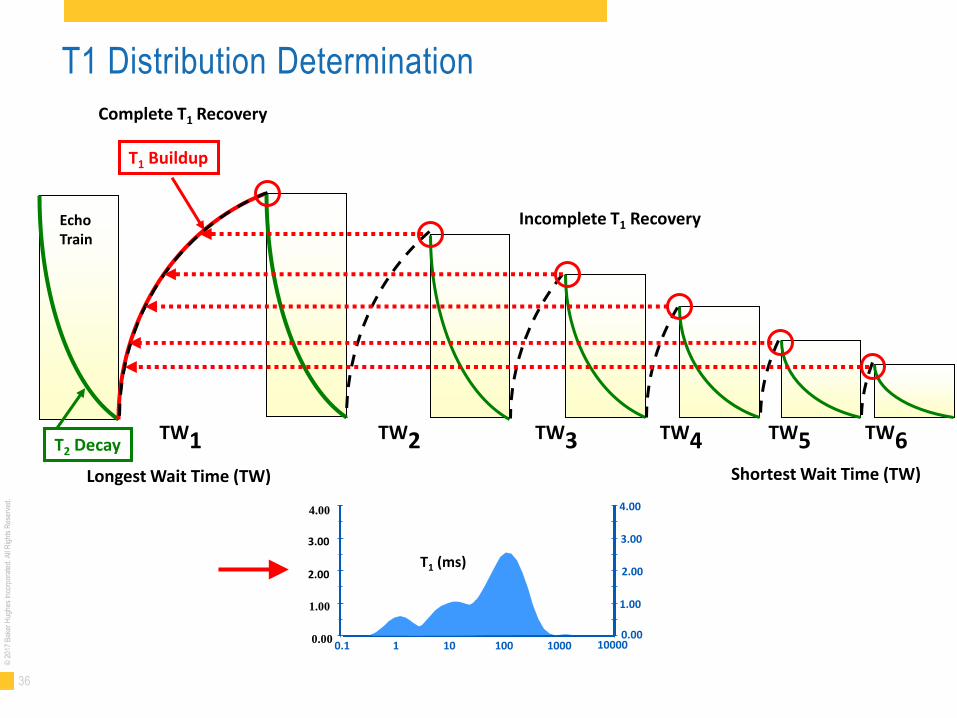
T1 Distribution Determination
Echo Train
Incomplete T1 Recovery
Longest Wait Time (TW) Shortest Wait Time (TW)
TW1 TW2 TW3 TW4 TW6 TW5
T1 Buildup
T2 Decay
Complete T1 Recovery
4.00
0.00
1.00
2.00
3.00
0.00
1.00
2.00
3.00
4.00
10000 0.1 1 10 100 1000
T1 (ms)

37
© 2
017
Bak
er H
ughe
s In
corp
orat
ed. A
ll R
ight
s R
eser
ved.
Diffusion
38
© 2
017
Bak
er H
ughe
s In
corp
orat
ed. A
ll R
ight
s R
eser
ved.
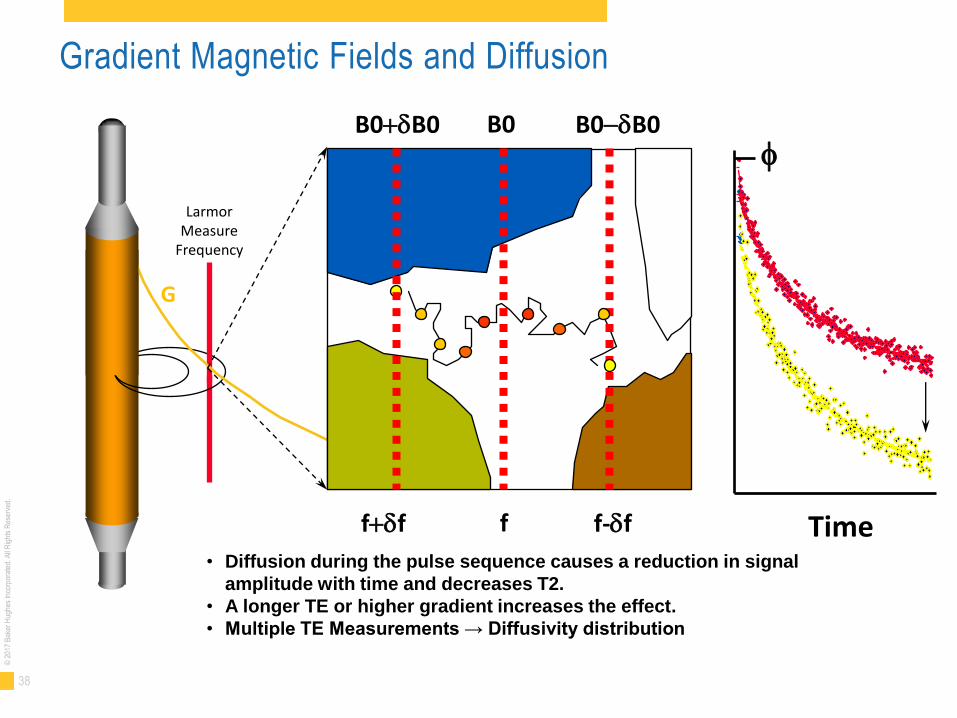
Gradient Magnetic Fields and Diffusion
• Diffusion during the pulse sequence causes a reduction in signal
amplitude with time and decreases T2.
• A longer TE or higher gradient increases the effect.
• Multiple TE Measurements → Diffusivity distribution
Time
B0+dB0 B0-dB0 B0
f+df f f-df
G
Larmor Measure
Frequency
39
© 2
017
Bak
er H
ughe
s In
corp
orat
ed. A
ll R
ight
s R
eser
ved.
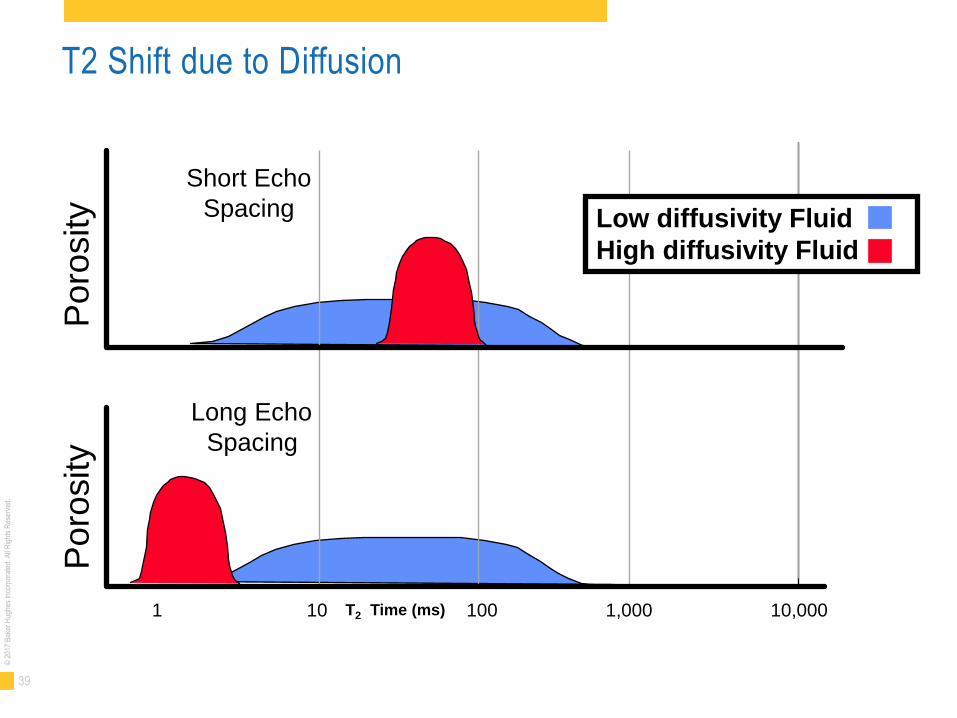
T2 Shift due to Diffusion
1 10 100 1,000 10,000 T2 Time (ms)
Low diffusivity Fluid
High diffusivity Fluid
Poro
sity
Po
rosity
Short Echo
Spacing
Long Echo
Spacing
40
© 2
017
Bak
er H
ughe
s In
corp
orat
ed. A
ll R
ight
s R
eser
ved.
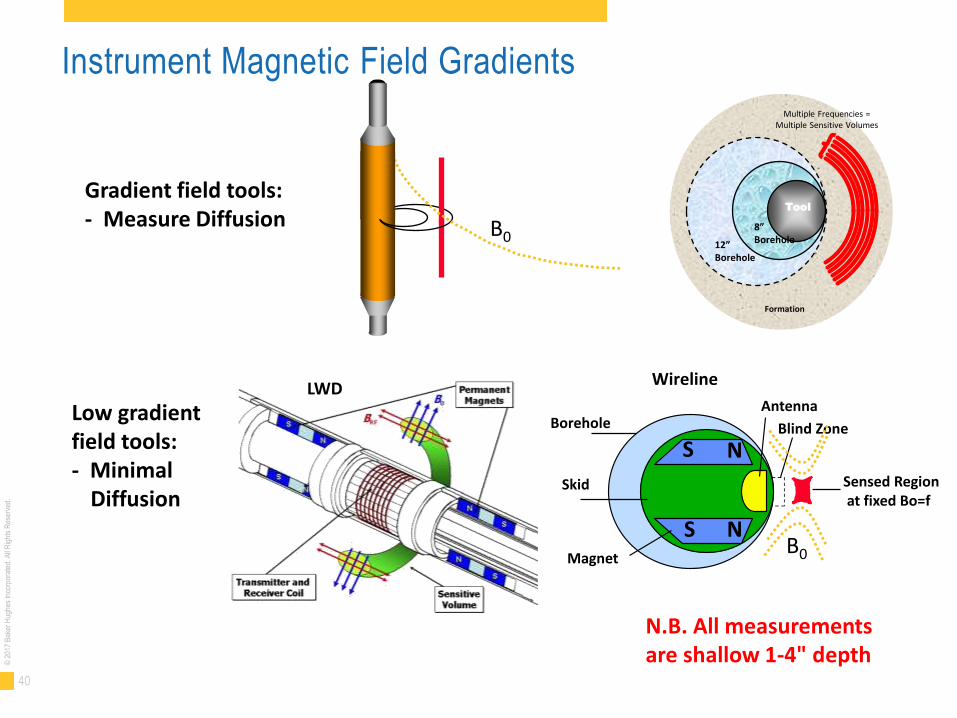
Instrument Magnetic Field Gradients
Gradient field tools: - Measure Diffusion
Formation
Multiple Frequencies = Multiple Sensitive Volumes
Tool
8” Borehole 12”
Borehole
B0
S N
S N Magnet
Borehole Blind Zone
Antenna
Sensed Region at fixed Bo=f
Skid
Wireline
Low gradient field tools: - Minimal
Diffusion
LWD
B0
N.B. All measurements are shallow 1-4" depth
41
© 2
017
Bak
er H
ughe
s In
corp
orat
ed. A
ll R
ight
s R
eser
ved.
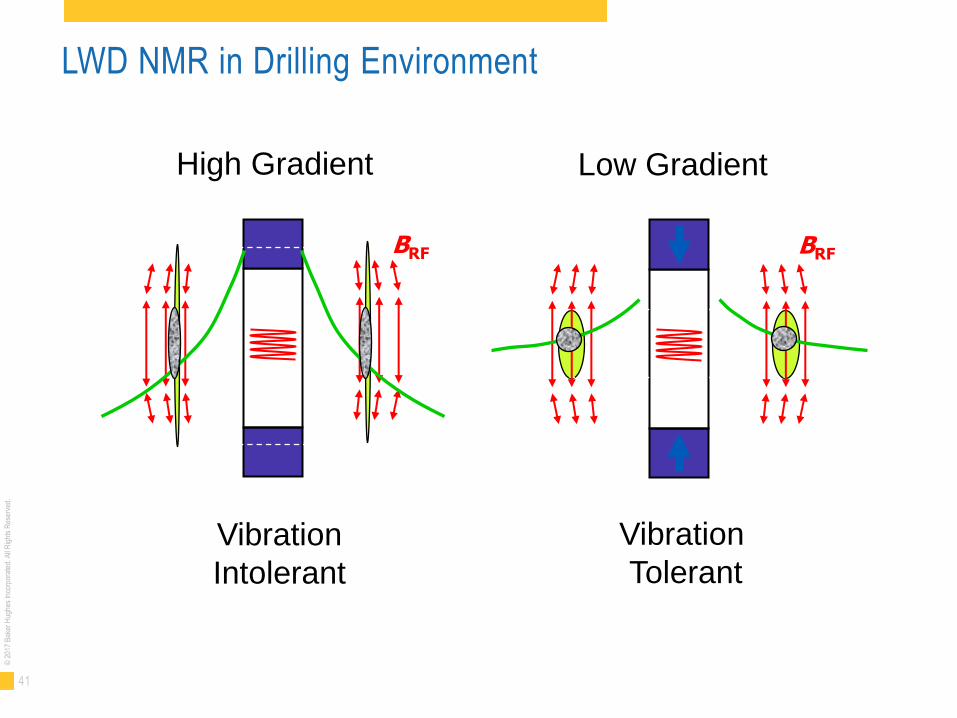
High Gradient Low Gradient
Vibration
Intolerant
Vibration
Tolerant
BRF BRF
LWD NMR in Drilling Environment

42
© 2
017
Bak
er H
ughe
s In
corp
orat
ed. A
ll R
ight
s R
eser
ved.
Fluids
43
© 2
017
Bak
er H
ughe
s In
corp
orat
ed. A
ll R
ight
s R
eser
ved.
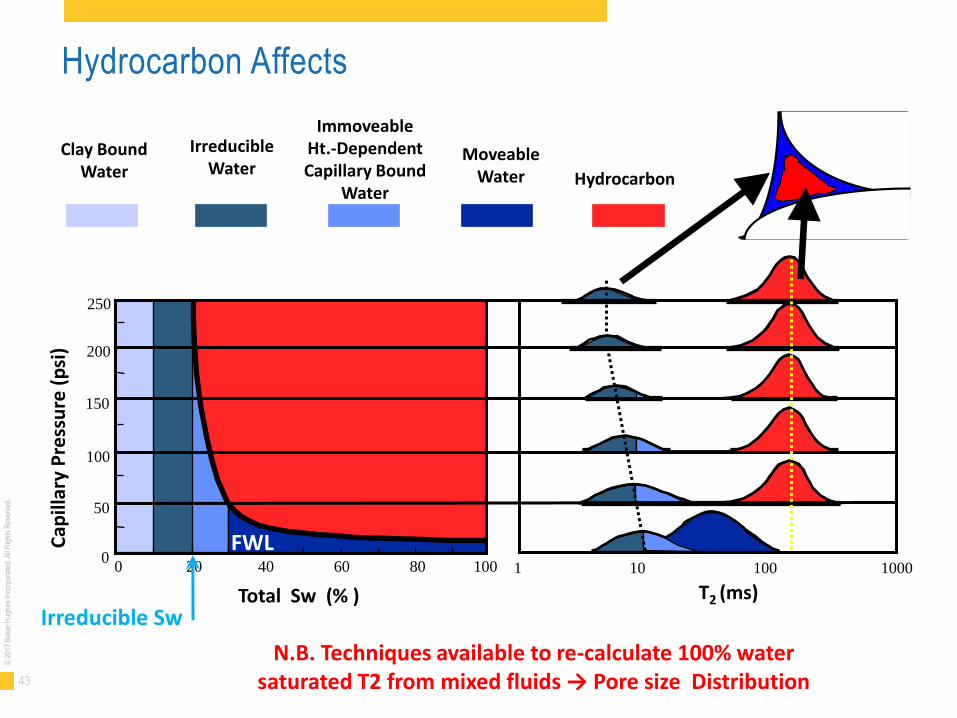
Immoveable Ht.-Dependent Capillary Bound
Water
Clay Bound Water
Moveable Water Hydrocarbon
IrreducibleWater
Cap
illar
y P
ress
ure
(p
si)
0 20 40 60 80 100
Total Sw (% )
250
0
100
150
200
50
Irreducible Sw
1 10 100 1000
T2 (ms)
Hydrocarbon Affects
N.B. Techniques available to re-calculate 100% water saturated T2 from mixed fluids → Pore size Distribution
FWL
44
© 2
017
Bak
er H
ughe
s In
corp
orat
ed. A
ll R
ight
s R
eser
ved.
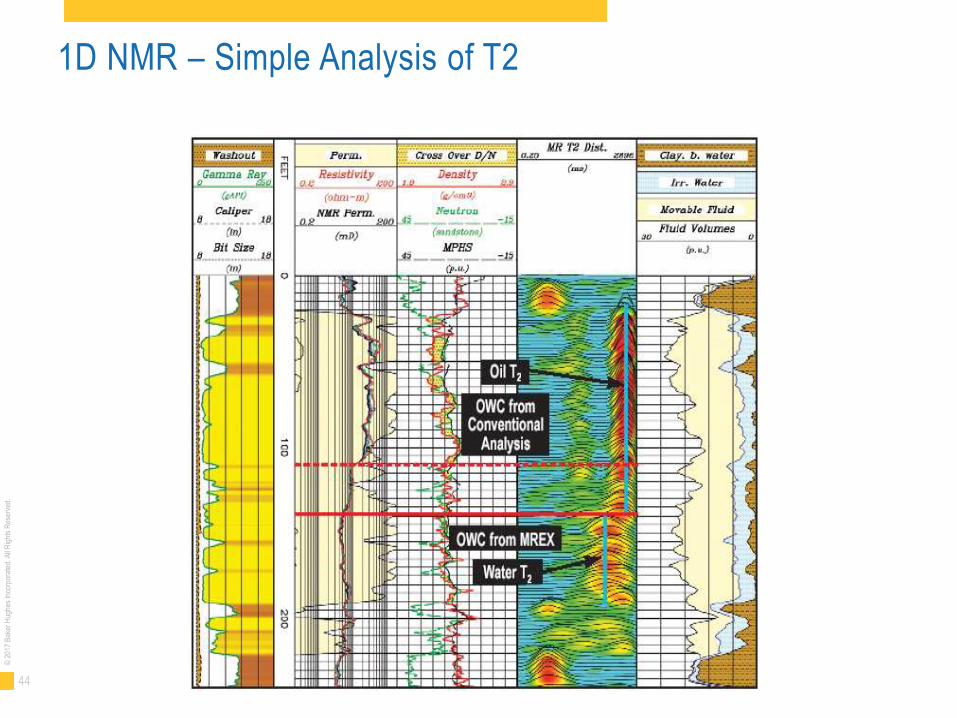
1D NMR – Simple Analysis of T2
45
© 2
017
Bak
er H
ughe
s In
corp
orat
ed. A
ll R
ight
s R
eser
ved.
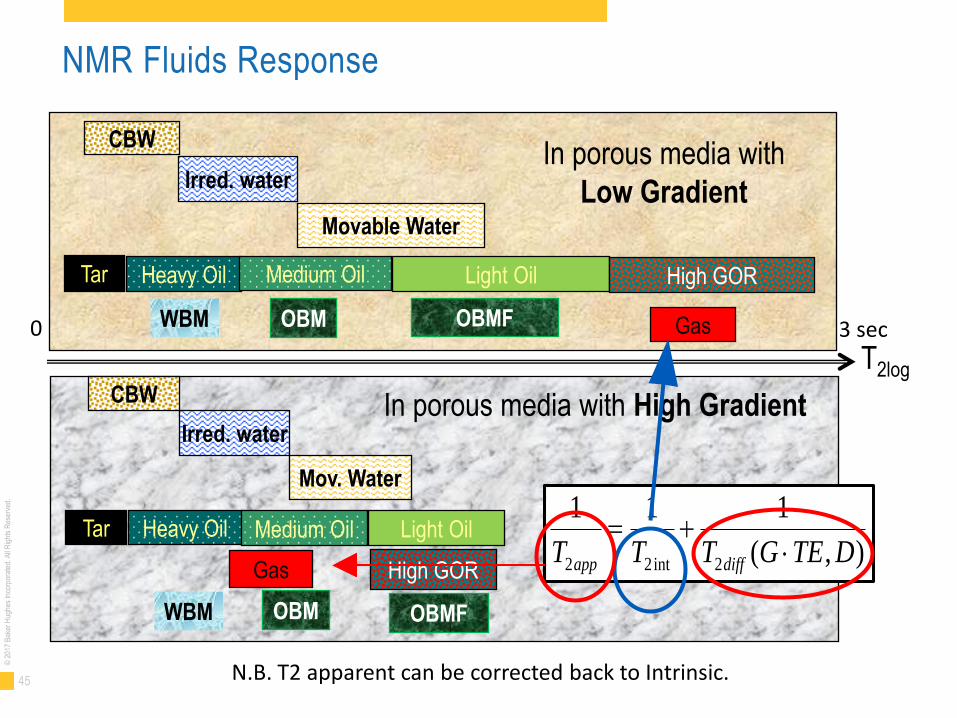
NMR Fluids Response
Gas
CBW
Heavy Oil
Irred. water
Medium Oil
Movable Water
Light Oil High GOR Tar
In porous media with
Low Gradient
T2log
CBW
Heavy Oil
Irred. water
Medium Oil
Mov. Water
Light Oil
Gas High GOR
Tar
In porous media with High Gradient
OBM WBM OBMF
WBM OBM OBMF 0 3 sec
),(
111
2int22 DTEGTTT diffapp +
N.B. T2 apparent can be corrected back to Intrinsic.
46
© 2
017
Bak
er H
ughe
s In
corp
orat
ed. A
ll R
ight
s R
eser
ved.
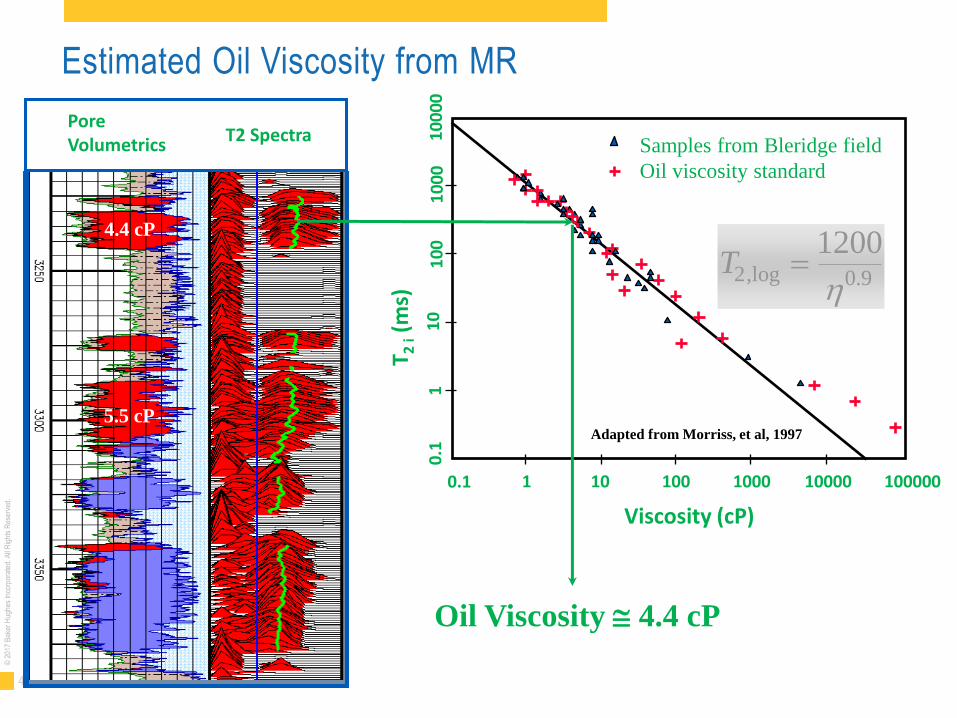
Estimated Oil Viscosity from MR
10
00
1
1
00
1
00
00
0
.1
10
0.1
T 2 i
(ms)
T2 0 9
1200,log .
10 100000 1 1000 100 10000
Samples from Bleridge field
Oil viscosity standard
Viscosity (cP)
Adapted from Morriss, et al, 1997
T2 Spectra Pore Volumetrics
Oil Viscosity 4.4 cP
4.4 cP
5.5 cP
47
© 2
017
Bak
er H
ughe
s In
corp
orat
ed. A
ll R
ight
s R
eser
ved.
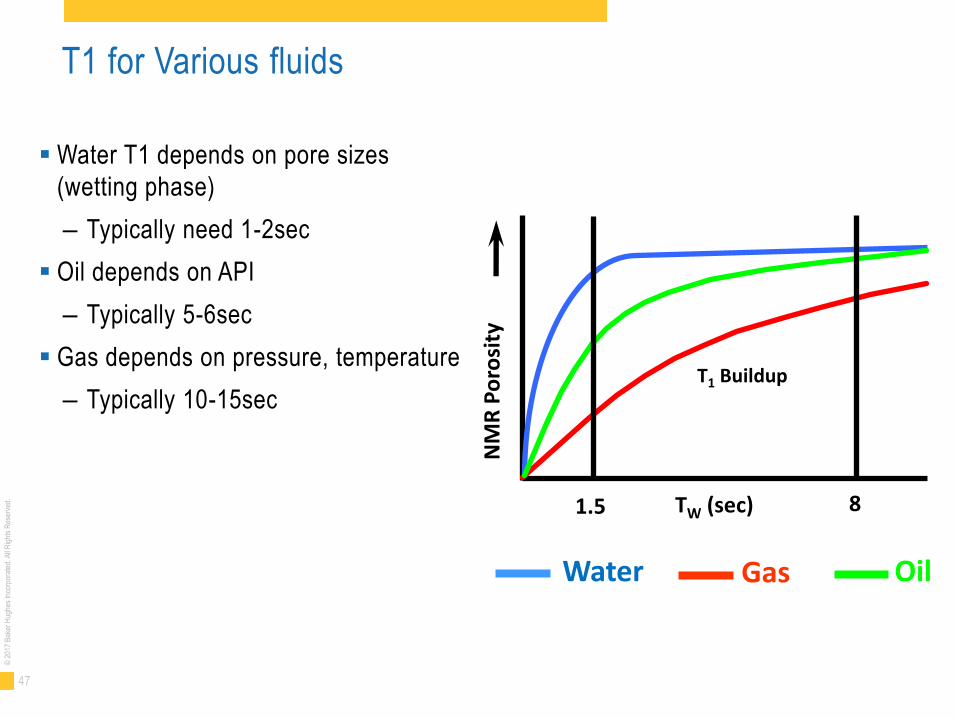
T1 for Various fluids
Water T1 depends on pore sizes
(wetting phase)
– Typically need 1-2sec
Oil depends on API
– Typically 5-6sec
Gas depends on pressure, temperature
– Typically 10-15sec
Oil
TW (sec) 1.5
T1 Buildup
NM
R P
oro
sity
8
Water Gas
48
© 2
017
Bak
er H
ughe
s In
corp
orat
ed. A
ll R
ight
s R
eser
ved.
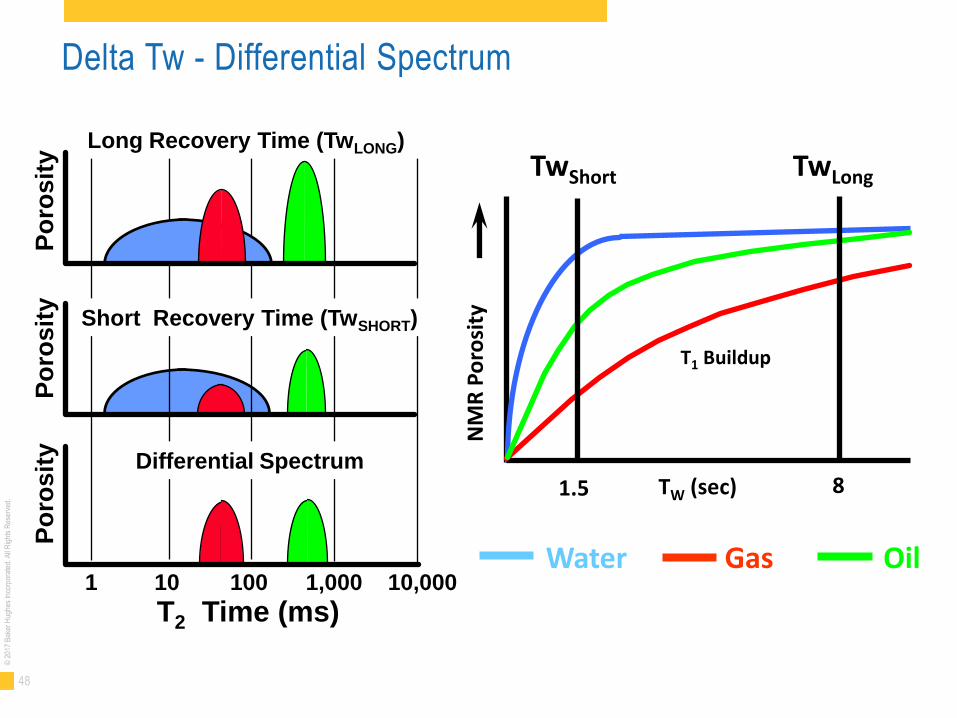
Delta Tw - Differential Spectrum
Oil
T2 Time (ms) 1 10 100 1,000 10,000
Po
rosit
y
Po
rosit
y
Po
rosit
y
Long Recovery Time (TwLONG)
Short Recovery Time (TwSHORT)
Differential Spectrum
Water Gas
TwShort TwLong
TW (sec) 1.5
T1 Buildup
NM
R P
oro
sity
8
49
© 2
017
Bak
er H
ughe
s In
corp
orat
ed. A
ll R
ight
s R
eser
ved.
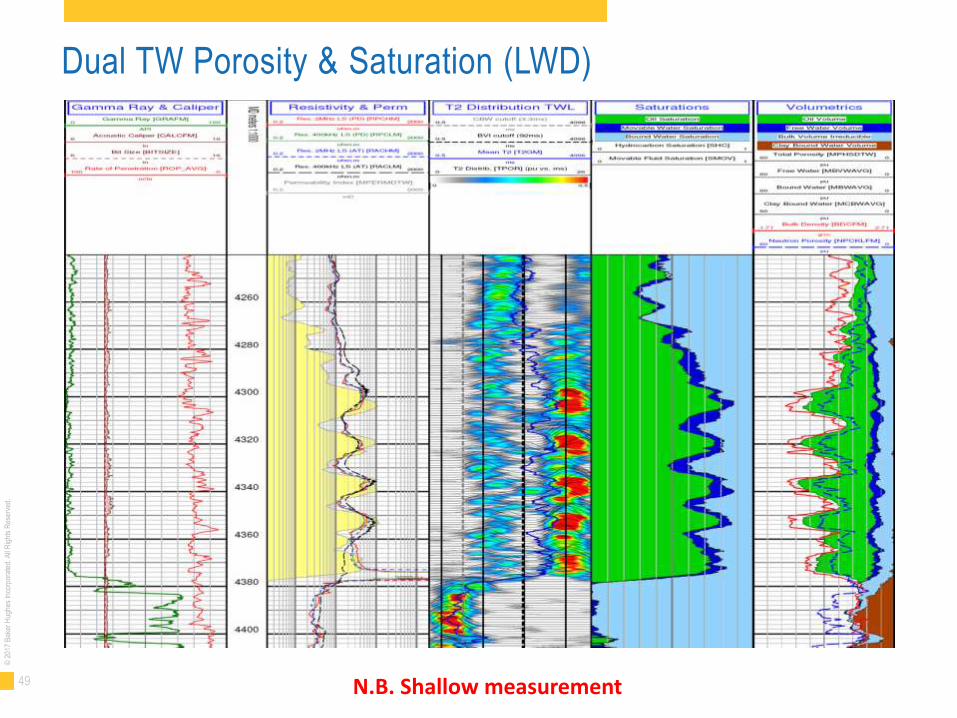
Dual TW Porosity & Saturation (LWD)
N.B. Shallow measurement
50
© 2
017
Bak
er H
ughe
s In
corp
orat
ed. A
ll R
ight
s R
eser
ved.
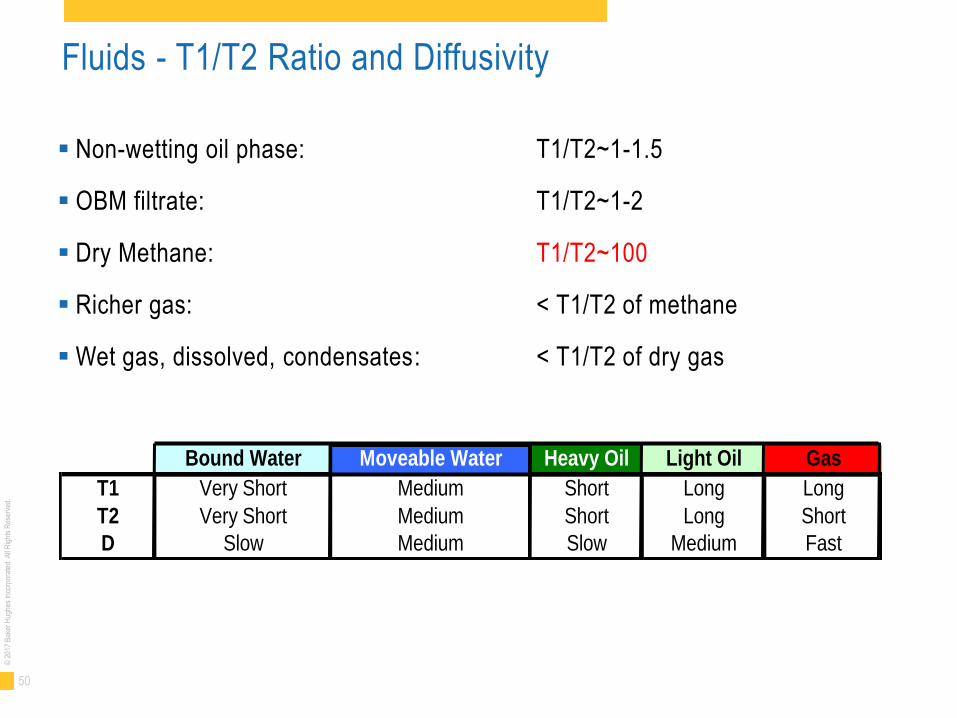
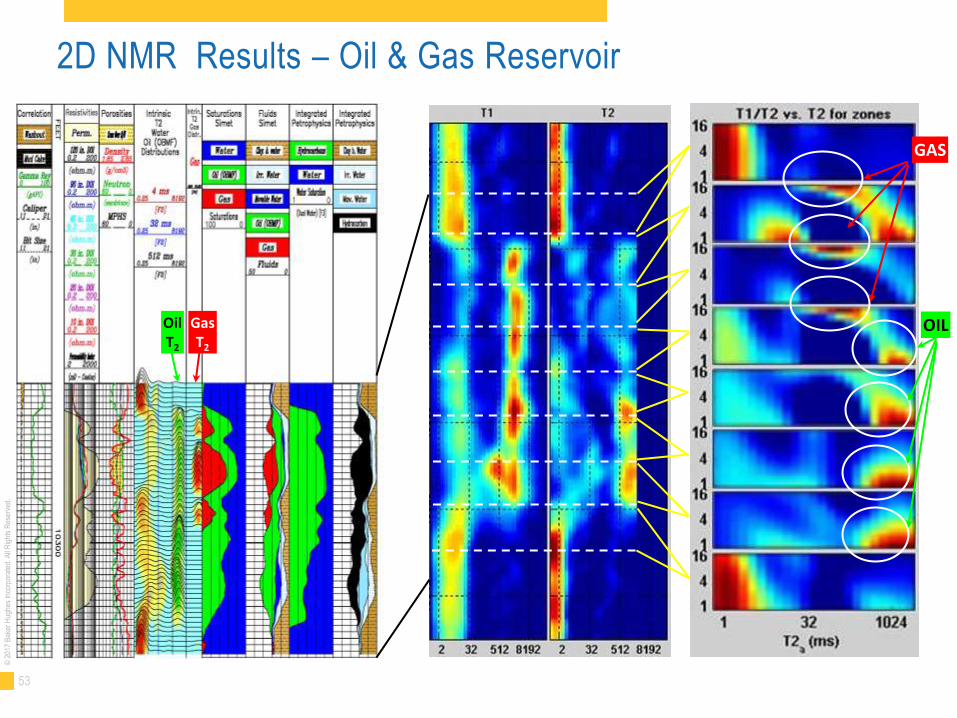
Fluids - T1/T2 Ratio and Diffusivity
Non-wetting oil phase: T1/T2~1-1.5
OBM filtrate: T1/T2~1-2
Dry Methane: T1/T2~100
Richer gas: < T1/T2 of methane
Wet gas, dissolved, condensates: < T1/T2 of dry gas
Bound Water Moveable Water Heavy Oil Light Oil Gas
T1 Very Short Medium Short Long Long
T2 Very Short Medium Short Long Short
D Slow Medium Slow Medium Fast
51
© 2
017
Bak
er H
ughe
s In
corp
orat
ed. A
ll R
ight
s R
eser
ved.
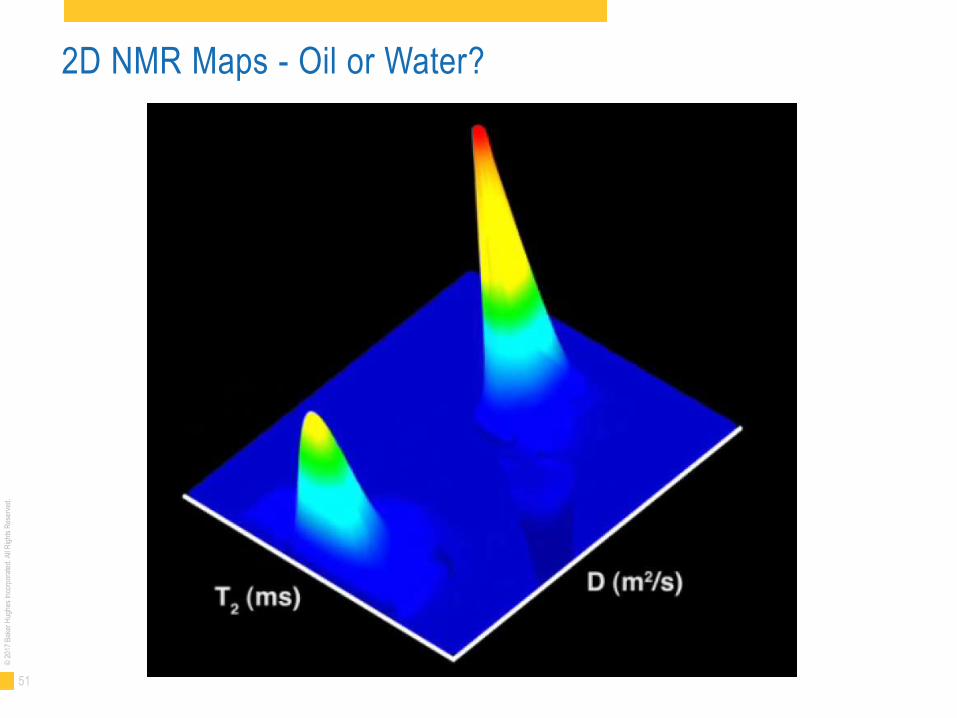
2D NMR Maps - Oil or Water?
52
© 2
017
Bak
er H
ughe
s In
corp
orat
ed. A
ll R
ight
s R
eser
ved.
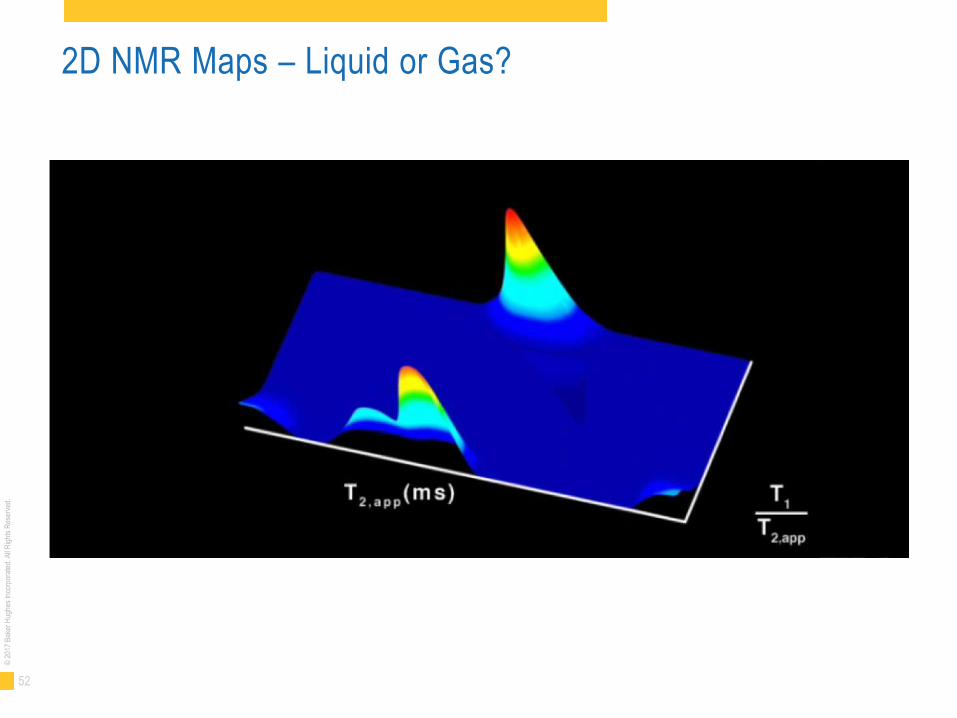
2D NMR Maps – Liquid or Gas?
53
© 2
017
Bak
er H
ughe
s In
corp
orat
ed. A
ll R
ight
s R
eser
ved.
2D NMR Results – Oil & Gas Reservoir
Oil T2
Gas T2
GAS
OIL
54
© 2
017
Bak
er H
ughe
s In
corp
orat
ed. A
ll R
ight
s R
eser
ved.
Clay Minerals
Non-Clay Minerals
CBW
BVMW
BVI
0% 100%
Hydrocarbon
Porosity - MR Analysis
Total Porosity

55
© 2
017
Bak
er H
ughe
s In
corp
orat
ed. A
ll R
ight
s R
eser
ved.
Magnetic Resonance Imaging
Clinical MRI images are determined from -
– Quantity of 1H present in the specimen
– Relaxation times present in the tissue

56
© 2
017
Bak
er H
ughe
s In
corp
orat
ed. A
ll R
ight
s R
eser
ved.
Other Applications
57
© 2
017
Bak
er H
ughe
s In
corp
orat
ed. A
ll R
ight
s R
eser
ved.
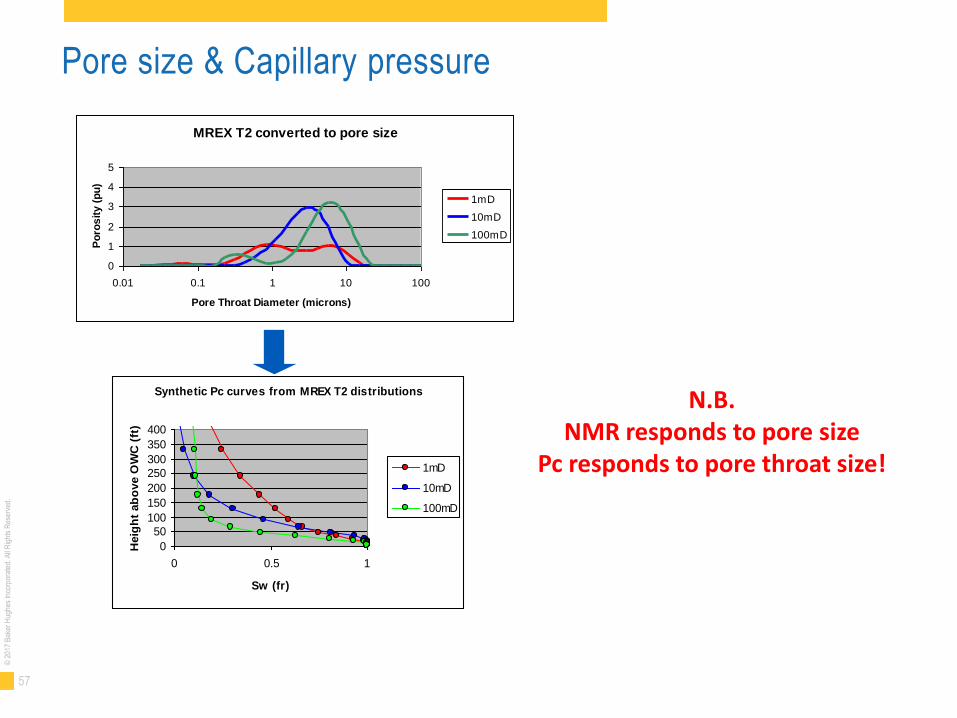
Pore size & Capillary pressure
MREX T2 converted to pore size
0
1
2
3
4
5
0.01 0.1 1 10 100
Pore Throat Diameter (microns)
Po
ros
ity
(p
u)
1mD
10mD
100mD
Synthetic Pc curves from MREX T2 distributions
0
50
100
150
200
250
300
350
400
0 0.5 1
Sw (fr)
Heig
ht
ab
ove O
WC
(ft
)
1mD
10mD
100mD
N.B. NMR responds to pore size
Pc responds to pore throat size!
58
© 2
017
Bak
er H
ughe
s In
corp
orat
ed. A
ll R
ight
s R
eser
ved.
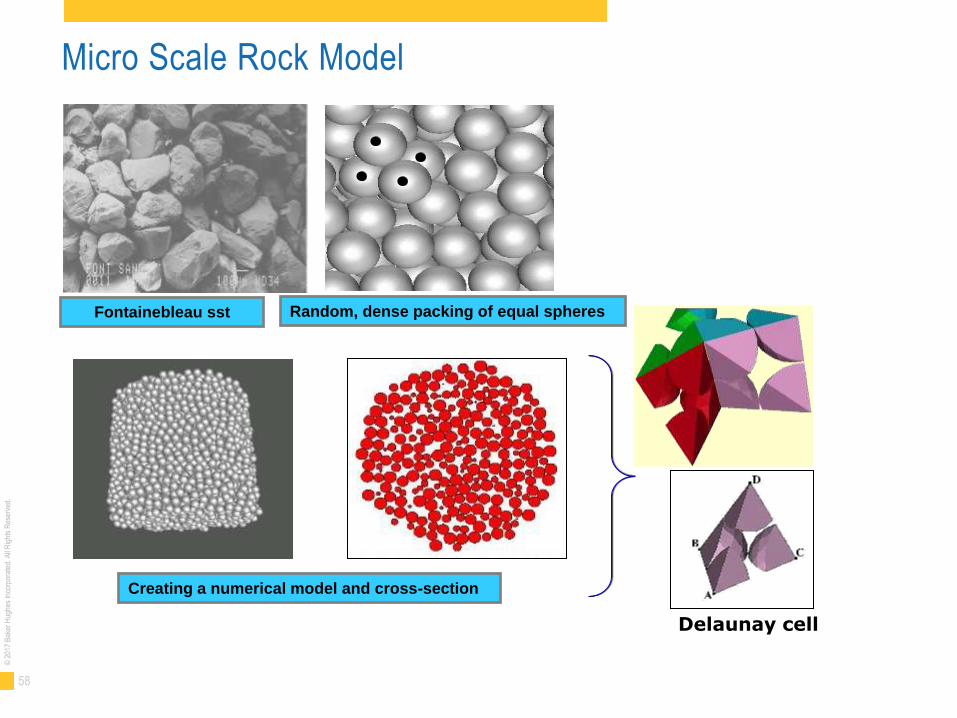
Fontainebleau sst Random, dense packing of equal spheres
Creating a numerical model and cross-section
Delaunay cell
Micro Scale Rock Model
59
© 2
017
Bak
er H
ughe
s In
corp
orat
ed. A
ll R
ight
s R
eser
ved.
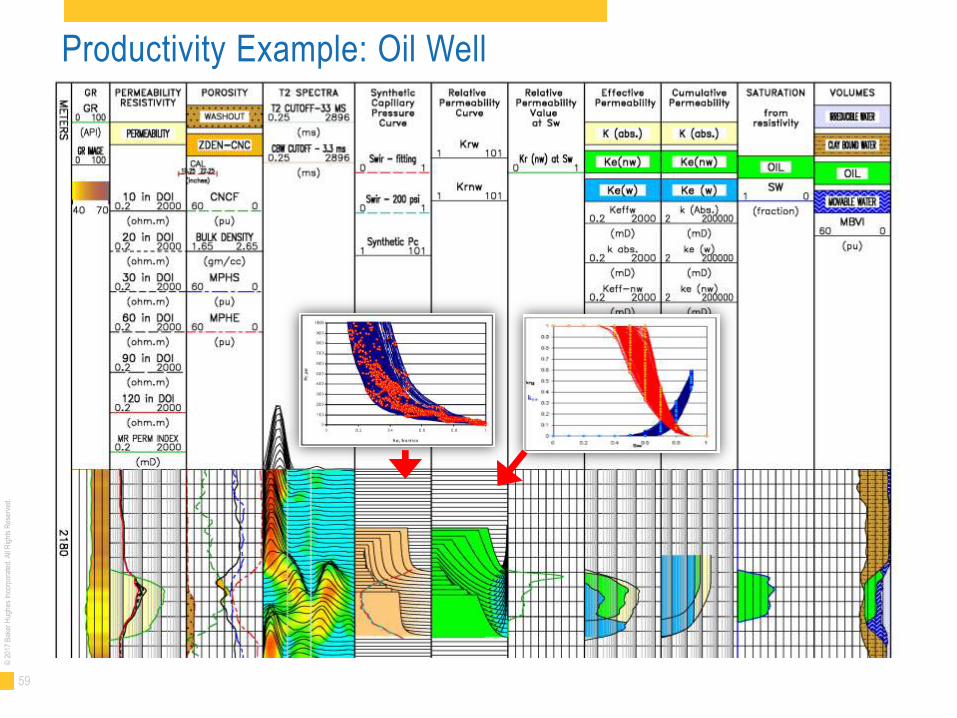
Productivity Example: Oil Well
60
© 2
017
Bak
er H
ughe
s In
corp
orat
ed. A
ll R
ight
s R
eser
ved.
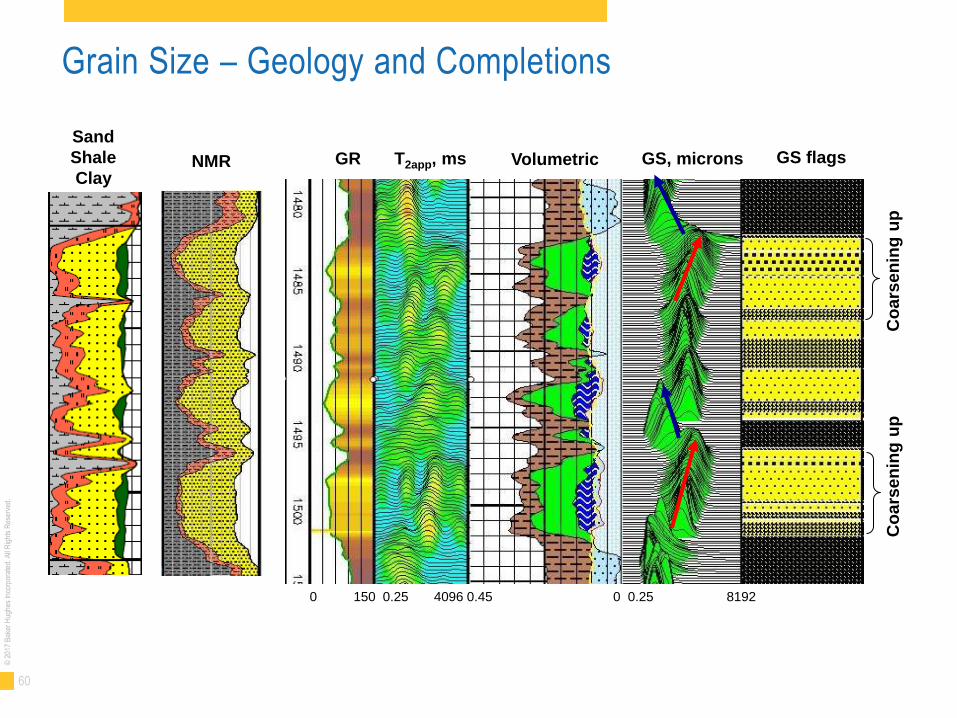
Grain Size – Geology and Completions
0 150 0.25 4096 0.45 0 0.25 8192
Co
ars
en
ing
up
C
oars
en
ing
up
NMR GR T2app, ms GS flags GS, microns Volumetric
Sand
Shale
Clay
61
© 2
017
Bak
er H
ughe
s In
corp
orat
ed. A
ll R
ight
s R
eser
ved.
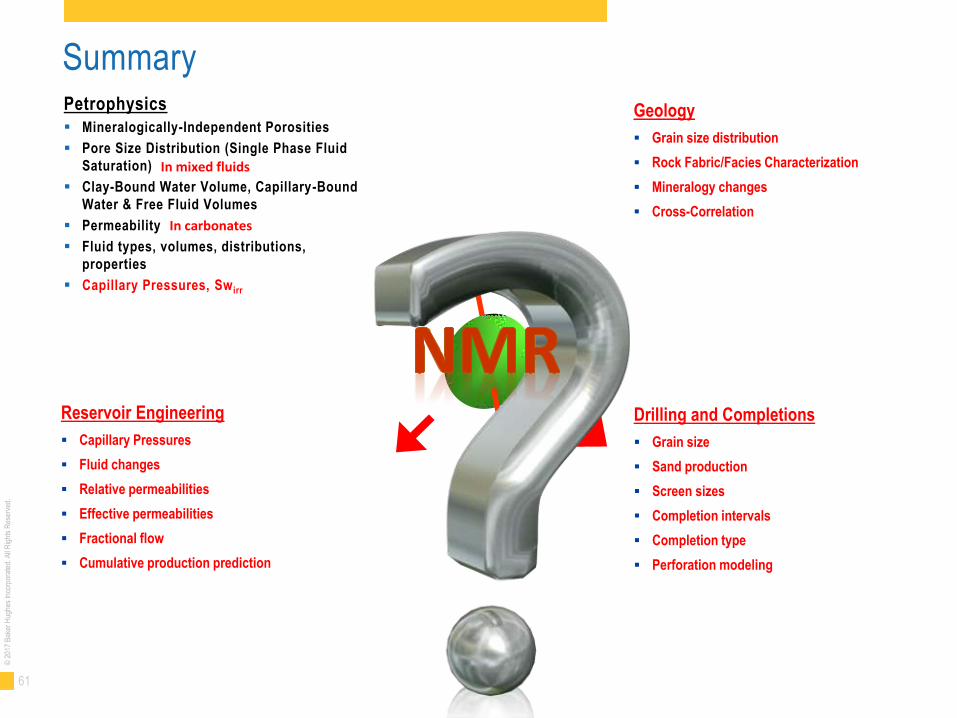
Summary Petrophysics
Mineralogically-Independent Porosities
Pore Size Distribution (Single Phase Fluid
Saturation)
Clay-Bound Water Volume, Capillary-Bound
Water & Free Fluid Volumes
Permeability
Fluid types, volumes, distributions,
properties
Capillary Pressures, Sw irr
Geology
Grain size distribution
Rock Fabric/Facies Characterization
Mineralogy changes
Cross-Correlation
Reservoir Engineering
Capillary Pressures
Fluid changes
Relative permeabilities
Effective permeabilities
Fractional flow
Cumulative production prediction
Drilling and Completions
Grain size
Sand production
Screen sizes
Completion intervals
Completion type
Perforation modeling
In mixed fluids
In carbonates