Embed Size (px)
Citation preview

C M P P a t t e r n D e p e n d e n t M o d e l i n g
Boning 1 MIT-MTL
Characterization Methods and Metricsfor Patterned Wafer CMP
Prof. Duane Boning
Massachusetts Institute of TechnologyElectrical Engineering and Computer Science
Microsystems Technology LaboratoriesRoom 39-567, Cambridge, MA 02139
Phone: (617) 253-0931Email: [email protected]
http://www-mtl.mit.edu/Metrology
C M P P a t t e r n D e p e n d e n t M o d e l i n g
Boning 2 MIT-MTL
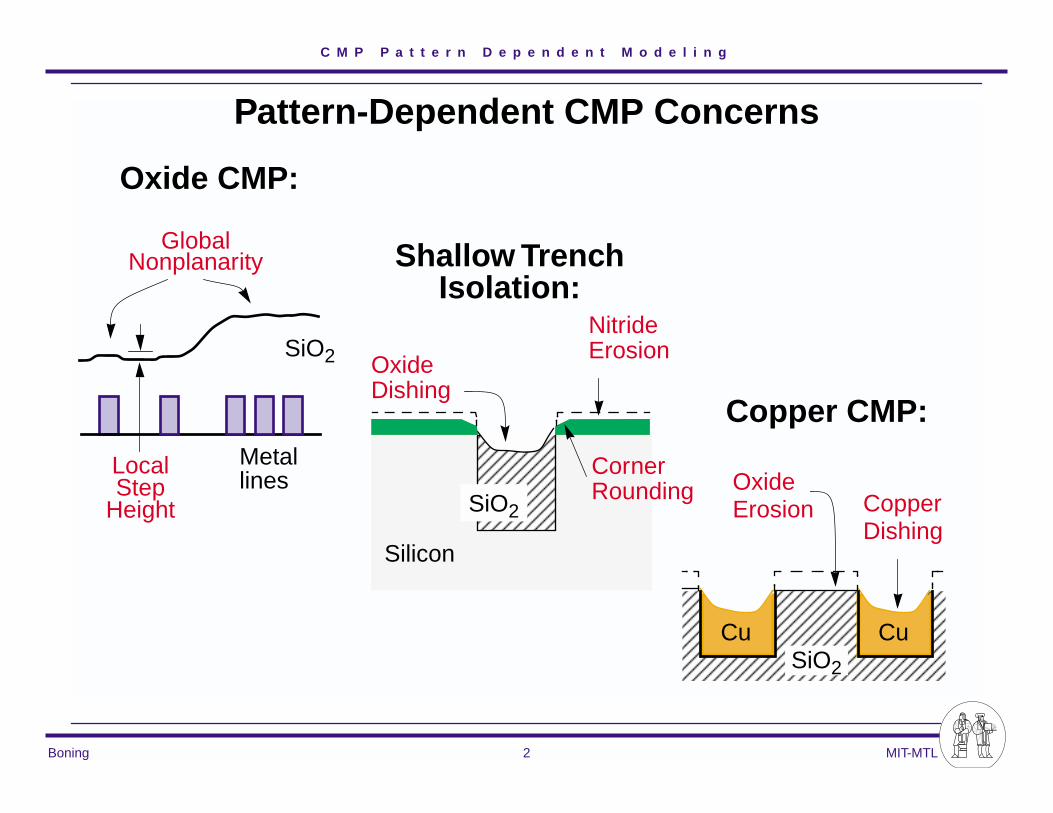
Pattern-Dependent CMP Concerns
GlobalNonplanarity
Oxide CMP:
SiO2
Metallines
Silicon
Oxide
Nitride
SiO2
Erosion
Corner
Dishing
Rounding
Shallow TrenchIsolation:
Copper CMP:
Cu
CopperOxide
SiO2
ErosionDishing
Cu
LocalStep
Height

C M P P a t t e r n D e p e n d e n t M o d e l i n g
Boning 3 MIT-MTL
Preview: Density & Global Planarity in Oxide CMP
Chemical-Mechanical Polishing to
remove local step
Goal: Reality:ρ1=low ρ2=high
t=0
t=ρ1z1/K
t=ρ2z1/K
Oxide Metal
LocalSteps
GlobalNonplanarity
turninto
density density
C M P P a t t e r n D e p e n d e n t M o d e l i n g
Boning 4 MIT-MTL
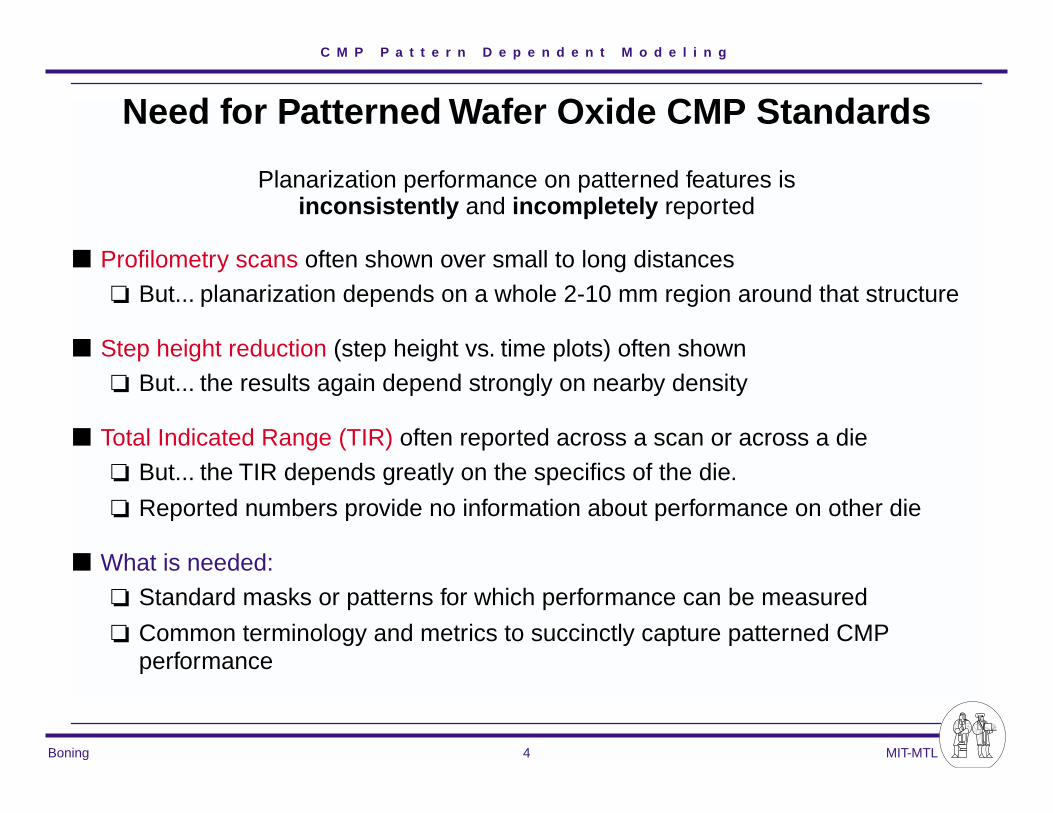
Need for Patterned Wafer Oxide CMP Standards
Planarization performance on patterned features is
inconsistently
and
incompletely
reported
■
Profilometry scans often shown over small to long distances
❏
But... planarization depends on a whole 2-10 mm region around that structure
■
Step height reduction (step height vs. time plots) often shown
❏
But... the results again depend strongly on nearby density
■
Total Indicated Range (TIR) often reported across a scan or across a die
❏
But... the TIR depends greatly on the specifics of the die.
❏
Reported numbers provide no information about performance on other die
■
What is needed:
❏
Standard masks or patterns for which performance can be measured
❏
Common terminology and metrics to succinctly capture patterned CMP performance

C M P P a t t e r n D e p e n d e n t M o d e l i n g
Boning 5 MIT-MTL
Outline
■
Motivation: Pattern Dependencies in Oxide, STI, and Metal Polishing
❏
Key Idea #1: Characterization using Test Masks and Test Patterns
❏
Key Idea #2: Planarization Length as Metric for Oxide CMP
■
Oxide Characterization Mask Evolution
■
Oxide CMP Model -- Effective Density
■
Planarization Length as a Metric
■
Future Issues
❏
Step height dependencies and characterization
❏
Dishing and erosion in STI, metal CMP
❏
Electrical test masks for copper CMP
C M P P a t t e r n D e p e n d e n t M o d e l i n g
Boning 6 MIT-MTL
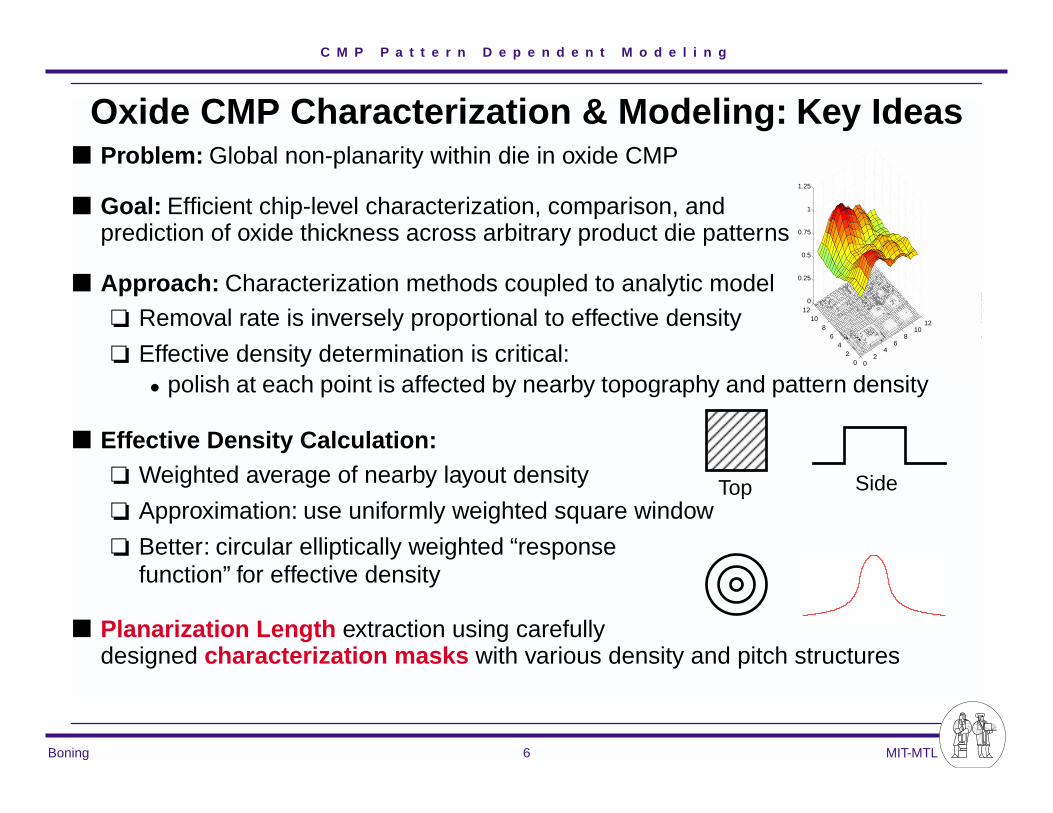
Oxide CMP Characterization & Modeling: Key Ideas■ Problem: Global non-planarity within die in oxide CMP
■ Goal: Efficient chip-level characterization, comparison, and prediction of oxide thickness across arbitrary product die patterns
■ Approach: Characterization methods coupled to analytic model ❏ Removal rate is inversely proportional to effective density
❏ Effective density determination is critical: • polish at each point is affected by nearby topography and pattern density
■ Effective Density Calculation:❏ Weighted average of nearby layout density
❏ Approximation: use uniformly weighted square window
❏ Better: circular elliptically weighted “response function” for effective density
■ Planarization Length extraction using carefully designed characterization masks with various density and pitch structures
02
46
810
12
02
46
810
120
0.25
0.5
0.75
1
1.25
68
1012
0
0.25
0.5
0.75
1
1.25
Top Side
C M P P a t t e r n D e p e n d e n t M o d e l i n g
Boning 7 MIT-MTL
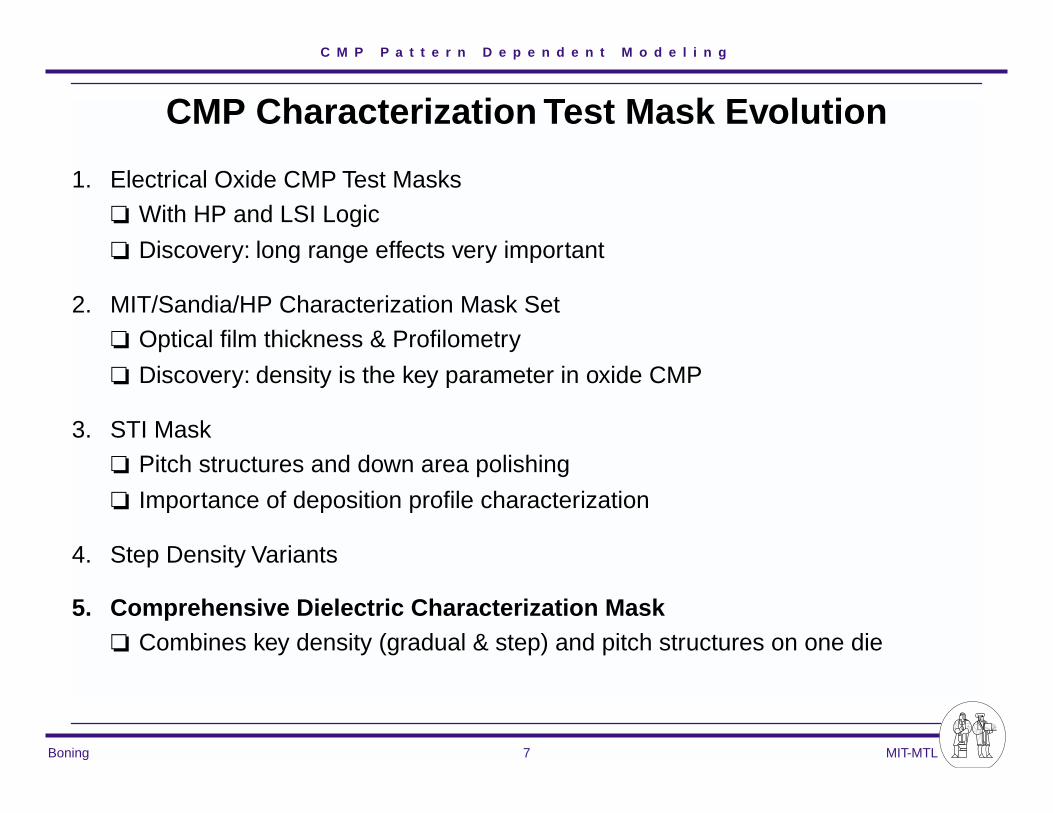
CMP Characterization Test Mask Evolution
1. Electrical Oxide CMP Test Masks
❏
With HP and LSI Logic
❏
Discovery: long range effects very important
2. MIT/Sandia/HP Characterization Mask Set
❏
Optical film thickness & Profilometry
❏
Discovery: density is the key parameter in oxide CMP
3. STI Mask
❏
Pitch structures and down area polishing
❏
Importance of deposition profile characterization
4. Step Density Variants
5. Comprehensive Dielectric Characterization Mask
❏
Combines key density (gradual & step) and pitch structures on one die

C M P P a t t e r n D e p e n d e n t M o d e l i n g
Boning 8 MIT-MTL
1. Electrical Test Mask for Oxide CMP (w/. HP)
LayoutFactorStructures
AreaFactorStructures
■ Line width
■ Line Spacing
■ Finger Length
■ No. of fingers
■ Orientation
■ Interaction Ringor Interaction Distance
■ Area of structure (fixed lw/ls)
C M P P a t t e r n D e p e n d e n t M o d e l i n g
Boning 9 MIT-MTL
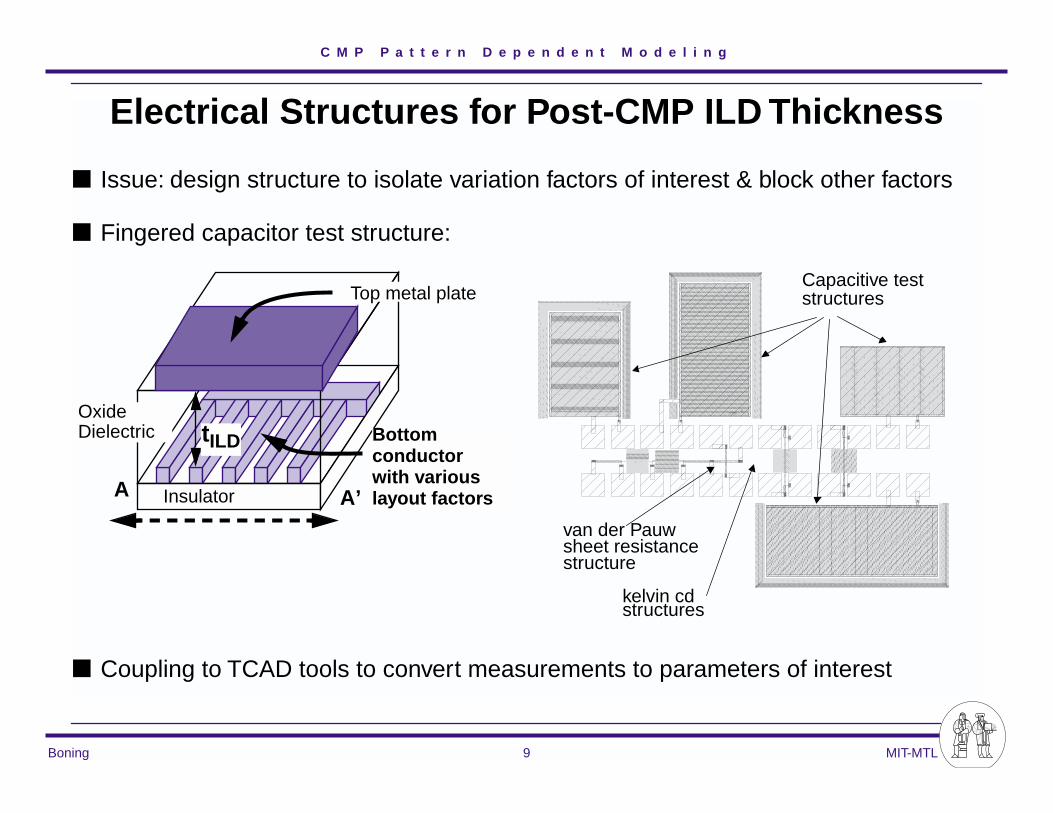
Electrical Structures for Post-CMP ILD Thickness
■ Issue: design structure to isolate variation factors of interest & block other factors
■ Fingered capacitor test structure:
■ Coupling to TCAD tools to convert measurements to parameters of interest
van der Pauwsheet resistance structure
kelvin cdstructures
Capacitive test
Insulator
Bottom conductorwith variouslayout factors
tILD
A A’
Top metal plate
OxideDielectric
structures

C M P P a t t e r n D e p e n d e n t M o d e l i n g
Boning 10 MIT-MTL
Example Results
−0.08 −0.06 −0.04 −0.02 0 0.02 0.04 0.06 0.08
05
1015
2025
05
1015
2025
−0.1
−0.05
0
0.05
0.1
XY
-0.1
-0.05
0
0.05
0.1
(nor
mal
ized
)IL
D T
hick
ness
Spatial Die Pattern
■ Layout factors important -- but at a much longer length scale than expected in the original mask design.
C M P P a t t e r n D e p e n d e n t M o d e l i n g
Boning 11 MIT MTL
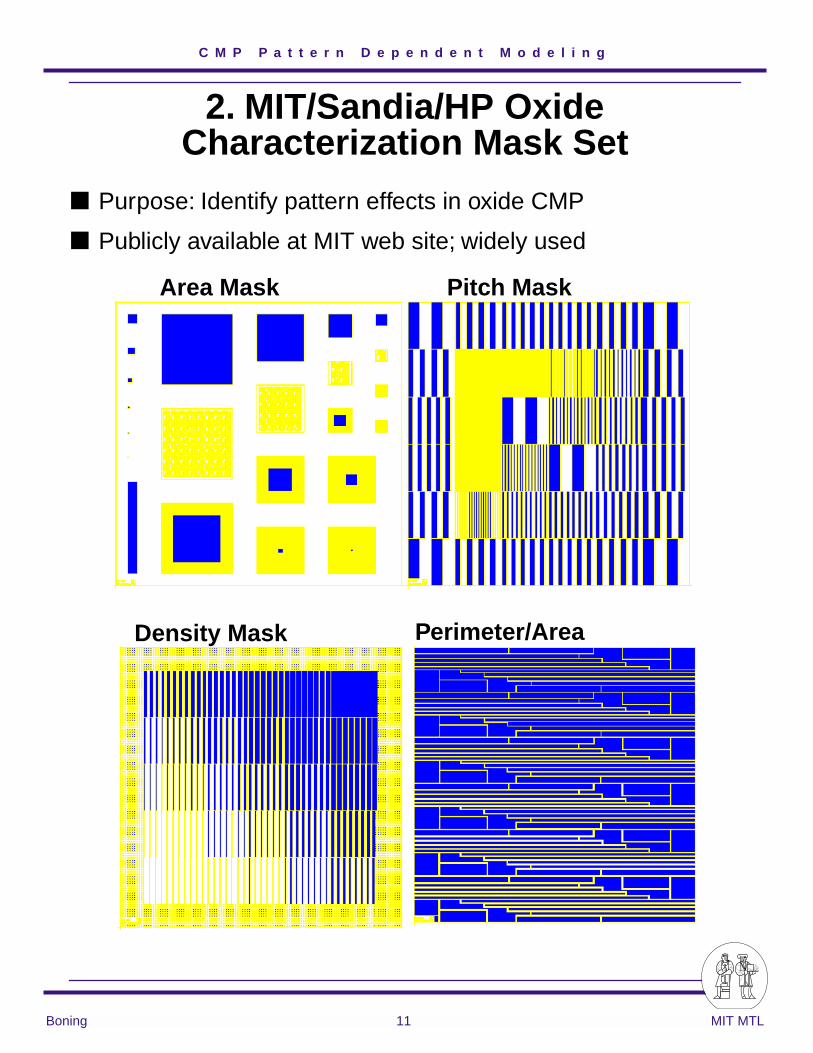
2. MIT/Sandia/HP Oxide Characterization Mask Set
■ Purpose: Identify pattern effects in oxide CMP
■ Publicly available at MIT web site; widely used
Area Mask Pitch Mask
Density Mask Perimeter/Area
C M P P a t t e r n D e p e n d e n t M o d e l i n g
Boning 12 MIT-MTL
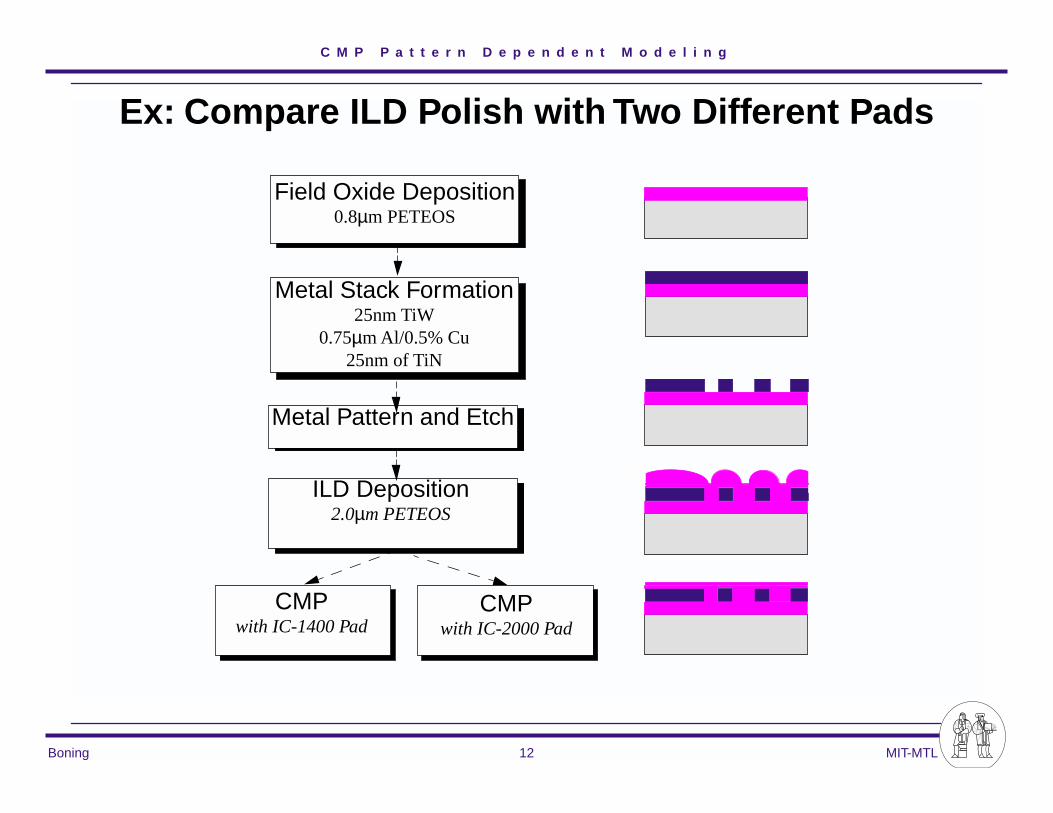
Ex: Compare ILD Polish with Two Different Pads
Field Oxide Deposition0.8µm PETEOS
Metal Stack Formation25nm TiW
0.75µm Al/0.5% Cu25nm of TiN
Metal Pattern and Etch
ILD Deposition2.0µm PETEOS
CMPwith IC-1400 Pad
CMPwith IC-2000 Pad
C M P P a t t e r n D e p e n d e n t M o d e l i n g
Boning 13 MIT MTL
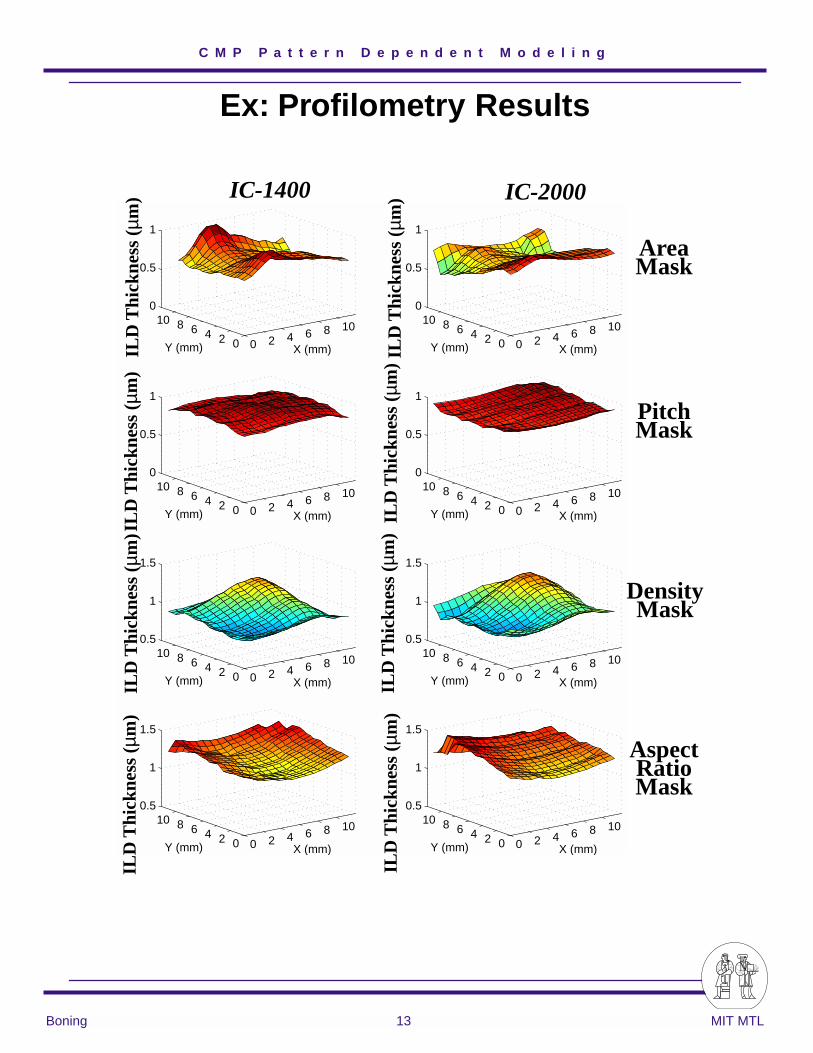
Ex: Profilometry Results
0 2 4 6 8 10
02468100
0.5
1
X (mm)Y (mm)
ILD
Thi
ckne
ss (
mic
rons
)
0 2 4 6 8 10
02468100
0.5
1
X (mm)Y (mm)
0 2 4 6 8 10
02468100
0.5
1
X (mm)Y (mm)
ILD
Thi
ckne
ss (
mic
rons
)
0 2 4 6 8 10
02468100
0.5
1
X (mm)Y (mm)
0 2 4 6 8 10
02468100.5
1
1.5
X (mm)Y (mm)
ILD
Thi
ckne
ss (
mic
rons
)
0 2 4 6 8 10
02468100.5
1
1.5
X (mm)Y (mm)
0 2 4 6 8 10
02468100.5
1
1.5
X (mm)Y (mm)
ILD
Thi
ckne
ss (
mic
rons
)
0 2 4 6 8 10
02468100.5
1
1.5
X (mm)Y (mm)
ILD
Thi
ckne
ss (
µm)
ILD
Thi
ckne
ss (
µm)
ILD
Thi
ckne
ss (
µm)
ILD
Thi
ckne
ss (
µm)
ILD
Thi
ckne
ss (
µm)
ILD
Thi
ckne
ss (
µm)
ILD
Thi
ckne
ss (
µm)
ILD
Thi
ckne
ss (
µm)
AreaMask
PitchMask
DensityMask
AspectRatioMask
IC-1400 IC-2000

C M P P a t t e r n D e p e n d e n t M o d e l i n g
Boning 14 MIT MTL
Conclusion: Density is Key Effect
■ Universal linear relationship between final oxide thickness and effective density
IC1400 IC2000
0 2 4 6 8 10−0.5
−0.25
0
0.25
0.5
Area (mm^2)
ILD
Thi
ckne
ss (
mic
rons
)Thickness vs. Area
IC1400 IC2000
0 250 500 750 10000
0.25
0.5
0.75
1
Pitch (microns)
ILD
Thi
ckne
ss (
mic
rons
)
Thickness vs. Pitch
IC1400 IC2000
0 0.25 0.5 0.75 10.5
0.75
1
1.25
1.5
Density
ILD
Thi
ckne
ss (
mic
rons
)
Thickness vs. Density
IC1400 IC2000
0 25 50 75 100−0.5
−0.25
0
0.25
0.5
Aspect Ratio
ILD
Thi
ckne
ss (
mic
rons
)
Thickness vs. Aspect Ratio
∆ IL
D T
hick
ness
(µm
)
ILD
Thi
ckne
ss (
µm)
ILD
Thi
ckne
ss (
µm)
∆ IL
D T
hick
ness
(µm
)
Area (mm2) Pitch (µm)
Density Aspect Ratio
Thickness vs. Area Thickness vs. Pitch
Thickness vs. Density Thickness vs. Aspect Ratio

C M P P a t t e r n D e p e n d e n t M o d e l i n g
Boning 15 MIT-MTL
3. Shallow Trench Isolation Masks (w/ AMAT, Sandia)
■ Oxide Polish Phase:❏ Density dependence extraction
■ Nitride Over-Polish Phase: ❏ Study dishing and erosion as function of density, pitch, feature size
Silicon
Oxide
Nitride
SiO2
Erosion
Corner
Dishing
Rounding
T. Pan et al., VMIC ‘98
Integrates
- density- pitch- SEM
structures on one mask.
C M P P a t t e r n D e p e n d e n t M o d e l i n g
Boning 16 MIT-MTL
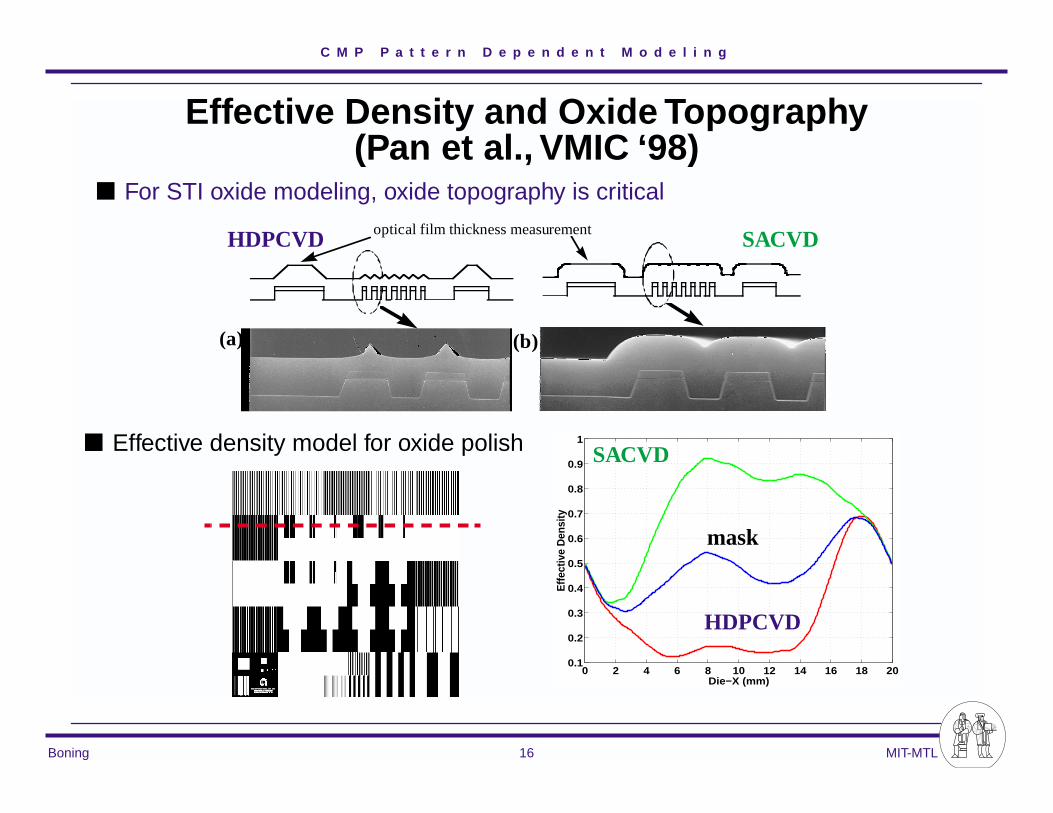
Effective Density and Oxide Topography(Pan et al., VMIC ‘98)
0 2 4 6 8 10 12 14 16 18 200.1
0.2
0.3
0.4
0.5
0.6
0.7
0.8
0.9
1
Die−X (mm)
Effe
ctiv
e D
ensi
ty
SACVD
mask
HDPCVD
■ For STI oxide modeling, oxide topography is critical
optical film thickness measurement
(a) (b)
■ Effective density model for oxide polish
HDPCVD SACVD
C M P P a t t e r n D e p e n d e n t M o d e l i n g
Boning 17 MIT-MTL
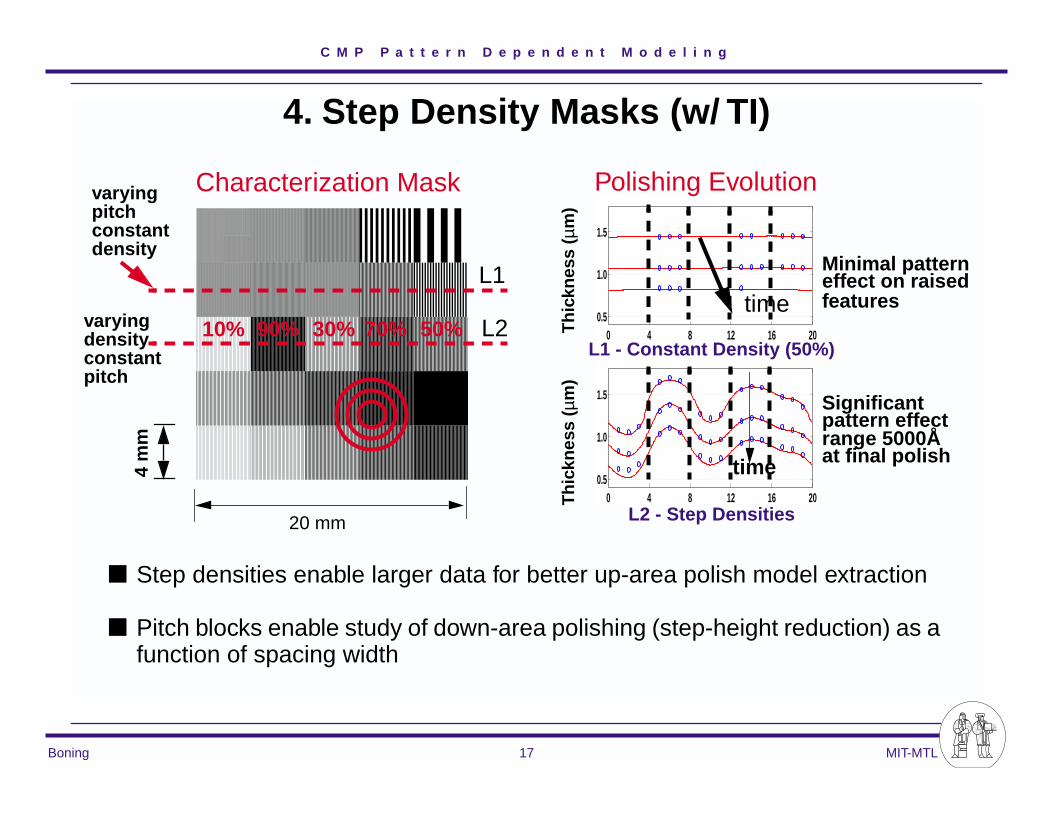
4. Step Density Masks (w/ TI)
0 4 8 12 16 200.5
1.0
1.5
0 4 8 12 16 200.5
1.0
1.5
20 mm
Characterization Mask
L1
L2L1 - Constant Density (50%)
L2 - Step Densities
Th
ickn
ess
(µm
)T
hic
knes
s (µ
m)
10% 90% 30% 70% 50%
Minimal patterneffect on raised
Significantpattern effectrange 5000Å
Polishing Evolution
time4 m
m
at final polish
varying pitch constantdensity
varying density constantpitch
time features
■ Step densities enable larger data for better up-area polish model extraction
■ Pitch blocks enable study of down-area polishing (step-height reduction) as a function of spacing width

C M P P a t t e r n D e p e n d e n t M o d e l i n g
Boning 18 MIT-MTL
5. MIT Comprehensive Dielectric Characterization Mask
■ 20mm x 20mm die size
■ Gradual density region
■ Step density region
■ Pitch region (constant 50% density)
■ SEM/Dielectric deposition characterization structures
■ Feature sizes down to 0.25µm
20
50
60 80
10030
40
70 90
20 m
m
10 90 30 70 50
P10 P50 P100
P500P200P30P80
P0.5 P0.7
P1 P2
10
P20
4 m
m
20 mm
P4 P6
P8 P10
GRADUAL
STEP
PITCHBIAS
C M P P a t t e r n D e p e n d e n t M o d e l i n g
Boning 19 MIT-MTL
Analytic CMP Model (Stine et al., CMPMIC ‘97)
■ CMP Characterization Mask Set❏ Pitch (linewidth and line space), perimeter, and structure area are minor effects
❏ Conclusion: Effective density is the key layout parameter
❏ Observe a simple oxide thickness vs. effective density dependence!
■ Oxide CMP Global Planarization Model
1. Polish rate at each point on the die is inversely proportional to the effective pattern density
2. Effective pattern density at each point depends on the nearby topography and density
3. The effective pattern density can be determined by the planarization length (or planarization window)
4. The planarization length must be characterized for a given CMP consumable set and process

C M P P a t t e r n D e p e n d e n t M o d e l i n g
Boning 20 MIT-MTL
Oxide CMP Pattern Dependent Model (Stine et al. ‘97)
■ Evaluation of pattern density is key to model development
■ Removal rate inversely proportional to density:
■ Density assumed constant (equal to pattern) until local step has been removed:
■ Final oxide thickness related to effective density:
dzdt----- k p pv– K
ρ x y,( )-----------------–= =
ρ x y z, ,( )ρ0 x y,( )
1
=z z0 z1–>
z z0 z1–<
zz0
Ktρ0 x y,( )---------------------
–
z0 z1– Kt– ρ0 x y,( )z1+
Kt ρ0z1<
Kt ρ0z1>
=
z1
z=0
z > z0-z1
z < z0-z1
up areas down areas
Metal
z0
Oxide
z = final oxide thickness over metal features
K = blanket oxide removal rate for a die of inter-est
t = polish timeρ0 = local pattern density
ρ0 x y,( )

C M P P a t t e r n D e p e n d e n t M o d e l i n g
Boning 21 MIT-MTL
Effective Density Using a Moving Window
L■ Effective density at X for a square constant weight
window is:
❏ L is defined as planarization length
■ The long-range “moving average” density calculation corresponds to a simple convolution picture:
❏ d(x,y) is the effective density at (x,y)
❏ p(x,y) is the “planarization impulse response” (weighting function) to raised features
❏ l(x,y) is the local (feature-scale) density
Raised area in square
Total area of square
d x y,( ) p x y,( ) l x y,( )⊗=
X
X
L
C M P P a t t e r n D e p e n d e n t M o d e l i n g
Boning 22 MIT-MTL
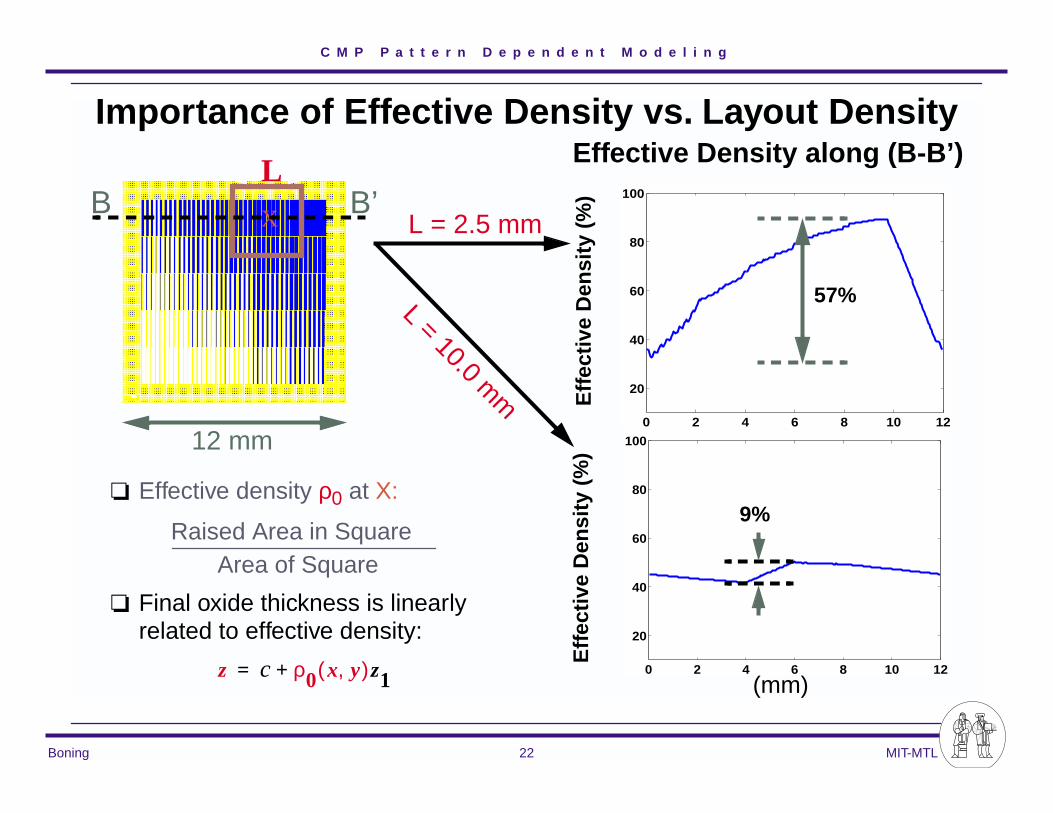
Importance of Effective Density vs. Layout Density
0 2 4 6 8 10 12
20
40
60
80
100
0 2 4 6 8 10 12
20
40
60
80
100
❏ Effective density ρ0 at X:
❏ Final oxide thickness is linearly related to effective density:
Raised Area in SquareArea of Square
z c ρ0 x y,( )z1+=
LX
12 mm
Eff
ecti
ve D
ensi
ty (
%)
Eff
ecti
ve D
ensi
ty (
%)
9%
57%
L = 2.5 mm
L = 10.0 mm
Effective Density along (B-B’)
B B’
(mm)
C M P P a t t e r n D e p e n d e n t M o d e l i n g
Boning 23 MIT-MTL
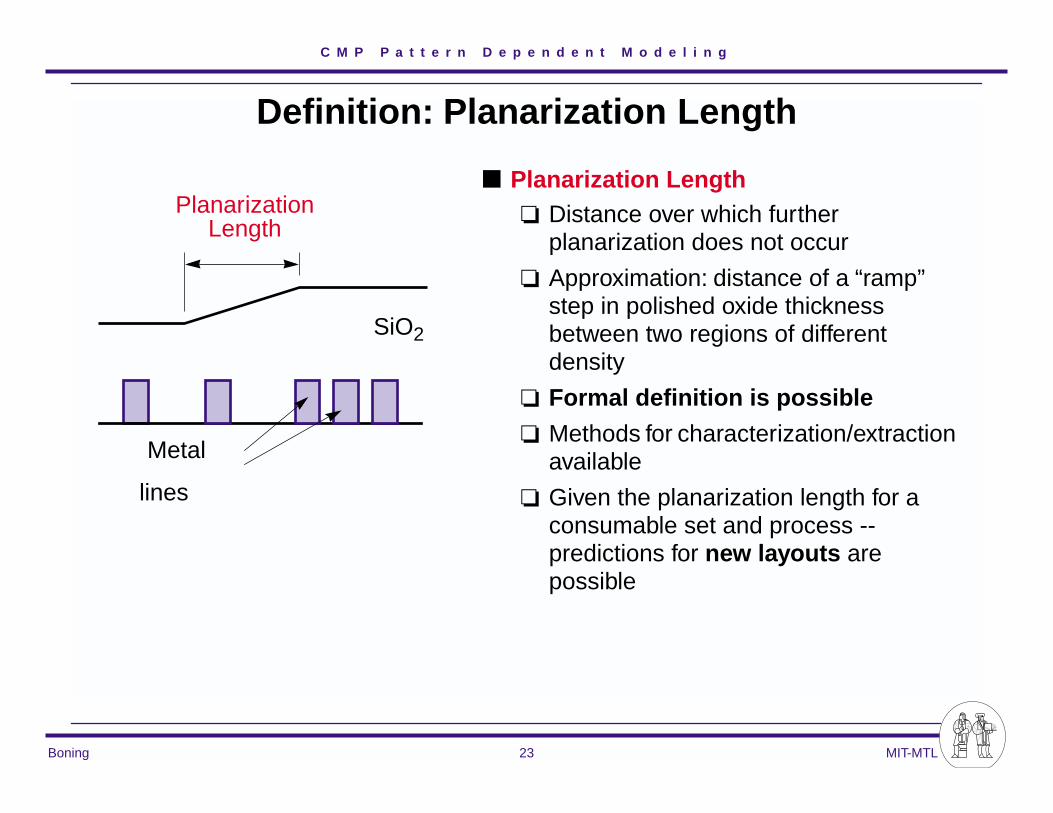
Definition: Planarization Length
PlanarizationLength
SiO2
Metal
lines
■ Planarization Length ❏ Distance over which further
planarization does not occur
❏ Approximation: distance of a “ramp” step in polished oxide thickness between two regions of different density
❏ Formal definition is possible
❏ Methods for characterization/extraction available
❏ Given the planarization length for a consumable set and process -- predictions for new layouts are possible

C M P P a t t e r n D e p e n d e n t M o d e l i n g
Boning 24 MIT-MTL
Definitions: Step Height and Local Planarity
Oxide/ILD Metal
h0 = step heightstep height reduction as function of polish time
local planarity: when local
feature step has been removed
C M P P a t t e r n D e p e n d e n t M o d e l i n g
Boning 25 MIT-MTL
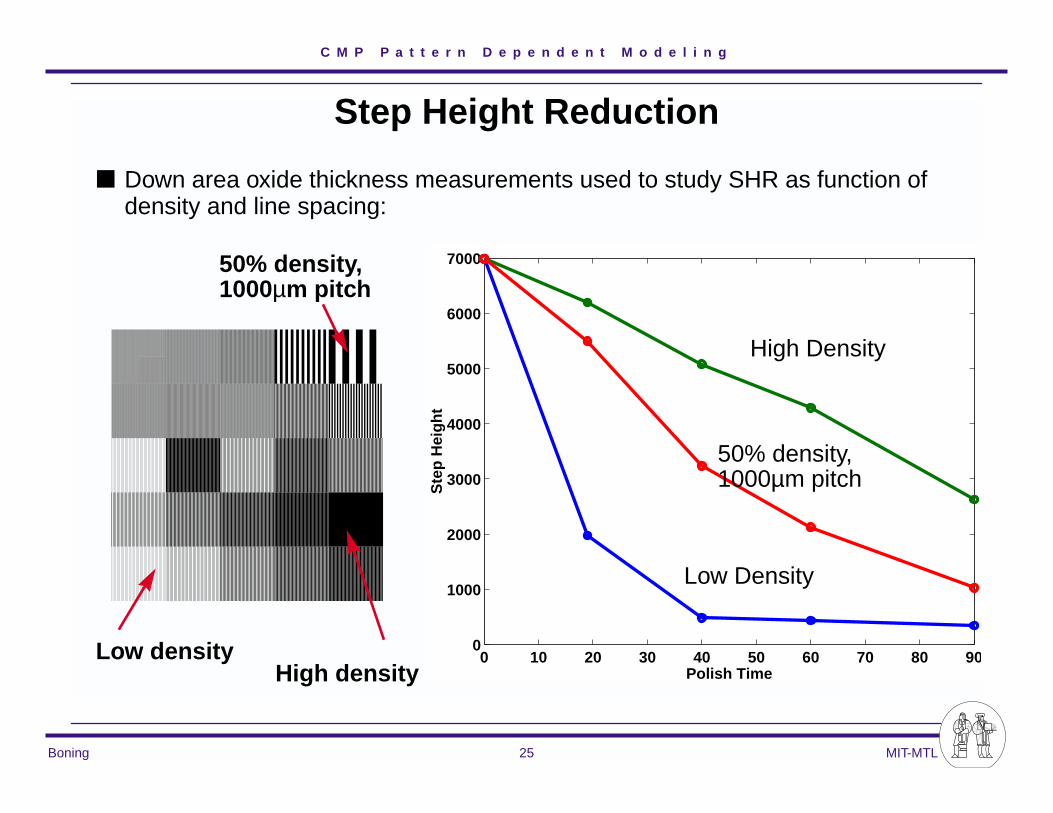
Step Height Reduction
0 10 20 30 40 50 60 70 80 900
1000
2000
3000
4000
5000
6000
7000
Ste
p H
eig
ht
Polish Time
50% density,
High densityLow density
Low Density
1000µm pitch
High Density
50% density,1000µm pitch
■ Down area oxide thickness measurements used to study SHR as function of density and line spacing:

C M P P a t t e r n D e p e n d e n t M o d e l i n g
Boning 26 MIT-MTL
Definition: Total Indicated Range (TIR)
■ TIR = Total Indicated Range = Max ILD thickness -
Min ILD thickness❏ Measures total within-die (or within-
scan) global nonuniformity
❏ Good figure of merit for a given mask layout and process/consumable set
❏ Must know where high and low oxide thicknesses are located in die
❏ Provides little information that is applicable to other masksExample profilometry scans over
existing test structures on a die.
Scan actually depends on layout several mm away

C M P P a t t e r n D e p e n d e n t M o d e l i n g
Boning 27 MIT-MTL
Density Mask: Effective vs. Layout Density for Different Planarization Lengths
LX
■ Effective density (and thus ILD thickness) changes depending on size of window■ The location of the high and low spots on the MIT density mask change location
depend on the pad/process (planarization length)!
0.00
0.20
0.40
0.60
0.80
1.00
1.20
0.04
0.12
0.2
0.28
0.36
0.44
0.52
0.6
0.68
0.76
0.84
0.92 1
Layout Density
Eff
ec
tiv
e
De
ns
ity 2 mm
3 mm
4 mm
5 mm
6 mm
7 mm
8 mm
9 mm
Acknowledge Doug Goetz (3M) for
observations on effective density
Planariz.Length

C M P P a t t e r n D e p e n d e n t M o d e l i n g
Boning 28 MIT-MTL
Planarization Length Extraction
LX
z
ρ
L
Min
imiz
e S
um
of
Sq
uar
e E
rro
r
CandidatePlanarization
Length
Effective Densityfor Measured
Points
Fit/Plot Oxidevs. Effective
Density
Rep
eat
to
C M P P a t t e r n D e p e n d e n t M o d e l i n g
Boning 29 MIT-MTL
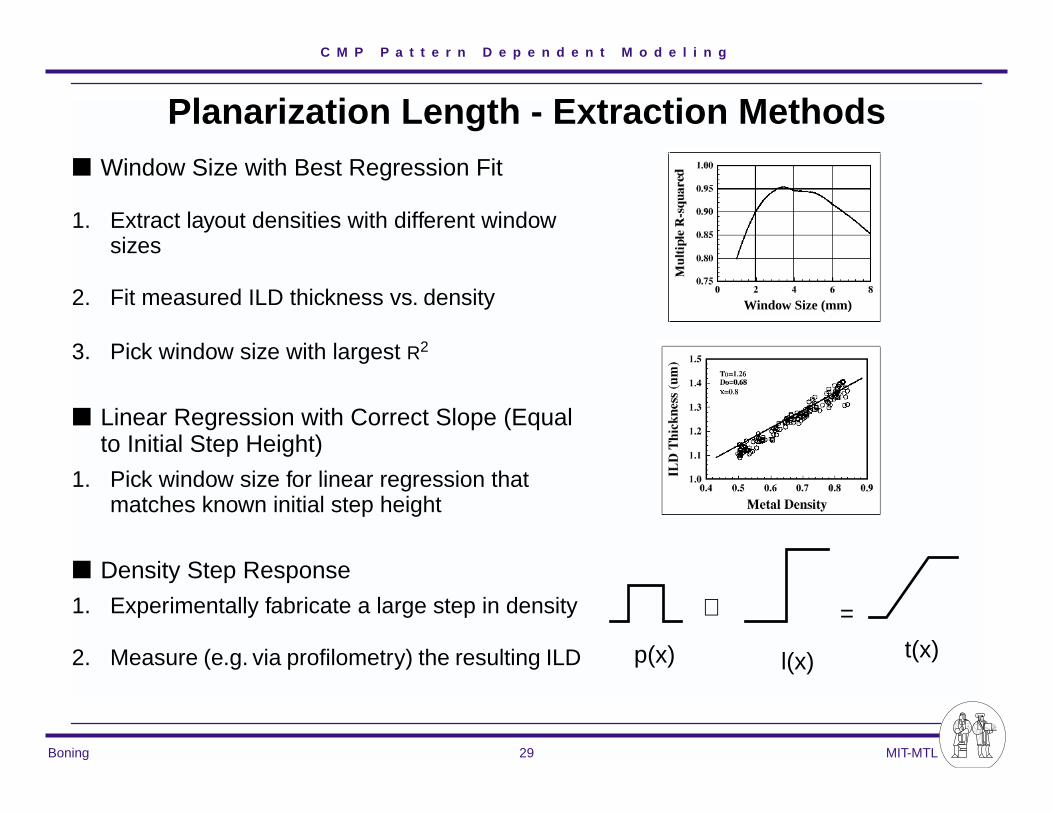
Planarization Length - Extraction Methods■ Window Size with Best Regression Fit
1. Extract layout densities with different window sizes
2. Fit measured ILD thickness vs. density
3. Pick window size with largest R2
■ Linear Regression with Correct Slope (Equal to Initial Step Height)
1. Pick window size for linear regression that matches known initial step height
■ Density Step Response
1. Experimentally fabricate a large step in density
2. Measure (e.g. via profilometry) the resulting ILD
Window Size (mm)
⊗ =
l(x) t(x)p(x)
C M P P a t t e r n D e p e n d e n t M o d e l i n g
Boning 30 MIT-MTL
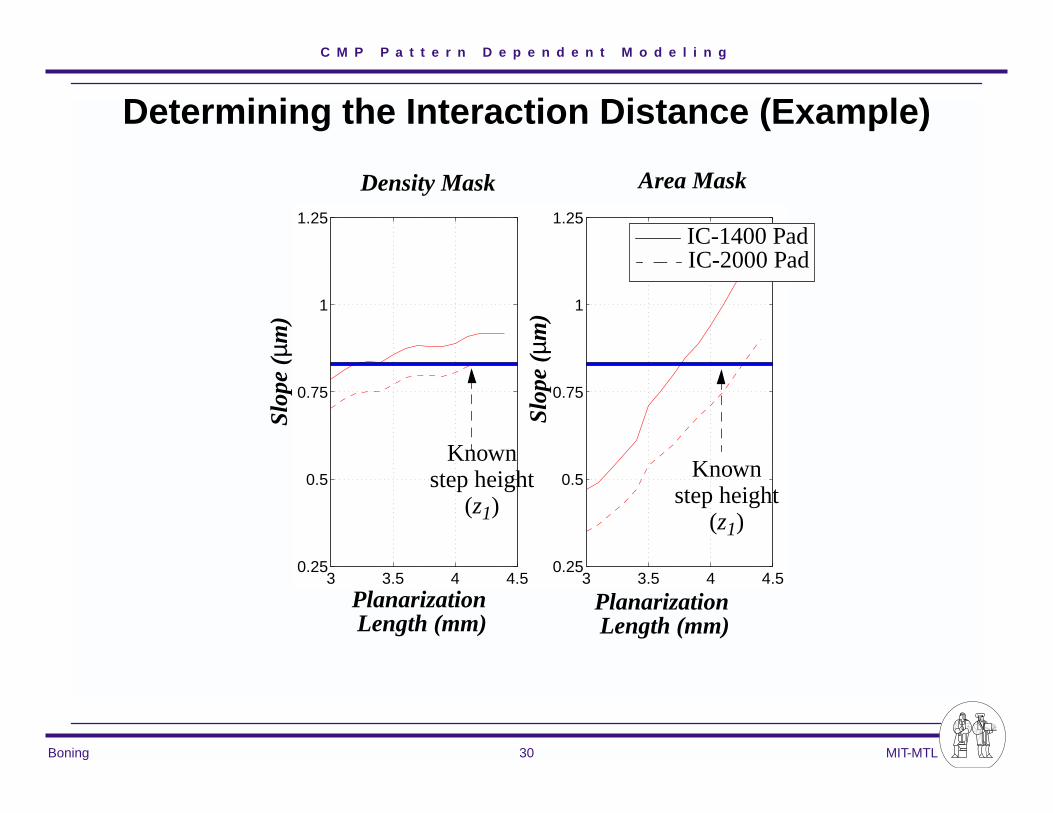
Determining the Interaction Distance (Example)
3 3.5 4 4.50.25
0.5
0.75
1
1.25
3 3.5 4 4.50.25
0.5
0.75
1
1.25
Planarization
Slop
e (µ
m)
IC-1400 PadIC-2000 Pad
Knownstep height
(z1)Sl
ope
(µm
)
Knownstep height
(z1)
Length (mm)Planarization Length (mm)
Density Mask Area Mask

C M P P a t t e r n D e p e n d e n t M o d e l i n g
Boning 31 MIT-MTL
Planarization Length & WIndow Size
■ Effective Density Window IDENTICAL TO “ Planarization Length”❏ Density window captures what nearby topography the process “sees” at point X.
■ Alternative Characterization Method: Fabricate a layout “ step density”❏ The resulting oxide thickness provides a “step density response” of the pad and
process -- that can be measured experimentally
10%90%
⊗ =
l(x) t(x)p(x)
90%10%TopView
SideView
planarizationimpulse response
local layoutdensity final oxide
thickness
⊗underlying metal pattern with given density
XX ... X
C M P P a t t e r n D e p e n d e n t M o d e l i n g
Boning 32 MIT-MTL
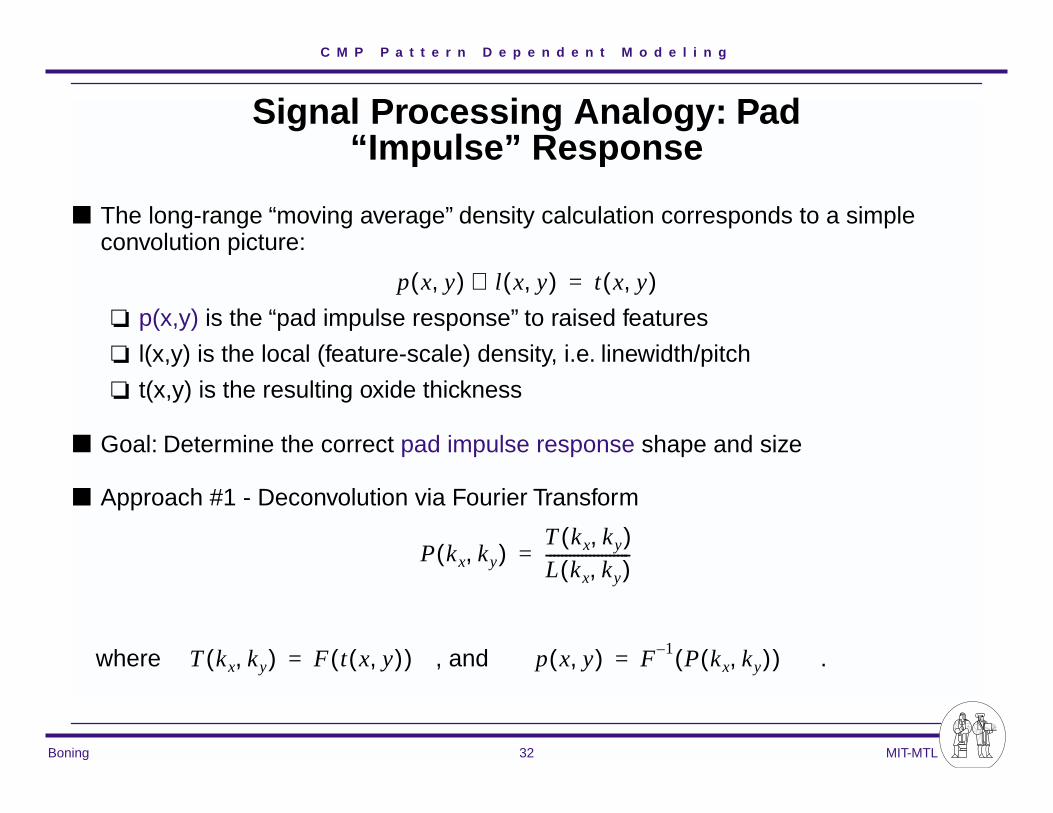
Signal Processing Analogy: Pad “ Impulse” Response
■ The long-range “moving average” density calculation corresponds to a simple convolution picture:
❏ p(x,y) is the “pad impulse response” to raised features
❏ l(x,y) is the local (feature-scale) density, i.e. linewidth/pitch
❏ t(x,y) is the resulting oxide thickness
■ Goal: Determine the correct pad impulse response shape and size
■ Approach #1 - Deconvolution via Fourier Transform
where , and .
p x y,( ) l x y,( )⊗ t x y,( )=
P kx ky,( )T kx ky,( )L kx ky,( )---------------------=
T kx ky,( ) F t x y,( )( )= p x y,( ) F 1– P kx ky,( )( )=
C M P P a t t e r n D e p e n d e n t M o d e l i n g
Boning 33 MIT-MTL
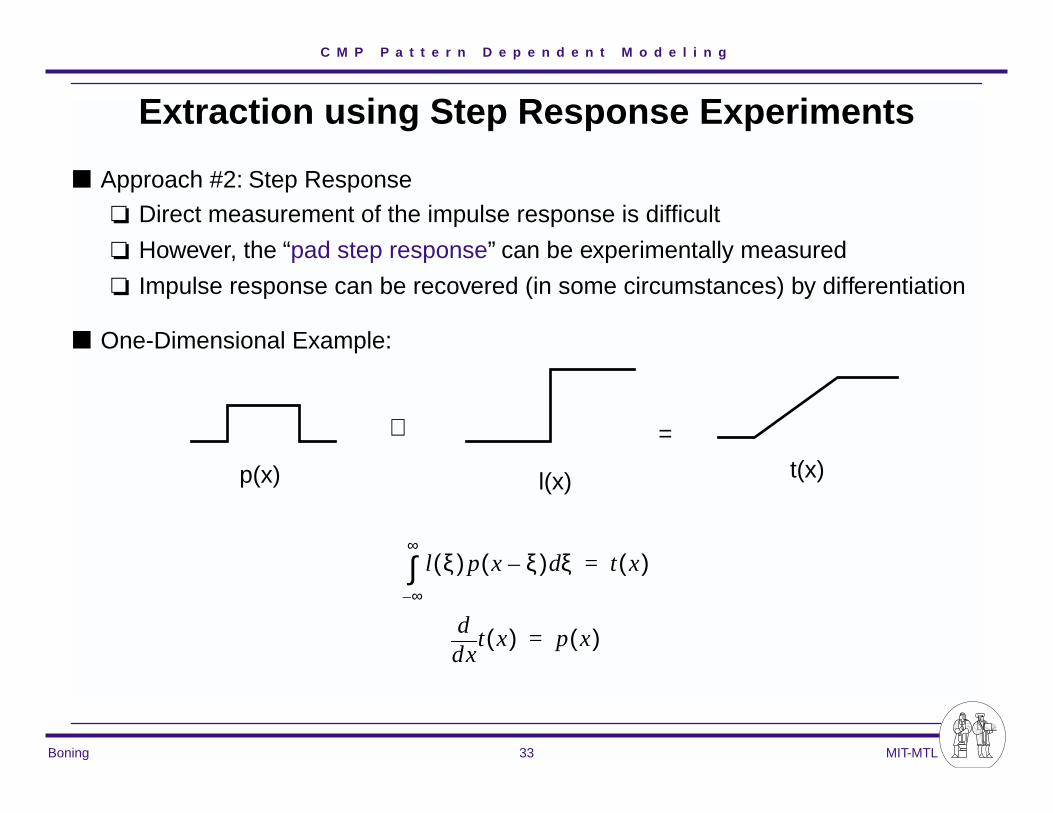
Extraction using Step Response Experiments
■ Approach #2: Step Response❏ Direct measurement of the impulse response is difficult
❏ However, the “pad step response” can be experimentally measured
❏ Impulse response can be recovered (in some circumstances) by differentiation
■ One-Dimensional Example:
⊗ =
l(x) t(x)p(x)
l ξ( ) p x ξ–( ) ξd∞–
∞
∫ t x( )=
xdd
t x( ) p x( )=
C M P P a t t e r n D e p e n d e n t M o d e l i n g
Boning 34 MIT-MTL
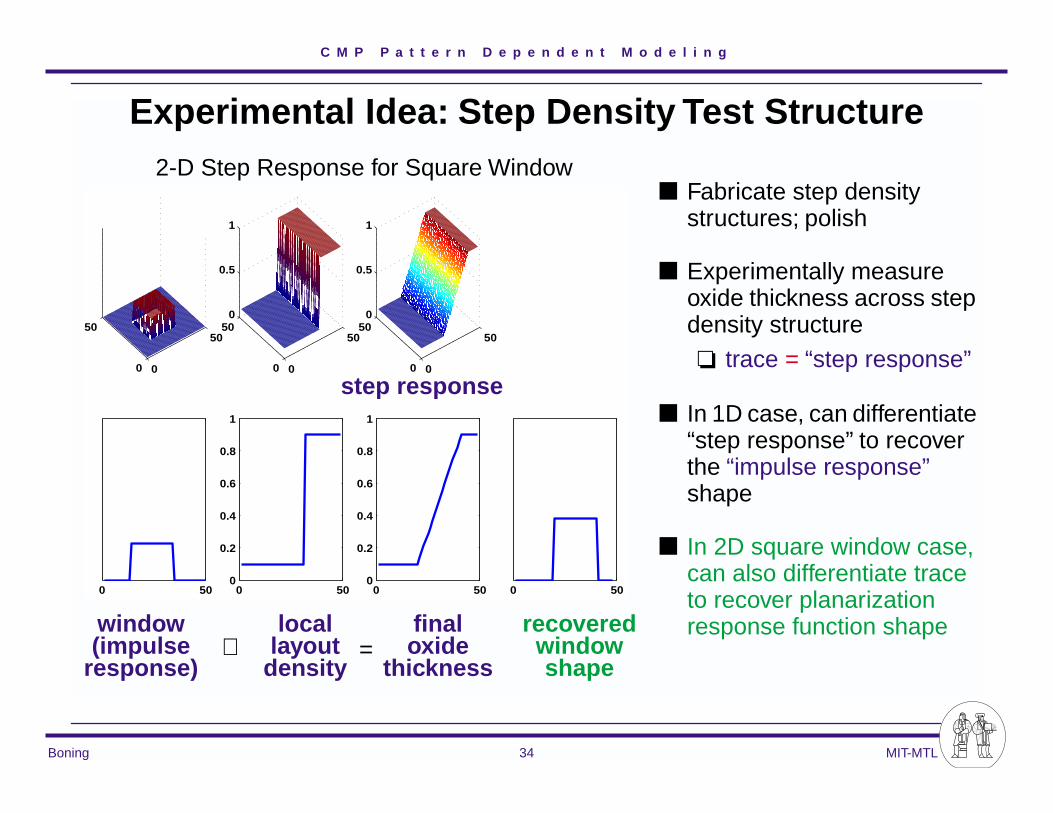
Experimental Idea: Step Density Test Structure
0
50
0
50
0
50
0
500
0.5
1
0
50
0
500
0.5
1
0 50 0 500
0.2
0.4
0.6
0.8
1
0 500
0.2
0.4
0.6
0.8
1
0 50
2-D Step Response for Square Window■ Fabricate step density
structures; polish
■ Experimentally measure oxide thickness across step density structure❏ trace = “step response”
■ In 1D case, can differentiate “step response” to recover the “impulse response” shape
■ In 2D square window case, can also differentiate trace to recover planarization response function shapewindow
(impulselocal
density
final
thicknessoxidelayout
response)
recovered
shapewindow⊗ =
step response
C M P P a t t e r n D e p e n d e n t M o d e l i n g
Boning 35 MIT-MTL
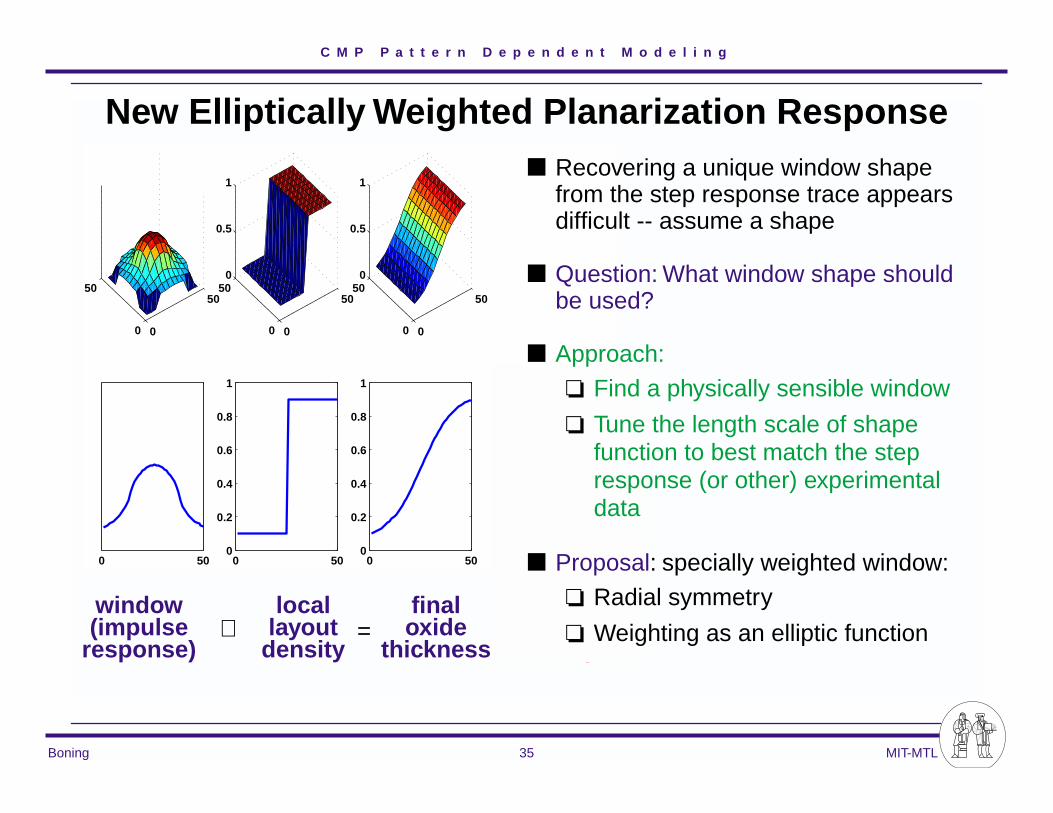
New Elliptically Weighted Planarization Response
0
50
0
50
0
50
0
500
0.5
1
0
50
0
500
0.5
1
0 50 0 500
0.2
0.4
0.6
0.8
1
0 500
0.2
0.4
0.6
0.8
1
0 50
window(impulse
local
density
final
thicknessoxidelayout
response)
recovered
shapewindow⊗ =
■ Recovering a unique window shape from the step response trace appears difficult -- assume a shape
■ Question: What window shape should be used?
■ Approach: ❏ Find a physically sensible window
❏ Tune the length scale of shape function to best match the step response (or other) experimental data
■ Proposal: specially weighted window:❏ Radial symmetry
❏ Weighting as an elliptic function
C M P P a t t e r n D e p e n d e n t M o d e l i n g
Boning 36 MIT-MTL
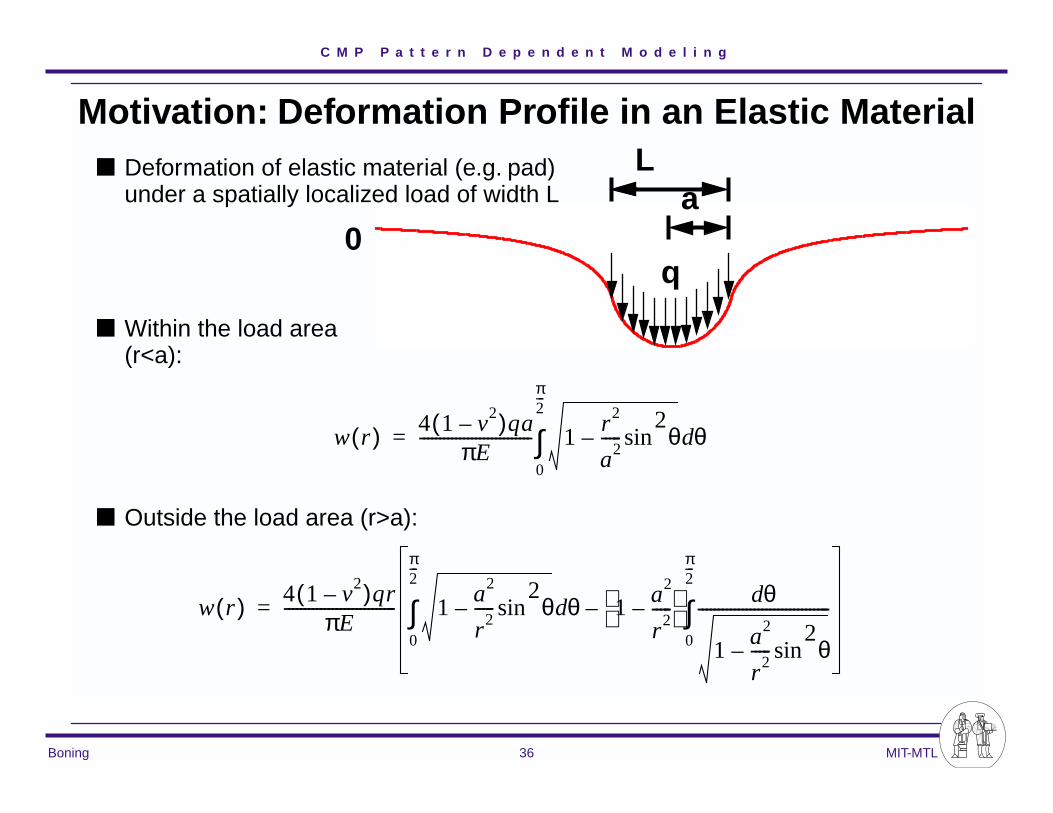
Motivation: Deformation Profi le in an Elastic Material
a q
0
■ Deformation of elastic material (e.g. pad) under a spatially localized load of width L
L
■ Within the load area (r<a):
■ Outside the load area (r>a):
w r( ) 4 1 v2–( )qaπE
---------------------------- 1r2
a2-----
2θsin– θd
0
π2---
∫=
w r( ) 4 1 v2–( )qrπE
---------------------------- 1a2
r2-----
2θsin– θd
0
π2---
∫ 1 a2
r2-----–
θd
1a2
r2-----
2θsin–
---------------------------------0
π2---
∫–=
C M P P a t t e r n D e p e n d e n t M o d e l i n g
Boning 37 MIT-MTL
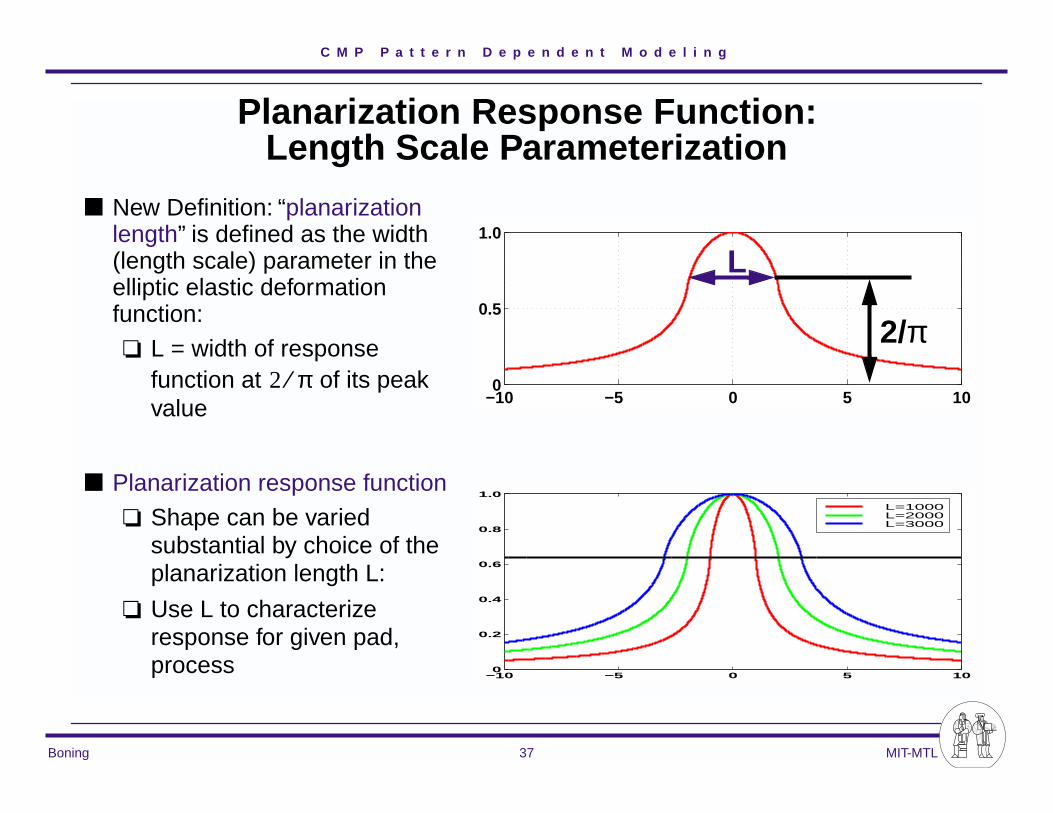
Planarization Response Function: Length Scale Parameterization
−10 −5 0 5 100
0.5
1.0
L
2/π
■ New Definition: “planarization length” is defined as the width (length scale) parameter in the elliptic elastic deformation function:❏ L = width of response
function at of its peak value
2 π⁄
−10 −5 0 5 100
0.2
0.4
0.6
0.8
1.0
L=1000L=2000L=3000
■ Planarization response function❏ Shape can be varied
substantial by choice of the planarization length L:
❏ Use L to characterize response for given pad, process
C M P P a t t e r n D e p e n d e n t M o d e l i n g
Boning 38 MIT-MTL
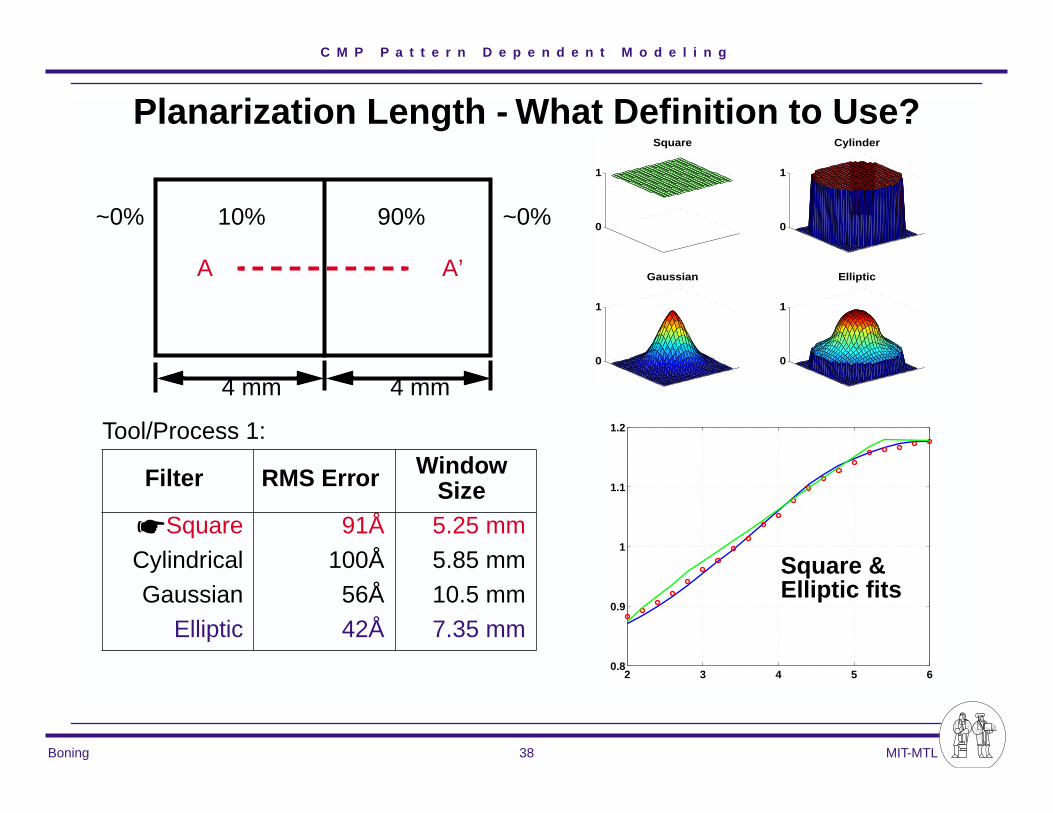
Planarization Length - What Definition to Use?
2 3 4 5 60.8
0.9
1
1.1
1.2
0
1
Square
0
1
Cylinder
0
1
Gaussian
0
1
Elliptic
Tool/Process 1:
Filter RMS Error Window Size
☛ Square 91Å 5.25 mmCylindrical 100Å 5.85 mmGaussian 56Å 10.5 mm
Elliptic 42Å 7.35 mm
A A’
10% 90%
4 mm 4 mm
~0% ~0%
Square & Elliptic fits

C M P P a t t e r n D e p e n d e n t M o d e l i n g
Boning 39 MIT-MTL
Response Function Comparisons - Test Die
0
1
Square
0
1
Cylinder
0
1
Gaussian
0
1
Elliptic
0 4 8 12 16 200.5
1
1.5
0 4 8 12 16 200.5
1
1.5
0.5
1
1.5
0.5
1
1.5
Density mapwithin smallgrid cells
Tool/Process 2:
Filter RMS Error Window Size
Square 257 A 2.7 mmCylindrical 251 A 3.3 mmGaussian 243 A 5.1 mm
Elliptic 239 A 7.8 mm
C M P P a t t e r n D e p e n d e n t M o d e l i n g
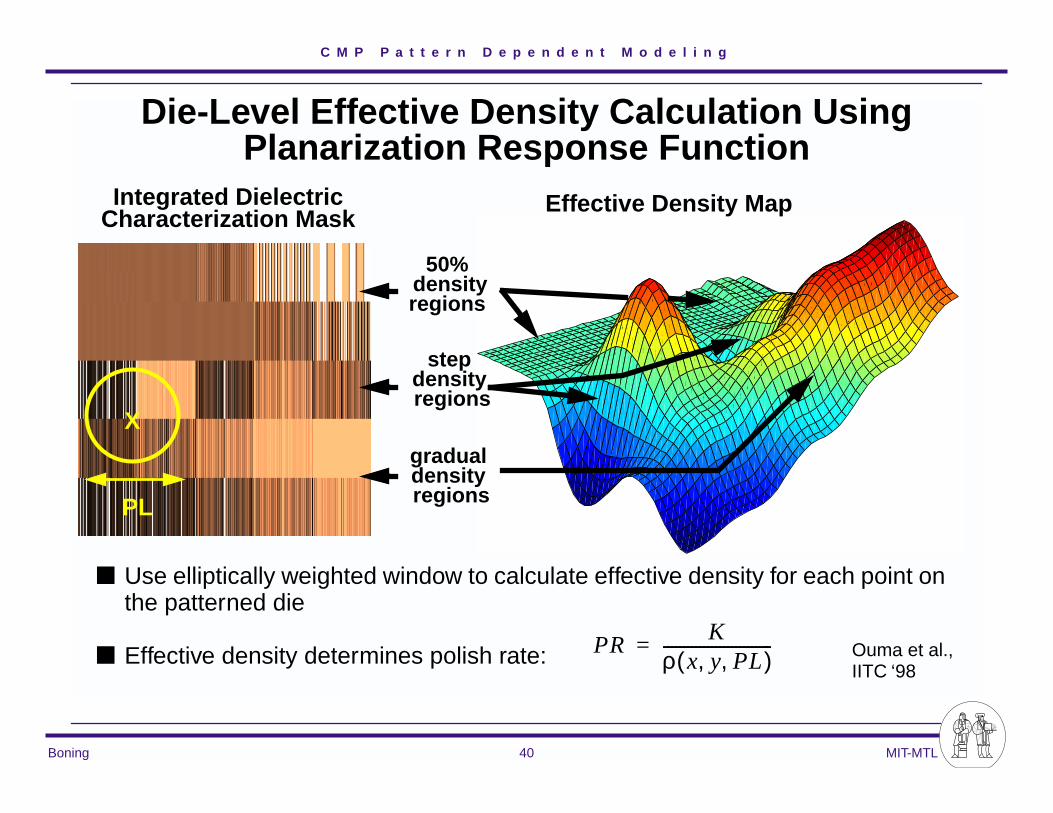
Boning 40 MIT-MTL
Die-Level Effective Density Calculation UsingPlanarization Response Function
■ Use elliptically weighted window to calculate effective density for each point on the patterned die
■ Effective density determines polish rate:
X
PL
50%
regions
gradualdensity regions
stepdensity regions
density
PRK
ρ x y PL, ,( )---------------------------=
Effective Density Map
Ouma et al., IITC ‘98
Integrated DielectricCharacterization Mask

C M P P a t t e r n D e p e n d e n t M o d e l i n g
Boning 41 MIT-MTL
Example: Post-Oxide Polish Thickness Prediction
0 10 20 30 40 50 600.5
0.6
0.7
0.8
0.9
1
1.1
1.2
1.3
ActualModel
0 10 20 30 40 50 601.5
1.55
1.6
1.65
1.7
ActualModel
Raised Area Predictions
Th
ickn
esse
s (µ
m)
Site # Site #
Down Area Predictions
Th
ickn
esse
s (µ
m)
RMSE = 273Å RMSE = 253Å
■ Density dependent model applied to both “up” (over metal) and “down” (between metal) oxide thickness resulting from oxide CMP:
50%
regions
gradualdensity regions
stepdensity regions
density50%
regions
gradualdensity regions
stepdensity regions
density
Smith et al.,CMP-MIC ‘99

C M P P a t t e r n D e p e n d e n t M o d e l i n g
Boning 42 MIT-MTL
Planarization Length/Response vs. TIR
■ TIR = Total Indicated Range = Max oxide thickness - Min oxide thickness❏ Measures total within-die global nonuniformity
❏ Good figure of merit for a given mask layout and process/consumable set
❏ Must know where high and low oxide thicknesses are located in die
❏ Provides little information that is applicable to other masks
■ Planarization Length and Response Function❏ Measures planarization capability of a given process/consumable set
❏ A derived metric based on measurements & characterization mask
❏ Powerful: used to efficiently predict oxide thickness for arbitrary layout:
❏ Future: relate planarization length to fundamental pad/process parameters
05
1015
20
05
1015
200
1
Effective density with elliptic filter of length 7.8 mm

C M P P a t t e r n D e p e n d e n t M o d e l i n g
Boning 43 MIT-MTL
Density Range and Resulting ILD Variation
2 4 6 8 10 120
20
40
60
80
100
0 1000 2000 3000 4000 5000 6000 7000 80000
20
40
60
80
100
TIR (Å)
Den
sity
Ran
ge,
(
%)
∆ρ
■ Effective density range across chip for any given CMP process/consumables:
=
■ Density variation results in oxide thickness variation -
Total Indicated Range (TIR):
, where
is initial deposition step height
∆ρ ρmax ρmin–
TIR ∆z ∆ρ z1•= =
z1

C M P P a t t e r n D e p e n d e n t M o d e l i n g
Boning 44 MIT-MTL
Future Issues
■ Step height dependencies and characterization❏ Important for small step height prediction (oxide, STI, other)
❏ Oxide Model Improvements• Density is not the whole story (just most of the story)• Integrated model combining effective density and step height dependence
improves model prediction accuracy
■ Model extensions needed for Copper/Metal/STI CMP❏ Dishing and erosion effects in STI and Metal CMP
❏ Characterization test masks for copper CMP

C M P P a t t e r n D e p e n d e n t M o d e l i n g
Boning 45 MIT-MTL
Step Height Dependence
■ Incompressible Pad Model: ❏ Up area removal rate scaled by density (e.g. MIT density model)
■ Compressible Pad Model:❏ Up area removal rate proportional to step height (Burke, Tseng, others)
■ Transition from incompressible to compressible pad model (Grillaert et al. - IMEC)
❏ Occurs at contact height or contact time where h1
Wafer Wafer
CMP Pad CMP Pad
Incompressible Pad Model Compressible Pad Model
h1
tc h1 h0 tcKρ----⋅
–=
C M P P a t t e r n D e p e n d e n t M o d e l i n g
Boning 46 MIT-MTL
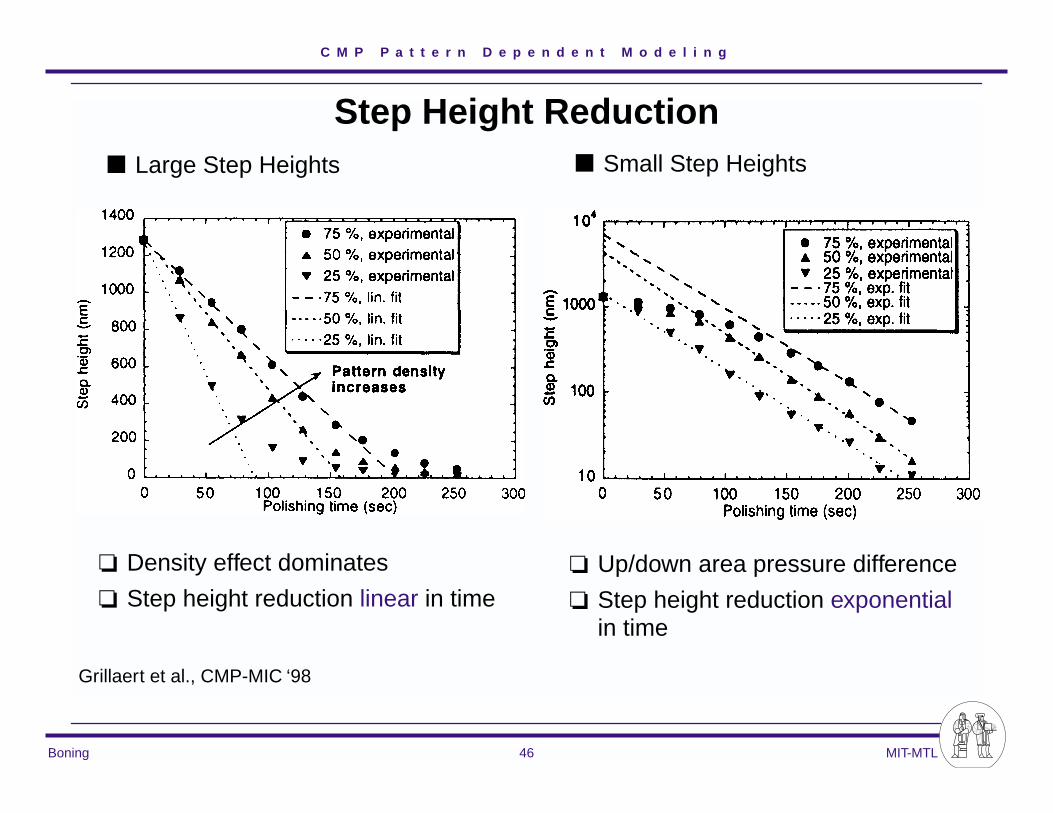
Step Height Reduction■ Large Step Heights ■ Small Step Heights
Grillaert et al., CMP-MIC ‘98
❏ Density effect dominates
❏ Step height reduction linear in time❏ Up/down area pressure difference
❏ Step height reduction exponential in time
C M P P a t t e r n D e p e n d e n t M o d e l i n g
Boning 47 MIT-MTL
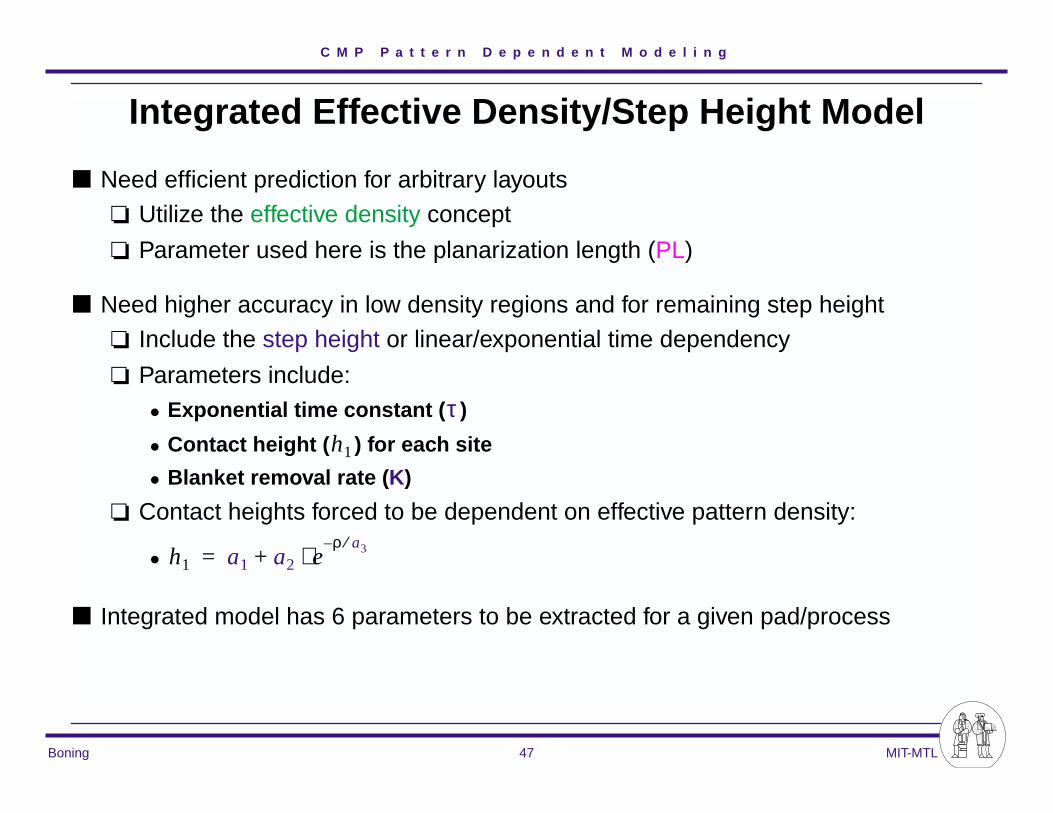
Integrated Effective Density/Step Height Model
■ Need efficient prediction for arbitrary layouts❏ Utilize the effective density concept
❏ Parameter used here is the planarization length (PL)
■ Need higher accuracy in low density regions and for remaining step height❏ Include the step height or linear/exponential time dependency
❏ Parameters include:• Exponential time constant ( )
• Contact height ( ) for each site
• Blanket removal rate (K)
❏ Contact heights forced to be dependent on effective pattern density:
•
■ Integrated model has 6 parameters to be extracted for a given pad/process
τh1
h1 a1 a2 eρ a3⁄–
⋅+=

C M P P a t t e r n D e p e n d e n t M o d e l i n g
Boning 48 MIT-MTL
Results: Integrated Density/Step Height Model
0 10 20 30 40 50 600.5
0.6
0.7
0.8
0.9
1
1.1
1.2
1.3
ActualModel
0 10 20 30 40 50 601.5
1.55
1.6
1.65
1.7
ActualModel
Raised Area Predictions
Th
ickn
esse
s (µ
m)
Site # Site #
Down Area Predictions
Th
ickn
esse
s (µ
m)
RMSE = 98Å RMSE = 83Å
■ Dramatically reduced errors: ❏ 273 Å rms (density model) --> 98 Å RMSE (integrated model)
■ Challenge:❏ Over-predicts down polish in low density regions: macro pad bending limit?
Smith et al.,CMP-MIC ‘99
C M P P a t t e r n D e p e n d e n t M o d e l i n g
Boning 49 MIT-MTL
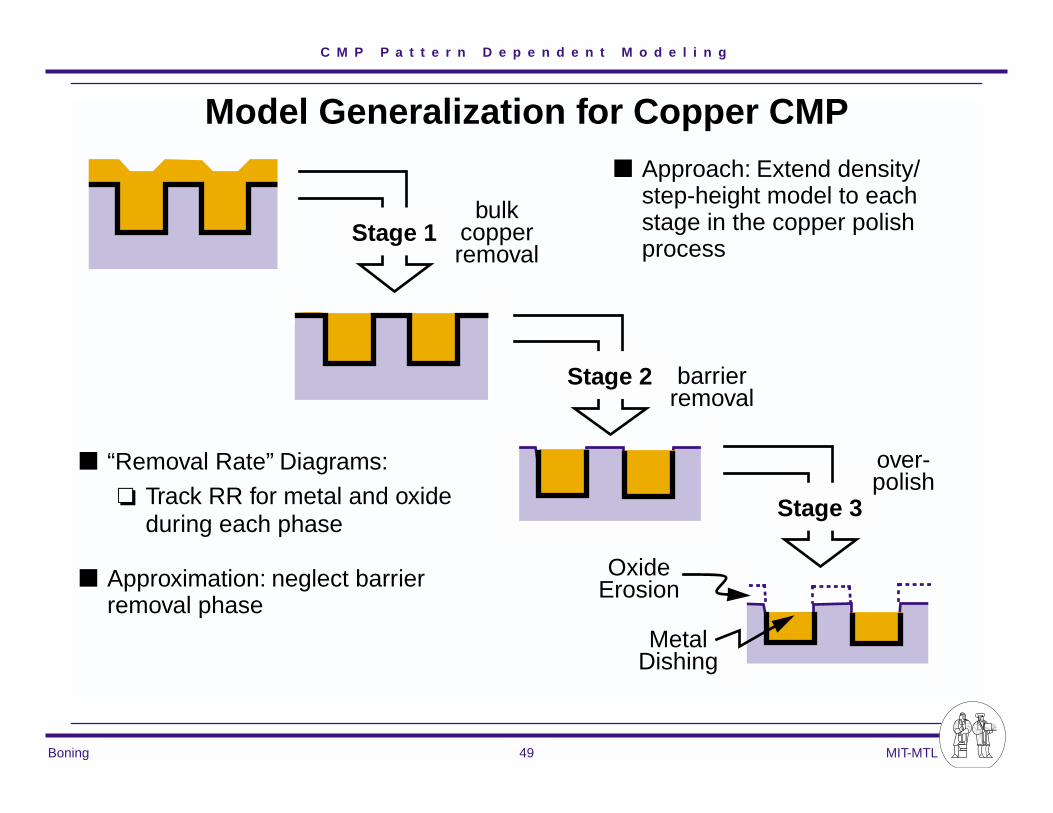
Model Generalization for Copper CMP
bulk
OxideErosion
MetalDishing
Stage 1 copperremoval
Stage 2 barrierremoval
Stage 3
over-polish
■ Approach: Extend density/step-height model to each stage in the copper polish process
■ “Removal Rate” Diagrams:❏ Track RR for metal and oxide
during each phase
■ Approximation: neglect barrier removal phase

C M P P a t t e r n D e p e n d e n t M o d e l i n g
Boning 50 MIT-MTL
Removal Rate Diagrams
hexh
RRm
1 ρm–---------------
down areaRRm
up area
Removal
Local
Rate
StepHeight
RR
metal rate
metal rate
time
dss
metal
oxide
Removal
Metal
Rate
DishingHeight
RR
rate
rate
time
RRm
)
RRox
)
RRox
1 ρm–---------------
)
dmax dm
Stage 1 - Bulk Metal Polish Stage 3 - Metal/Oxide Overpolish
❏ Key idea: RR as f(step height)
❏ Use a contact height hex
❏ Density affects up area Cu rate
❏ Key idea: RR as f(dishing height)
❏ dmax is max dishing (pad loses contact)
❏ dss is steady state dishing (Elbel)
C M P P a t t e r n D e p e n d e n t M o d e l i n g
Boning 51 MIT-MTL
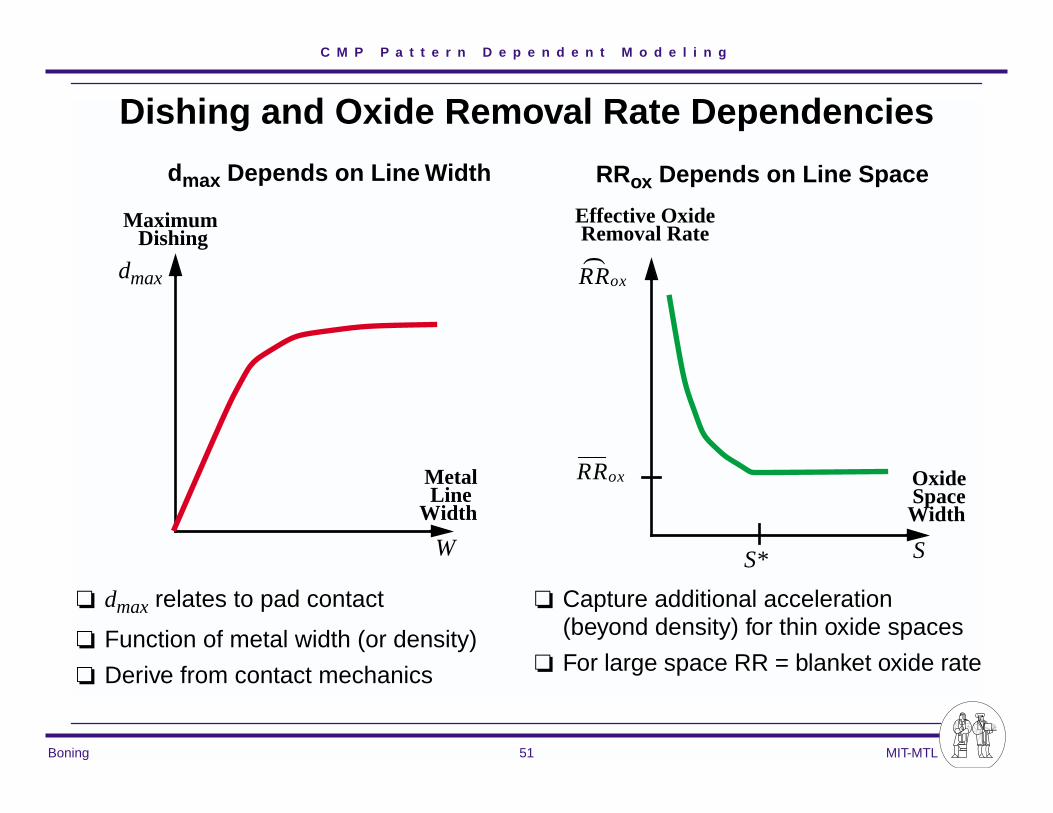
Dishing and Oxide Removal Rate Dependencies
W
Maximum
Metal
Dishing
LineWidth
dmax
S*
OxideSpaceWidth
RRox
)
S
dmax Depends on Line Width RRox Depends on Line Space
❏ dmax relates to pad contact
❏ Function of metal width (or density)
❏ Derive from contact mechanics
❏ Capture additional acceleration (beyond density) for thin oxide spaces
❏ For large space RR = blanket oxide rate
Effective OxideRemoval Rate
RRox

C M P P a t t e r n D e p e n d e n t M o d e l i n g
Boning 52 MIT-MTL
Metal (Copper) CMP - Electrical Test Mask
■ Physical (profilometry, AFM) arrays to study dishing and erosion
■ Electrical (resistance) test structures❏ E-test extraction of line loss
❏ Applicable to very fine pitch structures
■ Design as a function of density and pitch (or density, linewidth, linespace)
■ Variations and experiments in progress in collaboration with Sematech, TI, Applied Materials

C M P P a t t e r n D e p e n d e n t M o d e l i n g
Boning 53 MIT-MTL
Current Status: Extraction/Validation of Model
PITCH BLOCKS
DENSITY
BLOCKSDENSITY
BLOCKS
240 270 300 330 360 390 4200
0.2
0.4
0.6
0.8
1
Remaining Cu Thickness (µm)
Polish Time (sec)
10%30%50%70%90%
MetalDensity
o = Extracted* = Physical
Extraction ofElectrical/PhysicalTest Mask Pattern Dependencies
❏ Test structure & mask design
❏ Methodology development
❏ Extract model parameters for time evolution & pattern dep. effects
❏ Validate dishing and erosion trends and dependencies
C M P P a t t e r n D e p e n d e n t M o d e l i n g
Boning 54 MIT-MTL
Conclusions■ Standards needed for Characterization of Pattern Dependencies in CMP
❏ Key Idea #1: Characterization using Test Masks and Test Patterns
❏ Key Idea #2: Planarization Length as Metric for Oxide CMP
✔ Mask Evolution ❏ leading to “Comprehensive Dielectric CMP Characterization Mask”
✔ Oxide CMP Model -- Effective Density
✔ Planarization Length as a Metric
■ Future Issues❏ Characterization masks, methods and metrics for metal CMP still needed
C M P P a t t e r n D e p e n d e n t M o d e l i n g
Boning 55 MIT-MTL
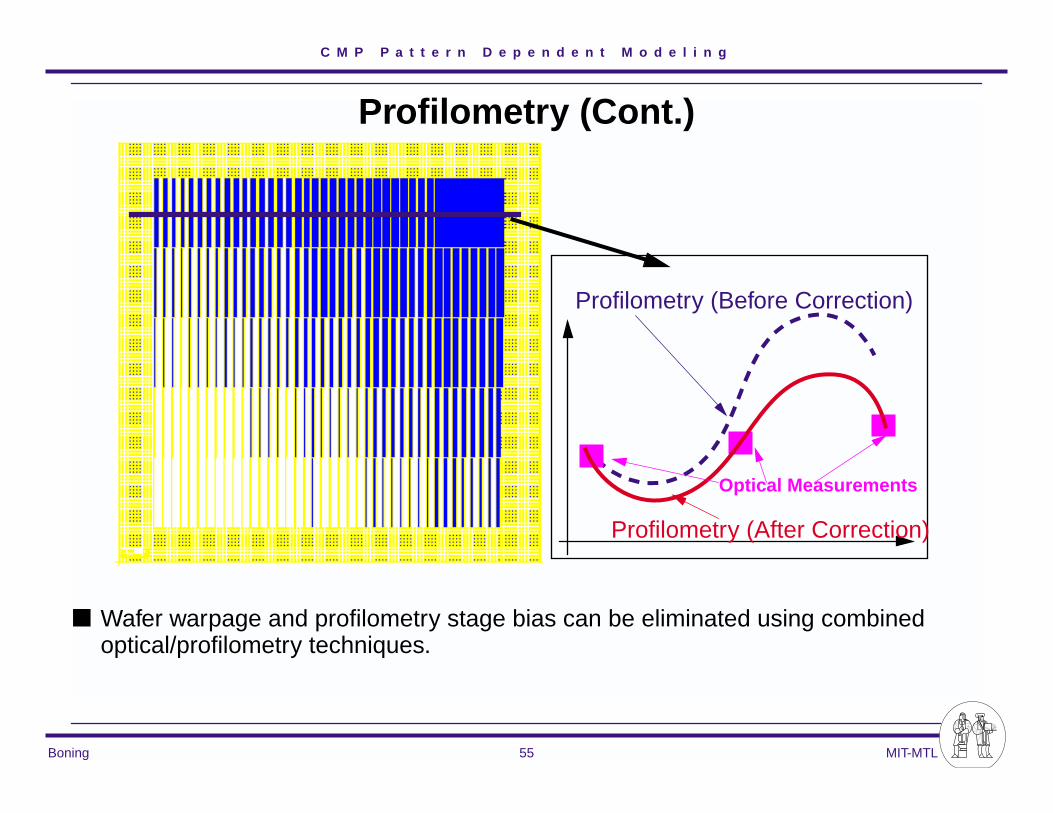
Profi lometry (Cont.)
■ Wafer warpage and profilometry stage bias can be eliminated using combined optical/profilometry techniques.
Profilometry (Before Correction)
Profilometry (After Correction)
Optical Measurements