Embed Size (px)
Citation preview
Chapter Twenty-eight
SIGHT DISTANCE
BUREAU OF LOCAL ROADS AND STREETS MANUAL

BUREAU OF LOCAL ROADS & STREETS Jan 2006 SIGHT DISTANCE 28(i)
Chapter Twenty-eight SIGHT DISTANCE
Table of Contents
Section Page 28-1 STOPPING SIGHT DISTANCE (SSD).................................................................... 28-1(1) 28-2 PASSING SIGHT DISTANCE ................................................................................. 28-2(1) 28-3 INTERSECTION SIGHT DISTANCE (ISD) ............................................................. 28-3(1)
28-3.01 General.................................................................................................. 28-3(1)28-3.02 Case A – Intersections With No Control ................................................ 28-3(2)28-3.03 Case B – Intersections with Stop Control on the Minor Road ............... 28-3(3)28-3.04 Case C – Intersections With Yield Control On the Minor Road ............. 28-3(7)28-3.05 Case D – Intersections with Traffic Signal Control ................................ 28-3(7)28-3.06 Case E – Intersections With All-Way Stop Control ................................ 28-3(7)28-3.07 Case F – Left Turns From the Major Road............................................ 28-3(9)28-3.08 Effect of Skew........................................................................................ 28-3(9)
28-4 REFERENCES........................................................................................................ 28-4(1)

BUREAU OF LOCAL ROADS & STREETS 28(ii) SIGHT DISTANCE Jan 2006
BUREAU OF LOCAL ROADS & STREETS Jan 2006 SIGHT DISTANCE 28-1(1)
Chapter Twenty-eight SIGHT DISTANCE
28-1 STOPPING SIGHT DISTANCE (SSD)
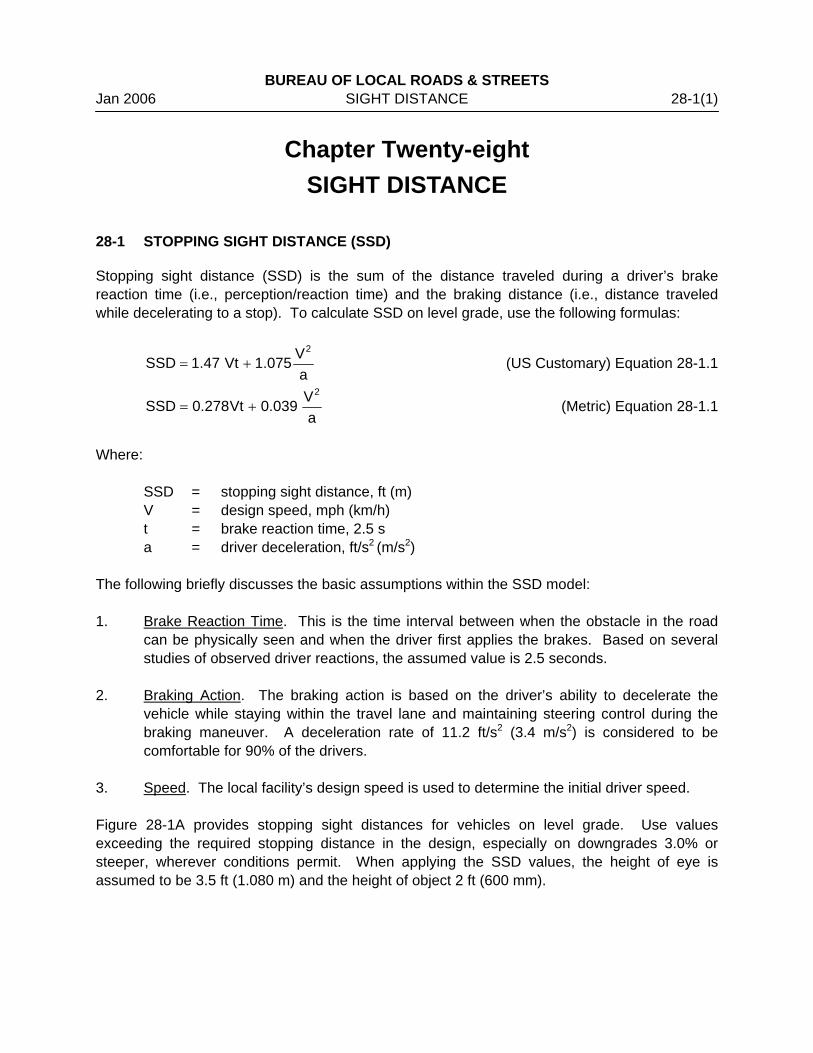
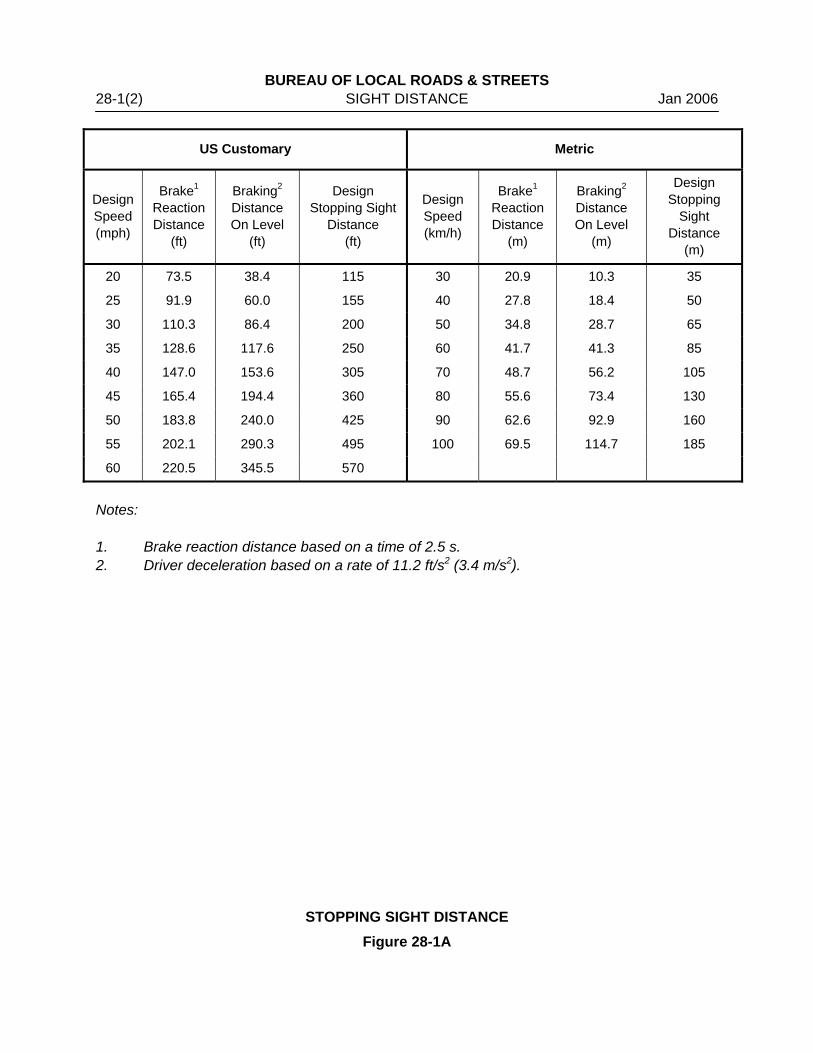
Stopping sight distance (SSD) is the sum of the distance traveled during a driver’s brake reaction time (i.e., perception/reaction time) and the braking distance (i.e., distance traveled while decelerating to a stop). To calculate SSD on level grade, use the following formulas:
a
V075.1Vt47.1SSD2
+= (US Customary) Equation 28-1.1
a
V039.0Vt278.0SSD2
+= (Metric) Equation 28-1.1
Where:
SSD = stopping sight distance, ft (m) V = design speed, mph (km/h) t = brake reaction time, 2.5 s a = driver deceleration, ft/s2 (m/s2)
The following briefly discusses the basic assumptions within the SSD model: 1. Brake Reaction Time. This is the time interval between when the obstacle in the road
can be physically seen and when the driver first applies the brakes. Based on several studies of observed driver reactions, the assumed value is 2.5 seconds.
2. Braking Action. The braking action is based on the driver’s ability to decelerate the
vehicle while staying within the travel lane and maintaining steering control during the braking maneuver. A deceleration rate of 11.2 ft/s2 (3.4 m/s2) is considered to be comfortable for 90% of the drivers.
3. Speed. The local facility’s design speed is used to determine the initial driver speed. Figure 28-1A provides stopping sight distances for vehicles on level grade. Use values exceeding the required stopping distance in the design, especially on downgrades 3.0% or steeper, wherever conditions permit. When applying the SSD values, the height of eye is assumed to be 3.5 ft (1.080 m) and the height of object 2 ft (600 mm).
BUREAU OF LOCAL ROADS & STREETS 28-1(2) SIGHT DISTANCE Jan 2006
US Customary Metric
Design Speed (mph)
Brake1
Reaction Distance
(ft)
Braking2
Distance On Level
(ft)
Design Stopping Sight
Distance (ft)
Design Speed (km/h)
Brake1 Reaction Distance
(m)
Braking2
Distance On Level
(m)
Design Stopping
Sight Distance
(m)
20 73.5 38.4 115 30 20.9 10.3 35
25 91.9 60.0 155 40 27.8 18.4 50
30 110.3 86.4 200 50 34.8 28.7 65
35 128.6 117.6 250 60 41.7 41.3 85
40 147.0 153.6 305 70 48.7 56.2 105
45 165.4 194.4 360 80 55.6 73.4 130
50 183.8 240.0 425 90 62.6 92.9 160
55 202.1 290.3 495 100 69.5 114.7 185
60 220.5 345.5 570
Notes: 1. Brake reaction distance based on a time of 2.5 s. 2. Driver deceleration based on a rate of 11.2 ft/s2 (3.4 m/s2).
STOPPING SIGHT DISTANCE Figure 28-1A
BUREAU OF LOCAL ROADS & STREETS Jan 2006 SIGHT DISTANCE 28-2(1) 28-2 PASSING SIGHT DISTANCE
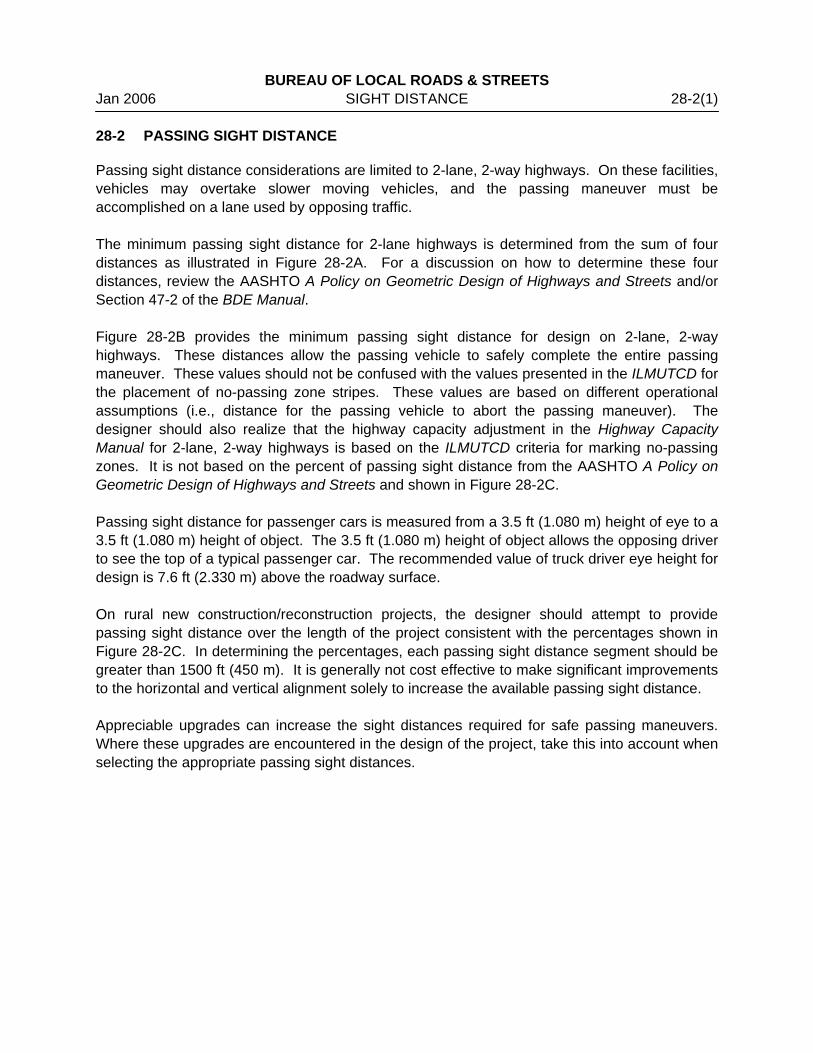
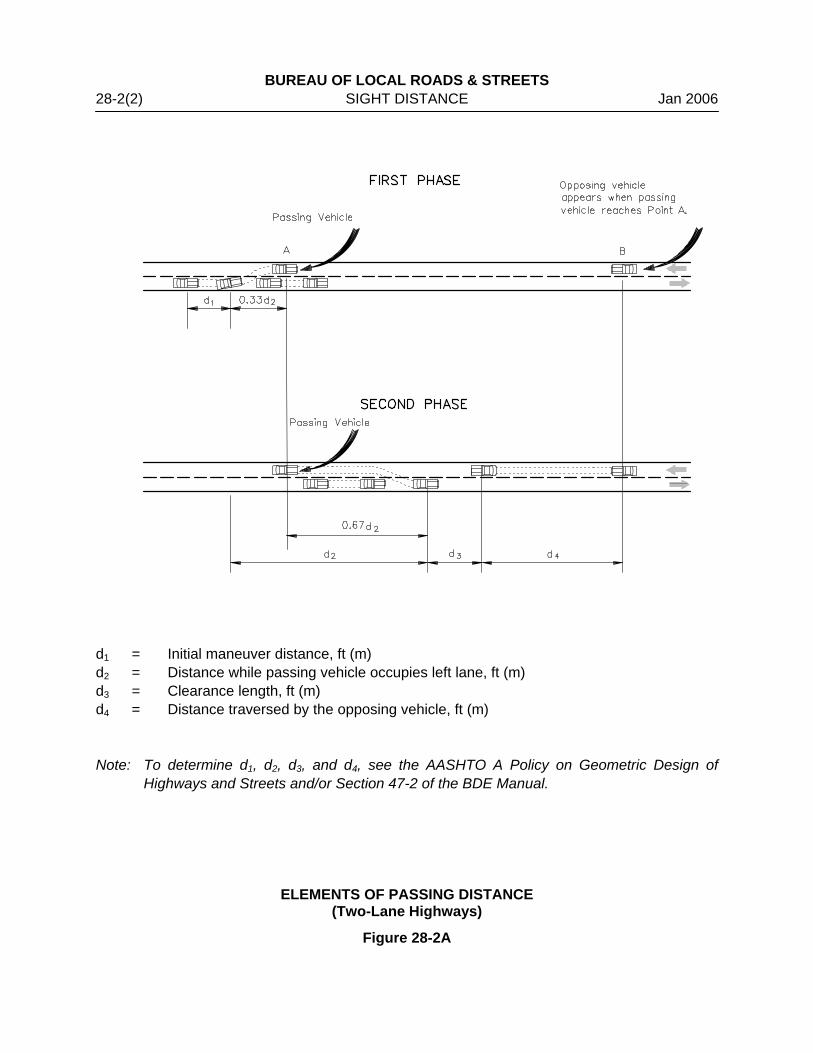
Passing sight distance considerations are limited to 2-lane, 2-way highways. On these facilities, vehicles may overtake slower moving vehicles, and the passing maneuver must be accomplished on a lane used by opposing traffic. The minimum passing sight distance for 2-lane highways is determined from the sum of four distances as illustrated in Figure 28-2A. For a discussion on how to determine these four distances, review the AASHTO A Policy on Geometric Design of Highways and Streets and/or Section 47-2 of the BDE Manual. Figure 28-2B provides the minimum passing sight distance for design on 2-lane, 2-way highways. These distances allow the passing vehicle to safely complete the entire passing maneuver. These values should not be confused with the values presented in the ILMUTCD for the placement of no-passing zone stripes. These values are based on different operational assumptions (i.e., distance for the passing vehicle to abort the passing maneuver). The designer should also realize that the highway capacity adjustment in the Highway Capacity Manual for 2-lane, 2-way highways is based on the ILMUTCD criteria for marking no-passing zones. It is not based on the percent of passing sight distance from the AASHTO A Policy on Geometric Design of Highways and Streets and shown in Figure 28-2C. Passing sight distance for passenger cars is measured from a 3.5 ft (1.080 m) height of eye to a 3.5 ft (1.080 m) height of object. The 3.5 ft (1.080 m) height of object allows the opposing driver to see the top of a typical passenger car. The recommended value of truck driver eye height for design is 7.6 ft (2.330 m) above the roadway surface. On rural new construction/reconstruction projects, the designer should attempt to provide passing sight distance over the length of the project consistent with the percentages shown in Figure 28-2C. In determining the percentages, each passing sight distance segment should be greater than 1500 ft (450 m). It is generally not cost effective to make significant improvements to the horizontal and vertical alignment solely to increase the available passing sight distance. Appreciable upgrades can increase the sight distances required for safe passing maneuvers. Where these upgrades are encountered in the design of the project, take this into account when selecting the appropriate passing sight distances.
BUREAU OF LOCAL ROADS & STREETS 28-2(2) SIGHT DISTANCE Jan 2006 d1 = Initial maneuver distance, ft (m) d2 = Distance while passing vehicle occupies left lane, ft (m) d3 = Clearance length, ft (m) d4 = Distance traversed by the opposing vehicle, ft (m) Note: To determine d1, d2, d3, and d4, see the AASHTO A Policy on Geometric Design of
Highways and Streets and/or Section 47-2 of the BDE Manual.
ELEMENTS OF PASSING DISTANCE (Two-Lane Highways)
Figure 28-2A
BUREAU OF LOCAL ROADS & STREETS Jan 2006 SIGHT DISTANCE 28-2(3)
US Customary Metric
Design Speed (mph)
Design Passing Sight Distance
(ft)
Design Speed (km/h)
Design Passing Sight Distance
(m)
20 710 30 200 25 900 40 270 30 1090 50 345 35 1280 60 410 40 1470 70 485 45 1625 80 540 50 1835 90 615 55 1985 100 670 60 2135
PASSING SIGHT DISTANCE
Figure 28-2B
Minimum Percent Passing Sight Distance Terrain
Collectors Local
Level 50% 40% Rolling 30% 20%
GUIDELINES FOR PERCENT PASSING DISTANCE
(Rural)
Figure 28-2C

BUREAU OF LOCAL ROADS & STREETS 28-2(4) SIGHT DISTANCE Jan 2006
BUREAU OF LOCAL ROADS & STREETS Jan 2006 SIGHT DISTANCE 28-3(1) 28-3 INTERSECTION SIGHT DISTANCE (ISD)
28-3.01 General
In general, ISD refers to the corner sight distance available in intersection quadrants that allows a driver approaching an intersection to observe the actions of vehicles on the crossing leg(s). ISD evaluations involve establishing the needed sight triangle in each quadrant by determining the legs of the triangle on the two crossing roadways. Within this clear sight triangle, the objective is to remove or lower any object that obstructs the driver’s view, if practical. Sight obstruction may include: • buildings,
• parked or turning vehicles,
• trees,
• hedges,
• fences,
• retaining walls, and
• the actual ground line. In addition, where a crossroad intersects the major road near a bridge on a crest vertical curve, items such as bridge parapets, piers, abutments, guardrail, or the crest vertical curve itself may restrict the clear sight triangle. The additional costs and impacts of removing sight obstructions are often justified. If it is impractical to remove an obstruction blocking the sight distance, consider providing traffic control devices or design applications (e.g., warning signs, turn lanes), which may not otherwise be considered. In general, point obstacles (e.g., traffic signs, utility poles) are not considered sight obstructions (i.e., the driver can move slightly to avoid these obstacles). Although crops are not considered obstructions, give consideration to crops within the corner sight distance triangle. The height of eye for passenger cars is assumed to be 3.5 ft (1.080 m) above the surface of the minor road. The height of object (approaching vehicle on the major road) is also assumed to be 3.5 ft (1.080 m). An object height of 3.5 ft (1.080 m) assumes that a sufficient portion of the oncoming vehicle must be visible to identify it as an object of concern by the minor road driver. If there are a sufficient number of trucks to warrant their consideration, see Section 36-6 of the BDE Manual. The necessary clear sight triangle is based on the type of traffic control at the intersection and on the design speeds of the two roadways. The types of traffic control and maneuvers are as follows: • Case A – Intersections with no control,
BUREAU OF LOCAL ROADS & STREETS 28-3(2) SIGHT DISTANCE Jan 2006 • Case B – Intersections with Stop control on the minor road:
• Case C – Intersections with Yield control on the minor road:
• Case D – Intersections with traffic signal control,
• Case E – Intersections with all-way Stop control, and
• Case F – Left turns from the major road. Gap acceptance is used as the conceptual basis for ISD criteria. For additional guidance on the gap acceptance design, see the AASHTO publication A Policy on Geometric Design of Highways and Streets.
28-3.02 Case A – Intersections With No Control
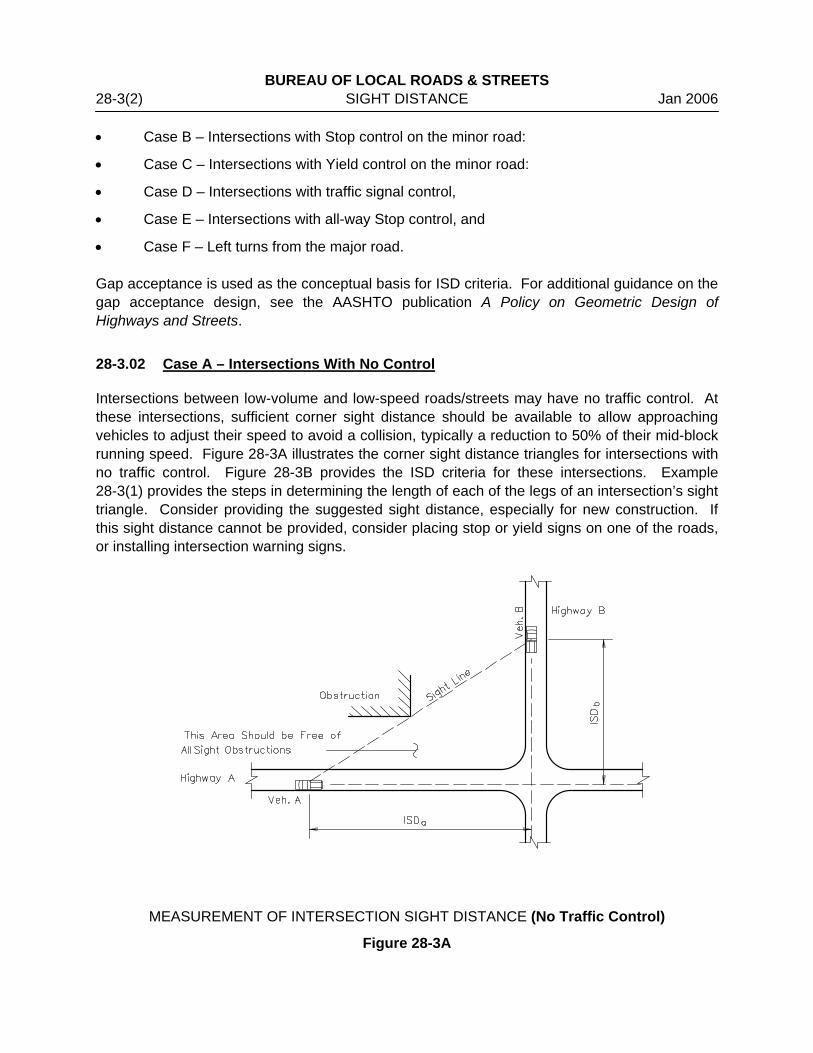
Intersections between low-volume and low-speed roads/streets may have no traffic control. At these intersections, sufficient corner sight distance should be available to allow approaching vehicles to adjust their speed to avoid a collision, typically a reduction to 50% of their mid-block running speed. Figure 28-3A illustrates the corner sight distance triangles for intersections with no traffic control. Figure 28-3B provides the ISD criteria for these intersections. Example 28-3(1) provides the steps in determining the length of each of the legs of an intersection’s sight triangle. Consider providing the suggested sight distance, especially for new construction. If this sight distance cannot be provided, consider placing stop or yield signs on one of the roads, or installing intersection warning signs.
MEASUREMENT OF INTERSECTION SIGHT DISTANCE (No Traffic Control)
Figure 28-3A

BUREAU OF LOCAL ROADS & STREETS Jan 2006 SIGHT DISTANCE 28-3(3) Example 28-3(1) Given: No traffic control at intersection Design speed — 40 mph (Highway A – see Figure 28-3A) 30 mph (Highway B – see Figure 28-3A) Problem: Determine legs of sight triangle. Solution: From Figure 28-3B — ISDa = 195 ft ISDb = 140 ft
* * * * * * * * * *
US Customary
Design Speed (mph) 20 25 30 35 40 45 50 Intersection Sight Distance (ft) 90 115 140 165 195 220 245
Metric
Design Speed (km/h) 30 40 50 60 70 80 Intersection Sight Distance (m) 25 35 45 55 65 75
Note: For approach downgrades greater than 3.0%, increase the ISD value by 10%.
INTERSECTION SIGHT DISTANCE (No Traffic Control)
Figure 28-3B 28-3.03 Case B – Intersections with Stop Control on the Minor Road
Where traffic on the minor road of an intersection is controlled by stop signs, the driver of the vehicle on the minor road must have sufficient sight distance for a safe departure from the stopped position assuming that the approaching vehicle comes into view as the stopped vehicle begins its departure. The intersection sight distance is obtained by providing clear sight triangles both to the right and left as shown in Figure 28-3C. The length of legs of these sight triangles is determined as follows:

BUREAU OF LOCAL ROADS & STREETS 28-3(4) SIGHT DISTANCE Jan 2006
CLEAR SIGHT TRIANGLES (STOP-CONTROLLED) INTERSECTIONS Figure 28-3C
BUREAU OF LOCAL ROADS & STREETS Jan 2006 SIGHT DISTANCE 28-3(5) 1. Minor Road. The length of leg along the minor road is based on two parts. The first is
the location of the driver’s eye on the minor road. This is typically assumed to be 15 ft (4.5 m) from the edge of traveled way for the major road and in the center of the lane on the minor road. The second part is based on the distance to the center of the vehicle on the major road. For right-turning vehicles, this is assumed to be the center of the closest travel lane from the left. For left-turning vehicles, this is assumed to be the center of the closest travel lane for vehicles approaching from the right. See Figure 28-3C.
2. Major Road. The length of the sight triangle leg or ISD along the major road is
determined using the following equation:
ISD = 1.47 Vmajor tg (US Customary) Equation 28-3.1 ISD = 0.278 Vmajor tg (Metric) Equation 28-3.1 Where: ISD = length of sight triangle leg along major road, ft (m) Vmajor = design speed of major road, mph (km/h) tg = gap acceptance time for entering the major road, sec
The critical gap time (tg) varies according to the design vehicle, the maneuver type, the grade on the minor road approach, the number of lanes on the major roadway, the type of operation, and the intersection skew.
3. Design Vehicles. For local roads and streets, assume a passenger car as the design
vehicle (i.e., tg = 7.5 seconds). 4. Grades. If the approach gradient on the minor road is on an upgrade greater than 3.0%,
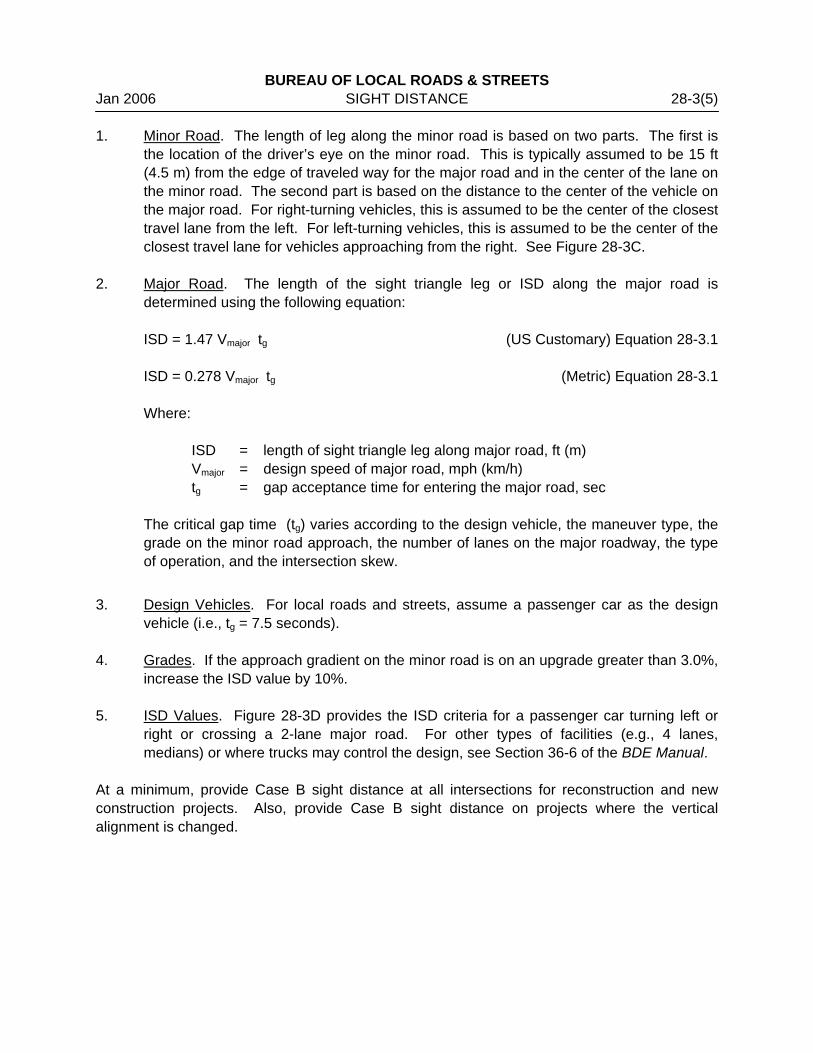
increase the ISD value by 10%. 5. ISD Values. Figure 28-3D provides the ISD criteria for a passenger car turning left or
right or crossing a 2-lane major road. For other types of facilities (e.g., 4 lanes, medians) or where trucks may control the design, see Section 36-6 of the BDE Manual.
At a minimum, provide Case B sight distance at all intersections for reconstruction and new construction projects. Also, provide Case B sight distance on projects where the vertical alignment is changed.
BUREAU OF LOCAL ROADS & STREETS 28-3(6) SIGHT DISTANCE Jan 2006
US Customary
Design Speed (Vmajor) (mph)
ISD (ft) (1)(2)
20 25 30 35 40 45 50 55 60
225 280 335 390 445 500 555 610 665
Metric
Design Speed (Vmajor) (km/h)
ISD (m) (1)(2)
30 40 50 60 70 80 90
100
65 85
105 130 150 170 190 210
Notes: 1. These ISD values assume crossing or left or right turns onto a 2-lane facility without a
median.
2. Where the approach grade on the minor road is on an upgrade greater than 3.0%, increase the ISD value by 10%.
INTERSECTION SIGHT DISTANCES
(Two-Lane Facilities)
Figure 28-3D
BUREAU OF LOCAL ROADS & STREETS Jan 2006 SIGHT DISTANCE 28-3(7) 28-3.04 Case C – Intersections With Yield Control On the Minor Road
At intersections controlled by a yield sign, drivers on the minor road will typically: • slow down as they approach the major road to approximately 60% of the approach
speed;
• based on their view of the major road, make a stop/continue decision; and
• either brake to a stop or continue their crossing or turning maneuver onto the major road.
Yield control criteria is based on a combination of the no control ISD discussed in Section 28-3.02 and the stop-controlled ISD as discussed in Section 28-3.03. Where yield control is proposed, consider the Case C sight distance on new construction and reconstruction projects. If adequate sight distance cannot be provided, consider replacing the yield sign with a stop sign. To determine the applicable clear sight triangles for a yield-controlled intersection, see Figure 28-3E. 28-3.05 Case D – Intersections with Traffic Signal Control
At signalized intersections, provide sufficient sight distance from the stop bar so that the first vehicle on each approach is visible to all other approaches. Traffic signals are often used at high-volume intersections to address crashes related to restricted sight distances. Therefore, the ISD criteria for left- or right-turning vehicles as discussed in Section 28-3.03 are typically not applicable at signalized intersections. However, where right-turn-on-red is allowed, check to ensure that the ISD for a stop-controlled right-turning vehicle is available to the left. If it is not, consider restricting the right-turn-on-red movement. In addition, if the traffic signal is placed on two-way flash operation (i.e., flashing amber on the major-road approaches and flashing red on the minor-road approaches) under off-peak or nighttime conditions, consider providing the ISD criteria as discussed in Section 28-3.03 for a stop-controlled intersection. 28-3.06 Case E – Intersections With All-Way Stop Control
At intersections with all-way stop control, provide sufficient sight distance from the stop bar so that the first stopped vehicle on each approach is visible to all other approaches. Often, intersections are converted to all-way stop control to address limited sight distance at the intersection. Therefore, providing additional sight distance at the intersection is unnecessary.

BUREAU OF LOCAL ROADS & STREETS 28-3(8) SIGHT DISTANCE Jan 2006
US Customary Metric
Design Speed (mph)
Minor Road Approach (a)
(ft)1,2
Major Road Approach (b)
(ft)
Design Speed (km/h)
Minor Road Approach (a)
(m)1,2
Major Road Approach (b)
(m) 20 25 30 35 40 45 50 55 60
100 130 160 195 235 275 320 370 420
195 240 290 335 385 430 480 530 575
30 40 50 60 70 80 90
100
30 40 55 65 80
100 115 135
55 75 95
110 130 145 165 185
Notes: 1. For “T” intersections, use 85 ft (25 m). 2. Values shown are for passenger cars crossing a 2-lane facility with no median and
grades 3.0% or less. Increase ISD by 10% on minor roads with approach grades exceeding 3.0%.
INTERSECTION SIGHT DISTANCE GUIDELINES (Yield Control)
Figure 28-3E

BUREAU OF LOCAL ROADS & STREETS Jan 2006 SIGHT DISTANCE 28-3(9) 28-3.07 Case F – Left Turns From the Major Road
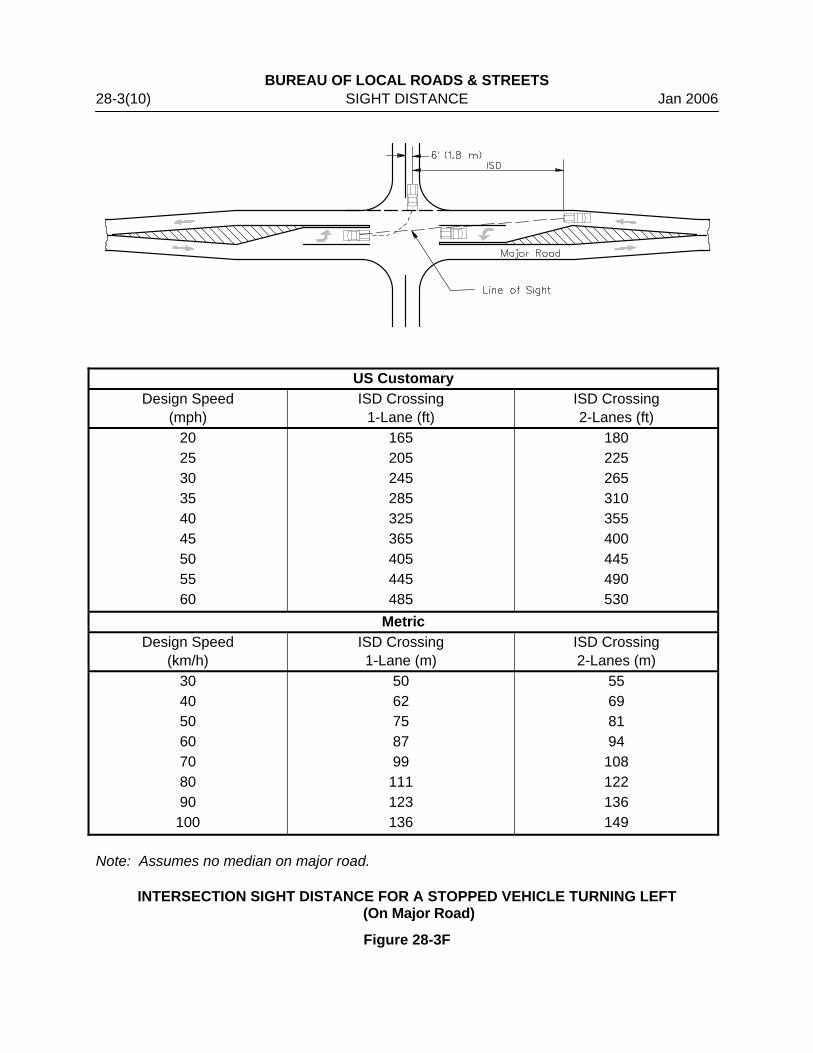
At all intersections, regardless of the type of traffic control, consider the sight distance needs for a stopped vehicle turning left from the major road. This situation is illustrated in Figure 28-3F. The driver will need to see straight ahead for a sufficient distance to turn left and clear the opposing travel lanes before an approaching vehicle reaches the intersection. Sight distance for opposing left turns may be increased by offsetting the left-turn lanes. Figure 28-3F provides ISD values for passenger cars turning left from the major road. 28-3.08 Effect of Skew
Where it is impractical to realign an intersection that is greater than 30° from the perpendicular, the designer may need to adjust the gap acceptance times to account for the additional travel time required for a vehicle to make a turn or cross a facility. At oblique-angled intersections, determine the actual path length for a turning or crossing vehicle by dividing the total distance of the lanes and/or median to be crossed by the sine of the intersection angle. If the actual path length exceeds the total width of the lanes to be crossed by 12 ft (3.6 m) or more, see Section 36-6 of the BDE Manual for additional guidance.
BUREAU OF LOCAL ROADS & STREETS 28-3(10) SIGHT DISTANCE Jan 2006
US Customary Design Speed
(mph) ISD Crossing
1-Lane (ft) ISD Crossing 2-Lanes (ft)
20 25 30 35 40 45 50 55 60
165 205 245 285 325 365 405 445 485
180 225 265 310 355 400 445 490 530
Metric Design Speed
(km/h) ISD Crossing 1-Lane (m)
ISD Crossing 2-Lanes (m)
30 40 50 60 70 80 90
100
50 62 75 87 99
111 123 136
55 69 81 94
108 122 136 149
Note: Assumes no median on major road.
INTERSECTION SIGHT DISTANCE FOR A STOPPED VEHICLE TURNING LEFT
(On Major Road)
Figure 28-3F
BUREAU OF LOCAL ROADS & STREETS Jan 2006 SIGHT DISTANCE 28-4(1) 28-4 REFERENCES
1. A Policy on Geometric Design of Highways and Streets, AASHTO, 2004. 2. NCHRP Report 400, Determination of Stopping Sight Distances, Transportation
Research Board, 1997. 3. Highway Capacity Manual 2000, Transportation Research Board, 2000. 4. NCHRP Report 383, Intersection Sight Distance, Transportation Research Board, 1996. 5. Chapter 36 “Intersections” and Chapter 47 “Rural Two-Lane/Multi-lane State Highways
(New Construction/Reconstruction),” Bureau of Design and Environment Manual, IDOT.

BUREAU OF LOCAL ROADS & STREETS 28-4(2) SIGHT DISTANCE Jan 2006