Embed Size (px)
Citation preview

CHAPTER – IV
IMPACT OF PRIORITY SECTOR LENDING ON
URBAN CO-OPERATIVE BANKS
A) INTRODUCTION
B) BACKGROUND OF AURANGABAD AND
JALNA DISTRICTS
C) FINANCIAL POSITION AND
PERFORMANCE OF URBAN CO-
OPERATIVE BANKS IN AURANGABAD
AND JALNA DISTRICTS
D) ANALYSIS OF PRIORITY SECTOR
LENDING DATA OF SELECTED URBAN
CO-OPERATIVE BANKS.
E) ANALYSIS OF MAJOR FINANCIAL
INDICATORS OF SELECTED URBAN CO-
OPERATIVE BANKS.
F) STUDY OF RECENT PERFORMANCE OF
THE SELECTED URBAN CO-OPERATIVE
BANKS.

CHAPTER NO. IV
IMPACT OF PRIORITY SECTOR LENDING ON
URBAN CO-OPERATIVE BANKS
The Urban co-operative banks have passed through many phase since
the enactment of the agriculture credit co-operative Societies Act, 1904.
Presently the Urban co-operative banks are facing number of problems
mainly problem of overdue, increasing amount of NPA, competition with
foreign, private and public commercial banks, political interference, lack of
trained personnel, low profitability etc. These banks are required to lend
60% of their total lending to priority sector. 25% of the priority sector
lending shall be given to weaker section of the society. Some experts
believe that the priority sector lending is the one of the major cause of the
poor performance of the number of urban banks.
The present chapter is an attempt to study the impact of priority sector
lending by the urban banks in Aurangabad and Jalna district. Priority sector
lending reports and annual reports of the selected banks for the period from
1995-96 to 2004-05 have been reviewed on the basis of various aspects such
as sub-sector wise study of loans sanctioned, amount advanced, amount of
overdue, profitability, Net NPA, Net GPA etc.
Background of Aurangabad Districts
Aurangabad is a regional headquarter of the Marathwada region. The
district headquarters situated on kham river is a place of great attraction for
the tourists because of numerous ancient remains. Aurangabad district is
famous for Ajanta caves, Ellora caves, Daultabad (Deogiri) Fort, Paithan,
84
Pawan Chakki and Bibi ka maqbara. Aurangabad district is a great center of
culture activities and place of political activities. Aurangabad is also an
industrial city and a good center of education having number of excellent
educational institutes. Dr. Babasaheb Ambedkar Marathwada University is
situated in Aurangabad, imparting and monitoring higher education in
Aurangabad, Jalna, Beed and Osmanabad districts of the Marathwada
region.
The geographical area of Aurangabad district is nearly 8900 Sq. kms.
Aurangabad district includes Kannad, Sillod, Soygaon, Khultabad, Vaijapur,
Gangapur, Aurangabad, Paithan and Fulambri talukas. The major rivers
flowing through the district are Godavari, Dudhana, Kham, Purna, Vaghur,
Kelna, Anjana, Girja, Shivana, Yelganga etc. The average rainfall in the
district is 725 mm and the temperature ranges between 130 to 42
0C.
According to 2001 census report the population of Aurangabad district was
2920348 and the literacy rate was 73.63 %.
District of Aurangabad is continuously a place of draught and
inadequate rainfall, bad and rocky land, less proportion of fertile land and
lack of perennial water source. All these aspects always hampered the
agricultural prospects of the district. It was Jayakwadi Project which filled
the breath in the farming economy of the district.
Till Nizam’s time the district had only traditional village industry
which has direct contribution in the village or local economy but not in the
district as such and not in the state. It only provided needs of society and
inadequate subsistence to the village professionals. Fortunately the Constant
& efforts of Government for upliftment of society gave fruits, though with
very slow pace, and various aspects including economy and industry grew
85
to the betterment. The best policy of the Government was the foundation of
the Maharashtra Industrial Development Corporation (MIDC). Similarly,
various financing institutes like SICOM, MSFC, MSSIDC, Regional
Development corporations, District Industrial Centers, Khadi Village
Industrial Corporation, Women Economical Development Corporation and
various schemes floated for time to time have also contributed in the
development of Aurangabad district. Aurangabad district received first
Industrial Estate called Chikalthana. Now Aurangabad has 5 major
industrial estates. The industrial estates are located at Chikalthana, Waluj,
Railway Station, Paithan road area, and at Paithan.
Communication of all types is an important factor in the development
of the society. Aurangabad is well connected with distance area through
railway, road and air transport system. (1)
Background of Jalna Districts
Jalna become the district in 1981. Prior to May, 1981 Jalna district
was a part of Aurangabad district. The district headquarters is situated on
Kundlika river. Jamb Samrtha in Jalna district is well known as a birth place
of Swami Ramdas Samarth. Asai in Jafrabad taluka is a famous place
known for the battle of 1803 between British and Maratha. Bhokardan, a
taluka headquarters is famous for early historical habitation and caves of
vakataka period.
Jalna is known as the seed capital of India. There are nearly 35 seed
processing units. Mahico Seeds Co., Mahendra Seeds Co., Safal Seeds Co.,
86

Krishidhan Seeds Co. etc. are well-known seeds companies in national as
well as in international market.
Re-rolling mills and steel companies have been flourished during last
30 years and the steel market is well known in Maharashtra.
Jalna is a well-known trading center of Maharashtra. Jalna grain
market is famous for certain goods all over the country.
The geographical area of Jalna is nearly 7405 Sq. kms. Jalna district
includes Jalna, Ambad, Bhokardan, Jafrabad, Partur, Mantha, Badnapur and
Ghansawangi talukas. The major rivers flowing through the district are
Godavari, Dudhana, Kundalika, Purna, Girja, Khelana, Galhati, Kalyan,
Jiverkhi, Jui, Dhamana etc. The average rainfall in the district is 730 mm
and the temperature ranges between 70 to 42
0 C. According to 2001 census
report, the population of Jalna district was 1612357.
The district has inadequate water sources including rain. Major area is
irrigated under well and artificial irrigation system which is still
undeveloped and inadequate. The district does not have major irrigation
project. The project of Jayakwadi of Paithan in Aurangabad district has
some influence over this district. The small farmers are greater in number
and that has immense effect on the agricultural product. The production and
yield of the major crops is much less as compare to the other districts of
Maharashtra. According to 1991 census report, 46.63% of the district
population was farmers and 36.16% were agricultural labours. This shows
that major portion of the population is dependent upon farming.
87
Jalna is one of the industrially backward district of Maharashtra state.
Jalna has four major Industrial estates. The first Industrial estate came into
existence in the year 1962 on co-operative basis which is situated near the
Christian grave yard. The second Industrial estate came into existence after
1980 which is situated on Aurangabad road. Industrial estates have also
been established in Partur and Ambad. The industrial development in the
district has accelerated to some extent only after establishment of District
Industrial Center in 1982.
Jalna is a major railway station on Mumbai-Kacheguda railway line.
It is well connected with distance area through railway and road. However,
development of new railway routes is very important for the development of
trade, commerce and industry in the Jalna districts.
Among many other problems, irregular and inadequate supply of
water is the burning problem of Jalna district which is hampering the
development of the district. (2)
Financial Position and Performance of Urban Co-operative Banks in
Aurangabad District.
The researcher has used secondary data for this purpose. According
to the available data for the year 2004-2005, there were 16 UCBs registered
in Aurangabad district. Table No. 4.1 provides better insight of the financial
position and performance of UCBs registered and operating in Aurangabad
district.
88
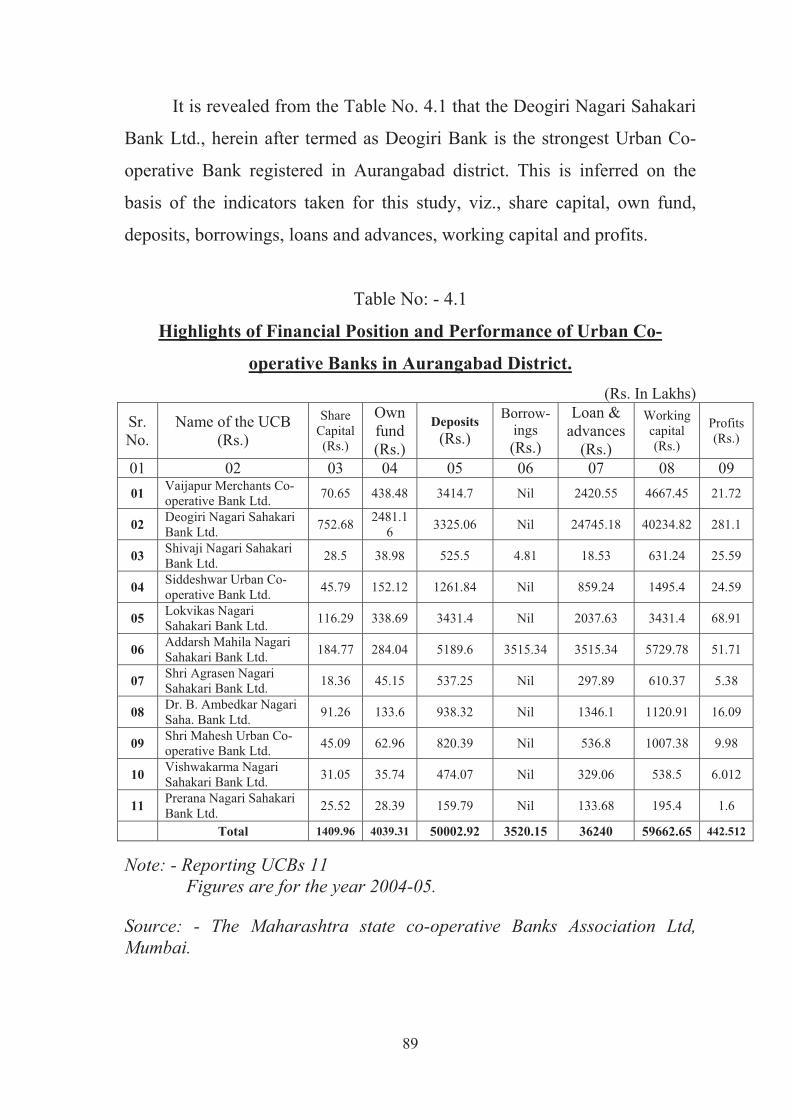
It is revealed from the Table No. 4.1 that the Deogiri Nagari Sahakari
Bank Ltd., herein after termed as Deogiri Bank is the strongest Urban Co-
operative Bank registered in Aurangabad district. This is inferred on the
basis of the indicators taken for this study, viz., share capital, own fund,
deposits, borrowings, loans and advances, working capital and profits.
Table No: - 4.1
Highlights of Financial Position and Performance of Urban Co-
operative Banks in Aurangabad District.
(Rs. In Lakhs)
Sr.
No.
Name of the UCB
(Rs.)
Share
Capital
(Rs.)
Own
fund
(Rs.)
Deposits
(Rs.)
Borrow-
ings
(Rs.)
Loan &
advances
(Rs.)
Working
capital
(Rs.)
Profits
(Rs.)
01 02 03 04 05 06 07 08 09
01Vaijapur Merchants Co-
operative Bank Ltd.70.65 438.48 3414.7 Nil 2420.55 4667.45 21.72
02Deogiri Nagari Sahakari
Bank Ltd.752.68
2481.1
63325.06 Nil 24745.18 40234.82 281.1
03Shivaji Nagari Sahakari
Bank Ltd.28.5 38.98 525.5 4.81 18.53 631.24 25.59
04Siddeshwar Urban Co-
operative Bank Ltd.45.79 152.12 1261.84 Nil 859.24 1495.4 24.59
05Lokvikas Nagari
Sahakari Bank Ltd.116.29 338.69 3431.4 Nil 2037.63 3431.4 68.91
06Addarsh Mahila Nagari
Sahakari Bank Ltd.184.77 284.04 5189.6 3515.34 3515.34 5729.78 51.71
07Shri Agrasen Nagari
Sahakari Bank Ltd.18.36 45.15 537.25 Nil 297.89 610.37 5.38
08Dr. B. Ambedkar Nagari
Saha. Bank Ltd.91.26 133.6 938.32 Nil 1346.1 1120.91 16.09
09Shri Mahesh Urban Co-
operative Bank Ltd.45.09 62.96 820.39 Nil 536.8 1007.38 9.98
10Vishwakarma Nagari
Sahakari Bank Ltd.31.05 35.74 474.07 Nil 329.06 538.5 6.012
11Prerana Nagari Sahakari
Bank Ltd.25.52 28.39 159.79 Nil 133.68 195.4 1.6
Total 1409.96 4039.31 50002.92 3520.15 36240 59662.65 442.512
Note: - Reporting UCBs 11
Figures are for the year 2004-05.
Source: - The Maharashtra state co-operative Banks Association Ltd,
Mumbai.
89
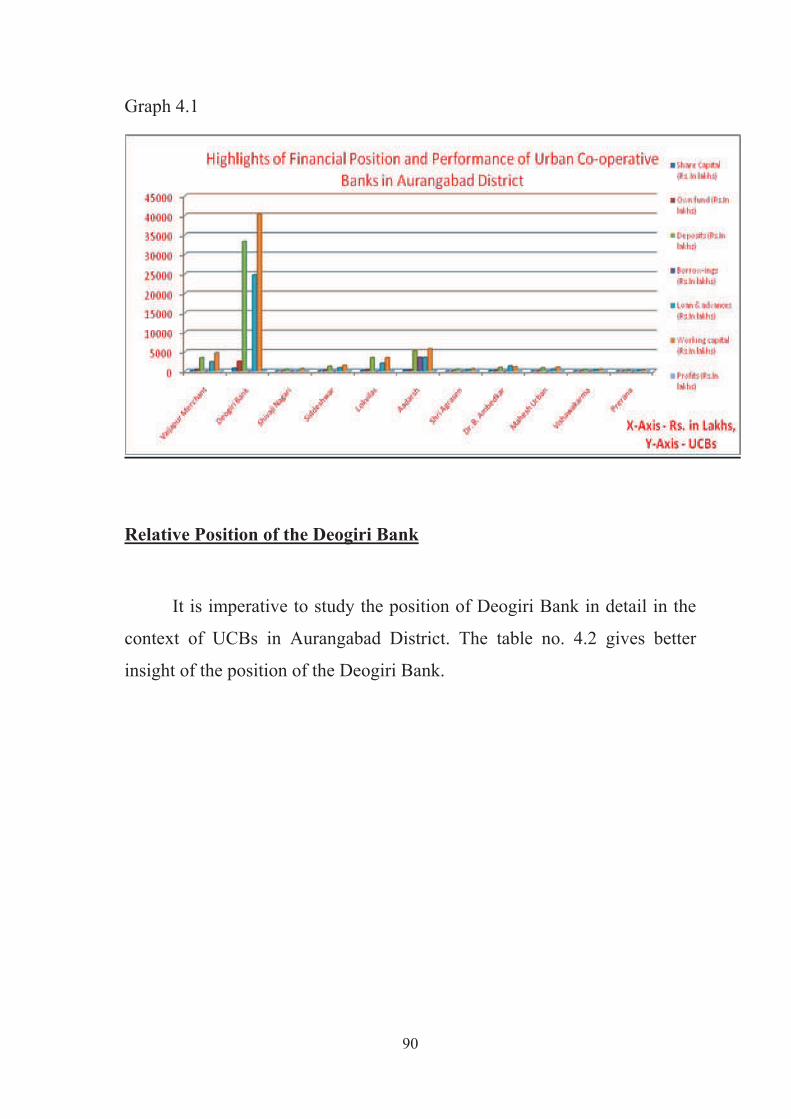
Graph 4.1
Relative Position of the Deogiri Bank
It is imperative to study the position of Deogiri Bank in detail in the
context of UCBs in Aurangabad District. The table no. 4.2 gives better
insight of the position of the Deogiri Bank.
90

Table No. 4.2
Relative Position of the Deogiri Bank in
Comparison to Total UCBs in Aurangabad District.(Rs. In Lakhs)
Sr.
No.Indicators
Position of all
UCBs in A. bad.
(Rs.)
Position of Deogiri
Bank (Rs.)
% Share of
Deogiri Bank.
01 02 03 04 05
01 Deposit 50,062.92 31248.70 66.42 %
02 Loans & Advance 36240.00 24745.18 68.28 %
03 Borrowing 3520.15 Nil Nil
04 Own fund 4039.31 2481.16 61.42 %
05 Profit 442.512 281.1 63.52 %
06 Share capital 1409.96 725.80 51.47 %
07 Working capital 59662.65 40234.82 67.43 %
Note: - 1) Figure relating to the year 2004-05 is being considered.
2) Reporting Banks 11
Source: - the Maharashtra state Co-operative Banks Association Ltd.
Mumbai.
Graph 4.2
91
It is revealed from the Table No. 4.2 that during 2004-05, the share
capital of Deogiri Bank in total Share capital of registered and operating
UCBs in Aurangabad district is more than 50%, where as in case of own
fund, deposits, loans & advances and working capital it is above 65 %. Its
profits is just below 65% of the total profits earned by reporting UCBs in
Aurangabad district.
It is also seen that the Deogiri bank is fully self-sufficient as there
were no borrowings during 2004-05.
The above fact shows that the financial position and profitability of
the Deogiri bank is very strong. It is seen that the Deogiri bank had
occupied the dominating position amongst the UCBs registered and
operating in Aurangabad district.
Financial Position and Performance of Urban Co-operative Banks in
Jalna District
According to the data available for the year 2004-05 there were seven
UCBs registered in Jalna district. Table No. 4.3 provides better insight of
the financial position and performance of UCBs registered and operating in
Jalna district.
92

Table No – 4.3
Highlights of Financial Position and Performance of
Urban Co-operative Banks in Jalna District.(Rs. In Lakhs)
Sr.
No
.
Name of the UCB
(Rs.)
ShareCapital
(Rs.)
Own
fund
(Rs.)
Deposits
(Rs.)Borrowin
gs (Rs.)
Loan &
advance
s (Rs.)
Working
capital
(Rs.)
Profits
(Rs.)
01 02 03 04 05 06 07 08 09
01
The Jalna Peoples
Co-operative Bank
Ltd.
124.58 638.7 6131.49 131.51 4482.5 7859.30 5.06
02
Shri Gajanan
Maharaj Urban Co-
operative Bank Ltd.
52.53 114.7 700.86 578.83 578.83 961.95 14.34
03
Priyadarshinai
Nagari Sahakari
Bank Ltd.
35.68 44.54 583.01 Nil 374.31 647.09 0.27
04
Jalna Merchants
Co-operative Bank
Ltd.
46.71 156.46 1616.14 Nil 1051.78 1940.56 43.34
05Mantha Urban Co-
operative Bank Ltd.28.97 54.19 809.8 Nil 535.97 930.84 6.64
Total 288.29 1008.59 9841.3 710.34 7023.39 12339.79 55.31
Note: - Reporting UCBs 05
Source: - The Maharashtra state Co-operative Banks’ Association Ltd.,
Mumbai.
Graph 4.3
93

It is revealed from table No. 4.3 that the position of Jalna peoples Co-
operative Bank Ltd., hereinafter termed as Peoples’ Bank, is stronger in
comparison to other UCBs registered in Jalna district on the basis of the
indicators, viz., share capital, own fund, deposits, loans and advances and
working capital. However, its profitability seems to be less than two other
UCBs, registered and operating in Jalna district. It is also seen that the
Peoples’ Bank has resorted to external borrowing where as there were three
other UCBs, which have not resorted to external borrowings for the year
2004-05. Hence on this parameter the position of Peoples’ bank is seems to
be weak.
The profitability of the Jalna Merchants Co-operative Bank Ltd was
highest as compared to other UCBs in Jalna district and it was not depend
upon external borrowings. However, merchants Bank came into existence in
1998 and the present study covers the period from 1995-96 to 2004-05. The
profitability of the Gajanan Maharaj Urban Co-operative Bank Ltd. was also
higher than the Peoples’ Bank. However, it came into existence in 1995 &
its dependence on external borrowing was also higher than the Peoples’
Bank.
Relative Position of Peoples’ bank, Jalna
It is imperative to study the position of Peoples Bank in detail in the
context of UCBs in Jalna District. The table no. 4.3 gives better insight of
the position of the Peoples Bank.
94

It is reveled from the table No. 4.4 that the share of Jalna Peoples Co-
operative Bank in total share capital of operating registered UCBs in Jalna
district during 2004-05 was 43.21%, where as in case of own fund, deposits,
loans and advances and working capital it was around 63%. It is also seen
that its borrowing was moderate at 18.51% during the same period.
The above facts show that the Peoples’ Bank is the strongest UCB in
Jalna district. However, it is also revealed that its share of profit is just
9.14% of the profit earned by all the operating registered UCBs in Jalna
district during 2004-05. It is a cause of concern for the Peoples’ Bank.
The researcher had to select one UCB each from Aurangabad and
Jalna district. The selection was made on purposive and systematic
sampling basis after analyzing the relative positions of the UCBs registered
in Aurangabad and Jalna districts.
Table No : 4.4
Relative Position of Peoples’ bank, Jalna in Comparison to
Total Urban Co-operative Banks in Jalna District.
(Rs. In Lakhs)
Sr.
No.Indicators
Position of
all UCBs in
Jalna (Rs.)
Position of
Peoples’
Bank (Rs.)
% Share of
JPC in UCBs
in Jalna
01 02 03 04 05
01 Share capital 288.29 124.58 43.21%
02 Own fund 1008.59 638.7 63.32
03 Deposit 9841.3 6131.49 62.30%
04 Borrowing 710.34 131.51 18.51%
05 Loans & Advance 7023.39 4482.5 63.82%
06 Working capital 12339.79 7859.35 63.69
07 Profit 55.31 5.06 9.14%
95

Graph No. 4.4
Deogiri Bank being the strongest bank amongst the UCBs registered
in Aurangabad and Peoples’ bank being the dominating UCB in Jalna
districts have been selected for detail study of the impact of priority sector
lending on UCBs in Aurangabad and Jalna districts.
Deogiri Bank was established in 1985 & working through ten
branches, two extension counters, one training center & head office. There
were 11232 shareholders. Peoples’ Bank was established in 1958 &
working through Nine branches & head office. There were 19090
shareholders. The area of operation of both the banks is confined to
Aurangabad & Jalna districts.
96

Priority Sector lending by Deogiri bank Aurangabad
To get deep insight of priority sector lending by these two banks, it is
necessary to study the number of borrowing units limits sanctioned, amount
advanced balance outstanding and amount of overdue under the priority
sector lending for the period from 1995-96 to 2004-05.
Table no. 4.5 gives better insight of the number of borrowing units
limits sanctioned, amount advanced balance outstanding and amount of
overdue under the priority sector lending by Deogiri bank, Aurangabad for
the period from 1995-96 to 2004-05.
Table No 4.5
Priority Sector lending by Deogiri bank Aurangabad
(Rs. In thousands)
Sr.
NoYear
No. Of
borrowing
units
Limits
sanctioned
Amount
Advanc
ed
Balance
outstandi
ng
Amt.
Overdue
01 02 03 04 05 06 07
01 March End
1995-962881 184842 181687 145377 19552
02 1996-97 3656 288724 283817 217375 21467
03 1997-98 4533 429587 431303 364936 28407
04 1998-99 3727 472667 450255 357628 23044
05 1999-2000 N. A. N. A. N. A. N. A. N. A.
06 2000-01 8613 1127226 1113854 957968 75894
07 2001-02 9120 1419897 1419897 1125196 88167
08 2002-03 9795 1430315 1403294 1182491 109660
09 2003-04 10679 1664075 1664076 1351557 178818
10 2004-05 11131 1884039 1855425 1576484 190817
Note: N. A. (Not available)
Source: - Deogiri Bank, priority sector Reports from 1995-96 to 2004-05.
97

It is seen from the Table No. 4.5 that the number of borrowers under
priority sector lending by Deogiri Nagari Sahakari Bank Ltd, Aurangabad
has increased from 2881 during 1995-96 to 11131 during 2004-05. There
was an increase by 286.35% in the number of borrowers during the period
of 10 years. It is also seen that during the year 2000-01 number of borrowers
as compared to 1998-99 has increased at a very high rate & there after the
increase in the number of borrowers was only moderate.
It is also seen from the Table No. 4.5 that the limits sanctioned under
the priority sector lending has increased from Rs. 184842 thousands in
1995-96 to Rs. 1884039 thousands in 2004-05 indicating an increase of over
10 times during the period of 10 years. It is also seen that there were
constant increase in the amount sanctioned under priority sector by the
Deogiri bank. However, the increase in limits sanctioned during 2000-01
seems to be sharp as compared to the year 1998-99.
It is also evident that the amount advanced under the priority sector
lending by Deogiri Bank has increased from Rs. 181687 thousands in 1995-
96 to Rs. 1855425 thousands in 2004-05, indicating nearly 10 times increase
during the period of 10 years. Almost same trend is evident so far as year-
to-year increase in amount advance is concerned as seen for limits
sanctioned.
The Table No 4.5 also reveals that the amount outstanding at the end
of March 1996 was Rs. 145377 thousands. It was Rs. 1576484 thousand at
the end of March 2005 indicating an increase of more than 10 times during
the period 1995-96 to 2004-05.
98
It is also seen from the Table No 4.5 that the amount of overdue for
the year ending March 1995 was Rs. 19552 thousands. It was Rs. 190520
thousands at the end of March 2005 showing nearly 10 time increase during
the same period.
Amount of overdue as a proportion of balance outstanding was
highest at 13.44% in 1995-96. Then from 1996-97 to 2002-03, it was less
than 10%. However, in 2003-04 and 2004-05, it was reached at 13.23% and
12.08% respectively. It means that the amount of overdue during 1996-97
to 2002-03 was much under control. However it was above tolerable limit
during 2003-04 and 2004-05. It was a cause of concern for the Deogiri
Bank.
Priority Sector Lending by Peoples’ Bank, Jalna
Table no. 4.6 gives an insight in to the priority sector lending by the
Jalna Peoples’ Bank, Jalna during the period 1995-96 to 2004-05.
99

Table No.: 4.6
Priority Sector Lending by Peoples’ Bank, Jalna(Rs. In thousands)
Sr.
No.Year
No of
borrowing
units
Limits
sanctioned
Amt.
Advanced
Balance
outstanding
Amt.
Overdue
01 02 03 04 05 06 07
01March
End
19963256 119273 99206 91265 29115
02 1997 3431 166744 150582 138705 27528
03 1998 3908 167339 145158 122364 23234
04 1999 4039 173589 160705 154229 20561
05 2000 4773 194185 195400 191160 20875
06 2001 5912 264848 266438 252433 23967
07 2002 5693 270468 291294 278737 37007
08 2003 5404 310369 301577 275292 45912
09 2004 4902 309065 296121 270626 53992
10 2005 3950 286114 278220 249052 48681
Source: - Peoples’ Bank Priority Sectors reports (1995-96 to 2004-05)
It is seen from the Table No. 4.6 that the number of borrowers under
priority sector lending by Jalna Peoples’ co-operative Bank Ltd. Jalna has
increased from 3256 at the end of March 1996 to 3950 at the end of March
2005. There was an increase of 21.31 % in the number of borrowers over a
period of 10 years. It is also seen that the number of borrower has increased
from 3256 in 1995-96 to 5912 in 2000-01 & there after there was a
declining trend till 2004-05.
It is also seen from the Table No 4.6 that the limits sanctioned under
the priority sector lending has increased from Rs. 119273 thousands in
1995-96 to Rs. 286114 thousands in 2004-05 indicating an increase of
139.88 % over the period of ten years. It is also revealed that there was
continuous increase in the limits sanctioned by peoples’ bank under priority
100
sector lending, except the year 2003-04, and 2004-05 in which it is seen that
limit sanctioned was slightly lower than the previous years.
A careful analysis of amount advanced under priority sector lending
by Peoples’ Bank, Jalna during 1995-96 to 2004-05 showed fluctuating
trends. In 1996-97, it has increased to Rs. 150582 thousands as compared
Rs. 99206 thousands in 1995-96, witnessing an increase of 51.78 %. In
1997-98, it has reduced to Rs. 145158 thousands witnessing a decline of
3.61 % as compared to 1996-97. There after there was a continuous
increase in amount advanced under priority sector till 2002-03. However, in
2003-04 it has declined to Rs. 296121 thousands as compared to Rs. 301577
thousands in 2002-03. In 2004-05, it has further reduced to Rs. 278220
thousands.
It is also seen that the amount of overdue was Rs. 29115 thousands in
1995-96. It has continuously decline till 1998-99 and reached the lowest
level of the period under study to Rs. 20561 thousands. There after, it has
shown a continued increasing trend till 2003-04 showing Rs. 53992
thousands in 2003-04. However, in 2004-05, it has declined to Rs. 48681
thousands. Over the period of 10 years, i.e. from 1995-96 to 2004-05, it has
increased by 67.20 %.
Analysis of borrowing units under priority sector lending.
It is imperative to study the total no. of beneficiaries and sub-sector
wise number of beneficiaries under the priority sector lending by Deogiri
Bank, Aurangabad and Peoples’ Bank, Jalna, for the period of 10 years from
1995-96 to 2004-05. It will reveal the relative significance of sub-sector
101

wise lending under the priority sector in the context of number of
beneficiaries.
Table no. 4.7 reveals the sub-sector wise increase or decrease in the
number of beneficiaries under the priority sector lending by Deogiri Bank,
Aurangabad, for the period from 1995-96 to 2004-05.
It is evident from table no. 4.7 that the total borrowing units under the
priority sector lending by Deogiri Bank, Aurangabad has continuously
increased from 2881 units in 1995-96 to 11131 units in 2004-05, except for
one year 1998-99. It was 2881 in 1995-96. It was increased to 11131 in
2004-05. It indicate that during the period of 10 years from 1995-96 to
2004-05, the total number of borrowing units under priority sector lending
by Deogiri bank has increased by 3.86 times. It means that this bank has
succeeded in attracting more and more borrowers over the period of time.
102
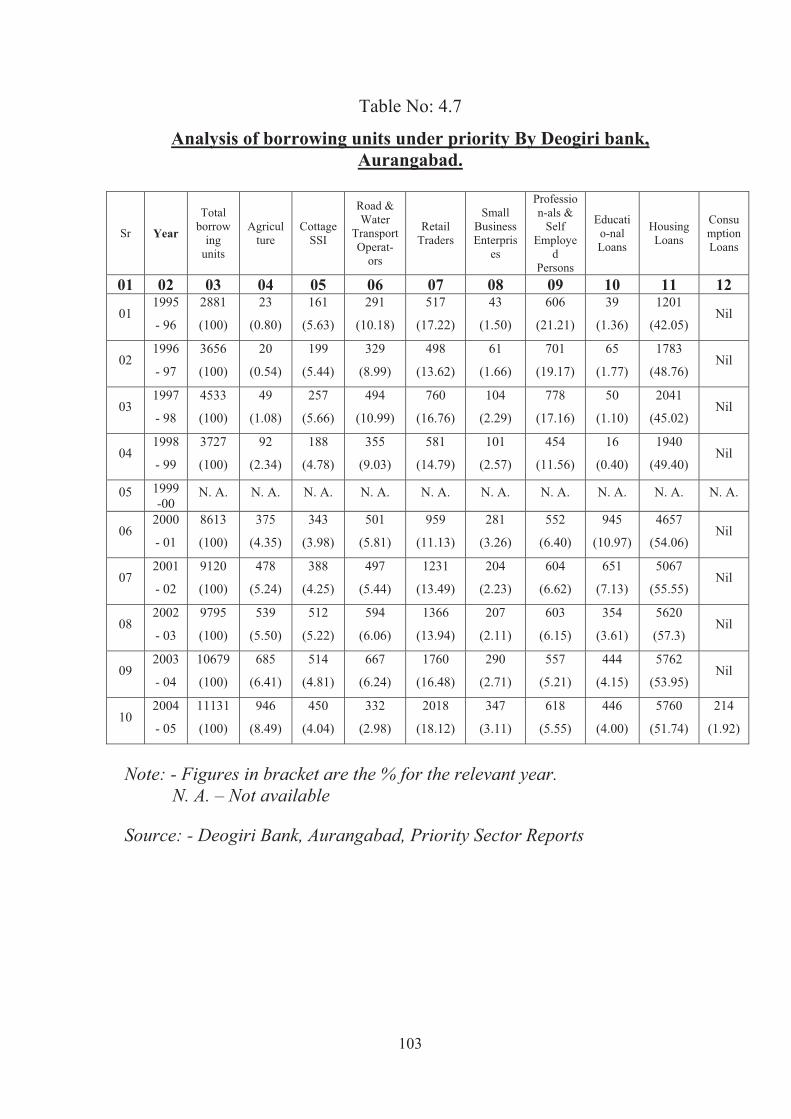
Table No: 4.7
Analysis of borrowing units under priority By Deogiri bank,
Aurangabad.
Sr Year
Total
borrow
ing
units
Agricul
ture
Cottage
SSI
Road &
Water
Transport
Operat-
ors
Retail
Traders
Small
Business
Enterpris
es
Professio
n-als &
Self
Employe
d
Persons
Educati
o-nal
Loans
Housing
Loans
Consu
mption
Loans
01 02 03 04 05 06 07 08 09 10 11 12
011995
- 96
2881
(100)
23
(0.80)
161
(5.63)
291
(10.18)
517
(17.22)
43
(1.50)
606
(21.21)
39
(1.36)
1201
(42.05)Nil
021996
- 97
3656
(100)
20
(0.54)
199
(5.44)
329
(8.99)
498
(13.62)
61
(1.66)
701
(19.17)
65
(1.77)
1783
(48.76)Nil
031997
- 98
4533
(100)
49
(1.08)
257
(5.66)
494
(10.99)
760
(16.76)
104
(2.29)
778
(17.16)
50
(1.10)
2041
(45.02)Nil
041998
- 99
3727
(100)
92
(2.34)
188
(4.78)
355
(9.03)
581
(14.79)
101
(2.57)
454
(11.56)
16
(0.40)
1940
(49.40)Nil
05 1999
-00N. A. N. A. N. A. N. A. N. A. N. A. N. A. N. A. N. A. N. A.
062000
- 01
8613
(100)
375
(4.35)
343
(3.98)
501
(5.81)
959
(11.13)
281
(3.26)
552
(6.40)
945
(10.97)
4657
(54.06)Nil
072001
- 02
9120
(100)
478
(5.24)
388
(4.25)
497
(5.44)
1231
(13.49)
204
(2.23)
604
(6.62)
651
(7.13)
5067
(55.55)Nil
082002
- 03
9795
(100)
539
(5.50)
512
(5.22)
594
(6.06)
1366
(13.94)
207
(2.11)
603
(6.15)
354
(3.61)
5620
(57.3)Nil
092003
- 04
10679
(100)
685
(6.41)
514
(4.81)
667
(6.24)
1760
(16.48)
290
(2.71)
557
(5.21)
444
(4.15)
5762
(53.95)Nil
102004
- 05
11131
(100)
946
(8.49)
450
(4.04)
332
(2.98)
2018
(18.12)
347
(3.11)
618
(5.55)
446
(4.00)
5760
(51.74)
214
(1.92)
Note: - Figures in bracket are the % for the relevant year.
N. A. – Not available
Source: - Deogiri Bank, Aurangabad, Priority Sector Reports
103

Table no 4.7 also revealed that the total number of borrowing units
under all the sub sectors has increased over the period from 1995-96 to
2004-05. However, the increase in the number of borrowing units under
housing loan, agriculture, educational loan and consumption loan was very
impressive.
It is further revealed from table no. 4.7 that the number of borrowing
units under the sub-sector housing loan by Deogiri Bank, has continuously
increase from 1201 units in 1995-96 to 5760 units in 2004-05. The number
of borrowing units under the agriculture sector has increase from 23 units in
1995-96 to 946 units in 2004-05. The increase in the number of borrowing
units under the housing loan and agriculture loan is very impressive.
In 1995-96, the relative position of various sub-sectors of the priority
sector lending by Deogiri Bank in the context of borrowing units were
in the following order, namely, (i) housing loan, (ii) professional and self –
employed, (iii) retail traders, (iv) road and water transport operators, (v)
cottage and SSI, (vi) small business enterprises, (vii) educational loan, (viii)
agriculture. During 1995-96 to 2003-04, no consumption loan was granted
by Deogiri bank.
In 2004-05, the relative position of number of borrowing units under
various sub-sectors of the priority sector were in the following order,
namely, (i) housing loan, (ii) retail traders, (iii) agriculture, (iv)
professionals and self-employed persons, (v) cottage and small SSI, (vi)
educational loan, (vii) small business enterprises, (viii) Road and water
transport operator, (ix) consumption loan.
104
The relative position of these sub-sectors have undergone a sea
change over the period of 10 years from 1995-96 to 2004-05.
It is also seen from the table no. 4.25 that the proportionate share of
borrowing units under housing loan, professionals and self employed
persons and retail traders in 1995-96 were 42.05 %, 21.21% and 17.22%
respectively and the share of remaining sub-sectors of the priority sector
was only 19.52 %. In 2004-05 the proportionate share of borrowing units
under the housing loan, retail traders and agriculture were 51.74 %, 18.12 %
and 8.49 % respectively. The share of remaining sub-sector of the priority
sector lending was 21.65 %.
It is further evident from table no. 4.7 that the relative importance of
agriculture loan have been considerably increased over the period from
1995-96 to 2004-05.
Analysis Of Borrowing Units Under Priority Sector Lending By
Peoples’ Bank, Jalna.
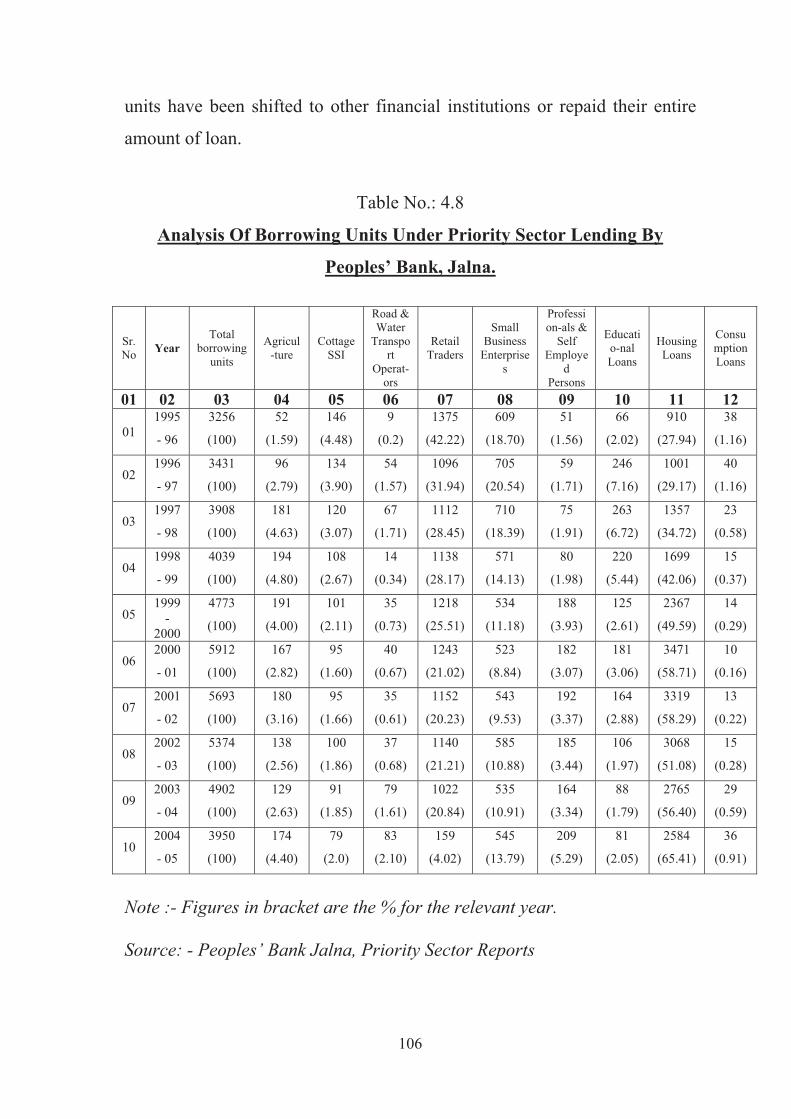
The table no. 4.8 reveals the sub-sector wise increase or decrease in
the number of beneficiaries under the priority sector lending by the Peoples’
Bank, Jalna for the period of 10 years from 1995-96 to 2004-05.
It is evident from table no. 4.8 that the total borrowing units under the
priority sector lending by Peoples’ Bank, Jalna has continuously increased
during 1995-96 to 2000-01. It was 3256 in 1995-96. It was increased to
5912 in 2000-01. Thereafter it has declined continuously from 2001-02 and
reached to 3950 in 2004-05. It means that the large number of borrowing
105
units have been shifted to other financial institutions or repaid their entire
amount of loan.
Table No.: 4.8
Analysis Of Borrowing Units Under Priority Sector Lending By
Peoples’ Bank, Jalna.
Sr.
NoYear
Total
borrowing
units
Agricul
-ture
Cottage
SSI
Road &
Water
Transpo
rt
Operat-
ors
Retail
Traders
Small
Business
Enterprise
s
Professi
on-als &
Self
Employe
d
Persons
Educati
o-nal
Loans
Housing
Loans
Consu
mption
Loans
01 02 03 04 05 06 07 08 09 10 11 12
01
1995
- 96
3256
(100)
52
(1.59)
146
(4.48)
9
(0.2)
1375
(42.22)
609
(18.70)
51
(1.56)
66
(2.02)
910
(27.94)
38
(1.16)
021996
- 97
3431
(100)
96
(2.79)
134
(3.90)
54
(1.57)
1096
(31.94)
705
(20.54)
59
(1.71)
246
(7.16)
1001
(29.17)
40
(1.16)
031997
- 98
3908
(100)
181
(4.63)
120
(3.07)
67
(1.71)
1112
(28.45)
710
(18.39)
75
(1.91)
263
(6.72)
1357
(34.72)
23
(0.58)
041998
- 99
4039
(100)
194
(4.80)
108
(2.67)
14
(0.34)
1138
(28.17)
571
(14.13)
80
(1.98)
220
(5.44)
1699
(42.06)
15
(0.37)
051999
-
2000
4773
(100)
191
(4.00)
101
(2.11)
35
(0.73)
1218
(25.51)
534
(11.18)
188
(3.93)
125
(2.61)
2367
(49.59)
14
(0.29)
062000
- 01
5912
(100)
167
(2.82)
95
(1.60)
40
(0.67)
1243
(21.02)
523
(8.84)
182
(3.07)
181
(3.06)
3471
(58.71)
10
(0.16)
072001
- 02
5693
(100)
180
(3.16)
95
(1.66)
35
(0.61)
1152
(20.23)
543
(9.53)
192
(3.37)
164
(2.88)
3319
(58.29)
13
(0.22)
082002
- 03
5374
(100)
138
(2.56)
100
(1.86)
37
(0.68)
1140
(21.21)
585
(10.88)
185
(3.44)
106
(1.97)
3068
(51.08)
15
(0.28)
092003
- 04
4902
(100)
129
(2.63)
91
(1.85)
79
(1.61)
1022
(20.84)
535
(10.91)
164
(3.34)
88
(1.79)
2765
(56.40)
29
(0.59)
102004
- 05
3950
(100)
174
(4.40)
79
(2.0)
83
(2.10)
159
(4.02)
545
(13.79)
209
(5.29)
81
(2.05)
2584
(65.41)
36
(0.91)
Note :- Figures in bracket are the % for the relevant year.
Source: - Peoples’ Bank Jalna, Priority Sector Reports
106
Table no. 4.8 also revealed that the total number of borrowing units
under the sub-sector housing loan by peoples’ bank has increased from 910
units in 1995-96 to 2584 units in 2004-05. The number of borrowing units
has declined from 1375 in 1995-96 to 159 in 2004-05. However, the number
of borrowing units under loans to retail traders during the year 1995-96 and
1996-97 was higher than the number of borrowing units under housing loan.
In 1995-96, the relative position of various sub-sectors of the priority
sector lending by peoples’ bank, Jalna in the context of borrowing units
were in the following order, namely, (i) retail traders, (ii) housing loan, (iii)
small business enterprises (iv) cottage and SSI, (v) educational loan, (vii)
agriculture, (vii) professionals and self-employed persons (viii)
consumption loan, (ix) road and water transport operators.
In 2004-05 the relative position of the number of borrowing units
under various sub-sector of the priority sector were in the following order,
namely, (i) housing loan, (ii) small business enterprises, (iii) professionals
and self-employed persons, (iv) agriculture, (v) retail traders, (vi) road and
water transport operators (vii) educational loan, (viii) cottage and small
scale industries, (ix) consumption loan.
The relative position of these sub-sectors have undergone a sea
change over the period of 10 years from 1995-96 to 2004-05.
It also reveled from the table no. 4.8 that the proportionate share of
borrowing units under housing loan, loans to retail traders and small
business enterprises in 1995-96 were 27.94%, 42.22%, and 18.70%
respectively. The share of remaining sub-sectors of the priority sectors was
only 11.14%.
107
In 2004-05 the proportionate share of borrowing units under the
housing loan, small business enterprises and professionals and self-
employed persons were 65.41%, 13.79% and 5.29% respectively. The share
of remaining sub-sectors of the priority sector lending was only 15.51%.
It is also evident from the table no. 4.8 that the relative importance of
the housing loan has been considerably increased over the period of 10 year
1995-96 to 2004-05. During the same period, the relative importance of
retail traders of and small business enterprises has declined.
Analysis of Limits Sanctioned Under Priority Sector Lending
After studying the number of borrowing units under various sub-
sectors of the priority sector lending by Deogiri Bank, Aurangabad and
Peoples’ bank, Jalna, it is imperative to study the salient features of limit
sanctioned by both the banks to various sub-sectors of the priority sector.
The table no. 4.9 reveals the salient features of limit sanctioned by
Deogiri Bank, Aurangabad to various sub-sectors of the priority sector
lending during the period from 1995-96 to 2004-05.
It is evident from the table no. 4.9 that the total amount of limits
sanctioned by Deogiri bank, Aurangabad under the priority sector lending
during the period of 10 years from 1995-96 to 2004-05 has shown the
increasing trend. The total amount of limits sanctioned under priority sector
lending by Deogiri Bank, Aurangabad in 1995-96 was Rs. 184842
thousands. It has reached to Rs. 1884039 thousands in 2004-05. It indicates
an increase of 10.19 times over a period 10 years from 1995-96 to 2004-05.
108
It is revealed from the table no. 4.9 that the limits sanctioned to
various sub-sectors of priority sector by Deogiri bank has under gone a sea
change over the period from 1995-96 to 2004-05. In 1995-96, the
proportionate share of limits sanctioned to cottage & SSI professional and
self-employed persons, road and water transport operators, housing loans,
retail traders was 37.62%, 17.86%, 17.11%, 14.56% and 10.75%
respectively. The proportionate share of remaining priority sectors was
2.05% of the total priority sector lending by Deogiri Bank.
In 2004-05, the proportionate share of the limits sanctioned to cottage
and SSI, housing loan, retail traders agriculture small business enterprises
was 35.50%, 24.87%, 13.51%, 10.96% 5.68% and the proportionate share
of remaining priority sectors was only 15.48% of the total priority sector
lending.
It means that the cottage and SSI sector remained at the top in the
amount of limits sanctioned by the Deogiri bank over a period of 10 years
from 1995-96 to 2004-05. However, during the same period the
proportionate share of limits sanctioned to professionals and road and water
transport operators have declined. The proportionate share of limits
sanctioned to agriculture, housing and retail traders have increased. The
relative increase in the limits sanctioned to agriculture was very impressive.
109

Table No: 4.9
Analysis of Limits Sanctioned Under Priority Sector Lending by
Deogiri Bank, Aurangabad.
(Rs. In thousands)
Sr.
NoYear
Limit
sanctioned
(Rs)
Agricul
-ture
(Rs)
Cottage
SSI
(Rs)
Road &
Water
Transpo
rt
Operat-
ors
Retail
Traders
(Rs)
Small
Busines
s
Enterpri
ses
(Rs)
Professio
n-als &
Self
Employe
d
Persons
(Rs)
Educati
o-nal
Loans
(Rs)
Housing
Loans
(Rs)
Consu
mptio
n
Loans
(Rs)
01 02 03 04 05 06 07 08 09 10 11 12
011995
- 96
184842
(100)
2455
(1.32)
69542
(37.62)
31643
(17.11)
19873
(10.75)
964
(0.52)
33028
(17.86)
406
(0.21)
26931
(14.56)Nil
021996
- 97
288724
(100)
1159
(0.40)
103734
(35.92)
43025
(14.90)
24772
(8.57)
6168
(2.13)
60646
(21.00)
848
(0.29)
48372
(16.75)Nil
031997
- 98
429587
(100)
4960
(1.15)
157020
(36.55)
75011
(17.46)
40958
(9.53)
19034
(4.43)
74919
(17.43)
918
(0.21)
54767
(13.21)Nil
041998
- 99
472667
(100)
6441
(1.36)
190318
(40.26)
53906
(11.40)
47810
(10.11)
11775
(2.49)
73073
(15.45)
764
(0.16)
88580
(18.74)Nil
05 1999
- 00 N. A. N. A. N. A. N. A. N. A. N. A. N. A. N. A. N. A. N.A.
062000
- 01
1127226
(100)
33203
(2.94)
441594
(39.17)
97130
(8.61)
114565
(10.16)
64603
(5.73)
130476
(11.57)
5680
(0.50)
239975
(21.28)Nil
072001
- 02
1419897
(100)
70380
(4.95)
436498
(30.74)
90774
(6.39)
173878
(12.24)
51930
(3.65)
310236
(21.84)
6760
(0.47)
279441
(19.68)Nil
082002
- 03
1430315
(100)
51294
(3.58)
656415
(45.89)
88764
(6.20)
156240
(10.92)
33182
(2.13)
117051
(8.18)
4165
(0.29)
323204
(22.59)Nil
092003
- 04
1664075
(100)
90899
(5.46)
733066
(44.05)
78204
(4.69)
188771
(11.34)
79230
(4.76)
110776
(6.65)
7625
(0.45)
375504
(22.56)Nil
102004
- 05
1884039
(100)
206637
(10.96)
668894
(35.50)
53155
(2.82)
254544
(13.51)
107052
(5.68)
93890
(4.98)
7383
(0.39)
468640
(24.87)
23844
(1.26)
Note: - Figures in bracket are the % for the relevant year.
N. A. – Not available
Source: - Deogiri Bank, Aurangabad, Priority Sector Reports
110

It is also revealed that the limits sanctioned to housing loans by the
Deogiri bank, Aurangabad during 1995-96 to 2004-05 has shown increasing
trend. The amount of limits sanctioned to housing loans in 1995-96 was Rs.
26931 thousands. In 2004-05, it has increased to Rs. 468640 thousands. It
indicates an increase of 17.40 times over the period of 10 years from 1995-
96 to 2004-05. It means that the housing loan is gaining popularity among
the customers of Deogiri bank. Similarly, it is revealed that the limits
sanctioned to cottage and small-scale industries by the Deogiri bank,
Aurangabad during 1995-96 to 2004-05 has shown increasing trend except
the year 2001-02 in which it was slightly lower than the year 2000-01. The
amount of limits sanctioned to cottage and small-scale industries in 1995-96
was Rs. 69542 thousands. In 2004-05, it has increased to Rs. 668894
thousands an increase of 9.61 times over the period of 10 years from 1995-
96 to 2004-05. Further it is revealed that the limits sanctioned to retail
traders by Deogiri bank, Aurangabad during 1995-96 to 2004-05 has shown
increasing trend except the year 2002-03, in which it was approximately 10
% lower than the year 2001-02. The amount of limits sanctioned to retail
traders in 1995-96 was Rs. 19873 thousands. In 2004-05 it was Rs. 254544
thousands. It has increased by 12.80 times over the period of 10 years from
1995-96 to 2004-05.
It is also seen that the Deogiri bank has sanctioned the loans for
consumption purpose only in 2004-05. There were no consumption loans
during 1995-96 to 2003-04. The amount of limits sanctioned for
consumption in 2004-05 was negligible. The amount of limits sanctioned for
educational loan was also negligible throughout the period from 1995-96 to
2004-05.
111
It is also revealed that the limits sanctioned to agriculture, road and
water transport operators, small business enterprises, professionals and self–
employed persons, educational loans by Deogiri bank, Aurangabad during
1995-96 to 2004-05 has shown fluctuating trend. However, it is also seen
that there was sharp increase in the amount of limits sanctioned to
agriculture in 2004-05.
The table no. 4.10 reveals the salient features of limit sanctioned by
Peoples’ Bank, Jalna to various sub-sectors of the priority sector lending
during the period from 1995-96 to 2004-05.
It is evident from the table no. 4.10 that the total amount of limits
sanctioned by Peoples’ Bank, Jalna under the priority sector lending during
1995-96 to 2004-05, showed the increasing trend till the year 2002-03, there
after it has declined during the year 2003-04 and 2004-05.
The total amount of limits sanctioned under priority sector lending by
Peoples’ Bank in 1995-96 was Rs. 119273 thousands. It has reached to Rs.
286114 thousands in 2004-05. It indicate an increase of 2.39 times over a
period of 10 years from 1995-96 to 2004-05.
It is reveled from the table no. 4.10 that the limits sanctioned to
various sub-sectors of priority sector has undergone a sea change over the
period of 10 years from 1995-96 to 2004-05. In 1995-96 the limits
sanctioned to cottage and small scale industries (61.96%), small business
enterprises (16.68%), retail traders (10.77%), housing (6.07%) and the share
of remaining priority sector was (4.52%) of the total priority sector lending
by peoples’ bank.
112
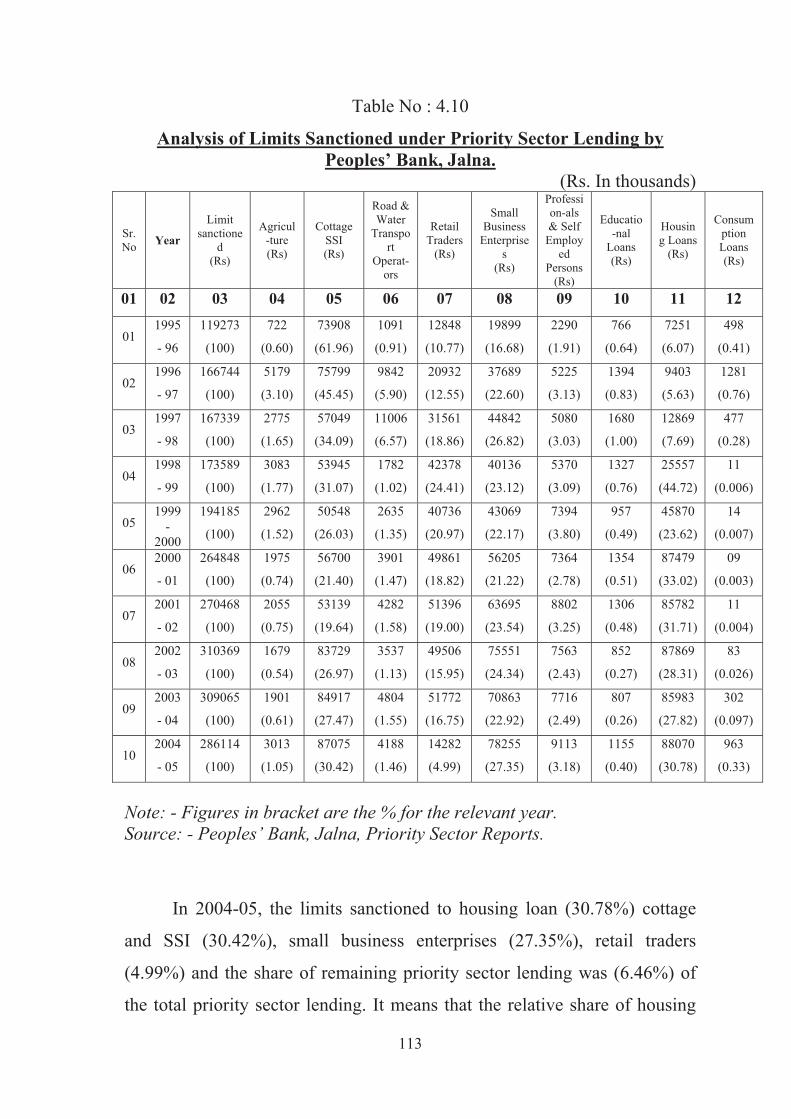
Table No : 4.10
Analysis of Limits Sanctioned under Priority Sector Lending by
Peoples’ Bank, Jalna.
(Rs. In thousands)
Sr.
NoYear
Limit
sanctione
d
(Rs)
Agricul
-ture
(Rs)
Cottage
SSI
(Rs)
Road &
Water
Transpo
rt
Operat-
ors
Retail
Traders
(Rs)
Small
Business
Enterprise
s
(Rs)
Professi
on-als
& Self
Employ
ed
Persons
(Rs)
Educatio
-nal
Loans
(Rs)
Housin
g Loans
(Rs)
Consum
ption
Loans
(Rs)
01 02 03 04 05 06 07 08 09 10 11 12
011995
- 96
119273
(100)
722
(0.60)
73908
(61.96)
1091
(0.91)
12848
(10.77)
19899
(16.68)
2290
(1.91)
766
(0.64)
7251
(6.07)
498
(0.41)
021996
- 97
166744
(100)
5179
(3.10)
75799
(45.45)
9842
(5.90)
20932
(12.55)
37689
(22.60)
5225
(3.13)
1394
(0.83)
9403
(5.63)
1281
(0.76)
031997
- 98
167339
(100)
2775
(1.65)
57049
(34.09)
11006
(6.57)
31561
(18.86)
44842
(26.82)
5080
(3.03)
1680
(1.00)
12869
(7.69)
477
(0.28)
041998
- 99
173589
(100)
3083
(1.77)
53945
(31.07)
1782
(1.02)
42378
(24.41)
40136
(23.12)
5370
(3.09)
1327
(0.76)
25557
(44.72)
11
(0.006)
051999
-
2000
194185
(100)
2962
(1.52)
50548
(26.03)
2635
(1.35)
40736
(20.97)
43069
(22.17)
7394
(3.80)
957
(0.49)
45870
(23.62)
14
(0.007)
062000
- 01
264848
(100)
1975
(0.74)
56700
(21.40)
3901
(1.47)
49861
(18.82)
56205
(21.22)
7364
(2.78)
1354
(0.51)
87479
(33.02)
09
(0.003)
072001
- 02
270468
(100)
2055
(0.75)
53139
(19.64)
4282
(1.58)
51396
(19.00)
63695
(23.54)
8802
(3.25)
1306
(0.48)
85782
(31.71)
11
(0.004)
082002
- 03
310369
(100)
1679
(0.54)
83729
(26.97)
3537
(1.13)
49506
(15.95)
75551
(24.34)
7563
(2.43)
852
(0.27)
87869
(28.31)
83
(0.026)
092003
- 04
309065
(100)
1901
(0.61)
84917
(27.47)
4804
(1.55)
51772
(16.75)
70863
(22.92)
7716
(2.49)
807
(0.26)
85983
(27.82)
302
(0.097)
102004
- 05
286114
(100)
3013
(1.05)
87075
(30.42)
4188
(1.46)
14282
(4.99)
78255
(27.35)
9113
(3.18)
1155
(0.40)
88070
(30.78)
963
(0.33)
Note: - Figures in bracket are the % for the relevant year.
Source: - Peoples’ Bank, Jalna, Priority Sector Reports.
In 2004-05, the limits sanctioned to housing loan (30.78%) cottage
and SSI (30.42%), small business enterprises (27.35%), retail traders
(4.99%) and the share of remaining priority sector lending was (6.46%) of
the total priority sector lending. It means that the relative share of housing
113

loan and small business enterprises have increased over the period of 10
years from 1995-96 to 2004-05. Over the same period the relative share of
cottage and SSI and retail traders have declined. The relative increase in the
limits sanctioned to the housing was impressive.
It is also revealed that the amount of limits sanctioned to all the sub-
sectors of priority sector lending by the Peoples bank, Jalna during 1995-96
to 2004-05 has show fluctuating trend.
It is also seen that the amounts of limits sanctioned for consumption
loans during 1995-96 to 1997-98 and 2002-03 to 2004-05 were relatively
higher than the limit sanctioned during the year 1998-99 to 2001-02. It was
almost negligible during 1998-99 to 2001-02.
The relative share of limits sanctioned to cottage and small sector
industries in total limits sanctioned by Peoples’ bank, Jalna in 1995-96 was
61.92%. There after it has successively declined and reached lowest level of
19.64% in 2001-02. However, it has started to increase from 2002-03 at
reached at 30.42% in 2004-05.
The relative share of limits sanctioned to housing loans in total limits
sanctioned under priority sector lending by Peoples’ bank, Jalna in 1995-96
was only 6.07 %. It has successively increased and reached the highest level
of 33.02% in 2000-01. It was 30.78% in 2004-05. The relative share of
limits sanctioned by Peoples’ bank, Jalna to retail traders in 1995-96 was
10.77%. It reached the highest level of 24.41% in 1998-99. It was at its
lowest level of 4.99% in 2004-05.
114
The relative share of limits sanctioned by Peoples’ bank, Jalna to
small business enterprises in 1995-96 was at 16.68 %. In 2004-05, it was at
its highest level of 27.35%.
The table no. 4.10 Revealed that the relative importance of housing
loans and loans to small business enterprises have increased on the other
hand, the relative importance of cottage and small scale industries and retail
traders have declined.
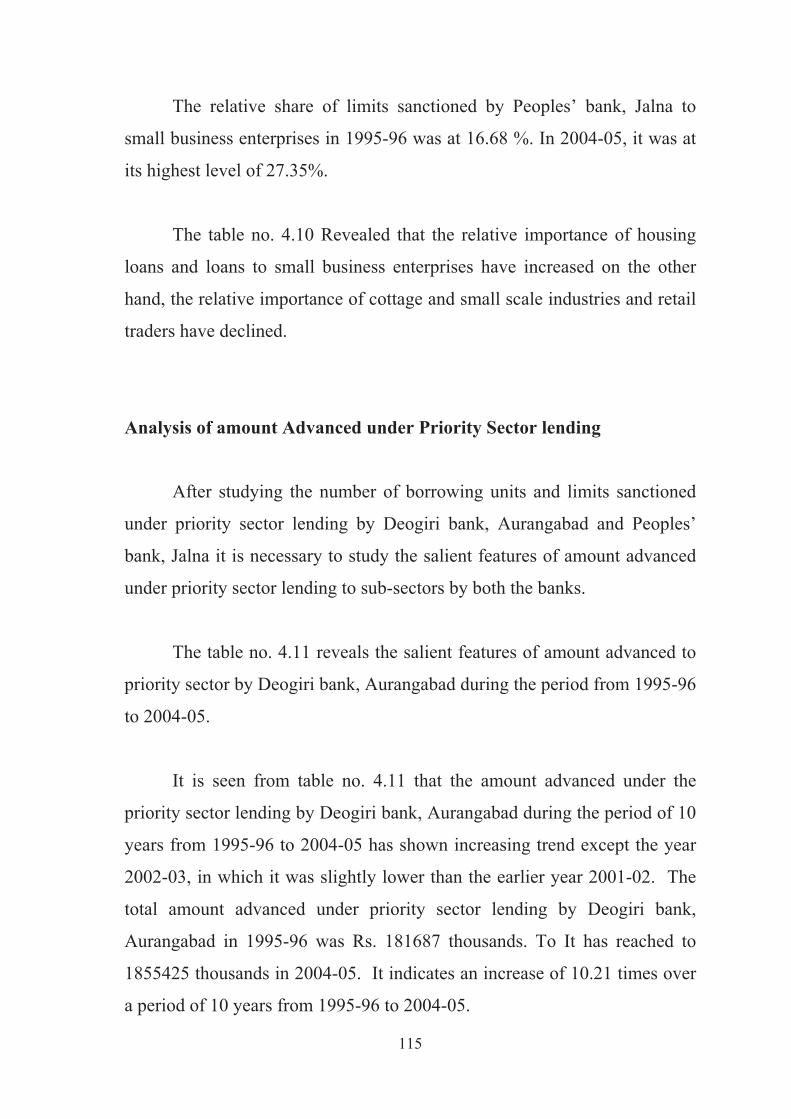
Analysis of amount Advanced under Priority Sector lending
After studying the number of borrowing units and limits sanctioned
under priority sector lending by Deogiri bank, Aurangabad and Peoples’
bank, Jalna it is necessary to study the salient features of amount advanced
under priority sector lending to sub-sectors by both the banks.
The table no. 4.11 reveals the salient features of amount advanced to
priority sector by Deogiri bank, Aurangabad during the period from 1995-96
to 2004-05.
It is seen from table no. 4.11 that the amount advanced under the
priority sector lending by Deogiri bank, Aurangabad during the period of 10
years from 1995-96 to 2004-05 has shown increasing trend except the year
2002-03, in which it was slightly lower than the earlier year 2001-02. The
total amount advanced under priority sector lending by Deogiri bank,
Aurangabad in 1995-96 was Rs. 181687 thousands. To It has reached to
1855425 thousands in 2004-05. It indicates an increase of 10.21 times over
a period of 10 years from 1995-96 to 2004-05.
115
It is reveled from the table no.4.11that the amount advanced to
various sub-sectors of priority sector by Deogiri bank over a period of 10
years from 1995-96 to 2004-05 has shown almost similar trend as shown by
the limit sanctioned by the Deogiri bank for the same period.
Table No : 4.11
Analysis of amount Advanced under Priority Sector lending by Deogiri
bank, Aurangabad.
(Rs. In thousands)
Sr.
NoYear
Amount
Advanced
(Rs)
Agricul-
ture
(Rs)
Cottage
SSI
(Rs)
Road &
Water
Transpo
rt
Operat-
ors
Retail
Traders
(Rs)
Small
Business
Enterprise
s
(Rs)
Professi
on-als &
Self
Employe
d
Persons
(Rs)
Educati
o-nal
Loans
(Rs)
Housing
Loans
(Rs)
Consu
mption
Loans
(Rs)
01 02 03 04 05 06 07 08 09 10 11 12
011995
- 96
181687
(100)
2452
(1.34)
67287
(37.03)
31269
(17.21)
19838
(10.91)
937
(0.51)
32752
(18.02)
406
(0.22)
26746
(14.72)Nil
021996
- 97
273817
(100)
1159
(0.42)
102742
(37.52)
42744
(15.61)
24772
(9.04)
6068
(2.21)
57360
(20.94)
848
(0.30)
38124
(13.92)Nil
031997
- 98
431303
(100)
4895
(1.13)
158015
(36.63)
75967
(17.61)
40986
(9.50)
19697
(4.56)
73469
(17.03)
933
(0.216)
57341
(13.29)Nil
041998
- 99
450255
(100)
6047
(1.34)
172779
(38.37)
53889
(11.96)
47705
(10.59)
11543
(2.56)
70675
(15.69)
764
(0.16)
86853
(19.28)Nil
05 1999
-00N. A. N. A. N. A. N. A. N. A. N. A. N. A. N. A. N. A. N. A.
062000
- 01
1113854
(100)
32521
(2.91)
434483
(39.00)
97177
(8.72)
113837
(10.22)
64441
(5.78)
128043
(11.49)
5680
(0.50)
237672
(21.33)Nil
072001
- 02
1419897
(100)
70380
(4.95)
436498
(30.74)
90774
(6.39)
173878
(12.24)
51930
(3.65)
310236
(21.84)
6760
(0.47)
279441
(19.68)Nil
082002
- 03
1403294
(100)
48622
(3.46)
643058
(45.82)
88472
(6.30)
155728
(11.09)
32556
(2.31)
112776
(8.03)
4135
(0.29)
317947
(22.65)Nil
092003
- 04
1664076
(100)
90899
(5.46)
733066
(44.05)
78204
(4.69)
188771
(11.34)
79230
(4.76)
110776
(6.65)
7625
(0.45)
375505
(22.56)Nil
102004
- 05
1855425
(100)
204997
(11.04)
660337
(35.58)
53019
(2.85)
252208
(13.59)
106282
(5.72)
92652
(4.99)
7183
(0.38)
455493
(24.54)
23254
(1.25)
Note: - Figures in bracket are the % for the relevant year.
N. A. – Not available
Source: - Deogiri Bank, Aurangabad, Priority Sector Reports
116
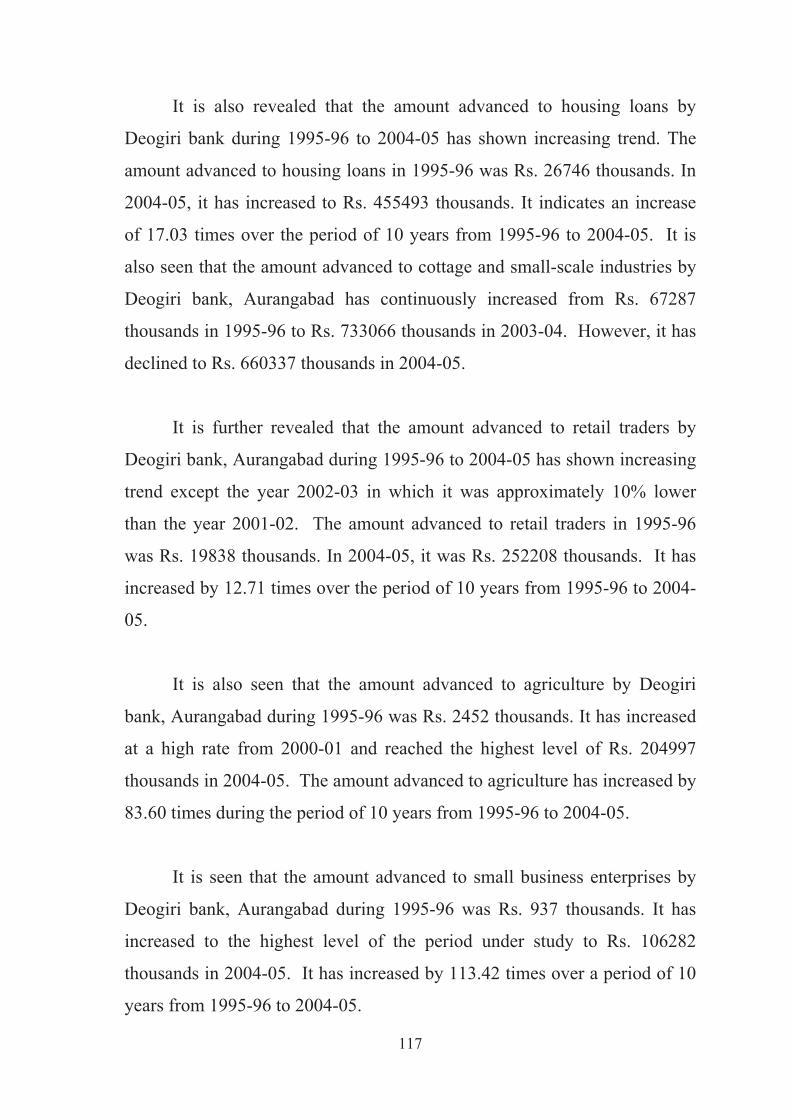
It is also revealed that the amount advanced to housing loans by
Deogiri bank during 1995-96 to 2004-05 has shown increasing trend. The
amount advanced to housing loans in 1995-96 was Rs. 26746 thousands. In
2004-05, it has increased to Rs. 455493 thousands. It indicates an increase
of 17.03 times over the period of 10 years from 1995-96 to 2004-05. It is
also seen that the amount advanced to cottage and small-scale industries by
Deogiri bank, Aurangabad has continuously increased from Rs. 67287
thousands in 1995-96 to Rs. 733066 thousands in 2003-04. However, it has
declined to Rs. 660337 thousands in 2004-05.
It is further revealed that the amount advanced to retail traders by
Deogiri bank, Aurangabad during 1995-96 to 2004-05 has shown increasing
trend except the year 2002-03 in which it was approximately 10% lower
than the year 2001-02. The amount advanced to retail traders in 1995-96
was Rs. 19838 thousands. In 2004-05, it was Rs. 252208 thousands. It has
increased by 12.71 times over the period of 10 years from 1995-96 to 2004-
05.
It is also seen that the amount advanced to agriculture by Deogiri
bank, Aurangabad during 1995-96 was Rs. 2452 thousands. It has increased
at a high rate from 2000-01 and reached the highest level of Rs. 204997
thousands in 2004-05. The amount advanced to agriculture has increased by
83.60 times during the period of 10 years from 1995-96 to 2004-05.
It is seen that the amount advanced to small business enterprises by
Deogiri bank, Aurangabad during 1995-96 was Rs. 937 thousands. It has
increased to the highest level of the period under study to Rs. 106282
thousands in 2004-05. It has increased by 113.42 times over a period of 10
years from 1995-96 to 2004-05.
117

This study revealed that the relative importance of agriculture, retail
traders, small business enterprises, and housing loan has increased over the
period of time.
It is also seen that during the period from 1995-96 to 2003-04 there
were no consumption loan granted by Deogiri bank. It has granted
consumption loans only during the terminal year of this study. Amount
advanced under this sub-sector was negligible.
The table no. 4.12 reveals the salient features of amount advanced to
priority sector by Peoples’ bank, Jalna during the period from 1995-96 to
2004-05.
It is revealed from the table no. 4.12 that the amount of advanced
under priority sector lending by Peoples’ bank, Jalna during the period of 10
years from 1995-96 to 2004-05 has shown the increasing trend from 1995-
96 to 2002-03. There after it has declined in 2003-04 and 2004-05. The
total amount of advanced under priority sector lending by Peoples’ bank,
Jalna in 1995-96 was Rs. 99206 thousands. It reached the highest level of
Rs. 301577 thousands in 2002-03 then reduced to Rs. 278220 thousands in
2004-05. It indicates an increase of 2.80 times over a period of 10 years
from 1995-96 to 2004-05.
It is revealed from the table no. 4.12 that the amount of advanced to
various sub-sectors of priority sector by Peoples’ bank over a period of 10
years from 1995-96 to 2004-05 has also shown similar trend as shown by
the limits sanctioned by the Peoples’ bank for the same period.
118
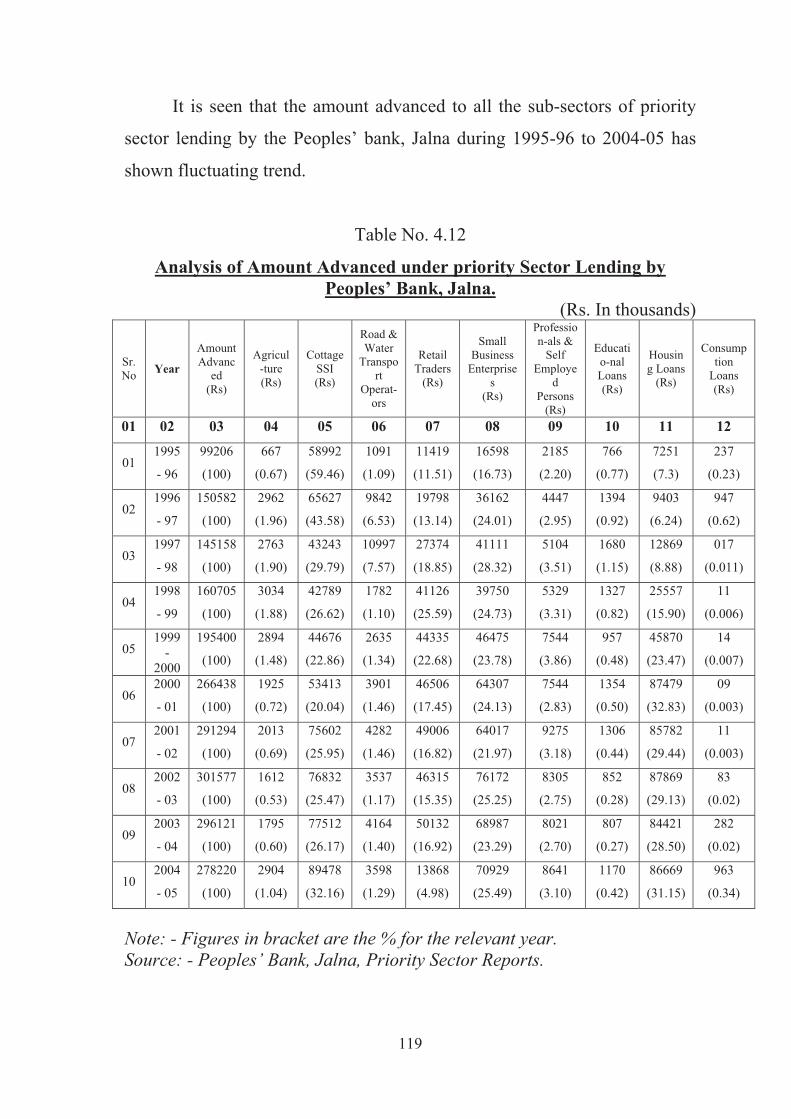
It is seen that the amount advanced to all the sub-sectors of priority
sector lending by the Peoples’ bank, Jalna during 1995-96 to 2004-05 has
shown fluctuating trend.
Table No. 4.12
Analysis of Amount Advanced under priority Sector Lending by
Peoples’ Bank, Jalna.
(Rs. In thousands)
Sr.
NoYear
Amount
Advanc
ed
(Rs)
Agricul
-ture
(Rs)
Cottage
SSI
(Rs)
Road &
Water
Transpo
rt
Operat-
ors
Retail
Traders
(Rs)
Small
Business
Enterprise
s
(Rs)
Professio
n-als &
Self
Employe
d
Persons
(Rs)
Educati
o-nal
Loans
(Rs)
Housin
g Loans
(Rs)
Consump
tion
Loans
(Rs)
01 02 03 04 05 06 07 08 09 10 11 12
011995
- 96
99206
(100)
667
(0.67)
58992
(59.46)
1091
(1.09)
11419
(11.51)
16598
(16.73)
2185
(2.20)
766
(0.77)
7251
(7.3)
237
(0.23)
021996
- 97
150582
(100)
2962
(1.96)
65627
(43.58)
9842
(6.53)
19798
(13.14)
36162
(24.01)
4447
(2.95)
1394
(0.92)
9403
(6.24)
947
(0.62)
031997
- 98
145158
(100)
2763
(1.90)
43243
(29.79)
10997
(7.57)
27374
(18.85)
41111
(28.32)
5104
(3.51)
1680
(1.15)
12869
(8.88)
017
(0.011)
041998
- 99
160705
(100)
3034
(1.88)
42789
(26.62)
1782
(1.10)
41126
(25.59)
39750
(24.73)
5329
(3.31)
1327
(0.82)
25557
(15.90)
11
(0.006)
051999
-
2000
195400
(100)
2894
(1.48)
44676
(22.86)
2635
(1.34)
44335
(22.68)
46475
(23.78)
7544
(3.86)
957
(0.48)
45870
(23.47)
14
(0.007)
062000
- 01
266438
(100)
1925
(0.72)
53413
(20.04)
3901
(1.46)
46506
(17.45)
64307
(24.13)
7544
(2.83)
1354
(0.50)
87479
(32.83)
09
(0.003)
072001
- 02
291294
(100)
2013
(0.69)
75602
(25.95)
4282
(1.46)
49006
(16.82)
64017
(21.97)
9275
(3.18)
1306
(0.44)
85782
(29.44)
11
(0.003)
082002
- 03
301577
(100)
1612
(0.53)
76832
(25.47)
3537
(1.17)
46315
(15.35)
76172
(25.25)
8305
(2.75)
852
(0.28)
87869
(29.13)
83
(0.02)
092003
- 04
296121
(100)
1795
(0.60)
77512
(26.17)
4164
(1.40)
50132
(16.92)
68987
(23.29)
8021
(2.70)
807
(0.27)
84421
(28.50)
282
(0.02)
102004
- 05
278220
(100)
2904
(1.04)
89478
(32.16)
3598
(1.29)
13868
(4.98)
70929
(25.49)
8641
(3.10)
1170
(0.42)
86669
(31.15)
963
(0.34)
Note: - Figures in bracket are the % for the relevant year.
Source: - Peoples’ Bank, Jalna, Priority Sector Reports.
119

It is also seen that the amount advanced to consumption loans during
1995-96, 1996-97 and 2002-03 to 2004-05 were relatively higher than the
amount advanced during 1997-98 to 2001-02. It was almost negligible
during 1997-98 to 2001-02.
The relative share of amount advanced to cottage and small scale
industries in total amount advanced by Peoples’ bank, Jalna in 1995-96
were 59.46%. There after its share in amount advanced to priority sector
has continuously declined till 2000-01 and reached to the lowest level of
20.04%. In 2004-05, it reached at 32.16%. It means that the relative
importance of cottage and small-scale industries has declined during the
period 1995-96 to 2004-05. It is seen that the share of cottage and small-
scale industries during 1999-2000 to 2003-04 was lower than the share of
housing loans.
The relative share of amount advanced to housing loans in total
amount advanced under priority sector lending by Peoples’ bank, Jalna was
7.3% in 1995-96. It has successively increased and reached the highest
level of 32.83% in 2000-01. It was 31.15% in 2004-05.
The relative share of amount advanced to retail traders in total amount
advanced under priority sector lending in 1995-96 was 11.51%. It has
continuously increased and reached its highest level of 25.59% in 1998-99.
There after from 1999-00 to 2004-05 it has shown continuously declining
trend and reached its lowest level of 4.98% in 2004-05.
The relative share of amount advanced to small business enterprises
in total amount advanced under priority sector in 1995-96 was 16.73%. It
was at its highest level of 28.32% in 1997-98. In 2004-05, it was at 25.49%.
120
The table no. 4.12 revealed that the relative importance of housing
loans and small business enterprises have increased during the priority
under study. On the other hand, the relative importances of cottage and
small scale industries and retail traders have declined during the same
period.
Analysis of Balance Outstanding under Priority Sector Lending
The study of balance outstanding under priority sector lending by
urban banks is essential to reveal the effectiveness or otherwise of the
lending policy and the collection policy of the urban banks.
The table no. 4.13 reveals the salient features of balance outstanding
under priority sector lending by Deogiri bank, Aurangabad during the period
from 1995-96 to 2004-05.
It is revealed from table no. 4.13 that the amount of balance
outstanding under priority sector lending by Deogiri bank has shown
increasing trend during the period from 1995-96 to 2004-05 except the year
1998-99 in which it has declined marginally from the amount of balance
outstanding for the year 1997-98. The amount of total balance outstanding
under priority sector lending by Deogiri bank for the year 1995-96 was Rs.
145377 thousands. In 2004-05, it was Rs. 1576484 thousands. It indicates an
increase of 10.84 times over a period of 10 years from 1995-96 to 2004-05.
121

Table No: 4.13
Analysis of Balance Outstanding under Priority Sector Lending by
Deogiri Bank
(Rs. In thousands)
Sr.
N
oYear
Total
Balance
outstand-
ing
(Rs)
Agricul
-ture
(Rs)
Cottage
SSI
(Rs)
Road &
Water
Transpo
rt
Operat-
ors
Retail
Traders
(Rs)
Small
Business
Enterprise
s
(Rs)
Professi
on-als &
Self
Employe
d
Persons
(Rs)
Educati
o-nal
Loans
(Rs)
Housing
Loans
(Rs)
Consu
mption
Loans
(Rs)
01 02 03 04 05 06 07 08 09 10 11 12
011995
- 96
145377
(100)
2689
(1.84)
59156
(40.69)
20066
(13.08)
16179
(11.12)
708
(0.48)
24687
(16.98)
365
(0.25)
21527
(14.80)Nil
021996
- 97
217375
(100)
986
(0.45)
85370
(39.27)
31328
(14.41)
20368
(9.37)
5310
(2.44)
37904
(17.43)
733
(0.33)
35376
(16.27)Nil
031997
- 98
364936
(100)
4037
(1.10)
145983
(40.00)
59389
(16.27)
35724
(9.78)
18951
(5.18)
57032
(15.63)
717
(0.19)
43103
(11.80)Nil
041998
- 99
357628
(100)
5005
(1.39)
141897
(39.67)
36321
(10.15)
42273
(11.82)
10265
(2.87)
53301
(14.90)
734
(0.20)
67832
(18.96)Nil
05 1999
-00N. A. N. A. N. A. N. A. N. A. N. A. N. A. N. A. N. A. N. A.
062000
- 01
957968
(100)
24004
(2.50)
410100
(42.80)
71308
(7.44)
98636
(10.29)
52344
(5.46)
102163
(10.66)
4829
(0.50)
194584
(20.31)Nil
072001
- 02
1125196
(100)
50249
(4.46)
349341
(31.04)
60054
(5.33)
128825
(11.44)
33345
(2.96)
273909
(24.34)
4674
(0.41)
224799
(19.97)Nil
082002
- 03
1182491
(100)
39497
(3.34)
559134
(47.28)
66302
(5.60)
146158
(12.36)
25869
(2.18)
86575
(7.32)
3609
(0.30)
255347
(21.59)Nil
092003
- 04
1351557
(100)
76838
(5.68)
625037
(46.24)
48445
(3.58)
153486
(11.35)
64767
(4.79)
80907
(5.98)
6496
(0.48)
295581
(21.86)Nil
102004
– 05
1576484
(100)
174625
(11.07)
539732
(34.23)
31560
(2.00)
237782
(15.08)
90507
(5.74)
69883
(4.43)
6643
(0.42)
406590
(25.79)
19162
(1.21)
Note: - Figures in bracket are the % for the relevant year.
N. A. – Not available
Source: - Deogiri Bank, Aurangabad, Priority Sector Reports
The proportionate share of balance outstanding of Deogiri bank
against the loans granted to cottage and small-scale industries, housing
loans, retail traders and professionals and self-employed persons for the
122
period under consideration found to be much higher than the other segments
of priority sector.
The sub-sectors wise trend of the amount of balance outstanding
against the priority sector lending seems to be similar as seen in case of
limits sanctioned and amount advanced. It is seen that the amount of balance
outstanding is positively co-related with the limits sanctioned and amount of
advanced granted to various sub-sectors of priority sector lending by
Deogiri bank.
The table no. 4.14 reveals the salient features of balance outstanding
under priority sector lending by Peoples’ bank, Jalna during the period from
1995-96 to 2004-05.
123

Table No : 4.14
Analysis of Balance outstanding under priority Sector Lending by
Peoples Bank, Jalna.
(Rs. In thousands)
Sr.
NoYear
Total
Balance
outstan
d
(Rs)
Agricul
-ture
(Rs)
Cottage
SSI
(Rs)
Road &
Water
Transpo
rt
Operat-
ors
Retail
Traders
(Rs)
Small
Business
Enterpris
es
(Rs)
Professio
n-als &
Self
Employe
d
Persons
(Rs)
Educatio
-nal
Loans
(Rs)
Housin
g Loans
(Rs)
Consumpt
ion Loans
(Rs)
01 02 03 04 05 06 07 08 09 10 11 12
011995
- 96
91265
(100)
595
(0.65)
55407
(60.71)
670
(0.73)
10969
(12.01)
15533
(17.01)
1856
(2.03)
406
(0.44)
5596
(6.13)
233
(0.25)
021996
- 97
138705
(100)
2961
(2.13)
61363
(44.23)
8537
(6.15)
18584
(13.39)
34353
(24.76)
3947
(2.84)
1365
(0.98)
7567
(5.45)
28
(0.020)
031997
- 98
122364
(100)
2752
(2.24)
44446
(36.32)
8826
(7.27)
9743
(7.96)
39471
(32.25)
4896
(4.00)
1472
(1.20)
10758
(8.79)Nil
041998
- 99
154229
(100)
3059
(1.98)
42363
(27.46)
1420
(0.92)
39616
(25.68)
37196
(24.11)
4630
(3.00)
1324
(0.85)
24608
(15.95)
13
(0.008)
051999
-
2000
191160
(100)
3124
(1.63)
43963
(22.99)
1817
(0.95)
48336
(25.28)
41108
(21.50)
6551
(3.42)
806
(0.42)
45444
(23.77)
11
(0.005)
062000
- 01
252433
(100)
2279
(0.90)
54404
(21.55)
3123
(1.23)
46089
(18.25)
65068
(25.77)
6852
(2.71)
1241
(0.49)
73368
(29.06)
09
(0.003)
072001
- 02
278737
(100)
2689
(0.96)
78934
(28.31)
3014
(1.08)
47951
(17.20)
59723
(21.42)
7893
(2.83)
1566
(0.56)
76955
(27.60)
12
(0.004)
082002
- 03
275292
(100)
2202
(0.79)
75681
(27.49)
2346
(0.85)
45646
(16.58)
72919
(26.48)
7214
(2.62)
939
(0.34)
68261
(24.79)
84
(0.030)
092003
- 04
270626
(100)
1758
(0.64)
78187
(28.89)
3189
(1.17)
47027
(17.38)
66186
(24.45)
7211
(2.67)
826
(0.30)
65960
(24.37)
282
(0.10)
102004
- 05
249052
(100)
2957
(1.18)
88430
(35.50)
2670
(1.07)
13679
(5.49)
65598
(26.33)
7507
(3.01)
1167
(0.46)
66135
(26.52)
909
(0.36)
Note: - Figures in bracket are the % for the relevant year.
Source: - Peoples’ Bank, Jalna, Priority Sector Reports.
124
It is revealed from table no. 4.14 that the amount of balance
outstanding under priority sector lending by Peoples’ bank, Jalna during the
period of 10 years from 1995-96 to 2004-05 has successively increased from
Rs. 91265 thousands in 1995-96 to Rs. 278737 thousands in 2001-02. There
after it has continuously declined and reached to Rs. 249052 thousands in
2004-05. It is seen that it has increased by 2.72 times over the period of 10
years from 1995-96 to 2004-05. The reduction in the amount of balance
outstanding during last three years of this study indicates that better lending
policy/recovery was being adopted during later years of this study.
The amount of balance outstanding against the loans granted to
cottage and small-scale industries, small business enterprises, housing loans
and retail traders found to be much higher as compared to other segments of
the priority sector lending.
The proportion of balance outstanding against the loans granted to
cottage and small-scale industries was 60.71% of the total balance
outstanding in 1995-96. It was reduced to the lowest level of 21.55% in
2000-01. In 2004-05, it has reached to 35.50%.
The proportion of balance outstanding against the loans granted to
small business enterprises was 17.01% of the total balance outstanding for
the year 1995-96. It has increased to 32.25% in 1997-98. In 2004-05, it was
at 26.33%.
The proportion of balance outstanding against the housing loans was
6.13% of the total balance outstanding for the year 1995-96. It was highest
at 29.06% in 2000-01. In 2004-05, it was at 26.52%.
125
The proportion of balance outstanding against the loans to retail
traders was 12.01% of the total balance outstanding for the year 1995-96. It
was highest at 25.68% in 1998-99. In 2004-05, it was at 5.49%.
The proportionate share of cottage and small-scale industries, small
business enterprises, housing loans and retail traders in the amount of
balance outstanding in higher mainly due to higher amount of loans granted
to these sectors by the Peoples’ bank, Jalna.
Analysis of Amount of Overdue under Priority Sector Lending
The study of amount of overdue under priority sector lending is
important from the point of view of effectiveness of lending policy and
recovery policy, effectiveness of management decisions and the efficiency
of the staff members of the lending bank.
The table no. 4.15 reveals the salient features of the amount of
overdue under priority sector lending by Deogiri bank, Aurangabad during
the period from 1995-96 to 2004-05.
126

Table No: 4.15
Analysis of Amount of Overdue under Priority Sector Lending by
Deogiri Bank.
(Rs. In thousands)
Sr.
NoYear
Total
Amount
of
overdues
(Rs)
Agricul
-ture
(Rs)
Cottage
SSI
(Rs)
Road &
Water
Transpo
rt
Operat-
ors
Retail
Traders
(Rs)
Small
Business
Enterprise
s
(Rs)
Professi
on-als &
Self
Employe
d
Persons
(Rs)
Educati
o-nal
Loans
(Rs)
Housing
Loans
(Rs)
Consu
mption
Loans
(Rs)
01 02 03 04 05 06 07 08 09 10 11 12
011995
- 96
19552
(100)
1979
(10.12)
5293
(27.07)
3526
(18.03)
4230
(21.63)
461
(2.35)
3648
(18.65)
023
(0.11)
392
(2.00)Nil
021996
- 97
21467
(100)
533
(2.48)
6503
(30.29)
2884
(13.43)
3134
(14.59)
416
(1.93)
6427
(29.93)
016
(0.07)
1554
(7.23)Nil
031997
- 98
28407
(100)
710
(2.50)
12204
(42.97)
3446
(12.13)
3996
(14.07)
1118
(3.93)
4795
(16.88)
041
(0.14)
2097
(7.38)Nil
041998
- 99
23044
(100)
269
(1.16)
11190
(48.55)
2016
(8.74)
2475
(10.74)
430
(1.86)
3998
(17.34)Nil
2666
(11.56)Nil
05 1999
-00N. A. N. A. N. A. N. A. N. A. N. A. N. A. N. A. N. A. Nil
062000
- 01
75894
(100)
4606
(6.06)
23946
(31.55)
7853
(10.34)
10201
(13.44)
2502
(3.29)
11565
(15.23)
1005
(1.32)
14216
(18.73)Nil
072001
- 02
88167
(100)
3266
(3.70)
35583
(40.35)
4789
(5.43)
10185
(11.55)
3717
(4.21)
12101
(13.72)
1787
(2.02)
16739
(18.98)Nil
082002
- 03
109660
(100)
6483
(5.91)
49785
(45.39)
5320
(4.85)
9811
(8.94)
3440
(3.13)
21427
(19.53)
1131
(1.03)
12263
(11.18)Nil
092003
- 04
178818
(100)
9584
(5.35)
86369
(48.29)
6548
(3.66)
27702
(15.49)
4727
(2.64)
21467
(12.00)
960
(0.53)
21461
(12.00)Nil
102004
– 05
190817
(100)
12035
(6.31)
98155
(51.43)
7066
(3.70)
29502
(15.46)
5360
(2.81)
13864
(7.27)
1024
(0.53)
17086
(8.96)
6725
(3.52)
Total735826
(100)
39465
(5.36)
329028
(44.71)
43448
(5.90)
101236
(13.75)
22171
(3.01)
99292
(13.49)
5987
(0.81)
88474
(12.02)
6725
(0.91)
Note: - Figures in bracket are the % for the relevant year.
N. A. – Not available
Source: - Deogiri Bank, Aurangabad, Priority Sector Reports
127
It is revealed from the table no. 4.15 that the amount of overdue under
priority sector lending by Deogiri bank, Aurangabad for the period of 10
years from 1995-96 to 2004-05 has increased from Rs. 19552 thousands in
1995-96 to Rs. 190817 thousands in 2004-05. it is seen that the amount of
overdue under priority sector lending during the period of this study has
continuously increased expect the year 1998-99 in which it has declined to
Rs. 23044 thousands as compared to Rs. 28407 in 1997-98. It is also
revealed that the amount of overdue under the priority sector lending by
Deogiri bank, Aurangabad has increased by 9.75 times during the period of
10 years from 1995-96 to 2004-05.
It is also revealed that the proportionate share of amount of overdue
under loans to cottage and small-scale industries was much higher than the
amount of overdue of other sub-sectors of priority sector. This phenomenon
has been observed throughout the period under consideration for this study.
After cottage and small-scale industries, the amount of overdue under loans
to retail traders, professional and self-employed persons and housing loans
were relatively higher than the remaining sub-sectors of the priority sector.
The amount of overdue under cottage and small-scale industries was
Rs. 5293 thousands in 1995-96. In 2004-05, it was Rs. 98155 thousands. It
indicates that this has increased by 18.54 times over the period of 10 years
from 1995-96 to 2004-05.
The amount of overdue against the loans to retail traders has sharply
increased during 2003-04. It was Rs. 4230 thousands in 1995-96. In 2004-
05, it was Rs. 29502 thousands.
128
The amount of overdue under housing loans was Rs. 392 thousands in
1995-96. It was at its highest level of Rs. 21461 thousands in 2003-04. In
2004-05, it was at Rs. 17086 thousands. It indicates that, it has increased by
43.58 times during the period of 10 years from 1995-96 to 2004-05.
The proportionate share of amount of overdue against the loans to
cottage and small industries was at 27.07 % in 1995-96. It was at 51.43% in
2004-05. This is the cause of concern for the management of Deogiri bank.
The table no. 4.16 reveals the salient features of the amount of
overdue under priority sector lending by Peoples’ bank, Jalna during the
period from 1995-96 to 2004-05.
It is revealed from the table no. 4.16 that the amount of overdue under
priority sector lending by Peoples’ bank, Jalna for the period of 10 years
from 1995-96 to 2004-05 has increased from Rs. 29115 thousands in 1995-
96 to Rs. 48681 thousands in 2004-05. However, it is also seen that the
amount of overdue during 1998-99 was at its lowest level of Rs. 20561
thousands. It was at its highest level of Rs. 53992 thousands in 2003-04. It
is also revealed that the amount of overdue under the priority sector lending
by Peoples’ bank, Jalna has increased by 1.67 times during the period of 10
years from 1995-96 to 2004-05.
It is also revealed that the proportionate share of amount overdue
under loans to cottage and small scale industries, small business enterprises,
retail traders and housing loans found to be much higher than the other
segments of priority sector lending by Peoples’ bank, Jalna for the period of
10 years from 1995-96 to 2004-05.
129

Table No: 4.16
Analysis of Amount of Overdue under Priority Sector Lending by
Peoples’ Bank, Jalna.
(Rs. In thousands)
Sr.
NoYear
Total
Amount
Advance
Agricul
-ture
(Rs)
Cottage
SSI
(Rs)
Road &
Water
Transpo
rt
Operat-
ors
Retail
Traders
(Rs)
Small
Business
Enterprise
s
(Rs)
Professi
on-als &
Self
Employe
d
Persons
(Rs)
Educati
o-nal
Loans
(Rs)
Housing
Loans
(Rs)
Consu
mption
Loans
(Rs)
01 02 03 04 05 06 07 08 09 10 11 12
011995
- 96
29115
(100)
24
(0.08)
20275
(69.63)
391
(1.34)
2928
(10.05)
2093
(7.18)
525
(1.80)
28
(0.096)
2851
(9.79)Nil
021996
- 97
27528
(100)
894
(3.24)
18540
(67.34)
147
(0.53)
2640
(9.59)
2032
(7.38)
453
(1.84)
37
(0.130)
2785
(10.11)Nil
031997
- 98
23234
(100)
251
(1.08)
16355
(70.39)
458
(1.97)
458
(1.97)
2942
(12.66)
370
(1.59)
17
(0.07)
2383
(10.25)Nil
041998
- 99
20561
(100)
305
(1.48)
12058
(58.64)
10
(0.048)
2243
(10.90)
3674
(17.86)
470
(2.28)
05
(0.02)
1796
(8.73)Nil
051999
-
2000
20875
(100)
286
(1.37)
10401
(49.82)
1387
(6.64)
3068
(14.69)
4087
(19.57)
228
(1.09)
05
(0.02)
1413
(6.76)Nil
062000
- 01
23967
(100)
217
(0.90)
11070
(46.18)
1251
(5.21)
3674
(15.32)
5670
(23.65)
478
(1.99)
05
(0.02)
1602
(6.68)Nil
072001
- 02
37007
(100)
107
(0.289)
11932
(32.24)
628
(1.69)
6463
(17.46)
13487
(36.44)
1416
(3.82)
04
(0.01)
2970
(8.02)Nil
082002
- 03
45912
(100)
167
(0.36)
9994
(21.76)
696
(1.51)
7336
(15.97)
20898
(45.51)
1331
(2.89)
04
(0.01)
5486
(11.94)Nil
092003
- 04
53992
(100)
197
(0.36)
13088
(24.24)
315
(0.58)
12135
(22.47)
19783
(36.64)
1651
(3.05)
22
(0.04)
6801
(12.59)Nil
102004
– 05
48681
(100)
156
(0.32)
17657
(36.29)
504
(1.03)
1899
(3.90)
19451
(39.95)
2089
(4.29)
23
(0.047)
6902
(14.17)Nil
Note: - Figures in bracket are the % for the relevant year.
Source: - Peoples’ Bank, Jalna, Priority Sector Reports.
130
It is seen that the amount of overdues under priority sector lending to
cottage and small-scale industries were much higher than the other priority
sectors during the 1995-96 to 2000-01. However, since 2001-02 to 2004-05
the amount of overdues under priority sector lending to small business
enterprises was much higher than amount of overdues relating to other
sectors of priority sector lending. It means that the position of cottage and
small-scale industries as regards to amount of overdues has considerably
improved over the period of time under consideration. At the same time, the
position of small business enterprises has considerably deteriorated over the
period of time under consideration for this study. The position of loans to
retail traders as regards the amount of overdues has deteriorated to some
extent over the period of time. It means that the lending policy was faulty as
regards to loans granted to small business enterprises and to some extent
loan granted to retail traders by the Peoples’ bank, Jalna or there might be
willful default on the part of borrowers under priority sector lending to
small business enterprises and retail traders.
Sub-sector wise average amount of advances per borrowing unit under
priority sector lending.
The relative importance of the sub-sector of priority sector can be
revealed through proper analysis of the average amount of advances per
borrowing units of these sub-sectors. This analysis will help in devising a
proper policy approach towards the priority sector lending.
The table no. 4.17 and table no. 4.18 gives an insight into the average
amount advances to different sub-sectors under the priority sector lending
by Deogiri bank, Aurangabad and Peoples’ Bank, Jalna.
131
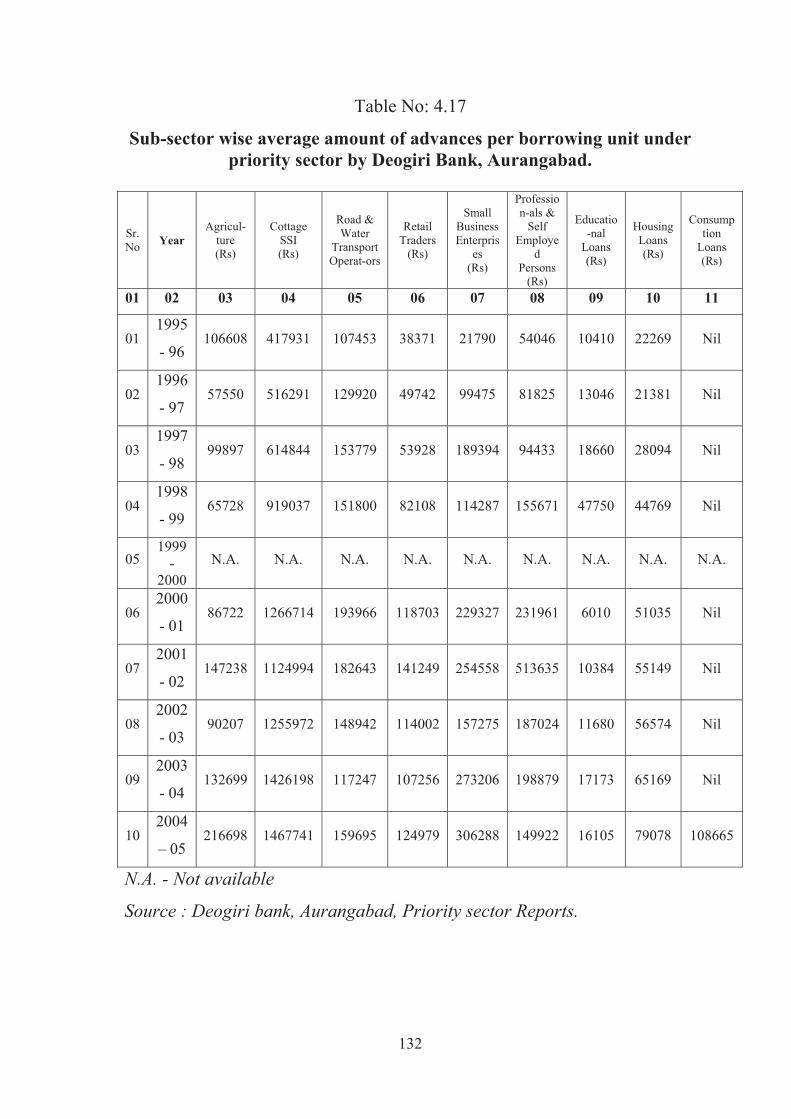
Table No: 4.17
Sub-sector wise average amount of advances per borrowing unit under
priority sector by Deogiri Bank, Aurangabad.
Sr.
NoYear
Agricul-
ture
(Rs)
Cottage
SSI
(Rs)
Road &
Water
Transport
Operat-ors
Retail
Traders
(Rs)
Small
Business
Enterpris
es
(Rs)
Professio
n-als &
Self
Employe
d
Persons
(Rs)
Educatio
-nal
Loans
(Rs)
Housing
Loans
(Rs)
Consump
tion
Loans
(Rs)
01 02 03 04 05 06 07 08 09 10 11
011995
- 96 106608 417931 107453 38371 21790 54046 10410 22269 Nil
021996
- 97 57550 516291 129920 49742 99475 81825 13046 21381 Nil
031997
- 98 99897 614844 153779 53928 189394 94433 18660 28094 Nil
041998
- 99 65728 919037 151800 82108 114287 155671 47750 44769 Nil
051999
-
2000
N.A. N.A. N.A. N.A. N.A. N.A. N.A. N.A. N.A.
062000
- 01 86722 1266714 193966 118703 229327 231961 6010 51035 Nil
072001
- 02 147238 1124994 182643 141249 254558 513635 10384 55149 Nil
082002
- 03 90207 1255972 148942 114002 157275 187024 11680 56574 Nil
092003
- 04 132699 1426198 117247 107256 273206 198879 17173 65169 Nil
102004
– 05 216698 1467741 159695 124979 306288 149922 16105 79078 108665
N.A. - Not available
Source : Deogiri bank, Aurangabad, Priority sector Reports.
132

Graph No. 4.5 (a)
0
200000
400000
600000
800000
1000000
1200000
1400000
1600000
1995- 96 1996- 97 1997- 98 1998- 99 1999-2000 2000- 01 2001- 02 2002- 03 2003- 04 2004 – 05
Sub-sector wise average amount of advances per borrowing unit under priority sector
by Deogiri Bank, Aurangabad
Agricul-ture
Cottage SSI
Road & Water
Transport
Operat-ors
Retail Traders
Graph No. 4.5 (b)
It is seen from the table no. 4.17 that the average amount of advances
per borrowing unit under the priority sector lending to agriculture by
Deogiri Bank, Aurangabad in 1995-96 was Rs. 106608. It has increased to
133
Rs. 216698 in 2004-05. However, there were continuous up and down in the
average amount of advances per borrowing unit to agriculture and allied
activity during the period 1995-96 to 2004-05. Over the period of ten years
from 1995-96 to 2004-05, this has increased by more than 2.03 times.
The average amount of advances per borrowing unit by Deogiri Bank,
Aurangabad to cottage and SSI has continuously increased during the period
from 1995-96 to 2004-05 except the year 2001-02. In 1995-96, it was Rs.
417913. It has increased to Rs. 1467741 in 2004-05. Over the period of ten
year, it has increased by 3.51 times.
The average amount of advances per borrowing units to road and
water transport operators by Deogiri Bank, Aurangabad during the period
from 1995-96 to 2004-05 shows up and down trend. In 1995-96 it was Rs.
107453. It has increased to Rs. 159695 in 2004-05. Over the period of ten
years from 1995-96 to 2004-05, it has increased by 1.48 times. The average
amount of retail traders by Deogiri Bank, Aurangabad during the period
from 1995-96 to 2004-05 shows that it has increased continuously increase
from Rs. 38317 in 1995-96 to Rs. 141249 in 2001-02, there after it has
declined during next two year from 2002-03 to 2003-04 and again increased
in the year 2004-05. Over the period of ten years from 1995-96 to 2004-05,
it has increased by 3.26 times.
The average amount of advances per borrowing unit to small business
enterprises by Deogiri Bank, Aurangabad shows up and down trend during
the period of ten years from 1995-96 to 2004-05. Over the period of ten
years from 1995-96 to 2004-05, it has increased by 14.05 times.
134
The average amount of advances per borrowing unit to professionals
and self-employed persons by Deogiri Bank, Aurangabad shows
continuously increase during the period from 1995-96 to 2001-02.
Thereafter during the period from 2002-03 to 2004-05 it shows up and down
trend. Over a period of ten year from 1995-96 to 2004-05, It has increased
by 2.77 times.
The average amount of advances per borrowing unit for educational
loan by Deogiri Bank, Aurangabad shows continues increase during the
period from 1995-96 to 1998-99. The year 1998-99 the increase was very
sharp. In 2000-01, it has sharply declined to the lowest level, Again from
2001-02 to 2002-03, it has increased and in 2004-05, it has slightly declined
over the period of ten year from 1995-96 to 2004-05, it has increased by
1.55 times.
The average amount of advances per borrowing unit for housing loans
by Deogiri Bank, Aurangabad shows continues increase during the period
from 1995-96 to 2004-05, it has increased by 3.55 times.
Deogiri bank did not granted consumption loan during 1995-96 to
2003-04. However, in 2004-05, it has granted the consumption loans and the
average amount of consumption loan per borrowing units was Rs. 108665.
It is seen from the table no. 4.18 that the average amount of advances
per borrowing unit under the priority sector lending to agriculture and allied
activities by the Peoples’ Bank, Jalna for the per of ten years from 1995-96
to 2004-05, shows small change except the year 1997-98, in which it has
increased sharply and immediately in next year declined sharply. During the
period of ten years, it has increased by 1.30 times.
135

The average amount of advances per borrowing unit to cottage and
SSI by the Peoples’ bank, Jalna shows up and down trend during the period
of ten years from 1995-96 to 2004-05. However, over the period from 1995-
96 to 2004-05, it has increased by 2.80 times.
Table No: 4.18
Sub-sector wise average amount of advances per borrowing unit under
priority sector by Peoples’ Bank, Jalna.
Sr.
NoYear
Agricul
-ture
(Rs)
Cottage
SSI
(Rs)
Road &
Water
Transpo
rt
Operat-
ors
Retail
Traders
(Rs)
Small
Business
Enterprises
(Rs)
Professio
n-als &
Self
Employe
d Persons
(Rs)
Educatio
-nal
Loans
(Rs)
Housing
Loans
(Rs)
Consum
ption
Loans
(Rs)
01 02 03 04 05 06 07 08 09 10 11
011995-
9612826 404054 121222 8304 27254 42843 11606 7968 6236
021996-
9730854 489753 182259 18063 51293 75372 5666 9393 23675
031997-
9815265 360358 164134 24616 57902 68053 6387 9483 739
041998-
9915639 396194 127285 36138 69614 66612 6031 15042 733
05 1999-
200015151 442336 75285 36399 87031 40127 7656 19378 1000
062000-
0111526 562242 97525 37414 122957 41450 7480 25202 900
072001-
0211183 795810 122342 42539 117895 48307 7963 25845 846
082002-
0311681 76832 95594 40627 130208 44891 8037 28640 5533
092003-
0413914 851780 52708 49052 128947 48908 9170 30533 9724
102004 –
0516689 1132632 43349 87220 130144 41344 14440 33540 26750
Source : Peoples’ Bank, Jalna, Priority sector Reports.
136
Graph No. 4.6 (a)
0
200000
400000
600000
800000
1000000
1200000
1995- 96 1996- 97 1997- 98 1998- 99 1999-2000 2000- 01 2001- 02 2002- 03 2003- 04 2004 – 05
Sub-sector wise average amount of advances per borrowing unit under priority sector by Peoples’ Bank, Jalna
Agricul-ture
Cottage SSI
Road & Water
Transport Operat-
ors
Retail Traders
X-Axis : Rs.,
Y-Axis : Year
Graph No. 4.6 (b)
0
20000
40000
60000
80000
100000
120000
140000
1995- 96 1996- 97 1997- 98 1998- 99 1999-2000 2000- 01 2001- 02 2002- 03 2003- 04 2004 – 05
Sub-sector wise average amount of advances per borrowing unit under priority sector by Peoples’ Bank, Jalna
Small Business
Enterprises
Profession-als &
Self Employed
Persons
Educatio-nal
Loans
Housing Loans
Consumption
Loans
137
The average amount of advances per borrowing unit to road and water
transport operators by the Peoples’ Bank, Jalna shows up and down trend
during the period of ten years from 1995-96 to 2004-05. However, over the
same period it has declined by 64%.
The average amount of advances per borrowing unit to retail traders
from 1995-96 to 2004-05, has continuously increased except the year 2002-
03. Over the period of ten years from 1995-96 to 2004-05, it has increased
by 10.50 times.
The average amount of advances per borrowing unit to small business
enterprises from 1995-96 to 2000-01 has shown continuously increasing
trends. There after it has shows up and down trend. However, over the
period of ten years from 1995-96 to 2004-05, it has increased by 4.7 times.
The average amount of advances per borrowing unit to professionals
and self-employed persons by Peoples’ Bank, Jalna during the period 1995-
96 to 2004-05 shows continuously up and down trend. It was highest at Rs.
75372 in 1996-97, over the period of ten years from 1995-96 to 2004-05, it
has declined by 3.5%.
The average amount of advances per borrowing units for education
loan shows up and down trend during 1995-96 to 1998-99. However, since
1999-2000, it shows continuously increasing trend till 2004-05. Over the
period from 1995-96 to 2004-05, it has increased by 1.24 times.
138

The average amount of advances per borrowing unit for housing loan
by Peoples’ Bank, Jalna during 1995-96 to 2004-05 shows continuously
increasing trend. However, over the period of ten years from 1995-96 to
2004-05, it has increased by 4.21 times.
The average amount of advances per borrowing unit for consumption
loan by Peoples’ Bank, Jalna during 1995-96 to 2004-05 shows up and
down trend. However, over the period from 1995-96 to 2004-05, it has
increased by 4.29 times.
Sub-sector wise average amount of overdue per borrowing unit under
priority sector lending.
The average amount of overdue is a key indicator of the performance
of the financial institutions specially the banks. This indicator provides an
insight into the lending policies and the recovery policies adopted by the
banks. It also helps the bank in devising proper lending and recovery policy.
The table no. 4.19 and table no. 4.20 gives an insight into the average
amount of overdue per borrowing unit to different sub-sectors under the
priority sector lending by Deogiri Bank, Aurangabad and Peoples’ Bank,
Jalna during the period from 1995-96 to 2004-05.
It is seen from table no. 4.19 that the average amount of overdue per
borrowing unit relating to agriculture and allied activities under priority
sector in case of Deogiri Bank during 1995-96 to 1998-99, there after it
shows up and down trend. However, over the period of ten years during
1995-96 to 2004-05, it has declined by 69%.
139

The average amount of overdue per borrowing unit relating to cottage
and SSI under priority sector has continuously increased during 1995-96 to
2004-05, except 1996-97. Over the period of ten years from 1995-96 to
2004-05, it has increased by 6.63 times.
The average amount of overdue per borrowing unit relating to road
and water transport operators under priority sector lending by Deogiri Bank
has declined during 1995-96 to 1998-99, there after it shows up and down
trend, however, over the period of ten years from 1995-96 to 2004-05, it has
increased by 1.76 times.
The average amount of overdue per borrowing unit relating to retail
traders under priority sector lending by Deogiri bank has declined during
1995-96 to 1998-99, there after it shows up and down trend. However, over
the period of ten years from 1995-96 to 2004-05, it has increased by 1.79
times.
The average amount of overdue per borrowing unit relating to small
business enterprises under priority sector lending by Deogiri Bank,
Aurangabad during 1995-96 to 2004-05, shows up and down trend.
However, over the period of ten years from 1995-96 to 2004-05, it has
increased by 1.44 times.
140
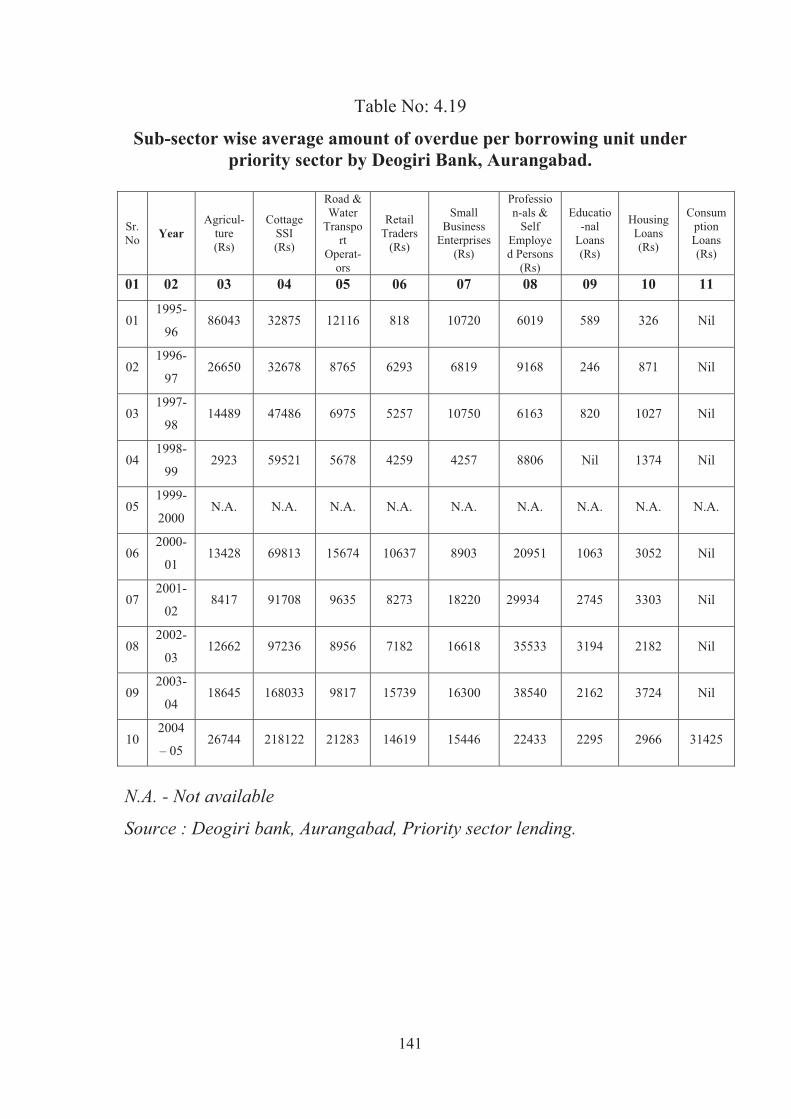
Table No: 4.19
Sub-sector wise average amount of overdue per borrowing unit under
priority sector by Deogiri Bank, Aurangabad.
Sr.
NoYear
Agricul-
ture
(Rs)
Cottage
SSI
(Rs)
Road &
Water
Transpo
rt
Operat-
ors
Retail
Traders
(Rs)
Small
Business
Enterprises
(Rs)
Professio
n-als &
Self
Employe
d Persons
(Rs)
Educatio
-nal
Loans
(Rs)
Housing
Loans
(Rs)
Consum
ption
Loans
(Rs)
01 02 03 04 05 06 07 08 09 10 11
011995-
9686043 32875 12116 818 10720 6019 589 326 Nil
1996-
9726650 32678 8765 6293 6819 9168 246 871 Nil02
1997-
9803 14489 47486 6975 5257 10750 6163 820 1027 Nil
1998-
992923 5952104 5678 4259 4257 8806 Nil 1374 Nil
051999-
2000N.A. N.A. N.A. N.A. N.A. N.A. N.A. N.A. N.A.
062000-
0113428 69813 15674 10637 8903 20951 1063 3052 Nil
072001-
028417 91708 9635 8273 18220 29934 2745 3303 Nil
082002-
0312662 97236 8956 7182 16618 35533 3194 2182 Nil
092003-
0418645 168033 9817 15739 16300 38540 2162 3724 Nil
102004
– 05 26744 218122 21283 14619 15446 22433 2295 2966 31425
N.A. - Not available
Source : Deogiri bank, Aurangabad, Priority sector lending.
141

Graph No. 4.7 (a)
0
50000
100000
150000
200000
250000
1995- 96 1996- 97 1997- 98 1998- 99 1999-2000 2000- 01 2001- 02 2002- 03 2003- 04 2004 – 05
Sub-sector wise average amount of overdue per borrowing unit under priority sector by Deogiri Bank,
Aurangabad
Agricul-ture
Cottage SSI
Road &WaterTransportOperat-ors
RetailTraders
X-Axis : Rs.,
Y-Axis : Year
Graph No. 4.7 (b)
0
5000
10000
15000
20000
25000
30000
35000
40000
1995- 96 1996- 97 1997- 98 1998- 99 1999-
2000
2000- 01 2001- 02 2002- 03 2003- 04 2004 – 05
Sub-sector wise average amount of overdue per borrowing unit under priority sector
by Deogiri Bank, Aurangabad
Small Business
Enterprises
Profession-als &
Self Employed
Persons
Educatio-nal Loans
Housing Loans
Consumption Loans
142
The average amount of overdue per borrowing unit relating to
professionals and self-employed persons under priority sector lending by
Deogiri Bank, Aurangabad shows up and down trend during 1995-96 to
1998-99, there after it shows upward trend during 2000-01 to 2003-04 &
then it has declined in 2004-05. However, over the period of ten years from
1995-96 to 2004-05, it has increased by 3.73 times.
The average amount of overdue per borrowing unit relating to
educational loan under priority sector lending by Deogiri bank during 1995-
96 to 1998-99, shows up and down trend, then during 2000-01 to 2002-03
shows upward trend, then declined in 2003-04 and again increased in 2004-
05. However, over the period of ten years from 1995-96 to 2004-05, it has
increased by 3.9 times.
The average amount of overdue per borrowing unit relating to
housing loan under priority sector lending by Deogiri Bank, Aurangabad
during 1995-96 to 2001-02, shows continuously increasing trend, there after
during 2002-03 to 2004-05, it shows up and down trend. However, over the
period of ten years from 1995-96 to 2004-05, it has increased by 9.10 times.
It is also seen that there were no overdue relating to consumption loan
during 1995-96 to 2003-04. It was Rs. 31424 in 2004-05.
143

Table No: 4.20
Sub-sector wise average amount of overdue per borrowing unit under
priority sector by Peoples’ Bank, Jalna.
Sr.
NoYear
Agricul
-ture
(Rs)
Cottage
SSI
(Rs)
Road &
Water
Transpo
rt
Operat-
ors
Retail
Traders
(Rs)
Small
Business
Enterprises
(Rs)
Professio
n-als &
Self
Employe
d Persons
(Rs)
Educatio
-nal
Loans
(Rs)
Housing
Loans
(Rs)
Consum
ption
Loans
(Rs)
01 02 03 04 05 06 07 08 09 10 11
011995-
96461 138869 43444 2129 3436 10294 424 3132 Nil
021996-
979312 138358 2722 2408 2882 7677 150 2782 Nil
031997-
981386 136291 6835 411 4143 4933 64 1756 Nil
041998-
991572 111648 714 1971 6434 5875 22 1057 Nil
05 1999-
20001497 102980 39628 2518 7653 1212 40 596 Nil
062000-
011299 116526 31275 2955 10841 2626 27 461 Nil
072001-
02594 125600 17942 5610 24837 7375 24 894 Nil
082002-
031210 99940 18810 6435 35723 7194 37 1788 Nil
092003-
041527 143824 3987 11873 36977 10067 250 2459 Nil
102004 –
05896 223506 6072 11943 35689 9952 283 2671 Nil
Source : Peoples’ Bank, Jalna, Priority sector Reports.
144

Graph No. 4.8 (a)
Graph No. 4.8 (b)
145
It is seen from table no. 4.20 that the average amount of overdue per
borrowing unit relating to agriculture and allied activities under priority
sector lending by Peoples’ bank, Jalna during 1995-96 to 2004-05 shows up
and down trend. However, over the period of ten years from 1995-96 to
2004-05, it has increased by 1.94 times.
The average amount of overdue per borrowing unit relating to cottage
and SSI under priority sector lending by Peoples’ bank during 1995-96 to
1999-2000 shows continuous declining trend during 2000-01 & 2001-02, it
has increased, in 2002-03 it has declined and again increased during 2003-
04 and 2004-05. It has increased sharply in the year 2004-05. However, over
the period of ten years it has increased by 1.61 times.
The average amount of overdue per borrowing unit relating to road
and water transport operators under priority sector by Peoples’ bank, Jalna
shows continuous up and down trend during 1995-96 to 2004-05. However,
over the period of ten years from 1995-96 to 2004-05, it has declined by
86%.
The average amount of overdue per borrowing unit relating to retail
traders under priority sector lending by Peoples’ bank, Jalna initially shows
up and down trend during 1995-96 to 1997-98, there after it shows
continuous increasing trend from 1998-99 to 2004-05. However, over the
period of ten year from 1995-96 to 2004-05, it has increased by 5.6 times.
The average amount of overdue per borrowing unit relating to small
business enterprises under priority sector lending by Peoples’ Bank, Jalna
during 1995-96 to 2004-05, shows increasing trend, except for the year
146
1996-97 and 2004-05. However, over the period of ten year from 1995-96 to
2004-05, it has increased by 10.39 times.
The average amount of overdue per borrowing unit relating to
professionals and self-employed persons under priority sector lending by
Peoples’ bank, Jalna during the period from 1995-96 to 2004-05, shows up
and down trend. However, over the period of ten years from 1995-96 to
2004-05, it has declined marginally by 0.03%.
The average amount of overdue per borrowing unit relating to
education loan under priority sector lending by Peoples’ Bank, Jalna during
1995-96 to 2004-05, shows up and down trend. However, over the period of
ten year from 1995-96 to 2004-05, it has declined by 33%.
The average amount of overdue per borrowing unit relating to
housing loan under priority sector lending by Peoples’ bank, Jalna during
the period from 1995-96 to 2000-01 shows declining trend, there after from
2001-02 to 2004-05, it shows increasing trend. However, over the period of
ten years from 1995-96 to 2004-05, it has declined by 15%.
The average amount of overdue per borrowing unit relating to
consumption loan under priority sector lending by Peoples’ bank, Jalna
during the period from 1995-96 to 2004-05 remain Nil.
Analysis of major performance indicators of the Deogiri Bank,
Aurangabad and Peoples’ Bank, Jalna.
The performance of the banks can be measured on the basis of
various indicators namely net profit, total advances amount of overdue,
147

priority sector lending, loans to weaker sections, % of NPA and GNPA to
total advances etc.
The operative efficiency of a bank can be measured on the basis of
net profit carried by the bank during the accounting period. Net profit as a
percentage of amounts of advances is an effective tool of measuring the
performance of the banks in an objective manner.
Amount of total advances over the period of time is an effective tool
to measure the growth of the banking business achieved by the banks during
the given period of the time.
Absolute amount of overdue and the overdue as a percentage of
amount advanced during a period of time is a measure of revealing the
effectiveness of management in relation to its lending policy and recovery
policy.
Proportionate share of priority sector lending and loans to weaker
sections is a measure to reveal the social adherence of the banks and its
commitment to realize social objectives as notified by the RBI in its policy
towards priority sector lending.
Gross non-performing assets and Net non performing assets are the
important tools to measure the effectiveness of the lending policy, recovery
policy, efficiency of the staff etc.
148

Analysis of major financial indicators of the Deogiri Bank, Aurangabad
and Peoples’ Bank, Jalna.
The table no. 4.21 and table no. 4.22 shows the position of Deogiri
bank, Aurangabad and Peoples’ bank, Jalna respectively in respect of total
advances, Net profits, percentage of overdue as to amount advances,
percentage of priority sector lending, percentage of weaker section lending,
percentage of Net NPA and Gross NPA.
Table No. 4.21
Statement showing major financial indicators of Deogiri Bank,
Aurangabad.
Year Net Profit
(Rs.)
Total advances
(Rs.)
% of Net
Profit to
total
advances
% of
over
due
% of priority
sector lending
to total
advances
% of weaker
section
lending to
total advances
% of Net
NPA
% of
Gross
NPA.
1995-96 4183251 131019541 3.19 9.4 60.89 9.05 N.A. N.A.
1996- 97 12880047 209819530 6.14 6.66 56.62 8.66 N.A. N.A.
1997- 98 21120456 382572415 5.52 5.28 53.90 8.75 N.A. N.A.
1998- 99 30069559 549796185 5.47 8.01 65.04 11.65 N.A. N.A.
1999-
200033029307 906404880 3.64 5.14 67.15 N.A. 3.82 N.A.
2000- 01 43830220 1393823962 3.14 5.95 68.74 9.10 4.85 6.25
2001- 02 50152195 1764292000 2.84 N.A. 63.78 7.77 5.12 8.69
2002- 03 45129364 1969595478 2.29 9.6 60.04 9.77 6.67 12.14
2003- 04 25877472 2088518396 1.24 N.A. 64.07 17.64 7.16 15.98
2004 - 05 28145922 2474518202 1.13 11.66 63.71 15.66 5.13 13.62
N.A. : Not available
Source : Annual Reports, 1995-96 to 2004-05, Deogiri Bank, Aurangabad.
It is evident from the table no. 4.21 that the net profit of the Deogiri
Bank, Aurangabad has continuously increased from 1995-96 to 2001-02,
there after it has declined during 2002-03 and 2003-04 and again increased
in the year 2004-05, over the period of ten year from 1995-96 to 2004-05,
149

the net profit of the Deogiri Bank, Aurangabad has increased by nearly 7
times.
The total amount of advances made by the Deogiri bank, Aurangabad
has continuously increased during the period 1995-96 to 2004-05. Over the
period of ten years from 1995-96 to 2004-05, it has increased by nearly 19
times.
It is seen from the table no. 4.21 that the percentage of net profit to
total advances in 1995-96 was 3.19%. it was highest in 1996-97 at 6.14%,
there after it was continuously declined and reached at 1.13% in 2004-05.
The percentage of overdue to amount advanced shows up down trend
during the period from 1995-96 to 2004-05. However, it was highest at
11.66% in the year 2004-05.
It is evident from the table no. 4.21 that the Deogiri Bank,
Aurangabad did not achieved the target of priority sector lending in the year
1996-97 and 1997-98 as it was 56.62% and 53.90% of the total advances
respectively.
It is seen that the percentage share of weaker section lending to total
advances shows the up and down trend during the period from 1995-96 to
2004-05. However, it was highest at 17.64% in 2003-04. It is also seen that
the percentage share of weaker section advances to total advances remain
below the stipulated target of 15% during the period from 1995-96 to 2002-
03.
150
It is seen from the table no. 4.21 that the percentage of Net NPA and
Gross NPA shows up and down trend during the period from 1999-2000 to
2004-05. However, Net NPA and gross NPA both were highest in the year
2003-04. It was mainly due to the charge in the norms for classification of
assets. This has resulted in higher provisioning for NPA.
It is seen that in 2003-04 and 2004-05, the percentage of net profit to
total advances was lowest to 1.24% and 1.13 respectively. During the same
period the percentage of overdue, percentage of weaker section lending to
total advances, percentage of Net NPA and gross NPA were higher than the
earlier years. It means that the higher percentage of overdue, lending to
weaker sections, Net NPA and Gross NPA have adversely affected the
profitability of the Deogiri Bank, Aurangabad. This has happen despite the
increase in the amount of advances.
It is evident from the table no. 4.22 that the net profit of the Peoples’
Bank, Jalna has up and down trends during the period from 1995-96 to
2004-05. In 2001-02, it was at its highest level of Rs. 8894683 and
immediately in next year i.e. 2002-03, it attained the lowest level for the
period of this study at Rs. 102459. Over the period of ten year from 1995-96
to 2004-05, the net profit has decreased by nearly 83%.
151
Table No. 4.22
Statement showing major financial indicators of Peoples’ Bank, Jalna.
Year Net Profit
(Rs.)
Total
advances
(Rs.)
% of
Net
Profit
to total
advanc
es
% of
over
due
% of
priority
sector
lending
to total
advance
s
% of
weaker
section
lending
to total
advanc
es
% of
Net
NPA
% of
Gros
s
NPA.
1995-96 3003405 146518220 2.04 30.09 62.32 14.90 21.90 30.09
1996- 97 7693350 228722699 3.36 18.06 60.64 14.61 6.38 18.06
1997- 98 6519748 222501482 2.93 16.92 62.61 14.29 16.26 16.90
1998- 99 7096592 243043240 2.91 14.94 63.46 14.07 2.48 14.94
1999-
20008144119 296634581 2.75 13.35 64.46 15.06 3.00 13.35
2000- 01 8704563 371662350 2.34 12.88 67.92 15.98 4.77 12.86
2001- 02 8894683 452027228 1.97 13.69 61.66 15.53 7.14 14.03
2002- 03 102459 435914358 0.02 23.72 63.15 15.08 22.01 30.29
2003- 04 2470934 427197811 0.57 29.90 63.35 16.74 19.54 29.80
2004 -05 506000 448250424 0.11 26.06 64.65 16.48 14.71 26.48
Source : Annual Reports, 1995-96 to 2004-05, Peoples Banks, Jalna.
The total amount of advances made by the Peoples’ bank, Jalna
during the period from 1995-96 to 2004-05 shows continuous up and down
trend. However, over the period of ten year, it has increased by 3.06 times.
It is seen from table no. 4.20 that the percentage of net profit to total
advances in 1995-96 was 2.04%. It was highest in 1996-97 at 3.36%, there
after it has continuously declined at reached at 0.02 in 2002-03. In 2003-04,
it has marginally increased to 0.57% and in 2004-05 it has again declined to
0.11%.
152

The percentage of overdue to amount advanced in 1995-96 was
highest at 30.09%, there after it has continuously declined during 1996-97 to
2000-01. In 2000-01 it has reached the lowest level at 12.88%. During
2001-02 to 2003-04, it has continuously increased and in reached at 29.90%
and in 2004-05 it has declined to 26.06%.
It is evident from the table no. 4.22 that the peoples’ bank, Jalna have
achieved the target of priority sector lending during the period from 1995-96
to 2004-05 as it was more than the stipulated target of 60% in each of the
period under the study.
It is seen that the percentage share of weaker section lending to total
advances during the period from 1995-96 to 2004-05 remain between
14.07%, during the initial period from 1995-96 to 1998-99. It was
marginally lower than the target of 15%, thereafter during 1999-2000 to
2004-05 it was marginally higher than the target.
It is evident that the percentage of gross NPA at the end of year 1995-
96 was 30.09%. It has continuously declined till the year 2000-2001. There
after it has increased in 2001-02 and 2002-03. It was at the highest level of
30.29% for the year 2002-03. There after it has declined during the year
2003-04 and 2004-05. The percentage of Net NPA and shows up and down
trend during the period from 1995-96 to 2002-03. During 2003-04 and
2004-05 it had been declined as compared to the year 2002-03. The Net
NPA and gross NPA both were highest in the year 2002-03. The gross NPA
and Net NPA both were higher than the average GNPA and NNPA at
national level for the urban co-operative banks.
153

It is seen that in 2002-03, 2003-04 and 2004-05, the percentage of net
profit to total advances was lowest to 0.02%, 0.57 and 0.11 respectively.
During the same period the percentage of overdue, percentage of weaker
section lending to total advances, percentage of Net NPA and gross NPA
were higher than the earlier years accept the year 1995-96. It means that the
higher percentage of overdue, lending to weaker sections, Net NPA and
Gross NPA have adversely affected the profitability of the Peoples’ Bank,
Jalna. This has happen despite the increase in the amount of advances.
Comparison of Deogiri Bank, Aurangabad and Peoples’ bank, Jalna in
respect of major financial indicators.
On the basis of the table no. 4.21 and table no. 4.22 that the
performance of Deogiri bank, Aurangabad is much better as compared to
the Peoples’ bank, Jalna.
It is evident that the net profit of the Deogiri bank has increased by 7
times over the period from ten year from 1995-96 to 2004-05. The net profit
of the Peoples’ bank, Jalna has declined by 83% over the same period.
The total amount of advances made by the Deogiri bank has increased
by nearly 19 times over the period of ten year from 1995-96 to 2004-05. The
total amount of advances made by the Peoples’ bank, Jalna has increased by
3.06 times over the same period.
It is also evident that the percentage of net profit to total advances for
Deogiri bank was much higher than the Peoples’ bank throughout the period
of ten years from 1995-96 to 2004-05.
154
The percentage of overdue to amount advanced in case of Deogiri
bank was much lower than the Peoples’ bank throughout the period from
1995-96 to 2004-05.
It is also evident that the percentage of peoples’ bank in respect of
priority sector lending and lending to weaker section as a percentage of total
advances was slightly better than the Deogiri bank, during the period from
1995-96 to 2004-05.
It is also seen that the performance of Deogiri bank in respect of net
NPA and Gross NPA is much better. The NPA position of the Peoples’ bank
was very weak during the period from 1995-96 to 2004-05. This view can
also be supported on the basis of percentage of overdue to total advances
made by the bank which is much higher in case of the Peoples bank.
The Deogiri bank in the initial period of this study seems to be
reluctant to lend to weaker section. However, during later year it has also
achieved the target of weaker section lending.
It can be summarized that the performance of the Deogiri bank is very
good in respect of various financial indicators considered for this study. It
means that the operative efficiency, lending policy, recovery policy of the
Deogiri bank was very good despite the social obligation of priority sector
lending imposed by the RBI.
However, the performance of Peoples’ bank is very weak as
compared to the Deogiri bank. This means that the operative efficiency,
lending policy and recovery policy of the Peoples’ bank was poor.
155

The Deogiri bank seems to be more transport as its annual reports
contains more and relevant information on the performance of the bank
including NPA etc., where as the Peoples’ bank lacks the transparency as its
annual reports did not contain important information mainly information
relating to NPA etc.
It can be concluded that the priority sector lending target of 60% of
total lending by the UCB is instrumental in bringing socio-economic change
in the society through generation of employment opportunities to the masses
and encouraging the Peoples for self-employment.
It can further be concluded that the failure or weak performance of
the UCB is not because of priority sector lending but it is because of
inefficiency, improper lending and ineffective recovery policy.
Study of recent performance of the selected Urban Co-operative banks.
The study of recent performance of the selected Urban co-operative
bank was necessary to reveal and confirm or otherwise the trend of the
performance of the UCBs in the light of trend revealed for the period from
1995-96 to 2004-05.
The table no. 4.23 reveals the major performance indicators of the
Deogiri bank, Aurangabad and Peoples’ bank, Jalna for the year 2008-09.
156

Table no. 4.23
Statement showing major performance indicators of Deogiri bank,
Aurangabad and Peoples’ bank, Jalna for the year 2008-09.
Performance indicators Deogiri Bank, (%) Peoples’ bank,
Jalna (%)
1. Net Profits (Rs.) 2,97,48,753.69 88,78,236.00
2. Total advances (Rs.) 2,34,79,56,822.69 39,98,71,105.00
3. % of Net profits to total
advances
1.27 2.22
4. % of overdue 16.30 22.24
5. % of priority sector lending
to total section
65.59 69.62
6. % of weaker section
lending to total lending
15.68 22.40
7. % of Net NPA 1.67 1.95
Source : Annual reports of Deogiri bank and Peoples bank 2008-09.
It is reveled from the table no. 4.23 that the net profit as a percentage
of total advances made by Deogiri bank and Peoples’ bank during the year
was 1.27% and 2.22% respectively. The amount of overdue as a percentage
of total advances of Deogiri bank and Peoples’ bank for the year was 16.30
and 22.24% respectively. it is further seen that both the banks have achieved
the target of 60% of the total lending to priority sector and 15% of the total
lending to weaker section. It is also revealed that the Net NPA of the
Deogiri bank and Peoples’ bank for the year was at 1.67% and 1.95%
respectively.
157

References :
1) Dr. K. K. Sharma, Chief Compiler, Dr. K. G. Pathan & Dr. V. S.
Mangnale, “Intellectual’s Sandarbh Maharashtra State & District at a
Glance Vol.-II”, published by Intellectual Book Bureau, Bhopal
(2004) P. No. 638 - 662
2) Dr. K. K. Sharma, op cit, P-705-723.
3) www.rbi.org.in
4) Deogiri Banks, Aurangabad, Priority sector lending reports 1995-96
to 2004-05.
5) Peoples’ Bank, Jalna, Priority sector lending reports 1995-96 to 2004-
05.
6) Deogiri Bank, Aurangabad, Annual Reports 1995-96 to 2004-05.
7) Peoples’ Bank, Jalna, Annual Reports 1995-96 to 2004-05.
158

![Comparative Analysis of Different Supervised ... · UNESCO World Heritage Sites, as well as Bibi Ka Maqbara [9]. The bellowed Figure 1 shows the study area-Aurangabad region of Aurangabad](https://img.pdfslide.us/doc/110x75/5ec8959f86ef5541f57baf8d/comparative-analysis-of-different-supervised-unesco-world-heritage-sites-as.jpg)


![Untitled-2 [kalsiproducts.com]kalsiproducts.com/kalsi.pdfATTA CHAKKI KAI-SI HAND BLENDER CHOPPER & LEMON SQUEEZER LEMON SQUEEZER KALSi KALSI R; HOPPER? HAND BLENDER CHOPPER 2 SPEED](https://img.pdfslide.us/doc/110x75/5b3140277f8b9a744a8ba9d6/untitled-2-chakki-kai-si-hand-blender-chopper-lemon-squeezer-lemon-squeezer.jpg)