Embed Size (px)
DESCRIPTION
6. Measuring National Output and National Income. CHAPTER OUTLINE. Gross Domestic Product Final Goods and Services Exclusion of Used Goods and Paper Transactions Exclusion of Output Produced Abroad by Domestically Owned Factors of Production Calculating GDP - PowerPoint PPT Presentation
Citation preview
1 of 38© 2012 Pearson Education, Inc. Publishing as Prentice Hall
PAR
T I
I C
once
pts
and
Prob
lem
s in
Mac
roec
onom
ics
CHAPTER OUTLINE
6Measuring National Output and National
Income
Gross Domestic Product Final Goods and ServicesExclusion of Used Goods and Paper TransactionsExclusion of Output Produced Abroad by Domestically Owned
Factors of Production
Calculating GDPThe Expenditure ApproachThe Income Approach
Nominal versus Real GDPCalculating Real GDP Calculating the GDP DeflatorThe Problems of Fixed Weights
Limitations of the GDP ConceptGDP and Social Welfare The Underground EconomyGross National Income per Capita
Looking Ahead
2 of 38© 2012 Pearson Education, Inc. Publishing as Prentice Hall
PAR
T I
I C
once
pts
and
Prob
lem
s in
Mac
roec
onom
ics
national income and product accounts Data collected and published by the government describing the various components of national income and output in the economy.
3 of 38© 2012 Pearson Education, Inc. Publishing as Prentice Hall
PAR
T I
I C
once
pts
and
Prob
lem
s in
Mac
roec
onom
ics
gross domestic product (GDP) The total market value of all final goods and services produced within a given period by factors of production located within a country.
GDP is the total market value of a country’s output. It is the market value of all final goods and services produced within a given period of time by factors of production located within a country.
Gross Domestic Product
4 of 38© 2012 Pearson Education, Inc. Publishing as Prentice Hall
PAR
T I
I C
once
pts
and
Prob
lem
s in
Mac
roec
onom
ics
5 of 38© 2012 Pearson Education, Inc. Publishing as Prentice Hall
PAR
T I
I C
once
pts
and
Prob
lem
s in
Mac
roec
onom
ics
final goods and services Goods and services produced for final use.
intermediate goods Goods that are produced by one firm for use in further processing by another firm.
value added The difference between the value of goods as they leave a stage of production and the cost of the goods as they entered that stage.
Gross Domestic Product
Final Goods and Services

6 of 38© 2012 Pearson Education, Inc. Publishing as Prentice Hall
PAR
T I
I C
once
pts
and
Prob
lem
s in
Mac
roec
onom
ics
In calculating GDP, we can sum up the value added at each stage of production or we can take the value of final sales. We do not use the value of total sales in an economy to measure how much output has been produced.
TABLE 6.1 Value Added in the Production of a Gallon of Gasoline (Hypothetical Numbers)
Stage of Production Value of Sales Value Added
(1) Cow produce milk(dairy)
800 800
(2) Grocery 2700 1900
(3) Retail sale 3000 300
Total value added $3000
Gross Domestic Product
Final Goods and Services
7 of 38© 2012 Pearson Education, Inc. Publishing as Prentice Hall
PAR
T I
I C
once
pts
and
Prob
lem
s in
Mac
roec
onom
ics
GDP is concerned only with new, or current, production. Old output is not counted in current GDP because it was already counted when it was produced.
GDP does not count transactions in which money or goods changes hands but in which no new goods and services are produced.
Gross Domestic Product
Exclusion of Used Goods and Paper Transactions

8 of 38© 2012 Pearson Education, Inc. Publishing as Prentice Hall
PAR
T I
I C
once
pts
and
Prob
lem
s in
Mac
roec
onom
ics
eBay’s business is to provide a marketplace for exchange. In doing so, it uses labor and capital and creates value.
In return for creating this value, eBay charges fees to the sellers that use its site. The value of these fees enter into GDP.
So while the old knickknacks that people sell on eBay do not contribute to current GDP, the cost of finding an interested buyer for those old goods does indeed get counted.
E C O N O M I C S I N P R A C T I C E
Where Does eBay Get Counted?

9 of 38© 2012 Pearson Education, Inc. Publishing as Prentice Hall
PAR
T I
I C
once
pts
and
Prob
lem
s in
Mac
roec
onom
ics
GDP is the value of output produced by factors of production located within a country.
gross national product (GNP) The total market value of all final goods and services produced within a given period by factors of production owned by a country’s citizens, regardless of where the output is produced.
Gross Domestic Product
Exclusion of Output Produced Abroad by Domestically Owned Factors of Production
10 of 38© 2012 Pearson Education, Inc. Publishing as Prentice Hall
PAR
T I
I C
once
pts
and
Prob
lem
s in
Mac
roec
onom
ics
expenditure approach A method of computing GDP that measures the total amount spent on all final goods and services during a given period.
income approach A method of computing GDP that measures the income—wages, rents, interest, and profits—received by all factors of production in producing final goods and services.
Calculating GDP
11 of 38© 2012 Pearson Education, Inc. Publishing as Prentice Hall
PAR
T I
I C
once
pts
and
Prob
lem
s in
Mac
roec
onom
ics
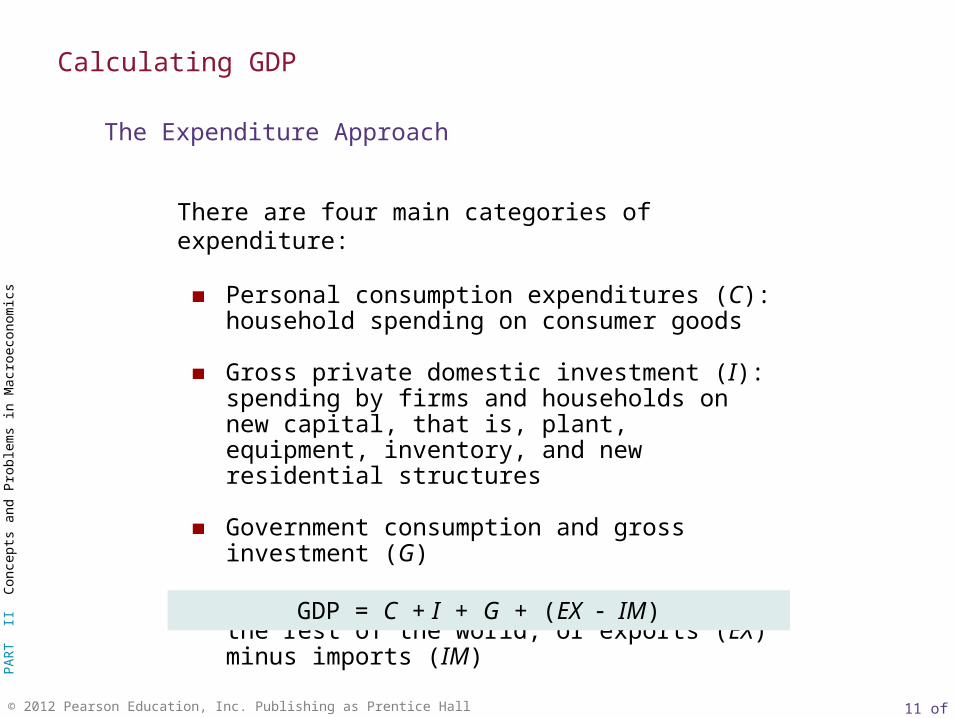
There are four main categories of expenditure:
Personal consumption expenditures (C): household spending on consumer goods
Gross private domestic investment (I): spending by firms and households on new capital, that is, plant, equipment, inventory, and new residential structures
Government consumption and gross investment (G)
Net exports (EX IM): net spending by the rest of the world, or exports (EX) minus imports (IM)
GDP = C + I + G + (EX IM)
Calculating GDP
The Expenditure Approach

12 of 38© 2012 Pearson Education, Inc. Publishing as Prentice Hall
PAR
T I
I C
once
pts
and
Prob
lem
s in
Mac
roec
onom
ics
TABLE 6.2 Components of U.S. GDP, 2009: The Expenditure Approach
Billions of Dollars Percentage of GDP
Personal consumption expenditures (C) 10,089.1 70.8
Durable goods 1,035.0 7.3Nondurable goods 2,220.2 15.6Services 6,833.9 47.9
Gross private domestic investment (l) 1,628.8 11.4Nonresidential 1,388.8 9.7Residential 361.0 2.5Change in business inventories 120.9 0.8
Government consumption and gross investment (G)
2,930.7 20.5
Federal 1,144.8 8.0State and local 1,786.9 12.5
Net exports (EX – IM) 392.4 2.8Exports (EX) 1,564.2 11.0
Imports (IM) 1,956.6 13.7Gross domestic product 14,256.3 100.0
Note: Numbers may not add exactly because of rounding.
Calculating GDP
The Expenditure Approach
13 of 38© 2012 Pearson Education, Inc. Publishing as Prentice Hall
PAR
T I
I C
once
pts
and
Prob
lem
s in
Mac
roec
onom
ics
Calculating GDP
The Expenditure Approach
Personal Consumption Expenditures (C)
personal consumption expenditures (C) Expenditures by consumers on goods and services.
durable goods Goods that last a relatively long time, such as cars and household appliances.
nondurable goods Goods that are used up fairly quickly, such as food and clothing.
services The things we buy that do not involve the production of physical things, such as legal and medical services and education.

14 of 38© 2012 Pearson Education, Inc. Publishing as Prentice Hall
PAR
T I
I C
once
pts
and
Prob
lem
s in
Mac
roec
onom
ics
gross private domestic investment (I) Totalinvestment in capital—that is, the purchase of new housing, plants, equipment, and inventory by the private (or nongovernment) sector.
nonresidential investment Expenditures by firms for machines, tools, plants, and so on.
residential investment Expenditures by households and firms on new houses and apartment buildings.
Calculating GDP
The Expenditure Approach
Gross Private Domestic Investment (I)
15 of 38© 2012 Pearson Education, Inc. Publishing as Prentice Hall
PAR
T I
I C
once
pts
and
Prob
lem
s in
Mac
roec
onom
ics
change in business inventories The amount by which firms’ inventories change during a period. Inventories are the goods that firms produce now but intend to sell later.
GDP = Final sales + Change in business inventories
Change in Business Inventories
Calculating GDP
The Expenditure Approach
Gross Private Domestic Investment (I)
16 of 38© 2012 Pearson Education, Inc. Publishing as Prentice Hall
PAR
T I
I C
once
pts
and
Prob
lem
s in
Mac
roec
onom
ics
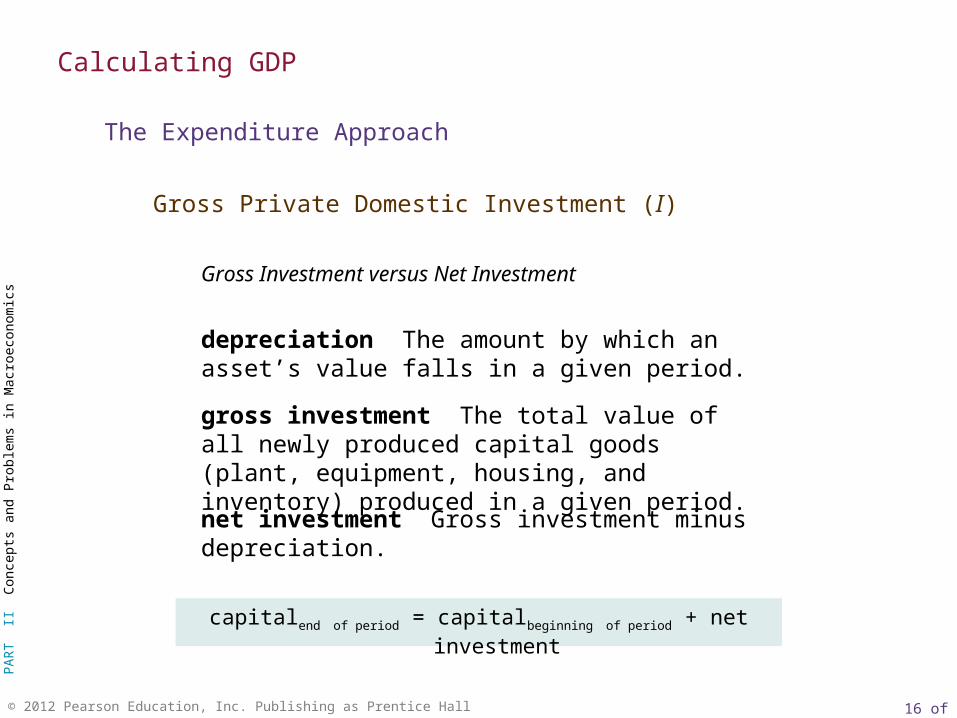
depreciation The amount by which an asset’s value falls in a given period.
gross investment The total value of all newly produced capital goods (plant, equipment, housing, and inventory) produced in a given period.
net investment Gross investment minus depreciation.
capitalend of period = capitalbeginning of period + net investment
Calculating GDP
The Expenditure Approach
Gross Private Domestic Investment (I)
Gross Investment versus Net Investment

17 of 38© 2012 Pearson Education, Inc. Publishing as Prentice Hall
PAR
T I
I C
once
pts
and
Prob
lem
s in
Mac
roec
onom
ics
government consumption and gross investment (G) Expenditures by federal, state, and local governments for final goods and services.
net exports (EX IM) The difference between exports (sales to foreigners of U.S.-produced goods and services) and imports (U.S. purchases of goods and services from abroad). The figure can be positive or negative.
Calculating GDP
The Expenditure Approach
Government Consumption and Gross Investment
Net Exports (EX IM)

18 of 38© 2012 Pearson Education, Inc. Publishing as Prentice Hall
PAR
T I
I C
once
pts
and
Prob
lem
s in
Mac
roec
onom
ics
Calculating GDP
The Income Approach
compensation of employees Includes wages, salaries, and various supplements—employer contributions to social insurance and pension funds, for example—paid to households by firms and by the government.
proprietors’ income The income of unincorporated businesses.
rental income The income received by property owners in the form of rent.
corporate profits The income of corporations.
national income The total income earned by the factors of production owned by a country’s citizens.
19 of 38© 2012 Pearson Education, Inc. Publishing as Prentice Hall
PAR
T I
I C
once
pts
and
Prob
lem
s in
Mac
roec
onom
ics
Calculating GDP
The Income Approach
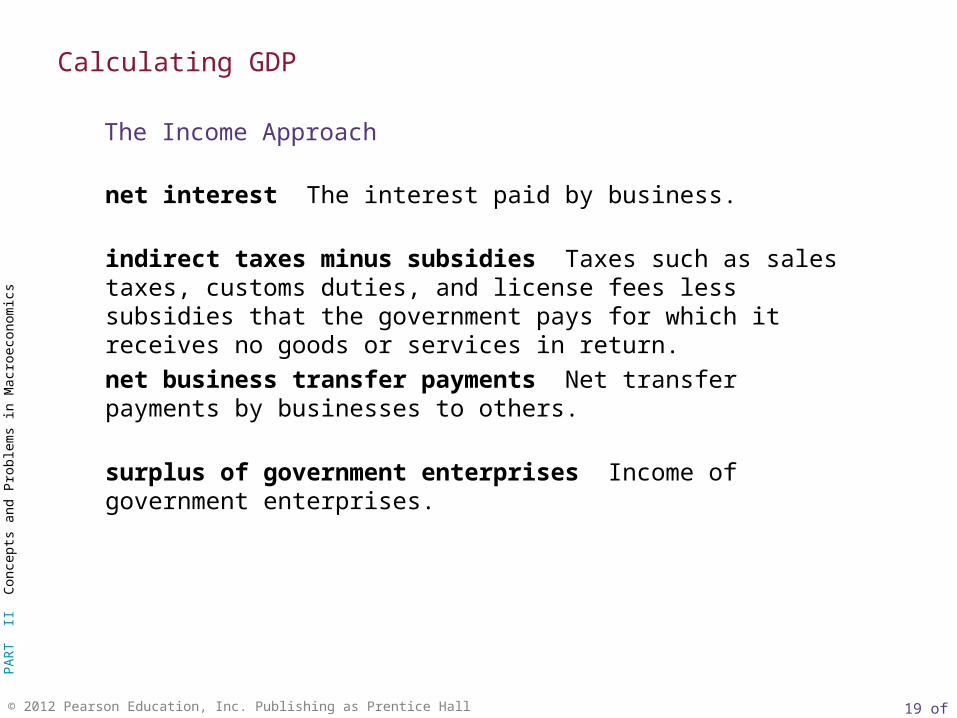
indirect taxes minus subsidies Taxes such as sales taxes, customs duties, and license fees less subsidies that the government pays for which it receives no goods or services in return.
net business transfer payments Net transfer payments by businesses to others.
surplus of government enterprises Income of government enterprises.
net interest The interest paid by business.
20 of 38© 2012 Pearson Education, Inc. Publishing as Prentice Hall
PAR
T I
I C
once
pts
and
Prob
lem
s in
Mac
roec
onom
ics
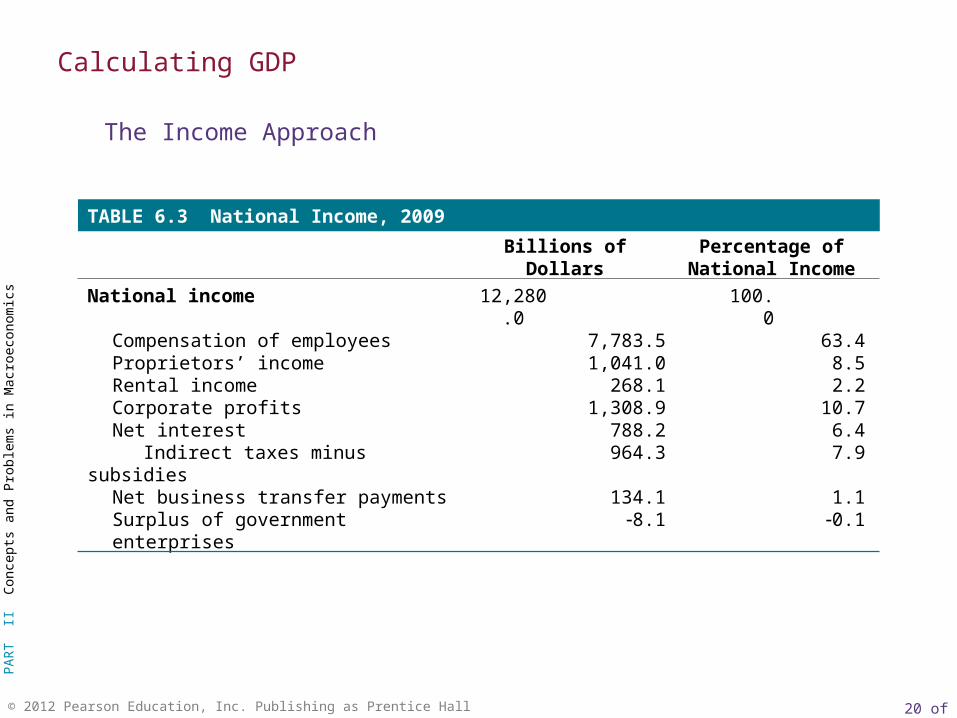
TABLE 6.3 National Income, 2009
Billions ofDollars
Percentage of National Income
National income 12,280.0 100.0Compensation of employees 7,783.5 63.4Proprietors’ income 1,041.0 8.5Rental income 268.1 2.2Corporate profits 1,308.9 10.7Net interest 788.2 6.4
Indirect taxes minus subsidies 964.3 7.9Net business transfer payments 134.1 1.1Surplus of government enterprises 8.1 0.1
Calculating GDP
The Income Approach
21 of 38© 2012 Pearson Education, Inc. Publishing as Prentice Hall
PAR
T I
I C
once
pts
and
Prob
lem
s in
Mac
roec
onom
ics
Calculating GDP
The Income Approach
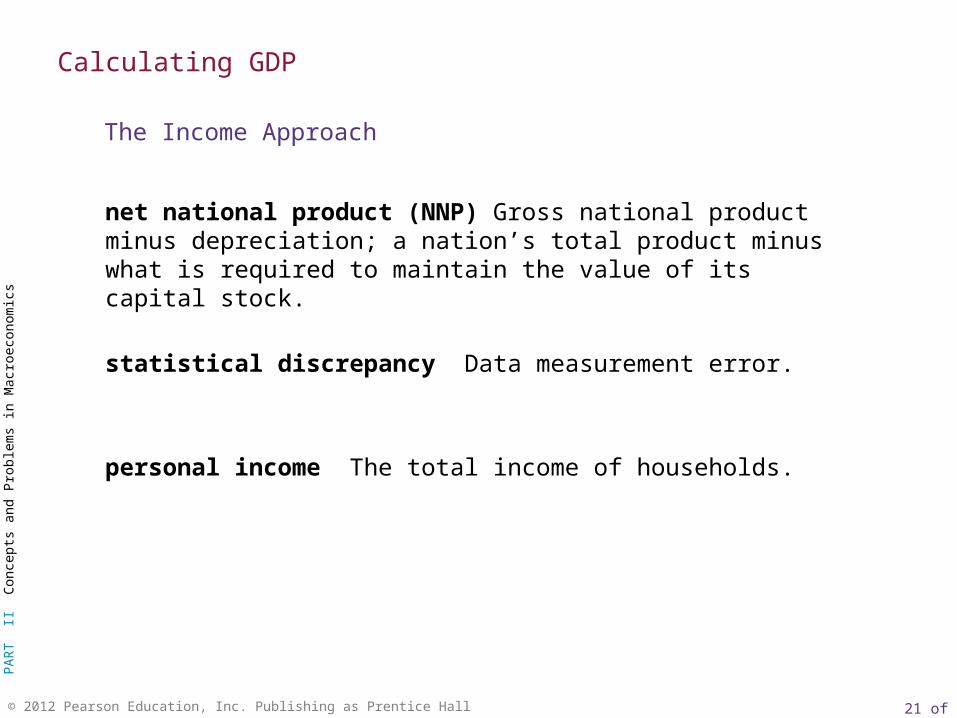
statistical discrepancy Data measurement error.
personal income The total income of households.
net national product (NNP) Gross national product minus depreciation; a nation’s total product minus what is required to maintain the value of its capital stock.

22 of 38© 2012 Pearson Education, Inc. Publishing as Prentice Hall
PAR
T I
I C
once
pts
and
Prob
lem
s in
Mac
roec
onom
ics
TABLE 6.4 GDP, GNP, NNP, and National Income, 2009
Dollars(Billions)
GDP 14,256.3Plus: Receipts of factor income from the rest of the world +589.4
Less: Payments of factor income to the rest of the world 484.5Equals: GNP 14,361.2
Less: Depreciation 1,864.0Equals: Net national product (NNP) 12,497.2
Less: Statistical discrepancy 217.3Equals: National income 12,280.0
Calculating GDP
The Income Approach
23 of 38© 2012 Pearson Education, Inc. Publishing as Prentice Hall
PAR
T I
I C
once
pts
and
Prob
lem
s in
Mac
roec
onom
ics
Calculating GDP
The Income Approach
disposable personal income or after-tax income Personal income minus personal income taxes. The amount that households have to spend or save.
personal saving The amount of disposable income that is left after total personal spending in a given period.
personal saving rate The percentage of disposable personal income that is saved. If the personal saving rate is low, households are spending a large amount relative to their incomes; if it is high, households are spending cautiously.
24 of 38© 2012 Pearson Education, Inc. Publishing as Prentice Hall
PAR
T I
I C
once
pts
and
Prob
lem
s in
Mac
roec
onom
ics
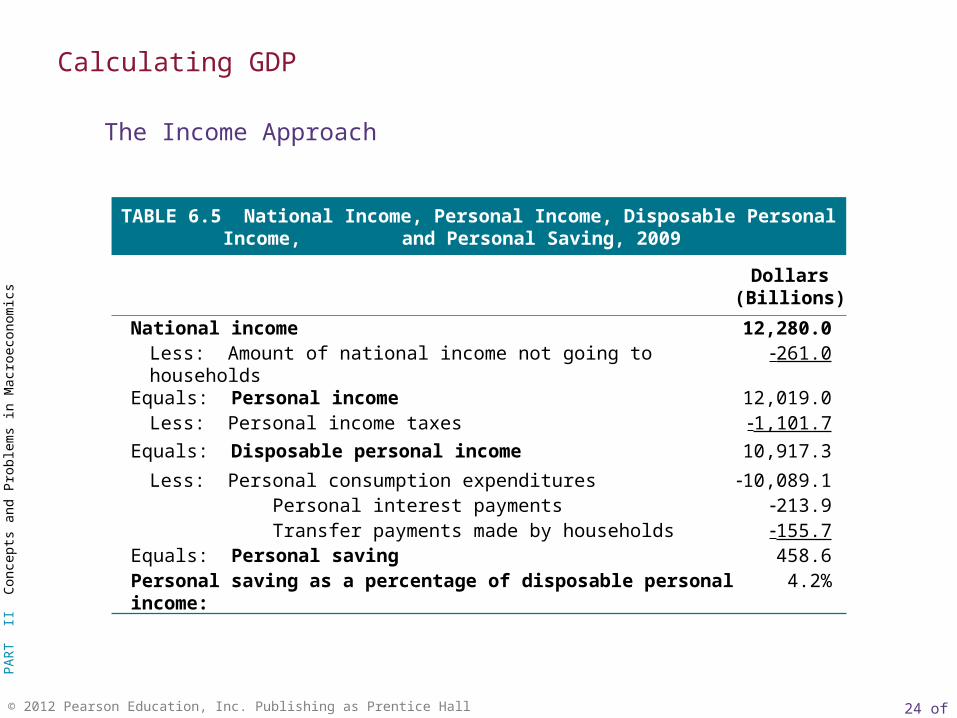
TABLE 6.5 National Income, Personal Income, Disposable Personal Income, and Personal Saving, 2009
Dollars(Billions)
National income 12,280.0Less: Amount of national income not going to households 261.0
Equals: Personal income 12,019.0Less: Personal income taxes 1,101.7
Equals: Disposable personal income 10,917.3
Less: Personal consumption expenditures 10,089.1 Personal interest payments 213.9 Transfer payments made by households 155.7
Equals: Personal saving 458.6Personal saving as a percentage of disposable personal income: 4.2%
Calculating GDP
The Income Approach
25 of 38© 2012 Pearson Education, Inc. Publishing as Prentice Hall
PAR
T I
I C
once
pts
and
Prob
lem
s in
Mac
roec
onom
ics
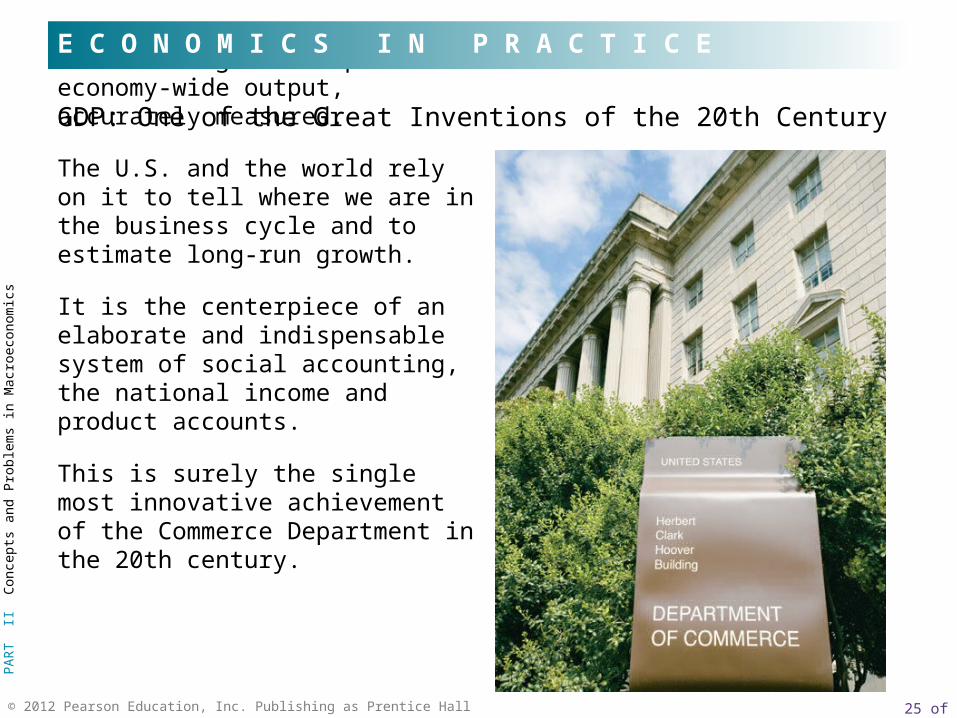
GDP! The right concept of economy-wide output, accurately measured.
The U.S. and the world rely on it to tell where we are in the business cycle and to estimate long-run growth.
It is the centerpiece of an elaborate and indispensable system of social accounting, the national income and product accounts.
This is surely the single most innovative achievement of the Commerce Department in the 20th century.
E C O N O M I C S I N P R A C T I C E
GDP: One of the Great Inventions of the 20th Century
26 of 38© 2012 Pearson Education, Inc. Publishing as Prentice Hall
PAR
T I
I C
once
pts
and
Prob
lem
s in
Mac
roec
onom
ics
current dollars The current prices that we pay for goods and services.
nominal GDP Gross domestic product measured in current dollars.
weight The importance attached to an item within a group of items.
Nominal versus Real GDP
27 of 38© 2012 Pearson Education, Inc. Publishing as Prentice Hall
PAR
T I
I C
once
pts
and
Prob
lem
s in
Mac
roec
onom
ics
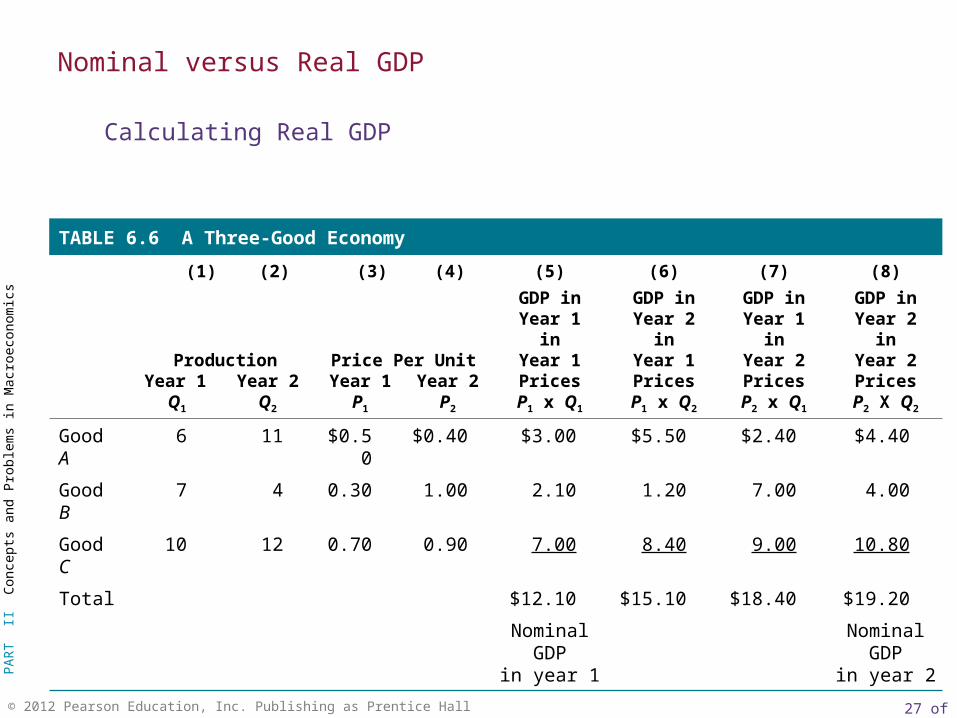
TABLE 6.6 A Three-Good Economy
(1) (2) (3) (4) (5) (6) (7) (8)
GDP in GDP in GDP in GDP inYear 1 Year 2 Year 1 Year 2
in in in inProduction Price Per Unit Year 1 Year 1 Year 2 Year 2
Year 1 Year 2 Year 1 Year 2 Prices Prices Prices PricesQ1 Q2 P1 P2 P1 x Q1 P1 x Q2 P2 x Q1 P2 X Q2
Good A 6 11 $0.50
$0.40 $3.00 $5.50 $2.40 $4.40
Good B 7 4 0.30 1.00 2.10 1.20 7.00 4.00
Good C 10 12 0.70 0.90 7.00 8.40 9.00 10.80
Total $12.10 $15.10 $18.40 $19.20
Nominal GDPin year 1
NominalGDP
in year 2
Nominal versus Real GDP
Calculating Real GDP
28 of 38© 2012 Pearson Education, Inc. Publishing as Prentice Hall
PAR
T I
I C
once
pts
and
Prob
lem
s in
Mac
roec
onom
ics
base year The year chosen for the weights in a fixed-weight procedure.
fixed-weight procedure A procedure that uses weights from a given base year.
Nominal versus Real GDP
Calculating Real GDP
29 of 38© 2012 Pearson Education, Inc. Publishing as Prentice Hall
PAR
T I
I C
once
pts
and
Prob
lem
s in
Mac
roec
onom
ics
Policy makers not only need good measures of how real output is changing but also good measures of how the overall price level is changing.
The GDP deflator is one measure of the overall price level.
Nominal versus Real GDP
Calculating the GDP Deflator

30 of 38© 2012 Pearson Education, Inc. Publishing as Prentice Hall
PAR
T I
I C
once
pts
and
Prob
lem
s in
Mac
roec
onom
ics
Many structural changes have taken place in the U.S. economy in the last 40 to 50 years.
The use of fixed-price weights does not account for the responses in the economy to supply shifts.
The fixed-weight procedure ignores the substitution away from goods whose prices are increasing and toward goods whose prices are decreasing or increasing less rapidly.
Nominal versus Real GDP
The Problems of Fixed Weights

31 of 38© 2012 Pearson Education, Inc. Publishing as Prentice Hall
PAR
T I
I C
once
pts
and
Prob
lem
s in
Mac
roec
onom
ics
If crime levels went down, society would be better off, but a decrease in crime is not an increase in output and is not reflected in GDP.
An increase in leisure is also an increase in social welfare, sometimes associated with a decrease in GDP.
Most nonmarket and domestic activities, such as housework and child care, are not counted in GDP even though they amount to real production.
GDP also has nothing to say about the distribution of output among individuals in a society.
Limitations of the GDP Concept
GDP and Social Welfare
32 of 38© 2012 Pearson Education, Inc. Publishing as Prentice Hall
PAR
T I
I C
once
pts
and
Prob
lem
s in
Mac
roec
onom
ics
underground economy The part of the economy in which transactions take place and in which income is generated that is unreported and therefore not counted in GDP.
Limitations of the GDP Concept
The Underground Economy
33 of 38© 2012 Pearson Education, Inc. Publishing as Prentice Hall
PAR
T I
I C
once
pts
and
Prob
lem
s in
Mac
roec
onom
ics
gross national income (GNI) GNP converted into dollars using an average of currency exchange rates over several years adjusted for rates of inflation.
Limitations of the GDP Concept
Gross National Income per Capita
34 of 38© 2012 Pearson Education, Inc. Publishing as Prentice Hall
PAR
T I
I C
once
pts
and
Prob
lem
s in
Mac
roec
onom
ics
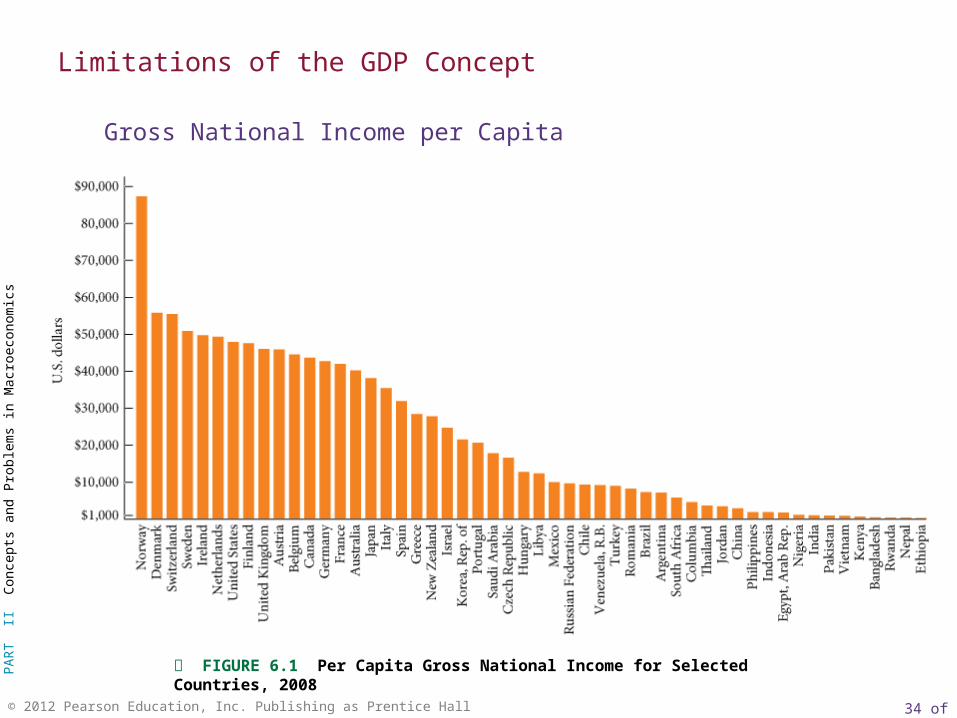
FIGURE 6.1 Per Capita Gross National Income for Selected Countries, 2008
Limitations of the GDP Concept
Gross National Income per Capita
35 of 38© 2012 Pearson Education, Inc. Publishing as Prentice Hall
PAR
T I
I C
once
pts
and
Prob
lem
s in
Mac
roec
onom
ics
Looking Ahead
This chapter has introduced many key variables in which macroeconomists are interested, including GDP and its components.
There is much more to be learned about the data that macroeconomists use.
In the next chapter, we will discuss the data on employment, unemployment, and the labor force.
In later chapters, we will discuss the data on money and interest rates.
Finally, we will discuss in more detail the data on the relationship between the United States and the rest of the world.
36 of 38© 2012 Pearson Education, Inc. Publishing as Prentice Hall
PAR
T I
I C
once
pts
and
Prob
lem
s in
Mac
roec
onom
ics
base year
change in business inventories
compensation of employees
corporate profits
current dollars
depreciation
disposable personal income, or after-tax income
durable goods
expenditure approach
final goods and services
fixed-weight procedure
government consumption and gross investment (G)
R E V I E W T E R M S A N D C O N C E P T S
gross domestic product (GDP)
gross investment
gross national income (GNI)
gross national product (GNP)
gross private domestic investment (I)
income approach
indirect taxes minus subsidies
intermediate goods
national income
national income and product accounts
net business transfer payments
37 of 38© 2012 Pearson Education, Inc. Publishing as Prentice Hall
PAR
T I
I C
once
pts
and
Prob
lem
s in
Mac
roec
onom
ics
net exports (EX - IM)
net interest
net investment
net national product (NNP)
nominal GDP
nondurable goods
nonresidential investment
personal consumption expenditures (C)
personal income
personal saving
personal saving rate
proprietors’ income
R E V I E W T E R M S A N D C O N C E P T S
rental income
residential investment
services
statistical discrepancy
surplus of government enterprises
underground economy
value added
weight
Expenditure approach to GDP: GDP = C + I + G + (EX IM)
GDP = Final sales + Change in business inventories
Net investment = Capital end of period Capital beginning of period