Embed Size (px)
Citation preview
1/27/2018
1
1
13Design and Analysis of Single-Factor Experiments:The Analysis of Variance
13-1 Designing Engineering Experiments
13-2 Completely Randomized Single-Factor Experiments
13-2.1 Example: Tensile strength13-2.2 Analysis of variance13-2.3 Multiple comparisons following
the ANOVA13-2.4 Residual analysis & model
checking
13-3 The Random-Effects Model13-3.1 Fixed versus random factors13-3.2 ANOVA & variance components
13-4 Randomized Complete Block Design
13-4.1 Design & statistical analysis13-4.2 Multiple comparisons13-4.3 Residual analysis & model
checking
CHAPTER OUTLINE
© John Wiley & Sons, Inc. Applied Statistics and Probability for Engineers, by Montgomery and Runger.
Learning Objectives for Chapter 13
After careful study of this chapter, you should be able to do the following:
1. Design and conduct engineering experiments involving a single factor with an arbitrary number of levels.
2. Understand how the analysis of variance is used to analyze the data from these experiments.
3. Assess model adequacy with residual plots.
4. Use multiple comparison procedures to identify specific differences between means.
5. Make decisions about sample size in single-factor experiments.
6. Understand the difference between fixed and random factors.
7. Estimate variance components in an experiment involving random factors.
8. Understand the blocking principle and how it is used to isolate the effect of nuisance factors.
9. Design and conduct experiments involving the randomized complete block design.
2
1/27/2018
2
© John Wiley & Sons, Inc. Applied Statistics and Probability for Engineers, by Montgomery and Runger.
13-1: Designing Engineering Experiments
Every experiment involves a sequence of activities:
1. Conjecture – the original hypothesis that motivates the
experiment.
2. Experiment – the test performed to investigate the
conjecture.
3. Analysis – the statistical analysis of the data from the
experiment.
4. Conclusion – what has been learned about the original
conjecture from the experiment. Often the experiment will
lead to a revised conjecture, and a new experiment, and so
forth.
3
© John Wiley & Sons, Inc. Applied Statistics and Probability for Engineers, by Montgomery and Runger.
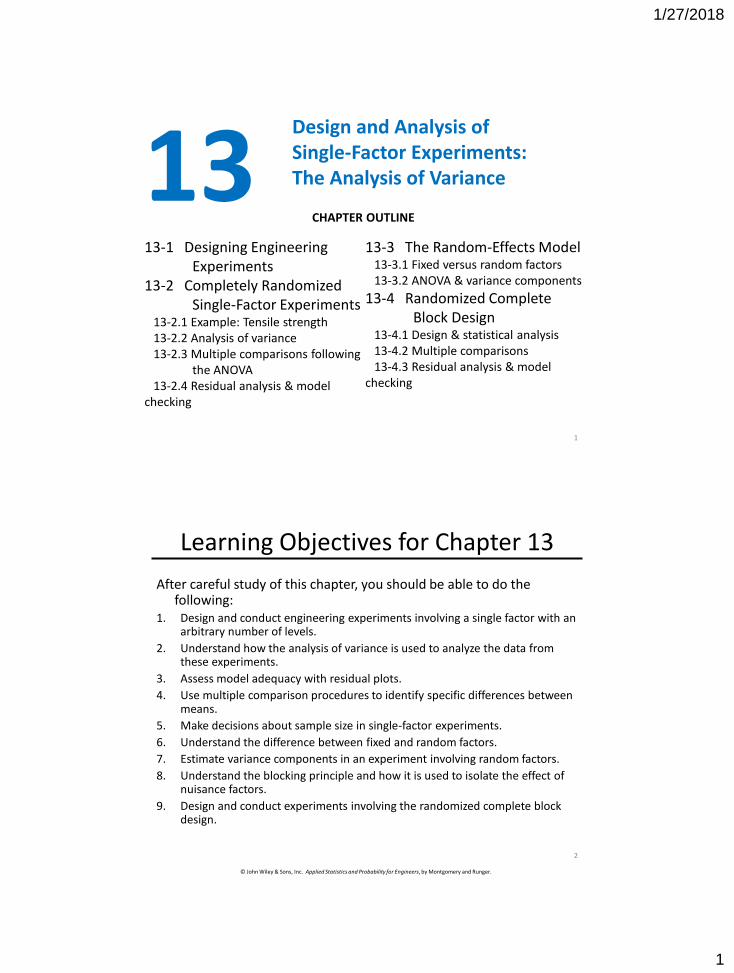
13-2: The Completely Randomized Single-Factor Experiment
13-2.1 An Example
4
1/27/2018
3
© John Wiley & Sons, Inc. Applied Statistics and Probability for Engineers, by Montgomery and Runger.
13-2: The Completely Randomized Single-Factor Experiment
13-2.1 An Example
5
© John Wiley & Sons, Inc. Applied Statistics and Probability for Engineers, by Montgomery and Runger.
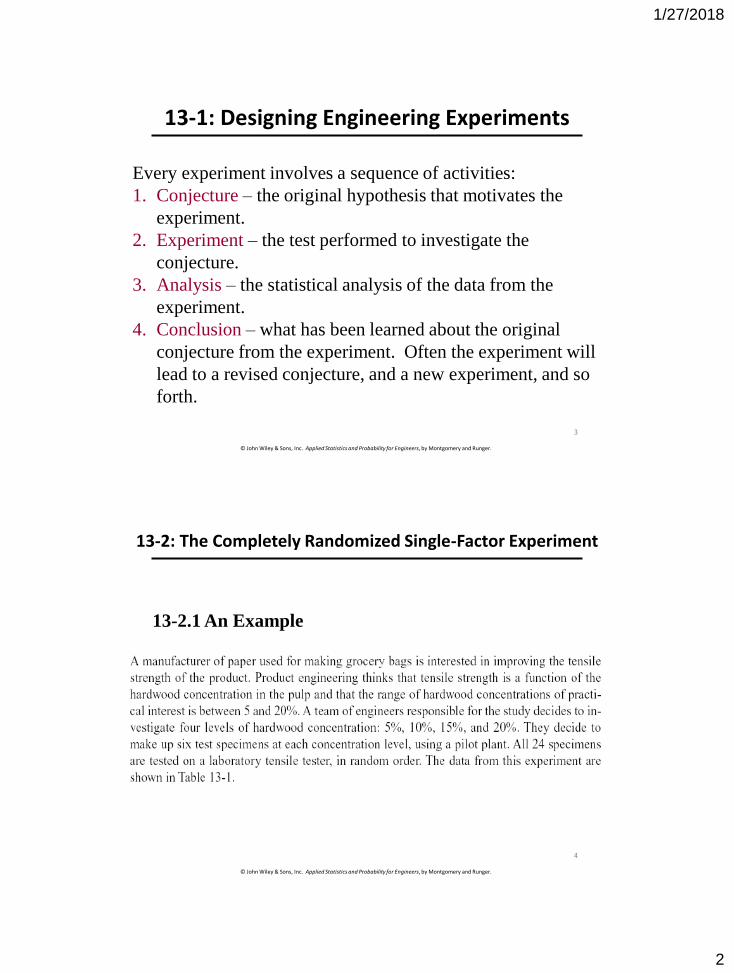
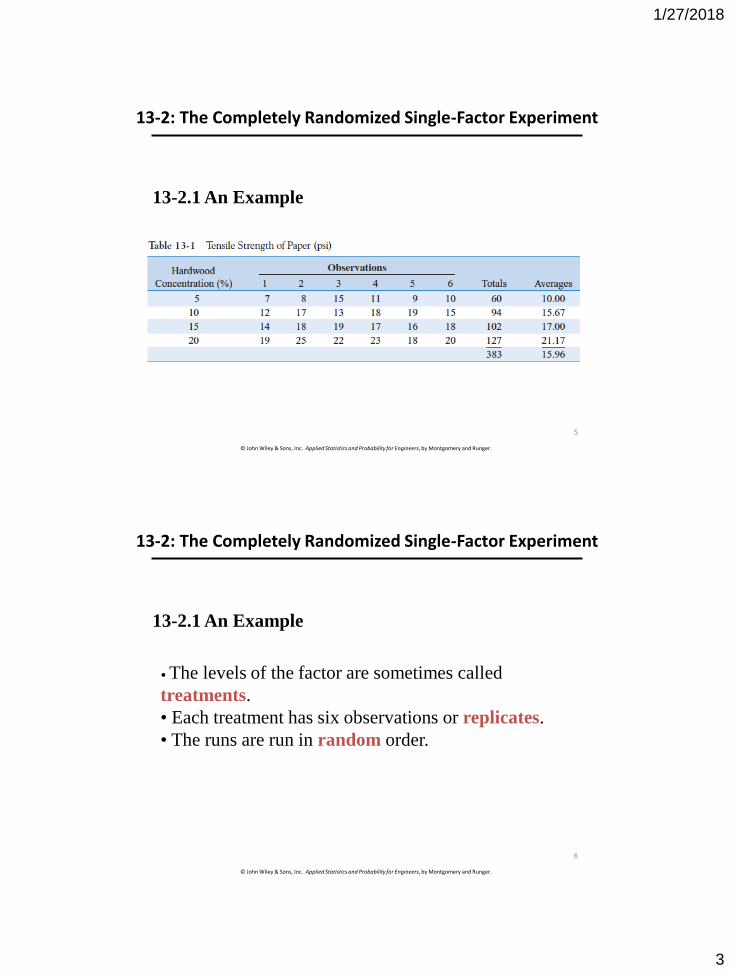
13-2: The Completely Randomized Single-Factor Experiment
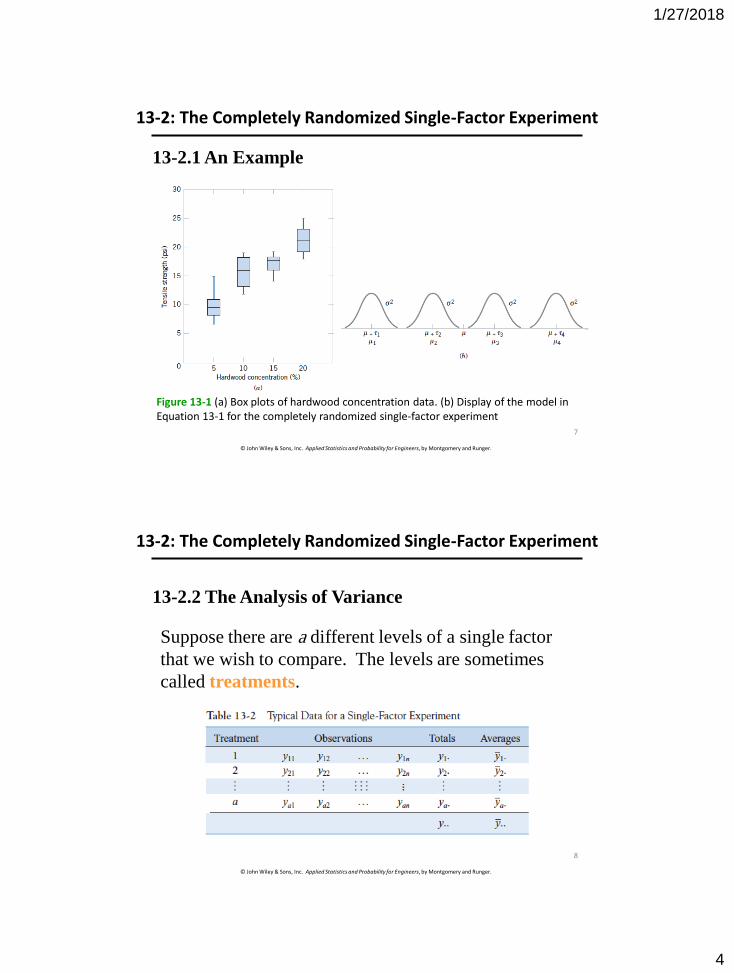
13-2.1 An Example
• The levels of the factor are sometimes called
treatments.
• Each treatment has six observations or replicates.
• The runs are run in random order.
6
1/27/2018
4
© John Wiley & Sons, Inc. Applied Statistics and Probability for Engineers, by Montgomery and Runger.
13-2: The Completely Randomized Single-Factor Experiment
Figure 13-1 (a) Box plots of hardwood concentration data. (b) Display of the model in Equation 13-1 for the completely randomized single-factor experiment
13-2.1 An Example
7
© John Wiley & Sons, Inc. Applied Statistics and Probability for Engineers, by Montgomery and Runger.
13-2: The Completely Randomized Single-Factor Experiment
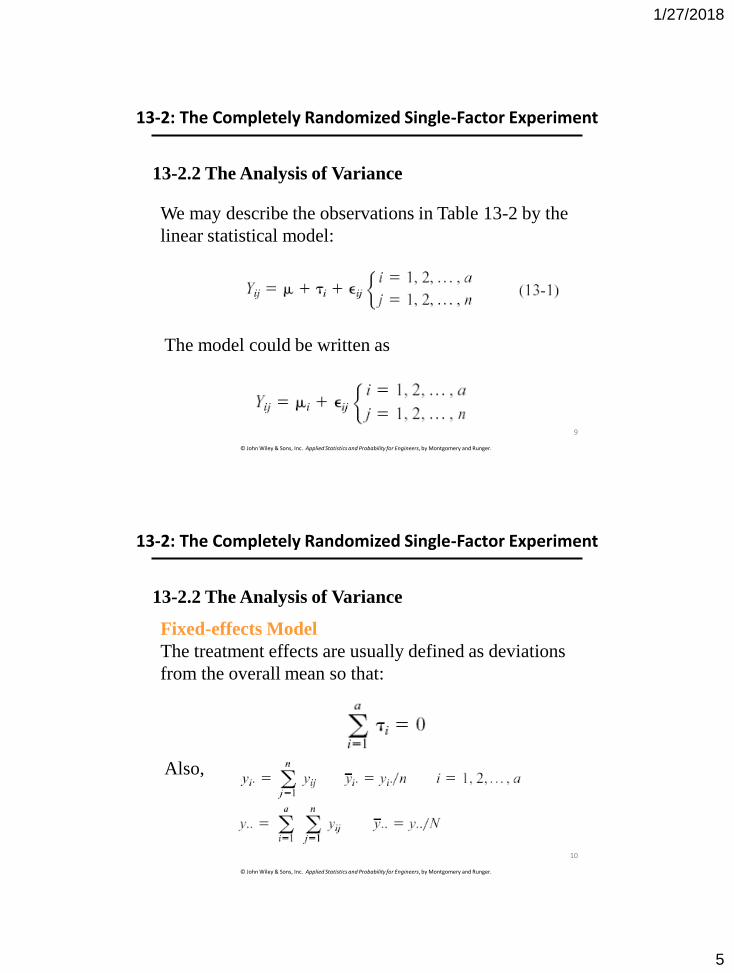
13-2.2 The Analysis of Variance
Suppose there are a different levels of a single factor
that we wish to compare. The levels are sometimes
called treatments.
8
1/27/2018
5
© John Wiley & Sons, Inc. Applied Statistics and Probability for Engineers, by Montgomery and Runger.
13-2: The Completely Randomized Single-Factor Experiment
13-2.2 The Analysis of Variance
We may describe the observations in Table 13-2 by the
linear statistical model:
The model could be written as
9
© John Wiley & Sons, Inc. Applied Statistics and Probability for Engineers, by Montgomery and Runger.
13-2: The Completely Randomized Single-Factor Experiment
13-2.2 The Analysis of Variance
Fixed-effects Model
The treatment effects are usually defined as deviations
from the overall mean so that:
Also,
10
1/27/2018
6
© John Wiley & Sons, Inc. Applied Statistics and Probability for Engineers, by Montgomery and Runger.
13-2: The Completely Randomized Single-Factor Experiment
13-2.2 The Analysis of Variance
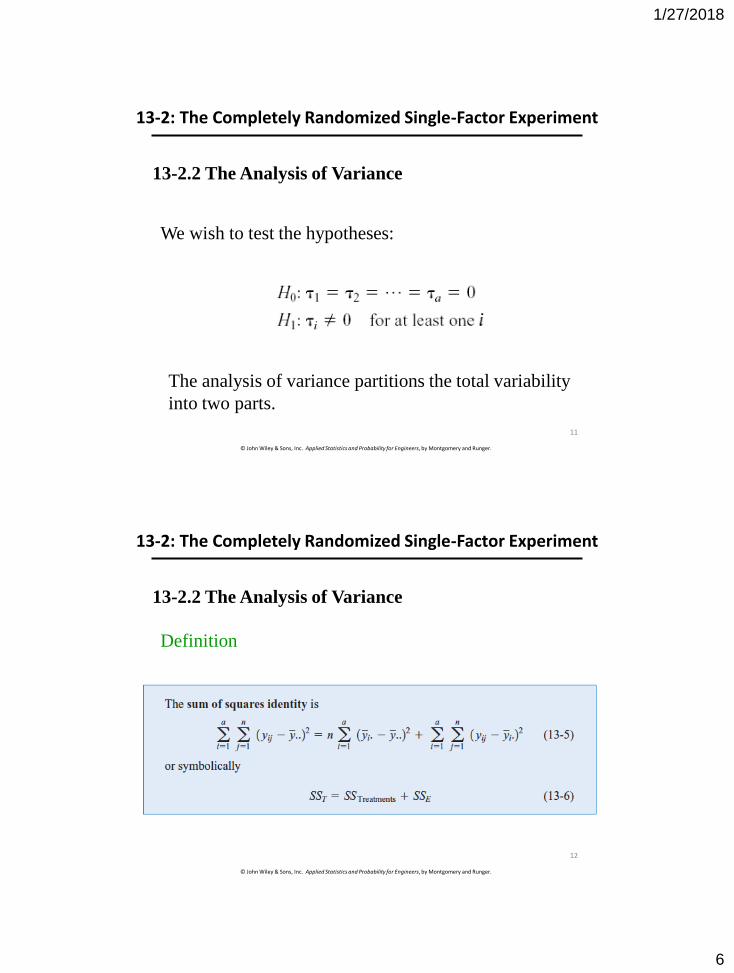
We wish to test the hypotheses:
The analysis of variance partitions the total variability
into two parts.
11
© John Wiley & Sons, Inc. Applied Statistics and Probability for Engineers, by Montgomery and Runger.
13-2: The Completely Randomized Single-Factor Experiment
13-2.2 The Analysis of Variance
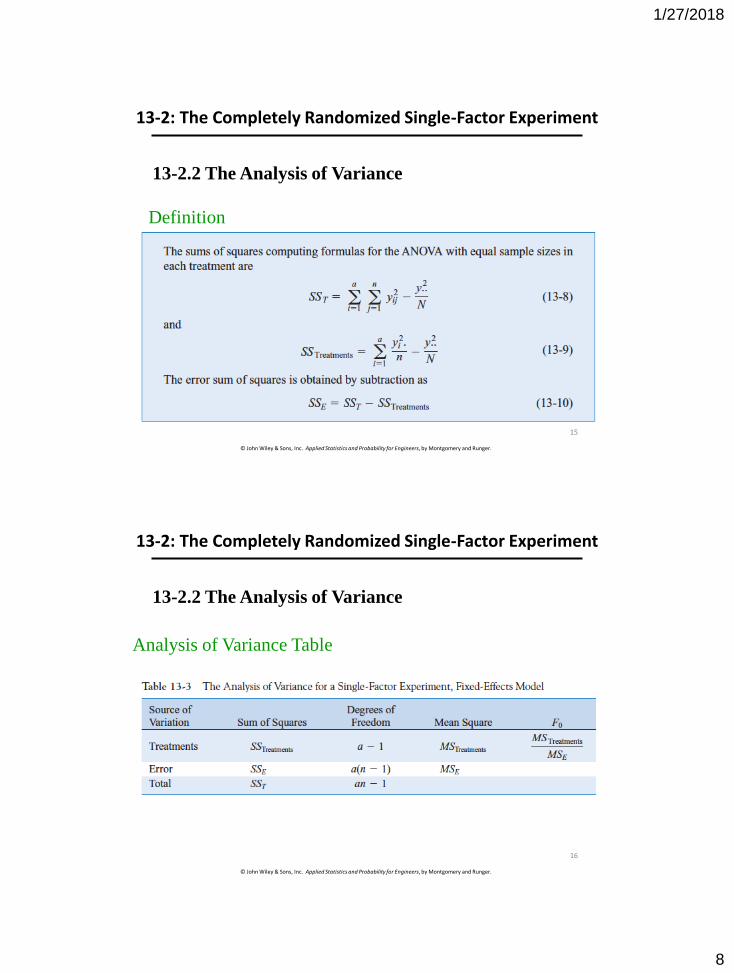
Definition
12
1/27/2018
7
© John Wiley & Sons, Inc. Applied Statistics and Probability for Engineers, by Montgomery and Runger.
13-2: The Completely Randomized Single-Factor Experiment
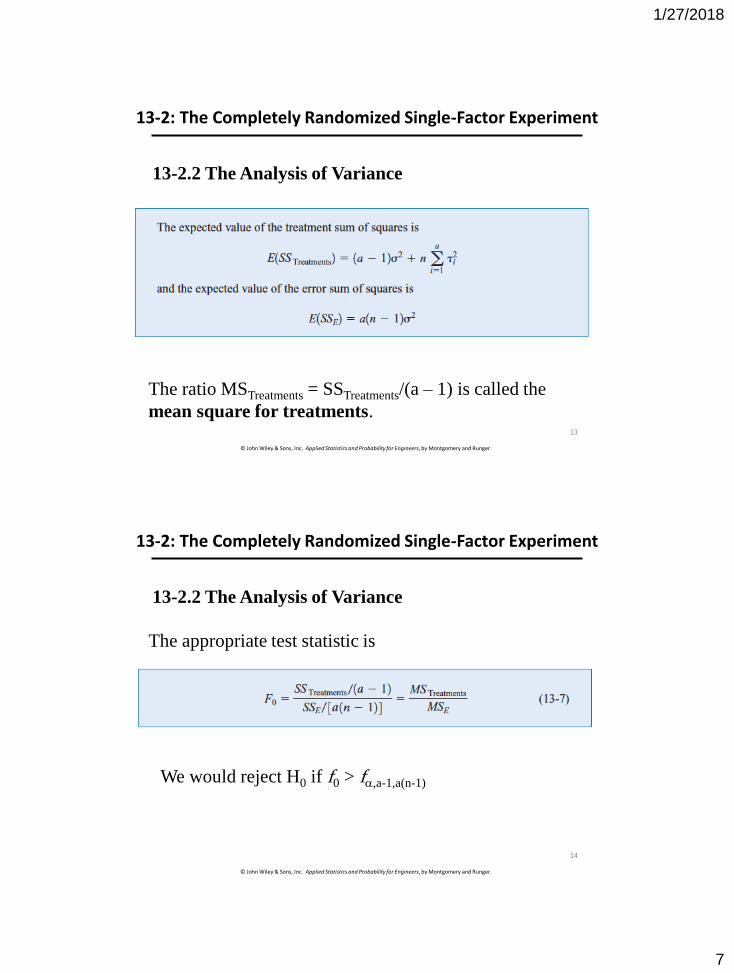
13-2.2 The Analysis of Variance
The ratio MSTreatments = SSTreatments/(a – 1) is called the
mean square for treatments.13
© John Wiley & Sons, Inc. Applied Statistics and Probability for Engineers, by Montgomery and Runger.
13-2: The Completely Randomized Single-Factor Experiment
13-2.2 The Analysis of Variance
The appropriate test statistic is
We would reject H0 if f0 > f,a-1,a(n-1)
14
1/27/2018
8
© John Wiley & Sons, Inc. Applied Statistics and Probability for Engineers, by Montgomery and Runger.
13-2: The Completely Randomized Single-Factor Experiment
13-2.2 The Analysis of Variance
Definition
15
© John Wiley & Sons, Inc. Applied Statistics and Probability for Engineers, by Montgomery and Runger.
13-2: The Completely Randomized Single-Factor Experiment
13-2.2 The Analysis of Variance
Analysis of Variance Table
16
1/27/2018
9
© John Wiley & Sons, Inc. Applied Statistics and Probability for Engineers, by Montgomery and Runger.
13-2: The Completely Randomized Single-Factor Experiment
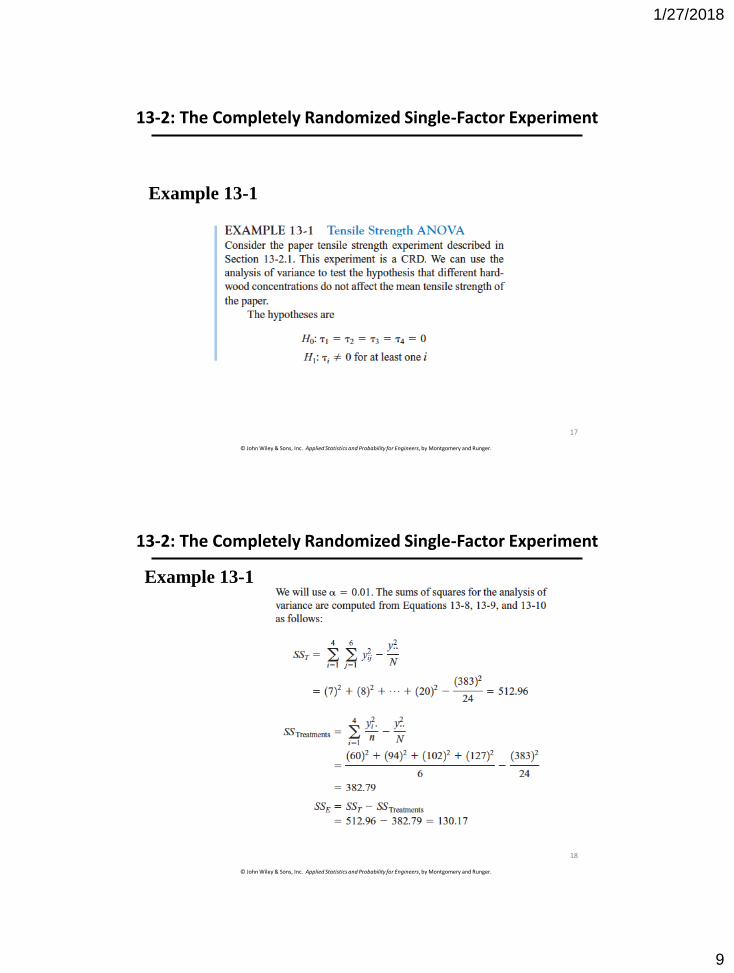
Example 13-1
17
© John Wiley & Sons, Inc. Applied Statistics and Probability for Engineers, by Montgomery and Runger.
13-2: The Completely Randomized Single-Factor Experiment
Example 13-1
18
1/27/2018
10
© John Wiley & Sons, Inc. Applied Statistics and Probability for Engineers, by Montgomery and Runger.
13-2: The Completely Randomized Single-Factor Experiment
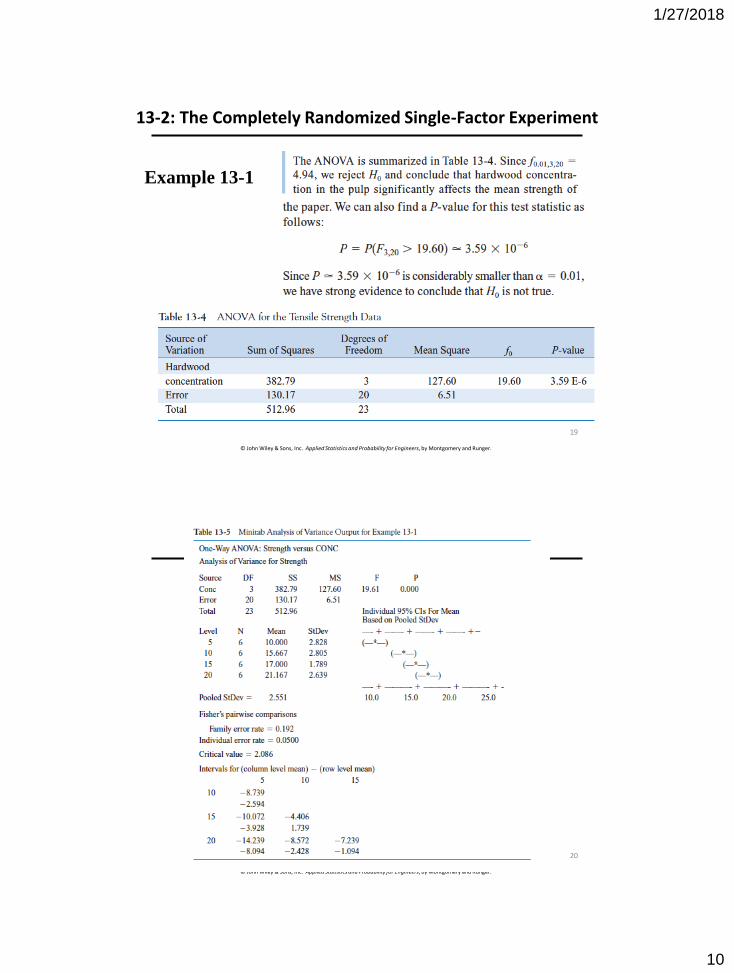
Example 13-1
19
© John Wiley & Sons, Inc. Applied Statistics and Probability for Engineers, by Montgomery and Runger.
20
1/27/2018
11
© John Wiley & Sons, Inc. Applied Statistics and Probability for Engineers, by Montgomery and Runger.
13-2: The Completely Randomized Single-Factor Experiment
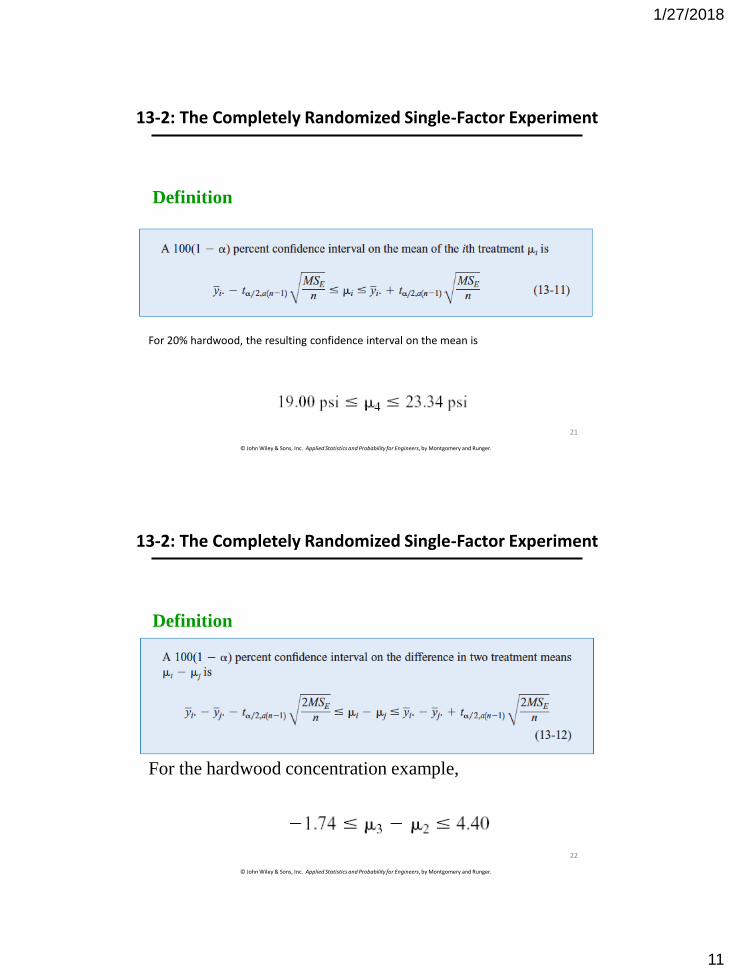
Definition
For 20% hardwood, the resulting confidence interval on the mean is
21
© John Wiley & Sons, Inc. Applied Statistics and Probability for Engineers, by Montgomery and Runger.
13-2: The Completely Randomized Single-Factor Experiment
Definition
For the hardwood concentration example,
22
1/27/2018
12
© John Wiley & Sons, Inc. Applied Statistics and Probability for Engineers, by Montgomery and Runger.
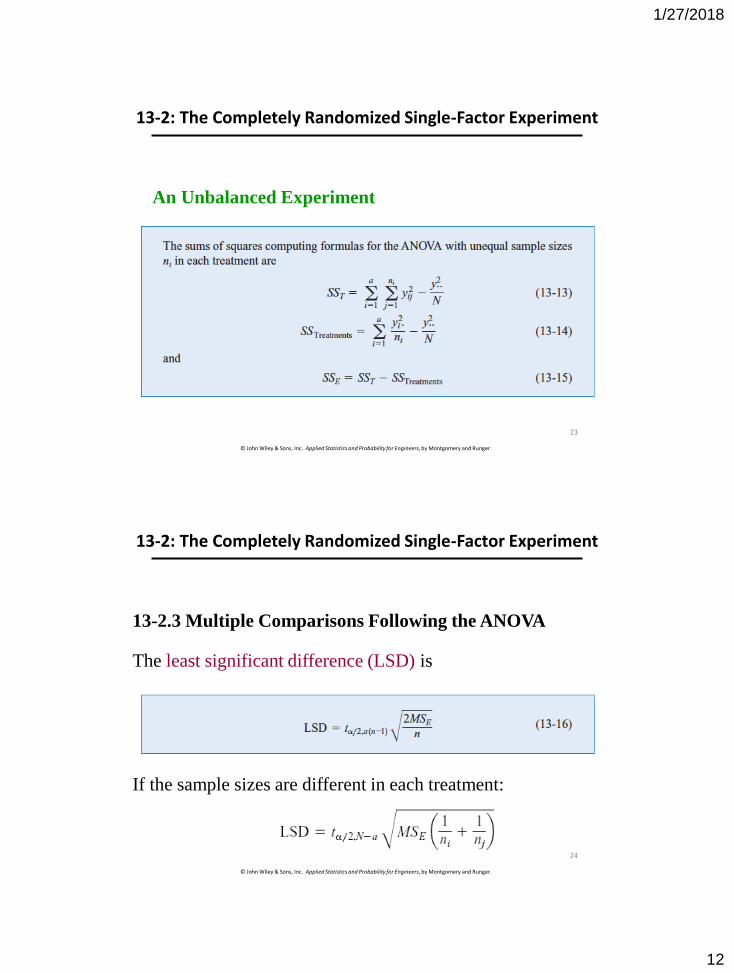
13-2: The Completely Randomized Single-Factor Experiment
An Unbalanced Experiment
23
© John Wiley & Sons, Inc. Applied Statistics and Probability for Engineers, by Montgomery and Runger.
13-2: The Completely Randomized Single-Factor Experiment
13-2.3 Multiple Comparisons Following the ANOVA
The least significant difference (LSD) is
If the sample sizes are different in each treatment:
24
1/27/2018
13
© John Wiley & Sons, Inc. Applied Statistics and Probability for Engineers, by Montgomery and Runger.
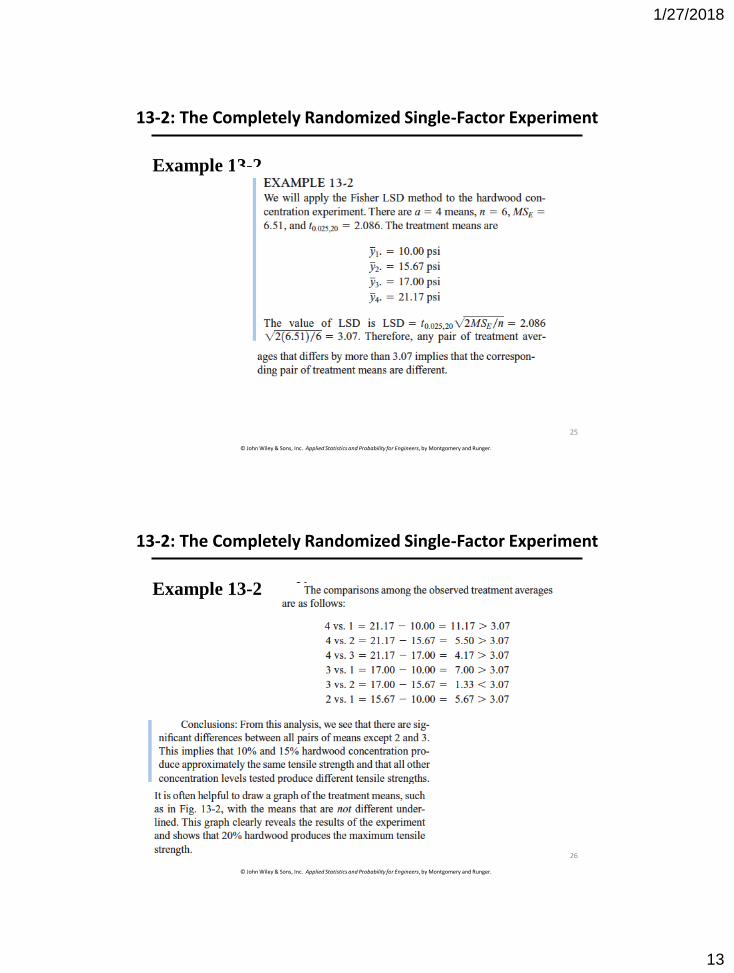
13-2: The Completely Randomized Single-Factor Experiment
Example 13-2
25
© John Wiley & Sons, Inc. Applied Statistics and Probability for Engineers, by Montgomery and Runger.
13-2: The Completely Randomized Single-Factor Experiment
Example 13-2
26
1/27/2018
14
© John Wiley & Sons, Inc. Applied Statistics and Probability for Engineers, by Montgomery and Runger.
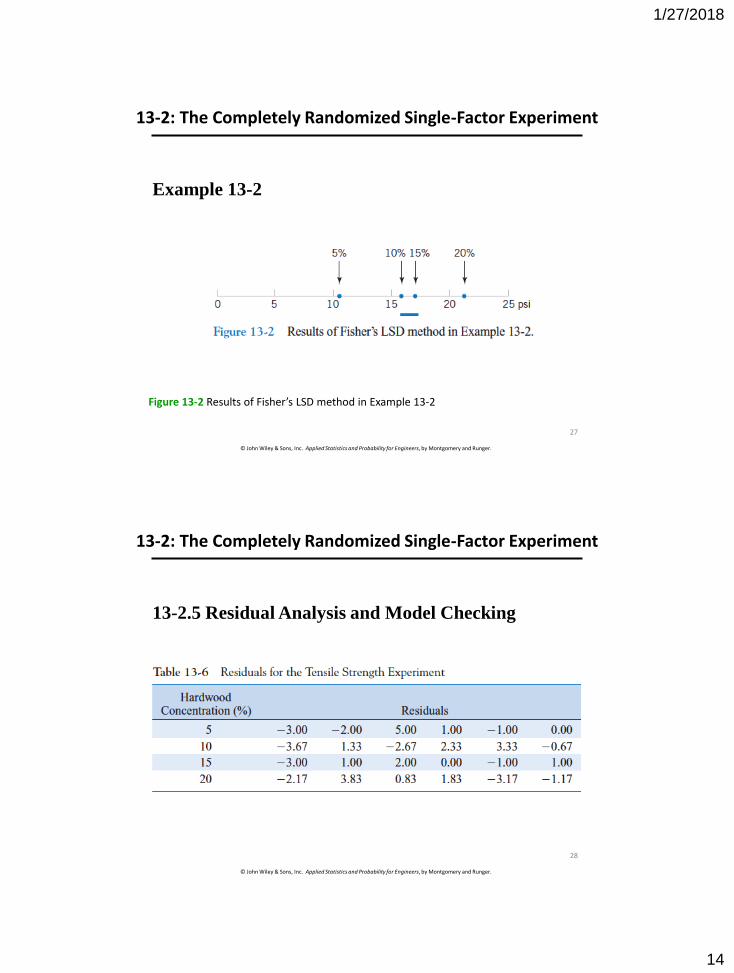
13-2: The Completely Randomized Single-Factor Experiment
Example 13-2
Figure 13-2 Results of Fisher’s LSD method in Example 13-2
27
© John Wiley & Sons, Inc. Applied Statistics and Probability for Engineers, by Montgomery and Runger.
13-2: The Completely Randomized Single-Factor Experiment
13-2.5 Residual Analysis and Model Checking
28
1/27/2018
15
© John Wiley & Sons, Inc. Applied Statistics and Probability for Engineers, by Montgomery and Runger.
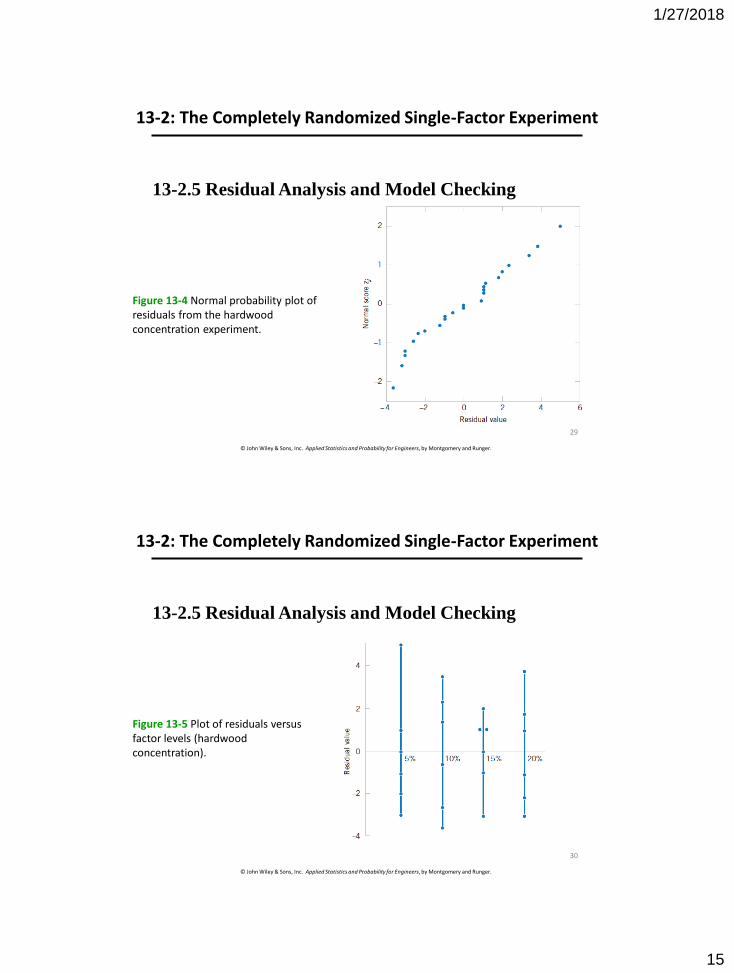
13-2: The Completely Randomized Single-Factor Experiment
13-2.5 Residual Analysis and Model Checking
Figure 13-4 Normal probability plot of residuals from the hardwood concentration experiment.
29
© John Wiley & Sons, Inc. Applied Statistics and Probability for Engineers, by Montgomery and Runger.
13-2: The Completely Randomized Single-Factor Experiment
13-2.5 Residual Analysis and Model Checking
Figure 13-5 Plot of residuals versus factor levels (hardwood concentration).
30
1/27/2018
16
© John Wiley & Sons, Inc. Applied Statistics and Probability for Engineers, by Montgomery and Runger.
13-2: The Completely Randomized Single-Factor Experiment
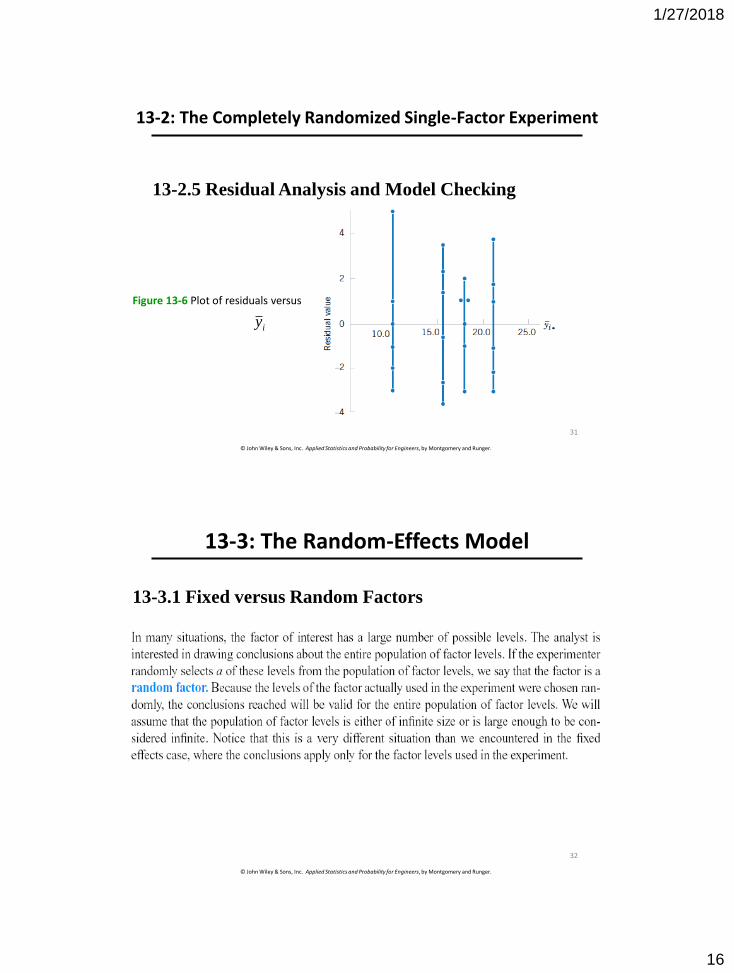
13-2.5 Residual Analysis and Model Checking
Figure 13-6 Plot of residuals versus
iy
31
© John Wiley & Sons, Inc. Applied Statistics and Probability for Engineers, by Montgomery and Runger.
13-3: The Random-Effects Model
13-3.1 Fixed versus Random Factors
32
1/27/2018
17
© John Wiley & Sons, Inc. Applied Statistics and Probability for Engineers, by Montgomery and Runger.
13-3: The Random-Effects Model
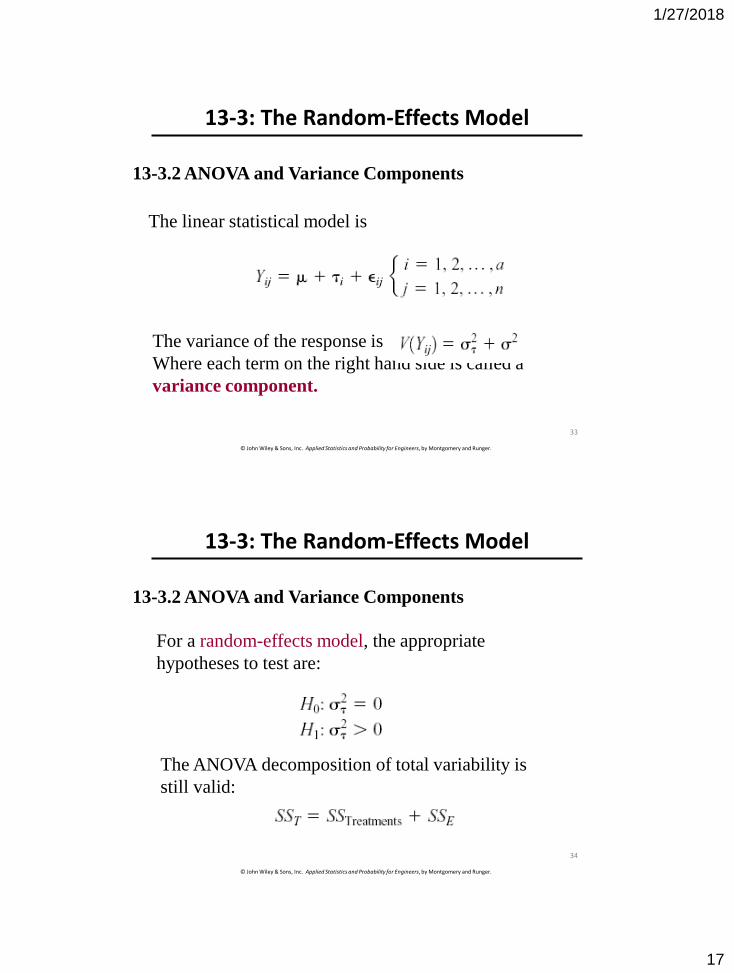
13-3.2 ANOVA and Variance Components
The linear statistical model is
The variance of the response is
Where each term on the right hand side is called a
variance component.
33
© John Wiley & Sons, Inc. Applied Statistics and Probability for Engineers, by Montgomery and Runger.
13-3: The Random-Effects Model
13-3.2 ANOVA and Variance Components
For a random-effects model, the appropriate
hypotheses to test are:
The ANOVA decomposition of total variability is
still valid:
34
1/27/2018
18
© John Wiley & Sons, Inc. Applied Statistics and Probability for Engineers, by Montgomery and Runger.
13-3: The Random-Effects Model
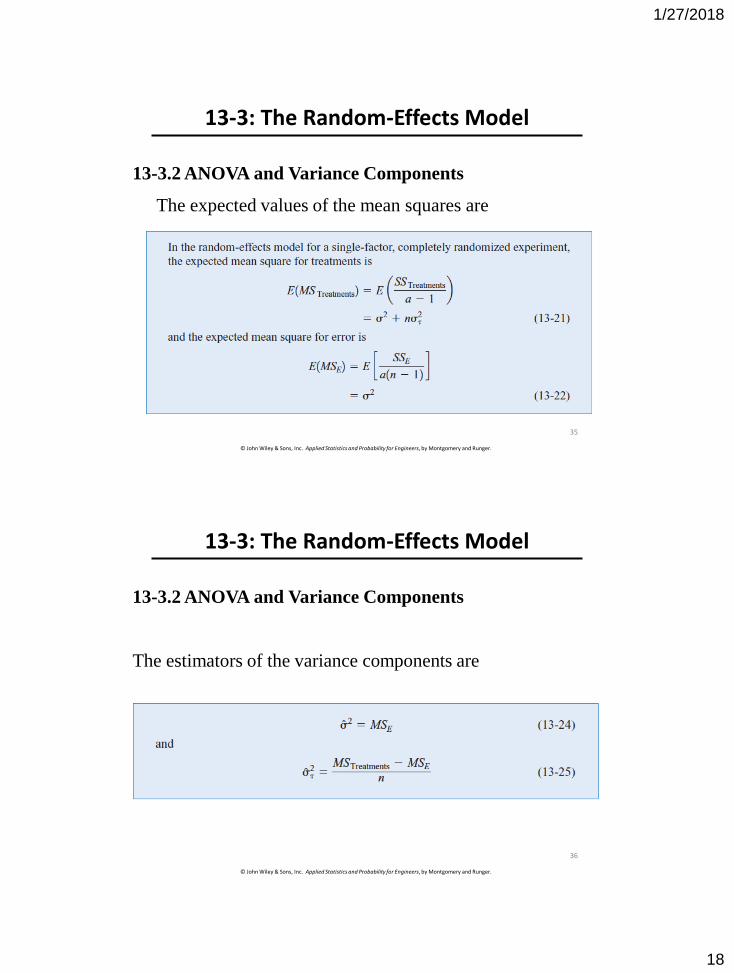
13-3.2 ANOVA and Variance Components
The expected values of the mean squares are
35
© John Wiley & Sons, Inc. Applied Statistics and Probability for Engineers, by Montgomery and Runger.
13-3: The Random-Effects Model
13-3.2 ANOVA and Variance Components
The estimators of the variance components are
36
1/27/2018
19
© John Wiley & Sons, Inc. Applied Statistics and Probability for Engineers, by Montgomery and Runger.
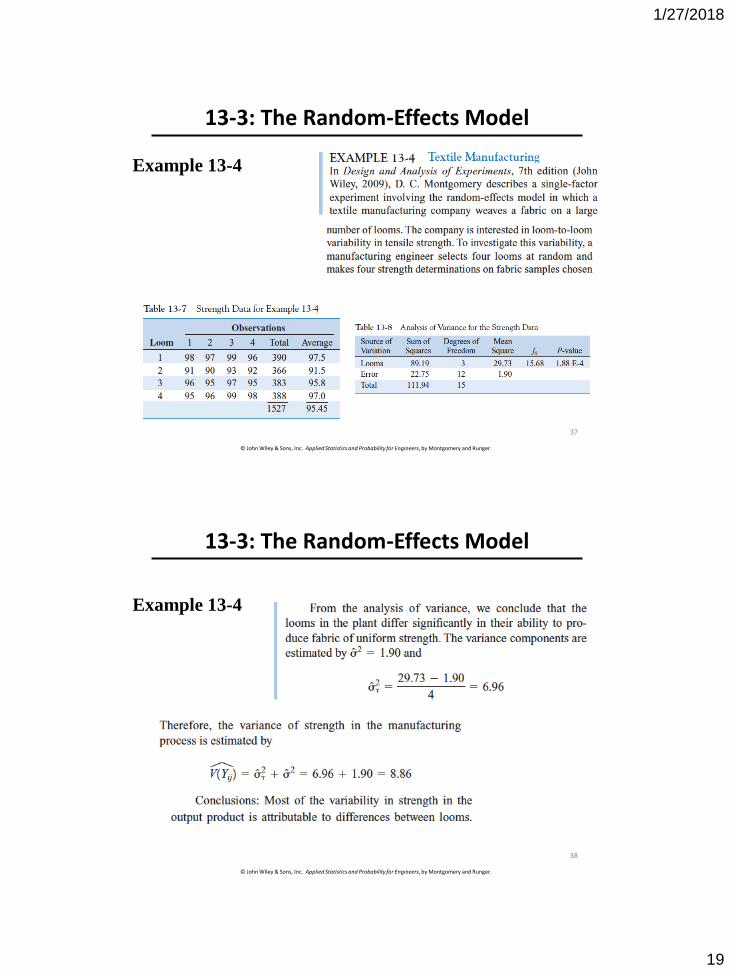
13-3: The Random-Effects Model
Example 13-4
37
© John Wiley & Sons, Inc. Applied Statistics and Probability for Engineers, by Montgomery and Runger.
13-3: The Random-Effects Model
Example 13-4
38
1/27/2018
20
© John Wiley & Sons, Inc. Applied Statistics and Probability for Engineers, by Montgomery and Runger.
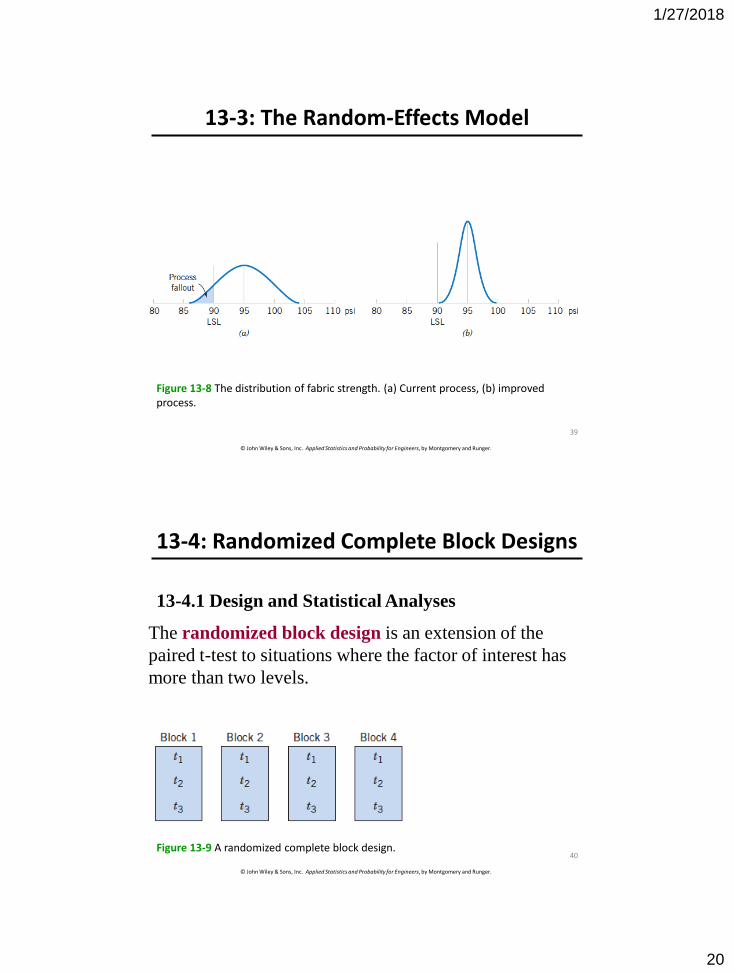
13-3: The Random-Effects Model
Figure 13-8 The distribution of fabric strength. (a) Current process, (b) improved process.
39
© John Wiley & Sons, Inc. Applied Statistics and Probability for Engineers, by Montgomery and Runger.
13-4: Randomized Complete Block Designs
13-4.1 Design and Statistical Analyses
The randomized block design is an extension of the
paired t-test to situations where the factor of interest has
more than two levels.
Figure 13-9 A randomized complete block design.40
1/27/2018
21
© John Wiley & Sons, Inc. Applied Statistics and Probability for Engineers, by Montgomery and Runger.
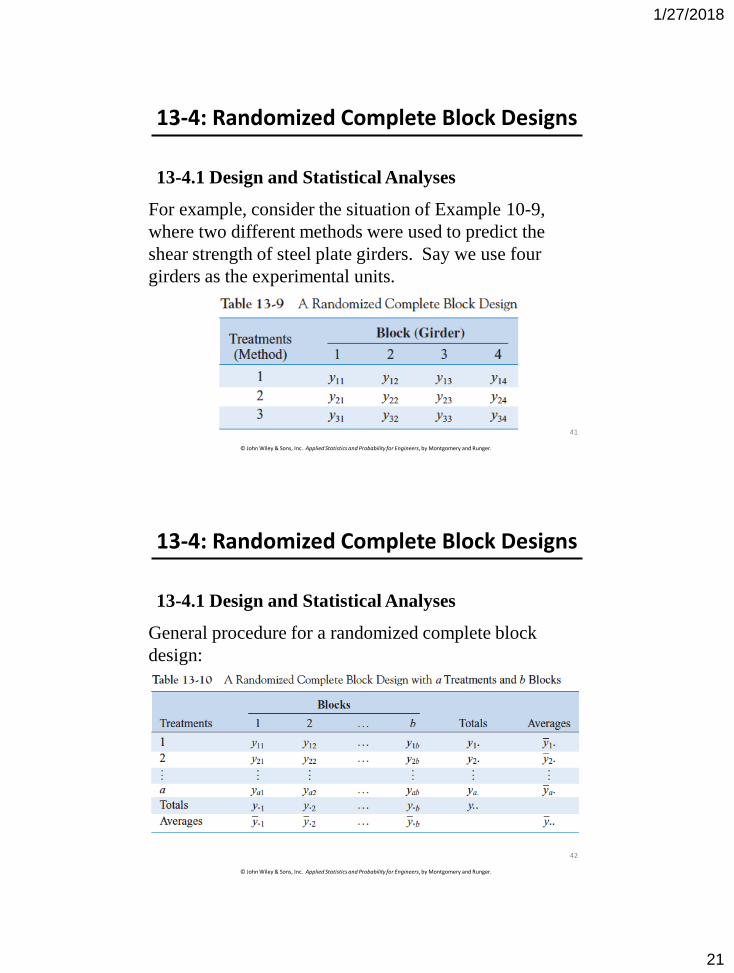
13-4: Randomized Complete Block Designs
13-4.1 Design and Statistical Analyses
For example, consider the situation of Example 10-9,
where two different methods were used to predict the
shear strength of steel plate girders. Say we use four
girders as the experimental units.
41
© John Wiley & Sons, Inc. Applied Statistics and Probability for Engineers, by Montgomery and Runger.
13-4: Randomized Complete Block Designs
13-4.1 Design and Statistical Analyses
General procedure for a randomized complete block
design:
42
1/27/2018
22
© John Wiley & Sons, Inc. Applied Statistics and Probability for Engineers, by Montgomery and Runger.
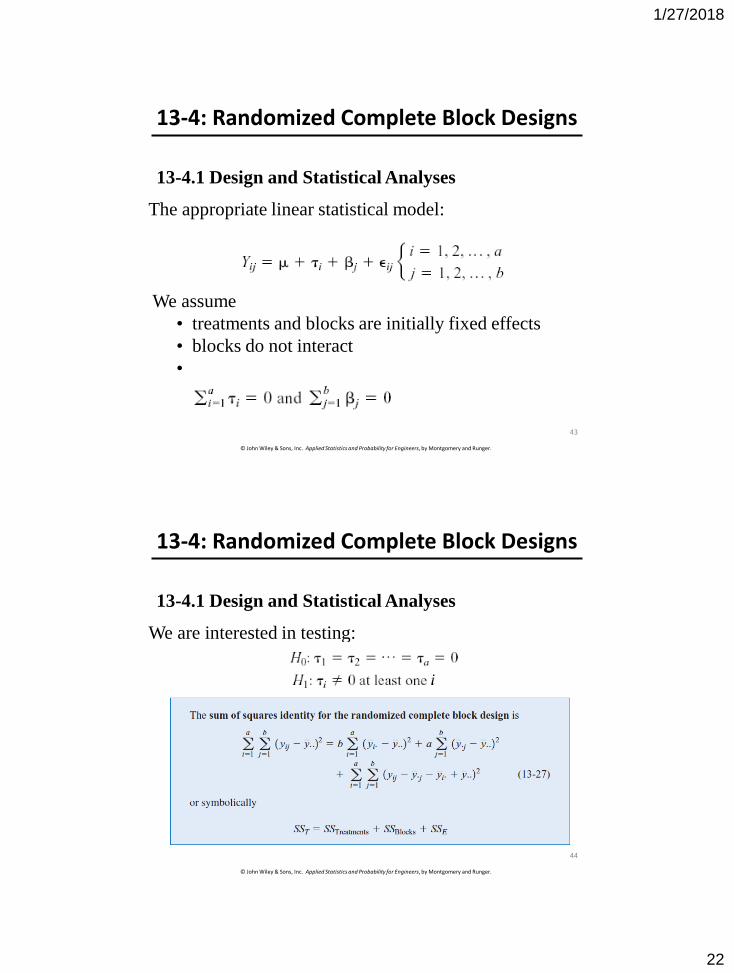
13-4: Randomized Complete Block Designs
13-4.1 Design and Statistical Analyses
The appropriate linear statistical model:
We assume
• treatments and blocks are initially fixed effects
• blocks do not interact
•
43
© John Wiley & Sons, Inc. Applied Statistics and Probability for Engineers, by Montgomery and Runger.
13-4: Randomized Complete Block Designs
13-4.1 Design and Statistical Analyses
We are interested in testing:
44
1/27/2018
23
© John Wiley & Sons, Inc. Applied Statistics and Probability for Engineers, by Montgomery and Runger.
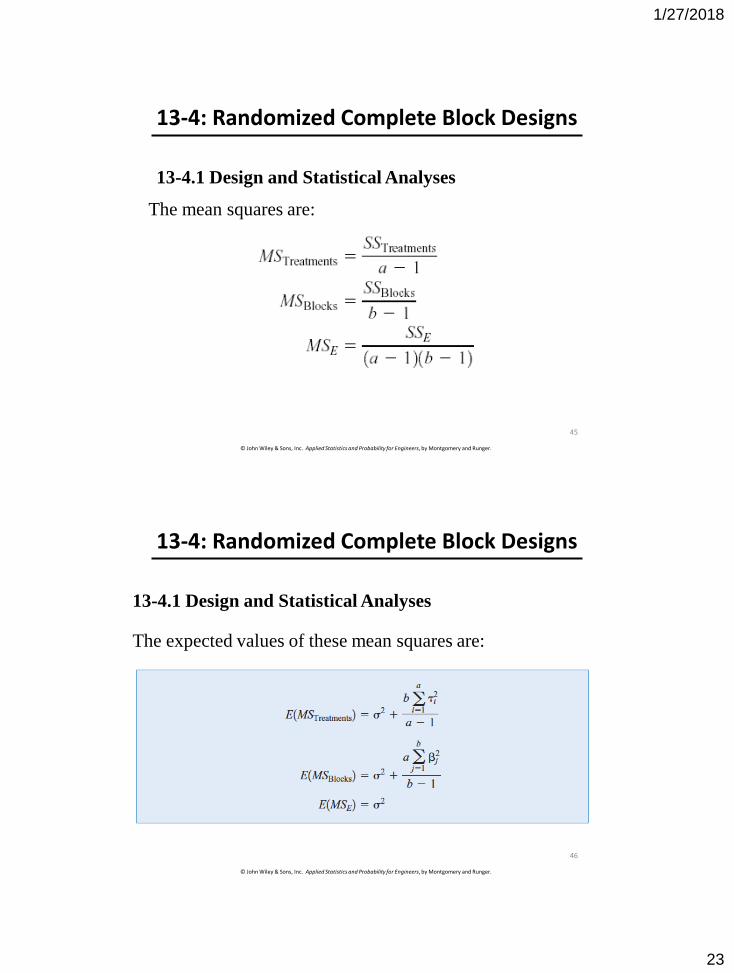
13-4: Randomized Complete Block Designs
13-4.1 Design and Statistical Analyses
The mean squares are:
45
© John Wiley & Sons, Inc. Applied Statistics and Probability for Engineers, by Montgomery and Runger.
13-4: Randomized Complete Block Designs
13-4.1 Design and Statistical Analyses
The expected values of these mean squares are:
46
1/27/2018
24
© John Wiley & Sons, Inc. Applied Statistics and Probability for Engineers, by Montgomery and Runger.
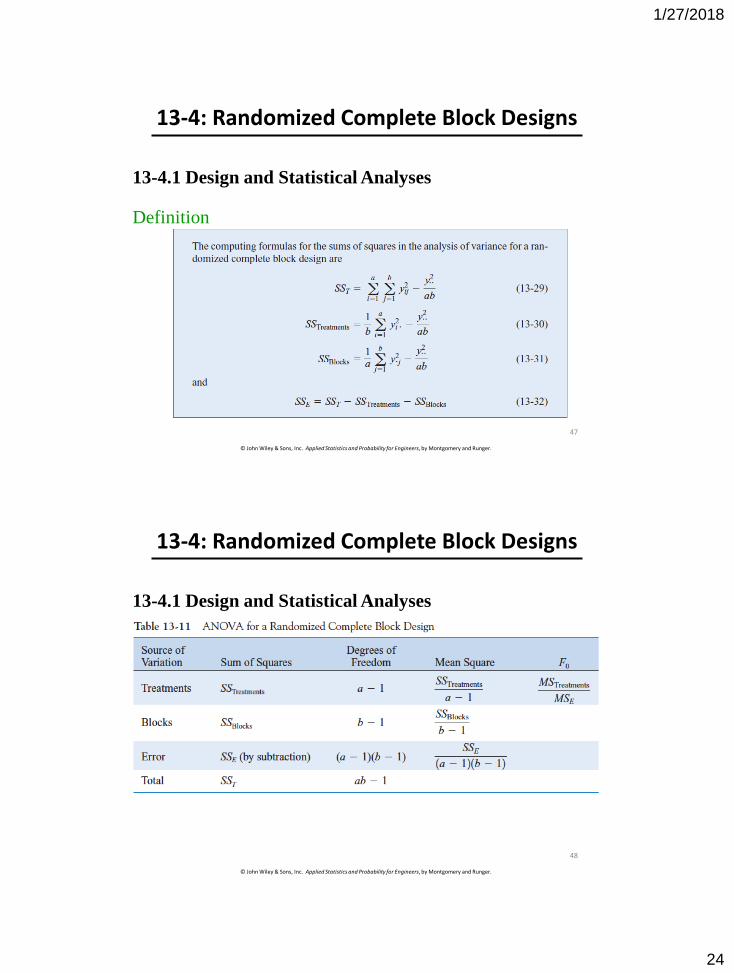
13-4: Randomized Complete Block Designs
13-4.1 Design and Statistical Analyses
Definition
47
© John Wiley & Sons, Inc. Applied Statistics and Probability for Engineers, by Montgomery and Runger.
13-4: Randomized Complete Block Designs
13-4.1 Design and Statistical Analyses
48
1/27/2018
25
© John Wiley & Sons, Inc. Applied Statistics and Probability for Engineers, by Montgomery and Runger.
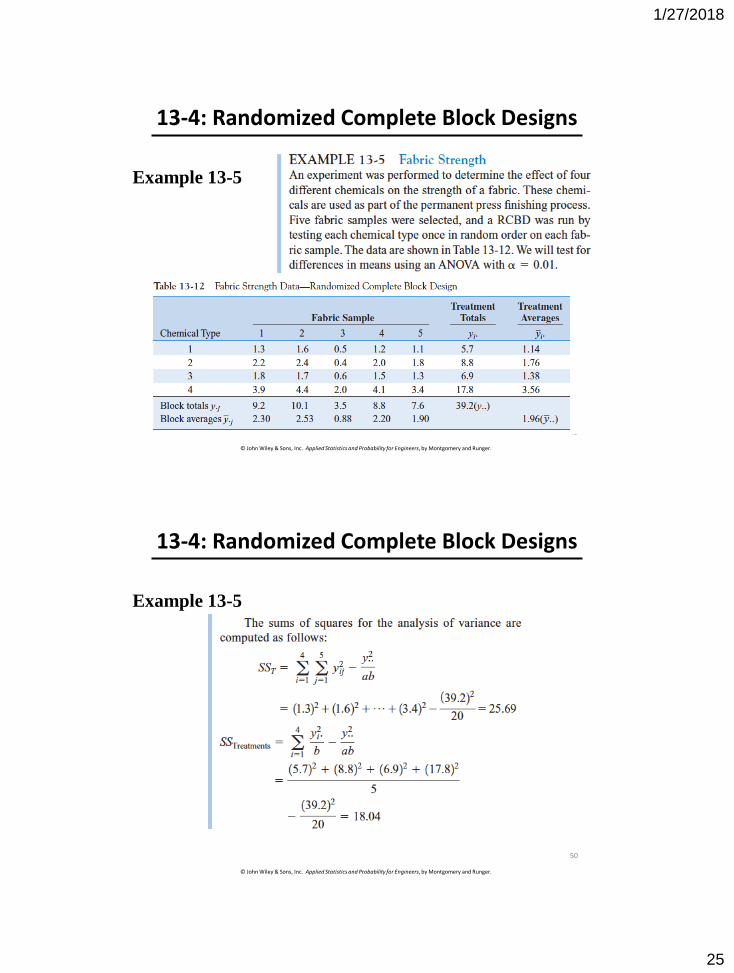
13-4: Randomized Complete Block Designs
Example 13-5
49
© John Wiley & Sons, Inc. Applied Statistics and Probability for Engineers, by Montgomery and Runger.
13-4: Randomized Complete Block Designs
Example 13-5
50
1/27/2018
26
© John Wiley & Sons, Inc. Applied Statistics and Probability for Engineers, by Montgomery and Runger.
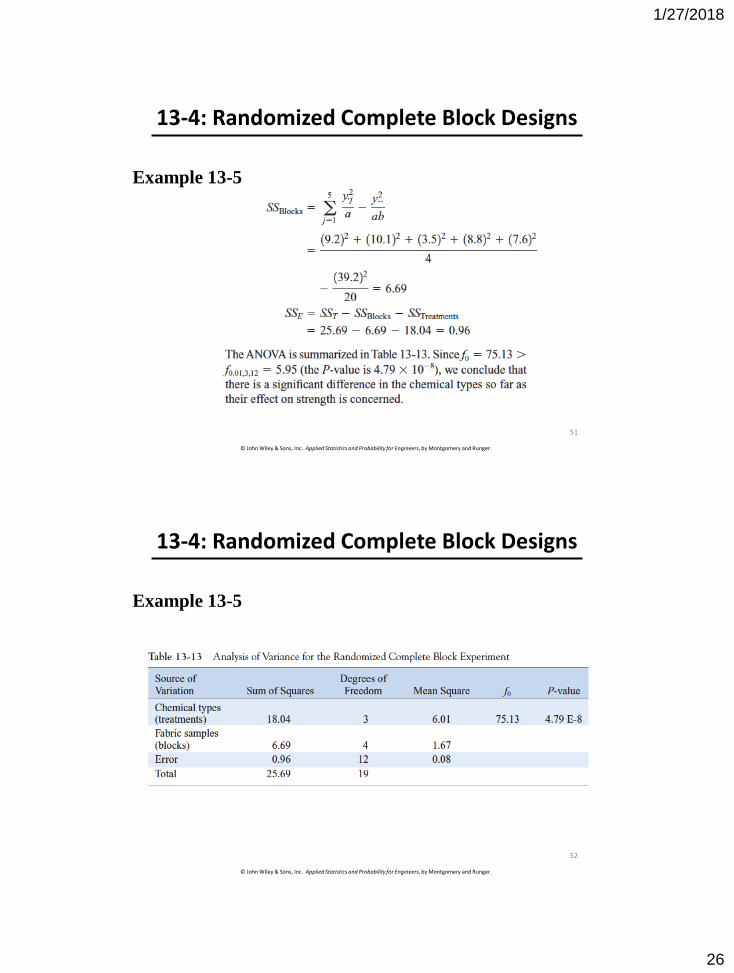
13-4: Randomized Complete Block Designs
Example 13-5
51
© John Wiley & Sons, Inc. Applied Statistics and Probability for Engineers, by Montgomery and Runger.
13-4: Randomized Complete Block Designs
Example 13-5
52
1/27/2018
27
© John Wiley & Sons, Inc. Applied Statistics and Probability for Engineers, by Montgomery and Runger.
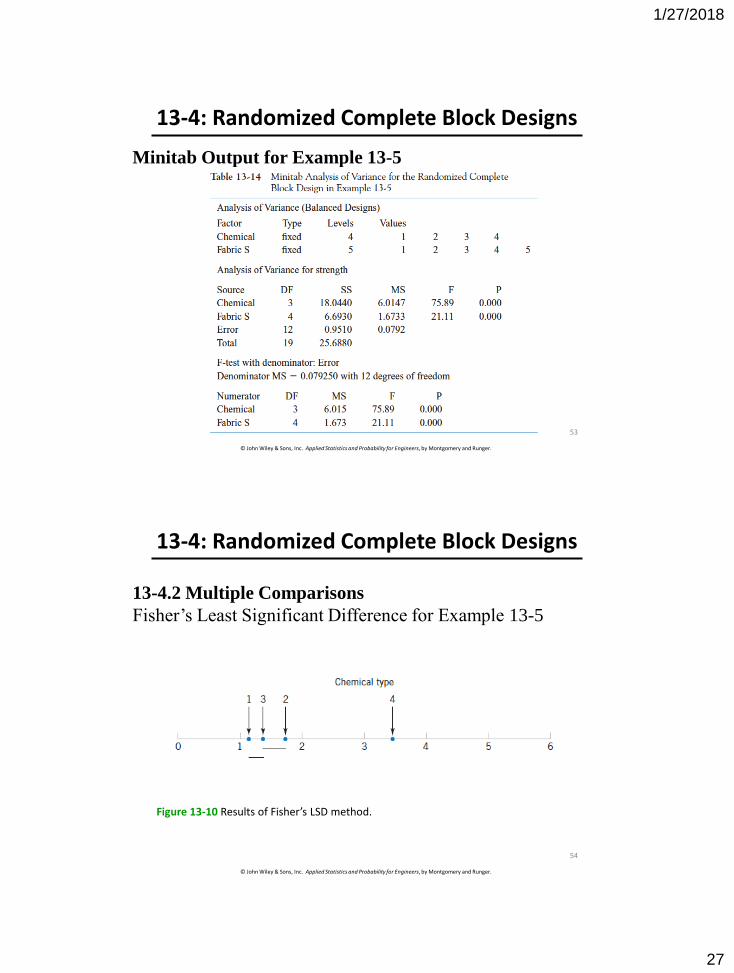
13-4: Randomized Complete Block Designs
Minitab Output for Example 13-5
53
© John Wiley & Sons, Inc. Applied Statistics and Probability for Engineers, by Montgomery and Runger.
13-4: Randomized Complete Block Designs
13-4.2 Multiple Comparisons
Fisher’s Least Significant Difference for Example 13-5
Figure 13-10 Results of Fisher’s LSD method.
54
1/27/2018
28
© John Wiley & Sons, Inc. Applied Statistics and Probability for Engineers, by Montgomery and Runger.
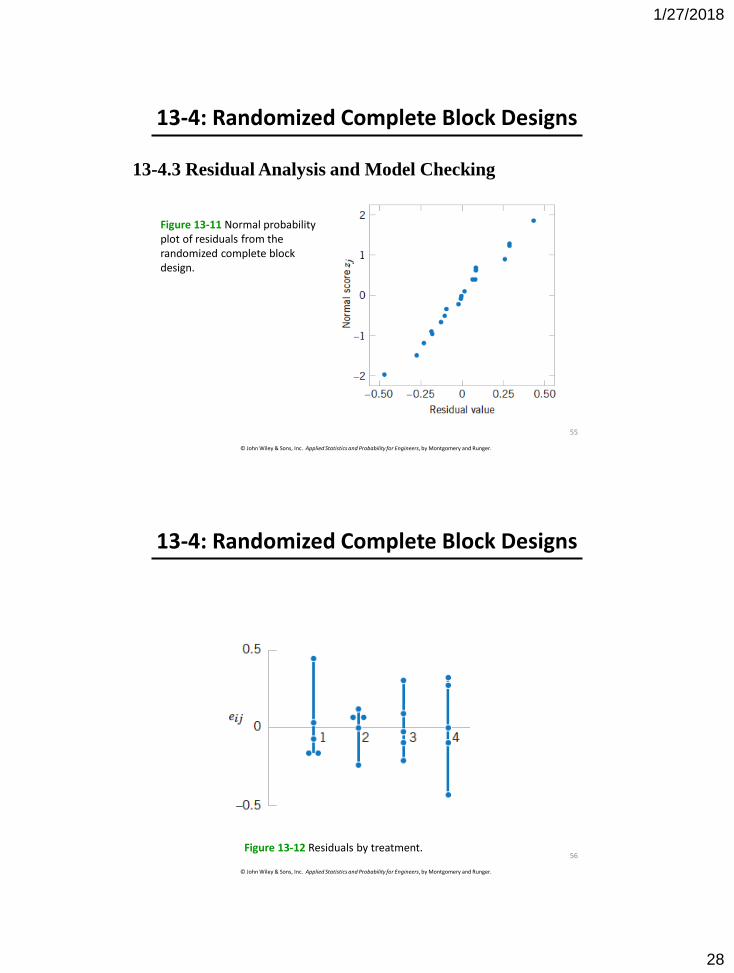
13-4: Randomized Complete Block Designs
13-4.3 Residual Analysis and Model Checking
Figure 13-11 Normal probability plot of residuals from the randomized complete block design.
55
© John Wiley & Sons, Inc. Applied Statistics and Probability for Engineers, by Montgomery and Runger.
13-4: Randomized Complete Block Designs
Figure 13-12 Residuals by treatment.56
1/27/2018
29
© John Wiley & Sons, Inc. Applied Statistics and Probability for Engineers, by Montgomery and Runger.
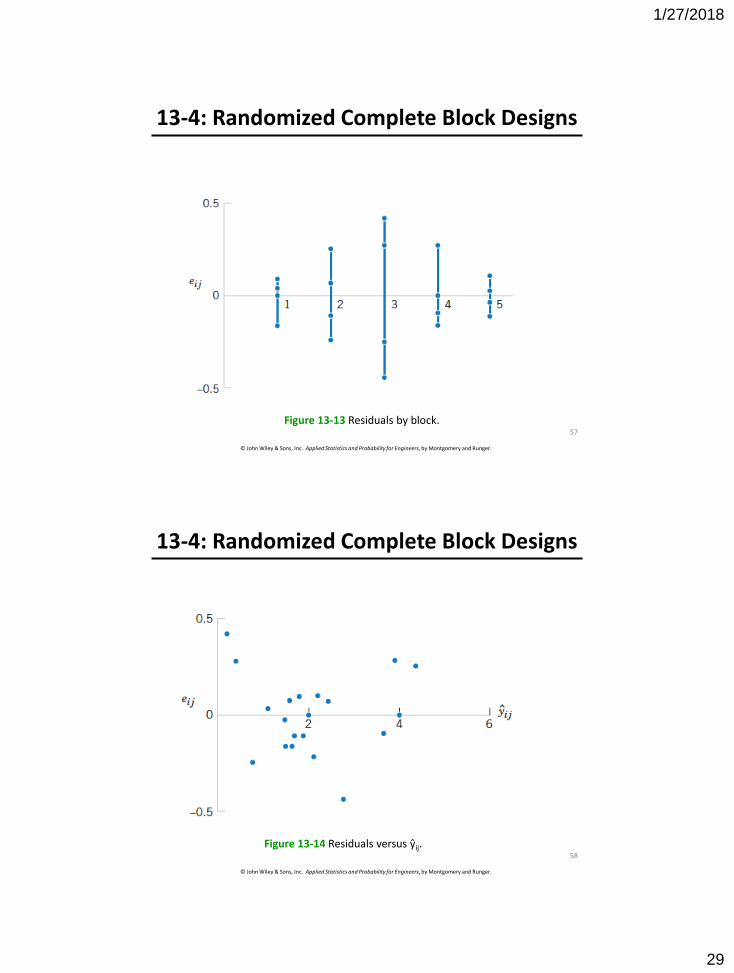
13-4: Randomized Complete Block Designs
Figure 13-13 Residuals by block.57
© John Wiley & Sons, Inc. Applied Statistics and Probability for Engineers, by Montgomery and Runger.
13-4: Randomized Complete Block Designs
Figure 13-14 Residuals versus ŷij.58
1/27/2018
30
© John Wiley & Sons, Inc. Applied Statistics and Probability for Engineers, by Montgomery and Runger.
Important Terms & Concepts of Chapter 13
Analysis of variance (ANOVA)
Blocking
Completely randomized experiment
Expected mean squares
Fisher’s least significant difference (LSD) method
Fixed factor
Graphical comparison of means
Levels of a factor
Mean square
Multiple comparisons
Nuisance factors
Random factor
Randomization
Randomized complete block design
Residual analysis & model adequacy checking
Sample size & replication in an experiment
Treatment effect
Variance component
59