Embed Size (px)
Citation preview
Chapter III
METHOD AND PROCEDURE
The present chapter deals with the operational aspects
of the study, the methodological and procedural design of the
research work, the tools and statistical treatment of the
data suited to the purpose and objectives of the work.
Since the method and procedure are subservient to aims
and objectives of a resarch v/ork, it may be profitably
recalled that the present study is an attempt to explore
the personal concomitants of over and under achievement in
different school subjects with the following specific
objectives:
(1) To identify the differential personality factors going
with over and under achievement in each of the four
subjects selected for study, Hindi, English/ Mathematics
and Science, among the male and female subjects separately,
(2) To investigate sex differences within the groups of
over achievers and under achievers in individual subject
areas along different personality dimensions.
(3) To determine whether over under achievement is a general
phenomenon or a specific one with reference to different
school subjects.
44
45
Tools of the Study
The meaningfulness of results of any research work
depends very much on the appropriateness of the tools and
measures employed in the study. They should be reasonably
valid and reliable as well as suited to the age and ability
levels of the sample involved in the research work.
For its purpose, the present investigation required the
following tools and measures:
i) a reliable test for measuring intelligence,
ii) a comprehensive standard test of personality, and
iii) dependable achievement scores of the subject areas involved in the study.
Measure of Intelligence
For measuring intelligence of the subjects, the 'Culture
Fair' test of general ability constructed by Cattell and
Cattail (Test of 'g': Culture Fair, Scale 2, Form A) was
employed. This test was chosen in preference to some other
possible choices primarily because it is a culture free test.
The authors claim that the test measures "individual
intelligence in a manner designed to reduce, as much as
possible, the influence of verbal fluency, cultural climate,
and educational level" (Measuring Intelligence with the
Culture Fair Tests, Manual for Scale 2 and 3, 1973, p.5).
Scale 2 of the test could profitably be employed for the
46
present study as it covers age range 8 years upwards and
the subjects for the study were school pupils of classes
VIII and IX, with a mean age of 15' years.
The ease of administration of the test was also a consi
deration. The test is so designed that it can be conveniently
administered in groups. In the words of the author, it is
"wholly group administrable".
AS already mentioned, in order to avoid the influence
of language the tasks in the test are so stjructured that the
subjects are required 'only to perceive relationships in
shapes and figures'.
So far as the design of the test is concerned, Cattells'
Test of 'g': Culture Fair, Scale 2, Form A, consists of four
subtests. The first subtest has 12 series items and the time
allotted for it is 3 minutes. The second subtest contains 14
classification items and the time allotted for it is 4 minutes.
The third subtest is constituted of 12 matrices and the
allotted time is 3 minutes. The fourth subtest has 8
topology items and the time cillotted for it is 2 /2 minutes.
Thus in all there are 46 items in four subtests. It appears
important to mention that both in the arrangement of the
four subtests and the order of items within the subtests the
psychological principle of moving from easy to difficult
operations is adhered to.
47
Examples are given before each sxibtest so that the task
requirements are understood well by the subjects involved.
Reliability of the Intelligence Measure
In order to determine the reliability of the Culture Fair,
Scale 2, Form A, the test-retest agreement method and the
split-half method were employed by the authors for obtaining
dependability coefficient and consistency coefficient respectively.
The test-retest 'dependability* coefficients, corrected to full
length on Spearman Brown Formula^ranged from .82 to ,85 while the
odd-even split half 'consistency' coefficients ranged from .95
to .97 (Technical Supplement for the Culture Fair Intelligence
Tests, Scales 2 and 3, 1973, p.2).
Validlty of the Intelliqence Measure
Concept validios by the internal consistency method, which
they term as the 'direct concept validities' for Scale 2 have
been calculated for each of the four subtests in Scale 2, and
reported in the Technical Supplement. For the 12 series
items of the first sub-test, the direct concept validity
coefficient is .76, for the 14 classification items of the
second subtest the coefficient is .54, for the 12 'matrices'
of the third subtest it is .76, and for 8 'topology' items of the
fourth subtest .51. For the total test consistency of 46 items,
the direct concept validity coefficient has been reported to be
48
.85 (Technical Supplement, 1973).
For determining concrete validity of Scale 2, performance
on the scale was correlated with that on other intelligence
tests. It is reported in the Manual that the concrete
validity coefficients for the Scale 2, Form A, against four
tests of intelligence, namely, 'Wechsler Adult, Revised
Beta, Otis Group Test, and Coloured progressive Matrices',
were found to be ,74, .76, .71 and .68 respectively (Technical
Supplement, 1973, p.18). The average coefficient of concrete
validity as determined against these tests was found to be
.70 (Manual, 1973, p.11).
The Measure of Achievement
For the achievement measure, the investigator had to
depend upon the school records of test and examination marks.
xMuch as the lack of reliability of school examination marks
is proverbial, there v/as no other way to get the measure of
academic achievement. It would have been, no doubt, far
better, if standardised achievement tests could have been
employed for this purpose but no such tests were available
for the school subjects chosen for the study and suited
to the grades on which the study was made. Next best
alternative was to construct an achievement test of one's
own and to standardise it to the extent that was possible.
In such a case the reliability and validity of the achievement
49
measure could have been ensured. However, neither standardised
tests of achievement were available nor the time and resources
at the disposal of the investigator allowed for the construction
of tests in the four subjects, chosen for study. Hence school
records and results of examinations had to be relied upon.
In order to ensure better reliability of achievement
scores, results of four tests taken at even intervals and
two examinations, one half yearly and one annual, were taken
into account in all the four subjects,— Hindi, English,
Mathematics and Science — for each of the two grades — VIII
and IX. The marks for these tests and examinations when added
separately for each of the four school sxibjects, yielded the
raw scores for every individual.
Measure of Personality
For studying the personality characteristics of the over
and under achievers in the present work, the investigator
employed an Indian adaptation of Cattell and Beloff's H.S.P.Q.
(Kapoor and Mehrotra, Form A, 1973), covering fourteen
personality dimensions. The H.S.P.Q. is a comprehensive test
of personality consisting of 114 items, which* the authors
claim, measures "distinct dimensions or traits of personality"
(Cattell and Beloff, Manual for the H.S.P.Q., 1973). The
dimensions, or traits, according to the authors come near to
covering the total personality comprising both the structural
50
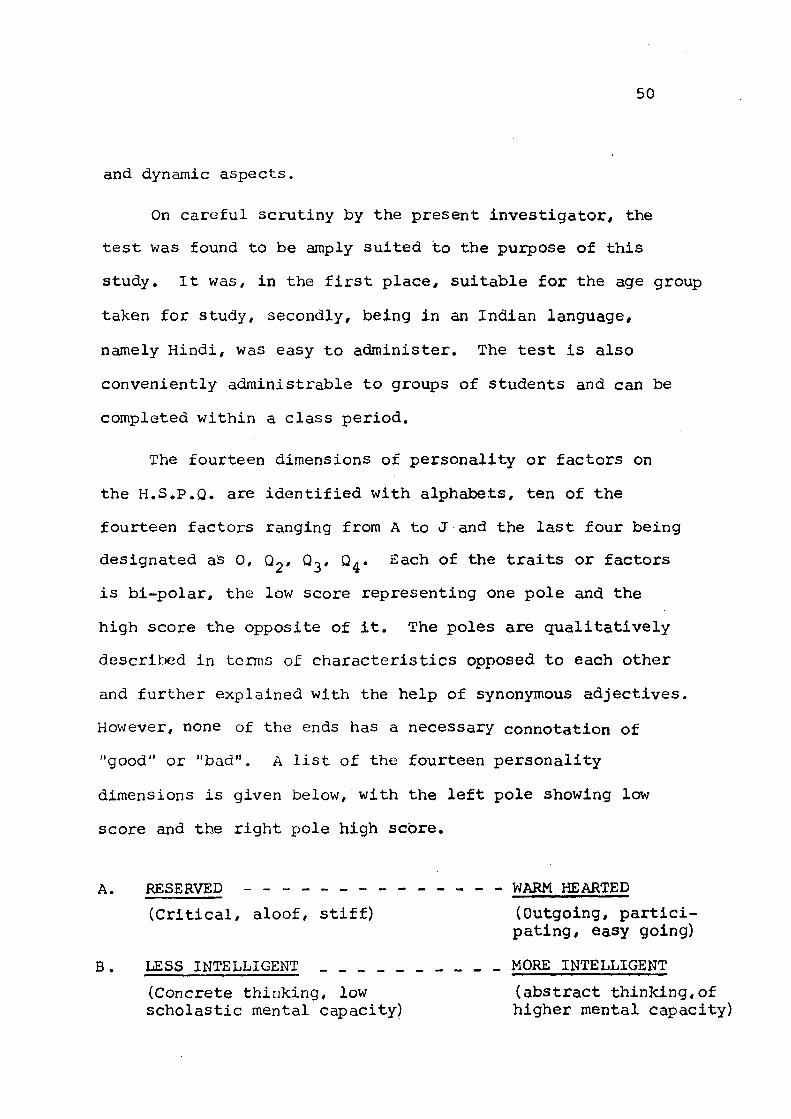
and dynamic aspects.
On careful scrutiny by the present investigator, the
test was found to be amply suited to the purpose of this
study. It was, in the first place, suitable for the age group
taken for study, secondly, being in an Indian language,
namely Hindi, was easy to administer. The test is also
conveniently administrable to groups of students and can be
completed within a class period.
The fourteen dimensions of personality or factors on
the H.S.p.Q. are identified with alphabets, ten of the
fourteen factors ranging from A to J and the last four being
designated as 0, Q^, Q3, Q^. Each of the traits or factors
is bi-polar, the low score representing one pole and the
high score the opposite of it. The poles are qualitatively
described in tenns of characteristics opposed to each other
and further explained with the help of synonymous adjectives.
However, none of the ends has a necessary connotation of
"good" or "bad". A list of the fourteen personality
dimensions is given below, with the left pole showing low
score and the right pole high score.
A.
B.
RESERVED
(Critical, aloof, stiff)
WARM HEARTED
(Outgoing, participating, easy going)
LESS INTELLIGENT _ MORE INTELLIGENT
(Concrete thinking, low scholastic mental capacity)
(abstract thinking,of higher mental capacity)
5 1
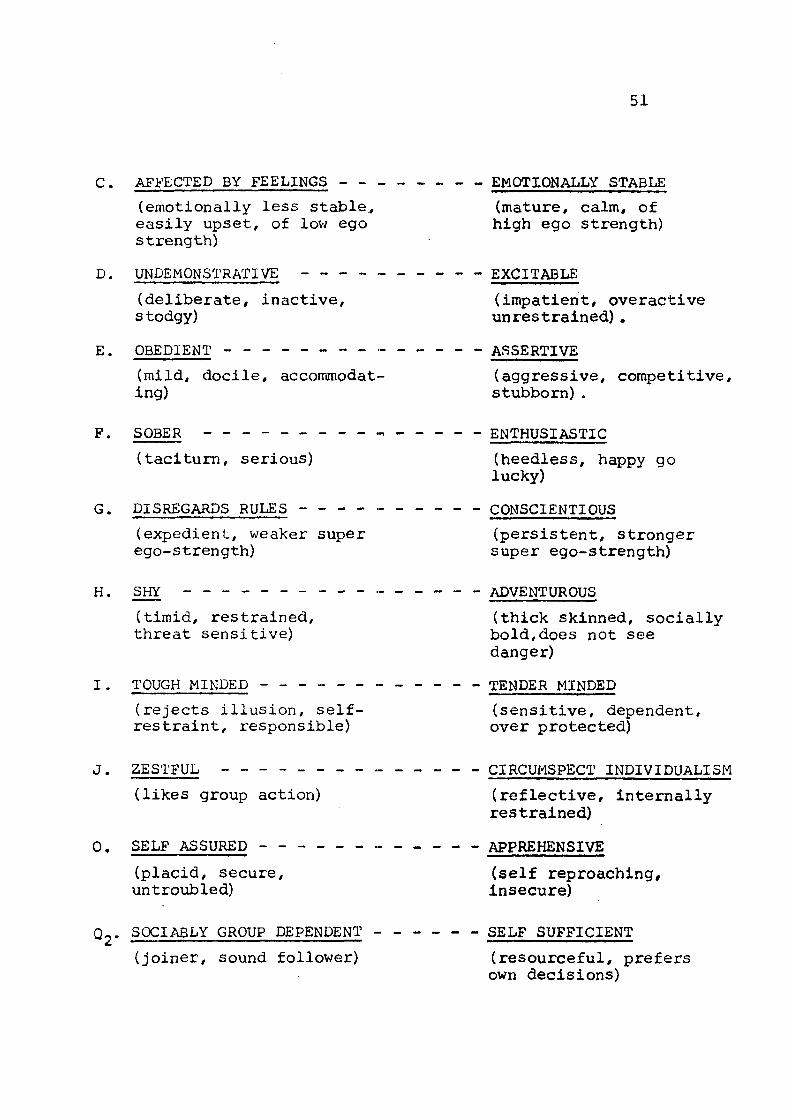
C . AFFECTED BY FEELINGS EMOTIONALLY STABLE
(emotionally less stable^ (mature, calm, of easily upset, of lov/ ego high ego strength) strength)
D. UNDEMONSTRATIVE EXCITABLE
(deliberate, inactive, (impatient, overactive stodgy) unrestrained) ,
E. OBEDIENT ASSERTIVE
(mild, docile, accommodat- (aggressive, competitive, ing) stubborn) .
F. SOBER ENTHUSIASTIC
(taciturn, serious) (heedless, happy go lucky)
G. DISREGARDS RULES - - CONSCIENTIOUS
(expedient, weaker super (persistent, stronger ego-strength) super ego-strength)
"• SHY ADVENTUROUS
(timid, restrained, (thick skinned, socially threat sensitive) bold,does not see
danger)
^ • TOUGH MINDED TENDER MINDED
(rejects illusion, self- (sensitive, dependent, restraint, responsible) over protected)
^' RESTFUL CIRCUMSPECT INDIVIDUALISM
(likes group action) (reflective, internally restrained)
0' SELF ASSURED APPREHENSIVE
(placid, secure, (self reproaching, untro\ibled) insecure)
Q,. SOCIABLY GROUP DEPENDENT SELF SUFFICIENT
(joiner, sound follower) (resourceful, prefers own decisions)
52
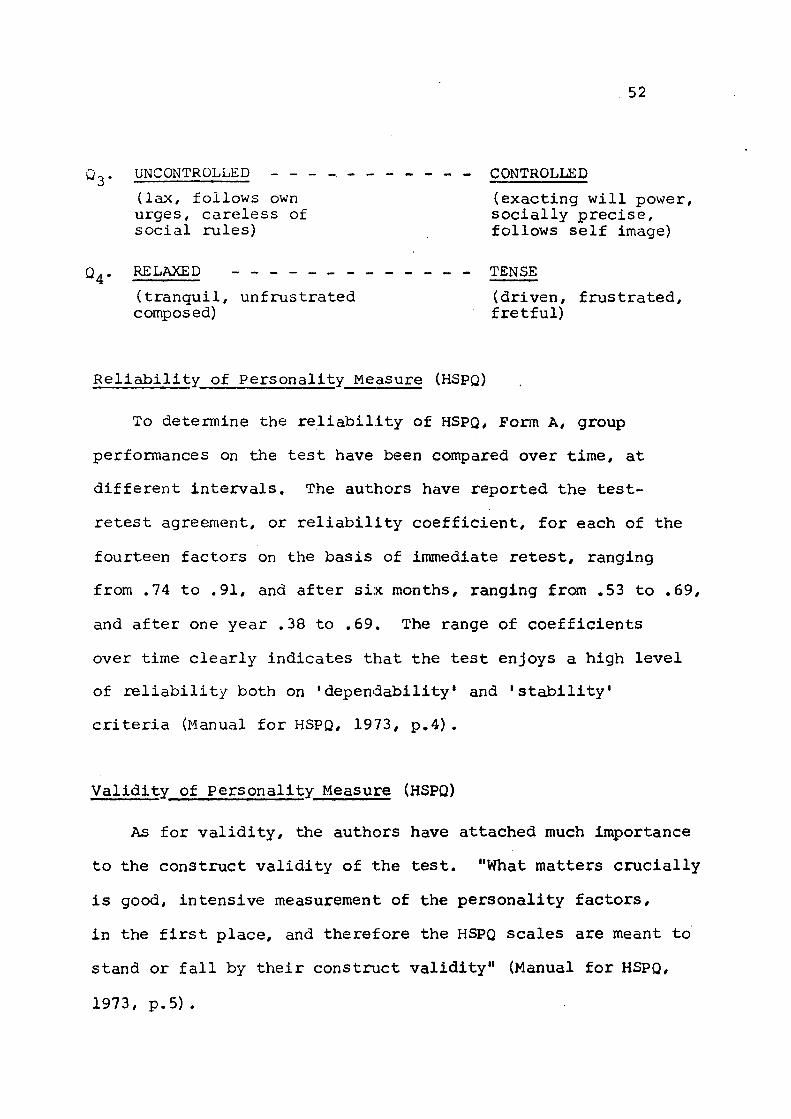
Q 3* UNCONTROLLED
(lax, follows own urges, careless of social rules)
RELAXED
(tranquil, unfrustrated composed)
CONTROLLED
(exacting will power, socially precise, follows self image)
TENSE
(driven, frustrated, fretful)
Reliability of Personality Measure (HSPQ)
To determine the reliability of HSPQ, Form A, group
performances on the test have been compared over time, at
different intervals. The authors have reported the test-
retest agreement, or reliability coefficient, for each of the
fourteen factors on the basis of immediate retest, ranging
from .74 to .91, and after six months, ranging fran .53 to .69,
and after one year .38 to .69. The range of coefficients
over time clearly indicates that the test enjoys a high level
of reliability both on 'dependability* and 'stability'
criteria (Manual for HSPQ, 1973, p.4) .
Validity of Personality Measure (HSPQ)
As for validity, the authors have attached much importance
to the construct validity of the test. "What matters crucially
is good, intensive measurement of the personality factors,
in the first place, and therefore the HSPQ scales are meant to
stand or fall by their construct validity" (Manual for HSPQ,
1973, p.5) .
53
The construct validity coefficients reported, for each of
the fourteen personality factors on the basis of multiple
correlation "between the items" iri the scale and the corres
ponding pure factor are highly significant. The coefficients
range from .57 to .74 (Manual for HSPQ, 1973, p.Si.
Population
To start with, a sample of 650 students was taken from VIII
and IX classes of Aligarh Muslim University boys* and girls'
high schools. The number of cases, however, shrank to 437
due to the occasional absense of the students on the days
of administration of the tests as well as due to the non
availability of achievement records of some of the subjects
who had missed some short term tests or examinations. The
ages of the subjects ranged from 14 to 16 years with a mean
of 15 years. Since the subjects hailed from the middle classes,
and were getting education under similar circumstances, the sample
was taken to be reasonably homogeneous from the socio
economic point of view.
Administration of the Tests and Collection of Data
The administration of the two tests, Cattells' Culture
Fair Intelligence Test and the High School Personality
Questionnaire (HSPQ) took two days in each of the three
54
schools where data for the study were collected. Both the
tests were administered to the same sections of VIII and
IX classes and strict adherence to the instructions given
by the authors of the tests was maintained.
The school children were highly involved and interested
while they were being tested on Cattells* Culture Fair
Intelligence Test and the HSPQ. It was a novel experience for
them and they took the task quite seriously. Scoring on
both the tests was done with the help of keys provided and thus for
each case, involved in the study, scores on intelligence
and fourteen personality factors were obtained. For achieve
ment, test and examination marks in Hindi, English, Mathematics
and Science were taken from the school registers and the total
marks in each school subject were converted in Z-scores
respectively, for each subject. To facilitate comparisons
between intelligence and achievement scores, the intelligence
scores were also converted in Z-scores (Best, 1977, p.238).
Identification of Over and Underachievement
After obtaining the data,the first task before the
investigator was to identify the cases of over and under
achievement in Hindi, English, Mathematics and Science
separately. The problem essentially involved the prediction
of 'the expected achievement' against which the positive and
negative discrepancies were to be worked out — the cases
55
of positive discrepancy being the over achievers and those of
negative discrepancy, the under achievers.
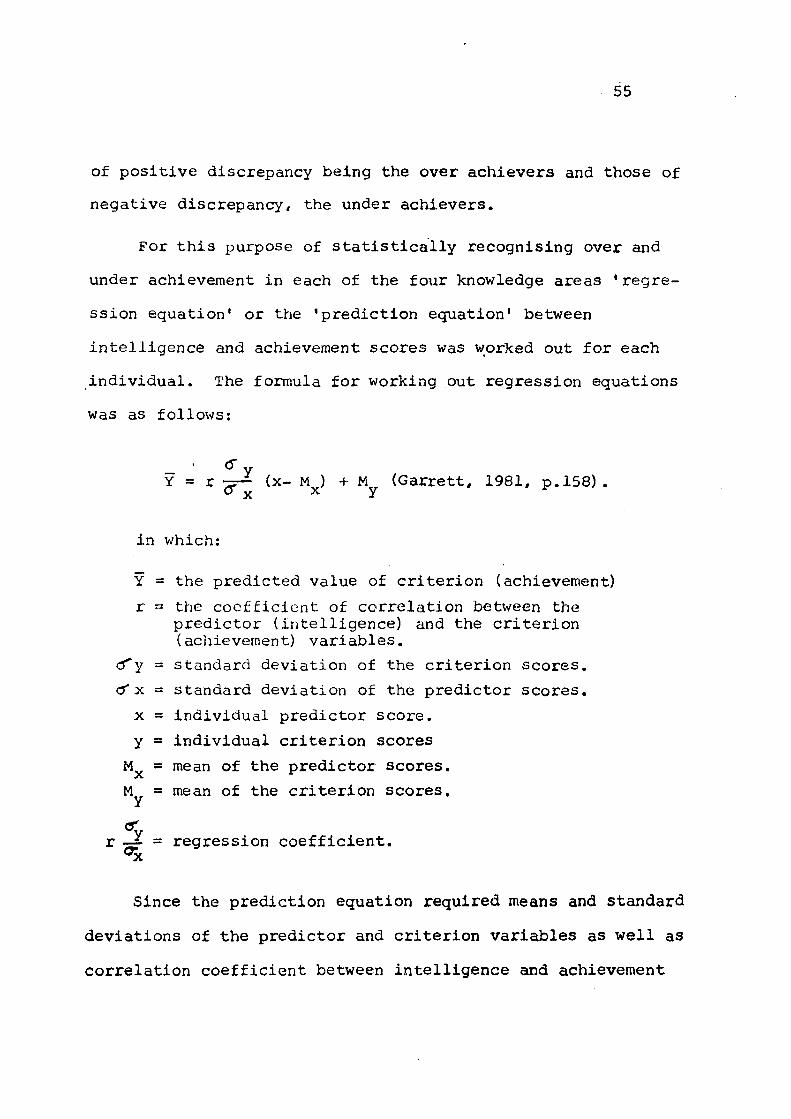
For this purpose of statistically recognising over and
under achievement in each of the four knowledge areas 'regre
ssion equation' or the 'prediction equation' between
intelligence and achievement scores was worked out for each
individual. The formula for working out regression equations
was as follows:
- ' ^ y Y = r -=—• (x- M ) + M (Garrett, 1981, p. 158) .
° X ^ y
in v/hich:
Y = the predicted value of criterion (achievement)
r =« the coefficient of correlation between the predictor (intelligence) and the criterion (achievement) variables.
cTy = standard deviation of the criterion scores,
cf X = standard deviation of the predictor scores,
X = individual predictor score.
y =» individual criterion scores
M = mean of the predictor scores.
M = mean of the criterion scores.
r —=• = regression coefficient.
Since the prediction equation required means and standard
deviations of the predictor and criterion variables as well as
correlation coefficient between intelligence and achievement
56
scores these were also worked out for boys and girls separately
and utilised in working out the regression equation. The
value thus obtained represented the expected achievement
score for the individual concerned as predicted on the basis
of intelligence.
After obtaining the predicted scores* the discrepancies
between the actual achievement scores and the predicted
values were worked out for each individual in each of the
four knowledge areas-^Hindi, English, Mathematics and
Science.
For identifying the overachievers and underachievers,
more precisely, i.e., unaffected by the statistical errors
of estimate, cases one SD above their predicted achieve
ment scores were designated as overachievers and those one
SD below as underachievers. The formula for standard error e
of estimate is given below:
7 : D ^ SDg = SD/ l-(r) (Garrett, 1981, p.161),
Working along the above mentioned procedure, the male
and female overachievers and underachievers were identified
in the four knowledge areas separately. These fell into
the following 16 groups — 8 for boys and 8 for girls:
57
1. Male overachievers in Hindi.
3. Male overachievers in English.
5. Male overachievers in Mathematics.
7. Male overachievers in Science.
2, Male underachievers in Hindi.
4. Male underachievers in English.
6. Male underachievers in Mathematics.
8. Male underachievers in Science.
9. Female overachievers in Hindi.
11. Female overachievers in English.
13. Female overachievers in Mathematics.
15. Female overachievers in Science.
10. Female underachievers in Hindi.
12. Female underachievers in English.
14. Female underachievers in Mathematics.
16. Female underachievers in Science.
Procedure for Assessing Generality/Specificity of Over and Under Achievement
An important problem before the investigator was to
ascertain whether over and under achievement is a general
phenomenon or a specific one with reference to different
school subject areas; whether the proportion of over and
under achievers in one knowledge area varies with variation
in other areas of scholastic achievement significantly
or not.
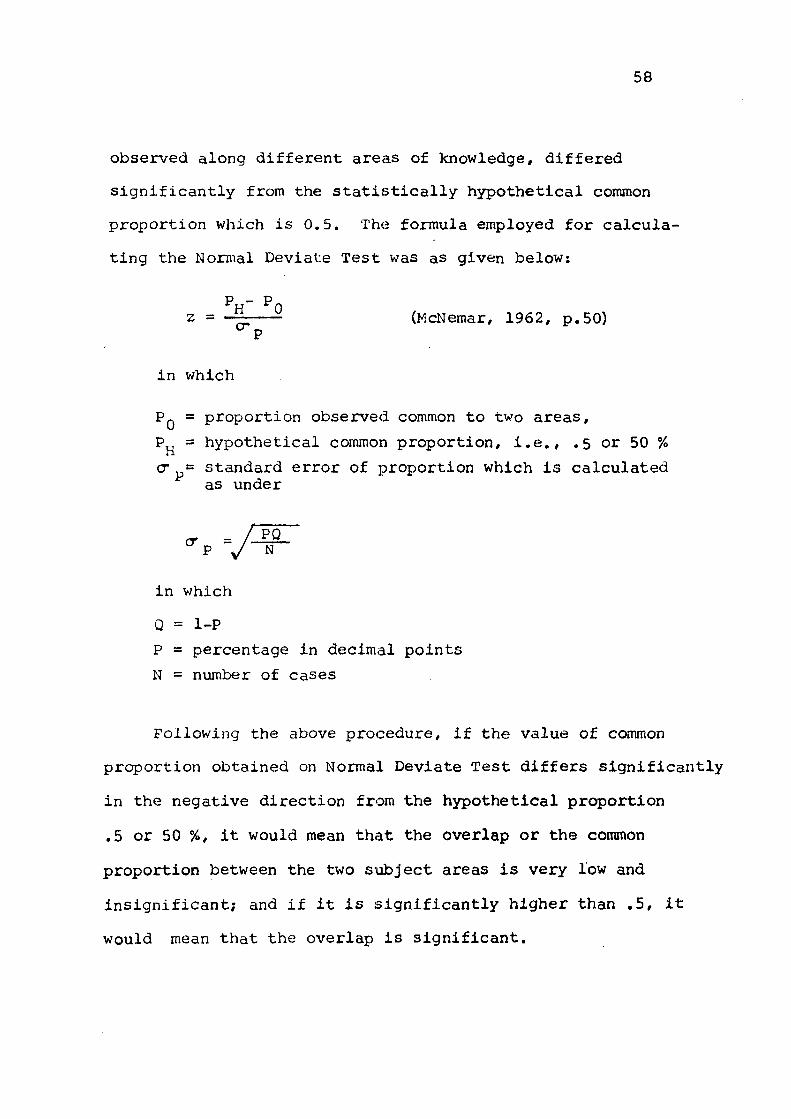
For treating the above problem, the study employed the
Normal Deviate Test-z- which would verify whether and to
what extent the common proportion of over and under achievers.
58
observed along different areas of knowledge, differed
significantly from the statistically hypothetical cornmon
proportion which is 0.5. The formula employed for calcula
ting the Nomial Deviate Test was as given below:
P - P z = — ; (McNemar, 1962, p.50)
P
in which
P^ = proportion observed common to two areas,
Po = hypothetical common proportion, i.e., .5 or 50 %
cr = standard error of proportion which is calculated as under
= / ^ _ , PQ P V̂ N
in which
Q = 1-P
P = percentage in decimal points
N = number of cases
Following the above procedure, if the value of common
proportion obtained on Normal Deviate Test differs significantly
in the negative direction from the hypothetical proportion
,5 or 50 %, it would mean that the overlap or the coiranon
proportion between the two subject areas is very low and
insignificant; and if it is significantly higher than ,5, it
would mean that the overlap is significant.
59
Procedure for Determining Group Differences on Personality Factors
In order to determine the differences between groups
of over and under achievers, in each of the four school
subjects, on the fourteen personality dimensions the 't'
test of significance of difference between means was employed.
For this, means and standard deviations were worked out for
each of the groups of over and under achievers in the four
subject areas on each of the fourteen dimensions of personality.
Sex differences within the groups of over achievers and
under achievers on the fourteen personality factors in each
of the four subject areas were also determined by the appli
cation of 't' test. The 't' values were computed with the
help of the following formula:
(McNemar, 1962, p. 102)
The analysis i s presented in the following chapter.