Embed Size (px)
Citation preview

24
CHAPTER III
RESEARCH AND PROCEDURE
In this chapter, the writer describes: (a) method of the research, (b)
research variables, (c) operational definitions, (d) population and sample of the
study, (e) technique for collecting data, (f) research instrument analysis, (g)
reseacrh treatments, and (h) technique for analyzing data.
A. Method of the Research
The method used in this research was experimental design.
Experimental design is the blueprint of the procedures that enable the
researcher to test the hypothesis by reaching valid conclusion about the
relationships between independent and dependent variable (Best and Khan,
1995, p. 146). In this research, the writer applied one of quasi experimental
research design, quasi experiment to provide control of when and to whom the
measurement is applied, but random assignment to experimental and control
treatments has not been applied. In this study, the pretest-posttest
nonequivalent groups design is used which is suggested by Best and Khan
(1995, p. 151).
In this study, the writer used the pretest posttest nonequivalent
groups design. This design is often used in classroom experiments when
experimental and control group are such naturally assembled groups as intact
25
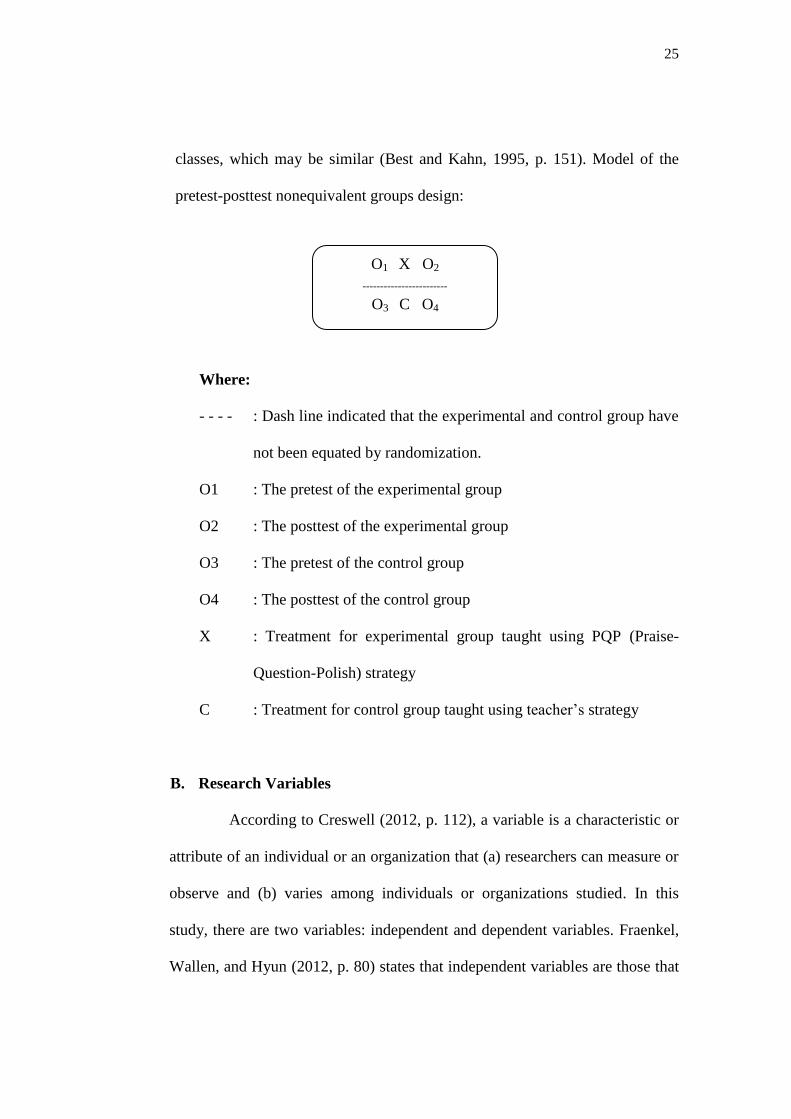
classes, which may be similar (Best and Kahn, 1995, p. 151). Model of the
pretest-posttest nonequivalent groups design:
Where:
- - - - : Dash line indicated that the experimental and control group have
not been equated by randomization.
O1 : The pretest of the experimental group
O2 : The posttest of the experimental group
O3 : The pretest of the control group
O4 : The posttest of the control group
X : Treatment for experimental group taught using PQP (Praise-
Question-Polish) strategy
C : Treatment for control group taught using teacher‟s strategy
B. Research Variables
According to Creswell (2012, p. 112), a variable is a characteristic or
attribute of an individual or an organization that (a) researchers can measure or
observe and (b) varies among individuals or organizations studied. In this
study, there are two variables: independent and dependent variables. Fraenkel,
Wallen, and Hyun (2012, p. 80) states that independent variables are those that
O1 X O2
------------------------
O3 C O4

26
the researcher chooses to study in order to assess their possible effect(s) on one
or more other variables. An independent variable is presumed to affect (at least
partly cause) or somehow influence at least one other variable. The variable
that the independent variable is presumed to affect is called a dependent
variable.
In this study, the independent variable is the use of PQP (Praise-
Question-Polish) strategy in teaching writing recount text, while the dependent
variable in this study is students‟ achievement of the tenth grade of SMA
Muhammadiyah 5 Palembang in writing recount text.
C. Operational Definitions
The title of this study is “Teaching Writing Recount Text by Using
PQP (Praise-Question-Polish) Strategy to the Tenth Grade Students of SMA
Muhammadiyah 5 Palembang”. From the title, the writer described teaching
recount text, PQP (Praise-Question-Polish) strategy, and students‟ writing
achievement.
1. Teaching Writing Recount Text
Teaching writing is an instructional activity which is done by a teacher in
the classroom by giving understanding to the students how to write a
sentence or a text. Recount text is a kind of English which retells actions
or experiences happened in the past. Teaching writing recount text is an
instructional activity which is done by a teacher in the classroom by giving
understanding to the students how to write a recount text based on the

27
correct generic structures, grammatical patterns, and language features of
recount text.
2. PQP (Praise-Question-Polish) Strategy
PQP strategy is a revision strategy that helps students to edit and revise
another‟s writing draft. It is suitable to improve writing skill which can
bring students to get better ability in writing recount text.
3. Students‟ writing achievement
Students‟ writing achievement means result gained by the students from a
test given after they received a treatment.
D. Population and Sample of the Study
1. Population
Population is the group of interest to the researcher, the group to
whom the researcher would like to generalize the results of the study
(Fraenkel and Wallen, 2009, p. 91). The population of this study was all of
the tenth grade students of SMA Muhammadiyah 5 Palembang in the
academic 2014/2015 with a total numbers of 146 students. The population of
the research is presented in table 2.
Table 2
Population of the Study
No Class Gender
Total Female Male
1 X.MIA 1 25 8 33
2 X.MIA 2 25 8 33
28
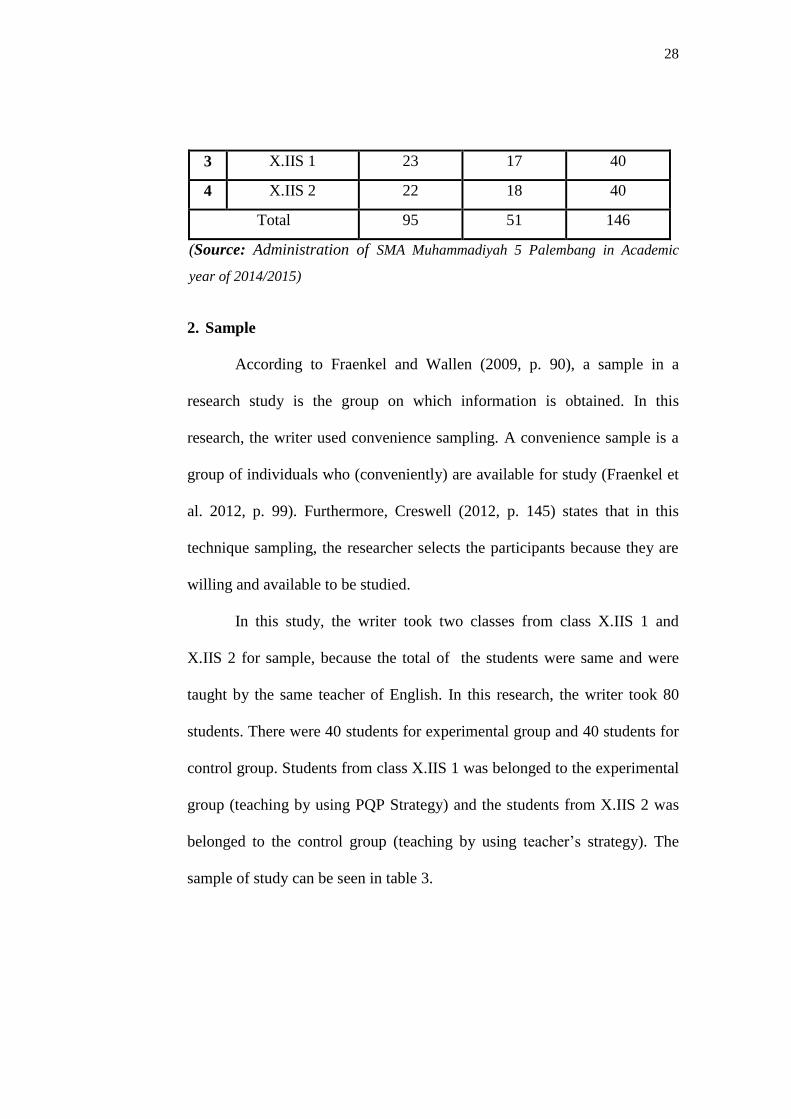
3 X.IIS 1 23 17 40
4 X.IIS 2 22 18 40
Total 95 51 146
(Source: Administration of SMA Muhammadiyah 5 Palembang in Academic
year of 2014/2015)
2. Sample
According to Fraenkel and Wallen (2009, p. 90), a sample in a
research study is the group on which information is obtained. In this
research, the writer used convenience sampling. A convenience sample is a
group of individuals who (conveniently) are available for study (Fraenkel et
al. 2012, p. 99). Furthermore, Creswell (2012, p. 145) states that in this
technique sampling, the researcher selects the participants because they are
willing and available to be studied.
In this study, the writer took two classes from class X.IIS 1 and
X.IIS 2 for sample, because the total of the students were same and were
taught by the same teacher of English. In this research, the writer took 80
students. There were 40 students for experimental group and 40 students for
control group. Students from class X.IIS 1 was belonged to the experimental
group (teaching by using PQP Strategy) and the students from X.IIS 2 was
belonged to the control group (teaching by using teacher‟s strategy). The
sample of study can be seen in table 3.

29
Table 3
Sample of The Study
No. Class Group Total
1 X.IIS 1 The Experimental Group 40
2 X.IIS 2 The Control Group 40
T o t a l 80
E. Technique for Collecting Data
In this study, the writer used test and questionnaire to collect the
data. The test was conducted twice as pretest and posttest in control and
experimental group. Then, questionnaire was conducted once in experimental
group only.
1. Test
The writer used test to collect the data from this study. According
to Arikunto (2013, p. 266), test is a tool or procedure which is used to
know or measuring something in a situation with manner and the roles
which used it. For collecting data, the writer used a written test which the
students was assigned to write a text related to the topic which had been
given by the teacher. In this study, the writer used pretest and posttest.
a. Pretest
The pretest was given before doing the treatment to the control
and experimental group. Creswell (2012, p. 297) states that a pretest
provides a measure on some attribute or characteristic that was assessed
for participants in an experiment before the students received a

30
treatment. The purpose of giving pretest to the students was to know the
students‟ ability in learning writing before implementing PQP (Praise-
Question-Polish) strategy. And the result of students‟ work would be
check and scored by two raters.
b. Posttest
The posttest was given at the end of treatment to the control and
experimental group. It was given after the teacher gave the treatment of
teaching writing through PQP (Praise-Question-Polish) Strategy.
Creswell (2012, p. 297) states that a posttest is a measure on some
attribute or characteristic that is assessed for participants in an
experiment after a treatment. The purpose of this test was to measure
students‟ ability in writing recount text. The same as pretest, two raters
would check and give score to the students‟ works. The result of this test
was compared with the result of pretest in order to know the effect of
teaching witing recount paragraph through PQP (Praise-Qustion-Polish)
Strategy. From the posttest, the writer was able to get the data that can
be used to measure the students‟ progress taught by using PQP (Praise-
Question-Polish) Strategy.
2. Questionnaire
In this study, the writer used questionnaire to know students‟
responses about the implementation of PQP (Praise-Question-Polish)
strategy. A closed-statements questionnaire was given to the students in

31
experimental group after the posttest was done. They were asked to give
responses toward sixteen statements on the questionnaire. To ask the
students‟ responses on the questionnaire, the writer used Quipper School
Indonesia as online learning media which is accessed from
http://www.quipperschool.com. There were two choices in each item in
which “1 for positive response” and “0 for negative response”.
F. Research Instrument Analysis
1. Validity Test
According to Fraenkel and Wallen (2009, p. 147), validity is the
most important idea to consider when preparing or selecting an instrument
for use. Term “validity” refers to the appropriateness, meaningfulness,
correctness and usefulness of the inferences of researcher makes (Fraenkel
and Wallen, 2009, p. 147). It means validity test was used to measure
whether the obtained data of an instrument was valid or not. This study used
construct validity, validity of each question item and content validity.
a. Construct Validity
Hughes (1989, p. 26) states that the word “construct” refers to
any underlying ability (or trait) which is hypothesized in a theory of
language. In this part, the construct validity of the research instruments
involved two types. There were instrument for pretest and posttest
activities, and lesson plans for control and experimental groups.

32
In this study, to evaluate whether the components of the
instrument and lesson plans are valid or not to be applied in research
activities, the writer used expert judgments from three validators.
Sugiyono (2011, p. 125) states that expert judgment is required to
estimate the construct validity.
There were three validators to validate the research instrument
and lesson plan. The first validator was M. Holandyah, M.Pd. the result
analysis of research instrument was instrument could be used without
revision and the result analysis of lesson plan could be used with a little
revision. The second validator was Amalia Hasanah, M.Pd. The result
analysis of research instrument could be used with a little revision, and
the result analysis of lesson plan could be used without revision. The
third validator was Manalulaili, M. Ed. The result analysis of research
instrument could be used with a little revision, and the result analysis of
lesson plan could be used with a little revision
From the three validators, it could be concluded that the
instrument and lesson plan were appropriate to be applied for the research
activities. The validator sheets could be seen in appendix A.
b. Validity of Each Question Item
Validity test of each question item is used to indicate whether the
test item of the instrument in each question is valid or not. To know
whether it is valid or not, the score of significance (r-output) should be

33
compared with the score of “r-table” product moment. A question item is
considered valid if “r-output” is higher than “r-table” (Basrowi and
Soenyono, 2007, p. 24).
In this study, the writer used questionnaire to know students‟
responses on the implementation of PQP (Praise-Question-Polish)
strategy. To measure the questionnaire was valid or not, the writer used
Pearson Correlation Coefficient in SPSS version 20 software. From the
result analysis in validity test of each question item, there were 16
statements considered valid from 24 statements given. Those statements
were considered valid because the score was higher than r-table (0.361).
From the explanation above, it could be concluded that the
questionnaire could be applied in research activities to know students‟
responses on the implementation of PQP (Praise-Question-Polish)
strategy. The result of Pearson Correlation Coefficient in SPSS version
20 software could be seen in appendix B.
c. Content Validity
Hughes (1989, p. 22) states that a test is said to have content
validity if its content constitutes a representative sample of the language
skill, structures, etc. with which it is meant to be concerned. A content
validity is very important since it is an accurate measure of what it is
supposed to measure. The specification for the test was formulated based
on the curriculum or syllabus of English for tenth graders of Senior High

34
School in order to know if the contents of the test item given were
appropriate to the students. Test of specification table is showed in table
4.
Table 4
Test of Specification Table
Objective Topic Indicator Type of
Test Number of Item
Total Number
The students will able to: 1. Identify the
information of recount text
2. Writing a topic and some supporting details of recount text through PQP (Praise-Question-Polish) strategy
3. Write a good recount text
1. The Flood
2. My First Time in Senior High School
3. The Sweetest
Birthday Party
4. My First Experience to Ride Motorcycle
5. My Unfortunate
1. Identifying the information of recount text
2. Writing a good recount text
Writing test
1 1
2. Reliability Test
Fraenkel and Wallen (2009, p. 47) state that reliability refers to the
consistency of scores or answer from one administration of an instrument to
another and from one set of items to another. Firstly, in this study, the writer
used inter-rater reliability to know whether the test was reliable or not. Inter-

35
rater reliability occurs when two or more scorers yield inconsistent scores of
the same test, possibly for lack or attention for scoring criteria, inexperience,
inattention, or even preconceived biases (Brown, 2004, p. 21). Inter-rater
reliability was the degree of agreement among raters. Then, the writer used
test-retest method to measure the questionnaire which had been considered
valid was reliable or not. The test-retest method involves administering the
same test twice to the same group after a certain time interval has elapsed. A
reliability coefficient is then calculated to indicate a relationship between the
two sets of scores obtained. (Fraenkel and Wallen, 2009, p. 155).
The writer did the tryout of writing test instrument and
questionnaire at M.A Al-Fatah Palembang to the tenth grade students with
total 30 students as the sample for finding reliability of the test. Meanwhile,
the research study was done at SMA Muhammadiyah 5 Palembang.
The score of students‟ recount text test was calculated by two
raters. The first rater was Wissudarti, M.Pd. She is a teacher of English at
SMP Kartika II-1 Palembang. The second rater was Arief Pamuji, M.Pd. He
is a lecturer at Bina Husada Palembang (see appendix K).
In scoring writing skill, the writer used analytic scoring rubric for
personal writing or recount text. According to Glencoe and McGraw-Hill
(2000, p. 8), analytic scoring is based on an in-depth analysis of aspects of
writing such as focus/organization, elaboration/support/style, and grammar,
usage, and mechanics. Analytic scoring is usually based on a scale of 0–100
with each aspect receiving a portion of the total points. Various

36
characteristics are listed under each aspect, forming categories, and each
category is assigned a weighted score. Regardless of the number of
characteristics in any particular category, the weight of the category stays
the same. For example, analytic scoring based on a possible total of 100
points might be weighted in this way: Focus/Organization 35 points;
Elaboration/Support/Style 35 points Grammar, Usage, and Mechanics 30
points (Glencoe and McGraw-Hill, 2000, p. 8).
Then the two sets of score was calculated by Spearman rank order
method formula suggested by Hatch and Lazaraton (1991, p. 453) to find
out whether or not the the instruments were reliable. The formula as follows:
Where:
R : Rank order correlation
d2 : Different rank score
n : The number of the students
The test was reliable if the result of the data measurement was higher
than 0.70. According to Frankel et al (2012, p. 157), for the purpose of a rule
thumb is that reliability should be at least 0.70 and preferable higher.
The rank order correlation was calculated to find the differences
between the two sets of rankings using the formula as follows:

37
R=1-
R=1-
R=1-
R=1-
R=1- 0,062736
R= 0,937264
R=0.94
From the result of rank order correlation was found that the
coefficient reliability of the writing test was 0.94 (see appendix C) and higher
than 0.70. Therefore, it can be stated that the assessment result was reliable.
The students‟ scores of questionnaire were taken from percentage of
students‟ responses which had been calculated by Quipper School Indonesia
(online learning media). To measure the test-retest method, Pearson
Correlation Coefficient in SPSS was used. The result analysis of reliable test
showed that the score of pearson correlation was 0.722. From the p-output, it
could be stated that the questionnaire was considered reliable since it was
higher than 0.70. For the complete data, it could be seen in appendix C.
38
G. Research Treatments
Treatment refers to action or process designed to find out that
something is effective, workable, and valid. The treatments was given in
experimental group by applying PQP (Praise-Question-Polish) strategy to the
tenth grade students of SMA Muhammadiyah 5 Palembang in academic year
2014/2015.
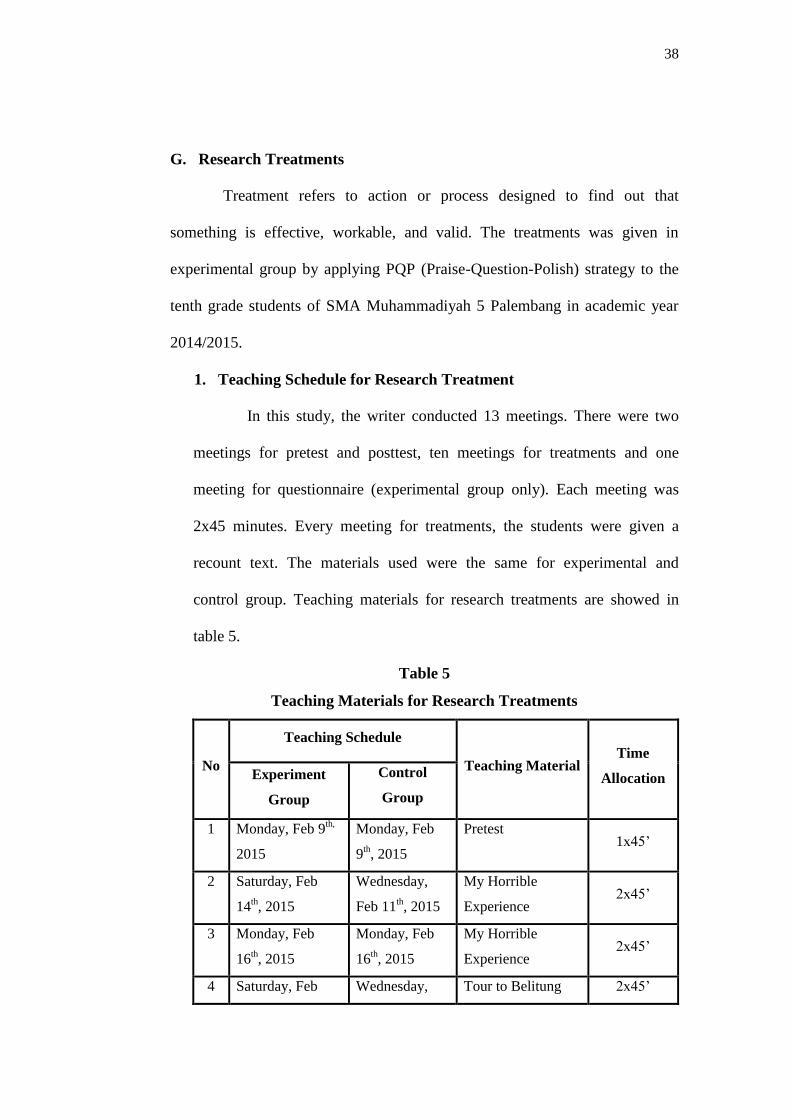
1. Teaching Schedule for Research Treatment
In this study, the writer conducted 13 meetings. There were two
meetings for pretest and posttest, ten meetings for treatments and one
meeting for questionnaire (experimental group only). Each meeting was
2x45 minutes. Every meeting for treatments, the students were given a
recount text. The materials used were the same for experimental and
control group. Teaching materials for research treatments are showed in
table 5.
Table 5
Teaching Materials for Research Treatments
No
Teaching Schedule
Teaching Material Time
Allocation Experiment
Group
Control
Group
1 Monday, Feb 9th,
2015
Monday, Feb
9th, 2015
Pretest 1x45‟
2 Saturday, Feb
14th, 2015
Wednesday,
Feb 11th, 2015
My Horrible
Experience 2x45‟
3 Monday, Feb
16th, 2015
Monday, Feb
16th, 2015
My Horrible
Experience 2x45‟
4 Saturday, Feb Wednesday, Tour to Belitung 2x45‟

39
21st, 2015 Feb 18th, 2015 Island
5 Monday, Feb
23rd, 2015
Monday, Feb
23rd, 2015
Tour to Belitung
Island 2x45‟
6 Saturday, Feb
21rd, 2015
Wednesday,
Feb 25th, 2015
Riding Bike to
Smith Beach 2x45‟
7 Saturday, Feb
28rd, 2015
Monday, Feb
23rd, 2015
Riding Bike to
Smith Beach 2x45‟
8 Monday, Mar 2nd,
2015
Monday, Mar
2nd, 2015 Children‟s Day 2x45‟
9 Saturday, Mar
7th, 2015
Wednesday,
Mar 4th, 2015 Children‟s Day 2x45‟
10 Monday, Mar 9th,
2015
Monday, Mar
9th, 2015
My Rainforest
Adventure 2x45‟
11 Saturday, Mar
14th, 2015
Wednesday,
Mar 11th, 2015
My Rainforest
Adventure 2x45‟
12 Saturday, Mar
28th, 2015
Wednesday,
Mar 25th, 2015 Posttest 1x45‟
13 Monday, Mar 30th, 2015
Questionnaire for
experimental group 2x45‟
2. Teaching Procedures for Research Treatment
To make the writer easier in doing the treatments, the writer
developed the procedures of both experimental and control group in
teaching writing recount text. The procedures could be seen in table 6.
Table 6
Teaching Procedures for Research Treatment
NO
ME
ET
ING
TEACHING PROCEDURES
EXPERIMENT GROUP CONTROL GROUP
LEARNING ACTIVITIES
TIME ALLOCATION
LERNING ACTIVITIES
TIME ALLOCATION

40
1 1st
meeting Pretest 45‟ Pretest 45‟
2 2nd meeting
1. Pre-activities
Teacher greets students
2.Whilst activites
Prewriting (teacher explains about recount text and topic 1 about „My Horrible Experience’)
Drafting (the teacher gives exercise [Practice on the topic] to the students to compose recount based on the topic above)
10‟
40‟
40‟
1. Pre-activities
Teacher greets students
2. Whilst activities
teacher explains about recount text and topic 1 about „My Horrible Experience’
10‟
80‟
3 3rd meeting
Revision stage by using PQP (practice continued).
- Teacher assigns students to group wchich consists of 3 students)
- Teacher prepares and distributes PQP guide
- Teacher has the students in each group designate one student the author, one the recorder, and one the reader.
- Instruct the author to pass the PQP guide to the recorder and the draft to the reader
- Instruct the reader to read the draft
10‟
10‟
5‟
5‟
35‟
─ Contiue whilst activities
Write down the general topic at the top of paper.
Then make a list of every idea that comes into students‟ mind about that topic. Keep the ideas flowing. Try to stay on the' general topic; however, if students write down information that is completely off the topic. don't worry about it because the students can cross it out later
Use words. phrases. or
10‟
25‟

41
aloud while the others listen. Then instruct the recorder to fill in the PQP guide with suggestions for revision
- Instruct the group to repeat the process until all three drafts have been read and each PQP guide has been completed
- Instruct the student to return the drafts and PQP guide to the authors, who will then use the guides for revision
Teacher asks the students to collect the draft of recount text which is written by the students
3.Post activities
The teacher asks the students who want to make conclusion about the material today that learned and closes the class
15‟
5‟
5‟
sentences, and don't worry about spelling or grammar
Now rewrite the list and group similar ideas together. Cross out items that don't belong or that are duplications
3. Post activities
The teacher asks the students who want to make conclusion about the material today that learned and closes the class
50‟
5‟
4 4th – 11th meeting
1.Pre-activities
Teacher greeting students
2.Whilst activites
Prewriting (teacher explains the topic 2,3,4 and 5 about „Tour to Belitung Island’, ‘Riding Bike to
10‟
40‟
1. Pre-activities
Teacher greets students
2. Whilst activities teacher explains about recount text and topic 2,3,4 and 5 about „Tour to Belitung Island’, ‘Riding Bike to
10‟
80‟

42
Smith Beach’, Children’s Day’, ‘My Rainforest Adventure’)
Drafting (the teacher gives exercise [practice on the topic] to the students to compose recount based on the topic above)
40‟
Smith Beach’, ‘Children’s Day’, ‘My Rainforest Adventure’)
Revision stage by using PQP (practice continued).
- Teacher assigns students to group wchich consists of 3 students)
- Teacher prepares and distributes PQP guide
- Teacher has the students in each group designate one student the author, one the recorder, and one the reader.
- Instruct the author to pass the PQP guide to the recorder and the draft to the reader
- Instruct the reader to read the draft aloud while the others listen. Then instruct the recorder to fill in the PQP guide with suggestions for revision
- Instruct the group to repeat the process until all
10‟
10‟
5‟
5‟
35‟
─ Contiue whilst activities
Write down the general topic at the top of paper.
Then make a list of every idea that comes into students‟ mind about that topic. Keep the ideas flowing. Try to stay on the' general topic; however, if students write down information that is completely off the topic. don't worry about it because the students can cross it out later
Use words. phrases. or sentences, and don't worry about spelling or grammar
Now rewrite the list and group similar ideas together. Cross out items that don't belong or
10‟
25‟
50‟

43
three drafts have been read and each PQP guide has been completed
- Instruct the student to return the drafts and PQP guide to the authors, who will then use the guides for revision
Teacher asks the students to collect the draft of recount text which is written by the students
3.Post activities
The teacher asks the students who want to make conclusion about the material today that learned and closes the class
15‟
5‟
5‟
that are duplications
3. Post activities
The teacher asks the students who want to make conclusion about the material today that learned and closes the class
5‟
5 12th meeting
Posttest 45‟ Posttest 45‟
6 13th meeting
Questionnaire for Experimental Group 90‟
H. Technique for Analyzing Data
For analyzing the data, the writer used IBM SPSS (Statistic Package
for the Social Science) Statistics version 20 for calculating students‟ scores in
pretest and posttest between two groups, experimental and control groups.
Then the writer presented the data by using some steps and techniques as
follows:

44
1. Data descriptions
In data description, distribution of frequency data and descriptive
statistics were illustrated from the obtained data of student‟s pretest and
posttest scores in control and experimental groups.
a. Distribution of frequency data
In distribution of frequency data, the student‟s score, frequency,
percentage are achieved. The distribution of frequency data were got from
(1) pretest score in control group, (2) posttest score in control group, (3)
pretest score in experimental group, (4) posttest score in experimental
group. Then, the distribution of frequency data is displayed in a table
analysis.
b. Descriptive statistics
In descriptive statistics, number of sample, the score of minimal,
maximal, mean, standard deviation, and standard error of mean were
obtained. Descriptive statistics was obtained from (1) pretest score in
control group, (2) posttest score in control group, (3) pretest score in
experimental group, (4) posttest score in experimental group.
2. Pre-requisite Analysis
Before analyzing the obtained data, pre-requisite analysis should be
done to see whether or not the data was normal and homogen.

45
a. Normality Test
According to Basrowi and Soenyono (2007, p. 85) Normality test
is used to measure whether the obtained data is normal or not. The data
can be classified into normal whenever the p-output is higher than 0,025.
In measuring normality test, 1-sample Kolmogorov-Smirnov was used.
The normality test was used to measure student‟s pretest and posttest
scores in control and experimental groups.
b. Homogeneity Test
Homogeneity test was used to measure the obtained scores whether
it was homogenous or not. Basrowi and Soenyono (2007, p. 106) states
that the score is categorized homogenous when the p-output was higher
than mean significant difference at 0,05 level. In measuring homogeneity
test, Levene Statistic in SPSS was used. The homogeneity test was used to
measure student‟s pretest and posttest scores in control and experimental
groups.
3. Hypothesis Testing
a. Measuring a Significant Difference on Students’ Achievement in
Writing Recount Text Taught by Using PQP (Praise-Question-
Polish) Strategy and Teacher’s Method
In measuring a significant difference on students‟ achievement in
writing recount text taught using PQP strategy and teacher‟s method,

46
independent sample t-test was used. A significant different was found
whenever the p-output is lower than 0,05 level and the t-value was higher
than t-table (Df.78:2000).
b. Measuring Students’ Responses on the Implementation of PQP
(Praise-Question-Polish) Strategy
In measuring students‟ responses on the implementation of PQP
(Praise-Question-Polish) strategy, the writer used Quipper School
Indonesia (online learning media). The implementation of PQP (Praise-
Question-Polish) strategy was successful in improving students‟
achievement in writing recount text whenever the result of questionnaire
was students‟ positive responses higher than students‟ negative responses.