Upload
others
View
3
Download
0
Embed Size (px)
Citation preview

Chapter 9 Making Capital Investment Decisions
9-1
The role of the financial manager is to answer these questions
9-2
What Investments Do
You Make
How Do You Finance These Investments
How Will You Manage Daily
Financial Activities
Capital Budgeting Decisions
Capital Structure Decisions
Working Capital Decisions
Making Capital Investment Decisions (Ch 9)
Investment Criteria (Ch 8)
FV and PV ndash Multiple Cash Flows (Ch 5)
FV and PV ndash Single Lump Sum (Ch 4)
Analyzing Financial Statements (Ch 3)
Financial Statements and Cash Flow (Ch 2)
Goal of Financial Management (Ch 1)
9-3
Blue Hen Brewery has developed a new style of beer that they think will be a big seller in the marketplace Higher alcohol content 16 ounce cans vs 12 ounce bottles
We need to determine whether or not this investment will increase shareholder value
9-4
Cash flow estimates are the starting point in analyzing an investment The cash flows were simply given to us in Chapter 8
We now need to understand where these cash flows come from And determine which cash flows should be considered in
the investment decision
9-5
Understand how to determine the relevant cash flows for a proposed investment
Understand how to analyze a projectrsquos projected cash flows
Learn how to evaluate an estimated NPV Scenario analysis Sensitivity analysis
9-6
Relevant Cash Flows
9-7
Once a company decides to take on a new investment project their cash flows are going to be different If the Blue Hen Brewery takes on this new product
line their cash flows will be altered
The challenge for the Finance manager is to determine if the change in cash flows that result from the investment will increase the shareholder value
9-8
9-9
Incremental Cash Flows for a Project
Relevant Cash Flows
Include only cash flows that will only occur if the project is accepted Incremental cash flows
The stand-alone principle allows us to analyze each project in isolation from the firm simply by focusing on incremental cash flows
In general it is easy to determine cash flows that are directly linked to the investment project under consideration Incremental revenue from the new product (eg
sales of the new beer) Incremental costs from the new product (eg
brewing ingredients packaging marketing)
There are however some situations where it can be difficult to determine if cash flows are or are not relevant
9-10
Relevant
bullOpportunity costsbullSide effectserosionbullNet working capitalbullTax effectsbullAfter tax salvage value
Not Relevant
bull ldquoSunkrdquo costsbullFinancing costs
9-11
The most valuable alternative that is given up if a particular investment is undertaken
If the project being considered is using an asset that has alternative uses and value then it is a relevant cash flow
9-12
Opportunity Cost
For the new Blue Hen Brewery beer being considered the plan is to use an older brewery building that was purchased years ago for $100000 and after depreciation is currently on their books for $40000
Should this be considered in the cash flow analysis for evaluating the new higher-alcohol product for Blue Hen Brewery If so what is the relevant cash flow amount
9-13
Which of the following is correct with respect to how to treat the old building that will be used for the new Blue Hen Brewery productA Since it is currently not being used it should be viewed as
ldquofreerdquo and have no impact on the cash flow for analyzing the new investment opportunity (ie this is a sunk cost)
B The cash flow impact to the project should be $100000 since this is what the building cost years ago
C The cash flow impact to the project should be $40000 since this is what the book value of the building currently is
D None of the above
9-14
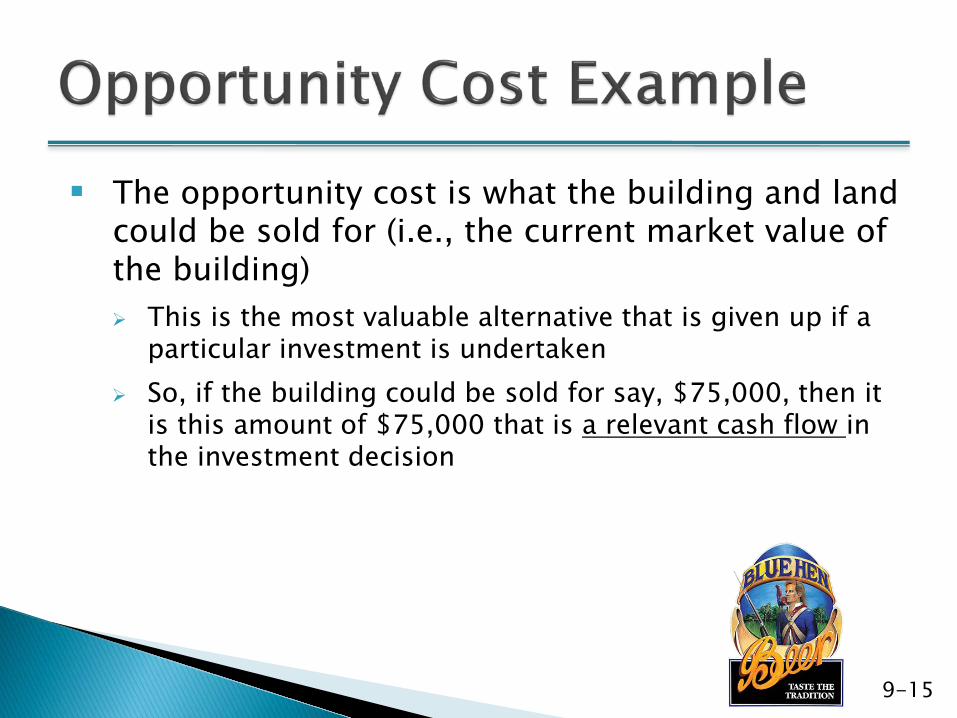
The opportunity cost is what the building and land could be sold for (ie the current market value of the building) This is the most valuable alternative that is given up if a
particular investment is undertaken So if the building could be sold for say $75000 then it
is this amount of $75000 that is a relevant cash flow in the investment decision
9-15
9-16
When a company launches a new product there could be ldquospilloverrdquo impacts on the sales of existing products Known as ldquoside effectsrdquo Can be positive ndash the new product increases the
sales of existing products Can be negative ndash the new product decreases
the sales of existing products (called ldquoerosionrdquo)
The cash flow of a new project that comes at the expense of a firmrsquos existing projects
Also known as ldquoproduct cannibalizationrdquo
9-17
Erosion
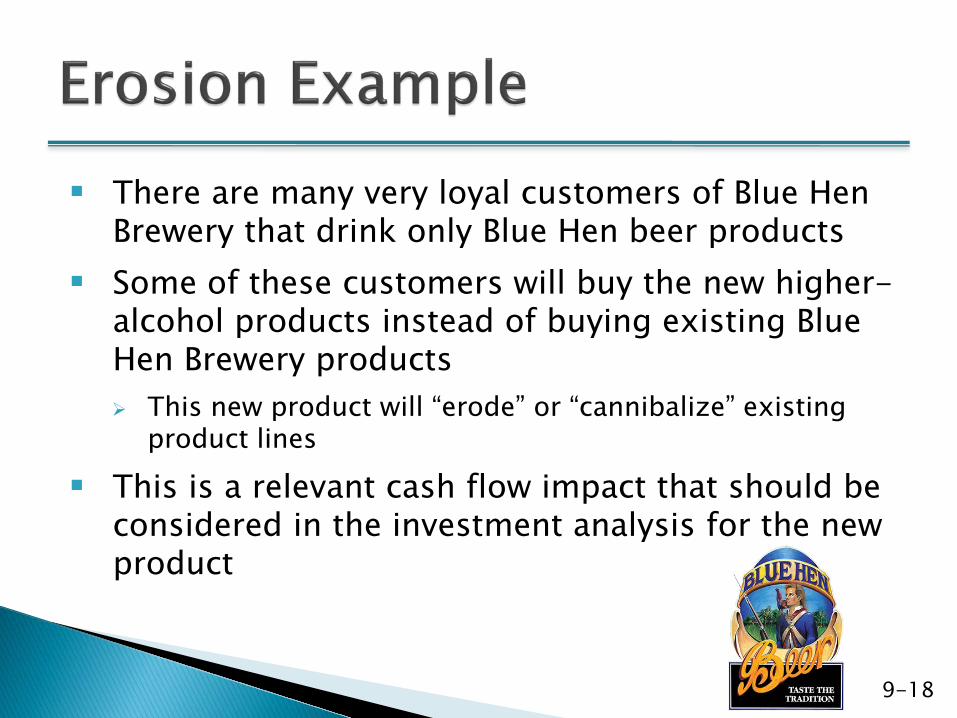
There are many very loyal customers of Blue Hen Brewery that drink only Blue Hen beer products
Some of these customers will buy the new higher-alcohol products instead of buying existing Blue Hen Brewery products This new product will ldquoeroderdquo or ldquocannibalizerdquo existing
product lines
This is a relevant cash flow impact that should be considered in the investment analysis for the new product
9-18
Thrill Rides is considering adding a new roller coaster to its amusement park The addition is expected to increase its overall ticket sales In particular the company expects to sell more tickets for its current roller coaster and experience extremely high demand for its new coaster Sales for its boat ride are expected to decline but food and beverage sales are expected to increase significantly All of the following are side effects associated with the new roller coaster with the exception of the
A Increased food sales
B Additional sales for the existing coaster
C Increased food costs from the higher food sales
D Reduced sales for the boat ride
E Ticket sales for the new coaster
9-19
9-20
Net working capital is Current Assets minus Current Liabilities
Current Assets Current Liabilitiesbull Cashbull Accounts Receivablebull Inventory
bull Accounts Payable
Most investment projects will impact a firmrsquos working capital Accounts receivable and inventory would increase to
support higher sales levels Accounts payable would likely increase as inventory
increases
These cash flows donrsquot appear on the income statement due to the GAAP matching principle Sales recorded when made not when cash is received Cost of goods sold recorded when sales are made
whether suppliers paid yet or not
9-21
In general most projects will require an investment in working capital at the beginning of the project This would need to be captured in the cash flow analysis
(as a cash outflow) at the time of launch or in the first year
At the end of the project the increase in working capital would no longer be needed as inventories are sold receivables collected etc This would need to be captured in the last year of the
project as a cash inflow from the release of working capital
9-22
We need to consider the tax impacts of all cash flows
Incremental cash flows are meant to be after-taxincremental cash flows
Which tax rate is most relevant for after-tax cash flowsA Marginal tax rateB Average tax rate
9-23
Many projects will require an investment in long-term assets at the beginning of the project This would need to be captured in the cash flow
analysis (as a cash outflow) at the time of launch
At the end of the project if there is value in this fixed asset the after-tax salvage value needs to be determined
9-24
If the salvage value is different from the book value of the asset then there is a tax effect which impacts cash flows
9-25
After-Tax Salvage
Salvage Amount= Tax rate [Salvage
Amount ndash Book Value]-
Book Value Initial Cost= - Accumulated
Depreciation
Straight-line depreciationD = (Initial cost ndash salvage) number of yearsStraight Line rarr Salvage Value
MACRS (Accelerated Depreciation)Depreciate rarr 0Recovery Period = Class Life12 Year ConventionMultiply percentage in table by the initial cost
9-26Copyright (c) 2017 McGraw-Hill Education All rights reserved No reproduction or distribution without the prior written consent of McGraw-Hill Education
You purchase a new piece of equipment for $100000 to be used in a project that will last 4 years If it is depreciated on a straight-line basis over 5 years what is the book value after 4 years
A $80000B $75000C $25000D $20000E $0
9-27
If you then sell this fixed asset at the end of the project (after 4 years) for $20000 what is your after-tax salvage value (Assume a 30 tax rate)
A $26000B $20000C $14000D $80000E $0
9-28
If you then sell this fixed asset at the end of the project (after 4 years) for $30000 what is your after-tax salvage value (Assume a 30 tax rate)
A $39000B $30000C $27000D $21000E $0
9-29
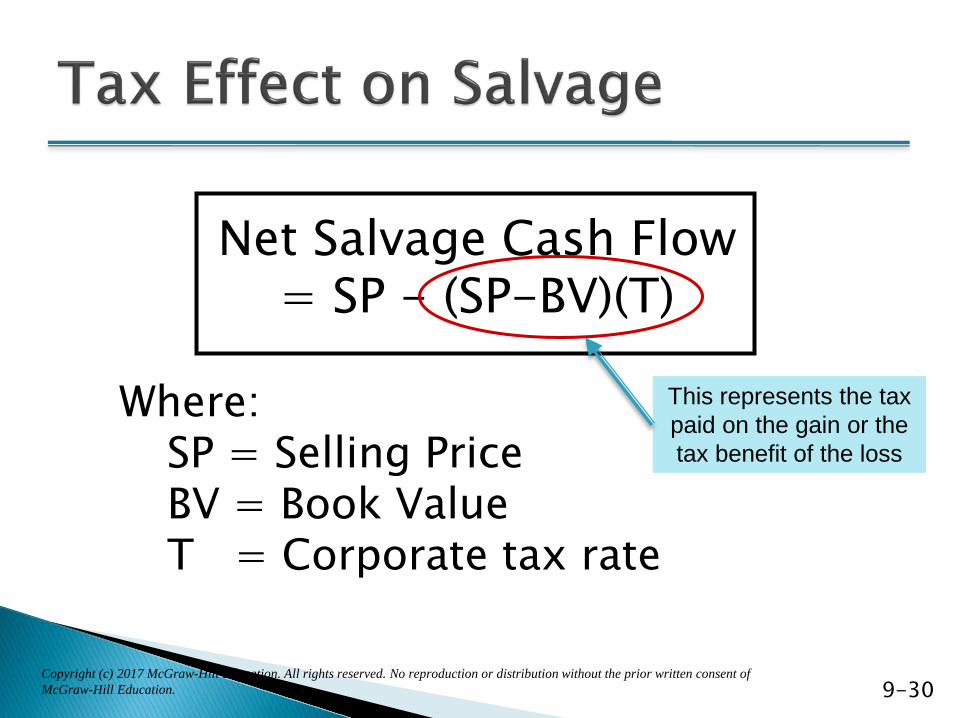
Net Salvage Cash Flow = SP - (SP-BV)(T)
WhereSP = Selling PriceBV = Book ValueT = Corporate tax rate
Copyright (c) 2017 McGraw-Hill Education All rights reserved No reproduction or distribution without the prior written consent of McGraw-Hill Education 9-30
This represents the tax paid on the gain or the tax benefit of the loss
Depreciation and After-Tax Salvage Car purchased for $12000 5-year property Marginal tax rate = 34
9-31
Depreciation 5-year Asset
Year Beg BV Depr Deprec End BV1 1200000$ 2000 240000$ 960000$ 2 960000$ 3200 384000$ 576000$ 3 576000$ 1920 230400$ 345600$ 4 345600$ 1152 138240$ 207360$ 5 207360$ 1152 138240$ 69120$ 6 69120$ 576 69120$ -$
10000 1200000$
Copyright (c) 2017 McGraw-Hill Education All rights reserved No reproduction or distribution without the prior written consent of McGraw-Hill Education
Depreciation 5-year Asset
Year Beg BV Depr Deprec End BV1 1200000$ 2000 240000$ 960000$ 2 960000$ 3200 384000$ 576000$ 3 576000$ 1920 230400$ 345600$ 4 345600$ 1152 138240$ 207360$ 5 207360$ 1152 138240$ 69120$ 6 69120$ 576 69120$ -$
10000 1200000$
Net Salvage Cash Flow = SP - (SP-BV)(T)If sold at EOY 5 for $3000
NSCF = 3000 - (3000 - 69120)(34) = $221501= $3000 ndash 78499 = $221501
If sold at EOY 2 for $4000NSCF = 4000 - (4000 - 5760)(34) = $459840
= $4000 ndash (-59840) = $459840
Copyright (c) 2017 McGraw-Hill Education All rights reserved No reproduction or distribution without the prior written consent of McGraw-Hill Education 9-32
What is the after-tax net salvage cash flow at end of year 5 and 2
A cost that has already been incurred and cannot be recouped
Therefore it should not be considered in an investment decision
9-33
Sunk Cost
The Blue Hen Brewery spent $100000 on market research and consulting fees to analyze their higher-alcohol beer product
Is this a sunk costA YesB NoC More information is needed
9-34
In Chapter 2 we learned that financing costs (eg interest expense) is a cash flow to creditors Interest expense is not an operating expense
We care only about cash flow from assets when we make investment decisions
Financing decisions are important but this is a separate question from deciding if an investment increases shareholder value or not Thus Financing costs are not a relevant cash flow in
analyzing an investment project
9-35
Relevant
bullOpportunity costsbullSide effectserosionbullNet working capitalbullTax effectsbullAfter-tax salvage value
Not Relevant
bull ldquoSunkrdquo costsbullFinancing costs
9-36
Which one of the following principles refers to the assumption that a project will be evaluated based on its incremental cash flows
A Forecast assumption principleB Base assumption principleC Fallacy principleD Erosion principle E Stand-alone principle
9-37
A cost that should be ignored when evaluating a project because that cost has already been incurred and cannot be recouped is referred to as a(n)
A Fixed costB Forgotten costC Variable costD Opportunity costE Sunk cost
9-38
Lake City Plastics currently produces plastic plates and silverware The company is considering expanding its product offerings to include plastic serving trays All of the following are relevant costs to this project with the exception of
A The cost of additional utilities required to operate the serving tray production operation
B Any change in the expected sales of plates and silverware gained from offering trays also
C A percentage of the current operating overhead
D The additional plastic raw materials that would be required
E The cost to acquire the forms needed to mold the trays
9-39
Which one of the following terms is most commonly used to describe the cash flows of a new project that are simply an offset of reduced cash flows for a current project
A Opportunity costB Sunk costC ErosionD Replicated flowsE Pirated flows
9-40
Pro Forma Financial
Statements and Cash Flows
9-41
The process to evaluate a proposed investment is as follows
9-42
Pro Forma Financial
Statements
Projected Cash Flows
Estimate Project Value
bull Assumptions are gathered and these serve as the basis for the pro forma financial statements
bull Incremental cash flows need to be determined Cash flow from
assets
bull Project value is determined NPV IRR PI Payback
Financial statements projecting future yearsrsquo operations Pro forma income
statement Pro forma balance sheet
Summarizes all relevant information for a project
9-43
Pro Forma Financial
Statements
Underwater Adventures Inc specializes in selling unique underwater experiences for scuba divers and snorkelers They have developed a ldquoshark attractantrdquo product to meet
this demand of customers who want to get close to sharks for better photos to post on social media
We have been asked to evaluate whether launching this product is a good idea
9-44
Estimated sales 50000 cans Sales Price per can $400 Cost per can $250 Estimated life 3 years Fixed costs $12000year Initial equipment cost $90000
100 depreciated over 3 year life Investment in NWC $20000 Tax rate 34 Cost of capital 20
Copyright (c) 2017 McGraw-Hill Education All rights reserved No reproduction or distribution without the prior written consent of McGraw-Hill Education 9-45
9-46Copyright (c) 2017 McGraw-Hill Education All rights reserved No reproduction or distribution without the prior written consent of McGraw-Hill Education
Sales (50000 units at $400unit) $200000Variable Costs ($250unit) ($125000)Gross Profit $75000Fixed Costs ($12000)Depreciation ($90000 3) ($30000)EBIT $33000Taxes (34) ($11200)
Net Income $21780
The pro forma income statement currently does not have any interest expense
Should interest expense be includedA YesB No
9-47
No interest expense is a financing expense and not a component of operating cash flow
We need to understand the cash flow impacts that result from changes in the balance sheet Investments in working capital (eg higher
inventory and accounts receivable) Investments in fixed assets (ie capital
requirements of the project) We donrsquot care about the financing aspects
of the balance sheet For the same reason we didnrsquot consider interest
expense in the pro forma income statement9-48
Estimated sales 50000 cans Sales Price per can $400 Cost per can $250 Estimated life 3 years Fixed costs $12000year Initial equipment cost $90000
100 depreciated over 3 year life Investment in NWC $20000 Tax rate 34 Cost of capital 20
Copyright (c) 2017 McGraw-Hill Education All rights reserved No reproduction or distribution without the prior written consent of McGraw-Hill Education 9-49
9-50Copyright (c) 2017 McGraw-Hill Education All rights reserved No reproduction or distribution without the prior written consent of McGraw-Hill Education
Year0 1 2 3
Net Working Capital
$20000 $20000 $20000 $20000
Net Fixed Assets
90000 60000 30000 0
Total Investment
$110000 $80000 $50000 $20000
Net Fixed Assets declines by the amount of depreciation each year
The process to evaluate a proposed investment is as follows
9-51
Pro Forma Financial
Statements
Projected Cash Flows
Estimate Project Value
9-52
Net Income Depreciation= +
Earnings Before Interest amp Taxes Depreciation Taxes= + -
Operating Cash Flow
Operating Cash Flow= minus
Net Capital
Spending
Changes in Net
Working Capital
Cash Flow from
Assetsminus
+ Interest
Will be 0 since interest is not a
relevant cash flow
9-53
Sales (50000 units at $400unit)
$200000
Variable Costs ($250unit) (125000)
Gross profit $ 75000
Fixed costs (12000)
Depreciation ($90000 3) (30000)
EBIT $ 33000
Taxes (34) (11220)
Net Income $ 21780=======
What is the operating cash flow
A $21750B $33000C $63000D $51780E $63780
9-54
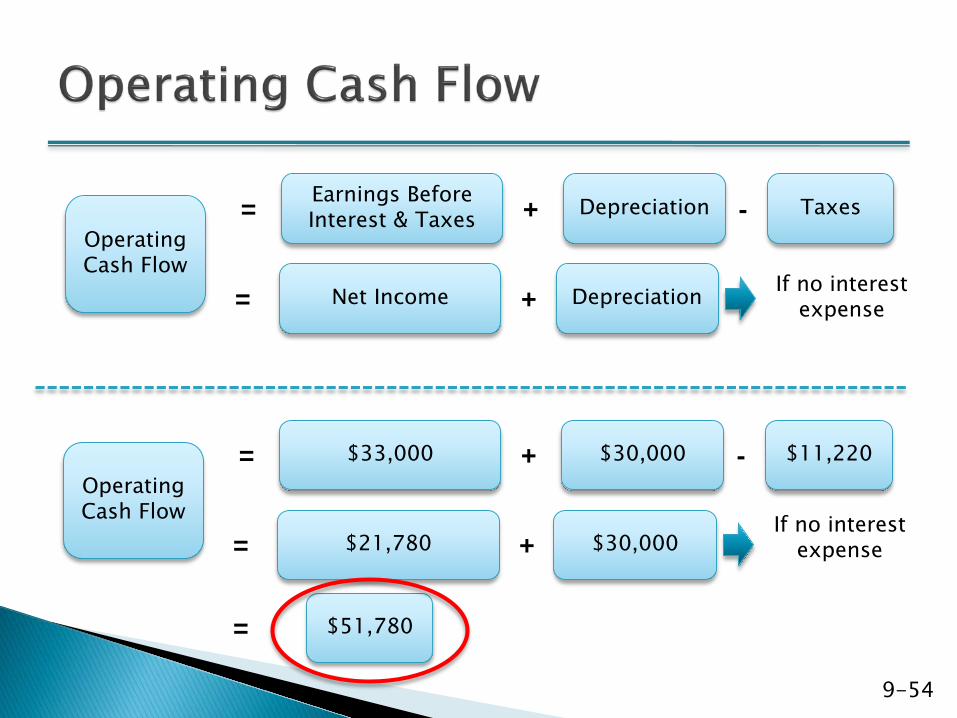
Net Income Depreciation= + If no interest expense
Earnings Before Interest amp Taxes Depreciation Taxes= + -
Operating Cash Flow
$21780 $30000= +If no interest
expense
$33000 $30000 $11220= + -Operating Cash Flow
= $51780
9-55
Year
0 1 2 3
OCF $51780 $51780 $51780
NWC -$20000 20000
Capital Spending
-$90000
CFFA -$110000 $51780 $51780 $71780
Note Investment in NWC is recovered in final yearEquipment cost is a cash outflow in year 0
Copyright (c) 2017 McGraw-Hill Education All rights reserved No reproduction or distribution without the prior written consent of McGraw-Hill Education
9-56Copyright (c) 2017 McGraw-Hill Education All rights reserved No reproduction or distribution without the prior written consent of McGraw-Hill Education
Year 0 1 2 3Sales 200000 200000 200000Variable Costs 125000 125000 125000Gross Profit 75000 75000 75000Fixed Costs 12000 12000 12000Depreciation 30000 30000 30000EBIT 33000 33000 33000Taxes 11220 11220 11220Net Income 21780 21780 21780
Operating Cash Flow 51780 51780 51780Changes in NWC -20000 20000Net Capital Spending -90000Cash Flow From Assets -110000 51780 51780 71780
Pro Forma Income Statement
Cash Flows
The process to evaluate a proposed investment is as follows
9-57
Pro Forma Financial
Statements
Projected Cash Flows
Estimate Project Value
9-58
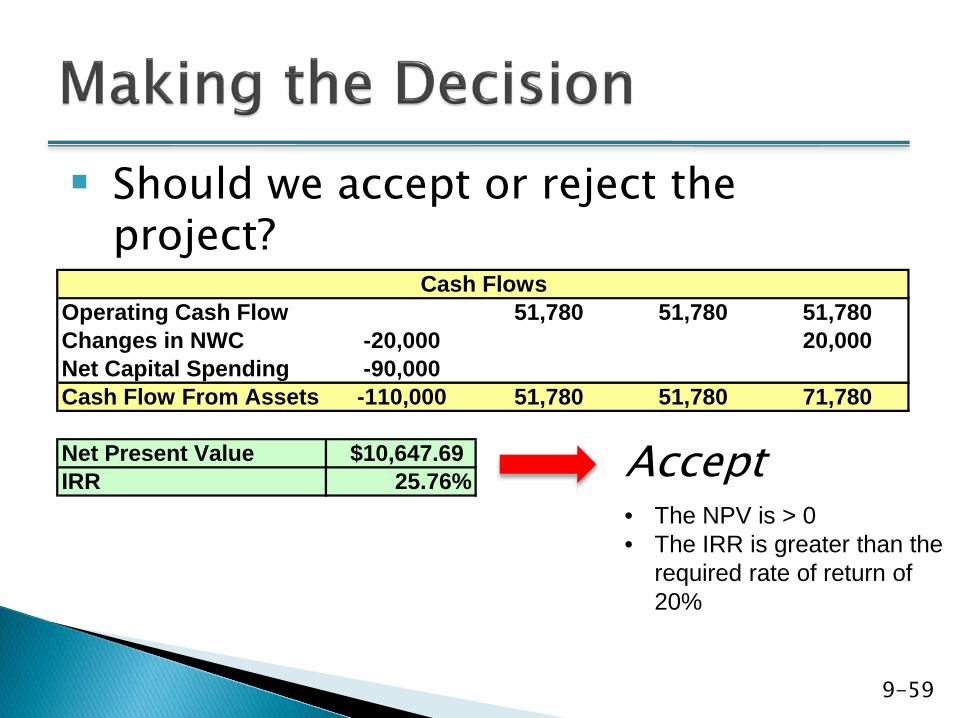
Operating Cash Flow 51780 51780 51780Changes in NWC -20000 20000Net Capital Spending -90000Cash Flow From Assets -110000 51780 51780 71780
Net Present Value $1064769IRR 2576
Cash Flows
We can estimate the project value by calculation the NPV and IRR
9-59
Operating Cash Flow 51780 51780 51780Changes in NWC -20000 20000Net Capital Spending -90000Cash Flow From Assets -110000 51780 51780 71780
Net Present Value $1064769IRR 2576
Cash Flows
Should we accept or reject the project
Acceptbull The NPV is gt 0bull The IRR is greater than the
required rate of return of 20
9-60
Year 0 1 2 3Sales 200000 200000 200000Variable Costs 125000 125000 125000Gross Profit 75000 75000 75000Fixed Costs 12000 12000 12000Depreciation 30000 30000 30000EBIT 33000 33000 33000Taxes 11220 11220 11220Net Income 21780 21780 21780
Operating Cash Flow 51780 51780 51780Changes in NWC -20000 20000Net Capital Spending -90000Cash Flow From Assets -110000 51780 51780 71780
Net Present Value $1064769IRR 2576
Pro Forma Income Statement
Cash Flows
OCF = EBIT + Depreciation ndash TaxesOCF = Net Income + Depreciation (if no interest)
Copyright (c) 2017 McGraw-Hill Education All rights reserved No reproduction or distribution without the prior written consent of McGraw-Hill Education
A new project is expected to generate an operating cash flow of $38728 and will initially free up $11610 in net working capital Purchases of fixed assets costing $52800 will be required to start up the project What is the total cash flow for this project at time zero
A -$64410
B -$41190
C -$52800
D $25682
E $50338
9-61
The pro forma income statement for a proposed investment should include all of the following except
A Fixed costsB Forecasted salesC Depreciation expenseD TaxesE Changes in net working capital
9-62
9-63
Sales (50000 units at $400unit)
$200000
Variable Costs ($250unit) (125000)
Gross profit $ 75000
Fixed costs (12000)
Depreciation ($90000 3) (30000)
EBIT $ 33000
Taxes (34) (11220)
Net Income $ 21780=======
What is the operating cash flow (using the approaches already learned)
A $21750B $33000C $63000D $51780E $63780
9-64
Net Income Depreciation= + If no interest expense
Earnings Before Interest amp Taxes Depreciation Taxes= + -
Operating Cash Flow
$21780 $30000= +If no interest
expense
$33000 $30000 $11220= + -Operating Cash Flow
= $51780
Option 1
Option 2
The tax savings that results from the depreciation deduction
Calculated as depreciation multiplied by the corporate tax rate
9-65
Depreciation Tax Shield
9-66
(Sales ndash Costs) (1 ndash Tax Rate) = +Operating
Cash FlowDepreciation Tax Rate
Option 3
9-67
Sales (50000 units at $400unit)
$200000
Variable Costs ($250unit) (125000)
Gross profit $ 75000
Fixed costs (12000)
Depreciation ($90000 3) (30000)
EBIT $ 33000
Taxes (34) (11220)
Net Income $ 21780=======
What is the operating cash flow using the tax shield approach
9-68
($200000 -$137000) 66
+ $30000 34
= $51780
=
(Sales ndash Costs) (1 ndash Tax Rate) = +Operating
Cash FlowDepreciation Tax Rate
Which one of the following is the formula for computing operating cash flow
A Net Income + Depreciation + InterestB Net Income + Depreciation - InterestC EBIT + Depreciation - TaxesD (Sales ndash Costs) (1-Tax Rate) + (Depreciation Tax Rate)E A C and D
9-69
Evaluating NPV
Estimates
9-70
Calculating NPV is just an estimate based on the best information available The calculations could be wrong The confidence level in the analysis is a
judgment call A positive NPV suggests the project may be
worth doing But more analysis normally would be required
It is important to understand what the NPV looks like when things donrsquot go as planned
9-71
9-72
If NPV gt 0 Accept the project
Maybe accept the
project
Why maybe
9-73
What drives the NPV result
Projected future cash
flow
How do you know your projected estimates are
accurate
9-74
Forecasting Risk
We need to develop some tools to understand where potential estimate errors may exist
The possibility that errors (or poor estimates) in projected cash flows will lead to incorrect decisions
Also called ldquoestimation riskrdquo
The following tools will help assess the reasonableness of the NPV analysis
9-75
What-If Analysis
Scenario analysis Sensitivity analysis
Understand sources of value
Articulate what drives the investment to deliver a positive NPV
A positive NPV is creating value for the shareholders
We should understand what is the source of this value
9-76
Project Idea Potential Questions to Answer
New Product bull Is this new product better than the competitionbull Does this new product meet an unmet consumer need
Marketing Campaign
bull Is it reasonable that this marketing effort can increase sales as estimated
CompanyAcquisition
bull Are there sufficient synergies that can be realized to justify the purchase price
Cost Improvements
bull How realistic is it that the expected cost savings will truly materialize in the time frame noted (without unexpected negative impacts)
9-77
Scenario Analysis
The determination of what happens to NPV estimates when we ask what-if questions
Sensitivity Analysis
Investigation of what happens to NPV estimates when only one variable is changed
Scenario and Sensitivity Analysis
9-78
Examines several possible situations Worst case Base case or most likely case Best case
Provides a range of possible outcomes
Copyright (c) 2017 McGraw-Hill Education All rights reserved No reproduction or distribution without the prior written consent of McGraw-Hill Education 9-79
Copyright (c) 2017 McGraw-Hill Education All rights reserved No reproduction or distribution without the prior written consent of McGraw-Hill Education
Base Lower UpperUnits 6000 5500 6500 Priceunit 8000$ 7500$ 8500$ Variable costunit 6000$ 5800$ 6200$ Fixed costyear 50000$ 45000$ 55000$
BASE BEST WORST
Initial investment 200000$ Depreciated to salvage value of 0 over 5 yearsDeprecyr 40000$
Project Life 5 yearsTax rate 34Required return 12
Note ldquoLowerrdquo ne WorstldquoUpperrdquo ne Best
9-80
Copyright (c) 2017 McGraw-Hill Education All rights reserved No reproduction or distribution without the prior written consent of McGraw-Hill Education
BASE WORST BESTUnits 6000 5500 6500 Priceunit 8000$ 7500$ 8500$ Variable costunit 6000$ 6200$ 5800$ Fixed Cost 50000$ 55000$ 45000$
Sales 480000$ 412500$ 552500$ Variable Cost 360000 341000 377000Fixed Cost 50000 55000 45000Depreciation 40000 40000 40000EBIT 30000 (23500) 90500Taxes 10200 (7990) 30770Net Income 19800 (15510) 59730 + Deprec 40000 40000 40000
TOTAL CF 59800 24490 99730
NPV 15566 (111719) 159504
IRR 151 -144 409
9-81
Considers only a few possible outcomes
Assumes perfectly correlated inputs All ldquobadrdquo values occur together and
all ldquogoodrdquo values occur together More likely to have some ldquobadrdquo values
and some ldquogoodrdquo values
9-82
Shows how changes in an input variable affect NPV or IRR
Each variable is fixed except one Change one variable to see the effect
on NPV or IRR Answers ldquowhat ifrdquo questions
Copyright (c) 2017 McGraw-Hill Education All rights reserved No reproduction or distribution without the prior written consent of McGraw-Hill Education 9-83
Unit Sales Sensitivity
$(8226)
$15566
$39357
-2000000
-1000000
000
1000000
2000000
3000000
4000000
5000000
5500 6000 6500
Unit Sales
NPV
Copyright (c) 2017 McGraw-Hill Education All rights reserved No reproduction or distribution without the prior written consent of McGraw-Hill Education 9-84
Copyright (c) 2017 McGraw-Hill Education All rights reserved No reproduction or distribution without the prior written consent of McGraw-Hill Education
Base Fixed Cost Fixed CostUnits 6000 6000 6000 Priceunit 80$ 80 80Variable costunit 60$ 60 60Fixed costyear 50000$ 55000 45000
Initial investment 200000$ Depreciated to salvage value of 0 over 5 yearsDeprecyr 40000$
Tax rate 34Required Return 12
BASE FC FCUnits 6000 6000 6000 Priceunit 80$ 80$ 80$ Variable costunit 60$ 60$ 60$ Fixed cost 50000$ 55000$ 45000$
Sales 480000$ 480000$ 480000$ Variable Cost 360000 360000 360000 Fixed Cost 50000 55000 45000 Depreciation 40000 40000 40000 EBIT 30000 25000 35000 Taxes 10200 8500 11900 Net Income 19800 16500 23100 + Deprec 40000 40000 40000
TOTAL CF 59800 56500 63100
NPV 15566$ 3670$ 27461$
Fixed Cost Sensitivity
$27461
$15566
$3670
000
500000
1000000
1500000
2000000
2500000
3000000
$45000 $50000 $55000Fixed Cost
NPV
9-85
Strengths Identifies dangerous variables Gives some breakeven information
Weaknesses Says nothing about the likelihood of
change in a variable Ignores relationships among
variables
9-86
Neither provides a decision rule No indication whether a projectrsquos
expected return is sufficient to compensate for its risk
Ignores diversification Measures only stand-alone risk which
may not be the most relevant risk in capital budgeting
Copyright (c) 2017 McGraw-Hill Education All rights reserved No reproduction or distribution without the prior written consent of McGraw-Hill Education 9-87
Scenario analysis is best described as the determination of the
A Most likely outcome for a projectB Reasonable range of project outcomesC Variable that has the greatest effect on a projectrsquos
outcomeD Effect that a projectrsquos initial cost has on the projectrsquos net
present valueE Change in a projectrsquos net present value given a stated
change in projected sales
9-88
| Pro Forma Income Statements | |||||||||
| Year | 0 | 1 | 2 | 3 | |||||
| Sales | 200000 | 200000 | 200000 | ||||||
| Variable Costs | 125000 | 125000 | 125000 | ||||||
| Gross Profit | 75000 | 75000 | 75000 | ||||||
| Fixed Costs | 12000 | 12000 | 12000 | ||||||
| Depreciation | 30000 | 30000 | 30000 | ||||||
| EBIT | 33000 | 33000 | 33000 | ||||||
| Taxes | 11220 | 11220 | 11220 | ||||||
| Net Income | 21780 | 21780 | 21780 | ||||||
| Cash Flows | |||||||||
| Operating Cash Flow | 51780 | 51780 | 51780 | ||||||
| Changes in NWC | (20000) | 20000 | |||||||
| Net Capital Spending | (90000) | ||||||||
| Cash Flow From Assets | (110000) | 51780 | 51780 | 71780 | |||||
| Net Present Value | $1064769 | ||||||||
| IRR | 2576 |
| -30 | -20 | -10 | 0 | 10 | 20 | 30 | |||||||||
| UNITS | -70083865667486 | -415340381449136 | -129842106223412 | 155656169002312 | 441154444228038 | 726652719453761 | 101215099467949 | ||||||||
| FC | 512529013034468 | 393571398357083 | 274613783679698 | 155656169002312 | 36698554324927 | -82259060352458 | -201216675029843 |
| Sensitivity Analysis | |||||||||||||||||||||||||||||||||||||||
| -30 | -20 | -10 | 0 | 10 | 20 | 30 | -30 | -20 | -10 | 0 | 10 | 20 | 30 | ||||||||||||||||||||||||||
| Base | Units | Units | Units | Units | Units | Units | Units | Base | Fixed Cost | Fixed Cost | Fixed Cost | Fixed Cost | Fixed Cost | Fixed Cost | Fixed Cost | ||||||||||||||||||||||||
| Units | 6000 | 4200 | 4800 | 5400 | 6000 | 6600 | 7200 | 7800 | Units | 6000 | 6000 | 6000 | 6000 | 6000 | 6000 | 6000 | 6000 | ||||||||||||||||||||||
| Priceunit | $ 80 | 80 | 80 | 80 | 80 | 80 | 80 | 80 | Priceunit | $ 80 | 80 | 80 | 80 | 80 | 80 | 80 | 80 | ||||||||||||||||||||||
| Variable costunit | $ 60 | 60 | 60 | 60 | 60 | 60 | 60 | 60 | Variable costunit | $ 60 | 60 | 60 | 60 | 60 | 60 | 60 | 60 | ||||||||||||||||||||||
| Fixed costyear | $ 50000 | 50000 | 50000 | 50000 | 50000 | 50000 | 50000 | 50000 | Fixed costyear | $ 50000 | 35000 | 40000 | 45000 | 50000 | 55000 | 60000 | 65000 | ||||||||||||||||||||||
| Initial investment | $ 200000 | Initial investment | $ 200000 | ||||||||||||||||||||||||||||||||||||
| Depreciated to salvage value of 0 over 5 years | Depreciated to salvage value of 0 over 5 years | ||||||||||||||||||||||||||||||||||||||
| Deprecyr | $ 40000 | Deprecyr | $ 40000 | ||||||||||||||||||||||||||||||||||||
| Tax rate | 34 | Tax rate | 34 | ||||||||||||||||||||||||||||||||||||
| Required Return | 12 | Required Return | 12 | ||||||||||||||||||||||||||||||||||||
| BASE | UNITS | UNITS | UNITS | UNITS | UNITS | UNITS | UNITS | BASE | FC | FC | FC | FC | FC | FC | FC | ||||||||||||||||||||||||
| Units | 6000 | 4200 | 4800 | 5400 | 6000 | 6600 | 7200 | 7800 | Units | 6000 | 6000 | 6000 | 6000 | 6000 | 6000 | 6000 | 6000 | ||||||||||||||||||||||
| Priceunit | $ 80 | $ 80 | $ 80 | $ 80 | $ 80 | $ 80 | $ 80 | $ 80 | Priceunit | $ 80 | $ 80 | $ 80 | $ 80 | $ 80 | $ 80 | $ 80 | $ 80 | ||||||||||||||||||||||
| Variable costunit | $ 60 | $ 60 | $ 60 | $ 60 | $ 60 | $ 60 | $ 60 | $ 60 | Variable costunit | $ 60 | $ 60 | $ 60 | $ 60 | $ 60 | $ 60 | $ 60 | $ 60 | ||||||||||||||||||||||
| Fixed cost | $ 50000 | $ 50000 | $ 50000 | $ 50000 | $ 50000 | $ 50000 | $ 50000 | $ 50000 | Fixed cost | $ 50000 | $ 35000 | $ 40000 | $ 45000 | $ 50000 | $ 55000 | $ 60000 | $ 65000 | ||||||||||||||||||||||
| Sales | $ 480000 | $ 336000 | $ 384000 | $ 432000 | $ 480000 | $ 528000 | $ 576000 | $ 624000 | Sales | $ 480000 | $ 480000 | $ 480000 | $ 480000 | $ 480000 | $ 480000 | $ 480000 | $ 480000 | ||||||||||||||||||||||
| Variable Cost | 360000 | 252000 | 288000 | 324000 | 360000 | 396000 | 432000 | 468000 | Variable Cost | 360000 | 360000 | 360000 | 360000 | 360000 | 360000 | 360000 | 360000 | ||||||||||||||||||||||
| Fixed Cost | 50000 | 50000 | 50000 | 50000 | 50000 | 50000 | 50000 | 50000 | Fixed Cost | 50000 | 35000 | 40000 | 45000 | 50000 | 55000 | 60000 | 65000 | ||||||||||||||||||||||
| Depreciation | 40000 | 40000 | 40000 | 40000 | 40000 | 40000 | 40000 | 40000 | Depreciation | 40000 | 40000 | 40000 | 40000 | 40000 | 40000 | 40000 | 40000 | ||||||||||||||||||||||
| EBIT | 30000 | (6000) | 6000 | 18000 | 30000 | 42000 | 54000 | 66000 | EBIT | 30000 | 45000 | 40000 | 35000 | 30000 | 25000 | 20000 | 15000 | ||||||||||||||||||||||
| Taxes | 10200 | (2040) | 2040 | 6120 | 10200 | 14280 | 18360 | 22440 | Taxes | 10200 | 15300 | 13600 | 11900 | 10200 | 8500 | 6800 | 5100 | ||||||||||||||||||||||
| Net Income | 19800 | (3960) | 3960 | 11880 | 19800 | 27720 | 35640 | 43560 | Net Income | 19800 | 29700 | 26400 | 23100 | 19800 | 16500 | 13200 | 9900 | ||||||||||||||||||||||
| + Deprec | 40000 | 40000 | 40000 | 40000 | 40000 | 40000 | 40000 | 40000 | + Deprec | 40000 | 40000 | 40000 | 40000 | 40000 | 40000 | 40000 | 40000 | ||||||||||||||||||||||
| TOTAL CF | 59800 | 36040 | 43960 | 51880 | 59800 | 67720 | 75640 | 83560 | TOTAL CF | 59800 | 69700 | 66400 | 63100 | 59800 | 56500 | 53200 | 49900 | ||||||||||||||||||||||
| NPV | $ 15566 | $ (70084) | $ (41534) | $ (12984) | $ 15566 | $ 44115 | $ 72665 | $ 101215 | NPV | $ 15566 | $ 51253 | $ 39357 | $ 27461 | $ 15566 | $ 3670 | $ (8226) | $ (20122) | ||||||||||||||||||||||
| Change in NPV | -5502 | -3668 | -1834 | 00 | 1834 | 3668 | 5502 | Change in NPV | 2293 | 1528 | 764 | 00 | -764 | -1528 | -2293 | ||||||||||||||||||||||||
| Change in Variable | -300 | -200 | -100 | 00 | 100 | 200 | 300 | Change in Variable | -300 | -200 | -100 | 00 | 100 | 200 | 300 | ||||||||||||||||||||||||
| SENSITIVITY RATIO | 1834 | 1834 | 1834 | 000 | 1834 | 1834 | 1834 | SENSITIVITY RATIO | -764 | -764 | -764 | 000 | -764 | -764 | -764 | ||||||||||||||||||||||||
| INVERSE | INVERSE | INVERSE | INVERSE | INVERSE | INVERSE | INVERSE | |||||||||||||||||||||||||||||||||
| Sensitivity Ratio = ( Change in NPV) Change in Variable | |||||||||||||||||||||||||||||||||||||||
| Positive = Direct relationship | Sensitivity Ratio = ( Change in NPV) Change in Variable | ||||||||||||||||||||||||||||||||||||||
| Negative = Inverse relationship | Positive = Direct relationship | ||||||||||||||||||||||||||||||||||||||
| Negative = Inverse relationship | |||||||||||||||||||||||||||||||||||||||
| $ (200000) | $ (200000) | $ (200000) | $ (200000) | $ (200000) | $ (200000) | $ (200000) | $ (200000) | ||||||||||||||||||||||||||||||||
| 59800 | 36040 | 43960 | 51880 | 59800 | 67720 | 75640 | 83560 | $ (200000) | $ (200000) | $ (200000) | $ (200000) | $ (200000) | $ (200000) | $ (200000) | $ (200000) | ||||||||||||||||||||||||
| 59800 | 36040 | 43960 | 51880 | 59800 | 67720 | 75640 | 83560 | 59800 | 69700 | 66400 | 63100 | 59800 | 56500 | 53200 | 49900 | ||||||||||||||||||||||||
| 59800 | 36040 | 43960 | 51880 | 59800 | 67720 | 75640 | 83560 | 59800 | 69700 | 66400 | 63100 | 59800 | 56500 | 53200 | 49900 | ||||||||||||||||||||||||
| 59800 | 36040 | 43960 | 51880 | 59800 | 67720 | 75640 | 83560 | 59800 | 69700 | 66400 | 63100 | 59800 | 56500 | 53200 | 49900 | ||||||||||||||||||||||||
| 59800 | 36040 | 43960 | 51880 | 59800 | 67720 | 75640 | 83560 | 59800 | 69700 | 66400 | 63100 | 59800 | 56500 | 53200 | 49900 | ||||||||||||||||||||||||
| 59800 | 69700 | 66400 | 63100 | 59800 | 56500 | 53200 | 49900 | ||||||||||||||||||||||||||||||||
| PV | $ 215566 | $ 129916 | $ 158466 | $ 187016 | $ 215566 | $ 244115 | $ 272665 | $ 301215 | |||||||||||||||||||||||||||||||
| NPV | $ 15566 | $ (70084) | $ (41534) | $ (12984) | $ 15566 | $ 44115 | $ 72665 | $ 101215 | PV | $ 215566 | $ 251253 | $ 239357 | $ 227461 | $ 215566 | $ 203670 | $ 191774 | $ 179878 | ||||||||||||||||||||||
| NPV | $ 15566 | $ 51253 | $ 39357 | $ 27461 | $ 15566 | $ 3670 | $ (8226) | $ (20122) |
| Sensitivity Analysis | |||||||||||||||||||||||
| Base | Units | Units | Fixed Cost | Fixed Cost | |||||||||||||||||||
| Units | 6000 | 5500 | 6500 | 6000 | 6000 | ||||||||||||||||||
| Priceunit | $ 80 | 80 | 80 | 80 | 80 | ||||||||||||||||||
| Variable costunit | $ 60 | 60 | 60 | 60 | 60 | UNITS | |||||||||||||||||
| Fixed costyear | $ 50000 | 50000 | 50000 | 55000 | 45000 | X | 5500 | 6000 | 6500 | ||||||||||||||
| Y | $ (8226) | $ 15566 | $ 39357 | ||||||||||||||||||||
| Initial investment | $ 200000 | ||||||||||||||||||||||
| Depreciated to salvage value of 0 over 5 years | |||||||||||||||||||||||
| Deprecyr | $ 40000 | ||||||||||||||||||||||
| Tax rate | 34 | ||||||||||||||||||||||
| Required Return | 12 | ||||||||||||||||||||||
| BASE | UNITS | UNITS | FC | FC | |||||||||||||||||||
| Units | 6000 | 5500 | 6500 | 6000 | 6000 | ||||||||||||||||||
| Priceunit | $ 80 | $ 80 | $ 80 | $ 80 | $ 80 | ||||||||||||||||||
| Variable costunit | $ 60 | $ 60 | $ 60 | $ 60 | $ 60 | ||||||||||||||||||
| Fixed cost | $ 50000 | $ 50000 | $ 50000 | $ 55000 | $ 45000 | ||||||||||||||||||
| Sales | $ 480000 | $ 440000 | $ 520000 | $ 480000 | $ 480000 | ||||||||||||||||||
| Variable Cost | 360000 | 330000 | 390000 | 360000 | 360000 | ||||||||||||||||||
| Fixed Cost | 50000 | 50000 | 50000 | 55000 | 45000 | ||||||||||||||||||
| Depreciation | 40000 | 40000 | 40000 | 40000 | 40000 | ||||||||||||||||||
| EBIT | 30000 | 20000 | 40000 | 25000 | 35000 | ||||||||||||||||||
| Taxes | 10200 | 6800 | 13600 | 8500 | 11900 | ||||||||||||||||||
| Net Income | 19800 | 13200 | 26400 | 16500 | 23100 | ||||||||||||||||||
| + Deprec | 40000 | 40000 | 40000 | 40000 | 40000 | ||||||||||||||||||
| TOTAL CF | 59800 | 53200 | 66400 | 56500 | 63100 | ||||||||||||||||||
| NPV | $ 15566 | $ (8226) | $ 39357 | $ 3670 | $ 27461 | ||||||||||||||||||
| FC | |||||||||||||||||||||||
| $ (200000) | $ (200000) | $ (200000) | $ (200000) | $ (200000) | X | $ 45000 | $ 50000 | $ 55000 | |||||||||||||||
| 59800 | 53200 | 66400 | 56500 | 63100 | Y | $ 27461 | $ 15566 | $ 3670 | |||||||||||||||
| 59800 | 53200 | 66400 | 56500 | 63100 | |||||||||||||||||||
| 59800 | 53200 | 66400 | 56500 | 63100 | |||||||||||||||||||
| 59800 | 53200 | 66400 | 56500 | 63100 | |||||||||||||||||||
| 59800 | 53200 | 66400 | 56500 | 63100 | |||||||||||||||||||
| PV | $ 215566 | $ 191774 | $ 239357 | $ 203670 | $ 227461 | ||||||||||||||||||
| NPV | $ 15566 | $ (8226) | $ 39357 | $ 3670 | $ 27461 |
| Scenario Analysis | |||||||||
| Base | Lower | Upper | |||||||
| Units | 6000 | 5500 | 6500 | ||||||
| Priceunit | $ 8000 | $ 7500 | $ 8500 | ||||||
| Variable costunit | $ 6000 | $ 5800 | $ 6200 | ||||||
| Fixed costyear | $ 50000 | $ 45000 | $ 55000 | ||||||
| BASE | BEST | WORST | |||||||
| Initial investment | $ 200000 | ||||||||
| Depreciated to salvage value of 0 over 5 years | |||||||||
| Deprecyr | $ 40000 | ||||||||
| Project Life | 5 | years | |||||||
| Tax rate | 34 | ||||||||
| Required return | 12 | ||||||||
| BASE | WORST | BEST | |||||||
| Units | 6000 | 5500 | 6500 | ||||||
| Priceunit | $ 8000 | $ 7500 | $ 8500 | ||||||
| Variable costunit | $ 6000 | $ 6200 | $ 5800 | ||||||
| Fixed Cost | $ 50000 | $ 55000 | $ 45000 | ||||||
| Sales | $ 480000 | $ 412500 | $ 552500 | ||||||
| Variable Cost | 360000 | 341000 | 377000 | ||||||
| Fixed Cost | 50000 | 55000 | 45000 | ||||||
| Depreciation | 40000 | 40000 | 40000 | ||||||
| EBIT | 30000 | (23500) | 90500 | ||||||
| Taxes | 10200 | (7990) | 30770 | ||||||
| Net Income | 19800 | (15510) | 59730 | ||||||
| + Deprec | 40000 | 40000 | 40000 | ||||||
| TOTAL CF | 59800 | 24490 | 99730 | ||||||
| NPV | 15566 | (111719) | 159504 | ||||||
| IRR | 151 | -144 | 409 | ||||||
| NOTE | Note in WORST CASE tax credit for negative earnings | ||||||||
| $ (200000) | $ (200000) | $ (200000) | |||||||
| 59800 | 24490 | 99730 | |||||||
| 59800 | 24490 | 99730 | |||||||
| 59800 | 24490 | 99730 | |||||||
| 59800 | 24490 | 99730 | |||||||
| 59800 | 24490 | 99730 | |||||||
| PV | $215566 | $88281 | $359504 | ||||||
| NPV | 15566 | (111719) | 159504 |
| Majestic Mulch and Compost Company (MMCC) | |||||||||||||||||||||
| YEAR | 0 | 1 | 2 | 3 | 4 | 5 | 6 | 7 | 8 | ||||||||||||
| Background Data | |||||||||||||||||||||
| Unit Sales Estimates | 3000 | 5000 | 6000 | 6500 | 6000 | 5000 | 4000 | 3000 | |||||||||||||
| Variable Cost unit | $ 6000 | ||||||||||||||||||||
| Fixed Costs per year | $ 2500000 | ||||||||||||||||||||
| Sale Price per unit | $ 12000 | $ 12000 | $ 12000 | $ 12000 | $ 11000 | $ 11000 | $ 11000 | $ 11000 | $ 11000 | ||||||||||||
| Tax Rate | 340 | ||||||||||||||||||||
| Required Return on Project | 150 | ||||||||||||||||||||
| Yr 0 NWC | $ 2000000 | ||||||||||||||||||||
| NWC of sales | 15 | ||||||||||||||||||||
| Equipment cost - installed | $ 800000 | ||||||||||||||||||||
| Salvage Value in year 8 | 20 | of equipment cost | |||||||||||||||||||
| Depreciation Calculations | |||||||||||||||||||||
| Equipment Depreciable Base | 800000 | ||||||||||||||||||||
| MACRS (Eqpt-7 yr) | 1429 | 2449 | 1749 | 1249 | 892 | 893 | 893 | 446 | |||||||||||||
| Recovery Allowance | 114320 | 195920 | 139920 | 99920 | 71360 | 71440 | 71440 | 35680 | |||||||||||||
| Book Value | 685680 | 489760 | 349840 | 249920 | 178560 | 107120 | 35680 | 0 | |||||||||||||
| After-Tax Salvage Value | |||||||||||||||||||||
| Salvage Value | 20 | 160000 | |||||||||||||||||||
| Book Value (Year 8) | 0 | ||||||||||||||||||||
| Capital GainLoss | 160000 | ||||||||||||||||||||
| Taxes | 54400 | ||||||||||||||||||||
| Net SV (SV-Taxes) | 105600 | ||||||||||||||||||||
| Required Net Working Capital Investment | |||||||||||||||||||||
| 20000 | 54000 | 90000 | 108000 | 107250 | 99000 | 82500 | 66000 | 49500 | |||||||||||||
| YEAR | 0 | 1 | 2 | 3 | 4 | 5 | 6 | 7 | 8 | ||||||||||||
| Initial Investment | |||||||||||||||||||||
| Equipment Cost | (800000) | ||||||||||||||||||||
| Sales | 360000 | 600000 | 720000 | 715000 | 660000 | 550000 | 440000 | 330000 | |||||||||||||
| Variable Costs | 180000 | 300000 | 360000 | 390000 | 360000 | 300000 | 240000 | 180000 | |||||||||||||
| Fixed Costs | 25000 | 25000 | 25000 | 25000 | 25000 | 25000 | 25000 | 25000 | |||||||||||||
| Depreciation (Eqpt)) | 114320 | 195920 | 139920 | 99920 | 71360 | 71440 | 71440 | 35680 | |||||||||||||
| EBT | 40680 | 79080 | 195080 | 200080 | 203640 | 153560 | 103560 | 89320 | |||||||||||||
| Taxes | 13831 | 26887 | 66327 | 68027 | 69238 | 52210 | 35210 | 30369 | |||||||||||||
| Net Operating Income | 26849 | 52193 | 128753 | 132053 | 134402 | 101350 | 68350 | 58951 | |||||||||||||
| Add back Depreciation | 114320 | 195920 | 139920 | 99920 | 71360 | 71440 | 71440 | 35680 | |||||||||||||
| CASH FLOW from Operations | 141169 | 248113 | 268673 | 231973 | 205762 | 172790 | 139790 | 94631 | |||||||||||||
| NWC investment amp Recovery | (20000) | (34000) | (36000) | (18000) | 750 | 8250 | 16500 | 16500 | 66000 | ||||||||||||
| Salvage Value | 105600 | ||||||||||||||||||||
| TOTAL PROJECTED CF | (820000) | 107169 | 212113 | 250673 | 232723 | 214012 | 189290 | 156290 | 266231 | ||||||||||||
| Discounted Cash Flows | (820000) | 93190 | 160388 | 164821 | 133060 | 106402 | 81835 | 58755 | 87031 | ||||||||||||
| Cumulative Cash flows | (820000) | (712831) | (500718) | (250046) | (17323) | 196690 | 385979 | 542269 | 808500 | ||||||||||||
| NPV | $65483 | ||||||||||||||||||||
| IRR | 1724 | ||||||||||||||||||||
| Payback | 408 |
| Depreciation | 5-year Asset | ||||||||
| Year | Beg BV | Depr | Deprec | End BV | |||||
| 1 | $ 1200000 | 2000 | $ 240000 | $ 960000 | |||||
| 2 | $ 960000 | 3200 | $ 384000 | $ 576000 | |||||
| 3 | $ 576000 | 1920 | $ 230400 | $ 345600 | |||||
| 4 | $ 345600 | 1152 | $ 138240 | $ 207360 | |||||
| 5 | $ 207360 | 1152 | $ 138240 | $ 69120 | |||||
| 6 | $ 69120 | 576 | $ 69120 | $ - 0 | |||||
| 10000 | $ 1200000 | ||||||||
| EOY 5 | $3000 | $221501 | $78499 | ||||||
| EOY 2 | $4000 | $459840 | ($59840) |
| Pro Forma Income Statement | |||||||||
| Year | 0 | 1 | 2 | 3 | |||||
| Sales | 200000 | 200000 | 200000 | ||||||
| Variable Costs | 125000 | 125000 | 125000 | ||||||
| Gross Profit | 75000 | 75000 | 75000 | ||||||
| Fixed Costs | 12000 | 12000 | 12000 | ||||||
| Depreciation | 30000 | 30000 | 30000 | ||||||
| EBIT | 33000 | 33000 | 33000 | ||||||
| Taxes | 11220 | 11220 | 11220 | ||||||
| Net Income | 21780 | 21780 | 21780 | ||||||
| Cash Flows | |||||||||
| Operating Cash Flow | 51780 | 51780 | 51780 | ||||||
| Changes in NWC | -20000 | 20000 | |||||||
| Net Capital Spending | -90000 | ||||||||
| Cash Flow From Assets | -110000 | 51780 | 51780 | 71780 | |||||
| Net Present Value | $1064769 | ||||||||
| IRR | 2576 |
| 45000 | |
| 50000 | |
| 55000 |
| Pro Forma Income Statements | |||||||||
| Year | 0 | 1 | 2 | 3 | |||||
| Sales | 200000 | 200000 | 200000 | ||||||
| Variable Costs | 125000 | 125000 | 125000 | ||||||
| Gross Profit | 75000 | 75000 | 75000 | ||||||
| Fixed Costs | 12000 | 12000 | 12000 | ||||||
| Depreciation | 30000 | 30000 | 30000 | ||||||
| EBIT | 33000 | 33000 | 33000 | ||||||
| Taxes | 11220 | 11220 | 11220 | ||||||
| Net Income | 21780 | 21780 | 21780 | ||||||
| Cash Flows | |||||||||
| Operating Cash Flow | 51780 | 51780 | 51780 | ||||||
| Changes in NWC | (20000) | 20000 | |||||||
| Net Capital Spending | (90000) | ||||||||
| Cash Flow From Assets | (110000) | 51780 | 51780 | 71780 | |||||
| Net Present Value | $1064769 | ||||||||
| IRR | 2576 |
| -30 | -20 | -10 | 0 | 10 | 20 | 30 | |||||||||
| UNITS | -70083865667486 | -415340381449136 | -129842106223412 | 155656169002312 | 441154444228038 | 726652719453761 | 101215099467949 | ||||||||
| FC | 512529013034468 | 393571398357083 | 274613783679698 | 155656169002312 | 36698554324927 | -82259060352458 | -201216675029843 |
| Sensitivity Analysis | |||||||||||||||||||||||||||||||||||||||
| -30 | -20 | -10 | 0 | 10 | 20 | 30 | -30 | -20 | -10 | 0 | 10 | 20 | 30 | ||||||||||||||||||||||||||
| Base | Units | Units | Units | Units | Units | Units | Units | Base | Fixed Cost | Fixed Cost | Fixed Cost | Fixed Cost | Fixed Cost | Fixed Cost | Fixed Cost | ||||||||||||||||||||||||
| Units | 6000 | 4200 | 4800 | 5400 | 6000 | 6600 | 7200 | 7800 | Units | 6000 | 6000 | 6000 | 6000 | 6000 | 6000 | 6000 | 6000 | ||||||||||||||||||||||
| Priceunit | $ 80 | 80 | 80 | 80 | 80 | 80 | 80 | 80 | Priceunit | $ 80 | 80 | 80 | 80 | 80 | 80 | 80 | 80 | ||||||||||||||||||||||
| Variable costunit | $ 60 | 60 | 60 | 60 | 60 | 60 | 60 | 60 | Variable costunit | $ 60 | 60 | 60 | 60 | 60 | 60 | 60 | 60 | ||||||||||||||||||||||
| Fixed costyear | $ 50000 | 50000 | 50000 | 50000 | 50000 | 50000 | 50000 | 50000 | Fixed costyear | $ 50000 | 35000 | 40000 | 45000 | 50000 | 55000 | 60000 | 65000 | ||||||||||||||||||||||
| Initial investment | $ 200000 | Initial investment | $ 200000 | ||||||||||||||||||||||||||||||||||||
| Depreciated to salvage value of 0 over 5 years | Depreciated to salvage value of 0 over 5 years | ||||||||||||||||||||||||||||||||||||||
| Deprecyr | $ 40000 | Deprecyr | $ 40000 | ||||||||||||||||||||||||||||||||||||
| Tax rate | 34 | Tax rate | 34 | ||||||||||||||||||||||||||||||||||||
| Required Return | 12 | Required Return | 12 | ||||||||||||||||||||||||||||||||||||
| BASE | UNITS | UNITS | UNITS | UNITS | UNITS | UNITS | UNITS | BASE | FC | FC | FC | FC | FC | FC | FC | ||||||||||||||||||||||||
| Units | 6000 | 4200 | 4800 | 5400 | 6000 | 6600 | 7200 | 7800 | Units | 6000 | 6000 | 6000 | 6000 | 6000 | 6000 | 6000 | 6000 | ||||||||||||||||||||||
| Priceunit | $ 80 | $ 80 | $ 80 | $ 80 | $ 80 | $ 80 | $ 80 | $ 80 | Priceunit | $ 80 | $ 80 | $ 80 | $ 80 | $ 80 | $ 80 | $ 80 | $ 80 | ||||||||||||||||||||||
| Variable costunit | $ 60 | $ 60 | $ 60 | $ 60 | $ 60 | $ 60 | $ 60 | $ 60 | Variable costunit | $ 60 | $ 60 | $ 60 | $ 60 | $ 60 | $ 60 | $ 60 | $ 60 | ||||||||||||||||||||||
| Fixed cost | $ 50000 | $ 50000 | $ 50000 | $ 50000 | $ 50000 | $ 50000 | $ 50000 | $ 50000 | Fixed cost | $ 50000 | $ 35000 | $ 40000 | $ 45000 | $ 50000 | $ 55000 | $ 60000 | $ 65000 | ||||||||||||||||||||||
| Sales | $ 480000 | $ 336000 | $ 384000 | $ 432000 | $ 480000 | $ 528000 | $ 576000 | $ 624000 | Sales | $ 480000 | $ 480000 | $ 480000 | $ 480000 | $ 480000 | $ 480000 | $ 480000 | $ 480000 | ||||||||||||||||||||||
| Variable Cost | 360000 | 252000 | 288000 | 324000 | 360000 | 396000 | 432000 | 468000 | Variable Cost | 360000 | 360000 | 360000 | 360000 | 360000 | 360000 | 360000 | 360000 | ||||||||||||||||||||||
| Fixed Cost | 50000 | 50000 | 50000 | 50000 | 50000 | 50000 | 50000 | 50000 | Fixed Cost | 50000 | 35000 | 40000 | 45000 | 50000 | 55000 | 60000 | 65000 | ||||||||||||||||||||||
| Depreciation | 40000 | 40000 | 40000 | 40000 | 40000 | 40000 | 40000 | 40000 | Depreciation | 40000 | 40000 | 40000 | 40000 | 40000 | 40000 | 40000 | 40000 | ||||||||||||||||||||||
| EBIT | 30000 | (6000) | 6000 | 18000 | 30000 | 42000 | 54000 | 66000 | EBIT | 30000 | 45000 | 40000 | 35000 | 30000 | 25000 | 20000 | 15000 | ||||||||||||||||||||||
| Taxes | 10200 | (2040) | 2040 | 6120 | 10200 | 14280 | 18360 | 22440 | Taxes | 10200 | 15300 | 13600 | 11900 | 10200 | 8500 | 6800 | 5100 | ||||||||||||||||||||||
| Net Income | 19800 | (3960) | 3960 | 11880 | 19800 | 27720 | 35640 | 43560 | Net Income | 19800 | 29700 | 26400 | 23100 | 19800 | 16500 | 13200 | 9900 | ||||||||||||||||||||||
| + Deprec | 40000 | 40000 | 40000 | 40000 | 40000 | 40000 | 40000 | 40000 | + Deprec | 40000 | 40000 | 40000 | 40000 | 40000 | 40000 | 40000 | 40000 | ||||||||||||||||||||||
| TOTAL CF | 59800 | 36040 | 43960 | 51880 | 59800 | 67720 | 75640 | 83560 | TOTAL CF | 59800 | 69700 | 66400 | 63100 | 59800 | 56500 | 53200 | 49900 | ||||||||||||||||||||||
| NPV | $ 15566 | $ (70084) | $ (41534) | $ (12984) | $ 15566 | $ 44115 | $ 72665 | $ 101215 | NPV | $ 15566 | $ 51253 | $ 39357 | $ 27461 | $ 15566 | $ 3670 | $ (8226) | $ (20122) | ||||||||||||||||||||||
| Change in NPV | -5502 | -3668 | -1834 | 00 | 1834 | 3668 | 5502 | Change in NPV | 2293 | 1528 | 764 | 00 | -764 | -1528 | -2293 | ||||||||||||||||||||||||
| Change in Variable | -300 | -200 | -100 | 00 | 100 | 200 | 300 | Change in Variable | -300 | -200 | -100 | 00 | 100 | 200 | 300 | ||||||||||||||||||||||||
| SENSITIVITY RATIO | 1834 | 1834 | 1834 | 000 | 1834 | 1834 | 1834 | SENSITIVITY RATIO | -764 | -764 | -764 | 000 | -764 | -764 | -764 | ||||||||||||||||||||||||
| INVERSE | INVERSE | INVERSE | INVERSE | INVERSE | INVERSE | INVERSE | |||||||||||||||||||||||||||||||||
| Sensitivity Ratio = ( Change in NPV) Change in Variable | |||||||||||||||||||||||||||||||||||||||
| Positive = Direct relationship | Sensitivity Ratio = ( Change in NPV) Change in Variable | ||||||||||||||||||||||||||||||||||||||
| Negative = Inverse relationship | Positive = Direct relationship | ||||||||||||||||||||||||||||||||||||||
| Negative = Inverse relationship | |||||||||||||||||||||||||||||||||||||||
| $ (200000) | $ (200000) | $ (200000) | $ (200000) | $ (200000) | $ (200000) | $ (200000) | $ (200000) | ||||||||||||||||||||||||||||||||
| 59800 | 36040 | 43960 | 51880 | 59800 | 67720 | 75640 | 83560 | $ (200000) | $ (200000) | $ (200000) | $ (200000) | $ (200000) | $ (200000) | $ (200000) | $ (200000) | ||||||||||||||||||||||||
| 59800 | 36040 | 43960 | 51880 | 59800 | 67720 | 75640 | 83560 | 59800 | 69700 | 66400 | 63100 | 59800 | 56500 | 53200 | 49900 | ||||||||||||||||||||||||
| 59800 | 36040 | 43960 | 51880 | 59800 | 67720 | 75640 | 83560 | 59800 | 69700 | 66400 | 63100 | 59800 | 56500 | 53200 | 49900 | ||||||||||||||||||||||||
| 59800 | 36040 | 43960 | 51880 | 59800 | 67720 | 75640 | 83560 | 59800 | 69700 | 66400 | 63100 | 59800 | 56500 | 53200 | 49900 | ||||||||||||||||||||||||
| 59800 | 36040 | 43960 | 51880 | 59800 | 67720 | 75640 | 83560 | 59800 | 69700 | 66400 | 63100 | 59800 | 56500 | 53200 | 49900 | ||||||||||||||||||||||||
| 59800 | 69700 | 66400 | 63100 | 59800 | 56500 | 53200 | 49900 | ||||||||||||||||||||||||||||||||
| PV | $ 215566 | $ 129916 | $ 158466 | $ 187016 | $ 215566 | $ 244115 | $ 272665 | $ 301215 | |||||||||||||||||||||||||||||||
| NPV | $ 15566 | $ (70084) | $ (41534) | $ (12984) | $ 15566 | $ 44115 | $ 72665 | $ 101215 | PV | $ 215566 | $ 251253 | $ 239357 | $ 227461 | $ 215566 | $ 203670 | $ 191774 | $ 179878 | ||||||||||||||||||||||
| NPV | $ 15566 | $ 51253 | $ 39357 | $ 27461 | $ 15566 | $ 3670 | $ (8226) | $ (20122) |
| Sensitivity Analysis | |||||||||||||||||||||||
| Base | Units | Units | Fixed Cost | Fixed Cost | |||||||||||||||||||
| Units | 6000 | 5500 | 6500 | 6000 | 6000 | ||||||||||||||||||
| Priceunit | $ 80 | 80 | 80 | 80 | 80 | ||||||||||||||||||
| Variable costunit | $ 60 | 60 | 60 | 60 | 60 | UNITS | |||||||||||||||||
| Fixed costyear | $ 50000 | 50000 | 50000 | 55000 | 45000 | X | 5500 | 6000 | 6500 | ||||||||||||||
| Y | $ (8226) | $ 15566 | $ 39357 | ||||||||||||||||||||
| Initial investment | $ 200000 | ||||||||||||||||||||||
| Depreciated to salvage value of 0 over 5 years | |||||||||||||||||||||||
| Deprecyr | $ 40000 | ||||||||||||||||||||||
| Tax rate | 34 | ||||||||||||||||||||||
| Required Return | 12 | ||||||||||||||||||||||
| BASE | UNITS | UNITS | FC | FC | |||||||||||||||||||
| Units | 6000 | 5500 | 6500 | 6000 | 6000 | ||||||||||||||||||
| Priceunit | $ 80 | $ 80 | $ 80 | $ 80 | $ 80 | ||||||||||||||||||
| Variable costunit | $ 60 | $ 60 | $ 60 | $ 60 | $ 60 | ||||||||||||||||||
| Fixed cost | $ 50000 | $ 50000 | $ 50000 | $ 55000 | $ 45000 | ||||||||||||||||||
| Sales | $ 480000 | $ 440000 | $ 520000 | $ 480000 | $ 480000 | ||||||||||||||||||
| Variable Cost | 360000 | 330000 | 390000 | 360000 | 360000 | ||||||||||||||||||
| Fixed Cost | 50000 | 50000 | 50000 | 55000 | 45000 | ||||||||||||||||||
| Depreciation | 40000 | 40000 | 40000 | 40000 | 40000 | ||||||||||||||||||
| EBIT | 30000 | 20000 | 40000 | 25000 | 35000 | ||||||||||||||||||
| Taxes | 10200 | 6800 | 13600 | 8500 | 11900 | ||||||||||||||||||
| Net Income | 19800 | 13200 | 26400 | 16500 | 23100 | ||||||||||||||||||
| + Deprec | 40000 | 40000 | 40000 | 40000 | 40000 | ||||||||||||||||||
| TOTAL CF | 59800 | 53200 | 66400 | 56500 | 63100 | ||||||||||||||||||
| NPV | $ 15566 | $ (8226) | $ 39357 | $ 3670 | $ 27461 | ||||||||||||||||||
| FC | |||||||||||||||||||||||
| $ (200000) | $ (200000) | $ (200000) | $ (200000) | $ (200000) | X | $ 45000 | $ 50000 | $ 55000 | |||||||||||||||
| 59800 | 53200 | 66400 | 56500 | 63100 | Y | $ 27461 | $ 15566 | $ 3670 | |||||||||||||||
| 59800 | 53200 | 66400 | 56500 | 63100 | |||||||||||||||||||
| 59800 | 53200 | 66400 | 56500 | 63100 | |||||||||||||||||||
| 59800 | 53200 | 66400 | 56500 | 63100 | |||||||||||||||||||
| 59800 | 53200 | 66400 | 56500 | 63100 | |||||||||||||||||||
| PV | $ 215566 | $ 191774 | $ 239357 | $ 203670 | $ 227461 | ||||||||||||||||||
| NPV | $ 15566 | $ (8226) | $ 39357 | $ 3670 | $ 27461 |
| Scenario Analysis | |||||||||
| Base | Lower | Upper | |||||||
| Units | 6000 | 5500 | 6500 | ||||||
| Priceunit | $ 8000 | $ 7500 | $ 8500 | ||||||
| Variable costunit | $ 6000 | $ 5800 | $ 6200 | ||||||
| Fixed costyear | $ 50000 | $ 45000 | $ 55000 | ||||||
| BASE | BEST | WORST | |||||||
| Initial investment | $ 200000 | ||||||||
| Depreciated to salvage value of 0 over 5 years | |||||||||
| Deprecyr | $ 40000 | ||||||||
| Project Life | 5 | years | |||||||
| Tax rate | 34 | ||||||||
| Required return | 12 | ||||||||
| BASE | WORST | BEST | |||||||
| Units | 6000 | 5500 | 6500 | ||||||
| Priceunit | $ 8000 | $ 7500 | $ 8500 | ||||||
| Variable costunit | $ 6000 | $ 6200 | $ 5800 | ||||||
| Fixed Cost | $ 50000 | $ 55000 | $ 45000 | ||||||
| Sales | $ 480000 | $ 412500 | $ 552500 | ||||||
| Variable Cost | 360000 | 341000 | 377000 | ||||||
| Fixed Cost | 50000 | 55000 | 45000 | ||||||
| Depreciation | 40000 | 40000 | 40000 | ||||||
| EBIT | 30000 | (23500) | 90500 | ||||||
| Taxes | 10200 | (7990) | 30770 | ||||||
| Net Income | 19800 | (15510) | 59730 | ||||||
| + Deprec | 40000 | 40000 | 40000 | ||||||
| TOTAL CF | 59800 | 24490 | 99730 | ||||||
| NPV | 15566 | (111719) | 159504 | ||||||
| IRR | 151 | -144 | 409 | ||||||
| NOTE | Note in WORST CASE tax credit for negative earnings | ||||||||
| $ (200000) | $ (200000) | $ (200000) | |||||||
| 59800 | 24490 | 99730 | |||||||
| 59800 | 24490 | 99730 | |||||||
| 59800 | 24490 | 99730 | |||||||
| 59800 | 24490 | 99730 | |||||||
| 59800 | 24490 | 99730 | |||||||
| PV | $215566 | $88281 | $359504 | ||||||
| NPV | 15566 | (111719) | 159504 |
| Majestic Mulch and Compost Company (MMCC) | |||||||||||||||||||||
| YEAR | 0 | 1 | 2 | 3 | 4 | 5 | 6 | 7 | 8 | ||||||||||||
| Background Data | |||||||||||||||||||||
| Unit Sales Estimates | 3000 | 5000 | 6000 | 6500 | 6000 | 5000 | 4000 | 3000 | |||||||||||||
| Variable Cost unit | $ 6000 | ||||||||||||||||||||
| Fixed Costs per year | $ 2500000 | ||||||||||||||||||||
| Sale Price per unit | $ 12000 | $ 12000 | $ 12000 | $ 12000 | $ 11000 | $ 11000 | $ 11000 | $ 11000 | $ 11000 | ||||||||||||
| Tax Rate | 340 | ||||||||||||||||||||
| Required Return on Project | 150 | ||||||||||||||||||||
| Yr 0 NWC | $ 2000000 | ||||||||||||||||||||
| NWC of sales | 15 | ||||||||||||||||||||
| Equipment cost - installed | $ 800000 | ||||||||||||||||||||
| Salvage Value in year 8 | 20 | of equipment cost | |||||||||||||||||||
| Depreciation Calculations | |||||||||||||||||||||
| Equipment Depreciable Base | 800000 | ||||||||||||||||||||
| MACRS (Eqpt-7 yr) | 1429 | 2449 | 1749 | 1249 | 892 | 893 | 893 | 446 | |||||||||||||
| Recovery Allowance | 114320 | 195920 | 139920 | 99920 | 71360 | 71440 | 71440 | 35680 | |||||||||||||
| Book Value | 685680 | 489760 | 349840 | 249920 | 178560 | 107120 | 35680 | 0 | |||||||||||||
| After-Tax Salvage Value | |||||||||||||||||||||
| Salvage Value | 20 | 160000 | |||||||||||||||||||
| Book Value (Year 8) | 0 | ||||||||||||||||||||
| Capital GainLoss | 160000 | ||||||||||||||||||||
| Taxes | 54400 | ||||||||||||||||||||
| Net SV (SV-Taxes) | 105600 | ||||||||||||||||||||
| Required Net Working Capital Investment | |||||||||||||||||||||
| 20000 | 54000 | 90000 | 108000 | 107250 | 99000 | 82500 | 66000 | 49500 | |||||||||||||
| YEAR | 0 | 1 | 2 | 3 | 4 | 5 | 6 | 7 | 8 | ||||||||||||
| Initial Investment | |||||||||||||||||||||
| Equipment Cost | (800000) | ||||||||||||||||||||
| Sales | 360000 | 600000 | 720000 | 715000 | 660000 | 550000 | 440000 | 330000 | |||||||||||||
| Variable Costs | 180000 | 300000 | 360000 | 390000 | 360000 | 300000 | 240000 | 180000 | |||||||||||||
| Fixed Costs | 25000 | 25000 | 25000 | 25000 | 25000 | 25000 | 25000 | 25000 | |||||||||||||
| Depreciation (Eqpt)) | 114320 | 195920 | 139920 | 99920 | 71360 | 71440 | 71440 | 35680 | |||||||||||||
| EBT | 40680 | 79080 | 195080 | 200080 | 203640 | 153560 | 103560 | 89320 | |||||||||||||
| Taxes | 13831 | 26887 | 66327 | 68027 | 69238 | 52210 | 35210 | 30369 | |||||||||||||
| Net Operating Income | 26849 | 52193 | 128753 | 132053 | 134402 | 101350 | 68350 | 58951 | |||||||||||||
| Add back Depreciation | 114320 | 195920 | 139920 | 99920 | 71360 | 71440 | 71440 | 35680 | |||||||||||||
| CASH FLOW from Operations | 141169 | 248113 | 268673 | 231973 | 205762 | 172790 | 139790 | 94631 | |||||||||||||
| NWC investment amp Recovery | (20000) | (34000) | (36000) | (18000) | 750 | 8250 | 16500 | 16500 | 66000 | ||||||||||||
| Salvage Value | 105600 | ||||||||||||||||||||
| TOTAL PROJECTED CF | (820000) | 107169 | 212113 | 250673 | 232723 | 214012 | 189290 | 156290 | 266231 | ||||||||||||
| Discounted Cash Flows | (820000) | 93190 | 160388 | 164821 | 133060 | 106402 | 81835 | 58755 | 87031 | ||||||||||||
| Cumulative Cash flows | (820000) | (712831) | (500718) | (250046) | (17323) | 196690 | 385979 | 542269 | 808500 | ||||||||||||
| NPV | $65483 | ||||||||||||||||||||
| IRR | 1724 | ||||||||||||||||||||
| Payback | 408 |
| Depreciation | 5-year Asset | ||||||||
| Year | Beg BV | Depr | Deprec | End BV | |||||
| 1 | $ 1200000 | 2000 | $ 240000 | $ 960000 | |||||
| 2 | $ 960000 | 3200 | $ 384000 | $ 576000 | |||||
| 3 | $ 576000 | 1920 | $ 230400 | $ 345600 | |||||
| 4 | $ 345600 | 1152 | $ 138240 | $ 207360 | |||||
| 5 | $ 207360 | 1152 | $ 138240 | $ 69120 | |||||
| 6 | $ 69120 | 576 | $ 69120 | $ - 0 | |||||
| 10000 | $ 1200000 | ||||||||
| EOY 5 | $3000 | $221501 | $78499 | ||||||
| EOY 2 | $4000 | $459840 | ($59840) |
| Pro Forma Income Statement | |||||||||
| Year | 0 | 1 | 2 | 3 | |||||
| Sales | 200000 | 200000 | 200000 | ||||||
| Variable Costs | 125000 | 125000 | 125000 | ||||||
| Gross Profit | 75000 | 75000 | 75000 | ||||||
| Fixed Costs | 12000 | 12000 | 12000 | ||||||
| Depreciation | 30000 | 30000 | 30000 | ||||||
| EBIT | 33000 | 33000 | 33000 | ||||||
| Taxes | 11220 | 11220 | 11220 | ||||||
| Net Income | 21780 | 21780 | 21780 | ||||||
| Cash Flows | |||||||||
| Operating Cash Flow | 51780 | 51780 | 51780 | ||||||
| Changes in NWC | -20000 | 20000 | |||||||
| Net Capital Spending | -90000 | ||||||||
| Cash Flow From Assets | -110000 | 51780 | 51780 | 71780 | |||||
| Net Present Value | $1064769 | ||||||||
| IRR | 2576 |
| Pro Forma Income Statements | |||||||||
| Year | 0 | 1 | 2 | 3 | |||||
| Sales | 200000 | 200000 | 200000 | ||||||
| Variable Costs | 125000 | 125000 | 125000 | ||||||
| Gross Profit | 75000 | 75000 | 75000 | ||||||
| Fixed Costs | 12000 | 12000 | 12000 | ||||||
| Depreciation | 30000 | 30000 | 30000 | ||||||
| EBIT | 33000 | 33000 | 33000 | ||||||
| Taxes | 11220 | 11220 | 11220 | ||||||
| Net Income | 21780 | 21780 | 21780 | ||||||
| Cash Flows | |||||||||
| Operating Cash Flow | 51780 | 51780 | 51780 | ||||||
| Changes in NWC | (20000) | 20000 | |||||||
| Net Capital Spending | (90000) | ||||||||
| Cash Flow From Assets | (110000) | 51780 | 51780 | 71780 | |||||
| Net Present Value | $1064769 | ||||||||
| IRR | 2576 |
| -30 | -20 | -10 | 0 | 10 | 20 | 30 | |||||||||
| UNITS | -70083865667486 | -415340381449136 | -129842106223412 | 155656169002312 | 441154444228038 | 726652719453761 | 101215099467949 | ||||||||
| FC | 512529013034468 | 393571398357083 | 274613783679698 | 155656169002312 | 36698554324927 | -82259060352458 | -201216675029843 |
| Sensitivity Analysis | |||||||||||||||||||||||||||||||||||||||
| -30 | -20 | -10 | 0 | 10 | 20 | 30 | -30 | -20 | -10 | 0 | 10 | 20 | 30 | ||||||||||||||||||||||||||
| Base | Units | Units | Units | Units | Units | Units | Units | Base | Fixed Cost | Fixed Cost | Fixed Cost | Fixed Cost | Fixed Cost | Fixed Cost | Fixed Cost | ||||||||||||||||||||||||
| Units | 6000 | 4200 | 4800 | 5400 | 6000 | 6600 | 7200 | 7800 | Units | 6000 | 6000 | 6000 | 6000 | 6000 | 6000 | 6000 | 6000 | ||||||||||||||||||||||
| Priceunit | $ 80 | 80 | 80 | 80 | 80 | 80 | 80 | 80 | Priceunit | $ 80 | 80 | 80 | 80 | 80 | 80 | 80 | 80 | ||||||||||||||||||||||
| Variable costunit | $ 60 | 60 | 60 | 60 | 60 | 60 | 60 | 60 | Variable costunit | $ 60 | 60 | 60 | 60 | 60 | 60 | 60 | 60 | ||||||||||||||||||||||
| Fixed costyear | $ 50000 | 50000 | 50000 | 50000 | 50000 | 50000 | 50000 | 50000 | Fixed costyear | $ 50000 | 35000 | 40000 | 45000 | 50000 | 55000 | 60000 | 65000 | ||||||||||||||||||||||
| Initial investment | $ 200000 | Initial investment | $ 200000 | ||||||||||||||||||||||||||||||||||||
| Depreciated to salvage value of 0 over 5 years | Depreciated to salvage value of 0 over 5 years | ||||||||||||||||||||||||||||||||||||||
| Deprecyr | $ 40000 | Deprecyr | $ 40000 | ||||||||||||||||||||||||||||||||||||
| Tax rate | 34 | Tax rate | 34 | ||||||||||||||||||||||||||||||||||||
| Required Return | 12 | Required Return | 12 | ||||||||||||||||||||||||||||||||||||
| BASE | UNITS | UNITS | UNITS | UNITS | UNITS | UNITS | UNITS | BASE | FC | FC | FC | FC | FC | FC | FC | ||||||||||||||||||||||||
| Units | 6000 | 4200 | 4800 | 5400 | 6000 | 6600 | 7200 | 7800 | Units | 6000 | 6000 | 6000 | 6000 | 6000 | 6000 | 6000 | 6000 | ||||||||||||||||||||||
| Priceunit | $ 80 | $ 80 | $ 80 | $ 80 | $ 80 | $ 80 | $ 80 | $ 80 | Priceunit | $ 80 | $ 80 | $ 80 | $ 80 | $ 80 | $ 80 | $ 80 | $ 80 | ||||||||||||||||||||||
| Variable costunit | $ 60 | $ 60 | $ 60 | $ 60 | $ 60 | $ 60 | $ 60 | $ 60 | Variable costunit | $ 60 | $ 60 | $ 60 | $ 60 | $ 60 | $ 60 | $ 60 | $ 60 | ||||||||||||||||||||||
| Fixed cost | $ 50000 | $ 50000 | $ 50000 | $ 50000 | $ 50000 | $ 50000 | $ 50000 | $ 50000 | Fixed cost | $ 50000 | $ 35000 | $ 40000 | $ 45000 | $ 50000 | $ 55000 | $ 60000 | $ 65000 | ||||||||||||||||||||||
| Sales | $ 480000 | $ 336000 | $ 384000 | $ 432000 | $ 480000 | $ 528000 | $ 576000 | $ 624000 | Sales | $ 480000 | $ 480000 | $ 480000 | $ 480000 | $ 480000 | $ 480000 | $ 480000 | $ 480000 | ||||||||||||||||||||||
| Variable Cost | 360000 | 252000 | 288000 | 324000 | 360000 | 396000 | 432000 | 468000 | Variable Cost | 360000 | 360000 | 360000 | 360000 | 360000 | 360000 | 360000 | 360000 | ||||||||||||||||||||||
| Fixed Cost | 50000 | 50000 | 50000 | 50000 | 50000 | 50000 | 50000 | 50000 | Fixed Cost | 50000 | 35000 | 40000 | 45000 | 50000 | 55000 | 60000 | 65000 | ||||||||||||||||||||||
| Depreciation | 40000 | 40000 | 40000 | 40000 | 40000 | 40000 | 40000 | 40000 | Depreciation | 40000 | 40000 | 40000 | 40000 | 40000 | 40000 | 40000 | 40000 | ||||||||||||||||||||||
| EBIT | 30000 | (6000) | 6000 | 18000 | 30000 | 42000 | 54000 | 66000 | EBIT | 30000 | 45000 | 40000 | 35000 | 30000 | 25000 | 20000 | 15000 | ||||||||||||||||||||||
| Taxes | 10200 | (2040) | 2040 | 6120 | 10200 | 14280 | 18360 | 22440 | Taxes | 10200 | 15300 | 13600 | 11900 | 10200 | 8500 | 6800 | 5100 | ||||||||||||||||||||||
| Net Income | 19800 | (3960) | 3960 | 11880 | 19800 | 27720 | 35640 | 43560 | Net Income | 19800 | 29700 | 26400 | 23100 | 19800 | 16500 | 13200 | 9900 | ||||||||||||||||||||||
| + Deprec | 40000 | 40000 | 40000 | 40000 | 40000 | 40000 | 40000 | 40000 | + Deprec | 40000 | 40000 | 40000 | 40000 | 40000 | 40000 | 40000 | 40000 | ||||||||||||||||||||||
| TOTAL CF | 59800 | 36040 | 43960 | 51880 | 59800 | 67720 | 75640 | 83560 | TOTAL CF | 59800 | 69700 | 66400 | 63100 | 59800 | 56500 | 53200 | 49900 | ||||||||||||||||||||||
| NPV | $ 15566 | $ (70084) | $ (41534) | $ (12984) | $ 15566 | $ 44115 | $ 72665 | $ 101215 | NPV | $ 15566 | $ 51253 | $ 39357 | $ 27461 | $ 15566 | $ 3670 | $ (8226) | $ (20122) | ||||||||||||||||||||||
| Change in NPV | -5502 | -3668 | -1834 | 00 | 1834 | 3668 | 5502 | Change in NPV | 2293 | 1528 | 764 | 00 | -764 | -1528 | -2293 | ||||||||||||||||||||||||
| Change in Variable | -300 | -200 | -100 | 00 | 100 | 200 | 300 | Change in Variable | -300 | -200 | -100 | 00 | 100 | 200 | 300 | ||||||||||||||||||||||||
| SENSITIVITY RATIO | 1834 | 1834 | 1834 | 000 | 1834 | 1834 | 1834 | SENSITIVITY RATIO | -764 | -764 | -764 | 000 | -764 | -764 | -764 | ||||||||||||||||||||||||
| INVERSE | INVERSE | INVERSE | INVERSE | INVERSE | INVERSE | INVERSE | |||||||||||||||||||||||||||||||||
| Sensitivity Ratio = ( Change in NPV) Change in Variable | |||||||||||||||||||||||||||||||||||||||
| Positive = Direct relationship | Sensitivity Ratio = ( Change in NPV) Change in Variable | ||||||||||||||||||||||||||||||||||||||
| Negative = Inverse relationship | Positive = Direct relationship | ||||||||||||||||||||||||||||||||||||||
| Negative = Inverse relationship | |||||||||||||||||||||||||||||||||||||||
| $ (200000) | $ (200000) | $ (200000) | $ (200000) | $ (200000) | $ (200000) | $ (200000) | $ (200000) | ||||||||||||||||||||||||||||||||
| 59800 | 36040 | 43960 | 51880 | 59800 | 67720 | 75640 | 83560 | $ (200000) | $ (200000) | $ (200000) | $ (200000) | $ (200000) | $ (200000) | $ (200000) | $ (200000) | ||||||||||||||||||||||||
| 59800 | 36040 | 43960 | 51880 | 59800 | 67720 | 75640 | 83560 | 59800 | 69700 | 66400 | 63100 | 59800 | 56500 | 53200 | 49900 | ||||||||||||||||||||||||
| 59800 | 36040 | 43960 | 51880 | 59800 | 67720 | 75640 | 83560 | 59800 | 69700 | 66400 | 63100 | 59800 | 56500 | 53200 | 49900 | ||||||||||||||||||||||||
| 59800 | 36040 | 43960 | 51880 | 59800 | 67720 | 75640 | 83560 | 59800 | 69700 | 66400 | 63100 | 59800 | 56500 | 53200 | 49900 | ||||||||||||||||||||||||
| 59800 | 36040 | 43960 | 51880 | 59800 | 67720 | 75640 | 83560 | 59800 | 69700 | 66400 | 63100 | 59800 | 56500 | 53200 | 49900 | ||||||||||||||||||||||||
| 59800 | 69700 | 66400 | 63100 | 59800 | 56500 | 53200 | 49900 | ||||||||||||||||||||||||||||||||
| PV | $ 215566 | $ 129916 | $ 158466 | $ 187016 | $ 215566 | $ 244115 | $ 272665 | $ 301215 | |||||||||||||||||||||||||||||||
| NPV | $ 15566 | $ (70084) | $ (41534) | $ (12984) | $ 15566 | $ 44115 | $ 72665 | $ 101215 | PV | $ 215566 | $ 251253 | $ 239357 | $ 227461 | $ 215566 | $ 203670 | $ 191774 | $ 179878 | ||||||||||||||||||||||
| NPV | $ 15566 | $ 51253 | $ 39357 | $ 27461 | $ 15566 | $ 3670 | $ (8226) | $ (20122) |
| Sensitivity Analysis | |||||||||||||||||||||||
| Base | Units | Units | Fixed Cost | Fixed Cost | |||||||||||||||||||
| Units | 6000 | 5500 | 6500 | 6000 | 6000 | ||||||||||||||||||
| Priceunit | $ 80 | 80 | 80 | 80 | 80 | ||||||||||||||||||
| Variable costunit | $ 60 | 60 | 60 | 60 | 60 | ||||||||||||||||||
| Fixed costyear | $ 50000 | 50000 | 50000 | 55000 | 45000 | X | 5500 | 6000 | 6500 | ||||||||||||||
| Y | $ (8226) | $ 15566 | $ 39357 | ||||||||||||||||||||
| Initial investment | $ 200000 | ||||||||||||||||||||||
| Depreciated to salvage value of 0 over 5 years | |||||||||||||||||||||||
| Deprecyr | $ 40000 | ||||||||||||||||||||||
| Tax rate | 34 | ||||||||||||||||||||||
| Required Return | 12 | ||||||||||||||||||||||
| BASE | UNITS | UNITS | FC | FC | |||||||||||||||||||
| Units | 6000 | 5500 | 6500 | 6000 | 6000 | ||||||||||||||||||
| Priceunit | $ 80 | $ 80 | $ 80 | $ 80 | $ 80 | ||||||||||||||||||
| Variable costunit | $ 60 | $ 60 | $ 60 | $ 60 | $ 60 | ||||||||||||||||||
| Fixed cost | $ 50000 | $ 50000 | $ 50000 | $ 55000 | $ 45000 | ||||||||||||||||||
| Sales | $ 480000 | $ 440000 | $ 520000 | $ 480000 | $ 480000 | ||||||||||||||||||
| Variable Cost | 360000 | 330000 | 390000 | 360000 | 360000 | ||||||||||||||||||
| Fixed Cost | 50000 | 50000 | 50000 | 55000 | 45000 | ||||||||||||||||||
| Depreciation | 40000 | 40000 | 40000 | 40000 | 40000 | ||||||||||||||||||
| EBIT | 30000 | 20000 | 40000 | 25000 | 35000 | ||||||||||||||||||
| Taxes | 10200 | 6800 | 13600 | 8500 | 11900 | ||||||||||||||||||
| Net Income | 19800 | 13200 | 26400 | 16500 | 23100 | ||||||||||||||||||
| + Deprec | 40000 | 40000 | 40000 | 40000 | 40000 | ||||||||||||||||||
| TOTAL CF | 59800 | 53200 | 66400 | 56500 | 63100 | ||||||||||||||||||
| NPV | $ 15566 | $ (8226) | $ 39357 | $ 3670 | $ 27461 | ||||||||||||||||||
| $ (200000) | $ (200000) | $ (200000) | $ (200000) | $ (200000) | |||||||||||||||||||
| 59800 | 53200 | 66400 | 56500 | 63100 | |||||||||||||||||||
| 59800 | 53200 | 66400 | 56500 | 63100 | |||||||||||||||||||
| 59800 | 53200 | 66400 | 56500 | 63100 | |||||||||||||||||||
| 59800 | 53200 | 66400 | 56500 | 63100 | |||||||||||||||||||
| 59800 | 53200 | 66400 | 56500 | 63100 | |||||||||||||||||||
| PV | $ 215566 | $ 191774 | $ 239357 | $ 203670 | $ 227461 | ||||||||||||||||||
| NPV | $ 15566 | $ (8226) | $ 39357 | $ 3670 | $ 27461 |
| Scenario Analysis | |||||||||
| Base | Lower | Upper | |||||||
| Units | 6000 | 5500 | 6500 | ||||||
| Priceunit | $ 8000 | $ 7500 | $ 8500 | ||||||
| Variable costunit | $ 6000 | $ 5800 | $ 6200 | ||||||
| Fixed costyear | $ 50000 | $ 45000 | $ 55000 | ||||||
| BASE | BEST | WORST | |||||||
| Initial investment | $ 200000 | ||||||||
| Depreciated to salvage value of 0 over 5 years | |||||||||
| Deprecyr | $ 40000 | ||||||||
| Project Life | 5 | years | |||||||
| Tax rate | 34 | ||||||||
| Required return | 12 | ||||||||
| BASE | WORST | BEST | |||||||
| Units | 6000 | 5500 | 6500 | ||||||
| Priceunit | $ 8000 | $ 7500 | $ 8500 | ||||||
| Variable costunit | $ 6000 | $ 6200 | $ 5800 | ||||||
| Fixed Cost | $ 50000 | $ 55000 | $ 45000 | ||||||
| Sales | $ 480000 | $ 412500 | $ 552500 | ||||||
| Variable Cost | 360000 | 341000 | 377000 | ||||||
| Fixed Cost | 50000 | 55000 | 45000 | ||||||
| Depreciation | 40000 | 40000 | 40000 | ||||||
| EBIT | 30000 | (23500) | 90500 | ||||||
| Taxes | 10200 | (7990) | 30770 | ||||||
| Net Income | 19800 | (15510) | 59730 | ||||||
| + Deprec | 40000 | 40000 | 40000 | ||||||
| TOTAL CF | 59800 | 24490 | 99730 | ||||||
| NPV | 15566 | (111719) | 159504 | ||||||
| IRR | 151 | -144 | 409 | ||||||
| NOTE | Note in WORST CASE tax credit for negative earnings | ||||||||
| $ (200000) | $ (200000) | $ (200000) | |||||||
| 59800 | 24490 | 99730 | |||||||
| 59800 | 24490 | 99730 | |||||||
| 59800 | 24490 | 99730 | |||||||
| 59800 | 24490 | 99730 | |||||||
| 59800 | 24490 | 99730 | |||||||
| PV | $215566 | $88281 | $359504 | ||||||
| NPV | 15566 | (111719) | 159504 |
| Majestic Mulch and Compost Company (MMCC) | |||||||||||||||||||||
| YEAR | 0 | 1 | 2 | 3 | 4 | 5 | 6 | 7 | 8 | ||||||||||||
| Background Data | |||||||||||||||||||||
| Unit Sales Estimates | 3000 | 5000 | 6000 | 6500 | 6000 | 5000 | 4000 | 3000 | |||||||||||||
| Variable Cost unit | $ 6000 | ||||||||||||||||||||
| Fixed Costs per year | $ 2500000 | ||||||||||||||||||||
| Sale Price per unit | $ 12000 | $ 12000 | $ 12000 | $ 12000 | $ 11000 | $ 11000 | $ 11000 | $ 11000 | $ 11000 | ||||||||||||
| Tax Rate | 340 | ||||||||||||||||||||
| Required Return on Project | 150 | ||||||||||||||||||||
| Yr 0 NWC | $ 2000000 | ||||||||||||||||||||
| NWC of sales | 15 | ||||||||||||||||||||
| Equipment cost - installed | $ 800000 | ||||||||||||||||||||
| Salvage Value in year 8 | 20 | of equipment cost | |||||||||||||||||||
| Depreciation Calculations | |||||||||||||||||||||
| Equipment Depreciable Base | 800000 | ||||||||||||||||||||
| MACRS (Eqpt-7 yr) | 1429 | 2449 | 1749 | 1249 | 892 | 893 | 893 | 446 | |||||||||||||
| Recovery Allowance | 114320 | 195920 | 139920 | 99920 | 71360 | 71440 | 71440 | 35680 | |||||||||||||
| Book Value | 685680 | 489760 | 349840 | 249920 | 178560 | 107120 | 35680 | 0 | |||||||||||||
| After-Tax Salvage Value | |||||||||||||||||||||
| Salvage Value | 20 | 160000 | |||||||||||||||||||
| Book Value (Year 8) | 0 | ||||||||||||||||||||
| Capital GainLoss | 160000 | ||||||||||||||||||||
| Taxes | 54400 | ||||||||||||||||||||
| Net SV (SV-Taxes) | 105600 | ||||||||||||||||||||
| Required Net Working Capital Investment | |||||||||||||||||||||
| 20000 | 54000 | 90000 | 108000 | 107250 | 99000 | 82500 | 66000 | 49500 | |||||||||||||
| YEAR | 0 | 1 | 2 | 3 | 4 | 5 | 6 | 7 | 8 | ||||||||||||
| Initial Investment | |||||||||||||||||||||
| Equipment Cost | (800000) | ||||||||||||||||||||
| Sales | 360000 | 600000 | 720000 | 715000 | 660000 | 550000 | 440000 | 330000 | |||||||||||||
| Variable Costs | 180000 | 300000 | 360000 | 390000 | 360000 | 300000 | 240000 | 180000 | |||||||||||||
| Fixed Costs | 25000 | 25000 | 25000 | 25000 | 25000 | 25000 | 25000 | 25000 | |||||||||||||
| Depreciation (Eqpt)) | 114320 | 195920 | 139920 | 99920 | 71360 | 71440 | 71440 | 35680 | |||||||||||||
| EBT | 40680 | 79080 | 195080 | 200080 | 203640 | 153560 | 103560 | 89320 | |||||||||||||
| Taxes | 13831 | 26887 | 66327 | 68027 | 69238 | 52210 | 35210 | 30369 | |||||||||||||
| Net Operating Income | 26849 | 52193 | 128753 | 132053 | 134402 | 101350 | 68350 | 58951 | |||||||||||||
| Add back Depreciation | 114320 | 195920 | 139920 | 99920 | 71360 | 71440 | 71440 | 35680 | |||||||||||||
| CASH FLOW from Operations | 141169 | 248113 | 268673 | 231973 | 205762 | 172790 | 139790 | 94631 | |||||||||||||
| NWC investment amp Recovery | (20000) | (34000) | (36000) | (18000) | 750 | 8250 | 16500 | 16500 | 66000 | ||||||||||||
| Salvage Value | 105600 | ||||||||||||||||||||
| TOTAL PROJECTED CF | (820000) | 107169 | 212113 | 250673 | 232723 | 214012 | 189290 | 156290 | 266231 | ||||||||||||
| Discounted Cash Flows | (820000) | 93190 | 160388 | 164821 | 133060 | 106402 | 81835 | 58755 | 87031 | ||||||||||||
| Cumulative Cash flows | (820000) | (712831) | (500718) | (250046) | (17323) | 196690 | 385979 | 542269 | 808500 | ||||||||||||
| NPV | $65483 | ||||||||||||||||||||
| IRR | 1724 | ||||||||||||||||||||
| Payback | 408 |
| Depreciation | 5-year Asset | ||||||||
| Year | Beg BV | Depr | Deprec | End BV | |||||
| 1 | $ 1200000 | 2000 | $ 240000 | $ 960000 | |||||
| 2 | $ 960000 | 3200 | $ 384000 | $ 576000 | |||||
| 3 | $ 576000 | 1920 | $ 230400 | $ 345600 | |||||
| 4 | $ 345600 | 1152 | $ 138240 | $ 207360 | |||||
| 5 | $ 207360 | 1152 | $ 138240 | $ 69120 | |||||
| 6 | $ 69120 | 576 | $ 69120 | $ - 0 | |||||
| 10000 | $ 1200000 | ||||||||
| EOY 5 | $3000 | $221501 | $78499 | ||||||
| EOY 2 | $4000 | $459840 | ($59840) |
| Pro Forma Income Statement | |||||||||
| Year | 0 | 1 | 2 | 3 | |||||
| Sales | 200000 | 200000 | 200000 | ||||||
| Variable Costs | 125000 | 125000 | 125000 | ||||||
| Gross Profit | 75000 | 75000 | 75000 | ||||||
| Fixed Costs | 12000 | 12000 | 12000 | ||||||
| Depreciation | 30000 | 30000 | 30000 | ||||||
| EBIT | 33000 | 33000 | 33000 | ||||||
| Taxes | 11220 | 11220 | 11220 | ||||||
| Net Income | 21780 | 21780 | 21780 | ||||||
| Cash Flows | |||||||||
| Operating Cash Flow | 51780 | 51780 | 51780 | ||||||
| Changes in NWC | -20000 | 20000 | |||||||
| Net Capital Spending | -90000 | ||||||||
| Cash Flow From Assets | -110000 | 51780 | 51780 | 71780 | |||||
| Net Present Value | $1064769 | ||||||||
| IRR | 2576 |
| 5500 | |
| 6000 | |
| 6500 |
| Pro Forma Income Statements | |||||||||
| Year | 0 | 1 | 2 | 3 | |||||
| Sales | 200000 | 200000 | 200000 | ||||||
| Variable Costs | 125000 | 125000 | 125000 | ||||||
| Gross Profit | 75000 | 75000 | 75000 | ||||||
| Fixed Costs | 12000 | 12000 | 12000 | ||||||
| Depreciation | 30000 | 30000 | 30000 | ||||||
| EBIT | 33000 | 33000 | 33000 | ||||||
| Taxes | 11220 | 11220 | 11220 | ||||||
| Net Income | 21780 | 21780 | 21780 | ||||||
| Cash Flows | |||||||||
| Operating Cash Flow | 51780 | 51780 | 51780 | ||||||
| Changes in NWC | (20000) | 20000 | |||||||
| Net Capital Spending | (90000) | ||||||||
| Cash Flow From Assets | (110000) | 51780 | 51780 | 71780 | |||||
| Net Present Value | $1064769 | ||||||||
| IRR | 2576 |
| -30 | -20 | -10 | 0 | 10 | 20 | 30 | |||||||||
| UNITS | -70083865667486 | -415340381449136 | -129842106223412 | 155656169002312 | 441154444228038 | 726652719453761 | 101215099467949 | ||||||||
| FC | 512529013034468 | 393571398357083 | 274613783679698 | 155656169002312 | 36698554324927 | -82259060352458 | -201216675029843 |
| Sensitivity Analysis | |||||||||||||||||||||||||||||||||||||||
| -30 | -20 | -10 | 0 | 10 | 20 | 30 | -30 | -20 | -10 | 0 | 10 | 20 | 30 | ||||||||||||||||||||||||||
| Base | Units | Units | Units | Units | Units | Units | Units | Base | Fixed Cost | Fixed Cost | Fixed Cost | Fixed Cost | Fixed Cost | Fixed Cost | Fixed Cost | ||||||||||||||||||||||||
| Units | 6000 | 4200 | 4800 | 5400 | 6000 | 6600 | 7200 | 7800 | Units | 6000 | 6000 | 6000 | 6000 | 6000 | 6000 | 6000 | 6000 | ||||||||||||||||||||||
| Priceunit | $ 80 | 80 | 80 | 80 | 80 | 80 | 80 | 80 | Priceunit | $ 80 | 80 | 80 | 80 | 80 | 80 | 80 | 80 | ||||||||||||||||||||||
| Variable costunit | $ 60 | 60 | 60 | 60 | 60 | 60 | 60 | 60 | Variable costunit | $ 60 | 60 | 60 | 60 | 60 | 60 | 60 | 60 | ||||||||||||||||||||||
| Fixed costyear | $ 50000 | 50000 | 50000 | 50000 | 50000 | 50000 | 50000 | 50000 | Fixed costyear | $ 50000 | 35000 | 40000 | 45000 | 50000 | 55000 | 60000 | 65000 | ||||||||||||||||||||||
| Initial investment | $ 200000 | Initial investment | $ 200000 | ||||||||||||||||||||||||||||||||||||
| Depreciated to salvage value of 0 over 5 years | Depreciated to salvage value of 0 over 5 years | ||||||||||||||||||||||||||||||||||||||
| Deprecyr | $ 40000 | Deprecyr | $ 40000 | ||||||||||||||||||||||||||||||||||||
| Tax rate | 34 | Tax rate | 34 | ||||||||||||||||||||||||||||||||||||
| Required Return | 12 | Required Return | 12 | ||||||||||||||||||||||||||||||||||||
| BASE | UNITS | UNITS | UNITS | UNITS | UNITS | UNITS | UNITS | BASE | FC | FC | FC | FC | FC | FC | FC | ||||||||||||||||||||||||
| Units | 6000 | 4200 | 4800 | 5400 | 6000 | 6600 | 7200 | 7800 | Units | 6000 | 6000 | 6000 | 6000 | 6000 | 6000 | 6000 | 6000 | ||||||||||||||||||||||
| Priceunit | $ 80 | $ 80 | $ 80 | $ 80 | $ 80 | $ 80 | $ 80 | $ 80 | Priceunit | $ 80 | $ 80 | $ 80 | $ 80 | $ 80 | $ 80 | $ 80 | $ 80 | ||||||||||||||||||||||
| Variable costunit | $ 60 | $ 60 | $ 60 | $ 60 | $ 60 | $ 60 | $ 60 | $ 60 | Variable costunit | $ 60 | $ 60 | $ 60 | $ 60 | $ 60 | $ 60 | $ 60 | $ 60 | ||||||||||||||||||||||
| Fixed cost | $ 50000 | $ 50000 | $ 50000 | $ 50000 | $ 50000 | $ 50000 | $ 50000 | $ 50000 | Fixed cost | $ 50000 | $ 35000 | $ 40000 | $ 45000 | $ 50000 | $ 55000 | $ 60000 | $ 65000 | ||||||||||||||||||||||
| Sales | $ 480000 | $ 336000 | $ 384000 | $ 432000 | $ 480000 | $ 528000 | $ 576000 | $ 624000 | Sales | $ 480000 | $ 480000 | $ 480000 | $ 480000 | $ 480000 | $ 480000 | $ 480000 | $ 480000 | ||||||||||||||||||||||
| Variable Cost | 360000 | 252000 | 288000 | 324000 | 360000 | 396000 | 432000 | 468000 | Variable Cost | 360000 | 360000 | 360000 | 360000 | 360000 | 360000 | 360000 | 360000 | ||||||||||||||||||||||
| Fixed Cost | 50000 | 50000 | 50000 | 50000 | 50000 | 50000 | 50000 | 50000 | Fixed Cost | 50000 | 35000 | 40000 | 45000 | 50000 | 55000 | 60000 | 65000 | ||||||||||||||||||||||
| Depreciation | 40000 | 40000 | 40000 | 40000 | 40000 | 40000 | 40000 | 40000 | Depreciation | 40000 | 40000 | 40000 | 40000 | 40000 | 40000 | 40000 | 40000 | ||||||||||||||||||||||
| EBIT | 30000 | (6000) | 6000 | 18000 | 30000 | 42000 | 54000 | 66000 | EBIT | 30000 | 45000 | 40000 | 35000 | 30000 | 25000 | 20000 | 15000 | ||||||||||||||||||||||
| Taxes | 10200 | (2040) | 2040 | 6120 | 10200 | 14280 | 18360 | 22440 | Taxes | 10200 | 15300 | 13600 | 11900 | 10200 | 8500 | 6800 | 5100 | ||||||||||||||||||||||
| Net Income | 19800 | (3960) | 3960 | 11880 | 19800 | 27720 | 35640 | 43560 | Net Income | 19800 | 29700 | 26400 | 23100 | 19800 | 16500 | 13200 | 9900 | ||||||||||||||||||||||
| + Deprec | 40000 | 40000 | 40000 | 40000 | 40000 | 40000 | 40000 | 40000 | + Deprec | 40000 | 40000 | 40000 | 40000 | 40000 | 40000 | 40000 | 40000 | ||||||||||||||||||||||
| TOTAL CF | 59800 | 36040 | 43960 | 51880 | 59800 | 67720 | 75640 | 83560 | TOTAL CF | 59800 | 69700 | 66400 | 63100 | 59800 | 56500 | 53200 | 49900 | ||||||||||||||||||||||
| NPV | $ 15566 | $ (70084) | $ (41534) | $ (12984) | $ 15566 | $ 44115 | $ 72665 | $ 101215 | NPV | $ 15566 | $ 51253 | $ 39357 | $ 27461 | $ 15566 | $ 3670 | $ (8226) | $ (20122) | ||||||||||||||||||||||
| Change in NPV | -5502 | -3668 | -1834 | 00 | 1834 | 3668 | 5502 | Change in NPV | 2293 | 1528 | 764 | 00 | -764 | -1528 | -2293 | ||||||||||||||||||||||||
| Change in Variable | -300 | -200 | -100 | 00 | 100 | 200 | 300 | Change in Variable | -300 | -200 | -100 | 00 | 100 | 200 | 300 | ||||||||||||||||||||||||
| SENSITIVITY RATIO | 1834 | 1834 | 1834 | 000 | 1834 | 1834 | 1834 | SENSITIVITY RATIO | -764 | -764 | -764 | 000 | -764 | -764 | -764 | ||||||||||||||||||||||||
| INVERSE | INVERSE | INVERSE | INVERSE | INVERSE | INVERSE | INVERSE | |||||||||||||||||||||||||||||||||
| Sensitivity Ratio = ( Change in NPV) Change in Variable | |||||||||||||||||||||||||||||||||||||||
| Positive = Direct relationship | Sensitivity Ratio = ( Change in NPV) Change in Variable | ||||||||||||||||||||||||||||||||||||||
| Negative = Inverse relationship | Positive = Direct relationship | ||||||||||||||||||||||||||||||||||||||
| Negative = Inverse relationship | |||||||||||||||||||||||||||||||||||||||
| $ (200000) | $ (200000) | $ (200000) | $ (200000) | $ (200000) | $ (200000) | $ (200000) | $ (200000) | ||||||||||||||||||||||||||||||||
| 59800 | 36040 | 43960 | 51880 | 59800 | 67720 | 75640 | 83560 | $ (200000) | $ (200000) | $ (200000) | $ (200000) | $ (200000) | $ (200000) | $ (200000) | $ (200000) | ||||||||||||||||||||||||
| 59800 | 36040 | 43960 | 51880 | 59800 | 67720 | 75640 | 83560 | 59800 | 69700 | 66400 | 63100 | 59800 | 56500 | 53200 | 49900 | ||||||||||||||||||||||||
| 59800 | 36040 | 43960 | 51880 | 59800 | 67720 | 75640 | 83560 | 59800 | 69700 | 66400 | 63100 | 59800 | 56500 | 53200 | 49900 | ||||||||||||||||||||||||
| 59800 | 36040 | 43960 | 51880 | 59800 | 67720 | 75640 | 83560 | 59800 | 69700 | 66400 | 63100 | 59800 | 56500 | 53200 | 49900 | ||||||||||||||||||||||||
| 59800 | 36040 | 43960 | 51880 | 59800 | 67720 | 75640 | 83560 | 59800 | 69700 | 66400 | 63100 | 59800 | 56500 | 53200 | 49900 | ||||||||||||||||||||||||
| 59800 | 69700 | 66400 | 63100 | 59800 | 56500 | 53200 | 49900 | ||||||||||||||||||||||||||||||||
| PV | $ 215566 | $ 129916 | $ 158466 | $ 187016 | $ 215566 | $ 244115 | $ 272665 | $ 301215 | |||||||||||||||||||||||||||||||
| NPV | $ 15566 | $ (70084) | $ (41534) | $ (12984) | $ 15566 | $ 44115 | $ 72665 | $ 101215 | PV | $ 215566 | $ 251253 | $ 239357 | $ 227461 | $ 215566 | $ 203670 | $ 191774 | $ 179878 | ||||||||||||||||||||||
| NPV | $ 15566 | $ 51253 | $ 39357 | $ 27461 | $ 15566 | $ 3670 | $ (8226) | $ (20122) |
| Sensitivity Analysis | |||||||||||||
| Base | Units | Units | Fixed Cost | Fixed Cost | |||||||||
| Units | 6000 | 5500 | 6500 | 6000 | 6000 | ||||||||
| Priceunit | $ 80 | 80 | 80 | 80 | 80 | ||||||||
| Variable costunit | $ 60 | 60 | 60 | 60 | 60 | ||||||||
| Fixed costyear | $ 50000 | 50000 | 50000 | 55000 | 45000 | ||||||||
| Initial investment | $ 200000 | ||||||||||||
| Depreciated to salvage value of 0 over 5 years | |||||||||||||
| Deprecyr | $ 40000 | ||||||||||||
| Tax rate | 34 | ||||||||||||
| Required Return | 12 | ||||||||||||
| BASE | UNITS | UNITS | FC | FC | |||||||||
| Units | 6000 | 5500 | 6500 | 6000 | 6000 | ||||||||
| Priceunit | $ 80 | $ 80 | $ 80 | $ 80 | $ 80 | ||||||||
| Variable costunit | $ 60 | $ 60 | $ 60 | $ 60 | $ 60 | ||||||||
| Fixed cost | $ 50000 | $ 50000 | $ 50000 | $ 55000 | $ 45000 | ||||||||
| Sales | $ 480000 | $ 440000 | $ 520000 | $ 480000 | $ 480000 | ||||||||
| Variable Cost | 360000 | 330000 | 390000 | 360000 | 360000 | ||||||||
| Fixed Cost | 50000 | 50000 | 50000 | 55000 | 45000 | ||||||||
| Depreciation | 40000 | 40000 | 40000 | 40000 | 40000 | ||||||||
| EBIT | 30000 | 20000 | 40000 | 25000 | 35000 | ||||||||
| Taxes | 10200 | 6800 | 13600 | 8500 | 11900 | ||||||||
| Net Income | 19800 | 13200 | 26400 | 16500 | 23100 | ||||||||
| + Deprec | 40000 | 40000 | 40000 | 40000 | 40000 | ||||||||
| TOTAL CF | 59800 | 53200 | 66400 | 56500 | 63100 | ||||||||
| NPV | $ 15566 | $ (8226) | $ 39357 | $ 3670 | $ 27461 | ||||||||
| $ (200000) | $ (200000) | $ (200000) | $ (200000) | $ (200000) | |||||||||
| 59800 | 53200 | 66400 | 56500 | 63100 | |||||||||
| 59800 | 53200 | 66400 | 56500 | 63100 | |||||||||
| 59800 | 53200 | 66400 | 56500 | 63100 | |||||||||
| 59800 | 53200 | 66400 | 56500 | 63100 | |||||||||
| 59800 | 53200 | 66400 | 56500 | 63100 | |||||||||
| PV | $ 215566 | $ 191774 | $ 239357 | $ 203670 | $ 227461 | ||||||||
| NPV | $ 15566 | $ (8226) | $ 39357 | $ 3670 | $ 27461 |
| Scenario Analysis | |||||||||
| Base | Lower | Upper | |||||||
| Units | 6000 | 5500 | 6500 | ||||||
| Priceunit | $ 8000 | $ 7500 | $ 8500 | ||||||
| Variable costunit | $ 6000 | $ 5800 | $ 6200 | ||||||
| Fixed costyear | $ 50000 | $ 45000 | $ 55000 | ||||||
| BASE | BEST | WORST | |||||||
| Initial investment | $ 200000 | ||||||||
| Depreciated to salvage value of 0 over 5 years | |||||||||
| Deprecyr | $ 40000 | ||||||||
| Project Life | 5 | years | |||||||
| Tax rate | 34 | ||||||||
| Required return | 12 | ||||||||
| BASE | WORST | BEST | |||||||
| Units | 6000 | 5500 | 6500 | ||||||
| Priceunit | $ 8000 | $ 7500 | $ 8500 | ||||||
| Variable costunit | $ 6000 | $ 6200 | $ 5800 | ||||||
| Fixed Cost | $ 50000 | $ 55000 | $ 45000 | ||||||
| Sales | $ 480000 | $ 412500 | $ 552500 | ||||||
| Variable Cost | 360000 | 341000 | 377000 | ||||||
| Fixed Cost | 50000 | 55000 | 45000 | ||||||
| Depreciation | 40000 | 40000 | 40000 | ||||||
| EBIT | 30000 | (23500) | 90500 | ||||||
| Taxes | 10200 | (7990) | 30770 | ||||||
| Net Income | 19800 | (15510) | 59730 | ||||||
| + Deprec | 40000 | 40000 | 40000 | ||||||
| TOTAL CF | 59800 | 24490 | 99730 | ||||||
| NPV | 15566 | (111719) | 159504 | ||||||
| IRR | 151 | -144 | 409 | ||||||
| NOTE | Note in WORST CASE tax credit for negative earnings | ||||||||
| $ (200000) | $ (200000) | $ (200000) | |||||||
| 59800 | 24490 | 99730 | |||||||
| 59800 | 24490 | 99730 | |||||||
| 59800 | 24490 | 99730 | |||||||
| 59800 | 24490 | 99730 | |||||||
| 59800 | 24490 | 99730 | |||||||
| PV | $215566 | $88281 | $359504 | ||||||
| NPV | 15566 | (111719) | 159504 |
| Majestic Mulch and Compost Company (MMCC) | |||||||||||||||||||||
| YEAR | 0 | 1 | 2 | 3 | 4 | 5 | 6 | 7 | 8 | ||||||||||||
| Background Data | |||||||||||||||||||||
| Unit Sales Estimates | 3000 | 5000 | 6000 | 6500 | 6000 | 5000 | 4000 | 3000 | |||||||||||||
| Variable Cost unit | $ 6000 | ||||||||||||||||||||
| Fixed Costs per year | $ 2500000 | ||||||||||||||||||||
| Sale Price per unit | $ 12000 | $ 12000 | $ 12000 | $ 12000 | $ 11000 | $ 11000 | $ 11000 | $ 11000 | $ 11000 | ||||||||||||
| Tax Rate | 340 | ||||||||||||||||||||
| Required Return on Project | 150 | ||||||||||||||||||||
| Yr 0 NWC | $ 2000000 | ||||||||||||||||||||
| NWC of sales | 15 | ||||||||||||||||||||
| Equipment cost - installed | $ 800000 | ||||||||||||||||||||
| Salvage Value in year 8 | 20 | of equipment cost | |||||||||||||||||||
| Depreciation Calculations | |||||||||||||||||||||
| Equipment Depreciable Base | 800000 | ||||||||||||||||||||
| MACRS (Eqpt-7 yr) | 1429 | 2449 | 1749 | 1249 | 892 | 893 | 893 | 446 | |||||||||||||
| Recovery Allowance | 114320 | 195920 | 139920 | 99920 | 71360 | 71440 | 71440 | 35680 | |||||||||||||
| Book Value | 685680 | 489760 | 349840 | 249920 | 178560 | 107120 | 35680 | 0 | |||||||||||||
| After-Tax Salvage Value | |||||||||||||||||||||
| Salvage Value | 20 | 160000 | |||||||||||||||||||
| Book Value (Year 8) | 0 | ||||||||||||||||||||
| Capital GainLoss | 160000 | ||||||||||||||||||||
| Taxes | 54400 | ||||||||||||||||||||
| Net SV (SV-Taxes) | 105600 | ||||||||||||||||||||
| Required Net Working Capital Investment | |||||||||||||||||||||
| 20000 | 54000 | 90000 | 108000 | 107250 | 99000 | 82500 | 66000 | 49500 | |||||||||||||
| YEAR | 0 | 1 | 2 | 3 | 4 | 5 | 6 | 7 | 8 | ||||||||||||
| Initial Investment | |||||||||||||||||||||
| Equipment Cost | (800000) | ||||||||||||||||||||
| Sales | 360000 | 600000 | 720000 | 715000 | 660000 | 550000 | 440000 | 330000 | |||||||||||||
| Variable Costs | 180000 | 300000 | 360000 | 390000 | 360000 | 300000 | 240000 | 180000 | |||||||||||||
| Fixed Costs | 25000 | 25000 | 25000 | 25000 | 25000 | 25000 | 25000 | 25000 | |||||||||||||
| Depreciation (Eqpt)) | 114320 | 195920 | 139920 | 99920 | 71360 | 71440 | 71440 | 35680 | |||||||||||||
| EBT | 40680 | 79080 | 195080 | 200080 | 203640 | 153560 | 103560 | 89320 | |||||||||||||
| Taxes | 13831 | 26887 | 66327 | 68027 | 69238 | 52210 | 35210 | 30369 | |||||||||||||
| Net Operating Income | 26849 | 52193 | 128753 | 132053 | 134402 | 101350 | 68350 | 58951 | |||||||||||||
| Add back Depreciation | 114320 | 195920 | 139920 | 99920 | 71360 | 71440 | 71440 | 35680 | |||||||||||||
| CASH FLOW from Operations | 141169 | 248113 | 268673 | 231973 | 205762 | 172790 | 139790 | 94631 | |||||||||||||
| NWC investment amp Recovery | (20000) | (34000) | (36000) | (18000) | 750 | 8250 | 16500 | 16500 | 66000 | ||||||||||||
| Salvage Value | 105600 | ||||||||||||||||||||
| TOTAL PROJECTED CF | (820000) | 107169 | 212113 | 250673 | 232723 | 214012 | 189290 | 156290 | 266231 | ||||||||||||
| Discounted Cash Flows | (820000) | 93190 | 160388 | 164821 | 133060 | 106402 | 81835 | 58755 | 87031 | ||||||||||||
| Cumulative Cash flows | (820000) | (712831) | (500718) | (250046) | (17323) | 196690 | 385979 | 542269 | 808500 | ||||||||||||
| NPV | $65483 | ||||||||||||||||||||
| IRR | 1724 | ||||||||||||||||||||
| Payback | 408 |
| Depreciation | 5-year Asset | ||||||||
| Year | Beg BV | Depr | Deprec | End BV | |||||
| 1 | $ 1200000 | 2000 | $ 240000 | $ 960000 | |||||
| 2 | $ 960000 | 3200 | $ 384000 | $ 576000 | |||||
| 3 | $ 576000 | 1920 | $ 230400 | $ 345600 | |||||
| 4 | $ 345600 | 1152 | $ 138240 | $ 207360 | |||||
| 5 | $ 207360 | 1152 | $ 138240 | $ 69120 | |||||
| 6 | $ 69120 | 576 | $ 69120 | $ - 0 | |||||
| 10000 | $ 1200000 | ||||||||
| EOY 5 | $3000 | $221501 | $78499 | ||||||
| EOY 2 | $4000 | $459840 | ($59840) |
| Pro Forma Income Statement | |||||||||
| Year | 0 | 1 | 2 | 3 | |||||
| Sales | 200000 | 200000 | 200000 | ||||||
| Variable Costs | 125000 | 125000 | 125000 | ||||||
| Gross Profit | 75000 | 75000 | 75000 | ||||||
| Fixed Costs | 12000 | 12000 | 12000 | ||||||
| Depreciation | 30000 | 30000 | 30000 | ||||||
| EBIT | 33000 | 33000 | 33000 | ||||||
| Taxes | 11220 | 11220 | 11220 | ||||||
| Net Income | 21780 | 21780 | 21780 | ||||||
| Cash Flows | |||||||||
| Operating Cash Flow | 51780 | 51780 | 51780 | ||||||
| Changes in NWC | -20000 | 20000 | |||||||
| Net Capital Spending | -90000 | ||||||||
| Cash Flow From Assets | -110000 | 51780 | 51780 | 71780 | |||||
| Net Present Value | $1064769 | ||||||||
| IRR | 2576 |
| Pro Forma Income Statements | |||||||||
| Year | 0 | 1 | 2 | 3 | |||||
| Sales | 200000 | 200000 | 200000 | ||||||
| Variable Costs | 125000 | 125000 | 125000 | ||||||
| Gross Profit | 75000 | 75000 | 75000 | ||||||
| Fixed Costs | 12000 | 12000 | 12000 | ||||||
| Depreciation | 30000 | 30000 | 30000 | ||||||
| EBIT | 33000 | 33000 | 33000 | ||||||
| Taxes | 11220 | 11220 | 11220 | ||||||
| Net Income | 21780 | 21780 | 21780 | ||||||
| Cash Flows | |||||||||
| Operating Cash Flow | 51780 | 51780 | 51780 | ||||||
| Changes in NWC | (20000) | 20000 | |||||||
| Net Capital Spending | (90000) | ||||||||
| Cash Flow From Assets | (110000) | 51780 | 51780 | 71780 | |||||
| Net Present Value | $1064769 | ||||||||
| IRR | 2576 |
| Sensitivity Analysis | |||||||||
| Base | Units | Fixed Cost | |||||||
| Units | 6000 | 5500 | 6000 | ||||||
| Priceunit | $ 80 | 80 | 80 | ||||||
| Variable costunit | $ 60 | 60 | 60 | ||||||
| Fixed costyear | $ 50000 | 50000 | 55000 | ||||||
| Initial investment | $ 200000 | ||||||||
| Depreciated to salvage value of 0 over 5 years | |||||||||
| Deprecyr | $ 40000 | ||||||||
| Tax rate | 34 | ||||||||
| Required Return | 12 | ||||||||
| BASE | UNITS | FC | |||||||
| Units | 6000 | 5500 | 6000 | ||||||
| Priceunit | $ 80 | $ 80 | $ 80 | ||||||
| Variable costunit | $ 60 | $ 60 | $ 60 | ||||||
| Fixed cost | $ 50000 | $ 50000 | $ 55000 | ||||||
| Sales | $ 480000 | $ 440000 | $ 480000 | ||||||
| Variable Cost | 360000 | 330000 | 360000 | ||||||
| Fixed Cost | 50000 | 50000 | 55000 | ||||||
| Depreciation | 40000 | 40000 | 40000 | ||||||
| EBIT | 30000 | 20000 | 25000 | ||||||
| Taxes | 10200 | 6800 | 8500 | ||||||
| Net Income | 19800 | 13200 | 16500 | ||||||
| + Deprec | 40000 | 40000 | 40000 | ||||||
| TOTAL CF | 59800 | 53200 | 56500 | ||||||
| NPV | $ 15566 | $ (8226) | $ 3670 | ||||||
| Change in NPV | -1528 | -764 | |||||||
| Change in Variable | -83 | 100 | |||||||
| SENSITIVITY RATIO | 1834 | -764 | |||||||
| DIRECT | INVERSE | ||||||||
| Sensitivity Ratio = ( Change in NPV) Change in Variable | |||||||||
| Positive = Direct relationship | |||||||||
| Negative = Inverse relationship | |||||||||
| $ (200000) | $ (200000) | $ (200000) | |||||||
| 59800 | 53200 | 56500 | |||||||
| 59800 | 53200 | 56500 | |||||||
| 59800 | 53200 | 56500 | |||||||
| 59800 | 53200 | 56500 | |||||||
| 59800 | 53200 | 56500 | |||||||
| PV | $ 215566 | $ 191774 | $ 203670 | ||||||
| NPV | $ 15566 | $ (8226) | $ 3670 |
| Scenario Analysis | |||||||||
| Base | Lower | Upper | |||||||
| Units | 6000 | 5500 | 6500 | ||||||
| Priceunit | $ 8000 | $ 7500 | $ 8500 | ||||||
| Variable costunit | $ 6000 | $ 5800 | $ 6200 | ||||||
| Fixed costyear | $ 50000 | $ 45000 | $ 55000 | ||||||
| BASE | BEST | WORST | |||||||
| Initial investment | $ 200000 | ||||||||
| Depreciated to salvage value of 0 over 5 years | |||||||||
| Deprecyr | $ 40000 | ||||||||
| Project Life | 5 | years | |||||||
| Tax rate | 34 | ||||||||
| Required return | 12 | ||||||||
| BASE | WORST | BEST | |||||||
| Units | 6000 | 5500 | 6500 | ||||||
| Priceunit | $ 8000 | $ 7500 | $ 8500 | ||||||
| Variable costunit | $ 6000 | $ 6200 | $ 5800 | ||||||
| Fixed Cost | $ 50000 | $ 55000 | $ 45000 | ||||||
| Sales | $ 480000 | $ 412500 | $ 552500 | ||||||
| Variable Cost | 360000 | 341000 | 377000 | ||||||
| Fixed Cost | 50000 | 55000 | 45000 | ||||||
| Depreciation | 40000 | 40000 | 40000 | ||||||
| EBIT | 30000 | (23500) | 90500 | ||||||
| Taxes | 10200 | (7990) | 30770 | ||||||
| Net Income | 19800 | (15510) | 59730 | ||||||
| + Deprec | 40000 | 40000 | 40000 | ||||||
| TOTAL CF | 59800 | 24490 | 99730 | ||||||
| NPV | 15566 | (111719) | 159504 | ||||||
| IRR | 151 | -144 | 409 | ||||||
| NOTE | Note in WORST CASE tax credit for negative earnings | ||||||||
| $ (200000) | $ (200000) | $ (200000) | |||||||
| 59800 | 24490 | 99730 | |||||||
| 59800 | 24490 | 99730 | |||||||
| 59800 | 24490 | 99730 | |||||||
| 59800 | 24490 | 99730 | |||||||
| 59800 | 24490 | 99730 | |||||||
| PV | $215566 | $88281 | $359504 | ||||||
| NPV | 15566 | (111719) | 159504 |
| Majestic Mulch and Compost Company (MMCC) | |||||||||||||||||||||
| YEAR | 0 | 1 | 2 | 3 | 4 | 5 | 6 | 7 | 8 | ||||||||||||
| Background Data | |||||||||||||||||||||
| Unit Sales Estimates | 3000 | 5000 | 6000 | 6500 | 6000 | 5000 | 4000 | 3000 | |||||||||||||
| Variable Cost unit | $ 6000 | ||||||||||||||||||||
| Fixed Costs per year | $ 2500000 | ||||||||||||||||||||
| Sale Price per unit | $ 12000 | $ 12000 | $ 12000 | $ 12000 | $ 11000 | $ 11000 | $ 11000 | $ 11000 | $ 11000 | ||||||||||||
| Tax Rate | 340 | ||||||||||||||||||||
| Required Return on Project | 150 | ||||||||||||||||||||
| Yr 0 NWC | $ 2000000 | ||||||||||||||||||||
| NWC of sales | 15 | ||||||||||||||||||||
| Equipment cost - installed | $ 800000 | ||||||||||||||||||||
| Salvage Value in year 8 | 20 | of equipment cost | |||||||||||||||||||
| Depreciation Calculations | |||||||||||||||||||||
| Equipment Depreciable Base | 800000 | ||||||||||||||||||||
| MACRS (Eqpt-7 yr) | 1429 | 2449 | 1749 | 1249 | 893 | 893 | 893 | 445 | |||||||||||||
| Recovery Allowance | 114320 | 195920 | 139920 | 99920 | 71440 | 71440 | 71440 | 35600 | |||||||||||||
| Book Value | 685680 | 489760 | 349840 | 249920 | 178480 | 107040 | 35600 | 0 | |||||||||||||
| After-Tax Salvage Value | |||||||||||||||||||||
| Salvage Value | 20 | 160000 | |||||||||||||||||||
| Book Value (Year 8) | 0 | ||||||||||||||||||||
| Capital GainLoss | 160000 | ||||||||||||||||||||
| Taxes | 54400 | ||||||||||||||||||||
| Net SV (SV-Taxes) | 105600 | ||||||||||||||||||||
| Required Net Working Capital Investment | |||||||||||||||||||||
| 20000 | 54000 | 90000 | 108000 | 107250 | 99000 | 82500 | 66000 | 49500 | |||||||||||||
| YEAR | 0 | 1 | 2 | 3 | 4 | 5 | 6 | 7 | 8 | ||||||||||||
| Initial Investment | |||||||||||||||||||||
| Equipment Cost | (800000) | ||||||||||||||||||||
| Sales | 360000 | 600000 | 720000 | 715000 | 660000 | 550000 | 440000 | 330000 | |||||||||||||
| Variable Costs | 180000 | 300000 | 360000 | 390000 | 360000 | 300000 | 240000 | 180000 | |||||||||||||
| Fixed Costs | 25000 | 25000 | 25000 | 25000 | 25000 | 25000 | 25000 | 25000 | |||||||||||||
| Depreciation (Eqpt)) | 114320 | 195920 | 139920 | 99920 | 71440 | 71440 | 71440 | 35600 | |||||||||||||
| EBT | 40680 | 79080 | 195080 | 200080 | 203560 | 153560 | 103560 | 89400 | |||||||||||||
| Taxes | 13831 | 26887 | 66327 | 68027 | 69210 | 52210 | 35210 | 30396 | |||||||||||||
| Net Operating Income | 26849 | 52193 | 128753 | 132053 | 134350 | 101350 | 68350 | 59004 | |||||||||||||
| Add back Depreciation | 114320 | 195920 | 139920 | 99920 | 71440 | 71440 | 71440 | 35600 | |||||||||||||
| CASH FLOW from Operations | 141169 | 248113 | 268673 | 231973 | 205790 | 172790 | 139790 | 94604 | |||||||||||||
| NWC investment amp Recovery | (20000) | (34000) | (36000) | (18000) | 750 | 8250 | 16500 | 16500 | 66000 | ||||||||||||
| Salvage Value | 105600 | ||||||||||||||||||||
| TOTAL PROJECTED CF | (820000) | 107169 | 212113 | 250673 | 232723 | 214040 | 189290 | 156290 | 266204 | ||||||||||||
| Discounted Cash Flows | (820000) | 93190 | 160388 | 164821 | 133060 | 106416 | 81835 | 58755 | 87023 | ||||||||||||
| NPV | $ 65488 | ||||||||||||||||||||
| IRR | 1724 |
| Depreciation | 5-year Asset | ||||||||
| Year | Beg BV | Depr | Deprec | End BV | |||||
| 1 | $ 1200000 | 2000 | $ 240000 | $ 960000 | |||||
| 2 | $ 960000 | 3200 | $ 384000 | $ 576000 | |||||
| 3 | $ 576000 | 1920 | $ 230400 | $ 345600 | |||||
| 4 | $ 345600 | 1152 | $ 138240 | $ 207360 | |||||
| 5 | $ 207360 | 1152 | $ 138240 | $ 69120 | |||||
| 6 | $ 69120 | 576 | $ 69120 | $ - 0 | |||||
| 10000 | $ 1200000 | ||||||||
| EOY 5 | $3000 | $221501 | $78499 | ||||||
| EOY 2 | $4000 | $459840 | ($59840) |
| Pro Forma Income Statement | |||||||||
| Year | 0 | 1 | 2 | 3 | |||||
| Sales | 200000 | 200000 | 200000 | ||||||
| Variable Costs | 125000 | 125000 | 125000 | ||||||
| Gross Profit | 75000 | 75000 | 75000 | ||||||
| Fixed Costs | 12000 | 12000 | 12000 | ||||||
| Depreciation | 30000 | 30000 | 30000 | ||||||
| EBIT | 33000 | 33000 | 33000 | ||||||
| Taxes | 11220 | 11220 | 11220 | ||||||
| Net Income | 21780 | 21780 | 21780 | ||||||
| Cash Flows | |||||||||
| Operating Cash Flow | 51780 | 51780 | 51780 | ||||||
| Changes in NWC | -20000 | 20000 | |||||||
| Net Capital Spending | -90000 | ||||||||
| Cash Flow From Assets | -110000 | 51780 | 51780 | 71780 | |||||
| Net Present Value | $1064769 | ||||||||
| IRR | 2576 |
| Depreciation | 5-year Asset | ||||||||
| Year | Beg BV | Depr | Deprec | End BV | |||||
| 1 | $ 1200000 | 2000 | $ 240000 | $ 960000 | |||||
| 2 | $ 960000 | 3200 | $ 384000 | $ 576000 | |||||
| 3 | $ 576000 | 1920 | $ 230400 | $ 345600 | |||||
| 4 | $ 345600 | 1152 | $ 138240 | $ 207360 | |||||
| 5 | $ 207360 | 1152 | $ 138240 | $ 69120 | |||||
| 6 | $ 69120 | 576 | $ 69120 | $ - 0 | |||||
| 10000 | $ 1200000 |

The role of the financial manager is to answer these questions
9-2
What Investments Do
You Make
How Do You Finance These Investments
How Will You Manage Daily
Financial Activities
Capital Budgeting Decisions
Capital Structure Decisions
Working Capital Decisions
Making Capital Investment Decisions (Ch 9)
Investment Criteria (Ch 8)
FV and PV ndash Multiple Cash Flows (Ch 5)
FV and PV ndash Single Lump Sum (Ch 4)
Analyzing Financial Statements (Ch 3)
Financial Statements and Cash Flow (Ch 2)
Goal of Financial Management (Ch 1)
9-3
Blue Hen Brewery has developed a new style of beer that they think will be a big seller in the marketplace Higher alcohol content 16 ounce cans vs 12 ounce bottles
We need to determine whether or not this investment will increase shareholder value
9-4
Cash flow estimates are the starting point in analyzing an investment The cash flows were simply given to us in Chapter 8
We now need to understand where these cash flows come from And determine which cash flows should be considered in
the investment decision
9-5
Understand how to determine the relevant cash flows for a proposed investment
Understand how to analyze a projectrsquos projected cash flows
Learn how to evaluate an estimated NPV Scenario analysis Sensitivity analysis
9-6
Relevant Cash Flows
9-7
Once a company decides to take on a new investment project their cash flows are going to be different If the Blue Hen Brewery takes on this new product
line their cash flows will be altered
The challenge for the Finance manager is to determine if the change in cash flows that result from the investment will increase the shareholder value
9-8
9-9
Incremental Cash Flows for a Project
Relevant Cash Flows
Include only cash flows that will only occur if the project is accepted Incremental cash flows
The stand-alone principle allows us to analyze each project in isolation from the firm simply by focusing on incremental cash flows
In general it is easy to determine cash flows that are directly linked to the investment project under consideration Incremental revenue from the new product (eg
sales of the new beer) Incremental costs from the new product (eg
brewing ingredients packaging marketing)
There are however some situations where it can be difficult to determine if cash flows are or are not relevant
9-10
Relevant
bullOpportunity costsbullSide effectserosionbullNet working capitalbullTax effectsbullAfter tax salvage value
Not Relevant
bull ldquoSunkrdquo costsbullFinancing costs
9-11
The most valuable alternative that is given up if a particular investment is undertaken
If the project being considered is using an asset that has alternative uses and value then it is a relevant cash flow
9-12
Opportunity Cost
For the new Blue Hen Brewery beer being considered the plan is to use an older brewery building that was purchased years ago for $100000 and after depreciation is currently on their books for $40000
Should this be considered in the cash flow analysis for evaluating the new higher-alcohol product for Blue Hen Brewery If so what is the relevant cash flow amount
9-13
Which of the following is correct with respect to how to treat the old building that will be used for the new Blue Hen Brewery productA Since it is currently not being used it should be viewed as
ldquofreerdquo and have no impact on the cash flow for analyzing the new investment opportunity (ie this is a sunk cost)
B The cash flow impact to the project should be $100000 since this is what the building cost years ago
C The cash flow impact to the project should be $40000 since this is what the book value of the building currently is
D None of the above
9-14
The opportunity cost is what the building and land could be sold for (ie the current market value of the building) This is the most valuable alternative that is given up if a
particular investment is undertaken So if the building could be sold for say $75000 then it
is this amount of $75000 that is a relevant cash flow in the investment decision
9-15
9-16
When a company launches a new product there could be ldquospilloverrdquo impacts on the sales of existing products Known as ldquoside effectsrdquo Can be positive ndash the new product increases the
sales of existing products Can be negative ndash the new product decreases
the sales of existing products (called ldquoerosionrdquo)
The cash flow of a new project that comes at the expense of a firmrsquos existing projects
Also known as ldquoproduct cannibalizationrdquo
9-17
Erosion
There are many very loyal customers of Blue Hen Brewery that drink only Blue Hen beer products
Some of these customers will buy the new higher-alcohol products instead of buying existing Blue Hen Brewery products This new product will ldquoeroderdquo or ldquocannibalizerdquo existing
product lines
This is a relevant cash flow impact that should be considered in the investment analysis for the new product
9-18
Thrill Rides is considering adding a new roller coaster to its amusement park The addition is expected to increase its overall ticket sales In particular the company expects to sell more tickets for its current roller coaster and experience extremely high demand for its new coaster Sales for its boat ride are expected to decline but food and beverage sales are expected to increase significantly All of the following are side effects associated with the new roller coaster with the exception of the
A Increased food sales
B Additional sales for the existing coaster
C Increased food costs from the higher food sales
D Reduced sales for the boat ride
E Ticket sales for the new coaster
9-19
9-20
Net working capital is Current Assets minus Current Liabilities
Current Assets Current Liabilitiesbull Cashbull Accounts Receivablebull Inventory
bull Accounts Payable
Most investment projects will impact a firmrsquos working capital Accounts receivable and inventory would increase to
support higher sales levels Accounts payable would likely increase as inventory
increases
These cash flows donrsquot appear on the income statement due to the GAAP matching principle Sales recorded when made not when cash is received Cost of goods sold recorded when sales are made
whether suppliers paid yet or not
9-21
In general most projects will require an investment in working capital at the beginning of the project This would need to be captured in the cash flow analysis
(as a cash outflow) at the time of launch or in the first year
At the end of the project the increase in working capital would no longer be needed as inventories are sold receivables collected etc This would need to be captured in the last year of the
project as a cash inflow from the release of working capital
9-22
We need to consider the tax impacts of all cash flows
Incremental cash flows are meant to be after-taxincremental cash flows
Which tax rate is most relevant for after-tax cash flowsA Marginal tax rateB Average tax rate
9-23
Many projects will require an investment in long-term assets at the beginning of the project This would need to be captured in the cash flow
analysis (as a cash outflow) at the time of launch
At the end of the project if there is value in this fixed asset the after-tax salvage value needs to be determined
9-24
If the salvage value is different from the book value of the asset then there is a tax effect which impacts cash flows
9-25
After-Tax Salvage
Salvage Amount= Tax rate [Salvage
Amount ndash Book Value]-
Book Value Initial Cost= - Accumulated
Depreciation
Straight-line depreciationD = (Initial cost ndash salvage) number of yearsStraight Line rarr Salvage Value
MACRS (Accelerated Depreciation)Depreciate rarr 0Recovery Period = Class Life12 Year ConventionMultiply percentage in table by the initial cost
9-26Copyright (c) 2017 McGraw-Hill Education All rights reserved No reproduction or distribution without the prior written consent of McGraw-Hill Education
You purchase a new piece of equipment for $100000 to be used in a project that will last 4 years If it is depreciated on a straight-line basis over 5 years what is the book value after 4 years
A $80000B $75000C $25000D $20000E $0
9-27
If you then sell this fixed asset at the end of the project (after 4 years) for $20000 what is your after-tax salvage value (Assume a 30 tax rate)
A $26000B $20000C $14000D $80000E $0
9-28
If you then sell this fixed asset at the end of the project (after 4 years) for $30000 what is your after-tax salvage value (Assume a 30 tax rate)
A $39000B $30000C $27000D $21000E $0
9-29
Net Salvage Cash Flow = SP - (SP-BV)(T)
WhereSP = Selling PriceBV = Book ValueT = Corporate tax rate
Copyright (c) 2017 McGraw-Hill Education All rights reserved No reproduction or distribution without the prior written consent of McGraw-Hill Education 9-30
This represents the tax paid on the gain or the tax benefit of the loss
Depreciation and After-Tax Salvage Car purchased for $12000 5-year property Marginal tax rate = 34
9-31
Depreciation 5-year Asset
Year Beg BV Depr Deprec End BV1 1200000$ 2000 240000$ 960000$ 2 960000$ 3200 384000$ 576000$ 3 576000$ 1920 230400$ 345600$ 4 345600$ 1152 138240$ 207360$ 5 207360$ 1152 138240$ 69120$ 6 69120$ 576 69120$ -$
10000 1200000$
Copyright (c) 2017 McGraw-Hill Education All rights reserved No reproduction or distribution without the prior written consent of McGraw-Hill Education
Depreciation 5-year Asset
Year Beg BV Depr Deprec End BV1 1200000$ 2000 240000$ 960000$ 2 960000$ 3200 384000$ 576000$ 3 576000$ 1920 230400$ 345600$ 4 345600$ 1152 138240$ 207360$ 5 207360$ 1152 138240$ 69120$ 6 69120$ 576 69120$ -$
10000 1200000$
Net Salvage Cash Flow = SP - (SP-BV)(T)If sold at EOY 5 for $3000
NSCF = 3000 - (3000 - 69120)(34) = $221501= $3000 ndash 78499 = $221501
If sold at EOY 2 for $4000NSCF = 4000 - (4000 - 5760)(34) = $459840
= $4000 ndash (-59840) = $459840
Copyright (c) 2017 McGraw-Hill Education All rights reserved No reproduction or distribution without the prior written consent of McGraw-Hill Education 9-32
What is the after-tax net salvage cash flow at end of year 5 and 2
A cost that has already been incurred and cannot be recouped
Therefore it should not be considered in an investment decision
9-33
Sunk Cost
The Blue Hen Brewery spent $100000 on market research and consulting fees to analyze their higher-alcohol beer product
Is this a sunk costA YesB NoC More information is needed
9-34
In Chapter 2 we learned that financing costs (eg interest expense) is a cash flow to creditors Interest expense is not an operating expense
We care only about cash flow from assets when we make investment decisions
Financing decisions are important but this is a separate question from deciding if an investment increases shareholder value or not Thus Financing costs are not a relevant cash flow in
analyzing an investment project
9-35
Relevant
bullOpportunity costsbullSide effectserosionbullNet working capitalbullTax effectsbullAfter-tax salvage value
Not Relevant
bull ldquoSunkrdquo costsbullFinancing costs
9-36
Which one of the following principles refers to the assumption that a project will be evaluated based on its incremental cash flows
A Forecast assumption principleB Base assumption principleC Fallacy principleD Erosion principle E Stand-alone principle
9-37
A cost that should be ignored when evaluating a project because that cost has already been incurred and cannot be recouped is referred to as a(n)
A Fixed costB Forgotten costC Variable costD Opportunity costE Sunk cost
9-38
Lake City Plastics currently produces plastic plates and silverware The company is considering expanding its product offerings to include plastic serving trays All of the following are relevant costs to this project with the exception of
A The cost of additional utilities required to operate the serving tray production operation
B Any change in the expected sales of plates and silverware gained from offering trays also
C A percentage of the current operating overhead
D The additional plastic raw materials that would be required
E The cost to acquire the forms needed to mold the trays
9-39
Which one of the following terms is most commonly used to describe the cash flows of a new project that are simply an offset of reduced cash flows for a current project
A Opportunity costB Sunk costC ErosionD Replicated flowsE Pirated flows
9-40
Pro Forma Financial
Statements and Cash Flows
9-41
The process to evaluate a proposed investment is as follows
9-42
Pro Forma Financial
Statements
Projected Cash Flows
Estimate Project Value
bull Assumptions are gathered and these serve as the basis for the pro forma financial statements
bull Incremental cash flows need to be determined Cash flow from
assets
bull Project value is determined NPV IRR PI Payback
Financial statements projecting future yearsrsquo operations Pro forma income
statement Pro forma balance sheet
Summarizes all relevant information for a project
9-43
Pro Forma Financial
Statements
Underwater Adventures Inc specializes in selling unique underwater experiences for scuba divers and snorkelers They have developed a ldquoshark attractantrdquo product to meet
this demand of customers who want to get close to sharks for better photos to post on social media
We have been asked to evaluate whether launching this product is a good idea
9-44
Estimated sales 50000 cans Sales Price per can $400 Cost per can $250 Estimated life 3 years Fixed costs $12000year Initial equipment cost $90000
100 depreciated over 3 year life Investment in NWC $20000 Tax rate 34 Cost of capital 20
Copyright (c) 2017 McGraw-Hill Education All rights reserved No reproduction or distribution without the prior written consent of McGraw-Hill Education 9-45
9-46Copyright (c) 2017 McGraw-Hill Education All rights reserved No reproduction or distribution without the prior written consent of McGraw-Hill Education
Sales (50000 units at $400unit) $200000Variable Costs ($250unit) ($125000)Gross Profit $75000Fixed Costs ($12000)Depreciation ($90000 3) ($30000)EBIT $33000Taxes (34) ($11200)
Net Income $21780
The pro forma income statement currently does not have any interest expense
Should interest expense be includedA YesB No
9-47
No interest expense is a financing expense and not a component of operating cash flow
We need to understand the cash flow impacts that result from changes in the balance sheet Investments in working capital (eg higher
inventory and accounts receivable) Investments in fixed assets (ie capital
requirements of the project) We donrsquot care about the financing aspects
of the balance sheet For the same reason we didnrsquot consider interest
expense in the pro forma income statement9-48
Estimated sales 50000 cans Sales Price per can $400 Cost per can $250 Estimated life 3 years Fixed costs $12000year Initial equipment cost $90000
100 depreciated over 3 year life Investment in NWC $20000 Tax rate 34 Cost of capital 20
Copyright (c) 2017 McGraw-Hill Education All rights reserved No reproduction or distribution without the prior written consent of McGraw-Hill Education 9-49
9-50Copyright (c) 2017 McGraw-Hill Education All rights reserved No reproduction or distribution without the prior written consent of McGraw-Hill Education
Year0 1 2 3
Net Working Capital
$20000 $20000 $20000 $20000
Net Fixed Assets
90000 60000 30000 0
Total Investment
$110000 $80000 $50000 $20000
Net Fixed Assets declines by the amount of depreciation each year
The process to evaluate a proposed investment is as follows
9-51
Pro Forma Financial
Statements
Projected Cash Flows
Estimate Project Value
9-52
Net Income Depreciation= +
Earnings Before Interest amp Taxes Depreciation Taxes= + -
Operating Cash Flow
Operating Cash Flow= minus
Net Capital
Spending
Changes in Net
Working Capital
Cash Flow from
Assetsminus
+ Interest
Will be 0 since interest is not a
relevant cash flow
9-53
Sales (50000 units at $400unit)
$200000
Variable Costs ($250unit) (125000)
Gross profit $ 75000
Fixed costs (12000)
Depreciation ($90000 3) (30000)
EBIT $ 33000
Taxes (34) (11220)
Net Income $ 21780=======
What is the operating cash flow
A $21750B $33000C $63000D $51780E $63780
9-54
Net Income Depreciation= + If no interest expense
Earnings Before Interest amp Taxes Depreciation Taxes= + -
Operating Cash Flow
$21780 $30000= +If no interest
expense
$33000 $30000 $11220= + -Operating Cash Flow
= $51780
9-55
Year
0 1 2 3
OCF $51780 $51780 $51780
NWC -$20000 20000
Capital Spending
-$90000
CFFA -$110000 $51780 $51780 $71780
Note Investment in NWC is recovered in final yearEquipment cost is a cash outflow in year 0
Copyright (c) 2017 McGraw-Hill Education All rights reserved No reproduction or distribution without the prior written consent of McGraw-Hill Education
9-56Copyright (c) 2017 McGraw-Hill Education All rights reserved No reproduction or distribution without the prior written consent of McGraw-Hill Education
Year 0 1 2 3Sales 200000 200000 200000Variable Costs 125000 125000 125000Gross Profit 75000 75000 75000Fixed Costs 12000 12000 12000Depreciation 30000 30000 30000EBIT 33000 33000 33000Taxes 11220 11220 11220Net Income 21780 21780 21780
Operating Cash Flow 51780 51780 51780Changes in NWC -20000 20000Net Capital Spending -90000Cash Flow From Assets -110000 51780 51780 71780
Pro Forma Income Statement
Cash Flows
The process to evaluate a proposed investment is as follows
9-57
Pro Forma Financial
Statements
Projected Cash Flows
Estimate Project Value
9-58
Operating Cash Flow 51780 51780 51780Changes in NWC -20000 20000Net Capital Spending -90000Cash Flow From Assets -110000 51780 51780 71780
Net Present Value $1064769IRR 2576
Cash Flows
We can estimate the project value by calculation the NPV and IRR
9-59
Operating Cash Flow 51780 51780 51780Changes in NWC -20000 20000Net Capital Spending -90000Cash Flow From Assets -110000 51780 51780 71780
Net Present Value $1064769IRR 2576
Cash Flows
Should we accept or reject the project
Acceptbull The NPV is gt 0bull The IRR is greater than the
required rate of return of 20
9-60
Year 0 1 2 3Sales 200000 200000 200000Variable Costs 125000 125000 125000Gross Profit 75000 75000 75000Fixed Costs 12000 12000 12000Depreciation 30000 30000 30000EBIT 33000 33000 33000Taxes 11220 11220 11220Net Income 21780 21780 21780
Operating Cash Flow 51780 51780 51780Changes in NWC -20000 20000Net Capital Spending -90000Cash Flow From Assets -110000 51780 51780 71780
Net Present Value $1064769IRR 2576
Pro Forma Income Statement
Cash Flows
OCF = EBIT + Depreciation ndash TaxesOCF = Net Income + Depreciation (if no interest)
Copyright (c) 2017 McGraw-Hill Education All rights reserved No reproduction or distribution without the prior written consent of McGraw-Hill Education
A new project is expected to generate an operating cash flow of $38728 and will initially free up $11610 in net working capital Purchases of fixed assets costing $52800 will be required to start up the project What is the total cash flow for this project at time zero
A -$64410
B -$41190
C -$52800
D $25682
E $50338
9-61
The pro forma income statement for a proposed investment should include all of the following except
A Fixed costsB Forecasted salesC Depreciation expenseD TaxesE Changes in net working capital
9-62
9-63
Sales (50000 units at $400unit)
$200000
Variable Costs ($250unit) (125000)
Gross profit $ 75000
Fixed costs (12000)
Depreciation ($90000 3) (30000)
EBIT $ 33000
Taxes (34) (11220)
Net Income $ 21780=======
What is the operating cash flow (using the approaches already learned)
A $21750B $33000C $63000D $51780E $63780
9-64
Net Income Depreciation= + If no interest expense
Earnings Before Interest amp Taxes Depreciation Taxes= + -
Operating Cash Flow
$21780 $30000= +If no interest
expense
$33000 $30000 $11220= + -Operating Cash Flow
= $51780
Option 1
Option 2
The tax savings that results from the depreciation deduction
Calculated as depreciation multiplied by the corporate tax rate
9-65
Depreciation Tax Shield
9-66
(Sales ndash Costs) (1 ndash Tax Rate) = +Operating
Cash FlowDepreciation Tax Rate
Option 3
9-67
Sales (50000 units at $400unit)
$200000
Variable Costs ($250unit) (125000)
Gross profit $ 75000
Fixed costs (12000)
Depreciation ($90000 3) (30000)
EBIT $ 33000
Taxes (34) (11220)
Net Income $ 21780=======
What is the operating cash flow using the tax shield approach
9-68
($200000 -$137000) 66
+ $30000 34
= $51780
=
(Sales ndash Costs) (1 ndash Tax Rate) = +Operating
Cash FlowDepreciation Tax Rate
Which one of the following is the formula for computing operating cash flow
A Net Income + Depreciation + InterestB Net Income + Depreciation - InterestC EBIT + Depreciation - TaxesD (Sales ndash Costs) (1-Tax Rate) + (Depreciation Tax Rate)E A C and D
9-69
Evaluating NPV
Estimates
9-70
Calculating NPV is just an estimate based on the best information available The calculations could be wrong The confidence level in the analysis is a
judgment call A positive NPV suggests the project may be
worth doing But more analysis normally would be required
It is important to understand what the NPV looks like when things donrsquot go as planned
9-71
9-72
If NPV gt 0 Accept the project
Maybe accept the
project
Why maybe
9-73
What drives the NPV result
Projected future cash
flow
How do you know your projected estimates are
accurate
9-74
Forecasting Risk
We need to develop some tools to understand where potential estimate errors may exist
The possibility that errors (or poor estimates) in projected cash flows will lead to incorrect decisions
Also called ldquoestimation riskrdquo
The following tools will help assess the reasonableness of the NPV analysis
9-75
What-If Analysis
Scenario analysis Sensitivity analysis
Understand sources of value
Articulate what drives the investment to deliver a positive NPV
A positive NPV is creating value for the shareholders
We should understand what is the source of this value
9-76
Project Idea Potential Questions to Answer
New Product bull Is this new product better than the competitionbull Does this new product meet an unmet consumer need
Marketing Campaign
bull Is it reasonable that this marketing effort can increase sales as estimated
CompanyAcquisition
bull Are there sufficient synergies that can be realized to justify the purchase price
Cost Improvements
bull How realistic is it that the expected cost savings will truly materialize in the time frame noted (without unexpected negative impacts)
9-77
Scenario Analysis
The determination of what happens to NPV estimates when we ask what-if questions
Sensitivity Analysis
Investigation of what happens to NPV estimates when only one variable is changed
Scenario and Sensitivity Analysis
9-78
Examines several possible situations Worst case Base case or most likely case Best case
Provides a range of possible outcomes
Copyright (c) 2017 McGraw-Hill Education All rights reserved No reproduction or distribution without the prior written consent of McGraw-Hill Education 9-79
Copyright (c) 2017 McGraw-Hill Education All rights reserved No reproduction or distribution without the prior written consent of McGraw-Hill Education
Base Lower UpperUnits 6000 5500 6500 Priceunit 8000$ 7500$ 8500$ Variable costunit 6000$ 5800$ 6200$ Fixed costyear 50000$ 45000$ 55000$
BASE BEST WORST
Initial investment 200000$ Depreciated to salvage value of 0 over 5 yearsDeprecyr 40000$
Project Life 5 yearsTax rate 34Required return 12
Note ldquoLowerrdquo ne WorstldquoUpperrdquo ne Best
9-80
Copyright (c) 2017 McGraw-Hill Education All rights reserved No reproduction or distribution without the prior written consent of McGraw-Hill Education
BASE WORST BESTUnits 6000 5500 6500 Priceunit 8000$ 7500$ 8500$ Variable costunit 6000$ 6200$ 5800$ Fixed Cost 50000$ 55000$ 45000$
Sales 480000$ 412500$ 552500$ Variable Cost 360000 341000 377000Fixed Cost 50000 55000 45000Depreciation 40000 40000 40000EBIT 30000 (23500) 90500Taxes 10200 (7990) 30770Net Income 19800 (15510) 59730 + Deprec 40000 40000 40000
TOTAL CF 59800 24490 99730
NPV 15566 (111719) 159504
IRR 151 -144 409
9-81
Considers only a few possible outcomes
Assumes perfectly correlated inputs All ldquobadrdquo values occur together and
all ldquogoodrdquo values occur together More likely to have some ldquobadrdquo values
and some ldquogoodrdquo values
9-82
Shows how changes in an input variable affect NPV or IRR
Each variable is fixed except one Change one variable to see the effect
on NPV or IRR Answers ldquowhat ifrdquo questions
Copyright (c) 2017 McGraw-Hill Education All rights reserved No reproduction or distribution without the prior written consent of McGraw-Hill Education 9-83
Unit Sales Sensitivity
$(8226)
$15566
$39357
-2000000
-1000000
000
1000000
2000000
3000000
4000000
5000000
5500 6000 6500
Unit Sales
NPV
Copyright (c) 2017 McGraw-Hill Education All rights reserved No reproduction or distribution without the prior written consent of McGraw-Hill Education 9-84
Copyright (c) 2017 McGraw-Hill Education All rights reserved No reproduction or distribution without the prior written consent of McGraw-Hill Education
Base Fixed Cost Fixed CostUnits 6000 6000 6000 Priceunit 80$ 80 80Variable costunit 60$ 60 60Fixed costyear 50000$ 55000 45000
Initial investment 200000$ Depreciated to salvage value of 0 over 5 yearsDeprecyr 40000$
Tax rate 34Required Return 12
BASE FC FCUnits 6000 6000 6000 Priceunit 80$ 80$ 80$ Variable costunit 60$ 60$ 60$ Fixed cost 50000$ 55000$ 45000$
Sales 480000$ 480000$ 480000$ Variable Cost 360000 360000 360000 Fixed Cost 50000 55000 45000 Depreciation 40000 40000 40000 EBIT 30000 25000 35000 Taxes 10200 8500 11900 Net Income 19800 16500 23100 + Deprec 40000 40000 40000
TOTAL CF 59800 56500 63100
NPV 15566$ 3670$ 27461$
Fixed Cost Sensitivity
$27461
$15566
$3670
000
500000
1000000
1500000
2000000
2500000
3000000
$45000 $50000 $55000Fixed Cost
NPV
9-85
Strengths Identifies dangerous variables Gives some breakeven information
Weaknesses Says nothing about the likelihood of
change in a variable Ignores relationships among
variables
9-86
Neither provides a decision rule No indication whether a projectrsquos
expected return is sufficient to compensate for its risk
Ignores diversification Measures only stand-alone risk which
may not be the most relevant risk in capital budgeting
Copyright (c) 2017 McGraw-Hill Education All rights reserved No reproduction or distribution without the prior written consent of McGraw-Hill Education 9-87
Scenario analysis is best described as the determination of the
A Most likely outcome for a projectB Reasonable range of project outcomesC Variable that has the greatest effect on a projectrsquos
outcomeD Effect that a projectrsquos initial cost has on the projectrsquos net
present valueE Change in a projectrsquos net present value given a stated
change in projected sales
9-88
| Pro Forma Income Statements | |||||||||
| Year | 0 | 1 | 2 | 3 | |||||
| Sales | 200000 | 200000 | 200000 | ||||||
| Variable Costs | 125000 | 125000 | 125000 | ||||||
| Gross Profit | 75000 | 75000 | 75000 | ||||||
| Fixed Costs | 12000 | 12000 | 12000 | ||||||
| Depreciation | 30000 | 30000 | 30000 | ||||||
| EBIT | 33000 | 33000 | 33000 | ||||||
| Taxes | 11220 | 11220 | 11220 | ||||||
| Net Income | 21780 | 21780 | 21780 | ||||||
| Cash Flows | |||||||||
| Operating Cash Flow | 51780 | 51780 | 51780 | ||||||
| Changes in NWC | (20000) | 20000 | |||||||
| Net Capital Spending | (90000) | ||||||||
| Cash Flow From Assets | (110000) | 51780 | 51780 | 71780 | |||||
| Net Present Value | $1064769 | ||||||||
| IRR | 2576 |
| -30 | -20 | -10 | 0 | 10 | 20 | 30 | |||||||||
| UNITS | -70083865667486 | -415340381449136 | -129842106223412 | 155656169002312 | 441154444228038 | 726652719453761 | 101215099467949 | ||||||||
| FC | 512529013034468 | 393571398357083 | 274613783679698 | 155656169002312 | 36698554324927 | -82259060352458 | -201216675029843 |
| Sensitivity Analysis | |||||||||||||||||||||||||||||||||||||||
| -30 | -20 | -10 | 0 | 10 | 20 | 30 | -30 | -20 | -10 | 0 | 10 | 20 | 30 | ||||||||||||||||||||||||||
| Base | Units | Units | Units | Units | Units | Units | Units | Base | Fixed Cost | Fixed Cost | Fixed Cost | Fixed Cost | Fixed Cost | Fixed Cost | Fixed Cost | ||||||||||||||||||||||||
| Units | 6000 | 4200 | 4800 | 5400 | 6000 | 6600 | 7200 | 7800 | Units | 6000 | 6000 | 6000 | 6000 | 6000 | 6000 | 6000 | 6000 | ||||||||||||||||||||||
| Priceunit | $ 80 | 80 | 80 | 80 | 80 | 80 | 80 | 80 | Priceunit | $ 80 | 80 | 80 | 80 | 80 | 80 | 80 | 80 | ||||||||||||||||||||||
| Variable costunit | $ 60 | 60 | 60 | 60 | 60 | 60 | 60 | 60 | Variable costunit | $ 60 | 60 | 60 | 60 | 60 | 60 | 60 | 60 | ||||||||||||||||||||||
| Fixed costyear | $ 50000 | 50000 | 50000 | 50000 | 50000 | 50000 | 50000 | 50000 | Fixed costyear | $ 50000 | 35000 | 40000 | 45000 | 50000 | 55000 | 60000 | 65000 | ||||||||||||||||||||||
| Initial investment | $ 200000 | Initial investment | $ 200000 | ||||||||||||||||||||||||||||||||||||
| Depreciated to salvage value of 0 over 5 years | Depreciated to salvage value of 0 over 5 years | ||||||||||||||||||||||||||||||||||||||
| Deprecyr | $ 40000 | Deprecyr | $ 40000 | ||||||||||||||||||||||||||||||||||||
| Tax rate | 34 | Tax rate | 34 | ||||||||||||||||||||||||||||||||||||
| Required Return | 12 | Required Return | 12 | ||||||||||||||||||||||||||||||||||||
| BASE | UNITS | UNITS | UNITS | UNITS | UNITS | UNITS | UNITS | BASE | FC | FC | FC | FC | FC | FC | FC | ||||||||||||||||||||||||
| Units | 6000 | 4200 | 4800 | 5400 | 6000 | 6600 | 7200 | 7800 | Units | 6000 | 6000 | 6000 | 6000 | 6000 | 6000 | 6000 | 6000 | ||||||||||||||||||||||
| Priceunit | $ 80 | $ 80 | $ 80 | $ 80 | $ 80 | $ 80 | $ 80 | $ 80 | Priceunit | $ 80 | $ 80 | $ 80 | $ 80 | $ 80 | $ 80 | $ 80 | $ 80 | ||||||||||||||||||||||
| Variable costunit | $ 60 | $ 60 | $ 60 | $ 60 | $ 60 | $ 60 | $ 60 | $ 60 | Variable costunit | $ 60 | $ 60 | $ 60 | $ 60 | $ 60 | $ 60 | $ 60 | $ 60 | ||||||||||||||||||||||
| Fixed cost | $ 50000 | $ 50000 | $ 50000 | $ 50000 | $ 50000 | $ 50000 | $ 50000 | $ 50000 | Fixed cost | $ 50000 | $ 35000 | $ 40000 | $ 45000 | $ 50000 | $ 55000 | $ 60000 | $ 65000 | ||||||||||||||||||||||
| Sales | $ 480000 | $ 336000 | $ 384000 | $ 432000 | $ 480000 | $ 528000 | $ 576000 | $ 624000 | Sales | $ 480000 | $ 480000 | $ 480000 | $ 480000 | $ 480000 | $ 480000 | $ 480000 | $ 480000 | ||||||||||||||||||||||
| Variable Cost | 360000 | 252000 | 288000 | 324000 | 360000 | 396000 | 432000 | 468000 | Variable Cost | 360000 | 360000 | 360000 | 360000 | 360000 | 360000 | 360000 | 360000 | ||||||||||||||||||||||
| Fixed Cost | 50000 | 50000 | 50000 | 50000 | 50000 | 50000 | 50000 | 50000 | Fixed Cost | 50000 | 35000 | 40000 | 45000 | 50000 | 55000 | 60000 | 65000 | ||||||||||||||||||||||
| Depreciation | 40000 | 40000 | 40000 | 40000 | 40000 | 40000 | 40000 | 40000 | Depreciation | 40000 | 40000 | 40000 | 40000 | 40000 | 40000 | 40000 | 40000 | ||||||||||||||||||||||
| EBIT | 30000 | (6000) | 6000 | 18000 | 30000 | 42000 | 54000 | 66000 | EBIT | 30000 | 45000 | 40000 | 35000 | 30000 | 25000 | 20000 | 15000 | ||||||||||||||||||||||
| Taxes | 10200 | (2040) | 2040 | 6120 | 10200 | 14280 | 18360 | 22440 | Taxes | 10200 | 15300 | 13600 | 11900 | 10200 | 8500 | 6800 | 5100 | ||||||||||||||||||||||
| Net Income | 19800 | (3960) | 3960 | 11880 | 19800 | 27720 | 35640 | 43560 | Net Income | 19800 | 29700 | 26400 | 23100 | 19800 | 16500 | 13200 | 9900 | ||||||||||||||||||||||
| + Deprec | 40000 | 40000 | 40000 | 40000 | 40000 | 40000 | 40000 | 40000 | + Deprec | 40000 | 40000 | 40000 | 40000 | 40000 | 40000 | 40000 | 40000 | ||||||||||||||||||||||
| TOTAL CF | 59800 | 36040 | 43960 | 51880 | 59800 | 67720 | 75640 | 83560 | TOTAL CF | 59800 | 69700 | 66400 | 63100 | 59800 | 56500 | 53200 | 49900 | ||||||||||||||||||||||
| NPV | $ 15566 | $ (70084) | $ (41534) | $ (12984) | $ 15566 | $ 44115 | $ 72665 | $ 101215 | NPV | $ 15566 | $ 51253 | $ 39357 | $ 27461 | $ 15566 | $ 3670 | $ (8226) | $ (20122) | ||||||||||||||||||||||
| Change in NPV | -5502 | -3668 | -1834 | 00 | 1834 | 3668 | 5502 | Change in NPV | 2293 | 1528 | 764 | 00 | -764 | -1528 | -2293 | ||||||||||||||||||||||||
| Change in Variable | -300 | -200 | -100 | 00 | 100 | 200 | 300 | Change in Variable | -300 | -200 | -100 | 00 | 100 | 200 | 300 | ||||||||||||||||||||||||
| SENSITIVITY RATIO | 1834 | 1834 | 1834 | 000 | 1834 | 1834 | 1834 | SENSITIVITY RATIO | -764 | -764 | -764 | 000 | -764 | -764 | -764 | ||||||||||||||||||||||||
| INVERSE | INVERSE | INVERSE | INVERSE | INVERSE | INVERSE | INVERSE | |||||||||||||||||||||||||||||||||
| Sensitivity Ratio = ( Change in NPV) Change in Variable | |||||||||||||||||||||||||||||||||||||||
| Positive = Direct relationship | Sensitivity Ratio = ( Change in NPV) Change in Variable | ||||||||||||||||||||||||||||||||||||||
| Negative = Inverse relationship | Positive = Direct relationship | ||||||||||||||||||||||||||||||||||||||
| Negative = Inverse relationship | |||||||||||||||||||||||||||||||||||||||
| $ (200000) | $ (200000) | $ (200000) | $ (200000) | $ (200000) | $ (200000) | $ (200000) | $ (200000) | ||||||||||||||||||||||||||||||||
| 59800 | 36040 | 43960 | 51880 | 59800 | 67720 | 75640 | 83560 | $ (200000) | $ (200000) | $ (200000) | $ (200000) | $ (200000) | $ (200000) | $ (200000) | $ (200000) | ||||||||||||||||||||||||
| 59800 | 36040 | 43960 | 51880 | 59800 | 67720 | 75640 | 83560 | 59800 | 69700 | 66400 | 63100 | 59800 | 56500 | 53200 | 49900 | ||||||||||||||||||||||||
| 59800 | 36040 | 43960 | 51880 | 59800 | 67720 | 75640 | 83560 | 59800 | 69700 | 66400 | 63100 | 59800 | 56500 | 53200 | 49900 | ||||||||||||||||||||||||
| 59800 | 36040 | 43960 | 51880 | 59800 | 67720 | 75640 | 83560 | 59800 | 69700 | 66400 | 63100 | 59800 | 56500 | 53200 | 49900 | ||||||||||||||||||||||||
| 59800 | 36040 | 43960 | 51880 | 59800 | 67720 | 75640 | 83560 | 59800 | 69700 | 66400 | 63100 | 59800 | 56500 | 53200 | 49900 | ||||||||||||||||||||||||
| 59800 | 69700 | 66400 | 63100 | 59800 | 56500 | 53200 | 49900 | ||||||||||||||||||||||||||||||||
| PV | $ 215566 | $ 129916 | $ 158466 | $ 187016 | $ 215566 | $ 244115 | $ 272665 | $ 301215 | |||||||||||||||||||||||||||||||
| NPV | $ 15566 | $ (70084) | $ (41534) | $ (12984) | $ 15566 | $ 44115 | $ 72665 | $ 101215 | PV | $ 215566 | $ 251253 | $ 239357 | $ 227461 | $ 215566 | $ 203670 | $ 191774 | $ 179878 | ||||||||||||||||||||||
| NPV | $ 15566 | $ 51253 | $ 39357 | $ 27461 | $ 15566 | $ 3670 | $ (8226) | $ (20122) |
| Sensitivity Analysis | |||||||||||||||||||||||
| Base | Units | Units | Fixed Cost | Fixed Cost | |||||||||||||||||||
| Units | 6000 | 5500 | 6500 | 6000 | 6000 | ||||||||||||||||||
| Priceunit | $ 80 | 80 | 80 | 80 | 80 | ||||||||||||||||||
| Variable costunit | $ 60 | 60 | 60 | 60 | 60 | UNITS | |||||||||||||||||
| Fixed costyear | $ 50000 | 50000 | 50000 | 55000 | 45000 | X | 5500 | 6000 | 6500 | ||||||||||||||
| Y | $ (8226) | $ 15566 | $ 39357 | ||||||||||||||||||||
| Initial investment | $ 200000 | ||||||||||||||||||||||
| Depreciated to salvage value of 0 over 5 years | |||||||||||||||||||||||
| Deprecyr | $ 40000 | ||||||||||||||||||||||
| Tax rate | 34 | ||||||||||||||||||||||
| Required Return | 12 | ||||||||||||||||||||||
| BASE | UNITS | UNITS | FC | FC | |||||||||||||||||||
| Units | 6000 | 5500 | 6500 | 6000 | 6000 | ||||||||||||||||||
| Priceunit | $ 80 | $ 80 | $ 80 | $ 80 | $ 80 | ||||||||||||||||||
| Variable costunit | $ 60 | $ 60 | $ 60 | $ 60 | $ 60 | ||||||||||||||||||
| Fixed cost | $ 50000 | $ 50000 | $ 50000 | $ 55000 | $ 45000 | ||||||||||||||||||
| Sales | $ 480000 | $ 440000 | $ 520000 | $ 480000 | $ 480000 | ||||||||||||||||||
| Variable Cost | 360000 | 330000 | 390000 | 360000 | 360000 | ||||||||||||||||||
| Fixed Cost | 50000 | 50000 | 50000 | 55000 | 45000 | ||||||||||||||||||
| Depreciation | 40000 | 40000 | 40000 | 40000 | 40000 | ||||||||||||||||||
| EBIT | 30000 | 20000 | 40000 | 25000 | 35000 | ||||||||||||||||||
| Taxes | 10200 | 6800 | 13600 | 8500 | 11900 | ||||||||||||||||||
| Net Income | 19800 | 13200 | 26400 | 16500 | 23100 | ||||||||||||||||||
| + Deprec | 40000 | 40000 | 40000 | 40000 | 40000 | ||||||||||||||||||
| TOTAL CF | 59800 | 53200 | 66400 | 56500 | 63100 | ||||||||||||||||||
| NPV | $ 15566 | $ (8226) | $ 39357 | $ 3670 | $ 27461 | ||||||||||||||||||
| FC | |||||||||||||||||||||||
| $ (200000) | $ (200000) | $ (200000) | $ (200000) | $ (200000) | X | $ 45000 | $ 50000 | $ 55000 | |||||||||||||||
| 59800 | 53200 | 66400 | 56500 | 63100 | Y | $ 27461 | $ 15566 | $ 3670 | |||||||||||||||
| 59800 | 53200 | 66400 | 56500 | 63100 | |||||||||||||||||||
| 59800 | 53200 | 66400 | 56500 | 63100 | |||||||||||||||||||
| 59800 | 53200 | 66400 | 56500 | 63100 | |||||||||||||||||||
| 59800 | 53200 | 66400 | 56500 | 63100 | |||||||||||||||||||
| PV | $ 215566 | $ 191774 | $ 239357 | $ 203670 | $ 227461 | ||||||||||||||||||
| NPV | $ 15566 | $ (8226) | $ 39357 | $ 3670 | $ 27461 |
| Scenario Analysis | |||||||||
| Base | Lower | Upper | |||||||
| Units | 6000 | 5500 | 6500 | ||||||
| Priceunit | $ 8000 | $ 7500 | $ 8500 | ||||||
| Variable costunit | $ 6000 | $ 5800 | $ 6200 | ||||||
| Fixed costyear | $ 50000 | $ 45000 | $ 55000 | ||||||
| BASE | BEST | WORST | |||||||
| Initial investment | $ 200000 | ||||||||
| Depreciated to salvage value of 0 over 5 years | |||||||||
| Deprecyr | $ 40000 | ||||||||
| Project Life | 5 | years | |||||||
| Tax rate | 34 | ||||||||
| Required return | 12 | ||||||||
| BASE | WORST | BEST | |||||||
| Units | 6000 | 5500 | 6500 | ||||||
| Priceunit | $ 8000 | $ 7500 | $ 8500 | ||||||
| Variable costunit | $ 6000 | $ 6200 | $ 5800 | ||||||
| Fixed Cost | $ 50000 | $ 55000 | $ 45000 | ||||||
| Sales | $ 480000 | $ 412500 | $ 552500 | ||||||
| Variable Cost | 360000 | 341000 | 377000 | ||||||
| Fixed Cost | 50000 | 55000 | 45000 | ||||||
| Depreciation | 40000 | 40000 | 40000 | ||||||
| EBIT | 30000 | (23500) | 90500 | ||||||
| Taxes | 10200 | (7990) | 30770 | ||||||
| Net Income | 19800 | (15510) | 59730 | ||||||
| + Deprec | 40000 | 40000 | 40000 | ||||||
| TOTAL CF | 59800 | 24490 | 99730 | ||||||
| NPV | 15566 | (111719) | 159504 | ||||||
| IRR | 151 | -144 | 409 | ||||||
| NOTE | Note in WORST CASE tax credit for negative earnings | ||||||||
| $ (200000) | $ (200000) | $ (200000) | |||||||
| 59800 | 24490 | 99730 | |||||||
| 59800 | 24490 | 99730 | |||||||
| 59800 | 24490 | 99730 | |||||||
| 59800 | 24490 | 99730 | |||||||
| 59800 | 24490 | 99730 | |||||||
| PV | $215566 | $88281 | $359504 | ||||||
| NPV | 15566 | (111719) | 159504 |
| Majestic Mulch and Compost Company (MMCC) | |||||||||||||||||||||
| YEAR | 0 | 1 | 2 | 3 | 4 | 5 | 6 | 7 | 8 | ||||||||||||
| Background Data | |||||||||||||||||||||
| Unit Sales Estimates | 3000 | 5000 | 6000 | 6500 | 6000 | 5000 | 4000 | 3000 | |||||||||||||
| Variable Cost unit | $ 6000 | ||||||||||||||||||||
| Fixed Costs per year | $ 2500000 | ||||||||||||||||||||
| Sale Price per unit | $ 12000 | $ 12000 | $ 12000 | $ 12000 | $ 11000 | $ 11000 | $ 11000 | $ 11000 | $ 11000 | ||||||||||||
| Tax Rate | 340 | ||||||||||||||||||||
| Required Return on Project | 150 | ||||||||||||||||||||
| Yr 0 NWC | $ 2000000 | ||||||||||||||||||||
| NWC of sales | 15 | ||||||||||||||||||||
| Equipment cost - installed | $ 800000 | ||||||||||||||||||||
| Salvage Value in year 8 | 20 | of equipment cost | |||||||||||||||||||
| Depreciation Calculations | |||||||||||||||||||||
| Equipment Depreciable Base | 800000 | ||||||||||||||||||||
| MACRS (Eqpt-7 yr) | 1429 | 2449 | 1749 | 1249 | 892 | 893 | 893 | 446 | |||||||||||||
| Recovery Allowance | 114320 | 195920 | 139920 | 99920 | 71360 | 71440 | 71440 | 35680 | |||||||||||||
| Book Value | 685680 | 489760 | 349840 | 249920 | 178560 | 107120 | 35680 | 0 | |||||||||||||
| After-Tax Salvage Value | |||||||||||||||||||||
| Salvage Value | 20 | 160000 | |||||||||||||||||||
| Book Value (Year 8) | 0 | ||||||||||||||||||||
| Capital GainLoss | 160000 | ||||||||||||||||||||
| Taxes | 54400 | ||||||||||||||||||||
| Net SV (SV-Taxes) | 105600 | ||||||||||||||||||||
| Required Net Working Capital Investment | |||||||||||||||||||||
| 20000 | 54000 | 90000 | 108000 | 107250 | 99000 | 82500 | 66000 | 49500 | |||||||||||||
| YEAR | 0 | 1 | 2 | 3 | 4 | 5 | 6 | 7 | 8 | ||||||||||||
| Initial Investment | |||||||||||||||||||||
| Equipment Cost | (800000) | ||||||||||||||||||||
| Sales | 360000 | 600000 | 720000 | 715000 | 660000 | 550000 | 440000 | 330000 | |||||||||||||
| Variable Costs | 180000 | 300000 | 360000 | 390000 | 360000 | 300000 | 240000 | 180000 | |||||||||||||
| Fixed Costs | 25000 | 25000 | 25000 | 25000 | 25000 | 25000 | 25000 | 25000 | |||||||||||||
| Depreciation (Eqpt)) | 114320 | 195920 | 139920 | 99920 | 71360 | 71440 | 71440 | 35680 | |||||||||||||
| EBT | 40680 | 79080 | 195080 | 200080 | 203640 | 153560 | 103560 | 89320 | |||||||||||||
| Taxes | 13831 | 26887 | 66327 | 68027 | 69238 | 52210 | 35210 | 30369 | |||||||||||||
| Net Operating Income | 26849 | 52193 | 128753 | 132053 | 134402 | 101350 | 68350 | 58951 | |||||||||||||
| Add back Depreciation | 114320 | 195920 | 139920 | 99920 | 71360 | 71440 | 71440 | 35680 | |||||||||||||
| CASH FLOW from Operations | 141169 | 248113 | 268673 | 231973 | 205762 | 172790 | 139790 | 94631 | |||||||||||||
| NWC investment amp Recovery | (20000) | (34000) | (36000) | (18000) | 750 | 8250 | 16500 | 16500 | 66000 | ||||||||||||
| Salvage Value | 105600 | ||||||||||||||||||||
| TOTAL PROJECTED CF | (820000) | 107169 | 212113 | 250673 | 232723 | 214012 | 189290 | 156290 | 266231 | ||||||||||||
| Discounted Cash Flows | (820000) | 93190 | 160388 | 164821 | 133060 | 106402 | 81835 | 58755 | 87031 | ||||||||||||
| Cumulative Cash flows | (820000) | (712831) | (500718) | (250046) | (17323) | 196690 | 385979 | 542269 | 808500 | ||||||||||||
| NPV | $65483 | ||||||||||||||||||||
| IRR | 1724 | ||||||||||||||||||||
| Payback | 408 |
| Depreciation | 5-year Asset | ||||||||
| Year | Beg BV | Depr | Deprec | End BV | |||||
| 1 | $ 1200000 | 2000 | $ 240000 | $ 960000 | |||||
| 2 | $ 960000 | 3200 | $ 384000 | $ 576000 | |||||
| 3 | $ 576000 | 1920 | $ 230400 | $ 345600 | |||||
| 4 | $ 345600 | 1152 | $ 138240 | $ 207360 | |||||
| 5 | $ 207360 | 1152 | $ 138240 | $ 69120 | |||||
| 6 | $ 69120 | 576 | $ 69120 | $ - 0 | |||||
| 10000 | $ 1200000 | ||||||||
| EOY 5 | $3000 | $221501 | $78499 | ||||||
| EOY 2 | $4000 | $459840 | ($59840) |
| Pro Forma Income Statement | |||||||||
| Year | 0 | 1 | 2 | 3 | |||||
| Sales | 200000 | 200000 | 200000 | ||||||
| Variable Costs | 125000 | 125000 | 125000 | ||||||
| Gross Profit | 75000 | 75000 | 75000 | ||||||
| Fixed Costs | 12000 | 12000 | 12000 | ||||||
| Depreciation | 30000 | 30000 | 30000 | ||||||
| EBIT | 33000 | 33000 | 33000 | ||||||
| Taxes | 11220 | 11220 | 11220 | ||||||
| Net Income | 21780 | 21780 | 21780 | ||||||
| Cash Flows | |||||||||
| Operating Cash Flow | 51780 | 51780 | 51780 | ||||||
| Changes in NWC | -20000 | 20000 | |||||||
| Net Capital Spending | -90000 | ||||||||
| Cash Flow From Assets | -110000 | 51780 | 51780 | 71780 | |||||
| Net Present Value | $1064769 | ||||||||
| IRR | 2576 |
| 45000 | |
| 50000 | |
| 55000 |
| Pro Forma Income Statements | |||||||||
| Year | 0 | 1 | 2 | 3 | |||||
| Sales | 200000 | 200000 | 200000 | ||||||
| Variable Costs | 125000 | 125000 | 125000 | ||||||
| Gross Profit | 75000 | 75000 | 75000 | ||||||
| Fixed Costs | 12000 | 12000 | 12000 | ||||||
| Depreciation | 30000 | 30000 | 30000 | ||||||
| EBIT | 33000 | 33000 | 33000 | ||||||
| Taxes | 11220 | 11220 | 11220 | ||||||
| Net Income | 21780 | 21780 | 21780 | ||||||
| Cash Flows | |||||||||
| Operating Cash Flow | 51780 | 51780 | 51780 | ||||||
| Changes in NWC | (20000) | 20000 | |||||||
| Net Capital Spending | (90000) | ||||||||
| Cash Flow From Assets | (110000) | 51780 | 51780 | 71780 | |||||
| Net Present Value | $1064769 | ||||||||
| IRR | 2576 |
| -30 | -20 | -10 | 0 | 10 | 20 | 30 | |||||||||
| UNITS | -70083865667486 | -415340381449136 | -129842106223412 | 155656169002312 | 441154444228038 | 726652719453761 | 101215099467949 | ||||||||
| FC | 512529013034468 | 393571398357083 | 274613783679698 | 155656169002312 | 36698554324927 | -82259060352458 | -201216675029843 |
| Sensitivity Analysis | |||||||||||||||||||||||||||||||||||||||
| -30 | -20 | -10 | 0 | 10 | 20 | 30 | -30 | -20 | -10 | 0 | 10 | 20 | 30 | ||||||||||||||||||||||||||
| Base | Units | Units | Units | Units | Units | Units | Units | Base | Fixed Cost | Fixed Cost | Fixed Cost | Fixed Cost | Fixed Cost | Fixed Cost | Fixed Cost | ||||||||||||||||||||||||
| Units | 6000 | 4200 | 4800 | 5400 | 6000 | 6600 | 7200 | 7800 | Units | 6000 | 6000 | 6000 | 6000 | 6000 | 6000 | 6000 | 6000 | ||||||||||||||||||||||
| Priceunit | $ 80 | 80 | 80 | 80 | 80 | 80 | 80 | 80 | Priceunit | $ 80 | 80 | 80 | 80 | 80 | 80 | 80 | 80 | ||||||||||||||||||||||
| Variable costunit | $ 60 | 60 | 60 | 60 | 60 | 60 | 60 | 60 | Variable costunit | $ 60 | 60 | 60 | 60 | 60 | 60 | 60 | 60 | ||||||||||||||||||||||
| Fixed costyear | $ 50000 | 50000 | 50000 | 50000 | 50000 | 50000 | 50000 | 50000 | Fixed costyear | $ 50000 | 35000 | 40000 | 45000 | 50000 | 55000 | 60000 | 65000 | ||||||||||||||||||||||
| Initial investment | $ 200000 | Initial investment | $ 200000 | ||||||||||||||||||||||||||||||||||||
| Depreciated to salvage value of 0 over 5 years | Depreciated to salvage value of 0 over 5 years | ||||||||||||||||||||||||||||||||||||||
| Deprecyr | $ 40000 | Deprecyr | $ 40000 | ||||||||||||||||||||||||||||||||||||
| Tax rate | 34 | Tax rate | 34 | ||||||||||||||||||||||||||||||||||||
| Required Return | 12 | Required Return | 12 | ||||||||||||||||||||||||||||||||||||
| BASE | UNITS | UNITS | UNITS | UNITS | UNITS | UNITS | UNITS | BASE | FC | FC | FC | FC | FC | FC | FC | ||||||||||||||||||||||||
| Units | 6000 | 4200 | 4800 | 5400 | 6000 | 6600 | 7200 | 7800 | Units | 6000 | 6000 | 6000 | 6000 | 6000 | 6000 | 6000 | 6000 | ||||||||||||||||||||||
| Priceunit | $ 80 | $ 80 | $ 80 | $ 80 | $ 80 | $ 80 | $ 80 | $ 80 | Priceunit | $ 80 | $ 80 | $ 80 | $ 80 | $ 80 | $ 80 | $ 80 | $ 80 | ||||||||||||||||||||||
| Variable costunit | $ 60 | $ 60 | $ 60 | $ 60 | $ 60 | $ 60 | $ 60 | $ 60 | Variable costunit | $ 60 | $ 60 | $ 60 | $ 60 | $ 60 | $ 60 | $ 60 | $ 60 | ||||||||||||||||||||||
| Fixed cost | $ 50000 | $ 50000 | $ 50000 | $ 50000 | $ 50000 | $ 50000 | $ 50000 | $ 50000 | Fixed cost | $ 50000 | $ 35000 | $ 40000 | $ 45000 | $ 50000 | $ 55000 | $ 60000 | $ 65000 | ||||||||||||||||||||||
| Sales | $ 480000 | $ 336000 | $ 384000 | $ 432000 | $ 480000 | $ 528000 | $ 576000 | $ 624000 | Sales | $ 480000 | $ 480000 | $ 480000 | $ 480000 | $ 480000 | $ 480000 | $ 480000 | $ 480000 | ||||||||||||||||||||||
| Variable Cost | 360000 | 252000 | 288000 | 324000 | 360000 | 396000 | 432000 | 468000 | Variable Cost | 360000 | 360000 | 360000 | 360000 | 360000 | 360000 | 360000 | 360000 | ||||||||||||||||||||||
| Fixed Cost | 50000 | 50000 | 50000 | 50000 | 50000 | 50000 | 50000 | 50000 | Fixed Cost | 50000 | 35000 | 40000 | 45000 | 50000 | 55000 | 60000 | 65000 | ||||||||||||||||||||||
| Depreciation | 40000 | 40000 | 40000 | 40000 | 40000 | 40000 | 40000 | 40000 | Depreciation | 40000 | 40000 | 40000 | 40000 | 40000 | 40000 | 40000 | 40000 | ||||||||||||||||||||||
| EBIT | 30000 | (6000) | 6000 | 18000 | 30000 | 42000 | 54000 | 66000 | EBIT | 30000 | 45000 | 40000 | 35000 | 30000 | 25000 | 20000 | 15000 | ||||||||||||||||||||||
| Taxes | 10200 | (2040) | 2040 | 6120 | 10200 | 14280 | 18360 | 22440 | Taxes | 10200 | 15300 | 13600 | 11900 | 10200 | 8500 | 6800 | 5100 | ||||||||||||||||||||||
| Net Income | 19800 | (3960) | 3960 | 11880 | 19800 | 27720 | 35640 | 43560 | Net Income | 19800 | 29700 | 26400 | 23100 | 19800 | 16500 | 13200 | 9900 | ||||||||||||||||||||||
| + Deprec | 40000 | 40000 | 40000 | 40000 | 40000 | 40000 | 40000 | 40000 | + Deprec | 40000 | 40000 | 40000 | 40000 | 40000 | 40000 | 40000 | 40000 | ||||||||||||||||||||||
| TOTAL CF | 59800 | 36040 | 43960 | 51880 | 59800 | 67720 | 75640 | 83560 | TOTAL CF | 59800 | 69700 | 66400 | 63100 | 59800 | 56500 | 53200 | 49900 | ||||||||||||||||||||||
| NPV | $ 15566 | $ (70084) | $ (41534) | $ (12984) | $ 15566 | $ 44115 | $ 72665 | $ 101215 | NPV | $ 15566 | $ 51253 | $ 39357 | $ 27461 | $ 15566 | $ 3670 | $ (8226) | $ (20122) | ||||||||||||||||||||||
| Change in NPV | -5502 | -3668 | -1834 | 00 | 1834 | 3668 | 5502 | Change in NPV | 2293 | 1528 | 764 | 00 | -764 | -1528 | -2293 | ||||||||||||||||||||||||
| Change in Variable | -300 | -200 | -100 | 00 | 100 | 200 | 300 | Change in Variable | -300 | -200 | -100 | 00 | 100 | 200 | 300 | ||||||||||||||||||||||||
| SENSITIVITY RATIO | 1834 | 1834 | 1834 | 000 | 1834 | 1834 | 1834 | SENSITIVITY RATIO | -764 | -764 | -764 | 000 | -764 | -764 | -764 | ||||||||||||||||||||||||
| INVERSE | INVERSE | INVERSE | INVERSE | INVERSE | INVERSE | INVERSE | |||||||||||||||||||||||||||||||||
| Sensitivity Ratio = ( Change in NPV) Change in Variable | |||||||||||||||||||||||||||||||||||||||
| Positive = Direct relationship | Sensitivity Ratio = ( Change in NPV) Change in Variable | ||||||||||||||||||||||||||||||||||||||
| Negative = Inverse relationship | Positive = Direct relationship | ||||||||||||||||||||||||||||||||||||||
| Negative = Inverse relationship | |||||||||||||||||||||||||||||||||||||||
| $ (200000) | $ (200000) | $ (200000) | $ (200000) | $ (200000) | $ (200000) | $ (200000) | $ (200000) | ||||||||||||||||||||||||||||||||
| 59800 | 36040 | 43960 | 51880 | 59800 | 67720 | 75640 | 83560 | $ (200000) | $ (200000) | $ (200000) | $ (200000) | $ (200000) | $ (200000) | $ (200000) | $ (200000) | ||||||||||||||||||||||||
| 59800 | 36040 | 43960 | 51880 | 59800 | 67720 | 75640 | 83560 | 59800 | 69700 | 66400 | 63100 | 59800 | 56500 | 53200 | 49900 | ||||||||||||||||||||||||
| 59800 | 36040 | 43960 | 51880 | 59800 | 67720 | 75640 | 83560 | 59800 | 69700 | 66400 | 63100 | 59800 | 56500 | 53200 | 49900 | ||||||||||||||||||||||||
| 59800 | 36040 | 43960 | 51880 | 59800 | 67720 | 75640 | 83560 | 59800 | 69700 | 66400 | 63100 | 59800 | 56500 | 53200 | 49900 | ||||||||||||||||||||||||
| 59800 | 36040 | 43960 | 51880 | 59800 | 67720 | 75640 | 83560 | 59800 | 69700 | 66400 | 63100 | 59800 | 56500 | 53200 | 49900 | ||||||||||||||||||||||||
| 59800 | 69700 | 66400 | 63100 | 59800 | 56500 | 53200 | 49900 | ||||||||||||||||||||||||||||||||
| PV | $ 215566 | $ 129916 | $ 158466 | $ 187016 | $ 215566 | $ 244115 | $ 272665 | $ 301215 | |||||||||||||||||||||||||||||||
| NPV | $ 15566 | $ (70084) | $ (41534) | $ (12984) | $ 15566 | $ 44115 | $ 72665 | $ 101215 | PV | $ 215566 | $ 251253 | $ 239357 | $ 227461 | $ 215566 | $ 203670 | $ 191774 | $ 179878 | ||||||||||||||||||||||
| NPV | $ 15566 | $ 51253 | $ 39357 | $ 27461 | $ 15566 | $ 3670 | $ (8226) | $ (20122) |
| Sensitivity Analysis | |||||||||||||||||||||||
| Base | Units | Units | Fixed Cost | Fixed Cost | |||||||||||||||||||
| Units | 6000 | 5500 | 6500 | 6000 | 6000 | ||||||||||||||||||
| Priceunit | $ 80 | 80 | 80 | 80 | 80 | ||||||||||||||||||
| Variable costunit | $ 60 | 60 | 60 | 60 | 60 | UNITS | |||||||||||||||||
| Fixed costyear | $ 50000 | 50000 | 50000 | 55000 | 45000 | X | 5500 | 6000 | 6500 | ||||||||||||||
| Y | $ (8226) | $ 15566 | $ 39357 | ||||||||||||||||||||
| Initial investment | $ 200000 | ||||||||||||||||||||||
| Depreciated to salvage value of 0 over 5 years | |||||||||||||||||||||||
| Deprecyr | $ 40000 | ||||||||||||||||||||||
| Tax rate | 34 | ||||||||||||||||||||||
| Required Return | 12 | ||||||||||||||||||||||
| BASE | UNITS | UNITS | FC | FC | |||||||||||||||||||
| Units | 6000 | 5500 | 6500 | 6000 | 6000 | ||||||||||||||||||
| Priceunit | $ 80 | $ 80 | $ 80 | $ 80 | $ 80 | ||||||||||||||||||
| Variable costunit | $ 60 | $ 60 | $ 60 | $ 60 | $ 60 | ||||||||||||||||||
| Fixed cost | $ 50000 | $ 50000 | $ 50000 | $ 55000 | $ 45000 | ||||||||||||||||||
| Sales | $ 480000 | $ 440000 | $ 520000 | $ 480000 | $ 480000 | ||||||||||||||||||
| Variable Cost | 360000 | 330000 | 390000 | 360000 | 360000 | ||||||||||||||||||
| Fixed Cost | 50000 | 50000 | 50000 | 55000 | 45000 | ||||||||||||||||||
| Depreciation | 40000 | 40000 | 40000 | 40000 | 40000 | ||||||||||||||||||
| EBIT | 30000 | 20000 | 40000 | 25000 | 35000 | ||||||||||||||||||
| Taxes | 10200 | 6800 | 13600 | 8500 | 11900 | ||||||||||||||||||
| Net Income | 19800 | 13200 | 26400 | 16500 | 23100 | ||||||||||||||||||
| + Deprec | 40000 | 40000 | 40000 | 40000 | 40000 | ||||||||||||||||||
| TOTAL CF | 59800 | 53200 | 66400 | 56500 | 63100 | ||||||||||||||||||
| NPV | $ 15566 | $ (8226) | $ 39357 | $ 3670 | $ 27461 | ||||||||||||||||||
| FC | |||||||||||||||||||||||
| $ (200000) | $ (200000) | $ (200000) | $ (200000) | $ (200000) | X | $ 45000 | $ 50000 | $ 55000 | |||||||||||||||
| 59800 | 53200 | 66400 | 56500 | 63100 | Y | $ 27461 | $ 15566 | $ 3670 | |||||||||||||||
| 59800 | 53200 | 66400 | 56500 | 63100 | |||||||||||||||||||
| 59800 | 53200 | 66400 | 56500 | 63100 | |||||||||||||||||||
| 59800 | 53200 | 66400 | 56500 | 63100 | |||||||||||||||||||
| 59800 | 53200 | 66400 | 56500 | 63100 | |||||||||||||||||||
| PV | $ 215566 | $ 191774 | $ 239357 | $ 203670 | $ 227461 | ||||||||||||||||||
| NPV | $ 15566 | $ (8226) | $ 39357 | $ 3670 | $ 27461 |
| Scenario Analysis | |||||||||
| Base | Lower | Upper | |||||||
| Units | 6000 | 5500 | 6500 | ||||||
| Priceunit | $ 8000 | $ 7500 | $ 8500 | ||||||
| Variable costunit | $ 6000 | $ 5800 | $ 6200 | ||||||
| Fixed costyear | $ 50000 | $ 45000 | $ 55000 | ||||||
| BASE | BEST | WORST | |||||||
| Initial investment | $ 200000 | ||||||||
| Depreciated to salvage value of 0 over 5 years | |||||||||
| Deprecyr | $ 40000 | ||||||||
| Project Life | 5 | years | |||||||
| Tax rate | 34 | ||||||||
| Required return | 12 | ||||||||
| BASE | WORST | BEST | |||||||
| Units | 6000 | 5500 | 6500 | ||||||
| Priceunit | $ 8000 | $ 7500 | $ 8500 | ||||||
| Variable costunit | $ 6000 | $ 6200 | $ 5800 | ||||||
| Fixed Cost | $ 50000 | $ 55000 | $ 45000 | ||||||
| Sales | $ 480000 | $ 412500 | $ 552500 | ||||||
| Variable Cost | 360000 | 341000 | 377000 | ||||||
| Fixed Cost | 50000 | 55000 | 45000 | ||||||
| Depreciation | 40000 | 40000 | 40000 | ||||||
| EBIT | 30000 | (23500) | 90500 | ||||||
| Taxes | 10200 | (7990) | 30770 | ||||||
| Net Income | 19800 | (15510) | 59730 | ||||||
| + Deprec | 40000 | 40000 | 40000 | ||||||
| TOTAL CF | 59800 | 24490 | 99730 | ||||||
| NPV | 15566 | (111719) | 159504 | ||||||
| IRR | 151 | -144 | 409 | ||||||
| NOTE | Note in WORST CASE tax credit for negative earnings | ||||||||
| $ (200000) | $ (200000) | $ (200000) | |||||||
| 59800 | 24490 | 99730 | |||||||
| 59800 | 24490 | 99730 | |||||||
| 59800 | 24490 | 99730 | |||||||
| 59800 | 24490 | 99730 | |||||||
| 59800 | 24490 | 99730 | |||||||
| PV | $215566 | $88281 | $359504 | ||||||
| NPV | 15566 | (111719) | 159504 |
| Majestic Mulch and Compost Company (MMCC) | |||||||||||||||||||||
| YEAR | 0 | 1 | 2 | 3 | 4 | 5 | 6 | 7 | 8 | ||||||||||||
| Background Data | |||||||||||||||||||||
| Unit Sales Estimates | 3000 | 5000 | 6000 | 6500 | 6000 | 5000 | 4000 | 3000 | |||||||||||||
| Variable Cost unit | $ 6000 | ||||||||||||||||||||
| Fixed Costs per year | $ 2500000 | ||||||||||||||||||||
| Sale Price per unit | $ 12000 | $ 12000 | $ 12000 | $ 12000 | $ 11000 | $ 11000 | $ 11000 | $ 11000 | $ 11000 | ||||||||||||
| Tax Rate | 340 | ||||||||||||||||||||
| Required Return on Project | 150 | ||||||||||||||||||||
| Yr 0 NWC | $ 2000000 | ||||||||||||||||||||
| NWC of sales | 15 | ||||||||||||||||||||
| Equipment cost - installed | $ 800000 | ||||||||||||||||||||
| Salvage Value in year 8 | 20 | of equipment cost | |||||||||||||||||||
| Depreciation Calculations | |||||||||||||||||||||
| Equipment Depreciable Base | 800000 | ||||||||||||||||||||
| MACRS (Eqpt-7 yr) | 1429 | 2449 | 1749 | 1249 | 892 | 893 | 893 | 446 | |||||||||||||
| Recovery Allowance | 114320 | 195920 | 139920 | 99920 | 71360 | 71440 | 71440 | 35680 | |||||||||||||
| Book Value | 685680 | 489760 | 349840 | 249920 | 178560 | 107120 | 35680 | 0 | |||||||||||||
| After-Tax Salvage Value | |||||||||||||||||||||
| Salvage Value | 20 | 160000 | |||||||||||||||||||
| Book Value (Year 8) | 0 | ||||||||||||||||||||
| Capital GainLoss | 160000 | ||||||||||||||||||||
| Taxes | 54400 | ||||||||||||||||||||
| Net SV (SV-Taxes) | 105600 | ||||||||||||||||||||
| Required Net Working Capital Investment | |||||||||||||||||||||
| 20000 | 54000 | 90000 | 108000 | 107250 | 99000 | 82500 | 66000 | 49500 | |||||||||||||
| YEAR | 0 | 1 | 2 | 3 | 4 | 5 | 6 | 7 | 8 | ||||||||||||
| Initial Investment | |||||||||||||||||||||
| Equipment Cost | (800000) | ||||||||||||||||||||
| Sales | 360000 | 600000 | 720000 | 715000 | 660000 | 550000 | 440000 | 330000 | |||||||||||||
| Variable Costs | 180000 | 300000 | 360000 | 390000 | 360000 | 300000 | 240000 | 180000 | |||||||||||||
| Fixed Costs | 25000 | 25000 | 25000 | 25000 | 25000 | 25000 | 25000 | 25000 | |||||||||||||
| Depreciation (Eqpt)) | 114320 | 195920 | 139920 | 99920 | 71360 | 71440 | 71440 | 35680 | |||||||||||||
| EBT | 40680 | 79080 | 195080 | 200080 | 203640 | 153560 | 103560 | 89320 | |||||||||||||
| Taxes | 13831 | 26887 | 66327 | 68027 | 69238 | 52210 | 35210 | 30369 | |||||||||||||
| Net Operating Income | 26849 | 52193 | 128753 | 132053 | 134402 | 101350 | 68350 | 58951 | |||||||||||||
| Add back Depreciation | 114320 | 195920 | 139920 | 99920 | 71360 | 71440 | 71440 | 35680 | |||||||||||||
| CASH FLOW from Operations | 141169 | 248113 | 268673 | 231973 | 205762 | 172790 | 139790 | 94631 | |||||||||||||
| NWC investment amp Recovery | (20000) | (34000) | (36000) | (18000) | 750 | 8250 | 16500 | 16500 | 66000 | ||||||||||||
| Salvage Value | 105600 | ||||||||||||||||||||
| TOTAL PROJECTED CF | (820000) | 107169 | 212113 | 250673 | 232723 | 214012 | 189290 | 156290 | 266231 | ||||||||||||
| Discounted Cash Flows | (820000) | 93190 | 160388 | 164821 | 133060 | 106402 | 81835 | 58755 | 87031 | ||||||||||||
| Cumulative Cash flows | (820000) | (712831) | (500718) | (250046) | (17323) | 196690 | 385979 | 542269 | 808500 | ||||||||||||
| NPV | $65483 | ||||||||||||||||||||
| IRR | 1724 | ||||||||||||||||||||
| Payback | 408 |
| Depreciation | 5-year Asset | ||||||||
| Year | Beg BV | Depr | Deprec | End BV | |||||
| 1 | $ 1200000 | 2000 | $ 240000 | $ 960000 | |||||
| 2 | $ 960000 | 3200 | $ 384000 | $ 576000 | |||||
| 3 | $ 576000 | 1920 | $ 230400 | $ 345600 | |||||
| 4 | $ 345600 | 1152 | $ 138240 | $ 207360 | |||||
| 5 | $ 207360 | 1152 | $ 138240 | $ 69120 | |||||
| 6 | $ 69120 | 576 | $ 69120 | $ - 0 | |||||
| 10000 | $ 1200000 | ||||||||
| EOY 5 | $3000 | $221501 | $78499 | ||||||
| EOY 2 | $4000 | $459840 | ($59840) |
| Pro Forma Income Statement | |||||||||
| Year | 0 | 1 | 2 | 3 | |||||
| Sales | 200000 | 200000 | 200000 | ||||||
| Variable Costs | 125000 | 125000 | 125000 | ||||||
| Gross Profit | 75000 | 75000 | 75000 | ||||||
| Fixed Costs | 12000 | 12000 | 12000 | ||||||
| Depreciation | 30000 | 30000 | 30000 | ||||||
| EBIT | 33000 | 33000 | 33000 | ||||||
| Taxes | 11220 | 11220 | 11220 | ||||||
| Net Income | 21780 | 21780 | 21780 | ||||||
| Cash Flows | |||||||||
| Operating Cash Flow | 51780 | 51780 | 51780 | ||||||
| Changes in NWC | -20000 | 20000 | |||||||
| Net Capital Spending | -90000 | ||||||||
| Cash Flow From Assets | -110000 | 51780 | 51780 | 71780 | |||||
| Net Present Value | $1064769 | ||||||||
| IRR | 2576 |
| Pro Forma Income Statements | |||||||||
| Year | 0 | 1 | 2 | 3 | |||||
| Sales | 200000 | 200000 | 200000 | ||||||
| Variable Costs | 125000 | 125000 | 125000 | ||||||
| Gross Profit | 75000 | 75000 | 75000 | ||||||
| Fixed Costs | 12000 | 12000 | 12000 | ||||||
| Depreciation | 30000 | 30000 | 30000 | ||||||
| EBIT | 33000 | 33000 | 33000 | ||||||
| Taxes | 11220 | 11220 | 11220 | ||||||
| Net Income | 21780 | 21780 | 21780 | ||||||
| Cash Flows | |||||||||
| Operating Cash Flow | 51780 | 51780 | 51780 | ||||||
| Changes in NWC | (20000) | 20000 | |||||||
| Net Capital Spending | (90000) | ||||||||
| Cash Flow From Assets | (110000) | 51780 | 51780 | 71780 | |||||
| Net Present Value | $1064769 | ||||||||
| IRR | 2576 |
| -30 | -20 | -10 | 0 | 10 | 20 | 30 | |||||||||
| UNITS | -70083865667486 | -415340381449136 | -129842106223412 | 155656169002312 | 441154444228038 | 726652719453761 | 101215099467949 | ||||||||
| FC | 512529013034468 | 393571398357083 | 274613783679698 | 155656169002312 | 36698554324927 | -82259060352458 | -201216675029843 |
| Sensitivity Analysis | |||||||||||||||||||||||||||||||||||||||
| -30 | -20 | -10 | 0 | 10 | 20 | 30 | -30 | -20 | -10 | 0 | 10 | 20 | 30 | ||||||||||||||||||||||||||
| Base | Units | Units | Units | Units | Units | Units | Units | Base | Fixed Cost | Fixed Cost | Fixed Cost | Fixed Cost | Fixed Cost | Fixed Cost | Fixed Cost | ||||||||||||||||||||||||
| Units | 6000 | 4200 | 4800 | 5400 | 6000 | 6600 | 7200 | 7800 | Units | 6000 | 6000 | 6000 | 6000 | 6000 | 6000 | 6000 | 6000 | ||||||||||||||||||||||
| Priceunit | $ 80 | 80 | 80 | 80 | 80 | 80 | 80 | 80 | Priceunit | $ 80 | 80 | 80 | 80 | 80 | 80 | 80 | 80 | ||||||||||||||||||||||
| Variable costunit | $ 60 | 60 | 60 | 60 | 60 | 60 | 60 | 60 | Variable costunit | $ 60 | 60 | 60 | 60 | 60 | 60 | 60 | 60 | ||||||||||||||||||||||
| Fixed costyear | $ 50000 | 50000 | 50000 | 50000 | 50000 | 50000 | 50000 | 50000 | Fixed costyear | $ 50000 | 35000 | 40000 | 45000 | 50000 | 55000 | 60000 | 65000 | ||||||||||||||||||||||
| Initial investment | $ 200000 | Initial investment | $ 200000 | ||||||||||||||||||||||||||||||||||||
| Depreciated to salvage value of 0 over 5 years | Depreciated to salvage value of 0 over 5 years | ||||||||||||||||||||||||||||||||||||||
| Deprecyr | $ 40000 | Deprecyr | $ 40000 | ||||||||||||||||||||||||||||||||||||
| Tax rate | 34 | Tax rate | 34 | ||||||||||||||||||||||||||||||||||||
| Required Return | 12 | Required Return | 12 | ||||||||||||||||||||||||||||||||||||
| BASE | UNITS | UNITS | UNITS | UNITS | UNITS | UNITS | UNITS | BASE | FC | FC | FC | FC | FC | FC | FC | ||||||||||||||||||||||||
| Units | 6000 | 4200 | 4800 | 5400 | 6000 | 6600 | 7200 | 7800 | Units | 6000 | 6000 | 6000 | 6000 | 6000 | 6000 | 6000 | 6000 | ||||||||||||||||||||||
| Priceunit | $ 80 | $ 80 | $ 80 | $ 80 | $ 80 | $ 80 | $ 80 | $ 80 | Priceunit | $ 80 | $ 80 | $ 80 | $ 80 | $ 80 | $ 80 | $ 80 | $ 80 | ||||||||||||||||||||||
| Variable costunit | $ 60 | $ 60 | $ 60 | $ 60 | $ 60 | $ 60 | $ 60 | $ 60 | Variable costunit | $ 60 | $ 60 | $ 60 | $ 60 | $ 60 | $ 60 | $ 60 | $ 60 | ||||||||||||||||||||||
| Fixed cost | $ 50000 | $ 50000 | $ 50000 | $ 50000 | $ 50000 | $ 50000 | $ 50000 | $ 50000 | Fixed cost | $ 50000 | $ 35000 | $ 40000 | $ 45000 | $ 50000 | $ 55000 | $ 60000 | $ 65000 | ||||||||||||||||||||||
| Sales | $ 480000 | $ 336000 | $ 384000 | $ 432000 | $ 480000 | $ 528000 | $ 576000 | $ 624000 | Sales | $ 480000 | $ 480000 | $ 480000 | $ 480000 | $ 480000 | $ 480000 | $ 480000 | $ 480000 | ||||||||||||||||||||||
| Variable Cost | 360000 | 252000 | 288000 | 324000 | 360000 | 396000 | 432000 | 468000 | Variable Cost | 360000 | 360000 | 360000 | 360000 | 360000 | 360000 | 360000 | 360000 | ||||||||||||||||||||||
| Fixed Cost | 50000 | 50000 | 50000 | 50000 | 50000 | 50000 | 50000 | 50000 | Fixed Cost | 50000 | 35000 | 40000 | 45000 | 50000 | 55000 | 60000 | 65000 | ||||||||||||||||||||||
| Depreciation | 40000 | 40000 | 40000 | 40000 | 40000 | 40000 | 40000 | 40000 | Depreciation | 40000 | 40000 | 40000 | 40000 | 40000 | 40000 | 40000 | 40000 | ||||||||||||||||||||||
| EBIT | 30000 | (6000) | 6000 | 18000 | 30000 | 42000 | 54000 | 66000 | EBIT | 30000 | 45000 | 40000 | 35000 | 30000 | 25000 | 20000 | 15000 | ||||||||||||||||||||||
| Taxes | 10200 | (2040) | 2040 | 6120 | 10200 | 14280 | 18360 | 22440 | Taxes | 10200 | 15300 | 13600 | 11900 | 10200 | 8500 | 6800 | 5100 | ||||||||||||||||||||||
| Net Income | 19800 | (3960) | 3960 | 11880 | 19800 | 27720 | 35640 | 43560 | Net Income | 19800 | 29700 | 26400 | 23100 | 19800 | 16500 | 13200 | 9900 | ||||||||||||||||||||||
| + Deprec | 40000 | 40000 | 40000 | 40000 | 40000 | 40000 | 40000 | 40000 | + Deprec | 40000 | 40000 | 40000 | 40000 | 40000 | 40000 | 40000 | 40000 | ||||||||||||||||||||||
| TOTAL CF | 59800 | 36040 | 43960 | 51880 | 59800 | 67720 | 75640 | 83560 | TOTAL CF | 59800 | 69700 | 66400 | 63100 | 59800 | 56500 | 53200 | 49900 | ||||||||||||||||||||||
| NPV | $ 15566 | $ (70084) | $ (41534) | $ (12984) | $ 15566 | $ 44115 | $ 72665 | $ 101215 | NPV | $ 15566 | $ 51253 | $ 39357 | $ 27461 | $ 15566 | $ 3670 | $ (8226) | $ (20122) | ||||||||||||||||||||||
| Change in NPV | -5502 | -3668 | -1834 | 00 | 1834 | 3668 | 5502 | Change in NPV | 2293 | 1528 | 764 | 00 | -764 | -1528 | -2293 | ||||||||||||||||||||||||
| Change in Variable | -300 | -200 | -100 | 00 | 100 | 200 | 300 | Change in Variable | -300 | -200 | -100 | 00 | 100 | 200 | 300 | ||||||||||||||||||||||||
| SENSITIVITY RATIO | 1834 | 1834 | 1834 | 000 | 1834 | 1834 | 1834 | SENSITIVITY RATIO | -764 | -764 | -764 | 000 | -764 | -764 | -764 | ||||||||||||||||||||||||
| INVERSE | INVERSE | INVERSE | INVERSE | INVERSE | INVERSE | INVERSE | |||||||||||||||||||||||||||||||||
| Sensitivity Ratio = ( Change in NPV) Change in Variable | |||||||||||||||||||||||||||||||||||||||
| Positive = Direct relationship | Sensitivity Ratio = ( Change in NPV) Change in Variable | ||||||||||||||||||||||||||||||||||||||
| Negative = Inverse relationship | Positive = Direct relationship | ||||||||||||||||||||||||||||||||||||||
| Negative = Inverse relationship | |||||||||||||||||||||||||||||||||||||||
| $ (200000) | $ (200000) | $ (200000) | $ (200000) | $ (200000) | $ (200000) | $ (200000) | $ (200000) | ||||||||||||||||||||||||||||||||
| 59800 | 36040 | 43960 | 51880 | 59800 | 67720 | 75640 | 83560 | $ (200000) | $ (200000) | $ (200000) | $ (200000) | $ (200000) | $ (200000) | $ (200000) | $ (200000) | ||||||||||||||||||||||||
| 59800 | 36040 | 43960 | 51880 | 59800 | 67720 | 75640 | 83560 | 59800 | 69700 | 66400 | 63100 | 59800 | 56500 | 53200 | 49900 | ||||||||||||||||||||||||
| 59800 | 36040 | 43960 | 51880 | 59800 | 67720 | 75640 | 83560 | 59800 | 69700 | 66400 | 63100 | 59800 | 56500 | 53200 | 49900 | ||||||||||||||||||||||||
| 59800 | 36040 | 43960 | 51880 | 59800 | 67720 | 75640 | 83560 | 59800 | 69700 | 66400 | 63100 | 59800 | 56500 | 53200 | 49900 | ||||||||||||||||||||||||
| 59800 | 36040 | 43960 | 51880 | 59800 | 67720 | 75640 | 83560 | 59800 | 69700 | 66400 | 63100 | 59800 | 56500 | 53200 | 49900 | ||||||||||||||||||||||||
| 59800 | 69700 | 66400 | 63100 | 59800 | 56500 | 53200 | 49900 | ||||||||||||||||||||||||||||||||
| PV | $ 215566 | $ 129916 | $ 158466 | $ 187016 | $ 215566 | $ 244115 | $ 272665 | $ 301215 | |||||||||||||||||||||||||||||||
| NPV | $ 15566 | $ (70084) | $ (41534) | $ (12984) | $ 15566 | $ 44115 | $ 72665 | $ 101215 | PV | $ 215566 | $ 251253 | $ 239357 | $ 227461 | $ 215566 | $ 203670 | $ 191774 | $ 179878 | ||||||||||||||||||||||
| NPV | $ 15566 | $ 51253 | $ 39357 | $ 27461 | $ 15566 | $ 3670 | $ (8226) | $ (20122) |
| Sensitivity Analysis | |||||||||||||||||||||||
| Base | Units | Units | Fixed Cost | Fixed Cost | |||||||||||||||||||
| Units | 6000 | 5500 | 6500 | 6000 | 6000 | ||||||||||||||||||
| Priceunit | $ 80 | 80 | 80 | 80 | 80 | ||||||||||||||||||
| Variable costunit | $ 60 | 60 | 60 | 60 | 60 | ||||||||||||||||||
| Fixed costyear | $ 50000 | 50000 | 50000 | 55000 | 45000 | X | 5500 | 6000 | 6500 | ||||||||||||||
| Y | $ (8226) | $ 15566 | $ 39357 | ||||||||||||||||||||
| Initial investment | $ 200000 | ||||||||||||||||||||||
| Depreciated to salvage value of 0 over 5 years | |||||||||||||||||||||||
| Deprecyr | $ 40000 | ||||||||||||||||||||||
| Tax rate | 34 | ||||||||||||||||||||||
| Required Return | 12 | ||||||||||||||||||||||
| BASE | UNITS | UNITS | FC | FC | |||||||||||||||||||
| Units | 6000 | 5500 | 6500 | 6000 | 6000 | ||||||||||||||||||
| Priceunit | $ 80 | $ 80 | $ 80 | $ 80 | $ 80 | ||||||||||||||||||
| Variable costunit | $ 60 | $ 60 | $ 60 | $ 60 | $ 60 | ||||||||||||||||||
| Fixed cost | $ 50000 | $ 50000 | $ 50000 | $ 55000 | $ 45000 | ||||||||||||||||||
| Sales | $ 480000 | $ 440000 | $ 520000 | $ 480000 | $ 480000 | ||||||||||||||||||
| Variable Cost | 360000 | 330000 | 390000 | 360000 | 360000 | ||||||||||||||||||
| Fixed Cost | 50000 | 50000 | 50000 | 55000 | 45000 | ||||||||||||||||||
| Depreciation | 40000 | 40000 | 40000 | 40000 | 40000 | ||||||||||||||||||
| EBIT | 30000 | 20000 | 40000 | 25000 | 35000 | ||||||||||||||||||
| Taxes | 10200 | 6800 | 13600 | 8500 | 11900 | ||||||||||||||||||
| Net Income | 19800 | 13200 | 26400 | 16500 | 23100 | ||||||||||||||||||
| + Deprec | 40000 | 40000 | 40000 | 40000 | 40000 | ||||||||||||||||||
| TOTAL CF | 59800 | 53200 | 66400 | 56500 | 63100 | ||||||||||||||||||
| NPV | $ 15566 | $ (8226) | $ 39357 | $ 3670 | $ 27461 | ||||||||||||||||||
| $ (200000) | $ (200000) | $ (200000) | $ (200000) | $ (200000) | |||||||||||||||||||
| 59800 | 53200 | 66400 | 56500 | 63100 | |||||||||||||||||||
| 59800 | 53200 | 66400 | 56500 | 63100 | |||||||||||||||||||
| 59800 | 53200 | 66400 | 56500 | 63100 | |||||||||||||||||||
| 59800 | 53200 | 66400 | 56500 | 63100 | |||||||||||||||||||
| 59800 | 53200 | 66400 | 56500 | 63100 | |||||||||||||||||||
| PV | $ 215566 | $ 191774 | $ 239357 | $ 203670 | $ 227461 | ||||||||||||||||||
| NPV | $ 15566 | $ (8226) | $ 39357 | $ 3670 | $ 27461 |
| Scenario Analysis | |||||||||
| Base | Lower | Upper | |||||||
| Units | 6000 | 5500 | 6500 | ||||||
| Priceunit | $ 8000 | $ 7500 | $ 8500 | ||||||
| Variable costunit | $ 6000 | $ 5800 | $ 6200 | ||||||
| Fixed costyear | $ 50000 | $ 45000 | $ 55000 | ||||||
| BASE | BEST | WORST | |||||||
| Initial investment | $ 200000 | ||||||||
| Depreciated to salvage value of 0 over 5 years | |||||||||
| Deprecyr | $ 40000 | ||||||||
| Project Life | 5 | years | |||||||
| Tax rate | 34 | ||||||||
| Required return | 12 | ||||||||
| BASE | WORST | BEST | |||||||
| Units | 6000 | 5500 | 6500 | ||||||
| Priceunit | $ 8000 | $ 7500 | $ 8500 | ||||||
| Variable costunit | $ 6000 | $ 6200 | $ 5800 | ||||||
| Fixed Cost | $ 50000 | $ 55000 | $ 45000 | ||||||
| Sales | $ 480000 | $ 412500 | $ 552500 | ||||||
| Variable Cost | 360000 | 341000 | 377000 | ||||||
| Fixed Cost | 50000 | 55000 | 45000 | ||||||
| Depreciation | 40000 | 40000 | 40000 | ||||||
| EBIT | 30000 | (23500) | 90500 | ||||||
| Taxes | 10200 | (7990) | 30770 | ||||||
| Net Income | 19800 | (15510) | 59730 | ||||||
| + Deprec | 40000 | 40000 | 40000 | ||||||
| TOTAL CF | 59800 | 24490 | 99730 | ||||||
| NPV | 15566 | (111719) | 159504 | ||||||
| IRR | 151 | -144 | 409 | ||||||
| NOTE | Note in WORST CASE tax credit for negative earnings | ||||||||
| $ (200000) | $ (200000) | $ (200000) | |||||||
| 59800 | 24490 | 99730 | |||||||
| 59800 | 24490 | 99730 | |||||||
| 59800 | 24490 | 99730 | |||||||
| 59800 | 24490 | 99730 | |||||||
| 59800 | 24490 | 99730 | |||||||
| PV | $215566 | $88281 | $359504 | ||||||
| NPV | 15566 | (111719) | 159504 |
| Majestic Mulch and Compost Company (MMCC) | |||||||||||||||||||||
| YEAR | 0 | 1 | 2 | 3 | 4 | 5 | 6 | 7 | 8 | ||||||||||||
| Background Data | |||||||||||||||||||||
| Unit Sales Estimates | 3000 | 5000 | 6000 | 6500 | 6000 | 5000 | 4000 | 3000 | |||||||||||||
| Variable Cost unit | $ 6000 | ||||||||||||||||||||
| Fixed Costs per year | $ 2500000 | ||||||||||||||||||||
| Sale Price per unit | $ 12000 | $ 12000 | $ 12000 | $ 12000 | $ 11000 | $ 11000 | $ 11000 | $ 11000 | $ 11000 | ||||||||||||
| Tax Rate | 340 | ||||||||||||||||||||
| Required Return on Project | 150 | ||||||||||||||||||||
| Yr 0 NWC | $ 2000000 | ||||||||||||||||||||
| NWC of sales | 15 | ||||||||||||||||||||
| Equipment cost - installed | $ 800000 | ||||||||||||||||||||
| Salvage Value in year 8 | 20 | of equipment cost | |||||||||||||||||||
| Depreciation Calculations | |||||||||||||||||||||
| Equipment Depreciable Base | 800000 | ||||||||||||||||||||
| MACRS (Eqpt-7 yr) | 1429 | 2449 | 1749 | 1249 | 892 | 893 | 893 | 446 | |||||||||||||
| Recovery Allowance | 114320 | 195920 | 139920 | 99920 | 71360 | 71440 | 71440 | 35680 | |||||||||||||
| Book Value | 685680 | 489760 | 349840 | 249920 | 178560 | 107120 | 35680 | 0 | |||||||||||||
| After-Tax Salvage Value | |||||||||||||||||||||
| Salvage Value | 20 | 160000 | |||||||||||||||||||
| Book Value (Year 8) | 0 | ||||||||||||||||||||
| Capital GainLoss | 160000 | ||||||||||||||||||||
| Taxes | 54400 | ||||||||||||||||||||
| Net SV (SV-Taxes) | 105600 | ||||||||||||||||||||
| Required Net Working Capital Investment | |||||||||||||||||||||
| 20000 | 54000 | 90000 | 108000 | 107250 | 99000 | 82500 | 66000 | 49500 | |||||||||||||
| YEAR | 0 | 1 | 2 | 3 | 4 | 5 | 6 | 7 | 8 | ||||||||||||
| Initial Investment | |||||||||||||||||||||
| Equipment Cost | (800000) | ||||||||||||||||||||
| Sales | 360000 | 600000 | 720000 | 715000 | 660000 | 550000 | 440000 | 330000 | |||||||||||||
| Variable Costs | 180000 | 300000 | 360000 | 390000 | 360000 | 300000 | 240000 | 180000 | |||||||||||||
| Fixed Costs | 25000 | 25000 | 25000 | 25000 | 25000 | 25000 | 25000 | 25000 | |||||||||||||
| Depreciation (Eqpt)) | 114320 | 195920 | 139920 | 99920 | 71360 | 71440 | 71440 | 35680 | |||||||||||||
| EBT | 40680 | 79080 | 195080 | 200080 | 203640 | 153560 | 103560 | 89320 | |||||||||||||
| Taxes | 13831 | 26887 | 66327 | 68027 | 69238 | 52210 | 35210 | 30369 | |||||||||||||
| Net Operating Income | 26849 | 52193 | 128753 | 132053 | 134402 | 101350 | 68350 | 58951 | |||||||||||||
| Add back Depreciation | 114320 | 195920 | 139920 | 99920 | 71360 | 71440 | 71440 | 35680 | |||||||||||||
| CASH FLOW from Operations | 141169 | 248113 | 268673 | 231973 | 205762 | 172790 | 139790 | 94631 | |||||||||||||
| NWC investment amp Recovery | (20000) | (34000) | (36000) | (18000) | 750 | 8250 | 16500 | 16500 | 66000 | ||||||||||||
| Salvage Value | 105600 | ||||||||||||||||||||
| TOTAL PROJECTED CF | (820000) | 107169 | 212113 | 250673 | 232723 | 214012 | 189290 | 156290 | 266231 | ||||||||||||
| Discounted Cash Flows | (820000) | 93190 | 160388 | 164821 | 133060 | 106402 | 81835 | 58755 | 87031 | ||||||||||||
| Cumulative Cash flows | (820000) | (712831) | (500718) | (250046) | (17323) | 196690 | 385979 | 542269 | 808500 | ||||||||||||
| NPV | $65483 | ||||||||||||||||||||
| IRR | 1724 | ||||||||||||||||||||
| Payback | 408 |
| Depreciation | 5-year Asset | ||||||||
| Year | Beg BV | Depr | Deprec | End BV | |||||
| 1 | $ 1200000 | 2000 | $ 240000 | $ 960000 | |||||
| 2 | $ 960000 | 3200 | $ 384000 | $ 576000 | |||||
| 3 | $ 576000 | 1920 | $ 230400 | $ 345600 | |||||
| 4 | $ 345600 | 1152 | $ 138240 | $ 207360 | |||||
| 5 | $ 207360 | 1152 | $ 138240 | $ 69120 | |||||
| 6 | $ 69120 | 576 | $ 69120 | $ - 0 | |||||
| 10000 | $ 1200000 | ||||||||
| EOY 5 | $3000 | $221501 | $78499 | ||||||
| EOY 2 | $4000 | $459840 | ($59840) |
| Pro Forma Income Statement | |||||||||
| Year | 0 | 1 | 2 | 3 | |||||
| Sales | 200000 | 200000 | 200000 | ||||||
| Variable Costs | 125000 | 125000 | 125000 | ||||||
| Gross Profit | 75000 | 75000 | 75000 | ||||||
| Fixed Costs | 12000 | 12000 | 12000 | ||||||
| Depreciation | 30000 | 30000 | 30000 | ||||||
| EBIT | 33000 | 33000 | 33000 | ||||||
| Taxes | 11220 | 11220 | 11220 | ||||||
| Net Income | 21780 | 21780 | 21780 | ||||||
| Cash Flows | |||||||||
| Operating Cash Flow | 51780 | 51780 | 51780 | ||||||
| Changes in NWC | -20000 | 20000 | |||||||
| Net Capital Spending | -90000 | ||||||||
| Cash Flow From Assets | -110000 | 51780 | 51780 | 71780 | |||||
| Net Present Value | $1064769 | ||||||||
| IRR | 2576 |
| 5500 | |
| 6000 | |
| 6500 |
| Pro Forma Income Statements | |||||||||
| Year | 0 | 1 | 2 | 3 | |||||
| Sales | 200000 | 200000 | 200000 | ||||||
| Variable Costs | 125000 | 125000 | 125000 | ||||||
| Gross Profit | 75000 | 75000 | 75000 | ||||||
| Fixed Costs | 12000 | 12000 | 12000 | ||||||
| Depreciation | 30000 | 30000 | 30000 | ||||||
| EBIT | 33000 | 33000 | 33000 | ||||||
| Taxes | 11220 | 11220 | 11220 | ||||||
| Net Income | 21780 | 21780 | 21780 | ||||||
| Cash Flows | |||||||||
| Operating Cash Flow | 51780 | 51780 | 51780 | ||||||
| Changes in NWC | (20000) | 20000 | |||||||
| Net Capital Spending | (90000) | ||||||||
| Cash Flow From Assets | (110000) | 51780 | 51780 | 71780 | |||||
| Net Present Value | $1064769 | ||||||||
| IRR | 2576 |
| -30 | -20 | -10 | 0 | 10 | 20 | 30 | |||||||||
| UNITS | -70083865667486 | -415340381449136 | -129842106223412 | 155656169002312 | 441154444228038 | 726652719453761 | 101215099467949 | ||||||||
| FC | 512529013034468 | 393571398357083 | 274613783679698 | 155656169002312 | 36698554324927 | -82259060352458 | -201216675029843 |
| Sensitivity Analysis | |||||||||||||||||||||||||||||||||||||||
| -30 | -20 | -10 | 0 | 10 | 20 | 30 | -30 | -20 | -10 | 0 | 10 | 20 | 30 | ||||||||||||||||||||||||||
| Base | Units | Units | Units | Units | Units | Units | Units | Base | Fixed Cost | Fixed Cost | Fixed Cost | Fixed Cost | Fixed Cost | Fixed Cost | Fixed Cost | ||||||||||||||||||||||||
| Units | 6000 | 4200 | 4800 | 5400 | 6000 | 6600 | 7200 | 7800 | Units | 6000 | 6000 | 6000 | 6000 | 6000 | 6000 | 6000 | 6000 | ||||||||||||||||||||||
| Priceunit | $ 80 | 80 | 80 | 80 | 80 | 80 | 80 | 80 | Priceunit | $ 80 | 80 | 80 | 80 | 80 | 80 | 80 | 80 | ||||||||||||||||||||||
| Variable costunit | $ 60 | 60 | 60 | 60 | 60 | 60 | 60 | 60 | Variable costunit | $ 60 | 60 | 60 | 60 | 60 | 60 | 60 | 60 | ||||||||||||||||||||||
| Fixed costyear | $ 50000 | 50000 | 50000 | 50000 | 50000 | 50000 | 50000 | 50000 | Fixed costyear | $ 50000 | 35000 | 40000 | 45000 | 50000 | 55000 | 60000 | 65000 | ||||||||||||||||||||||
| Initial investment | $ 200000 | Initial investment | $ 200000 | ||||||||||||||||||||||||||||||||||||
| Depreciated to salvage value of 0 over 5 years | Depreciated to salvage value of 0 over 5 years | ||||||||||||||||||||||||||||||||||||||
| Deprecyr | $ 40000 | Deprecyr | $ 40000 | ||||||||||||||||||||||||||||||||||||
| Tax rate | 34 | Tax rate | 34 | ||||||||||||||||||||||||||||||||||||
| Required Return | 12 | Required Return | 12 | ||||||||||||||||||||||||||||||||||||
| BASE | UNITS | UNITS | UNITS | UNITS | UNITS | UNITS | UNITS | BASE | FC | FC | FC | FC | FC | FC | FC | ||||||||||||||||||||||||
| Units | 6000 | 4200 | 4800 | 5400 | 6000 | 6600 | 7200 | 7800 | Units | 6000 | 6000 | 6000 | 6000 | 6000 | 6000 | 6000 | 6000 | ||||||||||||||||||||||
| Priceunit | $ 80 | $ 80 | $ 80 | $ 80 | $ 80 | $ 80 | $ 80 | $ 80 | Priceunit | $ 80 | $ 80 | $ 80 | $ 80 | $ 80 | $ 80 | $ 80 | $ 80 | ||||||||||||||||||||||
| Variable costunit | $ 60 | $ 60 | $ 60 | $ 60 | $ 60 | $ 60 | $ 60 | $ 60 | Variable costunit | $ 60 | $ 60 | $ 60 | $ 60 | $ 60 | $ 60 | $ 60 | $ 60 | ||||||||||||||||||||||
| Fixed cost | $ 50000 | $ 50000 | $ 50000 | $ 50000 | $ 50000 | $ 50000 | $ 50000 | $ 50000 | Fixed cost | $ 50000 | $ 35000 | $ 40000 | $ 45000 | $ 50000 | $ 55000 | $ 60000 | $ 65000 | ||||||||||||||||||||||
| Sales | $ 480000 | $ 336000 | $ 384000 | $ 432000 | $ 480000 | $ 528000 | $ 576000 | $ 624000 | Sales | $ 480000 | $ 480000 | $ 480000 | $ 480000 | $ 480000 | $ 480000 | $ 480000 | $ 480000 | ||||||||||||||||||||||
| Variable Cost | 360000 | 252000 | 288000 | 324000 | 360000 | 396000 | 432000 | 468000 | Variable Cost | 360000 | 360000 | 360000 | 360000 | 360000 | 360000 | 360000 | 360000 | ||||||||||||||||||||||
| Fixed Cost | 50000 | 50000 | 50000 | 50000 | 50000 | 50000 | 50000 | 50000 | Fixed Cost | 50000 | 35000 | 40000 | 45000 | 50000 | 55000 | 60000 | 65000 | ||||||||||||||||||||||
| Depreciation | 40000 | 40000 | 40000 | 40000 | 40000 | 40000 | 40000 | 40000 | Depreciation | 40000 | 40000 | 40000 | 40000 | 40000 | 40000 | 40000 | 40000 | ||||||||||||||||||||||
| EBIT | 30000 | (6000) | 6000 | 18000 | 30000 | 42000 | 54000 | 66000 | EBIT | 30000 | 45000 | 40000 | 35000 | 30000 | 25000 | 20000 | 15000 | ||||||||||||||||||||||
| Taxes | 10200 | (2040) | 2040 | 6120 | 10200 | 14280 | 18360 | 22440 | Taxes | 10200 | 15300 | 13600 | 11900 | 10200 | 8500 | 6800 | 5100 | ||||||||||||||||||||||
| Net Income | 19800 | (3960) | 3960 | 11880 | 19800 | 27720 | 35640 | 43560 | Net Income | 19800 | 29700 | 26400 | 23100 | 19800 | 16500 | 13200 | 9900 | ||||||||||||||||||||||
| + Deprec | 40000 | 40000 | 40000 | 40000 | 40000 | 40000 | 40000 | 40000 | + Deprec | 40000 | 40000 | 40000 | 40000 | 40000 | 40000 | 40000 | 40000 | ||||||||||||||||||||||
| TOTAL CF | 59800 | 36040 | 43960 | 51880 | 59800 | 67720 | 75640 | 83560 | TOTAL CF | 59800 | 69700 | 66400 | 63100 | 59800 | 56500 | 53200 | 49900 | ||||||||||||||||||||||
| NPV | $ 15566 | $ (70084) | $ (41534) | $ (12984) | $ 15566 | $ 44115 | $ 72665 | $ 101215 | NPV | $ 15566 | $ 51253 | $ 39357 | $ 27461 | $ 15566 | $ 3670 | $ (8226) | $ (20122) | ||||||||||||||||||||||
| Change in NPV | -5502 | -3668 | -1834 | 00 | 1834 | 3668 | 5502 | Change in NPV | 2293 | 1528 | 764 | 00 | -764 | -1528 | -2293 | ||||||||||||||||||||||||
| Change in Variable | -300 | -200 | -100 | 00 | 100 | 200 | 300 | Change in Variable | -300 | -200 | -100 | 00 | 100 | 200 | 300 | ||||||||||||||||||||||||
| SENSITIVITY RATIO | 1834 | 1834 | 1834 | 000 | 1834 | 1834 | 1834 | SENSITIVITY RATIO | -764 | -764 | -764 | 000 | -764 | -764 | -764 | ||||||||||||||||||||||||
| INVERSE | INVERSE | INVERSE | INVERSE | INVERSE | INVERSE | INVERSE | |||||||||||||||||||||||||||||||||
| Sensitivity Ratio = ( Change in NPV) Change in Variable | |||||||||||||||||||||||||||||||||||||||
| Positive = Direct relationship | Sensitivity Ratio = ( Change in NPV) Change in Variable | ||||||||||||||||||||||||||||||||||||||
| Negative = Inverse relationship | Positive = Direct relationship | ||||||||||||||||||||||||||||||||||||||
| Negative = Inverse relationship | |||||||||||||||||||||||||||||||||||||||
| $ (200000) | $ (200000) | $ (200000) | $ (200000) | $ (200000) | $ (200000) | $ (200000) | $ (200000) | ||||||||||||||||||||||||||||||||
| 59800 | 36040 | 43960 | 51880 | 59800 | 67720 | 75640 | 83560 | $ (200000) | $ (200000) | $ (200000) | $ (200000) | $ (200000) | $ (200000) | $ (200000) | $ (200000) | ||||||||||||||||||||||||
| 59800 | 36040 | 43960 | 51880 | 59800 | 67720 | 75640 | 83560 | 59800 | 69700 | 66400 | 63100 | 59800 | 56500 | 53200 | 49900 | ||||||||||||||||||||||||
| 59800 | 36040 | 43960 | 51880 | 59800 | 67720 | 75640 | 83560 | 59800 | 69700 | 66400 | 63100 | 59800 | 56500 | 53200 | 49900 | ||||||||||||||||||||||||
| 59800 | 36040 | 43960 | 51880 | 59800 | 67720 | 75640 | 83560 | 59800 | 69700 | 66400 | 63100 | 59800 | 56500 | 53200 | 49900 | ||||||||||||||||||||||||
| 59800 | 36040 | 43960 | 51880 | 59800 | 67720 | 75640 | 83560 | 59800 | 69700 | 66400 | 63100 | 59800 | 56500 | 53200 | 49900 | ||||||||||||||||||||||||
| 59800 | 69700 | 66400 | 63100 | 59800 | 56500 | 53200 | 49900 | ||||||||||||||||||||||||||||||||
| PV | $ 215566 | $ 129916 | $ 158466 | $ 187016 | $ 215566 | $ 244115 | $ 272665 | $ 301215 | |||||||||||||||||||||||||||||||
| NPV | $ 15566 | $ (70084) | $ (41534) | $ (12984) | $ 15566 | $ 44115 | $ 72665 | $ 101215 | PV | $ 215566 | $ 251253 | $ 239357 | $ 227461 | $ 215566 | $ 203670 | $ 191774 | $ 179878 | ||||||||||||||||||||||
| NPV | $ 15566 | $ 51253 | $ 39357 | $ 27461 | $ 15566 | $ 3670 | $ (8226) | $ (20122) |
| Sensitivity Analysis | |||||||||||||
| Base | Units | Units | Fixed Cost | Fixed Cost | |||||||||
| Units | 6000 | 5500 | 6500 | 6000 | 6000 | ||||||||
| Priceunit | $ 80 | 80 | 80 | 80 | 80 | ||||||||
| Variable costunit | $ 60 | 60 | 60 | 60 | 60 | ||||||||
| Fixed costyear | $ 50000 | 50000 | 50000 | 55000 | 45000 | ||||||||
| Initial investment | $ 200000 | ||||||||||||
| Depreciated to salvage value of 0 over 5 years | |||||||||||||
| Deprecyr | $ 40000 | ||||||||||||
| Tax rate | 34 | ||||||||||||
| Required Return | 12 | ||||||||||||
| BASE | UNITS | UNITS | FC | FC | |||||||||
| Units | 6000 | 5500 | 6500 | 6000 | 6000 | ||||||||
| Priceunit | $ 80 | $ 80 | $ 80 | $ 80 | $ 80 | ||||||||
| Variable costunit | $ 60 | $ 60 | $ 60 | $ 60 | $ 60 | ||||||||
| Fixed cost | $ 50000 | $ 50000 | $ 50000 | $ 55000 | $ 45000 | ||||||||
| Sales | $ 480000 | $ 440000 | $ 520000 | $ 480000 | $ 480000 | ||||||||
| Variable Cost | 360000 | 330000 | 390000 | 360000 | 360000 | ||||||||
| Fixed Cost | 50000 | 50000 | 50000 | 55000 | 45000 | ||||||||
| Depreciation | 40000 | 40000 | 40000 | 40000 | 40000 | ||||||||
| EBIT | 30000 | 20000 | 40000 | 25000 | 35000 | ||||||||
| Taxes | 10200 | 6800 | 13600 | 8500 | 11900 | ||||||||
| Net Income | 19800 | 13200 | 26400 | 16500 | 23100 | ||||||||
| + Deprec | 40000 | 40000 | 40000 | 40000 | 40000 | ||||||||
| TOTAL CF | 59800 | 53200 | 66400 | 56500 | 63100 | ||||||||
| NPV | $ 15566 | $ (8226) | $ 39357 | $ 3670 | $ 27461 | ||||||||
| $ (200000) | $ (200000) | $ (200000) | $ (200000) | $ (200000) | |||||||||
| 59800 | 53200 | 66400 | 56500 | 63100 | |||||||||
| 59800 | 53200 | 66400 | 56500 | 63100 | |||||||||
| 59800 | 53200 | 66400 | 56500 | 63100 | |||||||||
| 59800 | 53200 | 66400 | 56500 | 63100 | |||||||||
| 59800 | 53200 | 66400 | 56500 | 63100 | |||||||||
| PV | $ 215566 | $ 191774 | $ 239357 | $ 203670 | $ 227461 | ||||||||
| NPV | $ 15566 | $ (8226) | $ 39357 | $ 3670 | $ 27461 |
| Scenario Analysis | |||||||||
| Base | Lower | Upper | |||||||
| Units | 6000 | 5500 | 6500 | ||||||
| Priceunit | $ 8000 | $ 7500 | $ 8500 | ||||||
| Variable costunit | $ 6000 | $ 5800 | $ 6200 | ||||||
| Fixed costyear | $ 50000 | $ 45000 | $ 55000 | ||||||
| BASE | BEST | WORST | |||||||
| Initial investment | $ 200000 | ||||||||
| Depreciated to salvage value of 0 over 5 years | |||||||||
| Deprecyr | $ 40000 | ||||||||
| Project Life | 5 | years | |||||||
| Tax rate | 34 | ||||||||
| Required return | 12 | ||||||||
| BASE | WORST | BEST | |||||||
| Units | 6000 | 5500 | 6500 | ||||||
| Priceunit | $ 8000 | $ 7500 | $ 8500 | ||||||
| Variable costunit | $ 6000 | $ 6200 | $ 5800 | ||||||
| Fixed Cost | $ 50000 | $ 55000 | $ 45000 | ||||||
| Sales | $ 480000 | $ 412500 | $ 552500 | ||||||
| Variable Cost | 360000 | 341000 | 377000 | ||||||
| Fixed Cost | 50000 | 55000 | 45000 | ||||||
| Depreciation | 40000 | 40000 | 40000 | ||||||
| EBIT | 30000 | (23500) | 90500 | ||||||
| Taxes | 10200 | (7990) | 30770 | ||||||
| Net Income | 19800 | (15510) | 59730 | ||||||
| + Deprec | 40000 | 40000 | 40000 | ||||||
| TOTAL CF | 59800 | 24490 | 99730 | ||||||
| NPV | 15566 | (111719) | 159504 | ||||||
| IRR | 151 | -144 | 409 | ||||||
| NOTE | Note in WORST CASE tax credit for negative earnings | ||||||||
| $ (200000) | $ (200000) | $ (200000) | |||||||
| 59800 | 24490 | 99730 | |||||||
| 59800 | 24490 | 99730 | |||||||
| 59800 | 24490 | 99730 | |||||||
| 59800 | 24490 | 99730 | |||||||
| 59800 | 24490 | 99730 | |||||||
| PV | $215566 | $88281 | $359504 | ||||||
| NPV | 15566 | (111719) | 159504 |
| Majestic Mulch and Compost Company (MMCC) | |||||||||||||||||||||
| YEAR | 0 | 1 | 2 | 3 | 4 | 5 | 6 | 7 | 8 | ||||||||||||
| Background Data | |||||||||||||||||||||
| Unit Sales Estimates | 3000 | 5000 | 6000 | 6500 | 6000 | 5000 | 4000 | 3000 | |||||||||||||
| Variable Cost unit | $ 6000 | ||||||||||||||||||||
| Fixed Costs per year | $ 2500000 | ||||||||||||||||||||
| Sale Price per unit | $ 12000 | $ 12000 | $ 12000 | $ 12000 | $ 11000 | $ 11000 | $ 11000 | $ 11000 | $ 11000 | ||||||||||||
| Tax Rate | 340 | ||||||||||||||||||||
| Required Return on Project | 150 | ||||||||||||||||||||
| Yr 0 NWC | $ 2000000 | ||||||||||||||||||||
| NWC of sales | 15 | ||||||||||||||||||||
| Equipment cost - installed | $ 800000 | ||||||||||||||||||||
| Salvage Value in year 8 | 20 | of equipment cost | |||||||||||||||||||
| Depreciation Calculations | |||||||||||||||||||||
| Equipment Depreciable Base | 800000 | ||||||||||||||||||||
| MACRS (Eqpt-7 yr) | 1429 | 2449 | 1749 | 1249 | 892 | 893 | 893 | 446 | |||||||||||||
| Recovery Allowance | 114320 | 195920 | 139920 | 99920 | 71360 | 71440 | 71440 | 35680 | |||||||||||||
| Book Value | 685680 | 489760 | 349840 | 249920 | 178560 | 107120 | 35680 | 0 | |||||||||||||
| After-Tax Salvage Value | |||||||||||||||||||||
| Salvage Value | 20 | 160000 | |||||||||||||||||||
| Book Value (Year 8) | 0 | ||||||||||||||||||||
| Capital GainLoss | 160000 | ||||||||||||||||||||
| Taxes | 54400 | ||||||||||||||||||||
| Net SV (SV-Taxes) | 105600 | ||||||||||||||||||||
| Required Net Working Capital Investment | |||||||||||||||||||||
| 20000 | 54000 | 90000 | 108000 | 107250 | 99000 | 82500 | 66000 | 49500 | |||||||||||||
| YEAR | 0 | 1 | 2 | 3 | 4 | 5 | 6 | 7 | 8 | ||||||||||||
| Initial Investment | |||||||||||||||||||||
| Equipment Cost | (800000) | ||||||||||||||||||||
| Sales | 360000 | 600000 | 720000 | 715000 | 660000 | 550000 | 440000 | 330000 | |||||||||||||
| Variable Costs | 180000 | 300000 | 360000 | 390000 | 360000 | 300000 | 240000 | 180000 | |||||||||||||
| Fixed Costs | 25000 | 25000 | 25000 | 25000 | 25000 | 25000 | 25000 | 25000 | |||||||||||||
| Depreciation (Eqpt)) | 114320 | 195920 | 139920 | 99920 | 71360 | 71440 | 71440 | 35680 | |||||||||||||
| EBT | 40680 | 79080 | 195080 | 200080 | 203640 | 153560 | 103560 | 89320 | |||||||||||||
| Taxes | 13831 | 26887 | 66327 | 68027 | 69238 | 52210 | 35210 | 30369 | |||||||||||||
| Net Operating Income | 26849 | 52193 | 128753 | 132053 | 134402 | 101350 | 68350 | 58951 | |||||||||||||
| Add back Depreciation | 114320 | 195920 | 139920 | 99920 | 71360 | 71440 | 71440 | 35680 | |||||||||||||
| CASH FLOW from Operations | 141169 | 248113 | 268673 | 231973 | 205762 | 172790 | 139790 | 94631 | |||||||||||||
| NWC investment amp Recovery | (20000) | (34000) | (36000) | (18000) | 750 | 8250 | 16500 | 16500 | 66000 | ||||||||||||
| Salvage Value | 105600 | ||||||||||||||||||||
| TOTAL PROJECTED CF | (820000) | 107169 | 212113 | 250673 | 232723 | 214012 | 189290 | 156290 | 266231 | ||||||||||||
| Discounted Cash Flows | (820000) | 93190 | 160388 | 164821 | 133060 | 106402 | 81835 | 58755 | 87031 | ||||||||||||
| Cumulative Cash flows | (820000) | (712831) | (500718) | (250046) | (17323) | 196690 | 385979 | 542269 | 808500 | ||||||||||||
| NPV | $65483 | ||||||||||||||||||||
| IRR | 1724 | ||||||||||||||||||||
| Payback | 408 |
| Depreciation | 5-year Asset | ||||||||
| Year | Beg BV | Depr | Deprec | End BV | |||||
| 1 | $ 1200000 | 2000 | $ 240000 | $ 960000 | |||||
| 2 | $ 960000 | 3200 | $ 384000 | $ 576000 | |||||
| 3 | $ 576000 | 1920 | $ 230400 | $ 345600 | |||||
| 4 | $ 345600 | 1152 | $ 138240 | $ 207360 | |||||
| 5 | $ 207360 | 1152 | $ 138240 | $ 69120 | |||||
| 6 | $ 69120 | 576 | $ 69120 | $ - 0 | |||||
| 10000 | $ 1200000 | ||||||||
| EOY 5 | $3000 | $221501 | $78499 | ||||||
| EOY 2 | $4000 | $459840 | ($59840) |
| Pro Forma Income Statement | |||||||||
| Year | 0 | 1 | 2 | 3 | |||||
| Sales | 200000 | 200000 | 200000 | ||||||
| Variable Costs | 125000 | 125000 | 125000 | ||||||
| Gross Profit | 75000 | 75000 | 75000 | ||||||
| Fixed Costs | 12000 | 12000 | 12000 | ||||||
| Depreciation | 30000 | 30000 | 30000 | ||||||
| EBIT | 33000 | 33000 | 33000 | ||||||
| Taxes | 11220 | 11220 | 11220 | ||||||
| Net Income | 21780 | 21780 | 21780 | ||||||
| Cash Flows | |||||||||
| Operating Cash Flow | 51780 | 51780 | 51780 | ||||||
| Changes in NWC | -20000 | 20000 | |||||||
| Net Capital Spending | -90000 | ||||||||
| Cash Flow From Assets | -110000 | 51780 | 51780 | 71780 | |||||
| Net Present Value | $1064769 | ||||||||
| IRR | 2576 |
| Pro Forma Income Statements | |||||||||
| Year | 0 | 1 | 2 | 3 | |||||
| Sales | 200000 | 200000 | 200000 | ||||||
| Variable Costs | 125000 | 125000 | 125000 | ||||||
| Gross Profit | 75000 | 75000 | 75000 | ||||||
| Fixed Costs | 12000 | 12000 | 12000 | ||||||
| Depreciation | 30000 | 30000 | 30000 | ||||||
| EBIT | 33000 | 33000 | 33000 | ||||||
| Taxes | 11220 | 11220 | 11220 | ||||||
| Net Income | 21780 | 21780 | 21780 | ||||||
| Cash Flows | |||||||||
| Operating Cash Flow | 51780 | 51780 | 51780 | ||||||
| Changes in NWC | (20000) | 20000 | |||||||
| Net Capital Spending | (90000) | ||||||||
| Cash Flow From Assets | (110000) | 51780 | 51780 | 71780 | |||||
| Net Present Value | $1064769 | ||||||||
| IRR | 2576 |
| Sensitivity Analysis | |||||||||
| Base | Units | Fixed Cost | |||||||
| Units | 6000 | 5500 | 6000 | ||||||
| Priceunit | $ 80 | 80 | 80 | ||||||
| Variable costunit | $ 60 | 60 | 60 | ||||||
| Fixed costyear | $ 50000 | 50000 | 55000 | ||||||
| Initial investment | $ 200000 | ||||||||
| Depreciated to salvage value of 0 over 5 years | |||||||||
| Deprecyr | $ 40000 | ||||||||
| Tax rate | 34 | ||||||||
| Required Return | 12 | ||||||||
| BASE | UNITS | FC | |||||||
| Units | 6000 | 5500 | 6000 | ||||||
| Priceunit | $ 80 | $ 80 | $ 80 | ||||||
| Variable costunit | $ 60 | $ 60 | $ 60 | ||||||
| Fixed cost | $ 50000 | $ 50000 | $ 55000 | ||||||
| Sales | $ 480000 | $ 440000 | $ 480000 | ||||||
| Variable Cost | 360000 | 330000 | 360000 | ||||||
| Fixed Cost | 50000 | 50000 | 55000 | ||||||
| Depreciation | 40000 | 40000 | 40000 | ||||||
| EBIT | 30000 | 20000 | 25000 | ||||||
| Taxes | 10200 | 6800 | 8500 | ||||||
| Net Income | 19800 | 13200 | 16500 | ||||||
| + Deprec | 40000 | 40000 | 40000 | ||||||
| TOTAL CF | 59800 | 53200 | 56500 | ||||||
| NPV | $ 15566 | $ (8226) | $ 3670 | ||||||
| Change in NPV | -1528 | -764 | |||||||
| Change in Variable | -83 | 100 | |||||||
| SENSITIVITY RATIO | 1834 | -764 | |||||||
| DIRECT | INVERSE | ||||||||
| Sensitivity Ratio = ( Change in NPV) Change in Variable | |||||||||
| Positive = Direct relationship | |||||||||
| Negative = Inverse relationship | |||||||||
| $ (200000) | $ (200000) | $ (200000) | |||||||
| 59800 | 53200 | 56500 | |||||||
| 59800 | 53200 | 56500 | |||||||
| 59800 | 53200 | 56500 | |||||||
| 59800 | 53200 | 56500 | |||||||
| 59800 | 53200 | 56500 | |||||||
| PV | $ 215566 | $ 191774 | $ 203670 | ||||||
| NPV | $ 15566 | $ (8226) | $ 3670 |
| Scenario Analysis | |||||||||
| Base | Lower | Upper | |||||||
| Units | 6000 | 5500 | 6500 | ||||||
| Priceunit | $ 8000 | $ 7500 | $ 8500 | ||||||
| Variable costunit | $ 6000 | $ 5800 | $ 6200 | ||||||
| Fixed costyear | $ 50000 | $ 45000 | $ 55000 | ||||||
| BASE | BEST | WORST | |||||||
| Initial investment | $ 200000 | ||||||||
| Depreciated to salvage value of 0 over 5 years | |||||||||
| Deprecyr | $ 40000 | ||||||||
| Project Life | 5 | years | |||||||
| Tax rate | 34 | ||||||||
| Required return | 12 | ||||||||
| BASE | WORST | BEST | |||||||
| Units | 6000 | 5500 | 6500 | ||||||
| Priceunit | $ 8000 | $ 7500 | $ 8500 | ||||||
| Variable costunit | $ 6000 | $ 6200 | $ 5800 | ||||||
| Fixed Cost | $ 50000 | $ 55000 | $ 45000 | ||||||
| Sales | $ 480000 | $ 412500 | $ 552500 | ||||||
| Variable Cost | 360000 | 341000 | 377000 | ||||||
| Fixed Cost | 50000 | 55000 | 45000 | ||||||
| Depreciation | 40000 | 40000 | 40000 | ||||||
| EBIT | 30000 | (23500) | 90500 | ||||||
| Taxes | 10200 | (7990) | 30770 | ||||||
| Net Income | 19800 | (15510) | 59730 | ||||||
| + Deprec | 40000 | 40000 | 40000 | ||||||
| TOTAL CF | 59800 | 24490 | 99730 | ||||||
| NPV | 15566 | (111719) | 159504 | ||||||
| IRR | 151 | -144 | 409 | ||||||
| NOTE | Note in WORST CASE tax credit for negative earnings | ||||||||
| $ (200000) | $ (200000) | $ (200000) | |||||||
| 59800 | 24490 | 99730 | |||||||
| 59800 | 24490 | 99730 | |||||||
| 59800 | 24490 | 99730 | |||||||
| 59800 | 24490 | 99730 | |||||||
| 59800 | 24490 | 99730 | |||||||
| PV | $215566 | $88281 | $359504 | ||||||
| NPV | 15566 | (111719) | 159504 |
| Majestic Mulch and Compost Company (MMCC) | |||||||||||||||||||||
| YEAR | 0 | 1 | 2 | 3 | 4 | 5 | 6 | 7 | 8 | ||||||||||||
| Background Data | |||||||||||||||||||||
| Unit Sales Estimates | 3000 | 5000 | 6000 | 6500 | 6000 | 5000 | 4000 | 3000 | |||||||||||||
| Variable Cost unit | $ 6000 | ||||||||||||||||||||
| Fixed Costs per year | $ 2500000 | ||||||||||||||||||||
| Sale Price per unit | $ 12000 | $ 12000 | $ 12000 | $ 12000 | $ 11000 | $ 11000 | $ 11000 | $ 11000 | $ 11000 | ||||||||||||
| Tax Rate | 340 | ||||||||||||||||||||
| Required Return on Project | 150 | ||||||||||||||||||||
| Yr 0 NWC | $ 2000000 | ||||||||||||||||||||
| NWC of sales | 15 | ||||||||||||||||||||
| Equipment cost - installed | $ 800000 | ||||||||||||||||||||
| Salvage Value in year 8 | 20 | of equipment cost | |||||||||||||||||||
| Depreciation Calculations | |||||||||||||||||||||
| Equipment Depreciable Base | 800000 | ||||||||||||||||||||
| MACRS (Eqpt-7 yr) | 1429 | 2449 | 1749 | 1249 | 892 | 893 | 893 | 446 | |||||||||||||
| Recovery Allowance | 114320 | 195920 | 139920 | 99920 | 71360 | 71440 | 71440 | 35680 | |||||||||||||
| Book Value | 685680 | 489760 | 349840 | 249920 | 178560 | 107120 | 35680 | 0 | |||||||||||||
| After-Tax Salvage Value | |||||||||||||||||||||
| Salvage Value | 20 | 160000 | |||||||||||||||||||
| Book Value (Year 8) | 0 | ||||||||||||||||||||
| Capital GainLoss | 160000 | ||||||||||||||||||||
| Taxes | 54400 | ||||||||||||||||||||
| Net SV (SV-Taxes) | 105600 | ||||||||||||||||||||
| Required Net Working Capital Investment | |||||||||||||||||||||
| 20000 | 54000 | 90000 | 108000 | 107250 | 99000 | 82500 | 66000 | 49500 | |||||||||||||
| YEAR | 0 | 1 | 2 | 3 | 4 | 5 | 6 | 7 | 8 | ||||||||||||
| Initial Investment | |||||||||||||||||||||
| Equipment Cost | (800000) | ||||||||||||||||||||
| Sales | 360000 | 600000 | 720000 | 715000 | 660000 | 550000 | 440000 | 330000 | |||||||||||||
| Variable Costs | 180000 | 300000 | 360000 | 390000 | 360000 | 300000 | 240000 | 180000 | |||||||||||||
| Fixed Costs | 25000 | 25000 | 25000 | 25000 | 25000 | 25000 | 25000 | 25000 | |||||||||||||
| Depreciation (Eqpt)) | 114320 | 195920 | 139920 | 99920 | 71360 | 71440 | 71440 | 35680 | |||||||||||||
| EBT | 40680 | 79080 | 195080 | 200080 | 203640 | 153560 | 103560 | 89320 | |||||||||||||
| Taxes | 13831 | 26887 | 66327 | 68027 | 69238 | 52210 | 35210 | 30369 | |||||||||||||
| Net Operating Income | 26849 | 52193 | 128753 | 132053 | 134402 | 101350 | 68350 | 58951 | |||||||||||||
| Add back Depreciation | 114320 | 195920 | 139920 | 99920 | 71360 | 71440 | 71440 | 35680 | |||||||||||||
| CASH FLOW from Operations | 141169 | 248113 | 268673 | 231973 | 205762 | 172790 | 139790 | 94631 | |||||||||||||
| NWC investment amp Recovery | (20000) | (34000) | (36000) | (18000) | 750 | 8250 | 16500 | 16500 | 66000 | ||||||||||||
| Salvage Value | 105600 | ||||||||||||||||||||
| TOTAL PROJECTED CF | (820000) | 107169 | 212113 | 250673 | 232723 | 214012 | 189290 | 156290 | 266231 | ||||||||||||
| Discounted Cash Flows | (820000) | 93190 | 160388 | 164821 | 133060 | 106402 | 81835 | 58755 | 87031 | ||||||||||||
| Cumulative Cash flows | (820000) | (712831) | (500718) | (250046) | (17323) | 196690 | 385979 | 542269 | 808500 | ||||||||||||
| NPV | $65483 | ||||||||||||||||||||
| IRR | 1724 | ||||||||||||||||||||
| Payback | 408 |
| Depreciation | 5-year Asset | ||||||||
| Year | Beg BV | Depr | Deprec | End BV | |||||
| 1 | $ 1200000 | 2000 | $ 240000 | $ 960000 | |||||
| 2 | $ 960000 | 3200 | $ 384000 | $ 576000 | |||||
| 3 | $ 576000 | 1920 | $ 230400 | $ 345600 | |||||
| 4 | $ 345600 | 1152 | $ 138240 | $ 207360 | |||||
| 5 | $ 207360 | 1152 | $ 138240 | $ 69120 | |||||
| 6 | $ 69120 | 576 | $ 69120 | $ - 0 | |||||
| 10000 | $ 1200000 | ||||||||
| EOY 5 | $3000 | $221501 | $78499 | ||||||
| EOY 2 | $4000 | $459840 | ($59840) |
| Pro Forma Income Statement | |||||||||
| Year | 0 | 1 | 2 | 3 | |||||
| Sales | 200000 | 200000 | 200000 | ||||||
| Variable Costs | 125000 | 125000 | 125000 | ||||||
| Gross Profit | 75000 | 75000 | 75000 | ||||||
| Fixed Costs | 12000 | 12000 | 12000 | ||||||
| Depreciation | 30000 | 30000 | 30000 | ||||||
| EBIT | 33000 | 33000 | 33000 | ||||||
| Taxes | 11220 | 11220 | 11220 | ||||||
| Net Income | 21780 | 21780 | 21780 | ||||||
| Cash Flows | |||||||||
| Operating Cash Flow | 51780 | 51780 | 51780 | ||||||
| Changes in NWC | -20000 | 20000 | |||||||
| Net Capital Spending | -90000 | ||||||||
| Cash Flow From Assets | -110000 | 51780 | 51780 | 71780 | |||||
| Net Present Value | $1064769 | ||||||||
| IRR | 2576 |
| Pro Forma Income Statements | |||||||||
| Year | 0 | 1 | 2 | 3 | |||||
| Sales | 200000 | 200000 | 200000 | ||||||
| Variable Costs | 125000 | 125000 | 125000 | ||||||
| Gross Profit | 75000 | 75000 | 75000 | ||||||
| Fixed Costs | 12000 | 12000 | 12000 | ||||||
| Depreciation | 30000 | 30000 | 30000 | ||||||
| EBIT | 33000 | 33000 | 33000 | ||||||
| Taxes | 11220 | 11220 | 11220 | ||||||
| Net Income | 21780 | 21780 | 21780 | ||||||
| Cash Flows | |||||||||
| Operating Cash Flow | 51780 | 51780 | 51780 | ||||||
| Changes in NWC | (20000) | 20000 | |||||||
| Net Capital Spending | (90000) | ||||||||
| Cash Flow From Assets | (110000) | 51780 | 51780 | 71780 | |||||
| Net Present Value | $1064769 | ||||||||
| IRR | 2576 |
| Sensitivity Analysis | |||||||||
| Base | Units | Fixed Cost | |||||||
| Units | 6000 | 5500 | 6000 | ||||||
| Priceunit | $ 80 | 80 | 80 | ||||||
| Variable costunit | $ 60 | 60 | 60 | ||||||
| Fixed costyear | $ 50000 | 50000 | 55000 | ||||||
| Initial investment | $ 200000 | ||||||||
| Depreciated to salvage value of 0 over 5 years | |||||||||
| Deprecyr | $ 40000 | ||||||||
| Tax rate | 34 | ||||||||
| Required Return | 12 | ||||||||
| BASE | UNITS | FC | |||||||
| Units | 6000 | 5500 | 6000 | ||||||
| Priceunit | $ 80 | $ 80 | $ 80 | ||||||
| Variable costunit | $ 60 | $ 60 | $ 60 | ||||||
| Fixed cost | $ 50000 | $ 50000 | $ 55000 | ||||||
| Sales | $ 480000 | $ 440000 | $ 480000 | ||||||
| Variable Cost | 360000 | 330000 | 360000 | ||||||
| Fixed Cost | 50000 | 50000 | 55000 | ||||||
| Depreciation | 40000 | 40000 | 40000 | ||||||
| EBIT | 30000 | 20000 | 25000 | ||||||
| Taxes | 10200 | 6800 | 8500 | ||||||
| Net Income | 19800 | 13200 | 16500 | ||||||
| + Deprec | 40000 | 40000 | 40000 | ||||||
| TOTAL CF | 59800 | 53200 | 56500 | ||||||
| NPV | $ 15566 | $ (8226) | $ 3670 | ||||||
| Change in NPV | -1528 | -764 | |||||||
| Change in Variable | -83 | 100 | |||||||
| SENSITIVITY RATIO | 1834 | -764 | |||||||
| DIRECT | INVERSE | ||||||||
| Sensitivity Ratio = ( Change in NPV) Change in Variable | |||||||||
| Positive = Direct relationship | |||||||||
| Negative = Inverse relationship | |||||||||
| $ (200000) | $ (200000) | $ (200000) | |||||||
| 59800 | 53200 | 56500 | |||||||
| 59800 | 53200 | 56500 | |||||||
| 59800 | 53200 | 56500 | |||||||
| 59800 | 53200 | 56500 | |||||||
| 59800 | 53200 | 56500 | |||||||
| PV | $ 215566 | $ 191774 | $ 203670 | ||||||
| NPV | $ 15566 | $ (8226) | $ 3670 |
| Scenario Analysis | |||||||||
| Base | Lower | Upper | |||||||
| Units | 6000 | 5500 | 6500 | ||||||
| Priceunit | $ 8000 | $ 7500 | $ 8500 | ||||||
| Variable costunit | $ 6000 | $ 5800 | $ 6200 | ||||||
| Fixed costyear | $ 50000 | $ 45000 | $ 55000 | ||||||
| BASE | BEST | WORST | |||||||
| Initial investment | $ 200000 | ||||||||
| Depreciated to salvage value of 0 over 5 years | |||||||||
| Deprecyr | $ 40000 | ||||||||
| Project Life | 5 | years | |||||||
| Tax rate | 34 | ||||||||
| Required return | 12 | ||||||||
| BASE | WORST | BEST | |||||||
| Units | 6000 | 5500 | 6500 | ||||||
| Priceunit | $ 8000 | $ 7500 | $ 8500 | ||||||
| Variable costunit | $ 6000 | $ 6200 | $ 5800 | ||||||
| Fixed Cost | $ 50000 | $ 55000 | $ 45000 | ||||||
| Sales | $ 480000 | $ 412500 | $ 552500 | ||||||
| Variable Cost | 360000 | 341000 | 377000 | ||||||
| Fixed Cost | 50000 | 55000 | 45000 | ||||||
| Depreciation | 40000 | 40000 | 40000 | ||||||
| EBIT | 30000 | (23500) | 90500 | ||||||
| Taxes | 10200 | (7990) | 30770 | ||||||
| Net Income | 19800 | (15510) | 59730 | ||||||
| + Deprec | 40000 | 40000 | 40000 | ||||||
| TOTAL CF | 59800 | 24490 | 99730 | ||||||
| NPV | 15566 | (111719) | 159504 | ||||||
| IRR | 151 | -144 | 409 | ||||||
| NOTE | Note in WORST CASE tax credit for negative earnings | ||||||||
| $ (200000) | $ (200000) | $ (200000) | |||||||
| 59800 | 24490 | 99730 | |||||||
| 59800 | 24490 | 99730 | |||||||
| 59800 | 24490 | 99730 | |||||||
| 59800 | 24490 | 99730 | |||||||
| 59800 | 24490 | 99730 | |||||||
| PV | $215566 | $88281 | $359504 | ||||||
| NPV | 15566 | (111719) | 159504 |
| Majestic Mulch and Compost Company (MMCC) | |||||||||||||||||||||
| YEAR | 0 | 1 | 2 | 3 | 4 | 5 | 6 | 7 | 8 | ||||||||||||
| Background Data | |||||||||||||||||||||
| Unit Sales Estimates | 3000 | 5000 | 6000 | 6500 | 6000 | 5000 | 4000 | 3000 | |||||||||||||
| Variable Cost unit | $ 6000 | ||||||||||||||||||||
| Fixed Costs per year | $ 2500000 | ||||||||||||||||||||
| Sale Price per unit | $ 12000 | $ 12000 | $ 12000 | $ 12000 | $ 11000 | $ 11000 | $ 11000 | $ 11000 | $ 11000 | ||||||||||||
| Tax Rate | 340 | ||||||||||||||||||||
| Required Return on Project | 150 | ||||||||||||||||||||
| Yr 0 NWC | $ 2000000 | ||||||||||||||||||||
| NWC of sales | 15 | ||||||||||||||||||||
| Equipment cost - installed | $ 800000 | ||||||||||||||||||||
| Salvage Value in year 8 | 20 | of equipment cost | |||||||||||||||||||
| Depreciation Calculations | |||||||||||||||||||||
| Equipment Depreciable Base | 800000 | ||||||||||||||||||||
| MACRS (Eqpt-7 yr) | 1429 | 2449 | 1749 | 1249 | 892 | 893 | 893 | 446 | |||||||||||||
| Recovery Allowance | 114320 | 195920 | 139920 | 99920 | 71360 | 71440 | 71440 | 35680 | |||||||||||||
| Book Value | 685680 | 489760 | 349840 | 249920 | 178560 | 107120 | 35680 | 0 | |||||||||||||
| After-Tax Salvage Value | |||||||||||||||||||||
| Salvage Value | 20 | 160000 | |||||||||||||||||||
| Book Value (Year 8) | 0 | ||||||||||||||||||||
| Capital GainLoss | 160000 | ||||||||||||||||||||
| Taxes | 54400 | ||||||||||||||||||||
| Net SV (SV-Taxes) | 105600 | ||||||||||||||||||||
| Required Net Working Capital Investment | |||||||||||||||||||||
| 20000 | 54000 | 90000 | 108000 | 107250 | 99000 | 82500 | 66000 | 49500 | |||||||||||||
| YEAR | 0 | 1 | 2 | 3 | 4 | 5 | 6 | 7 | 8 | ||||||||||||
| Initial Investment | |||||||||||||||||||||
| Equipment Cost | (800000) | ||||||||||||||||||||
| Sales | 360000 | 600000 | 720000 | 715000 | 660000 | 550000 | 440000 | 330000 | |||||||||||||
| Variable Costs | 180000 | 300000 | 360000 | 390000 | 360000 | 300000 | 240000 | 180000 | |||||||||||||
| Fixed Costs | 25000 | 25000 | 25000 | 25000 | 25000 | 25000 | 25000 | 25000 | |||||||||||||
| Depreciation (Eqpt)) | 114320 | 195920 | 139920 | 99920 | 71360 | 71440 | 71440 | 35680 | |||||||||||||
| EBT | 40680 | 79080 | 195080 | 200080 | 203640 | 153560 | 103560 | 89320 | |||||||||||||
| Taxes | 13831 | 26887 | 66327 | 68027 | 69238 | 52210 | 35210 | 30369 | |||||||||||||
| Net Operating Income | 26849 | 52193 | 128753 | 132053 | 134402 | 101350 | 68350 | 58951 | |||||||||||||
| Add back Depreciation | 114320 | 195920 | 139920 | 99920 | 71360 | 71440 | 71440 | 35680 | |||||||||||||
| CASH FLOW from Operations | 141169 | 248113 | 268673 | 231973 | 205762 | 172790 | 139790 | 94631 | |||||||||||||
| NWC investment amp Recovery | (20000) | (34000) | (36000) | (18000) | 750 | 8250 | 16500 | 16500 | 66000 | ||||||||||||
| Salvage Value | 105600 | ||||||||||||||||||||
| TOTAL PROJECTED CF | (820000) | 107169 | 212113 | 250673 | 232723 | 214012 | 189290 | 156290 | 266231 | ||||||||||||
| Discounted Cash Flows | (820000) | 93190 | 160388 | 164821 | 133060 | 106402 | 81835 | 58755 | 87031 | ||||||||||||
| Cumulative Cash flows | (820000) | (712831) | (500718) | (250046) | (17323) | 196690 | 385979 | 542269 | 808500 | ||||||||||||
| NPV | $65483 | ||||||||||||||||||||
| IRR | 1724 | ||||||||||||||||||||
| Payback | 408 |
| Depreciation | 5-year Asset | ||||||||
| Year | Beg BV | Depr | Deprec | End BV | |||||
| 1 | $ 1200000 | 2000 | $ 240000 | $ 960000 | |||||
| 2 | $ 960000 | 3200 | $ 384000 | $ 576000 | |||||
| 3 | $ 576000 | 1920 | $ 230400 | $ 345600 | |||||
| 4 | $ 345600 | 1152 | $ 138240 | $ 207360 | |||||
| 5 | $ 207360 | 1152 | $ 138240 | $ 69120 | |||||
| 6 | $ 69120 | 576 | $ 69120 | $ - 0 | |||||
| 10000 | $ 1200000 | ||||||||
| EOY 5 | $3000 | $221501 | $78499 | ||||||
| EOY 2 | $4000 | $459840 | ($59840) |
| Pro Forma Income Statement | |||||||||
| Year | 0 | 1 | 2 | 3 | |||||
| Sales | 200000 | 200000 | 200000 | ||||||
| Variable Costs | 125000 | 125000 | 125000 | ||||||
| Gross Profit | 75000 | 75000 | 75000 | ||||||
| Fixed Costs | 12000 | 12000 | 12000 | ||||||
| Depreciation | 30000 | 30000 | 30000 | ||||||
| EBIT | 33000 | 33000 | 33000 | ||||||
| Taxes | 11220 | 11220 | 11220 | ||||||
| Net Income | 21780 | 21780 | 21780 | ||||||
| Cash Flows | |||||||||
| Operating Cash Flow | 51780 | 51780 | 51780 | ||||||
| Changes in NWC | -20000 | 20000 | |||||||
| Net Capital Spending | -90000 | ||||||||
| Cash Flow From Assets | -110000 | 51780 | 51780 | 71780 | |||||
| Net Present Value | $1064769 | ||||||||
| IRR | 2576 |
| Pro Forma Income Statements | |||||||||
| Year | 0 | 1 | 2 | 3 | |||||
| Sales | 200000 | 200000 | 200000 | ||||||
| Variable Costs | 125000 | 125000 | 125000 | ||||||
| Gross Profit | 75000 | 75000 | 75000 | ||||||
| Fixed Costs | 12000 | 12000 | 12000 | ||||||
| Depreciation | 30000 | 30000 | 30000 | ||||||
| EBIT | 33000 | 33000 | 33000 | ||||||
| Taxes | 11220 | 11220 | 11220 | ||||||
| Net Income | 21780 | 21780 | 21780 | ||||||
| Cash Flows | |||||||||
| Operating Cash Flow | 51780 | 51780 | 51780 | ||||||
| Changes in NWC | (20000) | 20000 | |||||||
| Net Capital Spending | (90000) | ||||||||
| Cash Flow From Assets | (110000) | 51780 | 51780 | 71780 | |||||
| Net Present Value | $1064769 | ||||||||
| IRR | 2576 |
| Sensitivity Analysis | |||||||||
| Base | Units | Fixed Cost | |||||||
| Units | 6000 | 5500 | 6000 | ||||||
| Priceunit | $ 80 | 80 | 80 | ||||||
| Variable costunit | $ 60 | 60 | 60 | ||||||
| Fixed costyear | $ 50000 | 50000 | 55000 | ||||||
| Initial investment | $ 200000 | ||||||||
| Depreciated to salvage value of 0 over 5 years | |||||||||
| Deprecyr | $ 40000 | ||||||||
| Tax rate | 34 | ||||||||
| Required Return | 12 | ||||||||
| BASE | UNITS | FC | |||||||
| Units | 6000 | 5500 | 6000 | ||||||
| Priceunit | $ 80 | $ 80 | $ 80 | ||||||
| Variable costunit | $ 60 | $ 60 | $ 60 | ||||||
| Fixed cost | $ 50000 | $ 50000 | $ 55000 | ||||||
| Sales | $ 480000 | $ 440000 | $ 480000 | ||||||
| Variable Cost | 360000 | 330000 | 360000 | ||||||
| Fixed Cost | 50000 | 50000 | 55000 | ||||||
| Depreciation | 40000 | 40000 | 40000 | ||||||
| EBIT | 30000 | 20000 | 25000 | ||||||
| Taxes | 10200 | 6800 | 8500 | ||||||
| Net Income | 19800 | 13200 | 16500 | ||||||
| + Deprec | 40000 | 40000 | 40000 | ||||||
| TOTAL CF | 59800 | 53200 | 56500 | ||||||
| NPV | $ 15566 | $ (8226) | $ 3670 | ||||||
| Change in NPV | -1528 | -764 | |||||||
| Change in Variable | -83 | 100 | |||||||
| SENSITIVITY RATIO | 1834 | -764 | |||||||
| DIRECT | INVERSE | ||||||||
| Sensitivity Ratio = ( Change in NPV) Change in Variable | |||||||||
| Positive = Direct relationship | |||||||||
| Negative = Inverse relationship | |||||||||
| $ (200000) | $ (200000) | $ (200000) | |||||||
| 59800 | 53200 | 56500 | |||||||
| 59800 | 53200 | 56500 | |||||||
| 59800 | 53200 | 56500 | |||||||
| 59800 | 53200 | 56500 | |||||||
| 59800 | 53200 | 56500 | |||||||
| PV | $ 215566 | $ 191774 | $ 203670 | ||||||
| NPV | $ 15566 | $ (8226) | $ 3670 |
| Scenario Analysis | |||||||||
| Base | Lower | Upper | |||||||
| Units | 6000 | 5500 | 6500 | ||||||
| Priceunit | $ 8000 | $ 7500 | $ 8500 | ||||||
| Variable costunit | $ 6000 | $ 5800 | $ 6200 | ||||||
| Fixed costyear | $ 50000 | $ 45000 | $ 55000 | ||||||
| BASE | BEST | WORST | |||||||
| Initial investment | $ 200000 | ||||||||
| Depreciated to salvage value of 0 over 5 years | |||||||||
| Deprecyr | $ 40000 | ||||||||
| Project Life | 5 | years | |||||||
| Tax rate | 34 | ||||||||
| Required return | 12 | ||||||||
| BASE | WORST | BEST | |||||||
| Units | 6000 | 5500 | 6500 | ||||||
| Priceunit | $ 8000 | $ 7500 | $ 8500 | ||||||
| Variable costunit | $ 6000 | $ 6200 | $ 5800 | ||||||
| Fixed Cost | $ 50000 | $ 55000 | $ 45000 | ||||||
| Sales | $ 480000 | $ 412500 | $ 552500 | ||||||
| Variable Cost | 360000 | 341000 | 377000 | ||||||
| Fixed Cost | 50000 | 55000 | 45000 | ||||||
| Depreciation | 40000 | 40000 | 40000 | ||||||
| EBIT | 30000 | (23500) | 90500 | ||||||
| Taxes | 10200 | (7990) | 30770 | ||||||
| Net Income | 19800 | (15510) | 59730 | ||||||
| + Deprec | 40000 | 40000 | 40000 | ||||||
| TOTAL CF | 59800 | 24490 | 99730 | ||||||
| NPV | 15566 | (111719) | 159504 | ||||||
| IRR | 151 | -144 | 409 | ||||||
| NOTE | Note in WORST CASE tax credit for negative earnings | ||||||||
| $ (200000) | $ (200000) | $ (200000) | |||||||
| 59800 | 24490 | 99730 | |||||||
| 59800 | 24490 | 99730 | |||||||
| 59800 | 24490 | 99730 | |||||||
| 59800 | 24490 | 99730 | |||||||
| 59800 | 24490 | 99730 | |||||||
| PV | $215566 | $88281 | $359504 | ||||||
| NPV | 15566 | (111719) | 159504 |
| Majestic Mulch and Compost Company (MMCC) | |||||||||||||||||||||
| YEAR | 0 | 1 | 2 | 3 | 4 | 5 | 6 | 7 | 8 | ||||||||||||
| Background Data | |||||||||||||||||||||
| Unit Sales Estimates | 3000 | 5000 | 6000 | 6500 | 6000 | 5000 | 4000 | 3000 | |||||||||||||
| Variable Cost unit | $ 6000 | ||||||||||||||||||||
| Fixed Costs per year | $ 2500000 | ||||||||||||||||||||
| Sale Price per unit | $ 12000 | $ 12000 | $ 12000 | $ 12000 | $ 11000 | $ 11000 | $ 11000 | $ 11000 | $ 11000 | ||||||||||||
| Tax Rate | 340 | ||||||||||||||||||||
| Required Return on Project | 150 | ||||||||||||||||||||
| Yr 0 NWC | $ 2000000 | ||||||||||||||||||||
| NWC of sales | 15 | ||||||||||||||||||||
| Equipment cost - installed | $ 800000 | ||||||||||||||||||||
| Salvage Value in year 8 | 20 | of equipment cost | |||||||||||||||||||
| Depreciation Calculations | |||||||||||||||||||||
| Equipment Depreciable Base | 800000 | ||||||||||||||||||||
| MACRS (Eqpt-7 yr) | 1429 | 2449 | 1749 | 1249 | 893 | 893 | 893 | 445 | |||||||||||||
| Recovery Allowance | 114320 | 195920 | 139920 | 99920 | 71440 | 71440 | 71440 | 35600 | |||||||||||||
| Book Value | 685680 | 489760 | 349840 | 249920 | 178480 | 107040 | 35600 | 0 | |||||||||||||
| After-Tax Salvage Value | |||||||||||||||||||||
| Salvage Value | 20 | 160000 | |||||||||||||||||||
| Book Value (Year 8) | 0 | ||||||||||||||||||||
| Capital GainLoss | 160000 | ||||||||||||||||||||
| Taxes | 54400 | ||||||||||||||||||||
| Net SV (SV-Taxes) | 105600 | ||||||||||||||||||||
| Required Net Working Capital Investment | |||||||||||||||||||||
| 20000 | 54000 | 90000 | 108000 | 107250 | 99000 | 82500 | 66000 | 49500 | |||||||||||||
| YEAR | 0 | 1 | 2 | 3 | 4 | 5 | 6 | 7 | 8 | ||||||||||||
| Initial Investment | |||||||||||||||||||||
| Equipment Cost | (800000) | ||||||||||||||||||||
| Sales | 360000 | 600000 | 720000 | 715000 | 660000 | 550000 | 440000 | 330000 | |||||||||||||
| Variable Costs | 180000 | 300000 | 360000 | 390000 | 360000 | 300000 | 240000 | 180000 | |||||||||||||
| Fixed Costs | 25000 | 25000 | 25000 | 25000 | 25000 | 25000 | 25000 | 25000 | |||||||||||||
| Depreciation (Eqpt)) | 114320 | 195920 | 139920 | 99920 | 71440 | 71440 | 71440 | 35600 | |||||||||||||
| EBT | 40680 | 79080 | 195080 | 200080 | 203560 | 153560 | 103560 | 89400 | |||||||||||||
| Taxes | 13831 | 26887 | 66327 | 68027 | 69210 | 52210 | 35210 | 30396 | |||||||||||||
| Net Operating Income | 26849 | 52193 | 128753 | 132053 | 134350 | 101350 | 68350 | 59004 | |||||||||||||
| Add back Depreciation | 114320 | 195920 | 139920 | 99920 | 71440 | 71440 | 71440 | 35600 | |||||||||||||
| CASH FLOW from Operations | 141169 | 248113 | 268673 | 231973 | 205790 | 172790 | 139790 | 94604 | |||||||||||||
| NWC investment amp Recovery | (20000) | (34000) | (36000) | (18000) | 750 | 8250 | 16500 | 16500 | 66000 | ||||||||||||
| Salvage Value | 105600 | ||||||||||||||||||||
| TOTAL PROJECTED CF | (820000) | 107169 | 212113 | 250673 | 232723 | 214040 | 189290 | 156290 | 266204 | ||||||||||||
| Discounted Cash Flows | (820000) | 93190 | 160388 | 164821 | 133060 | 106416 | 81835 | 58755 | 87023 | ||||||||||||
| NPV | $ 65488 | ||||||||||||||||||||
| IRR | 1724 |
| Depreciation | 5-year Asset | ||||||||
| Year | Beg BV | Depr | Deprec | End BV | |||||
| 1 | $ 1200000 | 2000 | $ 240000 | $ 960000 | |||||
| 2 | $ 960000 | 3200 | $ 384000 | $ 576000 | |||||
| 3 | $ 576000 | 1920 | $ 230400 | $ 345600 | |||||
| 4 | $ 345600 | 1152 | $ 138240 | $ 207360 | |||||
| 5 | $ 207360 | 1152 | $ 138240 | $ 69120 | |||||
| 6 | $ 69120 | 576 | $ 69120 | $ - 0 | |||||
| 10000 | $ 1200000 | ||||||||
| EOY 5 | $3000 | $221501 | $78499 | ||||||
| EOY 2 | $4000 | $459840 | ($59840) |
| Pro Forma Income Statement | |||||||||
| Year | 0 | 1 | 2 | 3 | |||||
| Sales | 200000 | 200000 | 200000 | ||||||
| Variable Costs | 125000 | 125000 | 125000 | ||||||
| Gross Profit | 75000 | 75000 | 75000 | ||||||
| Fixed Costs | 12000 | 12000 | 12000 | ||||||
| Depreciation | 30000 | 30000 | 30000 | ||||||
| EBIT | 33000 | 33000 | 33000 | ||||||
| Taxes | 11220 | 11220 | 11220 | ||||||
| Net Income | 21780 | 21780 | 21780 | ||||||
| Cash Flows | |||||||||
| Operating Cash Flow | 51780 | 51780 | 51780 | ||||||
| Changes in NWC | -20000 | 20000 | |||||||
| Net Capital Spending | -90000 | ||||||||
| Cash Flow From Assets | -110000 | 51780 | 51780 | 71780 | |||||
| Net Present Value | $1064769 | ||||||||
| IRR | 2576 |
| Pro Forma Income Statements | |||||||||
| Year | 0 | 1 | 2 | 3 | |||||
| Sales | 200000 | 200000 | 200000 | ||||||
| Variable Costs | 125000 | 125000 | 125000 | ||||||
| Gross Profit | 75000 | 75000 | 75000 | ||||||
| Fixed Costs | 12000 | 12000 | 12000 | ||||||
| Depreciation | 30000 | 30000 | 30000 | ||||||
| EBIT | 33000 | 33000 | 33000 | ||||||
| Taxes | 11220 | 11220 | 11220 | ||||||
| Net Income | 21780 | 21780 | 21780 | ||||||
| Cash Flows | |||||||||
| Operating Cash Flow | 51780 | 51780 | 51780 | ||||||
| Changes in NWC | (20000) | 20000 | |||||||
| Net Capital Spending | (90000) | ||||||||
| Cash Flow From Assets | (110000) | 51780 | 51780 | 71780 | |||||
| Net Present Value | $1064769 | ||||||||
| IRR | 2576 |
| Sensitivity Analysis | |||||||||
| Base | Units | Fixed Cost | |||||||
| Units | 6000 | 5500 | 6000 | ||||||
| Priceunit | $ 80 | 80 | 80 | ||||||
| Variable costunit | $ 60 | 60 | 60 | ||||||
| Fixed costyear | $ 50000 | 50000 | 55000 | ||||||
| Initial investment | $ 200000 | ||||||||
| Depreciated to salvage value of 0 over 5 years | |||||||||
| Deprecyr | $ 40000 | ||||||||
| Tax rate | 34 | ||||||||
| Required Return | 12 | ||||||||
| BASE | UNITS | FC | |||||||
| Units | 6000 | 5500 | 6000 | ||||||
| Priceunit | $ 80 | $ 80 | $ 80 | ||||||
| Variable costunit | $ 60 | $ 60 | $ 60 | ||||||
| Fixed cost | $ 50000 | $ 50000 | $ 55000 | ||||||
| Sales | $ 480000 | $ 440000 | $ 480000 | ||||||
| Variable Cost | 360000 | 330000 | 360000 | ||||||
| Fixed Cost | 50000 | 50000 | 55000 | ||||||
| Depreciation | 40000 | 40000 | 40000 | ||||||
| EBIT | 30000 | 20000 | 25000 | ||||||
| Taxes | 10200 | 6800 | 8500 | ||||||
| Net Income | 19800 | 13200 | 16500 | ||||||
| + Deprec | 40000 | 40000 | 40000 | ||||||
| TOTAL CF | 59800 | 53200 | 56500 | ||||||
| NPV | $ 15566 | $ (8226) | $ 3670 | ||||||
| Change in NPV | -1528 | -764 | |||||||
| Change in Variable | -83 | 100 | |||||||
| SENSITIVITY RATIO | 1834 | -764 | |||||||
| DIRECT | INVERSE | ||||||||
| Sensitivity Ratio = ( Change in NPV) Change in Variable | |||||||||
| Positive = Direct relationship | |||||||||
| Negative = Inverse relationship | |||||||||
| $ (200000) | $ (200000) | $ (200000) | |||||||
| 59800 | 53200 | 56500 | |||||||
| 59800 | 53200 | 56500 | |||||||
| 59800 | 53200 | 56500 | |||||||
| 59800 | 53200 | 56500 | |||||||
| 59800 | 53200 | 56500 | |||||||
| PV | $ 215566 | $ 191774 | $ 203670 | ||||||
| NPV | $ 15566 | $ (8226) | $ 3670 |
| Scenario Analysis | |||||||||
| Base | Lower | Upper | |||||||
| Units | 6000 | 5500 | 6500 | ||||||
| Priceunit | $ 8000 | $ 7500 | $ 8500 | ||||||
| Variable costunit | $ 6000 | $ 5800 | $ 6200 | ||||||
| Fixed costyear | $ 50000 | $ 45000 | $ 55000 | ||||||
| BASE | BEST | WORST | |||||||
| Initial investment | $ 200000 | ||||||||
| Depreciated to salvage value of 0 over 5 years | |||||||||
| Deprecyr | $ 40000 | ||||||||
| Project Life | 5 | years | |||||||
| Tax rate | 34 | ||||||||
| Required return | 12 | ||||||||
| BASE | WORST | BEST | |||||||
| Units | 6000 | 5500 | 6500 | ||||||
| Priceunit | $ 8000 | $ 7500 | $ 8500 | ||||||
| Variable costunit | $ 6000 | $ 6200 | $ 5800 | ||||||
| Fixed Cost | $ 50000 | $ 55000 | $ 45000 | ||||||
| Sales | $ 480000 | $ 412500 | $ 552500 | ||||||
| Variable Cost | 360000 | 341000 | 377000 | ||||||
| Fixed Cost | 50000 | 55000 | 45000 | ||||||
| Depreciation | 40000 | 40000 | 40000 | ||||||
| EBIT | 30000 | (23500) | 90500 | ||||||
| Taxes | 10200 | (7990) | 30770 | ||||||
| Net Income | 19800 | (15510) | 59730 | ||||||
| + Deprec | 40000 | 40000 | 40000 | ||||||
| TOTAL CF | 59800 | 24490 | 99730 | ||||||
| NPV | 15566 | (111719) | 159504 | ||||||
| IRR | 151 | -144 | 409 | ||||||
| NOTE | Note in WORST CASE tax credit for negative earnings | ||||||||
| $ (200000) | $ (200000) | $ (200000) | |||||||
| 59800 | 24490 | 99730 | |||||||
| 59800 | 24490 | 99730 | |||||||
| 59800 | 24490 | 99730 | |||||||
| 59800 | 24490 | 99730 | |||||||
| 59800 | 24490 | 99730 | |||||||
| PV | $215566 | $88281 | $359504 | ||||||
| NPV | 15566 | (111719) | 159504 |
| Majestic Mulch and Compost Company (MMCC) | |||||||||||||||||||||
| YEAR | 0 | 1 | 2 | 3 | 4 | 5 | 6 | 7 | 8 | ||||||||||||
| Background Data | |||||||||||||||||||||
| Unit Sales Estimates | 3000 | 5000 | 6000 | 6500 | 6000 | 5000 | 4000 | 3000 | |||||||||||||
| Variable Cost unit | $ 6000 | ||||||||||||||||||||
| Fixed Costs per year | $ 2500000 | ||||||||||||||||||||
| Sale Price per unit | $ 12000 | $ 12000 | $ 12000 | $ 12000 | $ 11000 | $ 11000 | $ 11000 | $ 11000 | $ 11000 | ||||||||||||
| Tax Rate | 340 | ||||||||||||||||||||
| Required Return on Project | 150 | ||||||||||||||||||||
| Yr 0 NWC | $ 2000000 | ||||||||||||||||||||
| NWC of sales | 15 | ||||||||||||||||||||
| Equipment cost - installed | $ 800000 | ||||||||||||||||||||
| Salvage Value in year 8 | 20 | of equipment cost | |||||||||||||||||||
| Depreciation Calculations | |||||||||||||||||||||
| Equipment Depreciable Base | 800000 | ||||||||||||||||||||
| MACRS (Eqpt-7 yr) | 1429 | 2449 | 1749 | 1249 | 893 | 893 | 893 | 445 | |||||||||||||
| Recovery Allowance | 114320 | 195920 | 139920 | 99920 | 71440 | 71440 | 71440 | 35600 | |||||||||||||
| Book Value | 685680 | 489760 | 349840 | 249920 | 178480 | 107040 | 35600 | 0 | |||||||||||||
| After-Tax Salvage Value | |||||||||||||||||||||
| Salvage Value | 20 | 160000 | |||||||||||||||||||
| Book Value (Year 8) | 0 | ||||||||||||||||||||
| Capital GainLoss | 160000 | ||||||||||||||||||||
| Taxes | 54400 | ||||||||||||||||||||
| Net SV (SV-Taxes) | 105600 | ||||||||||||||||||||
| Required Net Working Capital Investment | |||||||||||||||||||||
| 20000 | 54000 | 90000 | 108000 | 107250 | 99000 | 82500 | 66000 | 49500 | |||||||||||||
| YEAR | 0 | 1 | 2 | 3 | 4 | 5 | 6 | 7 | 8 | ||||||||||||
| Initial Investment | |||||||||||||||||||||
| Equipment Cost | (800000) | ||||||||||||||||||||
| Sales | 360000 | 600000 | 720000 | 715000 | 660000 | 550000 | 440000 | 330000 | |||||||||||||
| Variable Costs | 180000 | 300000 | 360000 | 390000 | 360000 | 300000 | 240000 | 180000 | |||||||||||||
| Fixed Costs | 25000 | 25000 | 25000 | 25000 | 25000 | 25000 | 25000 | 25000 | |||||||||||||
| Depreciation (Eqpt)) | 114320 | 195920 | 139920 | 99920 | 71440 | 71440 | 71440 | 35600 | |||||||||||||
| EBT | 40680 | 79080 | 195080 | 200080 | 203560 | 153560 | 103560 | 89400 | |||||||||||||
| Taxes | 13831 | 26887 | 66327 | 68027 | 69210 | 52210 | 35210 | 30396 | |||||||||||||
| Net Operating Income | 26849 | 52193 | 128753 | 132053 | 134350 | 101350 | 68350 | 59004 | |||||||||||||
| Add back Depreciation | 114320 | 195920 | 139920 | 99920 | 71440 | 71440 | 71440 | 35600 | |||||||||||||
| CASH FLOW from Operations | 141169 | 248113 | 268673 | 231973 | 205790 | 172790 | 139790 | 94604 | |||||||||||||
| NWC investment amp Recovery | (20000) | (34000) | (36000) | (18000) | 750 | 8250 | 16500 | 16500 | 66000 | ||||||||||||
| Salvage Value | 105600 | ||||||||||||||||||||
| TOTAL PROJECTED CF | (820000) | 107169 | 212113 | 250673 | 232723 | 214040 | 189290 | 156290 | 266204 | ||||||||||||
| Discounted Cash Flows | (820000) | 93190 | 160388 | 164821 | 133060 | 106416 | 81835 | 58755 | 87023 | ||||||||||||
| NPV | $ 65488 | ||||||||||||||||||||
| IRR | 1724 |
| Depreciation | 5-year Asset | ||||||||
| Year | Beg BV | Depr | Deprec | End BV | |||||
| 1 | $ 1200000 | 2000 | $ 240000 | $ 960000 | |||||
| 2 | $ 960000 | 3200 | $ 384000 | $ 576000 | |||||
| 3 | $ 576000 | 1920 | $ 230400 | $ 345600 | |||||
| 4 | $ 345600 | 1152 | $ 138240 | $ 207360 | |||||
| 5 | $ 207360 | 1152 | $ 138240 | $ 69120 | |||||
| 6 | $ 69120 | 576 | $ 69120 | $ - 0 | |||||
| 10000 | $ 1200000 | ||||||||
| EOY 5 | $3000 | $221501 | $78499 | ||||||
| EOY 2 | $4000 | $459840 | ($59840) |
| Pro Forma Income Statement | |||||||||
| Year | 0 | 1 | 2 | 3 | |||||
| Sales | 200000 | 200000 | 200000 | ||||||
| Variable Costs | 125000 | 125000 | 125000 | ||||||
| Gross Profit | 75000 | 75000 | 75000 | ||||||
| Fixed Costs | 12000 | 12000 | 12000 | ||||||
| Depreciation | 30000 | 30000 | 30000 | ||||||
| EBIT | 33000 | 33000 | 33000 | ||||||
| Taxes | 11220 | 11220 | 11220 | ||||||
| Net Income | 21780 | 21780 | 21780 | ||||||
| Cash Flows | |||||||||
| Operating Cash Flow | 51780 | 51780 | 51780 | ||||||
| Changes in NWC | -20000 | 20000 | |||||||
| Net Capital Spending | -90000 | ||||||||
| Cash Flow From Assets | -110000 | 51780 | 51780 | 71780 | |||||
| Net Present Value | $1064769 | ||||||||
| IRR | 2576 |
| Pro Forma Income Statements | |||||||||
| Year | 0 | 1 | 2 | 3 | |||||
| Sales | 200000 | 200000 | 200000 | ||||||
| Variable Costs | 125000 | 125000 | 125000 | ||||||
| Gross Profit | 75000 | 75000 | 75000 | ||||||
| Fixed Costs | 12000 | 12000 | 12000 | ||||||
| Depreciation | 30000 | 30000 | 30000 | ||||||
| EBIT | 33000 | 33000 | 33000 | ||||||
| Taxes | 11220 | 11220 | 11220 | ||||||
| Net Income | 21780 | 21780 | 21780 | ||||||
| Cash Flows | |||||||||
| Operating Cash Flow | 51780 | 51780 | 51780 | ||||||
| Changes in NWC | (20000) | 20000 | |||||||
| Net Capital Spending | (90000) | ||||||||
| Cash Flow From Assets | (110000) | 51780 | 51780 | 71780 | |||||
| Net Present Value | $1064769 | ||||||||
| IRR | 2576 |
| Sensitivity Analysis | |||||||||
| Base | Units | Fixed Cost | |||||||
| Units | 6000 | 5500 | 6000 | ||||||
| Priceunit | $ 80 | 80 | 80 | ||||||
| Variable costunit | $ 60 | 60 | 60 | ||||||
| Fixed costyear | $ 50000 | 50000 | 55000 | ||||||
| Initial investment | $ 200000 | ||||||||
| Depreciated to salvage value of 0 over 5 years | |||||||||
| Deprecyr | $ 40000 | ||||||||
| Tax rate | 34 | ||||||||
| Required Return | 12 | ||||||||
| BASE | UNITS | FC | |||||||
| Units | 6000 | 5500 | 6000 | ||||||
| Priceunit | $ 80 | $ 80 | $ 80 | ||||||
| Variable costunit | $ 60 | $ 60 | $ 60 | ||||||
| Fixed cost | $ 50000 | $ 50000 | $ 55000 | ||||||
| Sales | $ 480000 | $ 440000 | $ 480000 | ||||||
| Variable Cost | 360000 | 330000 | 360000 | ||||||
| Fixed Cost | 50000 | 50000 | 55000 | ||||||
| Depreciation | 40000 | 40000 | 40000 | ||||||
| EBIT | 30000 | 20000 | 25000 | ||||||
| Taxes | 10200 | 6800 | 8500 | ||||||
| Net Income | 19800 | 13200 | 16500 | ||||||
| + Deprec | 40000 | 40000 | 40000 | ||||||
| TOTAL CF | 59800 | 53200 | 56500 | ||||||
| NPV | $ 15566 | $ (8226) | $ 3670 | ||||||
| Change in NPV | -1528 | -764 | |||||||
| Change in Variable | -83 | 100 | |||||||
| SENSITIVITY RATIO | 1834 | -764 | |||||||
| DIRECT | INVERSE | ||||||||
| Sensitivity Ratio = ( Change in NPV) Change in Variable | |||||||||
| Positive = Direct relationship | |||||||||
| Negative = Inverse relationship | |||||||||
| $ (200000) | $ (200000) | $ (200000) | |||||||
| 59800 | 53200 | 56500 | |||||||
| 59800 | 53200 | 56500 | |||||||
| 59800 | 53200 | 56500 | |||||||
| 59800 | 53200 | 56500 | |||||||
| 59800 | 53200 | 56500 | |||||||
| PV | $ 215566 | $ 191774 | $ 203670 | ||||||
| NPV | $ 15566 | $ (8226) | $ 3670 |
| Scenario Analysis | |||||||||
| Base | Lower | Upper | |||||||
| Units | 6000 | 5500 | 6500 | ||||||
| Priceunit | $ 8000 | $ 7500 | $ 8500 | ||||||
| Variable costunit | $ 6000 | $ 5800 | $ 6200 | ||||||
| Fixed costyear | $ 50000 | $ 45000 | $ 55000 | ||||||
| BASE | BEST | WORST | |||||||
| Initial investment | $ 200000 | ||||||||
| Depreciated to salvage value of 0 over 5 years | |||||||||
| Deprecyr | $ 40000 | ||||||||
| Project Life | 5 | years | |||||||
| Tax rate | 34 | ||||||||
| Required return | 12 | ||||||||
| BASE | WORST | BEST | |||||||
| Units | 6000 | 5500 | 6500 | ||||||
| Priceunit | $ 8000 | $ 7500 | $ 8500 | ||||||
| Variable costunit | $ 6000 | $ 6200 | $ 5800 | ||||||
| Fixed Cost | $ 50000 | $ 55000 | $ 45000 | ||||||
| Sales | $ 480000 | $ 412500 | $ 552500 | ||||||
| Variable Cost | 360000 | 341000 | 377000 | ||||||
| Fixed Cost | 50000 | 55000 | 45000 | ||||||
| Depreciation | 40000 | 40000 | 40000 | ||||||
| EBIT | 30000 | (23500) | 90500 | ||||||
| Taxes | 10200 | (7990) | 30770 | ||||||
| Net Income | 19800 | (15510) | 59730 | ||||||
| + Deprec | 40000 | 40000 | 40000 | ||||||
| TOTAL CF | 59800 | 24490 | 99730 | ||||||
| NPV | 15566 | (111719) | 159504 | ||||||
| IRR | 151 | -144 | 409 | ||||||
| NOTE | Note in WORST CASE tax credit for negative earnings | ||||||||
| $ (200000) | $ (200000) | $ (200000) | |||||||
| 59800 | 24490 | 99730 | |||||||
| 59800 | 24490 | 99730 | |||||||
| 59800 | 24490 | 99730 | |||||||
| 59800 | 24490 | 99730 | |||||||
| 59800 | 24490 | 99730 | |||||||
| PV | $215566 | $88281 | $359504 | ||||||
| NPV | 15566 | (111719) | 159504 |
| Majestic Mulch and Compost Company (MMCC) | |||||||||||||||||||||
| YEAR | 0 | 1 | 2 | 3 | 4 | 5 | 6 | 7 | 8 | ||||||||||||
| Background Data | |||||||||||||||||||||
| Unit Sales Estimates | 3000 | 5000 | 6000 | 6500 | 6000 | 5000 | 4000 | 3000 | |||||||||||||
| Variable Cost unit | $ 6000 | ||||||||||||||||||||
| Fixed Costs per year | $ 2500000 | ||||||||||||||||||||
| Sale Price per unit | $ 12000 | $ 12000 | $ 12000 | $ 12000 | $ 11000 | $ 11000 | $ 11000 | $ 11000 | $ 11000 | ||||||||||||
| Tax Rate | 340 | ||||||||||||||||||||
| Required Return on Project | 150 | ||||||||||||||||||||
| Yr 0 NWC | $ 2000000 | ||||||||||||||||||||
| NWC of sales | 15 | ||||||||||||||||||||
| Equipment cost - installed | $ 800000 | ||||||||||||||||||||
| Salvage Value in year 8 | 20 | of equipment cost | |||||||||||||||||||
| Depreciation Calculations | |||||||||||||||||||||
| Equipment Depreciable Base | 800000 | ||||||||||||||||||||
| MACRS (Eqpt-7 yr) | 1429 | 2449 | 1749 | 1249 | 893 | 893 | 893 | 445 | |||||||||||||
| Recovery Allowance | 114320 | 195920 | 139920 | 99920 | 71440 | 71440 | 71440 | 35600 | |||||||||||||
| Book Value | 685680 | 489760 | 349840 | 249920 | 178480 | 107040 | 35600 | 0 | |||||||||||||
| After-Tax Salvage Value | |||||||||||||||||||||
| Salvage Value | 20 | 160000 | |||||||||||||||||||
| Book Value (Year 8) | 0 | ||||||||||||||||||||
| Capital GainLoss | 160000 | ||||||||||||||||||||
| Taxes | 54400 | ||||||||||||||||||||
| Net SV (SV-Taxes) | 105600 | ||||||||||||||||||||
| Required Net Working Capital Investment | |||||||||||||||||||||
| 20000 | 54000 | 90000 | 108000 | 107250 | 99000 | 82500 | 66000 | 49500 | |||||||||||||
| YEAR | 0 | 1 | 2 | 3 | 4 | 5 | 6 | 7 | 8 | ||||||||||||
| Initial Investment | |||||||||||||||||||||
| Equipment Cost | (800000) | ||||||||||||||||||||
| Sales | 360000 | 600000 | 720000 | 715000 | 660000 | 550000 | 440000 | 330000 | |||||||||||||
| Variable Costs | 180000 | 300000 | 360000 | 390000 | 360000 | 300000 | 240000 | 180000 | |||||||||||||
| Fixed Costs | 25000 | 25000 | 25000 | 25000 | 25000 | 25000 | 25000 | 25000 | |||||||||||||
| Depreciation (Eqpt)) | 114320 | 195920 | 139920 | 99920 | 71440 | 71440 | 71440 | 35600 | |||||||||||||
| EBT | 40680 | 79080 | 195080 | 200080 | 203560 | 153560 | 103560 | 89400 | |||||||||||||
| Taxes | 13831 | 26887 | 66327 | 68027 | 69210 | 52210 | 35210 | 30396 | |||||||||||||
| Net Operating Income | 26849 | 52193 | 128753 | 132053 | 134350 | 101350 | 68350 | 59004 | |||||||||||||
| Add back Depreciation | 114320 | 195920 | 139920 | 99920 | 71440 | 71440 | 71440 | 35600 | |||||||||||||
| CASH FLOW from Operations | 141169 | 248113 | 268673 | 231973 | 205790 | 172790 | 139790 | 94604 | |||||||||||||
| NWC investment amp Recovery | (20000) | (34000) | (36000) | (18000) | 750 | 8250 | 16500 | 16500 | 66000 | ||||||||||||
| Salvage Value | 105600 | ||||||||||||||||||||
| TOTAL PROJECTED CF | (820000) | 107169 | 212113 | 250673 | 232723 | 214040 | 189290 | 156290 | 266204 | ||||||||||||
| Discounted Cash Flows | (820000) | 93190 | 160388 | 164821 | 133060 | 106416 | 81835 | 58755 | 87023 | ||||||||||||
| NPV | $ 65488 | ||||||||||||||||||||
| IRR | 1724 |
| Depreciation | 5-year Asset | ||||||||
| Year | Beg BV | Depr | Deprec | End BV | |||||
| 1 | $ 1200000 | 2000 | $ 240000 | $ 960000 | |||||
| 2 | $ 960000 | 3200 | $ 384000 | $ 576000 | |||||
| 3 | $ 576000 | 1920 | $ 230400 | $ 345600 | |||||
| 4 | $ 345600 | 1152 | $ 138240 | $ 207360 | |||||
| 5 | $ 207360 | 1152 | $ 138240 | $ 69120 | |||||
| 6 | $ 69120 | 576 | $ 69120 | $ - 0 | |||||
| 10000 | $ 1200000 | ||||||||
| EOY 5 | $3000 | $221501 | $78499 | ||||||
| EOY 2 | $4000 | $459840 | ($59840) |
| Pro Forma Income Statement | |||||||||
| Year | 0 | 1 | 2 | 3 | |||||
| Sales | 200000 | 200000 | 200000 | ||||||
| Variable Costs | 125000 | 125000 | 125000 | ||||||
| Gross Profit | 75000 | 75000 | 75000 | ||||||
| Fixed Costs | 12000 | 12000 | 12000 | ||||||
| Depreciation | 30000 | 30000 | 30000 | ||||||
| EBIT | 33000 | 33000 | 33000 | ||||||
| Taxes | 11220 | 11220 | 11220 | ||||||
| Net Income | 21780 | 21780 | 21780 | ||||||
| Cash Flows | |||||||||
| Operating Cash Flow | 51780 | 51780 | 51780 | ||||||
| Changes in NWC | -20000 | 20000 | |||||||
| Net Capital Spending | -90000 | ||||||||
| Cash Flow From Assets | -110000 | 51780 | 51780 | 71780 | |||||
| Net Present Value | $1064769 | ||||||||
| IRR | 2576 |
| Depreciation | 5-year Asset | ||||||||
| Year | Beg BV | Depr | Deprec | End BV | |||||
| 1 | $ 1200000 | 2000 | $ 240000 | $ 960000 | |||||
| 2 | $ 960000 | 3200 | $ 384000 | $ 576000 | |||||
| 3 | $ 576000 | 1920 | $ 230400 | $ 345600 | |||||
| 4 | $ 345600 | 1152 | $ 138240 | $ 207360 | |||||
| 5 | $ 207360 | 1152 | $ 138240 | $ 69120 | |||||
| 6 | $ 69120 | 576 | $ 69120 | $ - 0 | |||||
| 10000 | $ 1200000 |
| Depreciation | 5-year Asset | ||||||||
| Year | Beg BV | Depr | Deprec | End BV | |||||
| 1 | $ 1200000 | 2000 | $ 240000 | $ 960000 | |||||
| 2 | $ 960000 | 3200 | $ 384000 | $ 576000 | |||||
| 3 | $ 576000 | 1920 | $ 230400 | $ 345600 | |||||
| 4 | $ 345600 | 1152 | $ 138240 | $ 207360 | |||||
| 5 | $ 207360 | 1152 | $ 138240 | $ 69120 | |||||
| 6 | $ 69120 | 576 | $ 69120 | $ - 0 | |||||
| 10000 | $ 1200000 |