Embed Size (px)
Citation preview
CHAPTER 8
Hot gas path heat transfer characteristics/ active cooling of turbine components
T. Simon1 & J. Piggush2
1Department of Mechanical Engineering, University of Minnesota, USA.2Pratt and Whitney, Inc., USA.
Abstract
Gas turbines play an important role in the lives of all of us. They are instrumental in providing electricity or fuel to our homes and in transportation via aircraft and ships. Despite over 50 years of operation and their current ubiquity, gas turbines continue to evolve, becoming more fuel effi cient, reliable, and durable. With pres-ent emphasis on further improvement in effi ciency and operation with alternative fuels, signifi cant engineering challenges remain. The gas turbine did not come about by virtue of a single, momentous breakthrough, but rather by numerous small advances on many fronts, including heat transfer, aerodynamics, materials, dynamics, lubrication, and fuels. The efforts of tens of thousands of engineers have produced the present, extensive body of knowledge that provides our basis for further development. Given the complexity of the engine, it is quite easy to become overwhelmed when trying to become acquainted with the technology on which it is based. This chapter is offered to help in one aspect of gas turbine tech-nology, the gas path heat transfer within the turbine. It aims fi rst to describe the physics of engine heat transfer by developing from simple ideas an introduction to the complex heat transfer phenomena within. This effort attempts to address how the engineer applies heat transfer tools available in the literature to support designs, which will advance engine life and enhance effi ciency. If successful, the newcomer will establish a foothold in the technology and the more experienced engineer will be reminded of some basic concepts.
1 Introduction
The main objective sought by the gas turbine heat transfer engineer is to pro-vide an airfoil and gas path design, which is both effi cient and can meet the life
www.witpress.com, ISSN 1755-8336 (on-line) WIT Transactions on State of the Art in Science and Engineering, Vol , © 20 WIT Press42 08
doi:10.2495/978-1-84564- - /062 0 08
232 Thermal Engineering in Power Systems
goals. This requires a broad understanding of the system. First, an understanding of the constraints associated with the material to be used must be developed. This information (which is often proprietary and carefully protected) includes such parameters as the material maximum use temperatures associated with oxidation and corrosion life, creep, and thermal–mechanical fatigue (all functions of tem-perature and stress). Given the projected usage and life goals, the designer applies life equations to determine metal temperature limits throughout the airfoil and on the passage walls. The internal cooling and fi lm cooling schemes are designed to maintain the metal temperatures below these limits.
The heat transfer engineer has several tools, which can be applied to provide a cooling scheme that meets the temperature constraints with minimal negative impact on engine aerodynamic and structural performance. These tools generally fall into two broad categories: those that cool the airfoil and endwalls inside and those that reduce the external heat load. Note that with regard to heat transfer from the passage fl ow to the airfoil, the two broad categories have opposite effects on heat transfer. Internal cooling generally increases airfoil surface heat transfer rates, while the external cooling aims to reduce them. They both tend to reduce airfoil and endwall temperatures. The complexity of choices to apply the various tech-niques to be discussed requires that the gas turbine heat transfer engineer has a thorough understanding of the entire heat transfer problem.
Internal cooling schemes generally employ one or more of the following tech-niques: impingement of cooling fl ow upon the wall to be cooled, convective cool-ing by channeling coolant fl ow through passages within the airfoil or endwall, and conduction through pin fi n arrays to augment heat transfer within the solid compo-nents of the airfoil and enhance convection by increasing both fl ow turbulence and fl uid-to-metal contact area. The choices for fl ow conditions and cooling path con-fi gurations associated with the cooling scheme are infl uenced by the pressure of the cooling fl ow supply, the temperature of the coolant fl uid, the heat load distribu-tion, and the stress distribution within the airfoil.
The external heat load may be controlled by one or more of the following meth-ods. First, there is the geometry. Although the shape of the airfoil is generally defi ned by aerodynamic considerations, there are regions, such as the leading and trailing edges, where some improvements may be effected, while maintaining acceptable aerodynamic performance. As necessary to accommodate cooling, the airfoil is thicker than the aerodynamic design engineer would have it. Also, there are thermal barrier coatings (TBCs). These are generally ceramic-based coatings that have low thermal conductivity. They are used to reduce the heat fl ux through the airfoil wall. Finally, fi lm cooling can be applied effectively on the external sur-face of the airfoil and on the endwall to reduce the temperature of the gas fl owing immediately adjacent to the airfoil and endwall surfaces. It should be noted that fi lm cooling injection into the gas path is usually done with an aerodynamic pen-alty. Effective cooling schemes must consider all impacts on the engine design.
Designers quickly realize that airfoil design is truly complex. The internal con-fi guration has a direct infl uence on the external heat load distribution, while the external heat load defi nes what the internal thermal design must accomplish.
www.witpress.com, ISSN 1755-8336 (on-line) WIT Transactions on State of the Art in Science and Engineering, Vol , © 20 WIT Press42 08
Hot Gas Path Heat Transfer Characteristics 233
Finding the fi nal confi guration of the airfoil requires a systematic approach to the analysis; either beginning with the external heat load and then moving into the coolant fl uid (the direction of energy fl ow) or beginning with the internal coolant and then documenting the external heat load (essentially moving in the general direction of the coolant). Although the choice is arbitrary, the discussion herein will move from the inside of the airfoil to the outside. As with any design process, multiple iterations through the analysis are required.
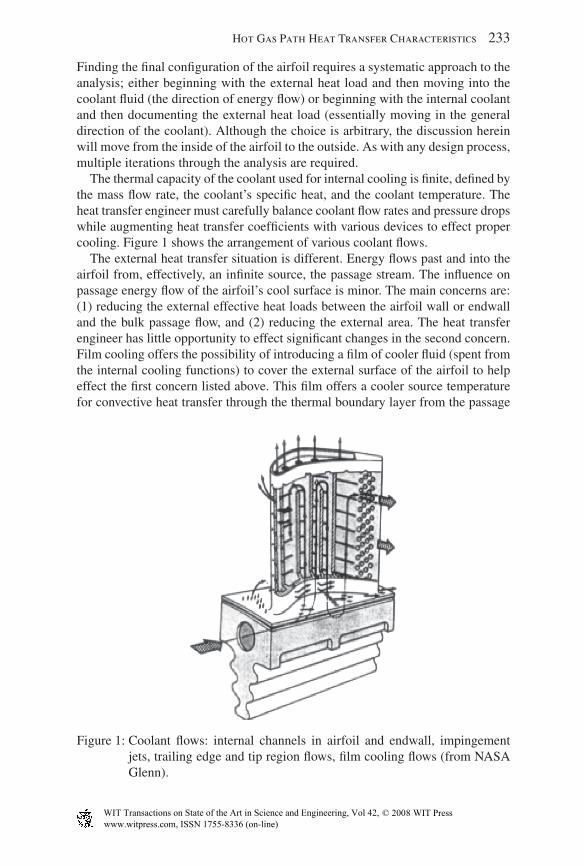
The thermal capacity of the coolant used for internal cooling is fi nite, defi ned by the mass fl ow rate, the coolant’s specifi c heat, and the coolant temperature. The heat transfer engineer must carefully balance coolant fl ow rates and pressure drops while augmenting heat transfer coeffi cients with various devices to effect proper cooling. Figure 1 shows the arrangement of various coolant fl ows.
The external heat transfer situation is different. Energy fl ows past and into the airfoil from, effectively, an infi nite source, the passage stream. The infl uence on passage energy fl ow of the airfoil’s cool surface is minor. The main concerns are: (1) reducing the external effective heat loads between the airfoil wall or endwall and the bulk passage fl ow, and (2) reducing the external area. The heat transfer engineer has little opportunity to effect signifi cant changes in the second concern. Film cooling offers the possibility of introducing a fi lm of cooler fl uid (spent from the internal cooling functions) to cover the external surface of the airfoil to help effect the fi rst concern listed above. This fi lm offers a cooler source temperature for convective heat transfer through the thermal boundary layer from the passage
Figure 1: Coolant fl ows: internal channels in airfoil and endwall, impingement jets, trailing edge and tip region fl ows, fi lm cooling fl ows (from NASA Glenn).
www.witpress.com, ISSN 1755-8336 (on-line) WIT Transactions on State of the Art in Science and Engineering, Vol , © 20 WIT Press42 08
234 Thermal Engineering in Power Systems
fl ow to the surface and, as such, reduces heat fl ux across the convective layer. Film cooling has, over the years, evolved to become a very effective method for reduc-ing the airfoil and endwall surface temperatures. A second opportunity for reduc-ing the surface heat fl ux is to introduce a solid-material coating of high thermal resistivity on the surface. This, in conjunction with the reduced heat fl ux due to fi lm cooling and with effective internal cooling, gives lower temperatures on the airfoil external surfaces and load-bearing regions of the airfoil and endwall.
The internal geometries of high-performance engine airfoils tend to be very complex, incorporating many features designed to strategically cool the internals so that the entire external surface of the airfoil remains generally at a uniform temperature at a level, which is suitable for sustained operation. Complicating the problem is the matter of getting suffi cient coolant supply pressure and in dealing with the thin trailing edge, the exposed tip, and the high heat transfer stagnation region at the leading edge of the airfoil. A rise in convective heat transfer coeffi -cient in a channel fl ow by some devised method or another is generally accompa-nied by a rise in pressure drop, giving a trade-off between enhancement and fl ow rate. Cooling fl ow circuit designs optimize the distribution of cooling effectiveness for a given pressure drop. Manufacturing considerations, such as accommodating component thermal growth and maintaining clearances, as well as controlling cost (usually refl ected in avoiding very fi ne feature sizes) are also taken into consider-ation. Designing a cooling scheme for a high performance engine gas path becomes a delicate balancing act between designs for internal and external heat transfer performance among many other design considerations. Tools include a strong fun-damental understanding of fl ow and heat transfer and a working knowledge of the many other design considerations. Codes and design methods are available to the heat transfer engineer, but a fundamental understanding is paramount.
References, such as the excellent books by Han et al. [1] and Lakshminarayana [2] provide more detail to gas turbine heat transfer design and to turbomachinery design, respectively.
2 Hot gas path heat transfer characteristics
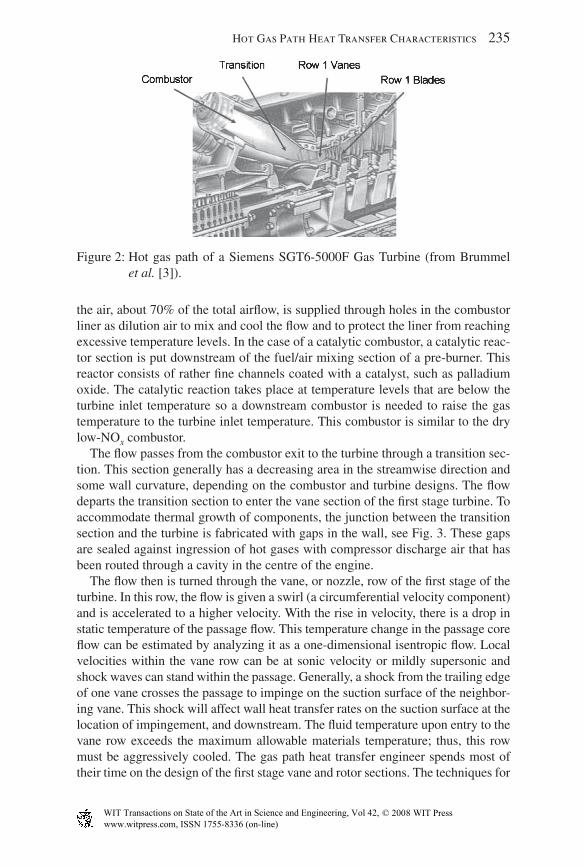
The fl ow entering the turbine gas path has come from the combustor, as shown in Fig. 2. Within the combustor, fuel (either a liquid similar to kerosene or diesel fuel or a gas, such as methane, syngas or high hydrogen and syngas (HSG) processed from coal) and air combine in a highly exothermic reaction that leads to high- temperature products of combustion at the high combustor pressure. A modern combustor called a dry, low-NOx combustor operates lean and without water injec-tion. A second type called a catalytic combustor has a selective catalytic reduction in the exhaust stream. In the low-NOx combustor, excess air is used to maintain the combustor exit temperature at a suitable limit, consistent with the engine design and turbine durability limits. Combustor designs often have a strong swirl in the combustion zone to enhance mixing and shorten the reaction zone. About 30% of the airfl ow enters the primary combustion zone either through a swirl section, or through holes in primary zone of the combustion chamber. The remainder of
www.witpress.com, ISSN 1755-8336 (on-line) WIT Transactions on State of the Art in Science and Engineering, Vol , © 20 WIT Press42 08
Hot Gas Path Heat Transfer Characteristics 235
the air, about 70% of the total airfl ow, is supplied through holes in the combustor liner as dilution air to mix and cool the fl ow and to protect the liner from reaching excessive temperature levels. In the case of a catalytic combustor, a catalytic reac-tor section is put downstream of the fuel/air mixing section of a pre-burner. This reactor consists of rather fi ne channels coated with a catalyst, such as palladium oxide. The catalytic reaction takes place at temperature levels that are below the turbine inlet temperature so a downstream combustor is needed to raise the gas temperature to the turbine inlet temperature. This combustor is similar to the dry low-NOx combustor.
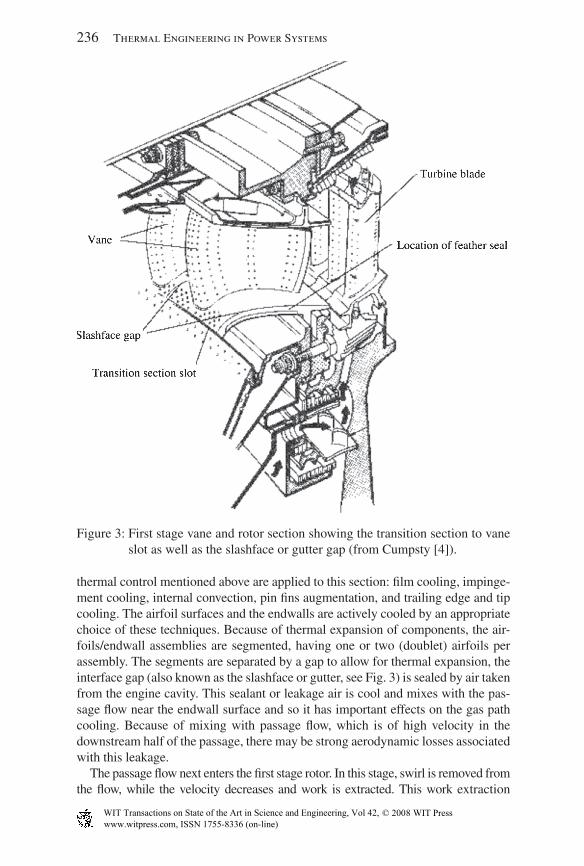
The fl ow passes from the combustor exit to the turbine through a transition sec-tion. This section generally has a decreasing area in the streamwise direction and some wall curvature, depending on the combustor and turbine designs. The fl ow departs the transition section to enter the vane section of the fi rst stage turbine. To accommodate thermal growth of components, the junction between the transition section and the turbine is fabricated with gaps in the wall, see Fig. 3. These gaps are sealed against ingression of hot gases with compressor discharge air that has been routed through a cavity in the centre of the engine.
The fl ow then is turned through the vane, or nozzle, row of the fi rst stage of the turbine. In this row, the fl ow is given a swirl (a circumferential velocity component) and is accelerated to a higher velocity. With the rise in velocity, there is a drop in static temperature of the passage fl ow. This temperature change in the passage core fl ow can be estimated by analyzing it as a one-dimensional isentropic fl ow. Local velocities within the vane row can be at sonic velocity or mildly supersonic and shock waves can stand within the passage. Generally, a shock from the trailing edge of one vane crosses the passage to impinge on the suction surface of the neighbor-ing vane. This shock will affect wall heat transfer rates on the suction surface at the location of impingement, and downstream. The fl uid temperature upon entry to the vane row exceeds the maximum allowable materials temperature; thus, this row must be aggressively cooled. The gas path heat transfer engineer spends most of their time on the design of the fi rst stage vane and rotor sections. The techniques for
Figure 2: Hot gas path of a Siemens SGT6-5000F Gas Turbine (from Brummel et al. [3]).
www.witpress.com, ISSN 1755-8336 (on-line) WIT Transactions on State of the Art in Science and Engineering, Vol , © 20 WIT Press42 08
236 Thermal Engineering in Power Systems
thermal control mentioned above are applied to this section: fi lm cooling, impinge-ment cooling, internal convection, pin fi ns augmentation, and trailing edge and tip cooling. The airfoil surfaces and the endwalls are actively cooled by an appropriate choice of these techniques. Because of thermal expansion of components, the air-foils/endwall assemblies are segmented, having one or two (doublet) airfoils per assembly. The segments are separated by a gap to allow for thermal expansion, the interface gap (also known as the slashface or gutter, see Fig. 3) is sealed by air taken from the engine cavity. This sealant or leakage air is cool and mixes with the pas-sage fl ow near the endwall surface and so it has important effects on the gas path cooling. Because of mixing with passage fl ow, which is of high velocity in the downstream half of the passage, there may be strong aerodynamic losses associated with this leakage.
The passage fl ow next enters the fi rst stage rotor. In this stage, swirl is removed from the fl ow, while the velocity decreases and work is extracted. This work extraction
Figure 3: First stage vane and rotor section showing the transition section to vane slot as well as the slashface or gutter gap (from Cumpsty [4]).
www.witpress.com, ISSN 1755-8336 (on-line) WIT Transactions on State of the Art in Science and Engineering, Vol , © 20 WIT Press42 08
Hot Gas Path Heat Transfer Characteristics 237
results in a drop in stagnation temperature. Though the fl uid velocity drops, the net effect of velocity change and work interaction is a drop in static temperature across the rotor passage (within the passage core fl ow). This stage is rotating; thus, the endwall, or platform, is moving relative to the endwall of the upstream vane row. The fl ow in the near-endwall region thus is skewed as it passes onto a moving platform from a stationary endwall. To accommodate the relative motion of the two rows and the thermal growth of the components, there is a gap between the vane and rotor sections (see Fig. 3). This gap is sealed with airfl ow from the cavity, again with effects on gas path heat transfer and aerodynamic losses. The degree of skewing mentioned above can be modifi ed by introducing the sealant fl ow with pre-swirl. Because of rotation, the fl ow and heat transfer are affected by buoyancy forces within the centripetal force fi eld and by Coriolis forces wherever there is a radial fl ow component, such as with the internal cooling channels.
As the fl ow proceeds through the remainder of the turbine, it passes through a series of vane and rotor components of subsequent stages. In each stage, work is extracted and the total temperature is reduced, while the loss penalty for the system due to cooling air usage continues to accumulate (the coolant air used in a down-stream stage is not available to do work within an upstream stage). The reduction in stage temperature has a signifi cant impact on the choice of materials and cooling schemes. Parts with lower external heat loads (such as the second blade) tend to require less aggressive internal cooling, resulting in reduced thermal gradients within the part material (compared to the gradients in the fi rst stage blade). Also, there are fewer internal ribs used to divide internal cooling passages and, since they tend to remain much cooler than the external walls, they carry much of the centrifu-gal stress load. This reduces the signifi cance of local surface failure modes, such as oxidation, and increases the relative importance of creep, which may be understood as a section average temperature and stress-related failure mode. The change in the life limiting failure mode and the reduced external heat loads may allow the designer to choose less exotic materials or apply less aggressive thermal control, thereby reducing the cost of the part. In the large castings found in industrial gas turbine engines, the greater cost benefi t may be realized by choosing less exotic materials. In the case of the smaller castings found in aircraft engines, machining costs may dominate the part price, driving the designer to choose a less complex cooling scheme. In both cases, the thermal design techniques are those employed in the fi rst stage, but are applied more sparingly in the downstream stages.
Other components demanding thermal design attention in the gas path are support struts and the engine propulsion nozzle (in the case of the aircraft gas turbine). Ther-mal loads on these components are more severe if the engine is equipped with an afterburner, a combustor in the gas path upstream of the nozzle. Our more detailed discussions to follow will be restricted to the vane and rotor stages of the turbine.
2.1 The fi rst stage high pressure turbine vane
The combustor exit turbulence level for a low-NOx style of combustor can be as high as 20–25% [1]. The engine manufacturer generally obtains data on the fl ow fi eld for a particular combustor, as it will depend on the combustor geometry.
www.witpress.com, ISSN 1755-8336 (on-line) WIT Transactions on State of the Art in Science and Engineering, Vol , © 20 WIT Press42 08
238 Thermal Engineering in Power Systems
However, several studies existing in the open literature give an indication of the turbulence levels that may be expected at the exit of the combustor. Measurements that are frequently referred on combustor exit fl ow conditions are by Goldstein et al.
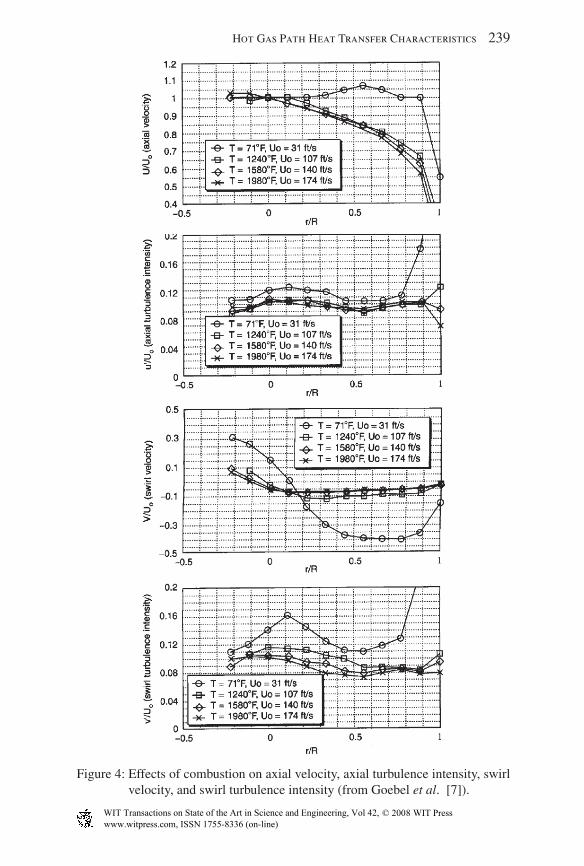
[5], Moss and Oldfi eld [6], Goebel et al. [7], van Fossen and Bunker [8], and Ames et al. [9]. A conclusion of the Moss and Oldfi eld study was that turbulence level and spectra are not strongly affected by whether there is combustion or not, or by the combustion rate when there is combustion. The data of Goebel et al., with and without combustion, include measurements of profi les of turbulence levels and exit temperatures. They found values of around 10–12% with a small but measurable drop in turbulence intensity between the unfi red case with cold inlet fl ow and a fi red case. Their combustor was designed to create signifi cant swirl of the mixing region fl ow (see Fig. 4). The drop in turbulence was more in the swirl component of turbu-lence than in the axial component. The turbulence components were normalized on the axial inlet velocity (no swirl component in the normalizing velocity).
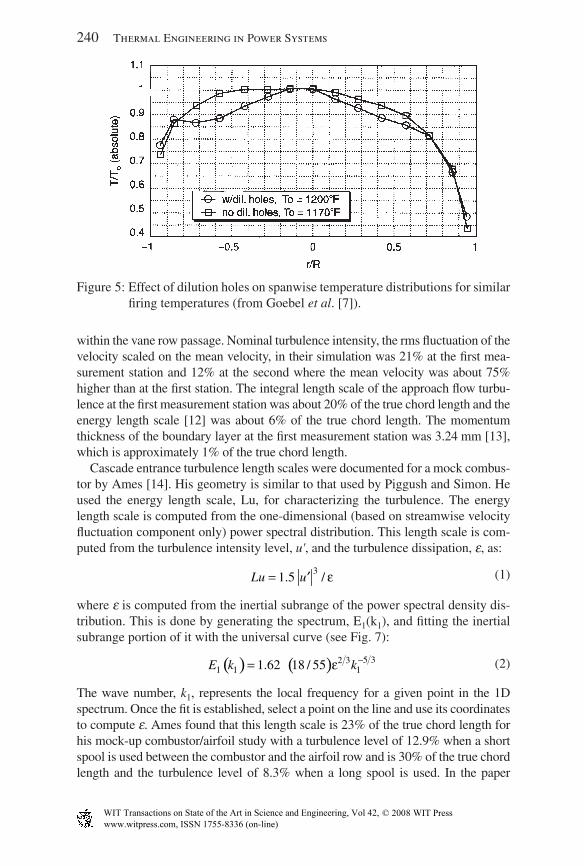
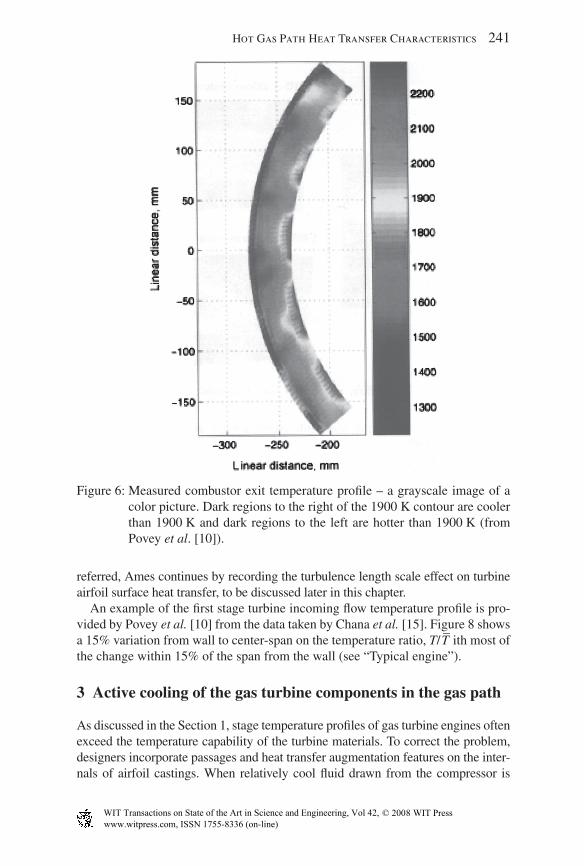
The radial distribution of temperature at the combustor exit is important for the design of the turbine passage endwalls. Over recent years, redesign of the combus-tors to improve NOx emission and increase average turbine inlet temperatures has led to fl atter profi les and, thus, hotter fl uid and higher thermal loading in the near-endwall regions of the turbine. Figure 5 shows representative temperature distribu-tions taken from Goebel et al. Figure 6 taken from Povey et al. [10] shows the radial and circumferential temperature distributions as measured in a military engine.
Next, the fl ow approaching the vane section is discussed. Ames et al. [9] noted that vane inlet turbulence depends on the nature of the fl ow in the core of the com-bustor, including residence time (as discussed above), but it is modifi ed by the inlet contraction ratio of the transition piece between the combustor and the turbine. The cross-sectional area of the duct decreases in the streamwise direction and, thus, the fl ow is accelerated. As a result of this acceleration, the turbulence of the passage fl ow is stretched and partially dissipated and the passage wall boundary layers, which will become the vane passage endwall boundary layers, are thinned. To accommodate thermal growth of components, the passages are assembled with gaps in the wall. These gaps are sealed against ingression of hot gases with fl ow from the cavity of the engine (see Fig. 3). This fl ow will emerge into the passage and thicken the passage wall boundary layers, as it mixes with the passage fl ow. In addition to the sealant fl ow, there may be intentional fi lm cooling fl ows in the approach duct, usually just upstream of the airfoil leading edge plane, which modify the approach fl ow bound-ary layer. Factors that infl uence the approach fl ow boundary layer growth are, com-bustor design, leakage (or sealant) fl ow confi gurations, fi lm cooling fl ows, roughness, streamwise acceleration, free-stream turbulence levels and scales, and surface streamwise curvature. Thus, each design will have different wall boundary layer characteristics. Piggush and Simon [11] simulated a low-NOx combustor and a tran-sition section, in their study of heat transfer in the fi rst stage vane, then documented the fl ow characteristics 1.5 and 0.1 axial chord lengths upstream of the airfoil lead-ing edge plane (before any leakage fl ow is introduced). They noted that the aerody-namic losses associated with the boundary layers on the walls that were to become the passage walls were less than one percent of the total aerodynamic losses encountered
www.witpress.com, ISSN 1755-8336 (on-line) WIT Transactions on State of the Art in Science and Engineering, Vol , © 20 WIT Press42 08
Hot Gas Path Heat Transfer Characteristics 239
Figure 4: Effects of combustion on axial velocity, axial turbulence intensity, swirl velocity, and swirl turbulence intensity (from Goebel et al. [7]).
www.witpress.com, ISSN 1755-8336 (on-line) WIT Transactions on State of the Art in Science and Engineering, Vol , © 20 WIT Press42 08
240 Thermal Engineering in Power Systems
within the vane row passage. Nominal turbulence intensity, the rms fl uctuation of the velocity scaled on the mean velocity, in their simulation was 21% at the fi rst mea-surement station and 12% at the second where the mean velocity was about 75% higher than at the fi rst station. The integral length scale of the approach fl ow turbu-lence at the fi rst measurement station was about 20% of the true chord length and the energy length scale [12] was about 6% of the true chord length. The momentum thickness of the boundary layer at the fi rst measurement station was 3.24 mm [13], which is approximately 1% of the true chord length.
Cascade entrance turbulence length scales were documented for a mock combus-tor by Ames [14]. His geometry is similar to that used by Piggush and Simon. He used the energy length scale, Lu, for characterizing the turbulence. The energy length scale is computed from the one-dimensional (based on streamwise velocity fl uctuation component only) power spectral distribution. This length scale is com-puted from the turbulence intensity level, u', and the turbulence dissipation, ε, as:
3
1.5 /Lu u ε= ′
(1)
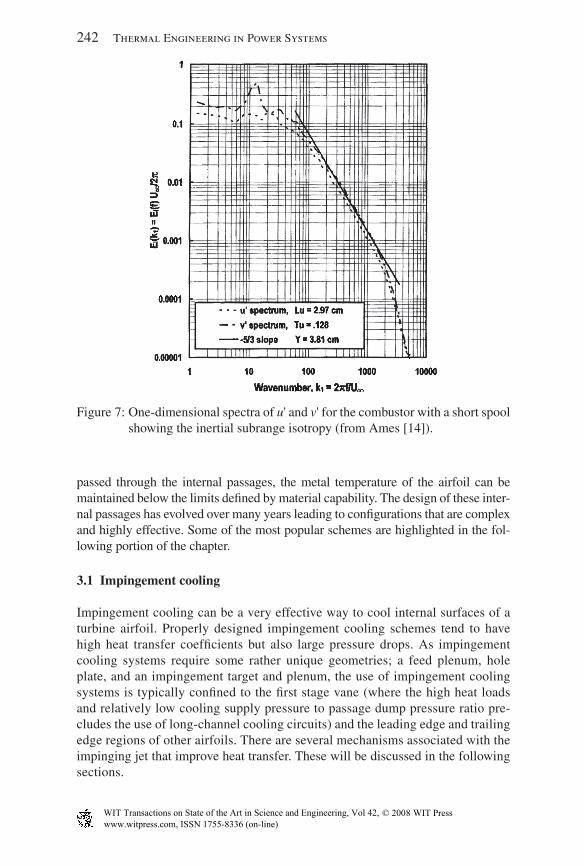
where ε is computed from the inertial subrange of the power spectral density dis-tribution. This is done by generating the spectrum, E1(k1), and fi tting the inertial subrange portion of it with the universal curve (see Fig. 7):
( ) ( ) 5 32 31 1 11.62 18 / 55E k kε −=
(2)
The wave number, k1, represents the local frequency for a given point in the 1D spectrum. Once the fi t is established, select a point on the line and use its coordinates to compute ε. Ames found that this length scale is 23% of the true chord length for his mock-up combustor/airfoil study with a turbulence level of 12.9% when a short spool is used between the combustor and the airfoil row and is 30% of the true chord length and the turbulence level of 8.3% when a long spool is used. In the paper
Figure 5: Effect of dilution holes on spanwise temperature distributions for similar fi ring temperatures (from Goebel et al. [7]).
www.witpress.com, ISSN 1755-8336 (on-line) WIT Transactions on State of the Art in Science and Engineering, Vol , © 20 WIT Press42 08
Hot Gas Path Heat Transfer Characteristics 241
referred, Ames continues by recording the turbulence length scale effect on turbine airfoil surface heat transfer, to be discussed later in this chapter.
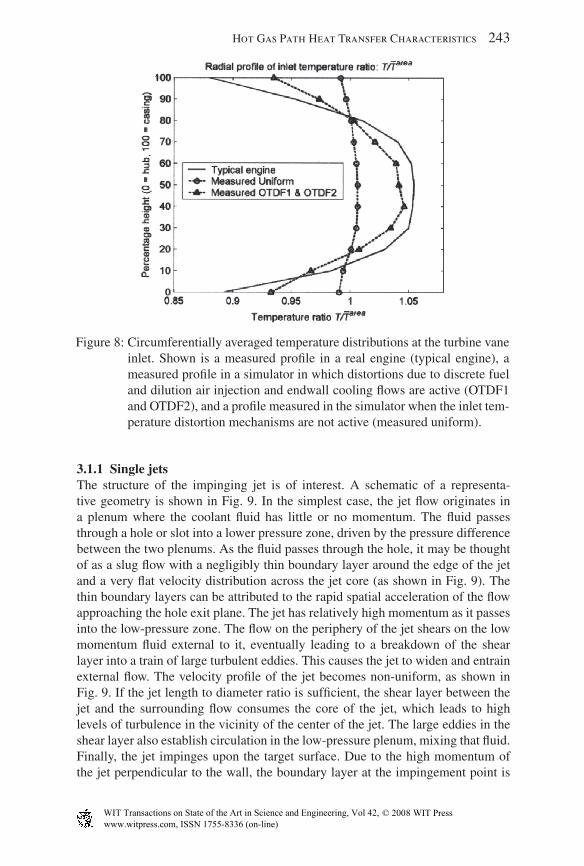
An example of the fi rst stage turbine incoming fl ow temperature profi le is pro-vided by Povey et al. [10] from the data taken by Chana et al. [15]. Figure 8 shows a 15% variation from wall to center-span on the temperature ratio, T/T
– ith most of
the change within 15% of the span from the wall (see “Typical engine”).
3 Active cooling of the gas turbine components in the gas path
As discussed in the Section 1, stage temperature profi les of gas turbine engines often exceed the temperature capability of the turbine materials. To correct the problem, designers incorporate passages and heat transfer augmentation features on the inter-nals of airfoil castings. When relatively cool fl uid drawn from the compressor is
Figure 6: Measured combustor exit temperature profi le – a grayscale image of a color picture. Dark regions to the right of the 1900 K contour are cooler than 1900 K and dark regions to the left are hotter than 1900 K (from Povey et al. [10]).
www.witpress.com, ISSN 1755-8336 (on-line) WIT Transactions on State of the Art in Science and Engineering, Vol , © 20 WIT Press42 08
242 Thermal Engineering in Power Systems
passed through the internal passages, the metal temperature of the airfoil can be maintained below the limits defi ned by material capability. The design of these inter-nal passages has evolved over many years leading to confi gurations that are complex and highly effective. Some of the most popular schemes are highlighted in the fol-lowing portion of the chapter.
3.1 Impingement cooling
Impingement cooling can be a very effective way to cool internal surfaces of a turbine airfoil. Properly designed impingement cooling schemes tend to have high heat transfer coeffi cients but also large pressure drops. As impingement cooling systems require some rather unique geometries; a feed plenum, hole plate, and an impingement target and plenum, the use of impingement cooling systems is typically confi ned to the fi rst stage vane (where the high heat loads and relatively low cooling supply pressure to passage dump pressure ratio pre-cludes the use of long-channel cooling circuits) and the leading edge and trailing edge regions of other airfoils. There are several mechanisms associated with the impinging jet that improve heat transfer. These will be discussed in the following sections.
Figure 7: One-dimensional spectra of u' and v' for the combustor with a short spool showing the inertial subrange isotropy (from Ames [14]).
www.witpress.com, ISSN 1755-8336 (on-line) WIT Transactions on State of the Art in Science and Engineering, Vol , © 20 WIT Press42 08
Hot Gas Path Heat Transfer Characteristics 243
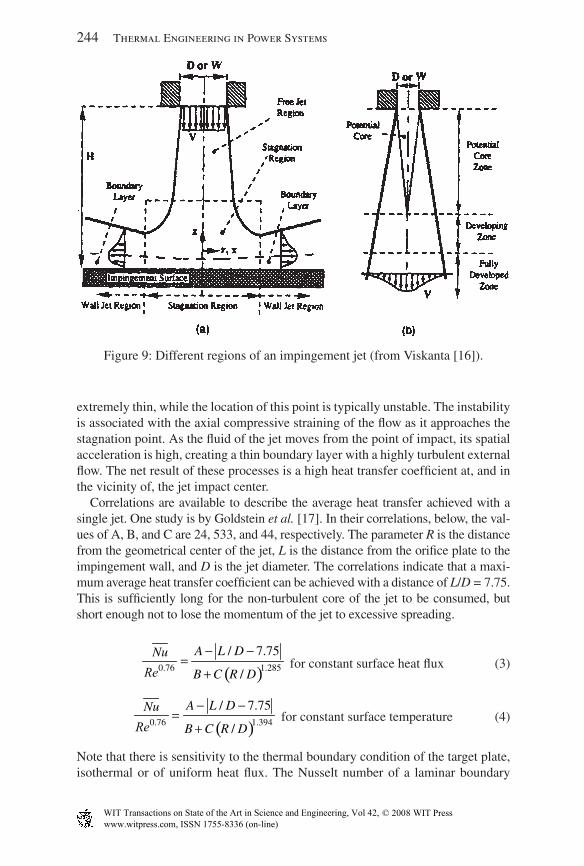
3.1.1 Single jetsThe structure of the impinging jet is of interest. A schematic of a representa-tive geometry is shown in Fig. 9. In the simplest case, the jet fl ow originates in a plenum where the coolant fl uid has little or no momentum. The fl uid passes through a hole or slot into a lower pressure zone, driven by the pressure difference between the two plenums. As the fl uid passes through the hole, it may be thought of as a slug fl ow with a negligibly thin boundary layer around the edge of the jet and a very fl at velocity distribution across the jet core (as shown in Fig. 9). The thin boundary layers can be attributed to the rapid spatial acceleration of the fl ow approaching the hole exit plane. The jet has relatively high momentum as it passes into the low-pressure zone. The fl ow on the periphery of the jet shears on the low momentum fl uid external to it, eventually leading to a breakdown of the shear layer into a train of large turbulent eddies. This causes the jet to widen and entrain external fl ow. The velocity profi le of the jet becomes non-uniform, as shown in Fig. 9. If the jet length to diameter ratio is suffi cient, the shear layer between the jet and the surrounding fl ow consumes the core of the jet, which leads to high levels of turbulence in the vicinity of the center of the jet. The large eddies in the shear layer also establish circulation in the low-pressure plenum, mixing that fl uid. Finally, the jet impinges upon the target surface. Due to the high momentum of the jet perpendicular to the wall, the boundary layer at the impingement point is
Figure 8: Circumferentially averaged temperature distributions at the turbine vane inlet. Shown is a measured profi le in a real engine (typical engine), a measured profi le in a simulator in which distortions due to discrete fuel and dilution air injection and endwall cooling fl ows are active (OTDF1 and OTDF2), and a profi le measured in the simulator when the inlet tem-perature distortion mechanisms are not active (measured uniform).
www.witpress.com, ISSN 1755-8336 (on-line) WIT Transactions on State of the Art in Science and Engineering, Vol , © 20 WIT Press42 08
244 Thermal Engineering in Power Systems
extremely thin, while the location of this point is typically unstable. The instability is associated with the axial compressive straining of the fl ow as it approaches the stagnation point. As the fl uid of the jet moves from the point of impact, its spatial acceleration is high, creating a thin boundary layer with a highly turbulent external fl ow. The net result of these processes is a high heat transfer coeffi cient at, and in the vicinity of, the jet impact center.
Correlations are available to describe the average heat transfer achieved with a single jet. One study is by Goldstein et al. [17]. In their correlations, below, the val-ues of A, B, and C are 24, 533, and 44, respectively. The parameter R is the distance from the geometrical center of the jet, L is the distance from the orifi ce plate to the impingement wall, and D is the jet diameter. The correlations indicate that a maxi-mum average heat transfer coeffi cient can be achieved with a distance of L/D = 7.75. This is suffi ciently long for the non-turbulent core of the jet to be consumed, but short enough not to lose the momentum of the jet to excessive spreading.
( )Re
− −=
+0.76 1.285
/ 7.75
/
A L DNu
B C R D
for constant surface heat fl ux (3)
( )Re
− −=
+0.76 1.394
/ 7.75
/
A L DNu
B C R D
for constant surface temperature (4)
Note that there is sensitivity to the thermal boundary condition of the target plate, isothermal or of uniform heat fl ux. The Nusselt number of a laminar boundary
Figure 9: Different regions of an impingement jet (from Viskanta [16]).
www.witpress.com, ISSN 1755-8336 (on-line) WIT Transactions on State of the Art in Science and Engineering, Vol , © 20 WIT Press42 08
Hot Gas Path Heat Transfer Characteristics 245
layer is known to be dependent on the thermal boundary conditions whereas a tur-bulent boundary layer is nearly independent of the thermal boundary conditions.
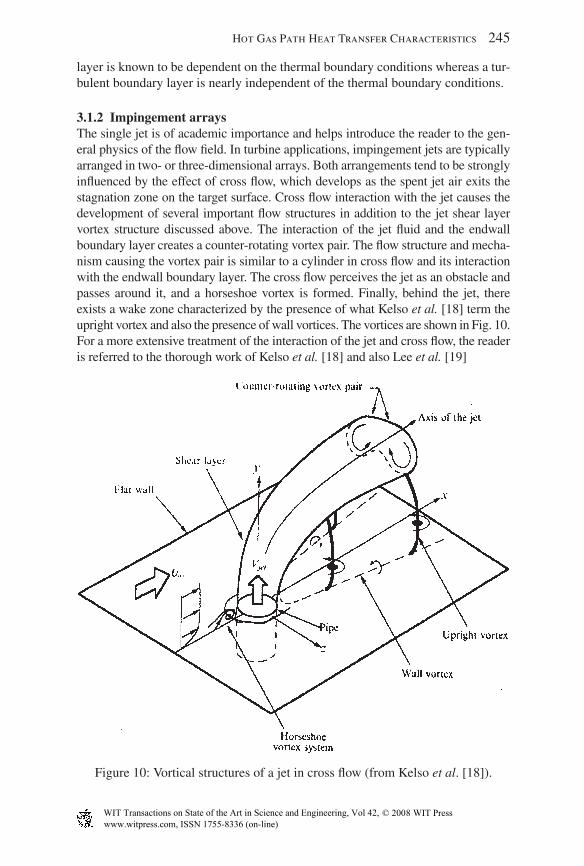
3.1.2 Impingement arraysThe single jet is of academic importance and helps introduce the reader to the gen-eral physics of the fl ow fi eld. In turbine applications, impingement jets are typically arranged in two- or three-dimensional arrays. Both arrangements tend to be strongly infl uenced by the effect of cross fl ow, which develops as the spent jet air exits the stagnation zone on the target surface. Cross fl ow interaction with the jet causes the development of several important fl ow structures in addition to the jet shear layer vortex structure discussed above. The interaction of the jet fl uid and the endwall boundary layer creates a counter-rotating vortex pair. The fl ow structure and mecha-nism causing the vortex pair is similar to a cylinder in cross fl ow and its interaction with the endwall boundary layer. The cross fl ow perceives the jet as an obstacle and passes around it, and a horseshoe vortex is formed. Finally, behind the jet, there exists a wake zone characterized by the presence of what Kelso et al. [18] term the upright vortex and also the presence of wall vortices. The vortices are shown in Fig. 10. For a more extensive treatment of the interaction of the jet and cross fl ow, the reader is referred to the thorough work of Kelso et al. [18] and also Lee et al. [19]
Figure 10: Vortical structures of a jet in cross fl ow (from Kelso et al. [18]).
www.witpress.com, ISSN 1755-8336 (on-line) WIT Transactions on State of the Art in Science and Engineering, Vol , © 20 WIT Press42 08
246 Thermal Engineering in Power Systems
It should be noted that in the case of impingement cooling, the jet may be inter-rupted by the target wall before all the fl ow structures outlined above have had a chance to develop fully. Such is the case when L/D is small and the laminar core of the jet extends to the impingement point. This short L/D case for a single jet was discussed by Adolfson et al. [20]. In this case, the impingement zone is laminar and the boundary layer fl ow departing from the stagnation zone transitions to tur-bulence as the pressure distribution dictates.
3.1.3 Jet array correlationsSome of the earliest work in this area was performed by Kercher and Tabakoff [21] who measured spatially averaged heat transfer coeffi cients. Their work focused on quantifying the effects of Reynolds number and jet-to-jet spacing. Several papers by Florschuetz, Metzger, and co-workers [22, 23] marked important advances in the understanding of jet array fl ow and heat transfer physics and also offered rela-tively simple correlations. Their work shows the infl uence of Reynolds number, hole size, jet spacing, the effects of jet-to-cross fl ow velocity ratio, and whether the jets are arranged in-line or are staggered. A correlation from Florschuetz et al. [23] is presented below.
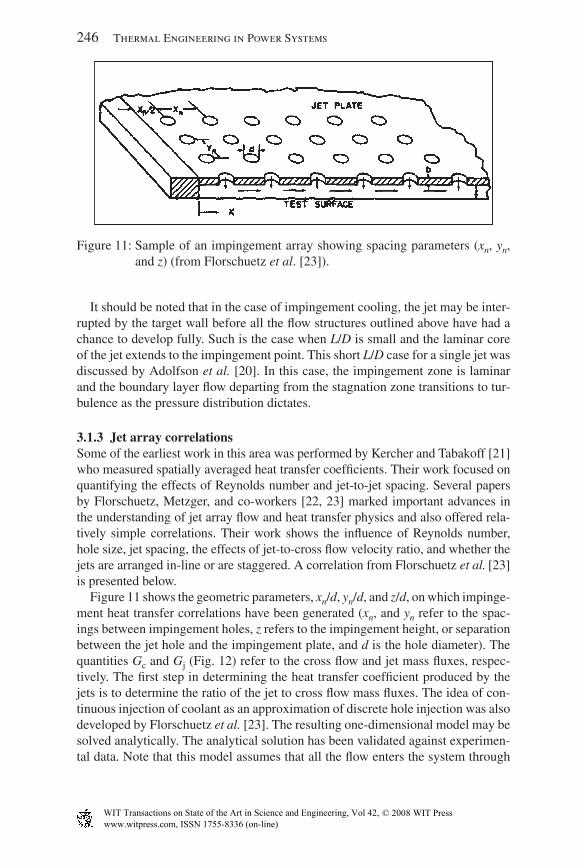
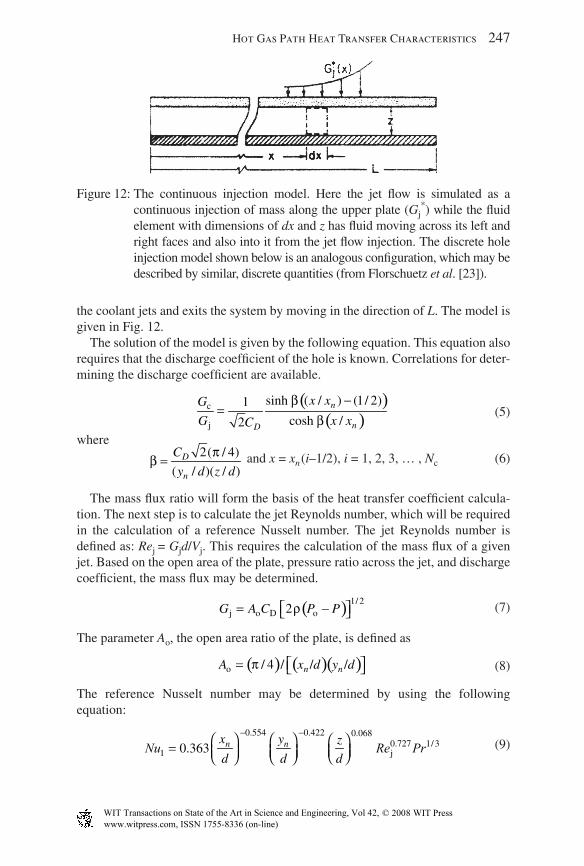
Figure 11 shows the geometric parameters, xn/d, yn/d, and z/d, on which impinge-ment heat transfer correlations have been generated (xn, and yn refer to the spac-ings between impingement holes, z refers to the impingement height, or separation between the jet hole and the impingement plate, and d is the hole diameter). The quantities Gc and Gj (Fig. 12) refer to the cross fl ow and jet mass fl uxes, respec-tively. The fi rst step in determining the heat transfer coeffi cient produced by the jets is to determine the ratio of the jet to cross fl ow mass fl uxes. The idea of con-tinuous injection of coolant as an approximation of discrete hole injection was also developed by Florschuetz et al. [23]. The resulting one-dimensional model may be solved analytically. The analytical solution has been validated against experimen-tal data. Note that this model assumes that all the fl ow enters the system through
Figure 11: Sample of an impingement array showing spacing parameters (xn, yn, and z) (from Florschuetz et al. [23]).
www.witpress.com, ISSN 1755-8336 (on-line) WIT Transactions on State of the Art in Science and Engineering, Vol , © 20 WIT Press42 08
Hot Gas Path Heat Transfer Characteristics 247
the coolant jets and exits the system by moving in the direction of L. The model is given in Fig. 12.
The solution of the model is given by the following equation. This equation also requires that the discharge coeffi cient of the hole is known. Correlations for deter-mining the discharge coeffi cient are available.
( )( )
c
j
sinh ( / ) (1/ 2)1
cosh /2n
nD
x xG
G x xC
ββ
−=
(5)
where
2( / 4)
( / )( / )D
n
C
y d z dβ
π=
and x = xn (i–1/2), i = 1, 2, 3, … , Nc (6)
The mass fl ux ratio will form the basis of the heat transfer coeffi cient calcula-tion. The next step is to calculate the jet Reynolds number, which will be required in the calculation of a reference Nusselt number. The jet Reynolds number is defi ned as: Rej = Gjd/Vj. This requires the calculation of the mass fl ux of a given jet. Based on the open area of the plate, pressure ratio across the jet, and discharge coeffi cient, the mass fl ux may be determined.
( ) 1/ 2
j o D o2G A C P Pρ⎡ ⎤= −⎣ ⎦ (7)
The parameter Ao, the open area ratio of the plate, is defi ned as
( ) ( )( )o / 4 / / /n nA x d y d⎡ ⎤= π ⎣ ⎦
(8)
The reference Nusselt number may be determined by using the following equation:
0.554 0.422 0.0680.727 1/3
1 j0.363 n nx y z
d d d
− −⎛ ⎞ ⎛ ⎞ ⎛ ⎞= ⎜ ⎟⎜ ⎟ ⎜ ⎟ ⎝ ⎠⎝ ⎠ ⎝ ⎠Nu Re Pr
(9)
Figure 12: The continuous injection model. Here the jet fl ow is simulated as a continuous injection of mass along the upper plate (Gj
*) while the fl uid element with dimensions of dx and z has fl uid moving across its left and right faces and also into it from the jet fl ow injection. The discrete hole injection model shown below is an analogous confi guration, which may be described by similar, discrete quantities (from Florschuetz et al. [23]).
www.witpress.com, ISSN 1755-8336 (on-line) WIT Transactions on State of the Art in Science and Engineering, Vol , © 20 WIT Press42 08
248 Thermal Engineering in Power Systems
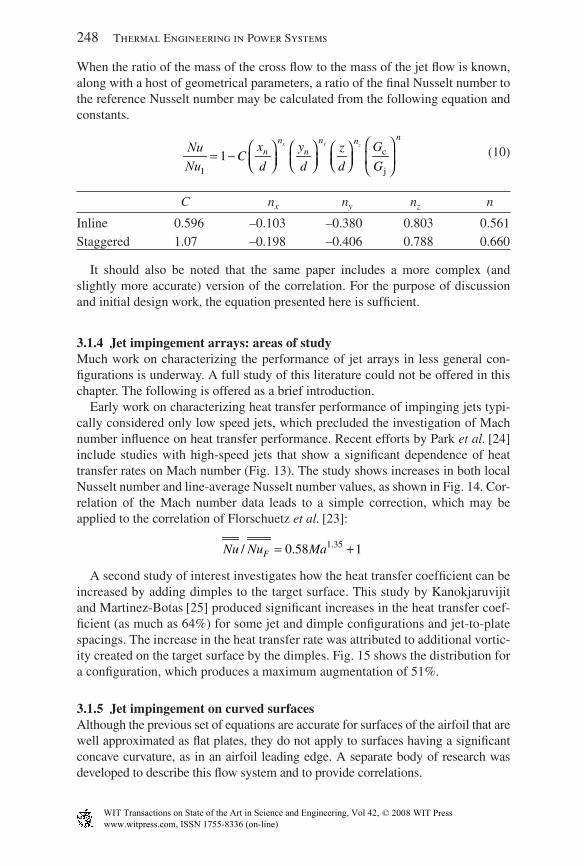
When the ratio of the mass of the cross fl ow to the mass of the jet fl ow is known, along with a host of geometrical parameters, a ratio of the fi nal Nusselt number to the reference Nusselt number may be calculated from the following equation and constants.
c
1 j
1x y z
nn n nn nx y Gz
Cd d d G
⎛ ⎞⎛ ⎞ ⎛ ⎞ ⎛ ⎞= − ⎜ ⎟⎜ ⎟⎜ ⎟ ⎜ ⎟ ⎝ ⎠⎝ ⎠ ⎝ ⎠ ⎝ ⎠
Nu
Nu
(10)
C nx ny nz n
Inline 0.596 –0.103 –0.380 0.803 0.561Staggered 1.07 –0.198 –0.406 0.788 0.660
It should also be noted that the same paper includes a more complex (and slightly more accurate) version of the correlation. For the purpose of discussion and initial design work, the equation presented here is suffi cient.
3.1.4 Jet impingement arrays: areas of studyMuch work on characterizing the performance of jet arrays in less general con-fi gurations is underway. A full study of this literature could not be offered in this chapter. The following is offered as a brief introduction.
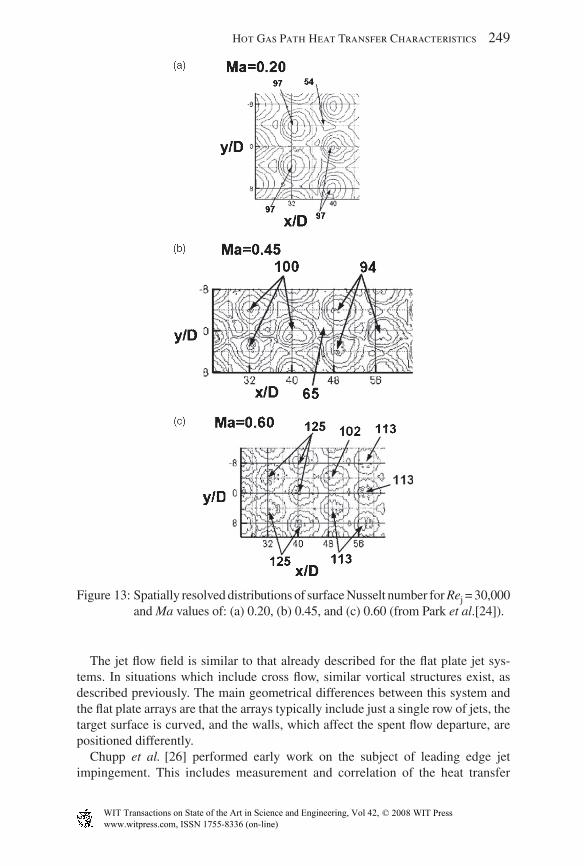
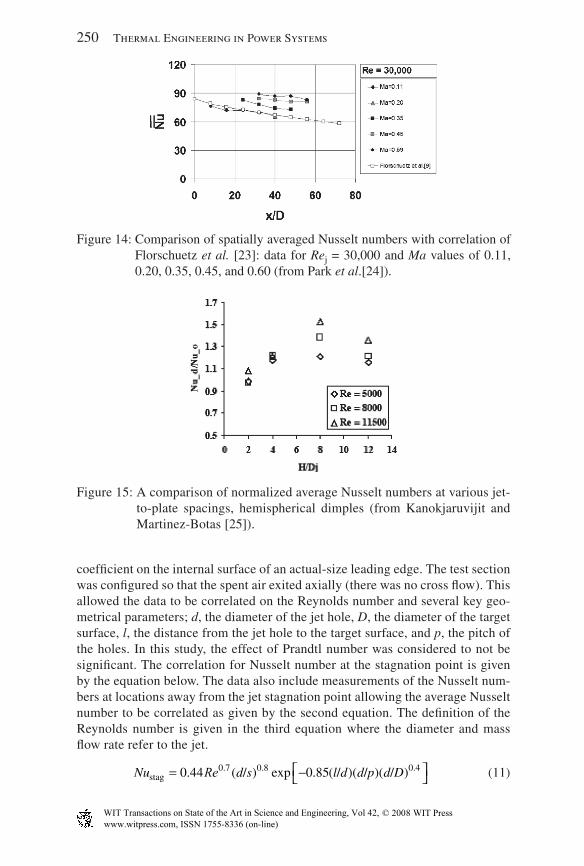
Early work on characterizing heat transfer performance of impinging jets typi-cally considered only low speed jets, which precluded the investigation of Mach number infl uence on heat transfer performance. Recent efforts by Park et al. [24] include studies with high-speed jets that show a signifi cant dependence of heat transfer rates on Mach number (Fig. 13). The study shows increases in both local Nusselt number and line-average Nusselt number values, as shown in Fig. 14. Cor-relation of the Mach number data leads to a simple correction, which may be applied to the correlation of Florschuetz et al. [23]:
1.35/ 0.58 1FNu Nu Ma= +
A second study of interest investigates how the heat transfer coeffi cient can be increased by adding dimples to the target surface. This study by Kanokjaruvijit and Martinez-Botas [25] produced signifi cant increases in the heat transfer coef-fi cient (as much as 64%) for some jet and dimple confi gurations and jet-to-plate spacings. The increase in the heat transfer rate was attributed to additional vortic-ity created on the target surface by the dimples. Fig. 15 shows the distribution for a confi guration, which produces a maximum augmentation of 51%.
3.1.5 Jet impingement on curved surfacesAlthough the previous set of equations are accurate for surfaces of the airfoil that are well approximated as fl at plates, they do not apply to surfaces having a signifi cant concave curvature, as in an airfoil leading edge. A separate body of research was developed to describe this fl ow system and to provide correlations.
www.witpress.com, ISSN 1755-8336 (on-line) WIT Transactions on State of the Art in Science and Engineering, Vol , © 20 WIT Press42 08
Hot Gas Path Heat Transfer Characteristics 249
The jet fl ow fi eld is similar to that already described for the fl at plate jet sys-tems. In situations which include cross fl ow, similar vortical structures exist, as described previously. The main geometrical differences between this system and the fl at plate arrays are that the arrays typically include just a single row of jets, the target surface is curved, and the walls, which affect the spent fl ow departure, are positioned differently.
Chupp et al. [26] performed early work on the subject of leading edge jet impingement. This includes measurement and correlation of the heat transfer
Figure 13: Spatially resolved distributions of surface Nusselt number for Rej = 30,000 and Ma values of: (a) 0.20, (b) 0.45, and (c) 0.60 (from Park et al.[24]).
www.witpress.com, ISSN 1755-8336 (on-line) WIT Transactions on State of the Art in Science and Engineering, Vol , © 20 WIT Press42 08
250 Thermal Engineering in Power Systems
coeffi cient on the internal surface of an actual-size leading edge. The test section was confi gured so that the spent air exited axially (there was no cross fl ow). This allowed the data to be correlated on the Reynolds number and several key geo-metrical parameters; d, the diameter of the jet hole, D, the diameter of the target surface, l, the distance from the jet hole to the target surface, and p, the pitch of the holes. In this study, the effect of Prandtl number was considered to not be signifi cant. The correlation for Nusselt number at the stagnation point is given by the equation below. The data also include measurements of the Nusselt num-bers at locations away from the jet stagnation point allowing the average Nusselt number to be correlated as given by the second equation. The defi nition of the Reynolds number is given in the third equation where the diameter and mass fl ow rate refer to the jet.
0.7 0.8 0.4
stag 0.44 ( / ) exp 0.85( / )( / )( / )Nu d s l d d p d D⎡ ⎤= −⎣ ⎦Re
(11)
Figure 14: Comparison of spatially averaged Nusselt numbers with correlation of Florschuetz et al. [23]: data for Rej = 30,000 and Ma values of 0.11, 0.20, 0.35, 0.45, and 0.60 (from Park et al.[24]).
Figure 15: A comparison of normalized average Nusselt numbers at various jet-to-plate spacings, hemispherical dimples (from Kanokjaruvijit and Martinez-Botas [25]).
www.witpress.com, ISSN 1755-8336 (on-line) WIT Transactions on State of the Art in Science and Engineering, Vol , © 20 WIT Press42 08
Hot Gas Path Heat Transfer Characteristics 251
0.7 0.5 0.6 0.5 1.2
avg 0.63 ( / ) ( / ) exp 1.27( / )( / ) ( / )Nu d s d D l d d p d D⎡ ⎤= −⎣ ⎦Re (12)
Re μ= π4 /.
m d (13)
Later work by Bunker and Metzger [27] and Metzger and Bunker [28] investi-gated similar curved leading edge geometries. The fi rst study indicates that heat transfer rates vary with the jet Reynolds number to the approximate power of 0.6–0.7 (a result which is similar to the rates reported by Chupp et al. [26]). The second study reports on the impact of coolant extraction on the leading edge heat transfer coeffi cients. The conclusion is that jet heat transfer is primarily dependant on the total amount of jet fl ow with a secondary but still signifi cant contribution due to the extraction of coolant fl ow through holes near the impingement site. The spent fl ow from the jets produces a recirculation region in the jet exhaust plenum. Drawing off spent jet air as fi lm cooling tends to affect this recirculation. An opti-mum confi guration of jet holes and fi lm coolant holes can be found. The impact of the fi lm extraction varies with the jet Reynolds number, the largest impact being produced at low jet Reynolds numbers.
3.2 Pin fi n cooling
Pin fi ns are useful tools for enhancing heat transfer coeffi cients. They are often found in the trailing edge region of turbine airfoils where the high heat transfer coeffi cients they produce are advantageous and the relatively large pressure drops they create are acceptable. Pins can also be designed to span from one side of the channel to the other, providing a conduction path, which helps maintain the unifor-mity of airfoil metal temperatures. Pins also provide additional surface area, which further enhances cooling performance.
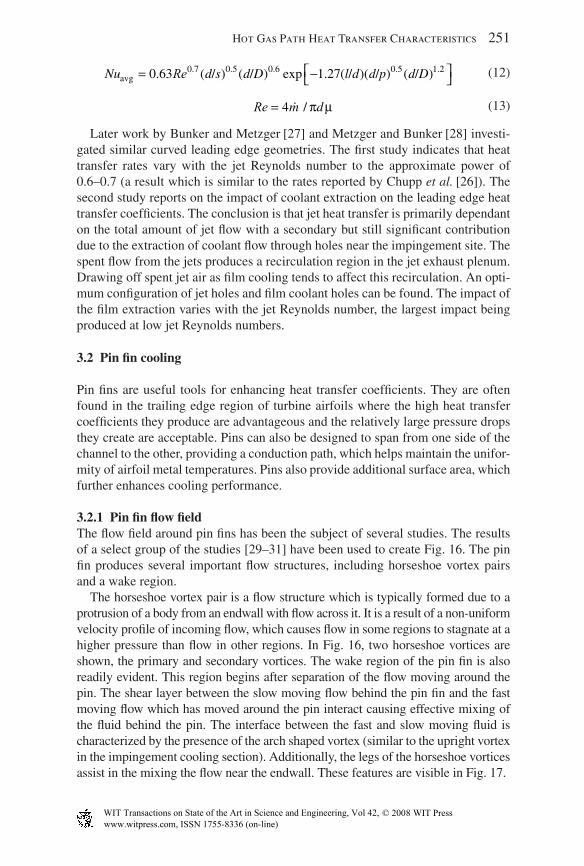
3.2.1 Pin fi n fl ow fi eldThe fl ow fi eld around pin fi ns has been the subject of several studies. The results of a select group of the studies [29–31] have been used to create Fig. 16. The pin fi n produces several important fl ow structures, including horseshoe vortex pairs and a wake region.
The horseshoe vortex pair is a fl ow structure which is typically formed due to a protrusion of a body from an endwall with fl ow across it. It is a result of a non-uniform velocity profi le of incoming fl ow, which causes fl ow in some regions to stagnate at a higher pressure than fl ow in other regions. In Fig. 16, two horseshoe vortices are shown, the primary and secondary vortices. The wake region of the pin fi n is also readily evident. This region begins after separation of the fl ow moving around the pin. The shear layer between the slow moving fl ow behind the pin fi n and the fast moving fl ow which has moved around the pin interact causing effective mixing of the fl uid behind the pin. The interface between the fast and slow moving fl uid is characterized by the presence of the arch shaped vortex (similar to the upright vortex in the impingement cooling section). Additionally, the legs of the horseshoe vortices assist in the mixing the fl ow near the endwall. These features are visible in Fig. 17.
www.witpress.com, ISSN 1755-8336 (on-line) WIT Transactions on State of the Art in Science and Engineering, Vol , © 20 WIT Press42 08
252 Thermal Engineering in Power Systems
Near the surfaces forming the pin and the endwall, the boundary layers are strongly affected by the presence of the pin. As the incoming fl ow stagnates on the face of the pin, the boundary layer is thin and the point of stagnation is unstable. This produces the high heat transfer coeffi cients well documented in other articles that show the heat transfer coeffi cients on cylinders in cross fl ow. The boundary layer builds, somewhat, as it moves around the surface of the pin until the boundary layer detaches. On the endwalls, the boundary layers skew as the fl ow moves around the obstruction. Behind the pin, in the wake region, the boundary layer is highly disturbed.
3.2.2 Pin fi n heat transferAs one may guess, the highest local heat transfer rates on the endwall are found near the leading edge of each pin in region infl uenced by the roll-up of
Figure 16: Flow fi eld around pin fi ns within an array. The oncoming boundary layer gives rise to the primary and secondary horseshoe vortices. The pin creates a wake region with strong mixing (from Ligrani et al. [32])
www.witpress.com, ISSN 1755-8336 (on-line) WIT Transactions on State of the Art in Science and Engineering, Vol , © 20 WIT Press42 08

Hot Gas Path Heat Transfer Characteristics 253
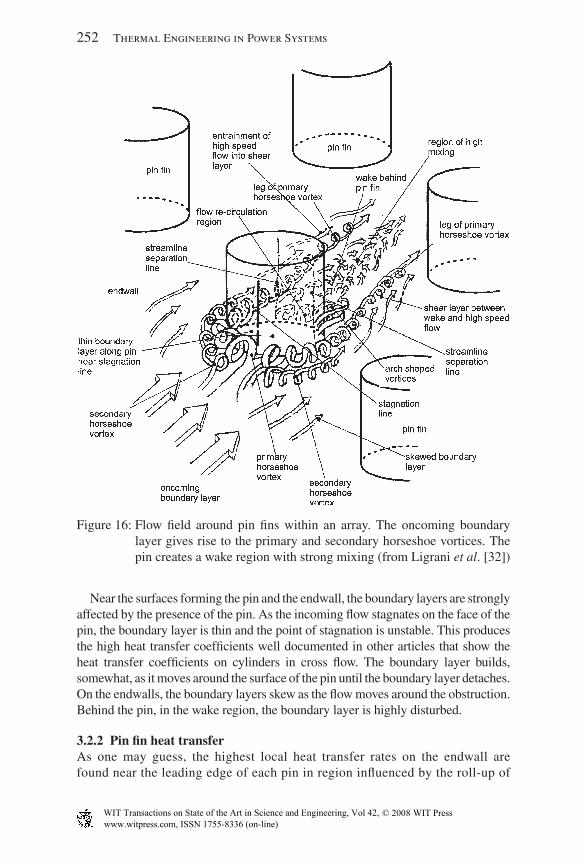
the horseshoe vortex. Downstream, the legs of the horseshoe vortices and the arch vortices help maintain high heat transfer rates. The work by Ligrani and Mahmood [34] clearly shows the heat transfer rates around an array of stag-gered pins (Fig. 18). Note that the heat transfer rates in the wake region are generally low but that the effective mixing in this region helps promote high heat transfer rates on the downstream pin. Arrays with staggered pins tend to exhibit slightly higher average heat transfer rates and a more uniform heat transfer rate distribution.
Most data on pin fi n arrays are presented as row average rather than local heat transfer coeffi cients. This is because pin fi ns typically are small features and the conduction of the metal tends to smooth any metal temperature variations pro-duced by the uneven heat transfer rates. Also, data giving the average heat transfer rate tend to be easier to collect. The average heat transfer rate at each row is a func-tion of the Reynolds number, the confi guration of the pin array (in-line or stag-gered), the spacing, and the size of the pins.
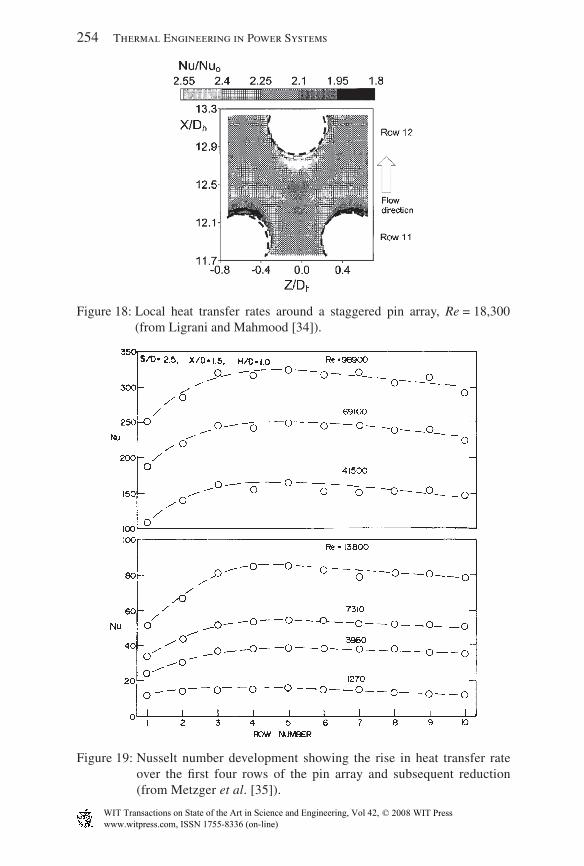
Row average heat transfer rates within pin arrays tend to exhibit increasing heat transfer from the fi rst to the third or fourth row and then a slow decline in heat transfer rates (see Fig. 19). The trend is shown in the data of Metzger et al. [35].
The data were also correlated with the Reynolds number (based on pin diameter and the fl uid velocity through the minimum fl ow area). For the fi rst row of the array, the relationship is
0.6110.140Nu = Re for 103 < Re < 104 (14)
and
0.8130.022Nu = Re for 104 < Re < 105 (15)
Figure 17: Oil and graphite visualization of a pin in cross fl ow clearly showing separation lines along the pin endwall (from Chyu and Natarajan [33]).
www.witpress.com, ISSN 1755-8336 (on-line) WIT Transactions on State of the Art in Science and Engineering, Vol , © 20 WIT Press42 08
254 Thermal Engineering in Power Systems
Figure 18: Local heat transfer rates around a staggered pin array, Re = 18,300 (from Ligrani and Mahmood [34]).
Figure 19: Nusselt number development showing the rise in heat transfer rate over the fi rst four rows of the pin array and subsequent reduction (from Metzger et al. [35]).
www.witpress.com, ISSN 1755-8336 (on-line) WIT Transactions on State of the Art in Science and Engineering, Vol , © 20 WIT Press42 08
Hot Gas Path Heat Transfer Characteristics 255
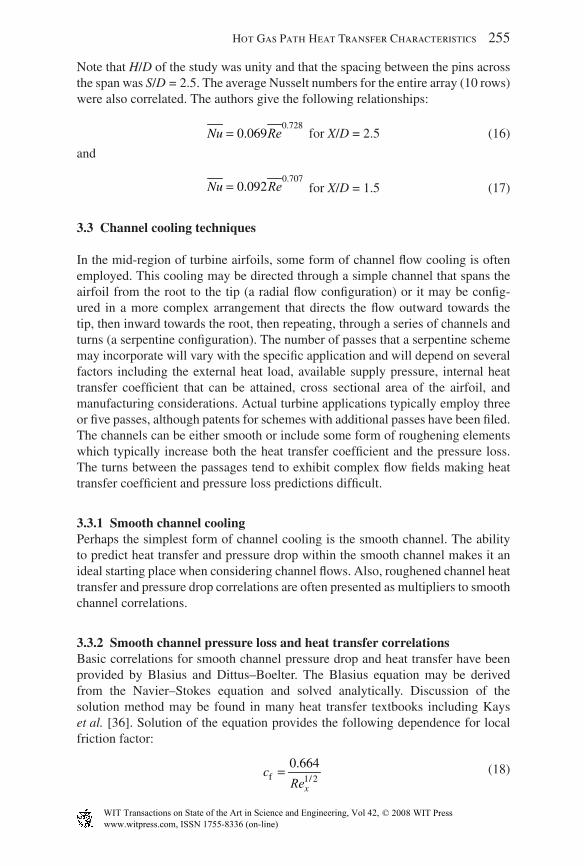
Note that H/D of the study was unity and that the spacing between the pins across the span was S/D = 2.5. The average Nusselt numbers for the entire array (10 rows) were also correlated. The authors give the following relationships:
0.728
0.069Nu = Re for X/D = 2.5 (16)
and
0.707
0.092Nu = Re for X/D = 1.5 (17)
3.3 Channel cooling techniques
In the mid-region of turbine airfoils, some form of channel fl ow cooling is often employed. This cooling may be directed through a simple channel that spans the airfoil from the root to the tip (a radial fl ow confi guration) or it may be confi g-ured in a more complex arrangement that directs the fl ow outward towards the tip, then inward towards the root, then repeating, through a series of channels and turns (a serpentine confi guration). The number of passes that a serpentine scheme may incorporate will vary with the specifi c application and will depend on several factors including the external heat load, available supply pressure, internal heat transfer coeffi cient that can be attained, cross sectional area of the airfoil, and manufacturing considerations. Actual turbine applications typically employ three or fi ve passes, although patents for schemes with additional passes have been fi led. The channels can be either smooth or include some form of roughening elements which typically increase both the heat transfer coeffi cient and the pressure loss. The turns between the passages tend to exhibit complex fl ow fi elds making heat transfer coeffi cient and pressure loss predictions diffi cult.
3.3.1 Smooth channel coolingPerhaps the simplest form of channel cooling is the smooth channel. The ability to predict heat transfer and pressure drop within the smooth channel makes it an ideal starting place when considering channel fl ows. Also, roughened channel heat transfer and pressure drop correlations are often presented as multipliers to smooth channel correlations.
3.3.2 Smooth channel pressure loss and heat transfer correlationsBasic correlations for smooth channel pressure drop and heat transfer have been provided by Blasius and Dittus–Boelter. The Blasius equation may be derived from the Navier–Stokes equation and solved analytically. Discussion of the solution method may be found in many heat transfer textbooks including Kays et al. [36]. Solution of the equation provides the following dependence for local friction factor:
f 1/ 2
0.664
x
c =Re
(18)
www.witpress.com, ISSN 1755-8336 (on-line) WIT Transactions on State of the Art in Science and Engineering, Vol , © 20 WIT Press42 08
256 Thermal Engineering in Power Systems
and mean friction factor:
mf 1/ 2
1.328=
x
cRe
(19)
Used with Bernoulli’s equation (the modifi ed Bernoulli equation) the pressure drop, along a smooth channel may be determined. Many pressure loss correlations for rough channels supply factors for multiplication, which make use of smooth channel correlations as the basis.
The Dittus–Boelter equation (fi rst proposed in 1930) has been developed to describe smooth channel heat transfer. The equation assumes fully developed fl ow (no entrance effects) and is often shown as Nu = 0.023Re0.8 Pr n where n = 0.4 for heating applica-tions and n = 0.3 for cooling applications. The equation is often used with n = 0.4 as a basis for rough channel heat transfer correlations. The equation can be found in many heat transfer textbooks including Gebhart [37] and Incropera and DeWitt [38].
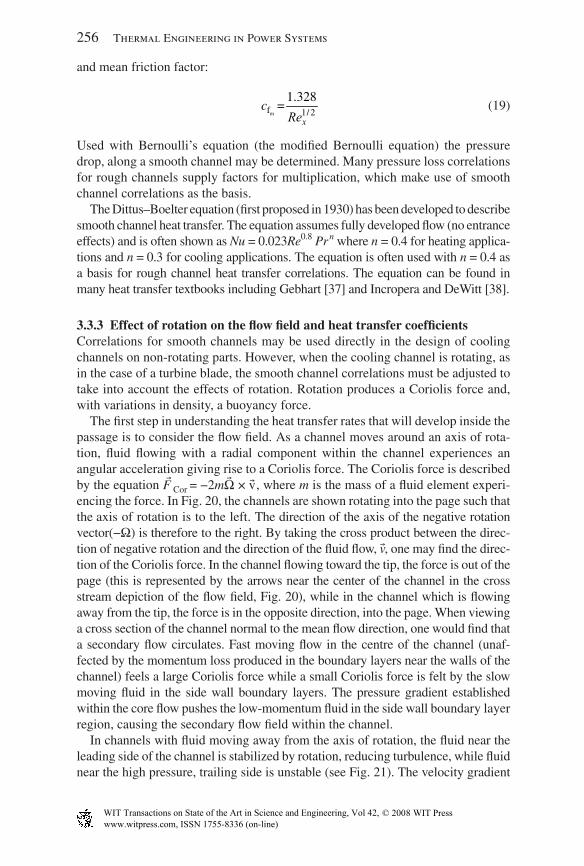
3.3.3 Effect of rotation on the fl ow fi eld and heat transfer coeffi cientsCorrelations for smooth channels may be used directly in the design of cooling channels on non-rotating parts. However, when the cooling channel is rotating, as in the case of a turbine blade, the smooth channel correlations must be adjusted to take into account the effects of rotation. Rotation produces a Coriolis force and, with variations in density, a buoyancy force.
The fi rst step in understanding the heat transfer rates that will develop inside the passage is to consider the fl ow fi eld. As a channel moves around an axis of rota-tion, fl uid fl owing with a radial component within the channel experiences an angular acceleration giving rise to a Coriolis force. The Coriolis force is described by the equation F⃗ Cor = −2mΩ⃗ × v⃗, where m is the mass of a fl uid element experi-encing the force. In Fig. 20, the channels are shown rotating into the page such that the axis of rotation is to the left. The direction of the axis of the negative rotation vector(−Ω· ) is therefore to the right. By taking the cross product between the direc-tion of negative rotation and the direction of the fl uid fl ow, v⃗, one may fi nd the direc-tion of the Coriolis force. In the channel fl owing toward the tip, the force is out of the page (this is represented by the arrows near the center of the channel in the cross stream depiction of the fl ow fi eld, Fig. 20), while in the channel which is fl owing away from the tip, the force is in the opposite direction, into the page. When viewing a cross section of the channel normal to the mean fl ow direction, one would fi nd that a secondary fl ow circulates. Fast moving fl ow in the centre of the channel (unaf-fected by the momentum loss produced in the boundary layers near the walls of the channel) feels a large Coriolis force while a small Coriolis force is felt by the slow moving fl uid in the side wall boundary layers. The pressure gradient established within the core fl ow pushes the low-momentum fl uid in the side wall boundary layer region, causing the secondary fl ow fi eld within the channel.
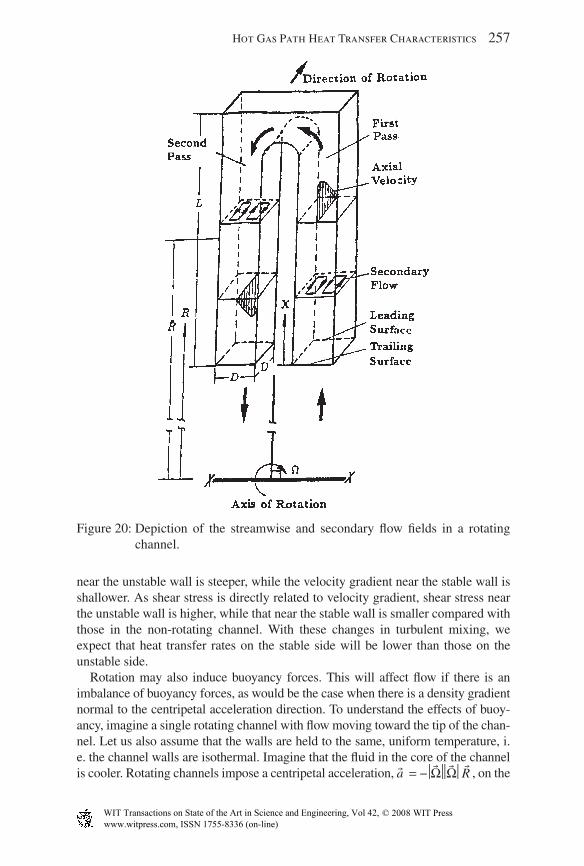
In channels with fl uid moving away from the axis of rotation, the fl uid near the leading side of the channel is stabilized by rotation, reducing turbulence, while fl uid near the high pressure, trailing side is unstable (see Fig. 21). The velocity gradient
www.witpress.com, ISSN 1755-8336 (on-line) WIT Transactions on State of the Art in Science and Engineering, Vol , © 20 WIT Press42 08
Hot Gas Path Heat Transfer Characteristics 257
near the unstable wall is steeper, while the velocity gradient near the stable wall is shallower. As shear stress is directly related to velocity gradient, shear stress near the unstable wall is higher, while that near the stable wall is smaller compared with those in the non-rotating channel. With these changes in turbulent mixing, we expect that heat transfer rates on the stable side will be lower than those on the unstable side.
Rotation may also induce buoyancy forces. This will affect fl ow if there is an imbalance of buoyancy forces, as would be the case when there is a density gradient normal to the centripetal acceleration direction. To understand the effects of buoy-ancy, imagine a single rotating channel with fl ow moving toward the tip of the chan-nel. Let us also assume that the walls are held to the same, uniform temperature, i.e. the channel walls are isothermal. Imagine that the fl uid in the core of the channel is cooler. Rotating channels impose a centripetal acceleration, a⃗ = −⏐Ω⃗⏐⏐Ω⃗⏐R⃗ , on the
Figure 20: Depiction of the streamwise and secondary fl ow fi elds in a rotating channel.
www.witpress.com, ISSN 1755-8336 (on-line) WIT Transactions on State of the Art in Science and Engineering, Vol , © 20 WIT Press42 08
258 Thermal Engineering in Power Systems
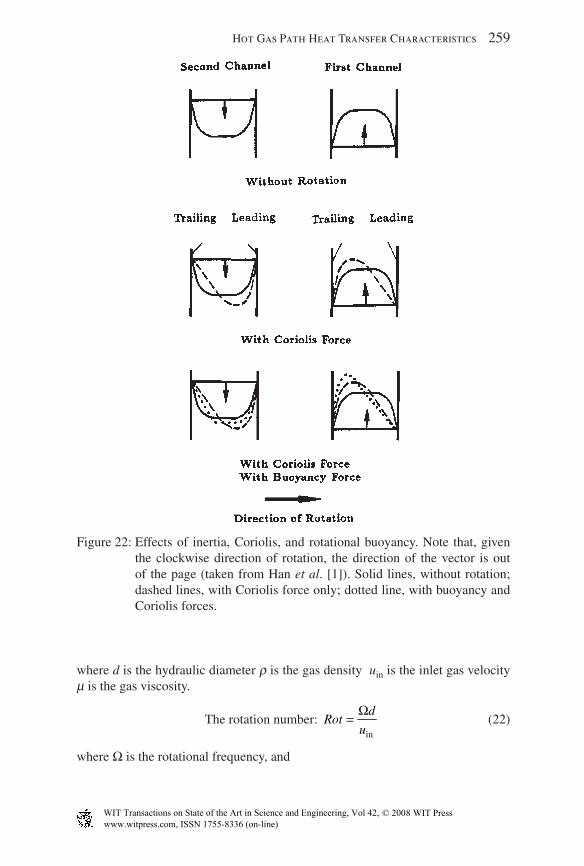
fl uid (the centripetal acceleration vector points toward the axis of rotation). The parameter R is the radius from the center of rotation to the location of interest. Cooler fl uid is denser and thus larger centripetal force per unit volume of fl uid, F⃗ cen = ρa⃗, is required to hold the fl uid on the constant-R streamline when com-pared to the lower density warmer fl uid near the wall. The force fi eld causes the cooler and more dense fl uid to move more quickly toward the tip of the channel while the near-wall, lower-density, fl uid moves less quickly toward the tip. If the fl ow were to be moving radially inward, the centripetal acceleration would remain unchanged and the core fl ow would move toward the center of rotation less rapidly while the near-wall, warmer fl uid would move more quickly. These two scenarios are shown in Fig. 22. When the Coriolis acceleration is added to the situation, the result is a velocity profi le in which the wall region that is made unstable by Coriolis acceleration is peaked to a greater extent while the wall region that is stabilized by Coriolis acceleration is less peaked (these are shown in the sketches in Fig. 22). Because of the secondary fl ow created by Coriolis acceleration and its convection of heated and cool fl ows within the channel, the buoyancy and Coriolis effects can-not be treated separately.
One pioneering study on rotation effects was by Wagner et al. [40] This study investigates several important parameters, including the effect of density ratio (DR = ( ρin − ρwall)/ρin) and rotation number, Rot, (as presented below). The results indicate that the fl ow behavior described above does indeed infl uence the heat transfer rates.
Effects of rotation can be expressed with the following parameters:
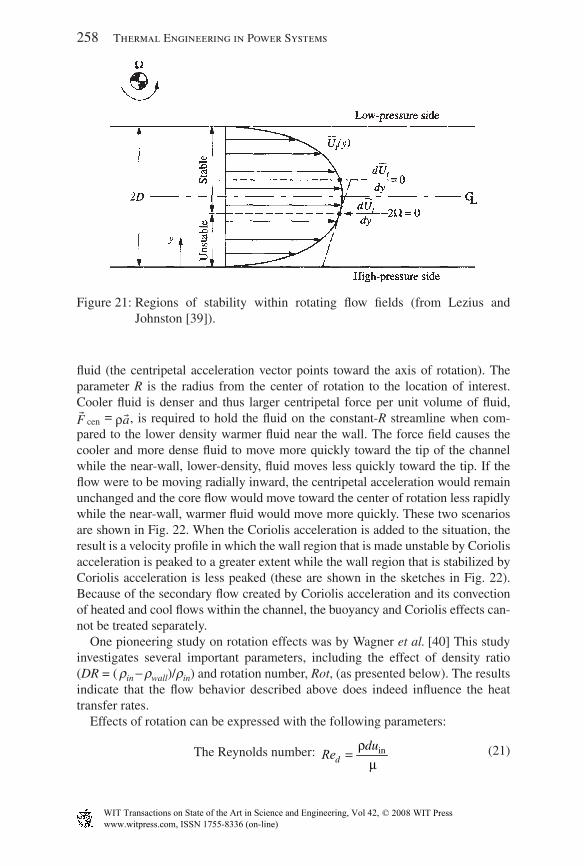
The Reynolds number:
ind
duρμ
=Re
(21)
Figure 21: Regions of stability within rotating fl ow fi elds (from Lezius and Johnston [39]).
www.witpress.com, ISSN 1755-8336 (on-line) WIT Transactions on State of the Art in Science and Engineering, Vol , © 20 WIT Press42 08
Hot Gas Path Heat Transfer Characteristics 259
where d is the hydraulic diameter ρ is the gas density uin is the inlet gas velocity μ is the gas viscosity.
The rotation number:
in
dRot
u
Ω=
(22)
where Ω is the rotational frequency, and
Figure 22: Effects of inertia, Coriolis, and rotational buoyancy. Note that, given the clockwise direction of rotation, the direction of the vector is out of the page (taken from Han et al. [1]). Solid lines, without rotation; dashed lines, with Coriolis force only; dotted line, with buoyancy and Coriolis forces.
www.witpress.com, ISSN 1755-8336 (on-line) WIT Transactions on State of the Art in Science and Engineering, Vol , © 20 WIT Press42 08
260 Thermal Engineering in Power Systems
The buoyancy number:
( )in 2 mT T RBo Rot
T d
⎛ ⎞±= ⎜ ⎟⎝ ⎠
(23)
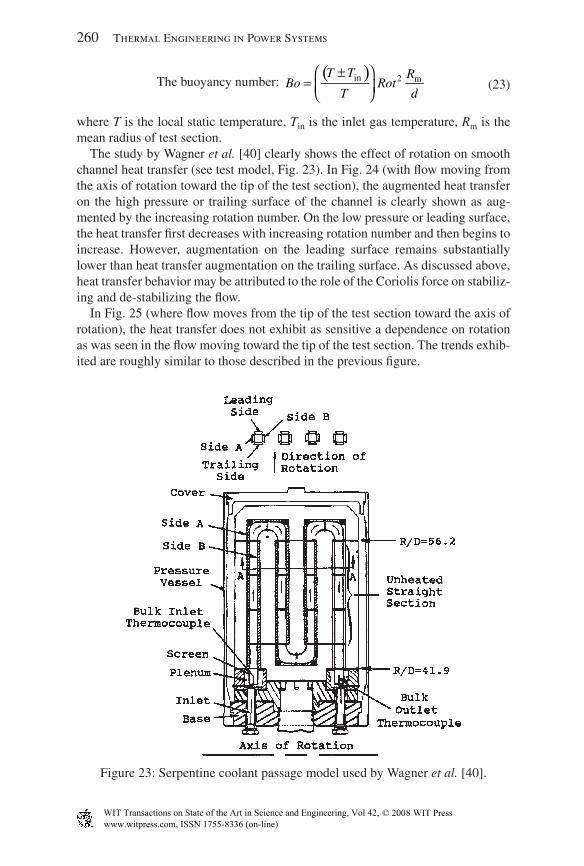
where T is the local static temperature, Tin is the inlet gas temperature, Rm is the mean radius of test section.
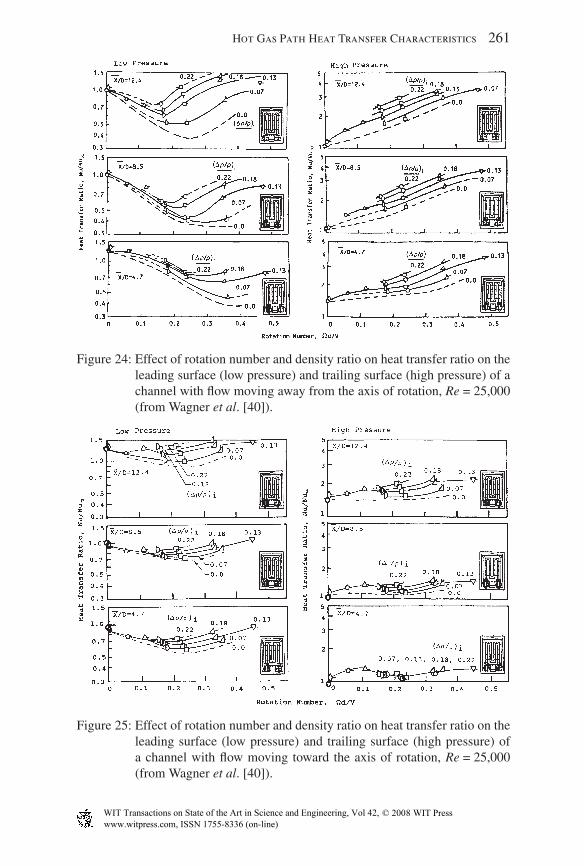
The study by Wagner et al. [40] clearly shows the effect of rotation on smooth channel heat transfer (see test model, Fig. 23). In Fig. 24 (with fl ow moving from the axis of rotation toward the tip of the test section), the augmented heat transfer on the high pressure or trailing surface of the channel is clearly shown as aug-mented by the increasing rotation number. On the low pressure or leading surface, the heat transfer fi rst decreases with increasing rotation number and then begins to increase. However, augmentation on the leading surface remains substantially lower than heat transfer augmentation on the trailing surface. As discussed above, heat transfer behavior may be attributed to the role of the Coriolis force on stabiliz-ing and de-stabilizing the fl ow.
In Fig. 25 (where fl ow moves from the tip of the test section toward the axis of rotation), the heat transfer does not exhibit as sensitive a dependence on rotation as was seen in the fl ow moving toward the tip of the test section. The trends exhib-ited are roughly similar to those described in the previous fi gure.
Figure 23: Serpentine coolant passage model used by Wagner et al. [40].
www.witpress.com, ISSN 1755-8336 (on-line) WIT Transactions on State of the Art in Science and Engineering, Vol , © 20 WIT Press42 08
Hot Gas Path Heat Transfer Characteristics 261
Figure 24: Effect of rotation number and density ratio on heat transfer ratio on the leading surface (low pressure) and trailing surface (high pressure) of a channel with fl ow moving away from the axis of rotation, Re = 25,000 (from Wagner et al. [40]).
Figure 25: Effect of rotation number and density ratio on heat transfer ratio on the leading surface (low pressure) and trailing surface (high pressure) of a channel with fl ow moving toward the axis of rotation, Re = 25,000 (from Wagner et al. [40]).
www.witpress.com, ISSN 1755-8336 (on-line) WIT Transactions on State of the Art in Science and Engineering, Vol , © 20 WIT Press42 08
262 Thermal Engineering in Power Systems
3.3.4 Rough channel coolingThe heat transfer coeffi cients that can be obtained with smooth channels are not suffi cient to transport the high heat loads of modern airfoils. To increase heat transfer coeffi cients, roughening is often employed on the channel walls. Perhaps the most popular method is by adding ribs.
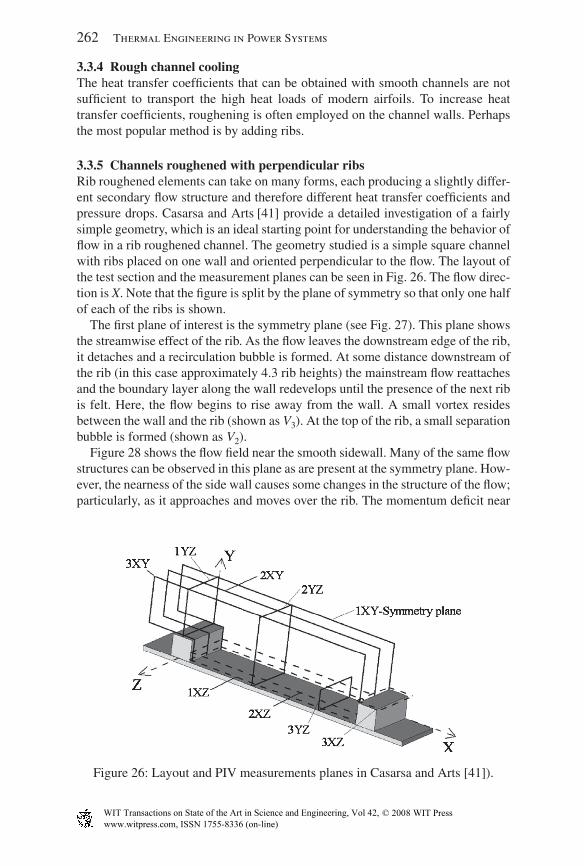
3.3.5 Channels roughened with perpendicular ribsRib roughened elements can take on many forms, each producing a slightly differ-ent secondary fl ow structure and therefore different heat transfer coeffi cients and pressure drops. Casarsa and Arts [41] provide a detailed investigation of a fairly simple geometry, which is an ideal starting point for understanding the behavior of fl ow in a rib roughened channel. The geometry studied is a simple square channel with ribs placed on one wall and oriented perpendicular to the fl ow. The layout of the test section and the measurement planes can be seen in Fig. 26. The fl ow direc-tion is X. Note that the fi gure is split by the plane of symmetry so that only one half of each of the ribs is shown.
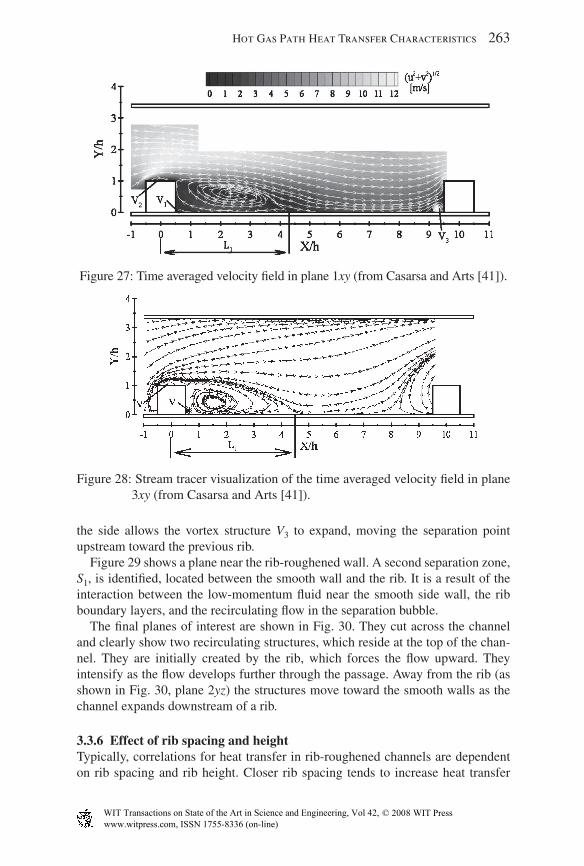
The fi rst plane of interest is the symmetry plane (see Fig. 27). This plane shows the streamwise effect of the rib. As the fl ow leaves the downstream edge of the rib, it detaches and a recirculation bubble is formed. At some distance downstream of the rib (in this case approximately 4.3 rib heights) the mainstream fl ow reattaches and the boundary layer along the wall redevelops until the presence of the next rib is felt. Here, the fl ow begins to rise away from the wall. A small vortex resides between the wall and the rib (shown as V3). At the top of the rib, a small separation bubble is formed (shown as V2).
Figure 28 shows the fl ow fi eld near the smooth sidewall. Many of the same fl ow structures can be observed in this plane as are present at the symmetry plane. How-ever, the nearness of the side wall causes some changes in the structure of the fl ow; particularly, as it approaches and moves over the rib. The momentum defi cit near
Figure 26: Layout and PIV measurements planes in Casarsa and Arts [41]).
www.witpress.com, ISSN 1755-8336 (on-line) WIT Transactions on State of the Art in Science and Engineering, Vol , © 20 WIT Press42 08
Hot Gas Path Heat Transfer Characteristics 263
the side allows the vortex structure V3 to expand, moving the separation point upstream toward the previous rib.
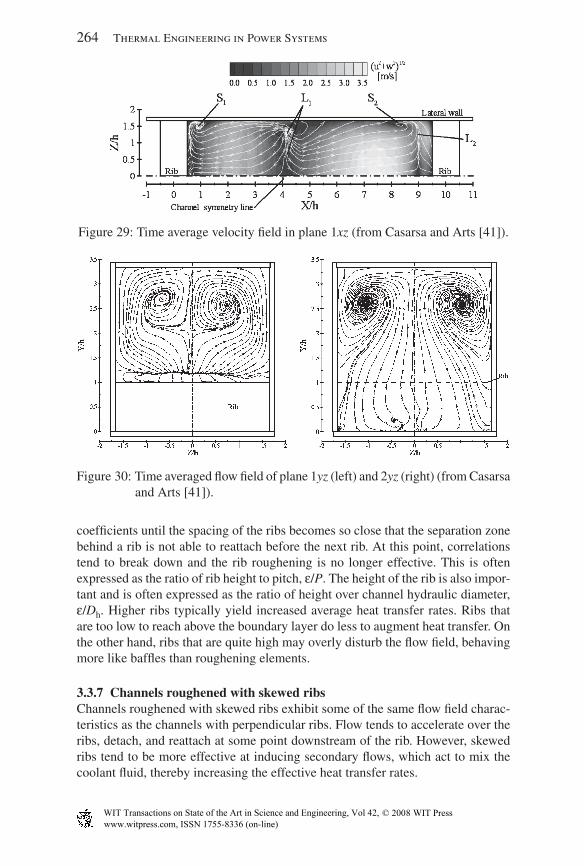
Figure 29 shows a plane near the rib-roughened wall. A second separation zone, S1, is identifi ed, located between the smooth wall and the rib. It is a result of the interaction between the low-momentum fl uid near the smooth side wall, the rib boundary layers, and the recirculating fl ow in the separation bubble.
The fi nal planes of interest are shown in Fig. 30. They cut across the channel and clearly show two recirculating structures, which reside at the top of the chan-nel. They are initially created by the rib, which forces the fl ow upward. They intensify as the fl ow develops further through the passage. Away from the rib (as shown in Fig. 30, plane 2yz) the structures move toward the smooth walls as the channel expands downstream of a rib.
3.3.6 Effect of rib spacing and heightTypically, correlations for heat transfer in rib-roughened channels are dependent on rib spacing and rib height. Closer rib spacing tends to increase heat transfer
Figure 27: Time averaged velocity fi eld in plane 1xy (from Casarsa and Arts [41]).
Figure 28: Stream tracer visualization of the time averaged velocity fi eld in plane 3xy (from Casarsa and Arts [41]).
www.witpress.com, ISSN 1755-8336 (on-line) WIT Transactions on State of the Art in Science and Engineering, Vol , © 20 WIT Press42 08
264 Thermal Engineering in Power Systems
coeffi cients until the spacing of the ribs becomes so close that the separation zone behind a rib is not able to reattach before the next rib. At this point, correlations tend to break down and the rib roughening is no longer effective. This is often expressed as the ratio of rib height to pitch, ε/P. The height of the rib is also impor-tant and is often expressed as the ratio of height over channel hydraulic diameter, ε/Dh. Higher ribs typically yield increased average heat transfer rates. Ribs that are too low to reach above the boundary layer do less to augment heat transfer. On the other hand, ribs that are quite high may overly disturb the fl ow fi eld, behaving more like baffl es than roughening elements.
3.3.7 Channels roughened with skewed ribsChannels roughened with skewed ribs exhibit some of the same fl ow fi eld charac-teristics as the channels with perpendicular ribs. Flow tends to accelerate over the ribs, detach, and reattach at some point downstream of the rib. However, skewed ribs tend to be more effective at inducing secondary fl ows, which act to mix the coolant fl uid, thereby increasing the effective heat transfer rates.
Figure 29: Time average velocity fi eld in plane 1xz (from Casarsa and Arts [41]).
Figure 30: Time averaged fl ow fi eld of plane 1yz (left) and 2yz (right) (from Casarsa and Arts [41]).
www.witpress.com, ISSN 1755-8336 (on-line) WIT Transactions on State of the Art in Science and Engineering, Vol , © 20 WIT Press42 08
Hot Gas Path Heat Transfer Characteristics 265
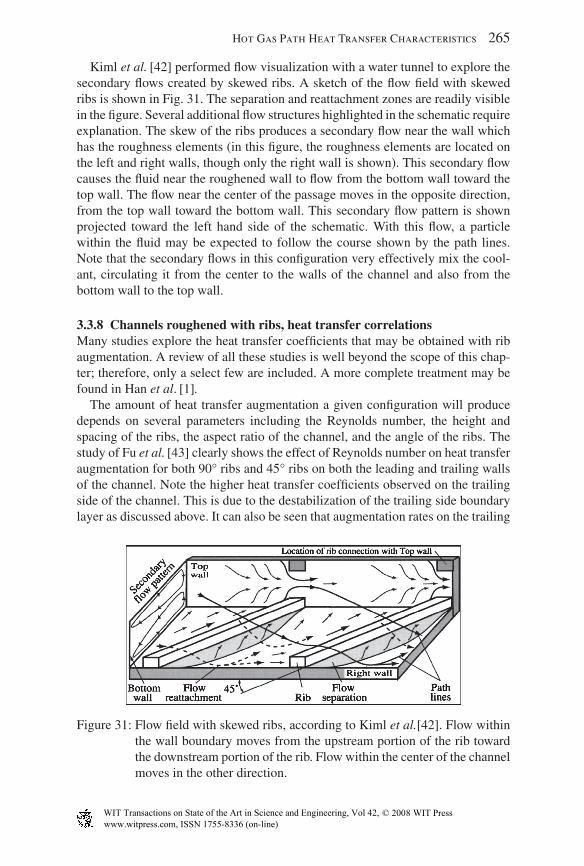
Kiml et al. [42] performed fl ow visualization with a water tunnel to explore the secondary fl ows created by skewed ribs. A sketch of the fl ow fi eld with skewed ribs is shown in Fig. 31. The separation and reattachment zones are readily visible in the fi gure. Several additional fl ow structures highlighted in the schematic require explanation. The skew of the ribs produces a secondary fl ow near the wall which has the roughness elements (in this fi gure, the roughness elements are located on the left and right walls, though only the right wall is shown). This secondary fl ow causes the fl uid near the roughened wall to fl ow from the bottom wall toward the top wall. The fl ow near the center of the passage moves in the opposite direction, from the top wall toward the bottom wall. This secondary fl ow pattern is shown projected toward the left hand side of the schematic. With this fl ow, a particle within the fl uid may be expected to follow the course shown by the path lines. Note that the secondary fl ows in this confi guration very effectively mix the cool-ant, circulating it from the center to the walls of the channel and also from the bottom wall to the top wall.
3.3.8 Channels roughened with ribs, heat transfer correlationsMany studies explore the heat transfer coeffi cients that may be obtained with rib augmentation. A review of all these studies is well beyond the scope of this chap-ter; therefore, only a select few are included. A more complete treatment may be found in Han et al. [1].
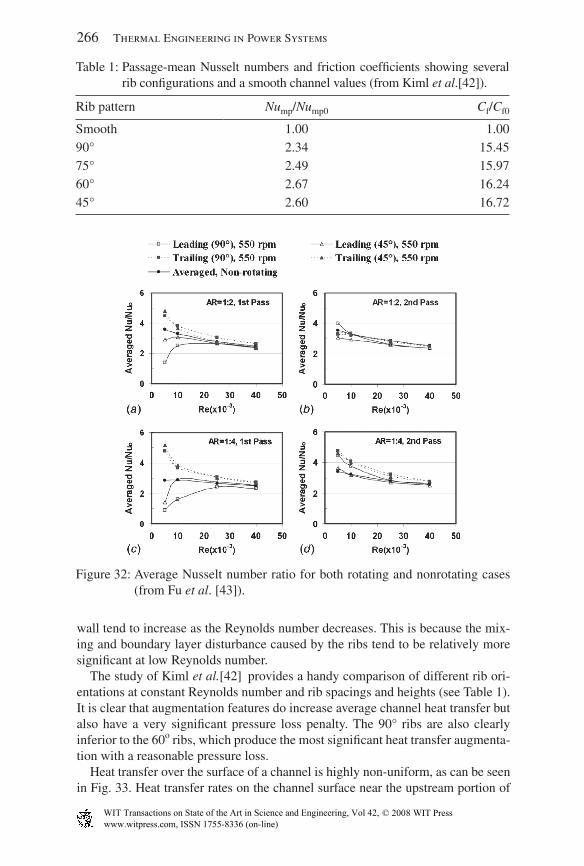
The amount of heat transfer augmentation a given confi guration will produce depends on several parameters including the Reynolds number, the height and spacing of the ribs, the aspect ratio of the channel, and the angle of the ribs. The study of Fu et al. [43] clearly shows the effect of Reynolds number on heat transfer augmentation for both 90° ribs and 45° ribs on both the leading and trailing walls of the channel. Note the higher heat transfer coeffi cients observed on the trailing side of the channel. This is due to the destabilization of the trailing side boundary layer as discussed above. It can also be seen that augmentation rates on the trailing
Figure 31: Flow fi eld with skewed ribs, according to Kiml et al.[42]. Flow within the wall boundary moves from the upstream portion of the rib toward the downstream portion of the rib. Flow within the center of the channel moves in the other direction.
www.witpress.com, ISSN 1755-8336 (on-line) WIT Transactions on State of the Art in Science and Engineering, Vol , © 20 WIT Press42 08
266 Thermal Engineering in Power Systems
wall tend to increase as the Reynolds number decreases. This is because the mix-ing and boundary layer disturbance caused by the ribs tend to be relatively more signifi cant at low Reynolds number.
The study of Kiml et al.[42] provides a handy comparison of different rib ori-entations at constant Reynolds number and rib spacings and heights (see Table 1). It is clear that augmentation features do increase average channel heat transfer but also have a very signifi cant pressure loss penalty. The 90° ribs are also clearly inferior to the 60o ribs, which produce the most signifi cant heat transfer augmenta-tion with a reasonable pressure loss.
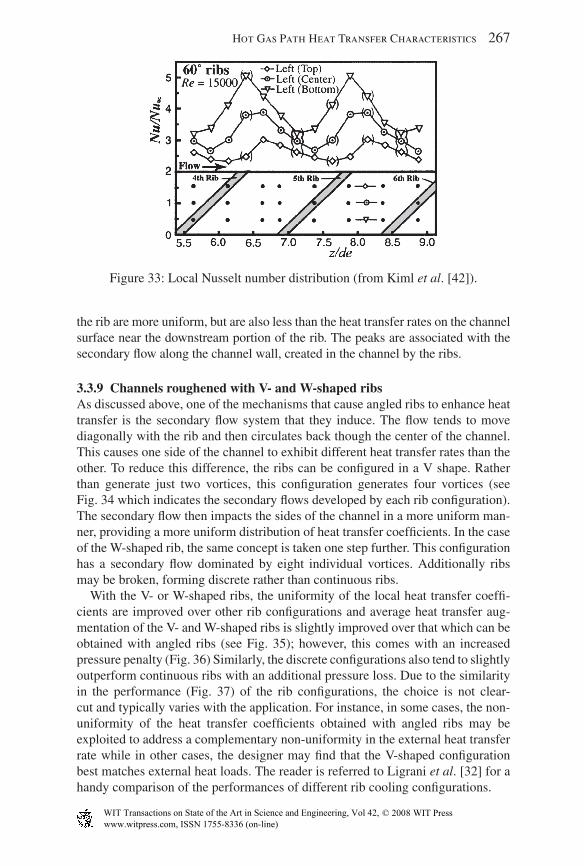
Heat transfer over the surface of a channel is highly non-uniform, as can be seen in Fig. 33. Heat transfer rates on the channel surface near the upstream portion of
Figure 32: Average Nusselt number ratio for both rotating and nonrotating cases (from Fu et al. [43]).
Table 1: Passage-mean Nusselt numbers and friction coeffi cients showing several rib confi gurations and a smooth channel values (from Kiml et al.[42]).
Rib pattern Nump/Nump0 Cf/Cf0
Smooth 1.00 1.0090° 2.34 15.4575° 2.49 15.9760° 2.67 16.2445° 2.60 16.72
www.witpress.com, ISSN 1755-8336 (on-line) WIT Transactions on State of the Art in Science and Engineering, Vol , © 20 WIT Press42 08
Hot Gas Path Heat Transfer Characteristics 267
the rib are more uniform, but are also less than the heat transfer rates on the channel surface near the downstream portion of the rib. The peaks are associated with the secondary fl ow along the channel wall, created in the channel by the ribs.
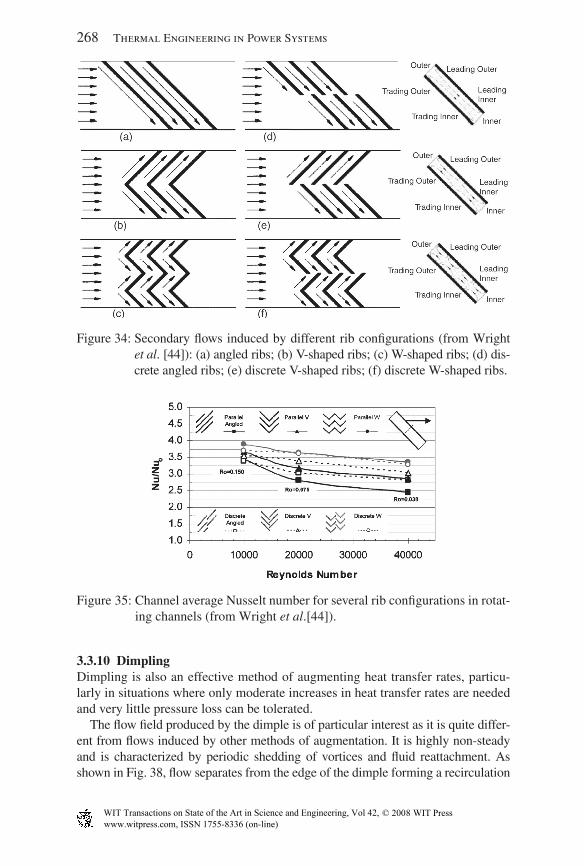
3.3.9 Channels roughened with V- and W-shaped ribsAs discussed above, one of the mechanisms that cause angled ribs to enhance heat transfer is the secondary fl ow system that they induce. The fl ow tends to move diagonally with the rib and then circulates back though the center of the channel. This causes one side of the channel to exhibit different heat transfer rates than the other. To reduce this difference, the ribs can be confi gured in a V shape. Rather than generate just two vortices, this confi guration generates four vortices (see Fig. 34 which indicates the secondary fl ows developed by each rib confi guration). The secondary fl ow then impacts the sides of the channel in a more uniform man-ner, providing a more uniform distribution of heat transfer coeffi cients. In the case of the W-shaped rib, the same concept is taken one step further. This confi guration has a secondary fl ow dominated by eight individual vortices. Additionally ribs may be broken, forming discrete rather than continuous ribs.
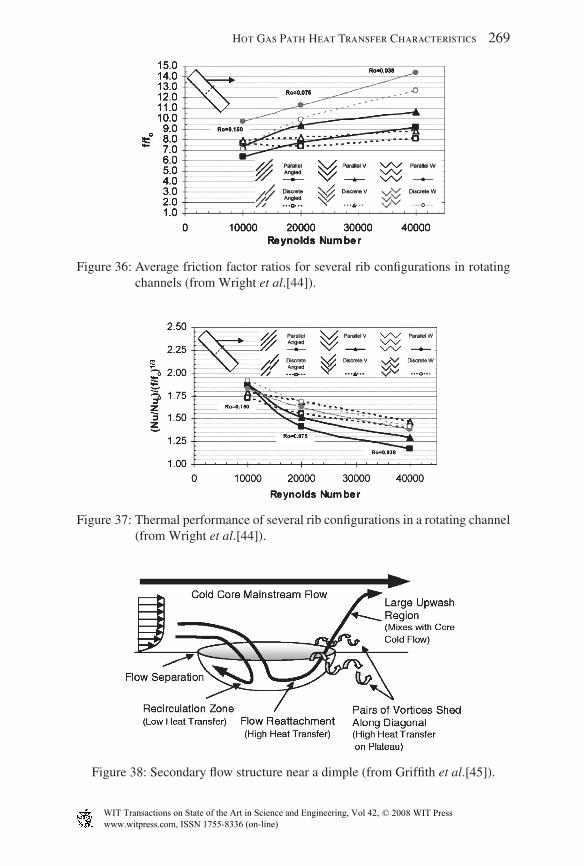
With the V- or W-shaped ribs, the uniformity of the local heat transfer coeffi -cients are improved over other rib confi gurations and average heat transfer aug-mentation of the V- and W-shaped ribs is slightly improved over that which can be obtained with angled ribs (see Fig. 35); however, this comes with an increased pressure penalty (Fig. 36) Similarly, the discrete confi gurations also tend to slightly outperform continuous ribs with an additional pressure loss. Due to the similarity in the performance (Fig. 37) of the rib confi gurations, the choice is not clear- cut and typically varies with the application. For instance, in some cases, the non-uniformity of the heat transfer coeffi cients obtained with angled ribs may be exploited to address a complementary non-uniformity in the external heat transfer rate while in other cases, the designer may fi nd that the V-shaped confi guration best matches external heat loads. The reader is referred to Ligrani et al. [32] for a handy comparison of the performances of different rib cooling confi gurations.
Figure 33: Local Nusselt number distribution (from Kiml et al. [42]).
www.witpress.com, ISSN 1755-8336 (on-line) WIT Transactions on State of the Art in Science and Engineering, Vol , © 20 WIT Press42 08
268 Thermal Engineering in Power Systems
3.3.10 DimplingDimpling is also an effective method of augmenting heat transfer rates, particu-larly in situations where only moderate increases in heat transfer rates are needed and very little pressure loss can be tolerated.
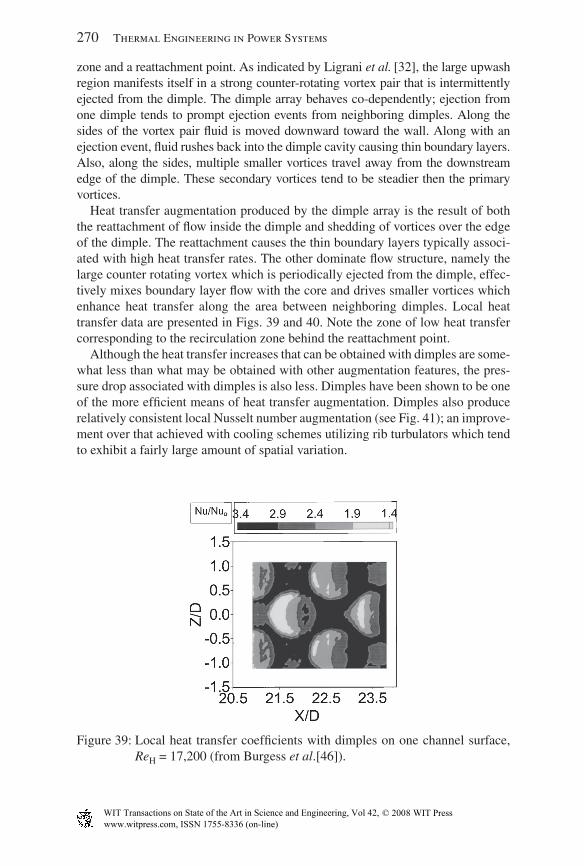
The fl ow fi eld produced by the dimple is of particular interest as it is quite differ-ent from fl ows induced by other methods of augmentation. It is highly non-steady and is characterized by periodic shedding of vortices and fl uid reattachment. As shown in Fig. 38, fl ow separates from the edge of the dimple forming a recirculation
Figure 34: Secondary fl ows induced by different rib confi gurations (from Wright et al. [44]): (a) angled ribs; (b) V-shaped ribs; (c) W-shaped ribs; (d) dis-crete angled ribs; (e) discrete V-shaped ribs; (f) discrete W-shaped ribs.
Figure 35: Channel average Nusselt number for several rib confi gurations in rotat-ing channels (from Wright et al.[44]).
www.witpress.com, ISSN 1755-8336 (on-line) WIT Transactions on State of the Art in Science and Engineering, Vol , © 20 WIT Press42 08
Hot Gas Path Heat Transfer Characteristics 269
Figure 36: Average friction factor ratios for several rib confi gurations in rotating channels (from Wright et al.[44]).
Figure 37: Thermal performance of several rib confi gurations in a rotating channel (from Wright et al.[44]).
Figure 38: Secondary fl ow structure near a dimple (from Griffi th et al.[45]).
www.witpress.com, ISSN 1755-8336 (on-line) WIT Transactions on State of the Art in Science and Engineering, Vol , © 20 WIT Press42 08
270 Thermal Engineering in Power Systems
zone and a reattachment point. As indicated by Ligrani et al. [32], the large upwash region manifests itself in a strong counter-rotating vortex pair that is intermittently ejected from the dimple. The dimple array behaves co-dependently; ejection from one dimple tends to prompt ejection events from neighboring dimples. Along the sides of the vortex pair fl uid is moved downward toward the wall. Along with an ejection event, fl uid rushes back into the dimple cavity causing thin boundary layers. Also, along the sides, multiple smaller vortices travel away from the downstream edge of the dimple. These secondary vortices tend to be steadier then the primary vortices.
Heat transfer augmentation produced by the dimple array is the result of both the reattachment of fl ow inside the dimple and shedding of vortices over the edge of the dimple. The reattachment causes the thin boundary layers typically associ-ated with high heat transfer rates. The other dominate fl ow structure, namely the large counter rotating vortex which is periodically ejected from the dimple, effec-tively mixes boundary layer fl ow with the core and drives smaller vortices which enhance heat transfer along the area between neighboring dimples. Local heat transfer data are presented in Figs. 39 and 40. Note the zone of low heat transfer corresponding to the recirculation zone behind the reattachment point.
Although the heat transfer increases that can be obtained with dimples are some-what less than what may be obtained with other augmentation features, the pres-sure drop associated with dimples is also less. Dimples have been shown to be one of the more effi cient means of heat transfer augmentation. Dimples also produce relatively consistent local Nusselt number augmentation (see Fig. 41); an improve-ment over that achieved with cooling schemes utilizing rib turbulators which tend to exhibit a fairly large amount of spatial variation.
Figure 39: Local heat transfer coeffi cients with dimples on one channel surface, ReH = 17,200 (from Burgess et al.[46]).
www.witpress.com, ISSN 1755-8336 (on-line) WIT Transactions on State of the Art in Science and Engineering, Vol , © 20 WIT Press42 08
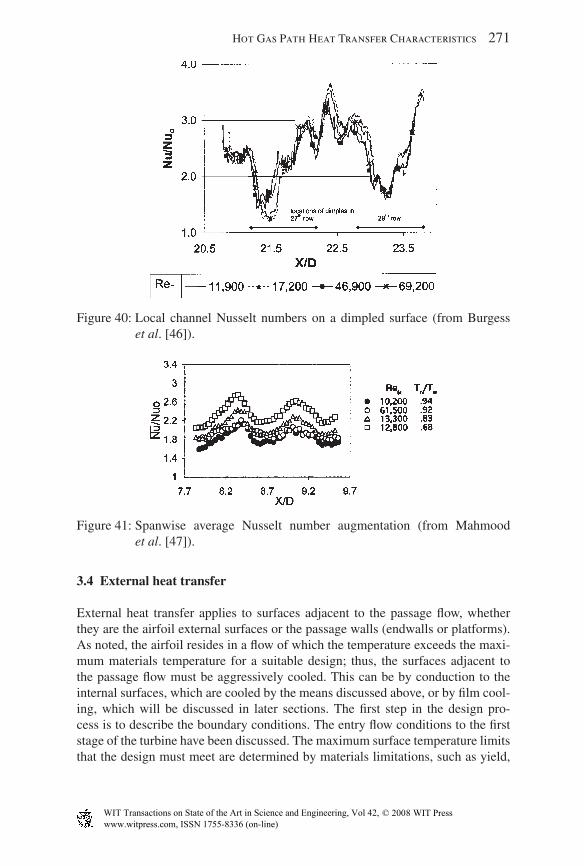
Hot Gas Path Heat Transfer Characteristics 271
3.4 External heat transfer
External heat transfer applies to surfaces adjacent to the passage fl ow, whether they are the airfoil external surfaces or the passage walls (endwalls or platforms). As noted, the airfoil resides in a fl ow of which the temperature exceeds the maxi-mum materials temperature for a suitable design; thus, the surfaces adjacent to the passage fl ow must be aggressively cooled. This can be by conduction to the internal surfaces, which are cooled by the means discussed above, or by fi lm cool-ing, which will be discussed in later sections. The fi rst step in the design pro-cess is to describe the boundary conditions. The entry fl ow conditions to the fi rst stage of the turbine have been discussed. The maximum surface temperature limits that the design must meet are determined by materials limitations, such as yield,
Figure 40: Local channel Nusselt numbers on a dimpled surface (from Burgess et al. [46]).
Figure 41: Spanwise average Nusselt number augmentation (from Mahmood et al. [47]).
www.witpress.com, ISSN 1755-8336 (on-line) WIT Transactions on State of the Art in Science and Engineering, Vol , © 20 WIT Press42 08
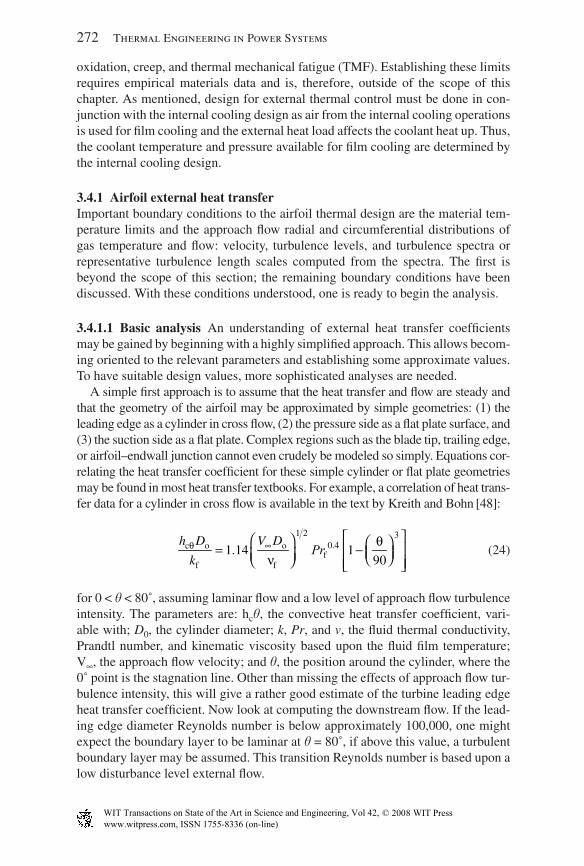
272 Thermal Engineering in Power Systems
oxidation, creep, and thermal mechanical fatigue (TMF). Establishing these limits requires empirical materials data and is, therefore, outside of the scope of this chapter. As mentioned, design for external thermal control must be done in con-junction with the internal cooling design as air from the internal cooling operations is used for fi lm cooling and the external heat load affects the coolant heat up. Thus, the coolant temperature and pressure available for fi lm cooling are determined by the internal cooling design.
3.4.1 Airfoil external heat transferImportant boundary conditions to the airfoil thermal design are the material tem-perature limits and the approach fl ow radial and circumferential distributions of gas temperature and fl ow: velocity, turbulence levels, and turbulence spectra or representative turbulence length scales computed from the spectra. The fi rst is beyond the scope of this section; the remaining boundary conditions have been discussed. With these conditions understood, one is ready to begin the analysis.
3.4.1.1 Basic analysis An understanding of external heat transfer coeffi cients may be gained by beginning with a highly simplifi ed approach. This allows becom-ing oriented to the relevant parameters and establishing some approximate values. To have suitable design values, more sophisticated analyses are needed.
A simple fi rst approach is to assume that the heat transfer and fl ow are steady and that the geometry of the airfoil may be approximated by simple geometries: (1) the leading edge as a cylinder in cross fl ow, (2) the pressure side as a fl at plate surface, and (3) the suction side as a fl at plate. Complex regions such as the blade tip, trailing edge, or airfoil–endwall junction cannot even crudely be modeled so simply. Equations cor-relating the heat transfer coeffi cient for these simple cylinder or fl at plate geometries may be found in most heat transfer textbooks. For example, a correlation of heat trans-fer data for a cylinder in cross fl ow is available in the text by Kreith and Bohn [48]:
1 2 30.4c o o
ff f
1.14 190
h D V D
kθ θ
ν∞
⎡ ⎤⎛ ⎞ ⎛ ⎞= −⎢ ⎥⎜ ⎟⎜ ⎟ ⎝ ⎠⎝ ⎠ ⎢ ⎥⎣ ⎦Pr
(24)
for 0 < q < 80˚, assuming laminar fl ow and a low level of approach fl ow turbulence intensity. The parameters are: hcq, the convective heat transfer coeffi cient, vari-able with; D0, the cylinder diameter; k, Pr, and v, the fl uid thermal conductivity, Prandtl number, and kinematic viscosity based upon the fl uid fi lm temperature; V∞, the approach fl ow velocity; and q, the position around the cylinder, where the 0˚ point is the stagnation line. Other than missing the effects of approach fl ow tur-bulence intensity, this will give a rather good estimate of the turbine leading edge heat transfer coeffi cient. Now look at computing the downstream fl ow. If the lead-ing edge diameter Reynolds number is below approximately 100,000, one might expect the boundary layer to be laminar at q = 80˚, if above this value, a turbulent boundary layer may be assumed. This transition Reynolds number is based upon a low disturbance level external fl ow.
www.witpress.com, ISSN 1755-8336 (on-line) WIT Transactions on State of the Art in Science and Engineering, Vol , © 20 WIT Press42 08
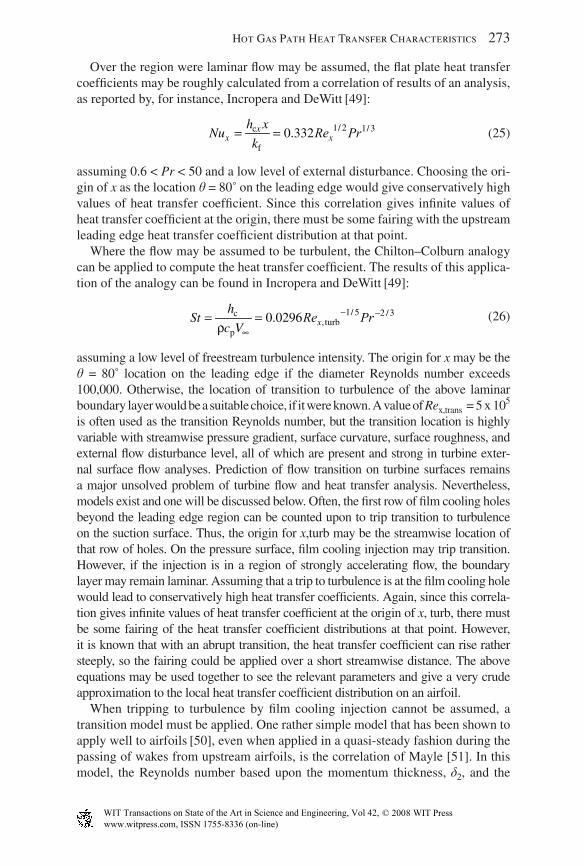
Hot Gas Path Heat Transfer Characteristics 273
Over the region were laminar fl ow may be assumed, the fl at plate heat transfer coeffi cients may be roughly calculated from a correlation of results of an analysis, as reported by, for instance, Incropera and DeWitt [49]:
Re Pr= = 1/ 2 1/3c
f
0.332xx x
h xNu
k (25)
assuming 0.6 < Pr < 50 and a low level of external disturbance. Choosing the ori-gin of x as the location q = 80˚ on the leading edge would give conservatively high values of heat transfer coeffi cient. Since this correlation gives infi nite values of heat transfer coeffi cient at the origin, there must be some fairing with the upstream leading edge heat transfer coeffi cient distribution at that point.
Where the fl ow may be assumed to be turbulent, the Chilton–Colburn analogy can be applied to compute the heat transfer coeffi cient. The results of this applica-tion of the analogy can be found in Incropera and DeWitt [49]:
1/ 5 2 /3c,turb
p
0.0296 xh
Stc Vρ
− −
∞= = Re Pr
(26)
assuming a low level of freestream turbulence intensity. The origin for x may be the q = 80˚ location on the leading edge if the diameter Reynolds number exceeds 100,000. Otherwise, the location of transition to turbulence of the above laminar boundary layer would be a suitable choice, if it were known. A value of Rex,trans = 5 x 10⁵ is often used as the transition Reynolds number, but the transition location is highly variable with streamwise pressure gradient, surface curvature, surface roughness, and external fl ow disturbance level, all of which are present and strong in turbine exter-nal surface fl ow analyses. Prediction of fl ow transition on turbine surfaces remains a major unsolved problem of turbine fl ow and heat transfer analysis. Nevertheless, models exist and one will be discussed below. Often, the fi rst row of fi lm cooling holes beyond the leading edge region can be counted upon to trip transition to turbulence on the suction surface. Thus, the origin for x,turb may be the streamwise location of that row of holes. On the pressure surface, fi lm cooling injection may trip transition. However, if the injection is in a region of strongly accelerating fl ow, the boundary layer may remain laminar. Assuming that a trip to turbulence is at the fi lm cooling hole would lead to conservatively high heat transfer coeffi cients. Again, since this correla-tion gives infi nite values of heat transfer coeffi cient at the origin of x, turb, there must be some fairing of the heat transfer coeffi cient distributions at that point. However, it is known that with an abrupt transition, the heat transfer coeffi cient can rise rather steeply, so the fairing could be applied over a short streamwise distance. The above equations may be used together to see the relevant parameters and give a very crude approximation to the local heat transfer coeffi cient distribution on an airfoil.
When tripping to turbulence by fi lm cooling injection cannot be assumed, a transition model must be applied. One rather simple model that has been shown to apply well to airfoils [50], even when applied in a quasi-steady fashion during the passing of wakes from upstream airfoils, is the correlation of Mayle [51]. In this model, the Reynolds number based upon the momentum thickness, d2, and the
www.witpress.com, ISSN 1755-8336 (on-line) WIT Transactions on State of the Art in Science and Engineering, Vol , © 20 WIT Press42 08
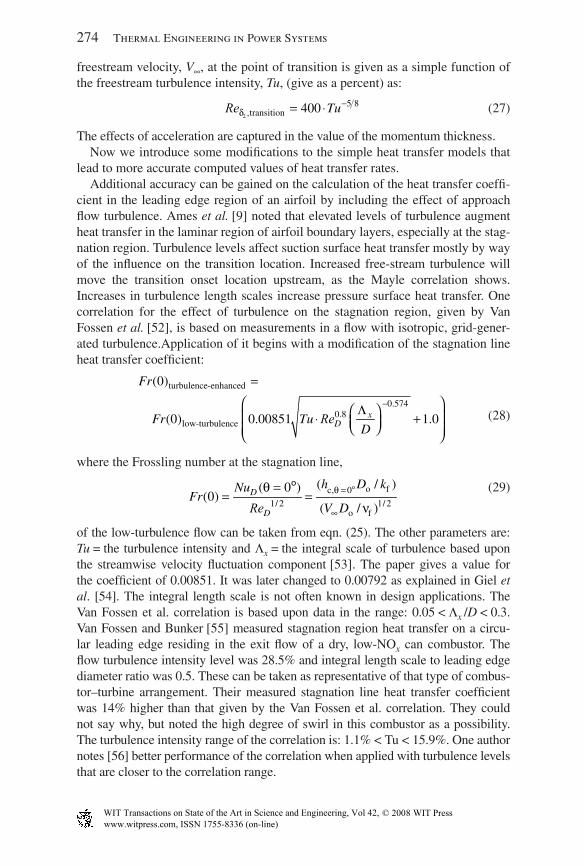
274 Thermal Engineering in Power Systems
freestream velocity, V∞, at the point of transition is given as a simple function of the freestream turbulence intensity, Tu, (give as a percent) as:
Reδ
−= ⋅2
5 8,transition 400 Tu
(27)
The effects of acceleration are captured in the value of the momentum thickness.Now we introduce some modifi cations to the simple heat transfer models that
lead to more accurate computed values of heat transfer rates.Additional accuracy can be gained on the calculation of the heat transfer coeffi -
cient in the leading edge region of an airfoil by including the effect of approach fl ow turbulence. Ames et al. [9] noted that elevated levels of turbulence augment heat transfer in the laminar region of airfoil boundary layers, especially at the stag-nation region. Turbulence levels affect suction surface heat transfer mostly by way of the infl uence on the transition location. Increased free-stream turbulence will move the transition onset location upstream, as the Mayle correlation shows. Increases in turbulence length scales increase pressure surface heat transfer. One correlation for the effect of turbulence on the stagnation region, given by Van Fossen et al. [52], is based on measurements in a fl ow with isotropic, grid-gener-ated turbulence.Application of it begins with a modifi cation of the stagnation line heat transfer coeffi cient:
Re−
=
⎛ ⎞Λ⎛ ⎞⎜ ⎟⋅ +⎜ ⎟⎝ ⎠⎜ ⎟⎝ ⎠
turbulence-enhanced
0.5740.8
low-turbulence
(0)
(0) 0.00851 1.0xD
Fr
Fr TuD
(28)
where the Frossling number at the stagnation line,
o fc, 0
1/ 2 1/ 2o f
( / )( 0 )(0)
( / )D
D
h D kNuFr
V D
θ θν
=
∞
== =
oo
Re
(29)
of the low-turbulence fl ow can be taken from eqn. (25). The other parameters are: Tu = the turbulence intensity and Λx = the integral scale of turbulence based upon the streamwise velocity fl uctuation component [53]. The paper gives a value for the coeffi cient of 0.00851. It was later changed to 0.00792 as explained in Giel et al. [54]. The integral length scale is not often known in design applications. The Van Fossen et al. correlation is based upon data in the range: 0.05 < Λx /D < 0.3. Van Fossen and Bunker [55] measured stagnation region heat transfer on a circu-lar leading edge residing in the exit fl ow of a dry, low-NOx can combustor. The fl ow turbulence intensity level was 28.5% and integral length scale to leading edge diameter ratio was 0.5. These can be taken as representative of that type of combus-tor–turbine arrangement. Their measured stagnation line heat transfer coeffi cient was 14% higher than that given by the Van Fossen et al. correlation. They could not say why, but noted the high degree of swirl in this combustor as a possibility. The turbulence intensity range of the correlation is: 1.1% < Tu < 15.9%. One author notes [56] better performance of the correlation when applied with turbulence levels that are closer to the correlation range.
www.witpress.com, ISSN 1755-8336 (on-line) WIT Transactions on State of the Art in Science and Engineering, Vol , © 20 WIT Press42 08
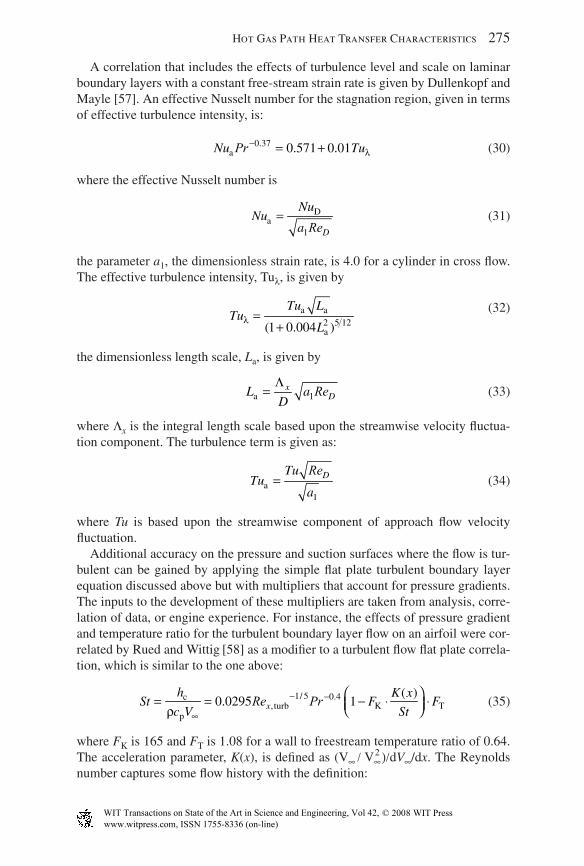
Hot Gas Path Heat Transfer Characteristics 275
A correlation that includes the effects of turbulence level and scale on laminar boundary layers with a constant free-stream strain rate is given by Dullenkopf and Mayle [57]. An effective Nusselt number for the stagnation region, given in terms of effective turbulence intensity, is:
Pr λ− = +0.37
a 0.571 0.01Nu Tu (30)
where the effective Nusselt number is
Da
1 D
NuNu
a=
Re
(31)
the parameter a1, the dimensionless strain rate, is 4.0 for a cylinder in cross fl ow. The effective turbulence intensity, Tuλ, is given by
a a2 5 12a(1 0.004 )
Tu LTu
Lλ =
+
(32)
the dimensionless length scale, La, is given by
a 1
xDL a
D
Λ= Re
(33)
where Λx is the integral length scale based upon the streamwise velocity fl uctua-tion component. The turbulence term is given as:
a
1
DTuTu
a=
Re
(34)
where Tu is based upon the streamwise component of approach fl ow velocity fl uctuation.
Additional accuracy on the pressure and suction surfaces where the fl ow is tur-bulent can be gained by applying the simple fl at plate turbulent boundary layer equation discussed above but with multipliers that account for pressure gradients. The inputs to the development of these multipliers are taken from analysis, corre-lation of data, or engine experience. For instance, the effects of pressure gradient and temperature ratio for the turbulent boundary layer fl ow on an airfoil were cor-related by Rued and Wittig [58] as a modifi er to a turbulent fl ow fl at plate correla-tion, which is similar to the one above:
1/ 5 0.4c,turb K T
p
( )0.0295 1x
h K xSt F F
c V Stρ− −
∞
⎛ ⎞= = − ⋅ ⋅⎜ ⎟⎝ ⎠Re Pr
(35)
where FK is 165 and FT is 1.08 for a wall to freestream temperature ratio of 0.64. The acceleration parameter, K(x), is defi ned as (V∞ / V∞
2 )/dV∞/dx. The Reynolds number captures some fl ow history with the defi nition:
www.witpress.com, ISSN 1755-8336 (on-line) WIT Transactions on State of the Art in Science and Engineering, Vol , © 20 WIT Press42 08
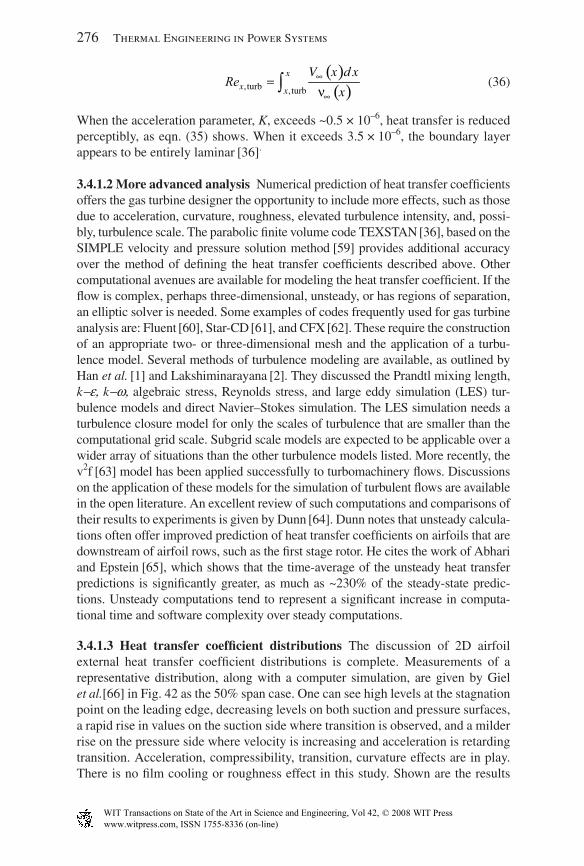
276 Thermal Engineering in Power Systems
( )( ), turb ,turb
x
x x
V x x
xν∞
∞= ∫
dRe
(36)
When the acceleration parameter, K, exceeds ~0.5 × 10⁻⁶, heat transfer is reduced perceptibly, as eqn. (35) shows. When it exceeds 3.5 × 10⁻⁶, the boundary layer appears to be entirely laminar [36].
3.4.1.2 More advanced analysis Numerical prediction of heat transfer coeffi cients offers the gas turbine designer the opportunity to include more effects, such as those due to acceleration, curvature, roughness, elevated turbulence intensity, and, possi-bly, turbulence scale. The parabolic fi nite volume code TEXSTAN [36], based on the SIMPLE velocity and pressure solution method [59] provides additional accuracy over the method of defi ning the heat transfer coeffi cients described above. Other computational avenues are available for modeling the heat transfer coeffi cient. If the fl ow is complex, perhaps three-dimensional, unsteady, or has regions of separation, an elliptic solver is needed. Some examples of codes frequently used for gas turbine analysis are: Fluent [60], Star-CD [61], and CFX [62]. These require the construction of an appropriate two- or three-dimensional mesh and the application of a turbu-lence model. Several methods of turbulence modeling are available, as outlined by Han et al. [1] and Lakshiminarayana [2]. They discussed the Prandtl mixing length, k−ε, k−ω, algebraic stress, Reynolds stress, and large eddy simulation (LES) tur-bulence models and direct Navier–Stokes simulation. The LES simulation needs a turbulence closure model for only the scales of turbulence that are smaller than the computational grid scale. Subgrid scale models are expected to be applicable over a wider array of situations than the other turbulence models listed. More recently, the v2f [63] model has been applied successfully to turbomachinery fl ows. Discussions on the application of these models for the simulation of turbulent fl ows are available in the open literature. An excellent review of such computations and comparisons of their results to experiments is given by Dunn [64]. Dunn notes that unsteady calcula-tions often offer improved prediction of heat transfer coeffi cients on airfoils that are downstream of airfoil rows, such as the fi rst stage rotor. He cites the work of Abhari and Epstein [65], which shows that the time-average of the unsteady heat transfer predictions is signifi cantly greater, as much as ~230% of the steady-state predic-tions. Unsteady computations tend to represent a signifi cant increase in computa-tional time and software complexity over steady computations.
3.4.1.3 Heat transfer coeffi cient distributions The discussion of 2D airfoil external heat transfer coeffi cient distributions is complete. Measurements of a representative distribution, along with a computer simulation, are given by Giel et al.[66] in Fig. 42 as the 50% span case. One can see high levels at the stagnation point on the leading edge, decreasing levels on both suction and pressure surfaces, a rapid rise in values on the suction side where transition is observed, and a milder rise on the pressure side where velocity is increasing and acceleration is retarding transition. Acceleration, compressibility, transition, curvature effects are in play. There is no fi lm cooling or roughness effect in this study. Shown are the results
www.witpress.com, ISSN 1755-8336 (on-line) WIT Transactions on State of the Art in Science and Engineering, Vol , © 20 WIT Press42 08
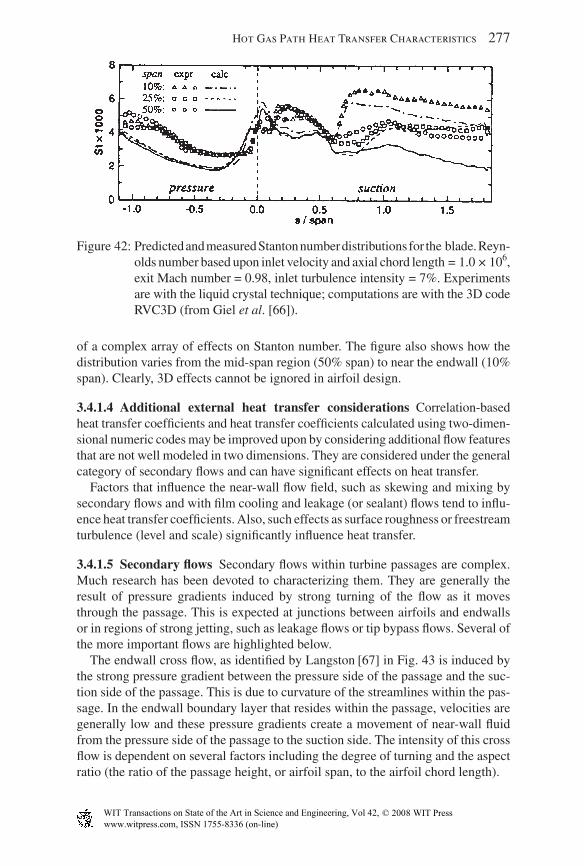
Hot Gas Path Heat Transfer Characteristics 277
of a complex array of effects on Stanton number. The fi gure also shows how the distribution varies from the mid-span region (50% span) to near the endwall (10% span). Clearly, 3D effects cannot be ignored in airfoil design.
3.4.1.4 Additional external heat transfer considerations Correlation-based heat transfer coeffi cients and heat transfer coeffi cients calculated using two-dimen-sional numeric codes may be improved upon by considering additional fl ow features that are not well modeled in two dimensions. They are considered under the general category of secondary fl ows and can have signifi cant effects on heat transfer.
Factors that infl uence the near-wall fl ow fi eld, such as skewing and mixing by secondary fl ows and with fi lm cooling and leakage (or sealant) fl ows tend to infl u-ence heat transfer coeffi cients. Also, such effects as surface roughness or freestream turbulence (level and scale) signifi cantly infl uence heat transfer.
3.4.1.5 Secondary fl ows Secondary fl ows within turbine passages are complex. Much research has been devoted to characterizing them. They are generally the result of pressure gradients induced by strong turning of the fl ow as it moves through the passage. This is expected at junctions between airfoils and endwalls or in regions of strong jetting, such as leakage fl ows or tip bypass fl ows. Several of the more important fl ows are highlighted below.
The endwall cross fl ow, as identifi ed by Langston [67] in Fig. 43 is induced by the strong pressure gradient between the pressure side of the passage and the suc-tion side of the passage. This is due to curvature of the streamlines within the pas-sage. In the endwall boundary layer that resides within the passage, velocities are generally low and these pressure gradients create a movement of near-wall fl uid from the pressure side of the passage to the suction side. The intensity of this cross fl ow is dependent on several factors including the degree of turning and the aspect ratio (the ratio of the passage height, or airfoil span, to the airfoil chord length).
Figure 42: Predicted and measured Stanton number distributions for the blade. Reyn-olds number based upon inlet velocity and axial chord length = 1.0 × 10⁶, exit Mach number = 0.98, inlet turbulence intensity = 7%. Experiments are with the liquid crystal technique; computations are with the 3D code RVC3D (from Giel et al. [66]).
www.witpress.com, ISSN 1755-8336 (on-line) WIT Transactions on State of the Art in Science and Engineering, Vol , © 20 WIT Press42 08
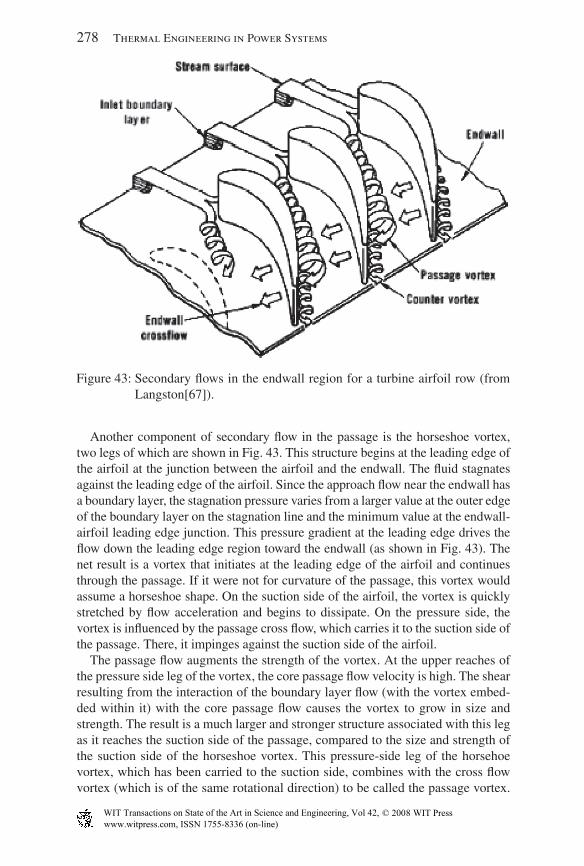
278 Thermal Engineering in Power Systems
Another component of secondary fl ow in the passage is the horseshoe vortex, two legs of which are shown in Fig. 43. This structure begins at the leading edge of the airfoil at the junction between the airfoil and the endwall. The fl uid stagnates against the leading edge of the airfoil. Since the approach fl ow near the endwall has a boundary layer, the stagnation pressure varies from a larger value at the outer edge of the boundary layer on the stagnation line and the minimum value at the endwall-airfoil leading edge junction. This pressure gradient at the leading edge drives the fl ow down the leading edge region toward the endwall (as shown in Fig. 43). The net result is a vortex that initiates at the leading edge of the airfoil and continues through the passage. If it were not for curvature of the passage, this vortex would assume a horseshoe shape. On the suction side of the airfoil, the vortex is quickly stretched by fl ow acceleration and begins to dissipate. On the pressure side, the vortex is infl uenced by the passage cross fl ow, which carries it to the suction side of the passage. There, it impinges against the suction side of the airfoil.
The passage fl ow augments the strength of the vortex. At the upper reaches of the pressure side leg of the vortex, the core passage fl ow velocity is high. The shear resulting from the interaction of the boundary layer fl ow (with the vortex embed-ded within it) with the core passage fl ow causes the vortex to grow in size and strength. The result is a much larger and stronger structure associated with this leg as it reaches the suction side of the passage, compared to the size and strength of the suction side of the horseshoe vortex. This pressure-side leg of the horsehoe vortex, which has been carried to the suction side, combines with the cross fl ow vortex (which is of the same rotational direction) to be called the passage vortex.
Figure 43: Secondary fl ows in the endwall region for a turbine airfoil row (from Langston[67]).
www.witpress.com, ISSN 1755-8336 (on-line) WIT Transactions on State of the Art in Science and Engineering, Vol , © 20 WIT Press42 08
Hot Gas Path Heat Transfer Characteristics 279
Downstream, the passage vortex moves off the passage endwall and up the suction sidewall. Flow on the pressure side of the airfoil is drawn toward the endwall of the airfoil. Figure 44 shows mass transfer measurements in a cascade. With the anal-ogy between mass and heat transfer, one can convert the mass transfer Sherwood number values, shown, to heat transfer Nusselt numbers. One can see on the suc-tion side the effect on mass transfer of the vortex impinging on and traveling up the suction wall in the downstream portion of the passage. On the pressure wall, the Sherwood number distribution is rather two-dimensional, indicating that the pas-sage vortex is carrying major components of the near-endwall region secondary fl ow away from the airfoil pressure surface.
Figure 44: Detailed Sherwood numbers on blade suction and pressure surfaces near the endwall (from Goldstein et al. [68]).
www.witpress.com, ISSN 1755-8336 (on-line) WIT Transactions on State of the Art in Science and Engineering, Vol , © 20 WIT Press42 08
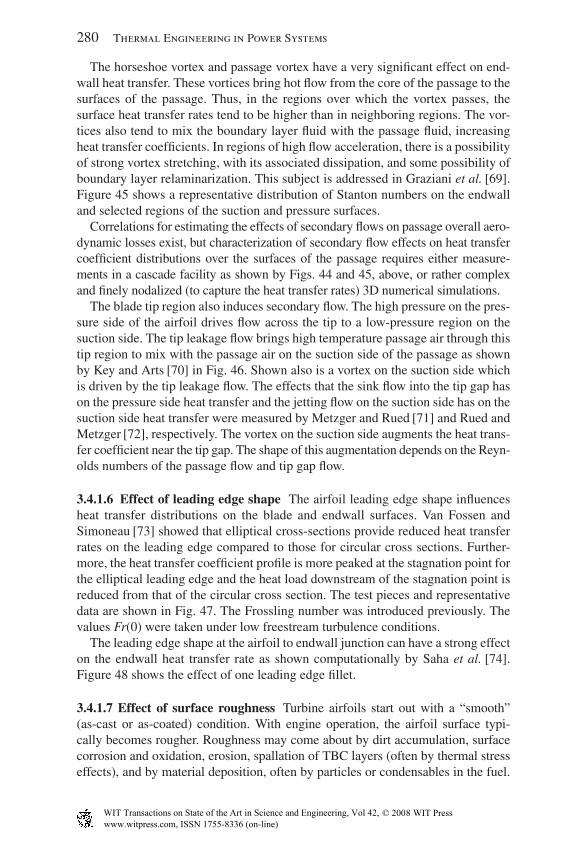
280 Thermal Engineering in Power Systems
The horseshoe vortex and passage vortex have a very signifi cant effect on end-wall heat transfer. These vortices bring hot fl ow from the core of the passage to the surfaces of the passage. Thus, in the regions over which the vortex passes, the surface heat transfer rates tend to be higher than in neighboring regions. The vor-tices also tend to mix the boundary layer fl uid with the passage fl uid, increasing heat transfer coeffi cients. In regions of high fl ow acceleration, there is a possibility of strong vortex stretching, with its associated dissipation, and some possibility of boundary layer relaminarization. This subject is addressed in Graziani et al. [69]. Figure 45 shows a representative distribution of Stanton numbers on the endwall and selected regions of the suction and pressure surfaces.
Correlations for estimating the effects of secondary fl ows on passage overall aero-dynamic losses exist, but characterization of secondary fl ow effects on heat transfer coeffi cient distributions over the surfaces of the passage requires either measure-ments in a cascade facility as shown by Figs. 44 and 45, above, or rather complex and fi nely nodalized (to capture the heat transfer rates) 3D numerical simulations.
The blade tip region also induces secondary fl ow. The high pressure on the pres-sure side of the airfoil drives fl ow across the tip to a low-pressure region on the suction side. The tip leakage fl ow brings high temperature passage air through this tip region to mix with the passage air on the suction side of the passage as shown by Key and Arts [70] in Fig. 46. Shown also is a vortex on the suction side which is driven by the tip leakage fl ow. The effects that the sink fl ow into the tip gap has on the pressure side heat transfer and the jetting fl ow on the suction side has on the suction side heat transfer were measured by Metzger and Rued [71] and Rued and Metzger [72], respectively. The vortex on the suction side augments the heat trans-fer coeffi cient near the tip gap. The shape of this augmentation depends on the Reyn-olds numbers of the passage fl ow and tip gap fl ow.
3.4.1.6 Effect of leading edge shape The airfoil leading edge shape infl uences heat transfer distributions on the blade and endwall surfaces. Van Fossen and Simoneau [73] showed that elliptical cross-sections provide reduced heat transfer rates on the leading edge compared to those for circular cross sections. Further-more, the heat transfer coeffi cient profi le is more peaked at the stagnation point for the elliptical leading edge and the heat load downstream of the stagnation point is reduced from that of the circular cross section. The test pieces and representative data are shown in Fig. 47. The Frossling number was introduced previously. The values Fr(0) were taken under low freestream turbulence conditions.
The leading edge shape at the airfoil to endwall junction can have a strong effect on the endwall heat transfer rate as shown computationally by Saha et al. [74]. Figure 48 shows the effect of one leading edge fi llet.
3.4.1.7 Effect of surface roughness Turbine airfoils start out with a “smooth” (as-cast or as-coated) condition. With engine operation, the airfoil surface typi-cally becomes rougher. Roughness may come about by dirt accumulation, surface corrosion and oxidation, erosion, spallation of TBC layers (often by thermal stress effects), and by material deposition, often by particles or condensables in the fuel.
www.witpress.com, ISSN 1755-8336 (on-line) WIT Transactions on State of the Art in Science and Engineering, Vol , © 20 WIT Press42 08
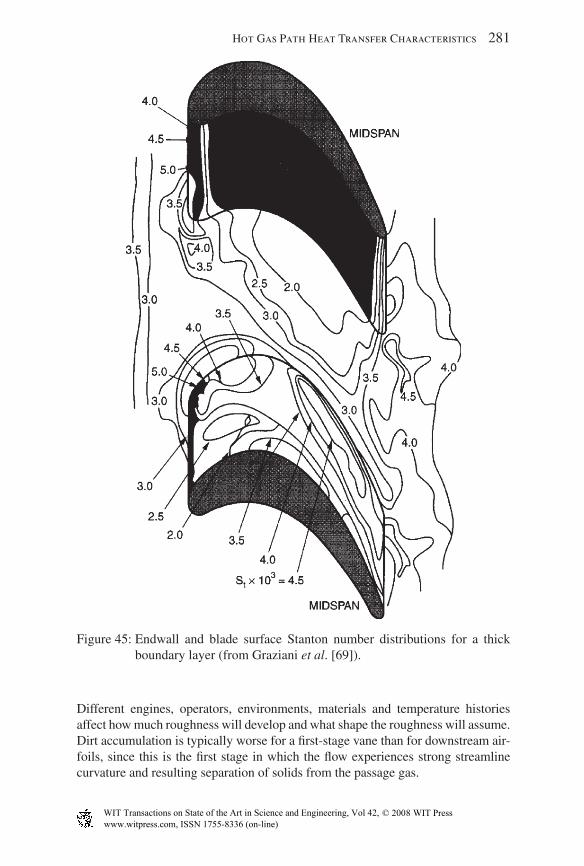
Hot Gas Path Heat Transfer Characteristics 281
Different engines, operators, environments, materials and temperature histories affect how much roughness will develop and what shape the roughness will assume. Dirt accumulation is typically worse for a fi rst-stage vane than for downstream air-foils, since this is the fi rst stage in which the fl ow experiences strong streamline curvature and resulting separation of solids from the passage gas.
Figure 45: Endwall and blade surface Stanton number distributions for a thick boundary layer (from Graziani et al. [69]).
www.witpress.com, ISSN 1755-8336 (on-line) WIT Transactions on State of the Art in Science and Engineering, Vol , © 20 WIT Press42 08
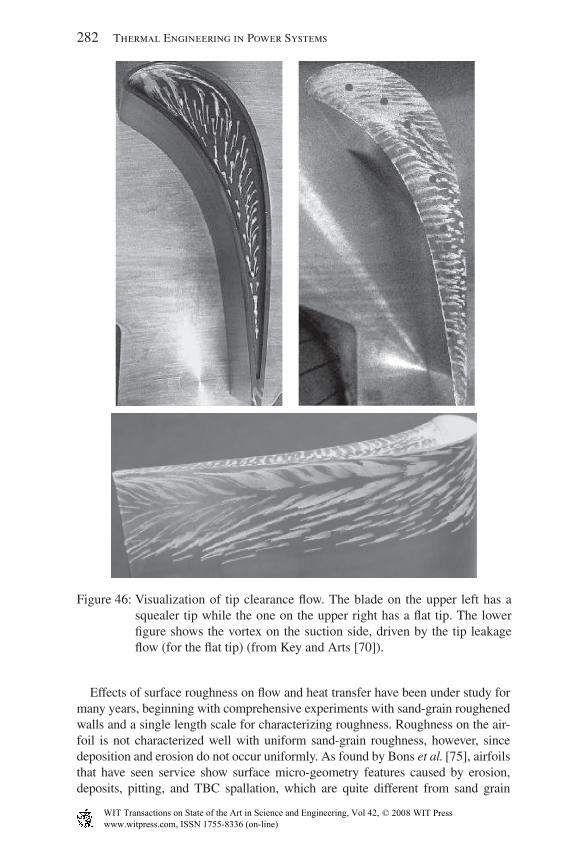
282 Thermal Engineering in Power Systems
Effects of surface roughness on fl ow and heat transfer have been under study for many years, beginning with comprehensive experiments with sand-grain roughened walls and a single length scale for characterizing roughness. Roughness on the air-foil is not characterized well with uniform sand-grain roughness, however, since deposition and erosion do not occur uniformly. As found by Bons et al. [75], airfoils that have seen service show surface micro-geometry features caused by erosion, deposits, pitting, and TBC spallation, which are quite different from sand grain
Figure 46: Visualization of tip clearance fl ow. The blade on the upper left has a squealer tip while the one on the upper right has a fl at tip. The lower fi gure shows the vortex on the suction side, driven by the tip leakage fl ow (for the fl at tip) (from Key and Arts [70]).
www.witpress.com, ISSN 1755-8336 (on-line) WIT Transactions on State of the Art in Science and Engineering, Vol , © 20 WIT Press42 08
Hot Gas Path Heat Transfer Characteristics 283
roughness, and from one another. It would be expected that the different types cannot be modeled as an equivalent sand grain roughness. They note that for uncoated tur-bine airfoils, corrosive deposits and erosion are the primary causes of roughness, occurring near the pressure side tip and hub regions, while spallation is the dominant cause of roughness for coated airfoils. The spallation effect was pronounced near the
Figure 47: Model profi le and low turbulence Frossling number distributions around leading edge compared to PARC-2D and Frossling solutions. Top: Model profi le; upper left: 1:1 ellipse; upper right: 2.25:1 ellipse; lower left: 1.5:1 ellipse; and lower right: 3:1 ellipse. PAR-2D is a 2D numerical simulation code (from Van Fossen and Simoneau [73]).
www.witpress.com, ISSN 1755-8336 (on-line) WIT Transactions on State of the Art in Science and Engineering, Vol , © 20 WIT Press42 08
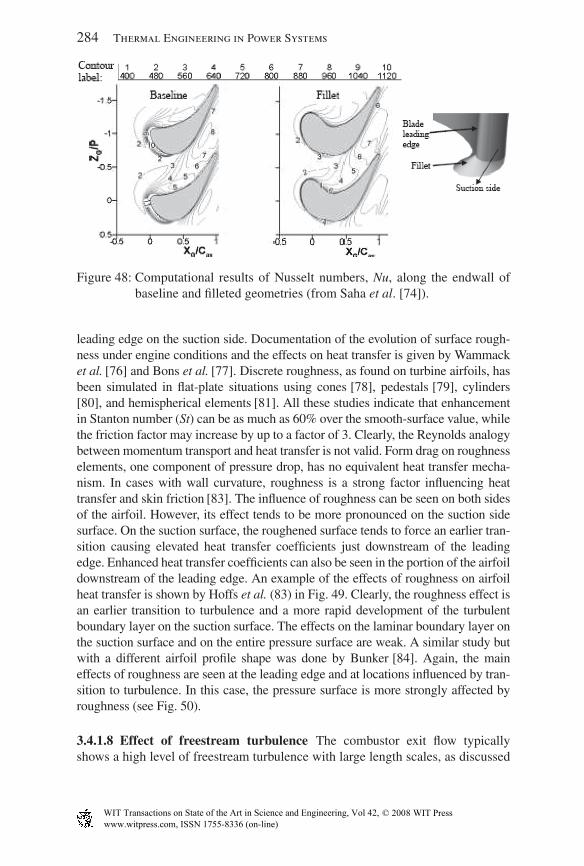
284 Thermal Engineering in Power Systems
leading edge on the suction side. Documentation of the evolution of surface rough-ness under engine conditions and the effects on heat transfer is given by Wammack et al. [76] and Bons et al. [77]. Discrete roughness, as found on turbine airfoils, has been simulated in fl at-plate situations using cones [78], pedestals [79], cylinders
[80], and hemispherical elements [81]. All these studies indicate that enhancement in Stanton number (St) can be as much as 60% over the smooth-surface value, while the friction factor may increase by up to a factor of 3. Clearly, the Reynolds analogy between momentum transport and heat transfer is not valid. Form drag on roughness elements, one component of pressure drop, has no equivalent heat transfer mecha-nism. In cases with wall curvature, roughness is a strong factor infl uencing heat transfer and skin friction [83]. The infl uence of roughness can be seen on both sides of the airfoil. However, its effect tends to be more pronounced on the suction side surface. On the suction surface, the roughened surface tends to force an earlier tran-sition causing elevated heat transfer coeffi cients just downstream of the leading edge. Enhanced heat transfer coeffi cients can also be seen in the portion of the airfoil downstream of the leading edge. An example of the effects of roughness on airfoil heat transfer is shown by Hoffs et al. (83) in Fig. 49. Clearly, the roughness effect is an earlier transition to turbulence and a more rapid development of the turbulent boundary layer on the suction surface. The effects on the laminar boundary layer on the suction surface and on the entire pressure surface are weak. A similar study but with a different airfoil profi le shape was done by Bunker [84]. Again, the main effects of roughness are seen at the leading edge and at locations infl uenced by tran-sition to turbulence. In this case, the pressure surface is more strongly affected by roughness (see Fig. 50).
3.4.1.8 Effect of freestream turbulence The combustor exit fl ow typically shows a high level of freestream turbulence with large length scales, as discussed
Figure 48: Computational results of Nusselt numbers, Nu, along the endwall of baseline and fi lleted geometries (from Saha et al. [74]).
www.witpress.com, ISSN 1755-8336 (on-line) WIT Transactions on State of the Art in Science and Engineering, Vol , © 20 WIT Press42 08
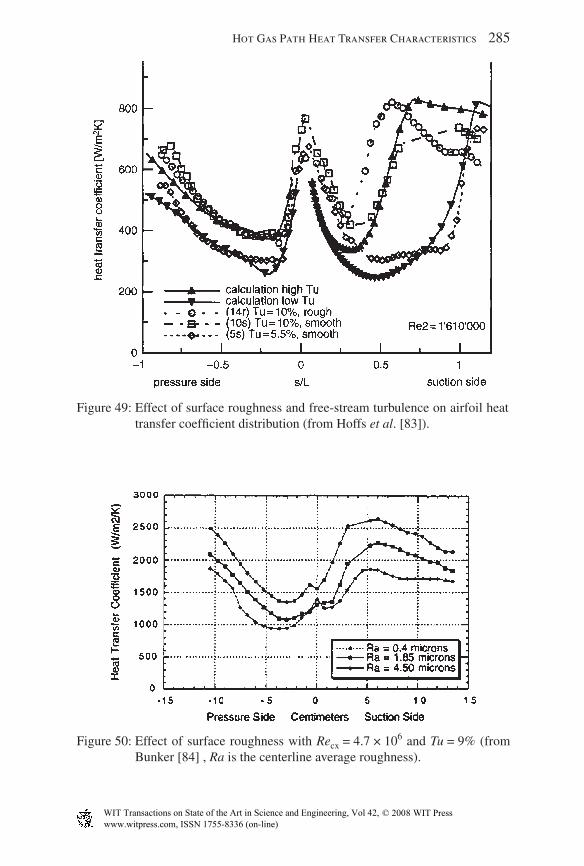
Hot Gas Path Heat Transfer Characteristics 285
Figure 49: Effect of surface roughness and free-stream turbulence on airfoil heat transfer coeffi cient distribution (from Hoffs et al. [83]).
Figure 50: Effect of surface roughness with Recx = 4.7 × 10⁶ and Tu = 9% (from Bunker [84] , Ra is the centerline average roughness).
www.witpress.com, ISSN 1755-8336 (on-line) WIT Transactions on State of the Art in Science and Engineering, Vol , © 20 WIT Press42 08
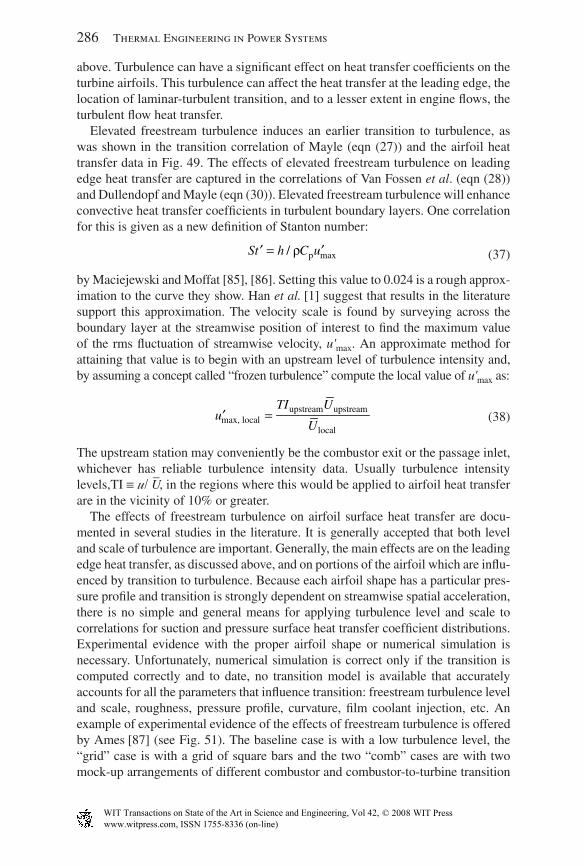
286 Thermal Engineering in Power Systems
above. Turbulence can have a signifi cant effect on heat transfer coeffi cients on the turbine airfoils. This turbulence can affect the heat transfer at the leading edge, the location of laminar-turbulent transition, and to a lesser extent in engine fl ows, the turbulent fl ow heat transfer.
Elevated freestream turbulence induces an earlier transition to turbulence, as was shown in the transition correlation of Mayle (eqn (27)) and the airfoil heat transfer data in Fig. 49. The effects of elevated freestream turbulence on leading edge heat transfer are captured in the correlations of Van Fossen et al. (eqn (28)) and Dullendopf and Mayle (eqn (30)). Elevated freestream turbulence will enhance convective heat transfer coeffi cients in turbulent boundary layers. One correlation for this is given as a new defi nition of Stanton number:
p max/St h C uρ=′ ′ (37)
by Maciejewski and Moffat [85], [86]. Setting this value to 0.024 is a rough approx-imation to the curve they show. Han et al. [1] suggest that results in the literature support this approximation. The velocity scale is found by surveying across the boundary layer at the streamwise position of interest to fi nd the maximum value of the rms fl uctuation of streamwise velocity, u'max. An approximate method for attaining that value is to begin with an upstream level of turbulence intensity and, by assuming a concept called “frozen turbulence” compute the local value of u'max as:
upstream upstreammax, local
local
TI Uu
U=′
(38)
The upstream station may conveniently be the combustor exit or the passage inlet, whichever has reliable turbulence intensity data. Usually turbulence intensity levels,TI ≡ u/ U–, in the regions where this would be applied to airfoil heat transfer are in the vicinity of 10% or greater.
The effects of freestream turbulence on airfoil surface heat transfer are docu-mented in several studies in the literature. It is generally accepted that both level and scale of turbulence are important. Generally, the main effects are on the leading edge heat transfer, as discussed above, and on portions of the airfoil which are infl u-enced by transition to turbulence. Because each airfoil shape has a particular pres-sure profi le and transition is strongly dependent on streamwise spatial acceleration, there is no simple and general means for applying turbulence level and scale to correlations for suction and pressure surface heat transfer coeffi cient distributions. Experimental evidence with the proper airfoil shape or numerical simulation is necessary. Unfortunately, numerical simulation is correct only if the transition is computed correctly and to date, no transition model is available that accurately accounts for all the parameters that infl uence transition: freestream turbulence level and scale, roughness, pressure profi le, curvature, fi lm coolant injection, etc. An example of experimental evidence of the effects of freestream turbulence is offered by Ames [87] (see Fig. 51). The baseline case is with a low turbulence level, the “grid” case is with a grid of square bars and the two “comb” cases are with two mock-up arrangements of different combustor and combustor-to-turbine transition
www.witpress.com, ISSN 1755-8336 (on-line) WIT Transactions on State of the Art in Science and Engineering, Vol , © 20 WIT Press42 08
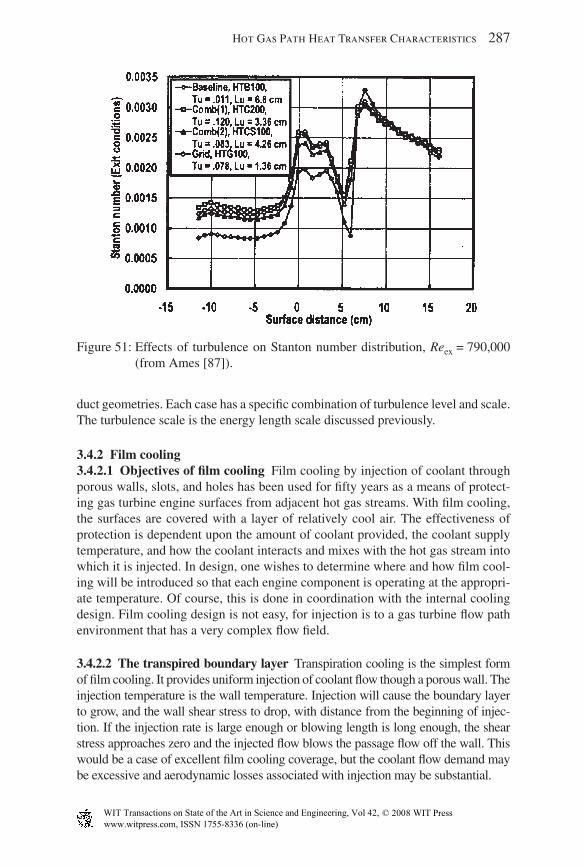
Hot Gas Path Heat Transfer Characteristics 287
duct geometries. Each case has a specifi c combination of turbulence level and scale. The turbulence scale is the energy length scale discussed previously.
3.4.2 Film cooling3.4.2.1 Objectives of fi lm cooling Film cooling by injection of coolant through porous walls, slots, and holes has been used for fi fty years as a means of protect-ing gas turbine engine surfaces from adjacent hot gas streams. With fi lm cooling, the surfaces are covered with a layer of relatively cool air. The effectiveness of protection is dependent upon the amount of coolant provided, the coolant supply temperature, and how the coolant interacts and mixes with the hot gas stream into which it is injected. In design, one wishes to determine where and how fi lm cool-ing will be introduced so that each engine component is operating at the appropri-ate temperature. Of course, this is done in coordination with the internal cooling design. Film cooling design is not easy, for injection is to a gas turbine fl ow path environment that has a very complex fl ow fi eld.
3.4.2.2 The transpired boundary layer Transpiration cooling is the simplest form of fi lm cooling. It provides uniform injection of coolant fl ow though a porous wall. The injection temperature is the wall temperature. Injection will cause the boundary layer to grow, and the wall shear stress to drop, with distance from the beginning of injec-tion. If the injection rate is large enough or blowing length is long enough, the shear stress approaches zero and the injected fl ow blows the passage fl ow off the wall. This would be a case of excellent fi lm cooling coverage, but the coolant fl ow demand may be excessive and aerodynamic losses associated with injection may be substantial.
Figure 51: Effects of turbulence on Stanton number distribution, Reex = 790,000 (from Ames [87]).
www.witpress.com, ISSN 1755-8336 (on-line) WIT Transactions on State of the Art in Science and Engineering, Vol , © 20 WIT Press42 08
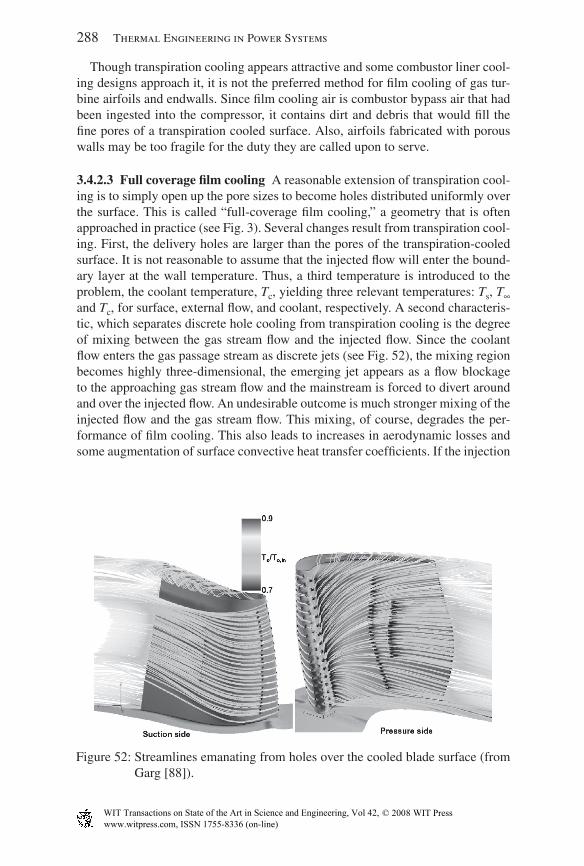
288 Thermal Engineering in Power Systems
Though transpiration cooling appears attractive and some combustor liner cool-ing designs approach it, it is not the preferred method for fi lm cooling of gas tur-bine airfoils and endwalls. Since fi lm cooling air is combustor bypass air that had been ingested into the compressor, it contains dirt and debris that would fi ll the fi ne pores of a transpiration cooled surface. Also, airfoils fabricated with porous walls may be too fragile for the duty they are called upon to serve.
3.4.2.3 Full coverage fi lm cooling A reasonable extension of transpiration cool-ing is to simply open up the pore sizes to become holes distributed uniformly over the surface. This is called “full-coverage fi lm cooling,” a geometry that is often approached in practice (see Fig. 3). Several changes result from transpiration cool-ing. First, the delivery holes are larger than the pores of the transpiration-cooled surface. It is not reasonable to assume that the injected fl ow will enter the bound-ary layer at the wall temperature. Thus, a third temperature is introduced to the problem, the coolant temperature, Tc, yielding three relevant temperatures: Ts, T∞ and Tc, for surface, external fl ow, and coolant, respectively. A second characteris-tic, which separates discrete hole cooling from transpiration cooling is the degree of mixing between the gas stream fl ow and the injected fl ow. Since the coolant fl ow enters the gas passage stream as discrete jets (see Fig. 52), the mixing region becomes highly three-dimensional, the emerging jet appears as a fl ow blockage to the approaching gas stream fl ow and the mainstream is forced to divert around and over the injected fl ow. An undesirable outcome is much stronger mixing of the injected fl ow and the gas stream fl ow. This mixing, of course, degrades the per-formance of fi lm cooling. This also leads to increases in aerodynamic losses and some augmentation of surface convective heat transfer coeffi cients. If the injection
Figure 52: Streamlines emanating from holes over the cooled blade surface (from Garg [88]).
www.witpress.com, ISSN 1755-8336 (on-line) WIT Transactions on State of the Art in Science and Engineering, Vol , © 20 WIT Press42 08
Hot Gas Path Heat Transfer Characteristics 289
rate becomes high enough, the jets would “tunnel through” the boundary layer fl ow and the cooling effectiveness becomes quite poor, the aerodynamic losses are high, and the heat transfer coeffi cients are substantially enhanced.
3.4.2.4 Describing fi lm cooling in terms of the adiabatic wall temperature When fi lm cooling is being applied, the heat transfer analysis must be modifi ed. Having three temperatures raises a question as to how the heat transfer coeffi cient might be described in terms of heat source (passage) and sink (wall) temperatures. In a traditional boundary layer fl ow, heat transfer rates are given by Newton’s law of cooling (simply a defi nition of the heat transfer coeffi cient, h):
( )wq h T T∞≡ −′′&
(39)
In the case of discrete-hole fi lm cooling, h is modifi ed, somewhat, by the injected fl ow. This is particularly true immediately downstream and in the near vicinity of the injection point. Farther downstream, one can often use, with little error, the h value one would expect without fi lm cooling. In the case of discrete-hole fi lm cooling, the thermal driving potential becomes the difference between the effec-tive temperature within the zone where the coolant and passage fl ows mix and the wall temperature:
film, effective w( )q h T T≡ −′′&
(40)
The effective temperature, Tfi lm,effective, is determined by a study of mixing of exter-nal fl ow and the injected fl ow. It is dependent upon the fl ow fi eld. Correlations are formulated to isolate “h” and Tfi lm,effective by fi rst determining Tfi lm,effective in the absence of wall heat transfer (set the wall to be adiabatic) but under the same fl ow conditions. Thus, a reasonable value for Tfi lm,effective could be Taw, the wall temperature established when the wall is adiabatic. To continue the separation, one then determines “h” with a heated wall but with the “fi lm cooling” and gas passage fl ow temperatures being the same. This “h” value is altered by injection solely via mixing due to the interaction of the two streams. This value is usually normalized as the Stanton number:
p
hSt
u cρ ∞=
(41)
or Nusselt number
x
hx
k=Nu
(42)
The Nusselt number would require an appropriate choice of length scale, perhaps x, the streamwise distance from the hole.
The adiabatic wall temperature is normalized as the fi lm cooling effectiveness:
aw
c
T T
T Tη ∞
∞
−=
− (43)
www.witpress.com, ISSN 1755-8336 (on-line) WIT Transactions on State of the Art in Science and Engineering, Vol , © 20 WIT Press42 08
290 Thermal Engineering in Power Systems
The effectiveness is 1.0 when the adiabatic wall temperature is the coolant tem-perature and zero when it is the freestream temperature. We therefore develop expressions for h and St ⁄ St0 (the subscript “0” indicates the situation in which there is no fi lm cooling present) in terms which capture the effects of:
Geometric features: slot width, hole size, distance from the injection point, ra-dius of streamwise curvature, hole pattern geometry parameters, hole delivery channel geometry parameters, etc.Flow parameters: mass fl uxes of injection and gas passage fl ows, momentum fl uxes of injection and gas passage fl ows, boundary layer thickness at the point of injection, velocity distribution of the emerging fi lm cooling fl ow, turbulence intensity levels and length scales in the gas passage fl ow and the coolant fl ow, parameters which capture secondary fl ow features within the gas passage, etc., andFluid properties: density, viscosity, specifi c heat, etc.
3.4.2.5 Discrete hole injection parallel to the surface A simple fi lm cooling realization is through a slot oriented so that injection is tangent to the wall. This is a discrete injection with no wall-normal component of velocity component. An analysis of it from Librizzi and Cresci [89] yields the following expression:
( )0.8
p, p,c
1
1 ( / ) 0.329 4.01 1c cη
ς∞
=⎡+ + −⎣
(44)
where
1 4 1 4
c c c c c c
c c c c
U s U sux x
s u Ms
μ ρ μ ρρς
ρ μ μ μ μ
− −∞ ∞
∞ ∞
⎛ ⎞ ⎛ ⎞⎡ ⎤ ⎡ ⎤= =⎢ ⎥ ⎢ ⎥⎜ ⎟ ⎜ ⎟⎝ ⎠ ⎝ ⎠⎣ ⎦ ⎣ ⎦
(45)
Once we establish the origin of x, we can compute η from the correlation. The most important parameters to the correlation are the mass fl ux ratio, M = rcuc ⁄ r∞u∞ and the streamwise distance from the hole in terms of the slot length, x ⁄ s. If we are suffi ciently far from the injection zone, we might assume that h is unaffected by injection.
Tangential slot injection is usually not applied for airfoil surface fi lm cooling because of the diffi culty of implementing a slot into the airfoil geometry and because of the reduction of airfoil strength it would create. Some combustor cooling schemes have injection geometries that approach tangential injection, however.
3.4.2.6 Injection with a wall-normal component of momentum A more prac-tical injection geometry is discrete injection with single, double, or several rows of holes (see Fig. 3). Though injection may be over a short streamwise distance, protection continues downstream of the injection zone until the coolant is mixed out. Downstream coverage by injection through rows of discrete holes is visible in
•
•
•
www.witpress.com, ISSN 1755-8336 (on-line) WIT Transactions on State of the Art in Science and Engineering, Vol , © 20 WIT Press42 08
Hot Gas Path Heat Transfer Characteristics 291
Fig. 52. Also visible is how the various coolant paths are infl uenced by secondary fl ows in the hub and tip regions.
If the coolant has a component of momentum fl ux in the wall-normal direction, the wall–normal momentum fl ux relative to the gas stream momentum fl ux may be a parameter of interest for it might suggest greater penetration of the coolant fl ow into the gas passage fl ow. This would infl uence the mixing process. One might expect that a value of wall-normal momentum fl ux approaching the gas stream momentum fl ux evaluated at the elevation where the interaction of the two streams is most intense would signal a possibility of coolant lift-off (or separation) from the surface, with a corresponding precipitous degradation of cooling performance. So long as the injected jet is not lifting off the wall, variations on the slot injection correlation given above can be applied to hole injection to give an estimate of the laterally averaged effectiveness. One could develop fi lm cooling design correla-tions of the form of eqn. (44) where x/s is the streamwise distance in terms of the hole diameter, s = d, or effective slot length, Se = πd2 ⁄ 4p for a single row of holes (p is the pitch). Of course, the actual processes are complex, so specifi c forms of the equation apply to specifi c geometries and sets of fl ow conditions. Such correla-tion forms are for the lateral-averaged effectiveness. Actual distributions are quite two-dimensional, as shown in Fig. 53.
When there are more than one row of fi lm cooling holes, i > 1, and the blowing is suffi ciently low that the coolant is not separating from the surface, the follow-ing superposition expression can be used for an approximation to the net fi lm effectiveness:
1
f f f01
(1 )i
N i
jji
η η η−
==
⎡ ⎤= −⎢ ⎥
⎢ ⎥⎣ ⎦∑ ∏
(46)
3.4.2.7 Net benefi t of fi lm cooling Film cooling reduces the source temperature for convective heat transfer from the gas to the wall, but it also augments the con-vective heat transfer coeffi cient, h. It will result in an overall thermal benefi t if the net of the two is a lower heat fl ux q"/q'<1.0.
g cf w
o o g w o g w
( )1
( )
T Th T Tq h
q h T T h T Tη
⎛ ⎞−−′′ = = −⎜ ⎟− −′′ ⎝ ⎠
(47)
where q" is the heat fl ux with fi lm cooling qo is the heat fl ux without fi lm cooling h is the heat transfer coeffi cient with fi lm cooling ho is the heat transfer coeffi cient without fi lm cooling Tw is the local wall temperature Tc is the coolant temperature, and Tg is the mainstream gas temperature.
The net heat fl ux ratio therefore depends upon the engine operational parame-ters, Tc ⁄ Tg, Tw ⁄ Tg, and h0, as well as the fi lm cooling parameters, h and h ⁄ h0.
3.4.2.8 Hole shape and orientation effects The fi lm cooling hole shape is important as it determines the fi lm coverage downstream of a row of cooling holes
www.witpress.com, ISSN 1755-8336 (on-line) WIT Transactions on State of the Art in Science and Engineering, Vol , © 20 WIT Press42 08
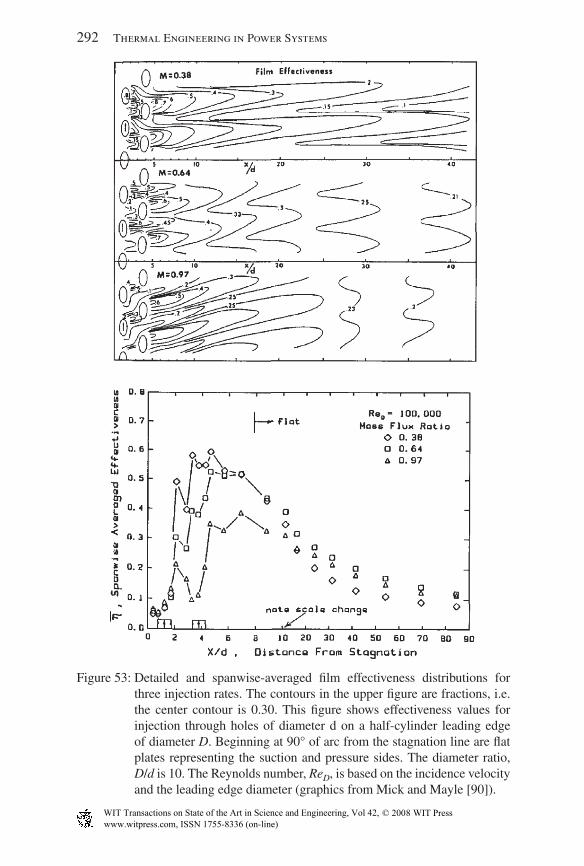
292 Thermal Engineering in Power Systems
Figure 53: Detailed and spanwise-averaged fi lm effectiveness distributions for three injection rates. The contours in the upper fi gure are fractions, i.e. the center contour is 0.30. This fi gure shows effectiveness values for injection through holes of diameter d on a half-cylinder leading edge of diameter D. Beginning at 90° of arc from the stagnation line are fl at plates representing the suction and pressure sides. The diameter ratio, D/d is 10. The Reynolds number, ReD, is based on the incidence velocity and the leading edge diameter (graphics from Mick and Mayle [90]).
www.witpress.com, ISSN 1755-8336 (on-line) WIT Transactions on State of the Art in Science and Engineering, Vol , © 20 WIT Press42 08
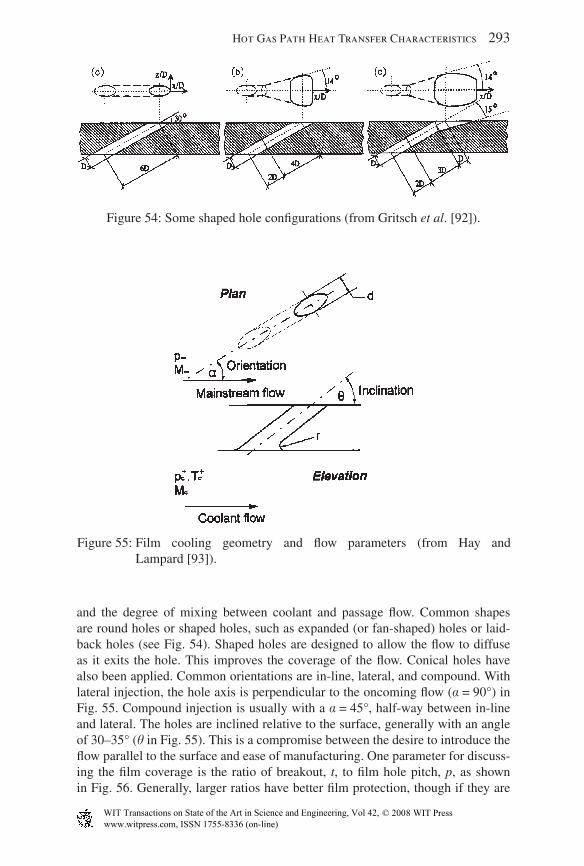
Hot Gas Path Heat Transfer Characteristics 293
and the degree of mixing between coolant and passage fl ow. Common shapes are round holes or shaped holes, such as expanded (or fan-shaped) holes or laid-back holes (see Fig. 54). Shaped holes are designed to allow the fl ow to diffuse as it exits the hole. This improves the coverage of the fl ow. Conical holes have also been applied. Common orientations are in-line, lateral, and compound. With lateral injection, the hole axis is perpendicular to the oncoming fl ow (a = 90°) in Fig. 55. Compound injection is usually with a a = 45°, half-way between in-line and lateral. The holes are inclined relative to the surface, generally with an angle of 30–35° (q in Fig. 55). This is a compromise between the desire to introduce the fl ow parallel to the surface and ease of manufacturing. One parameter for discuss-ing the fi lm coverage is the ratio of breakout, t, to fi lm hole pitch, p, as shown in Fig. 56. Generally, larger ratios have better fi lm protection, though if they are
Figure 54: Some shaped hole confi gurations (from Gritsch et al. [92]).
Figure 55: Film cooling geometry and fl ow parameters (from Hay and Lampard [93]).
www.witpress.com, ISSN 1755-8336 (on-line) WIT Transactions on State of the Art in Science and Engineering, Vol , © 20 WIT Press42 08
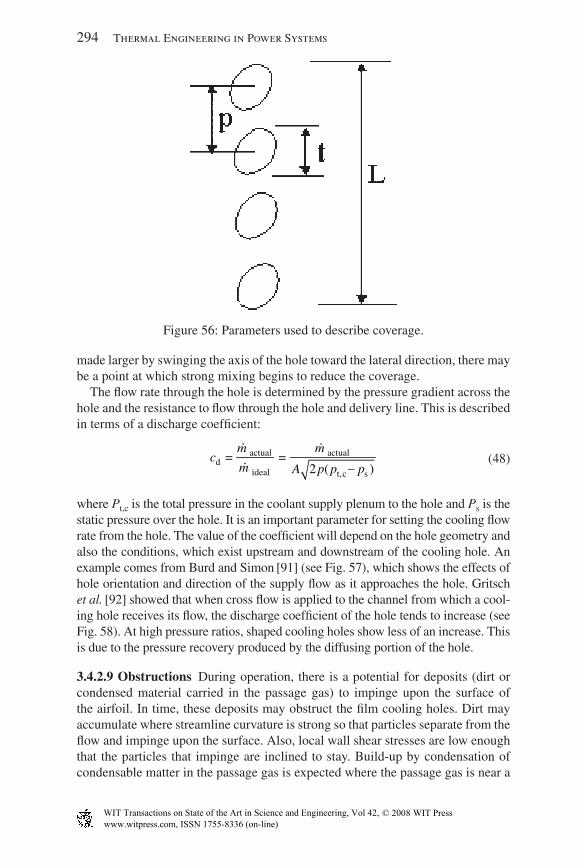
294 Thermal Engineering in Power Systems
made larger by swinging the axis of the hole toward the lateral direction, there may be a point at which strong mixing begins to reduce the coverage.
The fl ow rate through the hole is determined by the pressure gradient across the hole and the resistance to fl ow through the hole and delivery line. This is described in terms of a discharge coeffi cient:
actual actuald
ideal t,c s
. .= =. _2 ( )
m mc
m A p p p
(48)
where Pt,c is the total pressure in the coolant supply plenum to the hole and Ps is the static pressure over the hole. It is an important parameter for setting the cooling fl ow rate from the hole. The value of the coeffi cient will depend on the hole geometry and also the conditions, which exist upstream and downstream of the cooling hole. An example comes from Burd and Simon [91] (see Fig. 57), which shows the effects of hole orientation and direction of the supply fl ow as it approaches the hole. Gritsch et al. [92] showed that when cross fl ow is applied to the channel from which a cool-ing hole receives its fl ow, the discharge coeffi cient of the hole tends to increase (see Fig. 58). At high pressure ratios, shaped cooling holes show less of an increase. This is due to the pressure recovery produced by the diffusing portion of the hole.
3.4.2.9 Obstructions During operation, there is a potential for deposits (dirt or condensed material carried in the passage gas) to impinge upon the surface of the airfoil. In time, these deposits may obstruct the fi lm cooling holes. Dirt may accumulate where streamline curvature is strong so that particles separate from the fl ow and impinge upon the surface. Also, local wall shear stresses are low enough that the particles that impinge are inclined to stay. Build-up by condensation of condensable matter in the passage gas is expected where the passage gas is near a
Figure 56: Parameters used to describe coverage.
www.witpress.com, ISSN 1755-8336 (on-line) WIT Transactions on State of the Art in Science and Engineering, Vol , © 20 WIT Press42 08
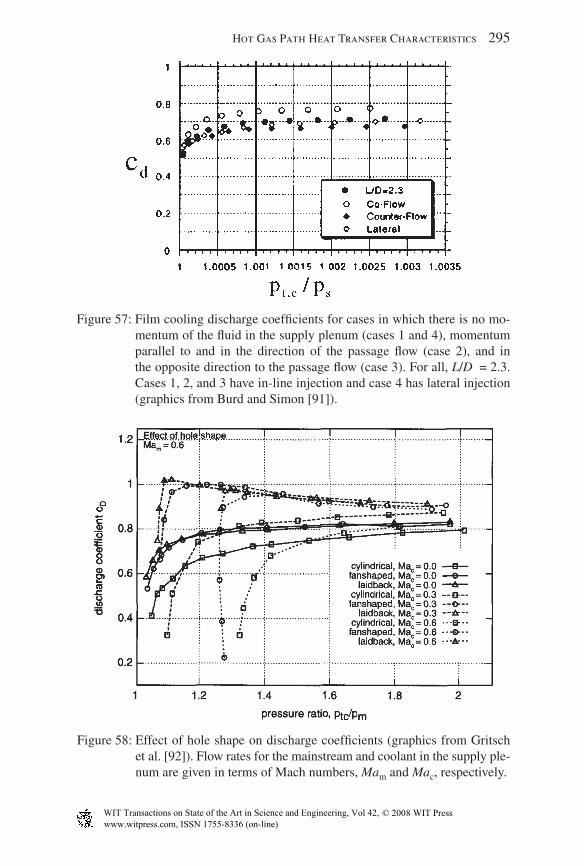
Hot Gas Path Heat Transfer Characteristics 295
Figure 58: Effect of hole shape on discharge coeffi cients (graphics from Gritsch et al. [92]). Flow rates for the mainstream and coolant in the supply ple-num are given in terms of Mach numbers, Mam and Mac, respectively.
Figure 57: Film cooling discharge coeffi cients for cases in which there is no mo-mentum of the fl uid in the supply plenum (cases 1 and 4), momentum parallel to and in the direction of the passage fl ow (case 2), and in the opposite direction to the passage fl ow (case 3). For all, L/D = 2.3. Cases 1, 2, and 3 have in-line injection and case 4 has lateral injection (graphics from Burd and Simon [91]).
www.witpress.com, ISSN 1755-8336 (on-line) WIT Transactions on State of the Art in Science and Engineering, Vol , © 20 WIT Press42 08

296 Thermal Engineering in Power Systems
locally cool wall section and shear stresses are low. This can be near the leading edges of fi lm cooling holes.
3.4.2.10 Film cooling design As noted, fi lm cooling is infl uenced by many effects (listed above). No simple correlation exists of the form of eqns. (44) and (45) that appropriately captures all effects in a general. Accurate correlations require mea-surements in facilities that capture all the important effects, or similarly complete numerical simulations must be conducted.
Film cooling on the leading edge is important, as the leading edge often has the highest heat load of the turbine. As noted above, freestream turbulence level and scale have strong effects in the leading edge region and the radius of curvature strongly affects the acceleration fi eld and therefore the coolant interaction with the approach fl ow. Since the boundary layers in the leading edge region are thin, rough-ness and deposition can strongly infl uence performance. In general, for the leading edge with a multiple row of holes (“a showerhead”), the fi lm superposition model discussed above is not used, for the mixing with the passage fl ow is too intense.
Correlation of fi lm cooling data on the pressure side must account for the rapid decay in fi lm cooling effectiveness due to concave curvature, free stream turbu-lence level, and pressure side particular pressure profi le.
Correlations on the suction side must account for the slower decay of fi lm cool-ing performance due to the more stable, accelerated boundary layer, and convex curvature. Again, it should be done for each particular design.
3.4.2.11 Film cooling on the tip The tip of the airfoil is diffi cult to cool for its geometry can change considerably due to oxide development, erosion and intense mixing of coolant and passage fl ow in the complex secondary fl ow discussed above. There is a substantial pressure difference between the pressure and the suction sides of the airfoil. This leads to high tip leakage fl ow and it associated mixing of the coolant. This effect is usually strongest at the mid-axial chord of the airfoil, close to the highest curvature point of the airfoil. In general, concentration of tip fi lm cooling holes in this area can address potential tip oxidation and burning problems. As noted above, there is strong vorticity on the suction side of the blade near the tip, as driven by the tip leakage fl ow. These vortices penetrate radially and circumferentially quite far into the passage near the suction wall. It is therefore necessary to include dedicated fi lm cooling in this tip region.
3.4.2.12 Film cooling on endwalls Endwall fi lm cooling and heat transfer are strongly infl uenced by secondary fl ows in the gas path. Such secondary fl ows will dictate the position of the fi lm holes on the platform.
Freidrichs et al. [94] documented a representative fi lm cooling effectiveness distribution on the endwall of a large-scale, low-speed cascade (see Fig. 59). Results indicate a large region of the pressure side leading edge that remains uncooled. The passage vortex and endwall secondary fl ows sweep coolant from the pressure side to the suction side and can disturb the mid passage coolant. Although specifi c results will vary signifi cantly from one confi guration to the next, the study indicates that cooling holes placed near the passage pressure side may be expected to produce little benefi t. Figure 52 shows the effects of tip and
www.witpress.com, ISSN 1755-8336 (on-line) WIT Transactions on State of the Art in Science and Engineering, Vol , © 20 WIT Press42 08
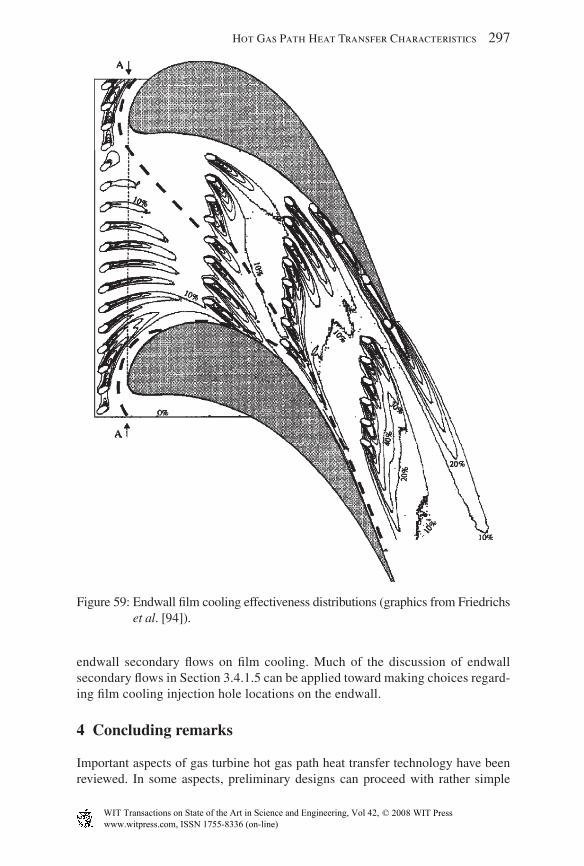
Hot Gas Path Heat Transfer Characteristics 297
endwall secondary fl ows on fi lm cooling. Much of the discussion of endwall secondary fl ows in Section 3.4.1.5 can be applied toward making choices regard-ing fi lm cooling injection hole locations on the endwall.
4 Concluding remarks
Important aspects of gas turbine hot gas path heat transfer technology have been reviewed. In some aspects, preliminary designs can proceed with rather simple
Figure 59: Endwall fi lm cooling effectiveness distributions (graphics from Friedrichs et al. [94]).
www.witpress.com, ISSN 1755-8336 (on-line) WIT Transactions on State of the Art in Science and Engineering, Vol , © 20 WIT Press42 08
298 Thermal Engineering in Power Systems
correlations, such as that presented for heat transfer on the leading edge. In most design aspects, the fl ow is too complex and heat transfer is infl uenced by too many factors for application of any general correlations. Thus, in support of engine design, (1) information in the literature is studied and interpreted; (2) measure-ments in cascades or other fl ow rigs which simulate the engine geometry and fl ow conditions of interest are taken and interpreted; (3) detailed calculations are made and the computed results are interpreted and; ultimately, (4) prototype engines are constructed, instrumented, operated, and examined for indications of excessive thermal loading. All of these steps require a strong understanding of the funda-mental principles which govern fl ow and heat transfer in the gas path. Experiments and computations never include all effects; thus, an understanding of the physics is needed in making experimental or computational setup choices.
Though reliance on computations is rising, the art of computation is still encum-bered with unanswered questions regarding computation of transition to turbu-lence and estimation of turbulent transport.
The objective of this chapter is to acquaint the designer with many important features of fl ow and heat transfer in the gas path that are to be considered when entering the literature, preparing experiments and computer models, and interpret-ing the information gathered.
References
[1] Han, J.-C., Dutta, S. & Ekkad, S., Gas Turbine Heat Transfer and Cooling Technology, Taylor Francis: New York, NY, 2000.
[2] Lakshminarayan, B., Turbulence modeling for turbomachinery fl ows (Section 5.2, Chapter 5). Fluid Dynamics and Heat Transfer of Turbomachinery, John Wiley & Sons: New York, NY, pp. 362–375, 1996.
[3] Drummel, H.-G., LeMeiux, D.H., Voigt, M. & Zombo, P.J., Online monitoring of gas turbine power plants, Siemens Power Generation Technical Paper, 2005.
[4] Cumpsty, N., Jet Propulsion, Cambridge University Press, Cambridge, UK, 1997.
[5] Goldstein, R.J., Lau, K.Y. & Leung, C.C., Velocity and turbulence measure-ments in combustion systems. Experiments in Fluids, 1, pp. 93–99, 1983.
[6] Moss, R.W. & Oldfi eld, M.L.G., Measurement of hot combustor turbulence spectra, ASME paper 91-GT-351, 1991.
[7] Goebel, S.G., Abuaf, N., Lovett, J.A. & Lee, C.P., Measurements of combus-tor velocity and turbulence profi les, ASME paper 93-GT-228, 1993.
[8] van Fossen, G.J. & Bunker, R.S., Augmentation of stagnation heat transfer due to turbulence from a DLN can combustor, ASME paper GT-2000-215, 2000.
[9] Ames, F.E., Wang, C. & Barbot, P.A., Measurement and prediction of the infl uence of catalytic and dry low NOx combustor turbulence on vane surface heat transfer. Journal of Turbomachinery, 125, pp. 210–220, 2003.
[10] Povey, T., Chana, K.S., Jones, T.V. & Hurrion, J., The effect of hot-streaks on HP vane surface and endwall heat transfer: An experimental and numerical study, ASME paper GT2005-69066, 2005.
www.witpress.com, ISSN 1755-8336 (on-line) WIT Transactions on State of the Art in Science and Engineering, Vol , © 20 WIT Press42 08
Hot Gas Path Heat Transfer Characteristics 299
[11] Piggush, J. & Simon, T.W., Flow measurements in a fi rst stage nozzle cas-cade having endwall contouring, ASME paper GT2005-68340, 2005.
[12] Hancock, P.E. & Bradshaw, P., The effect of free-stream turbulence on tur-bulent boundary layer fl ow and heat transfer. Journal of Fluids Engineering, 105, p. 284, 1983.
[13] Oke, R.A., Measurements in a Gas Turbine First Stage Nozzle Guide Vane Cascade with Film Cooling and Endwall Contouring, PhD Thesis, Mechani-cal Engineering Department, University of Minnesota, 2001.
[14] Ames, F.E., The infl uence of large-scale high-intensity turbulence on vane heat transfer. Journal of Turbomachinery, 119, pp. 23–30, 1997.
[15] Chana, K.S., Hurrion, J.R. & Jones, T.V., The design, development and test-ing of a non-uniform inlet temperature generator for the QinetiQ transient turbine research facility, ASME paper GT2003-38469, 2003.
[16] Viskanta, R., Heat transfer to impinging isothermal gas and fl ame jets. Experimental Thermal and Fluid Science, 6, pp. 111–134, 1993.
[17] Goldstein, R.J., Behbahani, A.I. & Heppelmann, K.K., Streamwise distribu-tion of the recovery factor and the local heat transfer coeffi cient to an imping-ing circular air jet. International Journal of Heat and Mass Transfer, 29, pp. 1227–1235, 1986.
[18] Kelso, R.M., Lim, T.T. & Perry, A.E., An experimental study of round jets in crossfl ow. Journal of Fluid Mechanics, 306, pp. 111–144, 1996.
[19] Lee, S.W., Lee, J.S. & Ro, S.T., Experimental study on the fl ow character-istics of streamwise inclined jets in crossfl ow on fl at plate. Journal of Tur-bomachinery, 116, pp. 97–105, 1996.
[20] Adolfson, D.A., Simon, T.W. & Ibrahim, M.B., Measurements, computation and analysis of a semi-constrained axisymmetric impinging jet, ASME paper GT2004-54215, 2004.
[21] Kercher, D.M. & Tabakoff, W., Heat transfer by a square array of round air jets impinging perpendicular to a fl at surface including the effect of spent air. Journal of Engineering for Power, 92, pp. 73–82, 1970.
[22] Metzger, D.E., Florschuetz, L.W., Takeuchi, D.I., Behee, R.D. & Berry, R.A., Heat transfer characteristics for inline and staggered arrays of circular jets with cross fl ow of spent air. Journal of Heat Transfer, 101, pp. 526–531, 1979.
[23] Florschuetz, L.W., Truman, C.R. & Metzger, D.E., Streamwise fl ow and heat transfer distributions for jet array impingement with cross fl ow. Journal of Heat Transfer, 103, pp. 337–342, 1981.
[24] Park, J., Goodro, M., Ligrani, P., Fox, M. & Moon, H., Separate effects of Mach number and Reynolds number on jet array impingement heat transfer. Journal of Turbomachinery, 129, pp. 269–280, 2007.
[25] Kanokjaruvijit, K. & Martinez-Botas, R.F., Parametric effects on heat trans-fer of impingement on dimpled surface. Journal of Turbomachinery, 127, pp. 287–296, 2005.
[26] Chupp, R.E., Helms, H.E., McFadden, P.W. & Brown, T.R., Evaluation of internal heat transfer coeffi cients for impingement cooled turbine blades. Journal of Aircraft, 6(1), pp. 203–208, 1969.
www.witpress.com, ISSN 1755-8336 (on-line) WIT Transactions on State of the Art in Science and Engineering, Vol , © 20 WIT Press42 08
300 Thermal Engineering in Power Systems
[27] Bunker, R.S. & Metzger, D.E., Local heat transfer in internally cooled tur-bine airfoil leading edge regions: Part I – Impingement cooling without fi lm coolant extraction. Journal of Turbomachinery, 112, pp. 451–458, 1990.
[28] Metzger, D.E. & Bunker, R.S., Local heat transfer in internally cooled tur-bine airfoil leading edge regions: Part II – Impingement cooling with fi lm coolant extraction. Journal of Turbomachinery, 112, pp. 459–466, 1990.
[29] Chyu, M.K., Hsing, Y.C. & Natarajan, V., Heat transfer on the base surface of three-dimensional protruding elements. International Journal of Heat and Mass Transfer, 39(4), pp. 2925–2935, 1996.
[30] Uzol, O. & Camci, C., Elliptical pin fi ns for gas turbine blade cooling applications. Part 2: Wake fl ow fi eld measurements and visualization using particle image velocimetry, ASME paper 2001-GT-181, 2001.
[31] Mahmood, G.I., Won, S.Y. & Ligrani, P.M., Local Nusselt numbers and fl ow structure in a rectangular channel with cylindrical pin-fi ns, Department of Mechanical Engineering, University of Utah, Salt Lake City, UT, 2002.
[32] Ligrani, P.M., Oliveira, M.M. & Blaskovich, T., Comparison of heat transfer augmentation techniques. AIAA Journal, 41(3), pp. 337–362, 2003.
[33] Chyu, M.K. & Natarajan, V., Heat transfer on the base surface of three-di-mensional protruding elements. International Journal of Heat and Mass Transfer, 39(14), pp. 2925–2935, 1996.
[34] Ligrani, P.M. & Mahmood, G.I., Variable property Nusselt numbers in a channel with pin fi ns. Journal of Thermophysics and Heat Transfer, 17(1), pp. 103–111, 2003.
[35] Metzger, D.E., Berry, R.A. & Bronson, J.P., Developing heat transfer in rect-angular ducts with staggered arrays of short pin fi ns. Journal of Heat Trans-fer, 104, pp. 700–706, 1982.
[36] Kays, W.M., Crawford, M.E. & Weigand, B., Convective Heat and Mass Transfer, McGraw-Hill Book Company, Inc.: New York, 2005.
[37] Gebhart, B., Heat Transfer, McGraw-Hill Book Company, Inc.: New York, 1961.
[38] Incropera, F.P. & DeWitt, D.P., Fundamental of Heat and Mass Transfer, 5th edn, John Wiley and Sons: Hoboken, NJ, 2002.
[39] Lezius, D.K. & Johnston, J.P., Roll-cell instabilities in rotating laminar and turbulent channel fl ows. Journal of Fluid Mechanics, 77(part 1), pp. 153–175, 1976.
[40] Wagner, J.H., Johnson, B.V. & Kopper, F.C., Heat transfer in rotating serpentine passages with smooth walls. Journal of Turbomachinery, 113, pp. 321–330, 1991.
[41] Casarsa, L. & Arts, T., Experimental investigation of the aerothermal per-formance of a high blockage rib-roughened cooling channel. Journal of Tur-bomachinery, 127, pp. 580–588, 2005.
[42] Kiml, R., Mochizuki, S. & Murata, A., Effects of rib arrangements on heat transfer and fl ow behavior in a rectangular rib-roughened passage: applica-tion to cooling of gas turbine blade trailing edge. Journal of Heat Transfer, 123, pp. 675–681, 2001.
www.witpress.com, ISSN 1755-8336 (on-line) WIT Transactions on State of the Art in Science and Engineering, Vol , © 20 WIT Press42 08
Hot Gas Path Heat Transfer Characteristics 301
[43] Fu, W.L., Wright, L.M. & Han, J.C., Heat transfer in two-pass rotating rect-angular channels (AR = 1:2 and AR = 1:4) with 45 degree angled rib turbula-tors. Journal of Heat Transfer, 127, pp. 164–174, 2005.
[44] Wright, L.M., Fu, W.-L. & Han, J.-C., Thermal performance of angled, V-shaped, and W-shaped rib turbulators in rotating rectangular cooling chan-nels (AR = 4:1). Journal of Turbomachinery, 126, pp. 604–614, 2004.
[45] Griffi th, T.S., Al-Hadhrami, L. & Han, J.C., Heat transfer in rotating rectan-gular cooling channels (AR = 4) with dimples. Journal of Turbomachinery, 125, pp. 555–564, 2003.
[46] Burgess, N.K., Oliveira, M.M. & Ligrani, P.M., Nusselt number behavior on deep dimples surfaces within a channel. Journal of Heat Transfer, 125, pp. 11–18, 2003.
[47] Mahmood, G.I., Hill, M.L., Nelson, D.L., Ligrani, P.M., Moon, H.-K. & Glezer, B., Local heat transfer and fl ow structure on and above a dimpled surface in a channel. Journal of Turbomachinery, 123, pp. 115–123, 2001.
[48] Kreith, F. & Bohn, M.S., Principles of Heat Transfer, Brooks/Cole: Pacifi c Grove, CA, 2000.
[49] Incropera, F.P. & DeWitt, D.P., Fundamentals of Heat and Mass Transfer, John Wiley & Sons: New York, NY, 2001.
[50] Jiang, N. & Simon, T.W., Modeling laminar-to-turbulent transition in a low-pressure turbine fl ow which is unsteady due to passing wakes: Part I – Transi-tion onset, ASME paper GT2003-38787, 2003.
[51] Mayle, R.E., The role of laminar-turbulent transition in gas turbine engines. Journal of Turbomachinery, 113, pp. 509–537, 1991.
[52] Van Fossen, G.J., Simoneau, R.J. & Ching, C.Y., Infl uence of turbulence pa-rameters, Reynolds number, and body shape on stagnation-region heat trans-fer. Journal of Heat Transfer, 117, pp. 597–603, 1995.
[53] Tennekes, H. & Lumley, J.L., A First Course in Turbulence, The MIT Press: Cambridge, MA, 1972.
[54] Giel, P.W., Boyle, R.J. & Bunker, R.S., Measurements and predictions of heat transfer on rotor blades in a transonic turbine cascade. Journal of Turboma-chinery, 126(1), pp. 110–121, 2004.
[55] Van Fossen, G.J. & Bunker, R.S., Augmentation of stagnation region heat transfer due to turbulence from a DLN (dry low-NOx) can combustor, ASME paper 2000-GT-215, 2000.
[56] Bunker, R.S., Personal communication, 2007. [57] Dullenkopf, K. & Mayle, R.E., An account of free-stream-turbulence length
scale on laminar heat transfer. Journal of Turbomachinery, 117, pp. 401–406, 1995.
[58] Rued, K. & Wittig, S., Laminar and transitional boundary layer structures in accelerating fl ow with heat transfer, ASME paper 86-GT-97, Dusseldorf, Germany, 1986.
[59] Patankar, S., Numerical Heat Transfer and Fluid Flow, Hemisphere Publish-ing Corp.: New York, NY, 1980.
[60] Fluent Users’ Manual: http://jullio.pe.kr/fl uent6.1/help/html/ug/main_pre.htm
www.witpress.com, ISSN 1755-8336 (on-line) WIT Transactions on State of the Art in Science and Engineering, Vol , © 20 WIT Press42 08
302 Thermal Engineering in Power Systems
[61] Star-CD web site: http://www.cd-adapco.com/products/STAR-CD/index.html [62] CFX web site: http://www.ansys.com/products/cfx.asp [63] Durbin, P., Near wall turbulence closure modeling without ‘damping func-
tions,’ Theoretical Computational Fluid Dynamics, 3(1), pp. 1–13, 1991. [64] Dunn, M.G., Convective heat transfer and aerodynamics in axial fl ow tur-
bines. Journal of Turbomachinery, 123, pp. 637–686, 2001. [65] Abhari, R.S. & Epstein, A.H., An experimental study of fi lm cooling in a
rotating transonic turbine, ASME paper 92-GT-201, 1992. [66] Giel, P.W., Van Fossen, G.J., Boyle, R.J., Thurman, D.R. & Civinskas, K.C.,
Blade heat transfer measurements and predictions in a transonic turbine cas-cade, ASME paper 99-GT-125, 1999.
[67] Langston, L.S., Crossfl ow in a turbine cascade passage. Journal of Engineer-ing for Power, 10, pp. 866–874, 1980.
[68] Goldstein, R.J., Wang, P.H. & Jabbari, M.Y., The infl uence of secondary fl ows near the endwall and boundary layer disturbance on convective transport from a turbine blade. Journal of Turbomachinery, 117, pp. 657–663, 1995.
[69] Graziani, R.A., Blair, M.F., Taylor, J.R. & Mayle, R.E., An experimental study of endwall and airfoil surface heat transfer in a large scale turbine blade cascade. Journal of Engineering for Power, 102, pp. 257–267, 1980.
[70] Key, N. & Arts, T., Comparison of turbine tip leakage fl ow for fl at tip and squealer tip geometries at high-speed conditions. Journal of Turbomachin-ery, 128, pp. 213–220, 2006.
[71] Metzger, D.E. & Rued, K., The infl uence of turbine clearance gap leakage on passage velocity and heat transfer near blade tips: Part I – Sink fl ow effects on blade pressure side. Journal of Turbomachinery, 111, pp. 284–292, 1989.
[72] Rued, K. & Metzger, D.E., The infl uence of turbine clearance gap leakage on passage velocity and heat transfer near blade tips: Part II – Source fl ow effects on blade suction sides. Journal of Turbomachinery, 111, pp. 293–300, 1989.
[73] Van Fossen, G.J. & Simoneau, R.J., Stagnation region heat transfer: the in-fl uence of turbulence parameters, Reynolds number and body shape. Gen-eral Papers in Heat and Mass Transfer, Insulation, and Turbomachinery, eds S.H. Chan, I.S. Habib, L.E. Hochreiter, R.L. Mahajan, E.V. McAssey, J.Y. Murthy, M.S. Sohal, R.J. Couvillion, W.B. Krause, R.S. Amano & R.H. Pletcher, ASME HTD-Vol. 271, 1994.
[74] Saha, A.K., Mahmood, G.I. & Acharya, S., The role of leading-edge con-touring on end-wall fl ow and heat transfer: computations and experiments, ASME paper GT2006-91318, 2006.
[75] Bons, J., Taylor, R., McClain, S. & Rivir, R., The many faces of turbine sur-face roughness. Journal of Turbomachinery, 123, pp. 739–748, 2001.
[76] Wammack, J.E., Crosby, J., Fletcher, D., Bons, J.P. & Fletcher, T.H., Evolu-tion of surface deposits on a high pressure turbine blade, Part I: Physical characteristics, ASME paper GT2006-91246, 2006.
[77] Bons, J.P., Wammack, J.E., Crosby, J., Fletcher, D. & Fletcher, T.H., Evolu-tion of surface deposits on a high pressure turbine blade, Part II: Convective heat transfer, ASME paper GT2006-91257, 2006.
www.witpress.com, ISSN 1755-8336 (on-line) WIT Transactions on State of the Art in Science and Engineering, Vol , © 20 WIT Press42 08
Hot Gas Path Heat Transfer Characteristics 303
[78] Bogard, D., Schmidt, D. & Tabbita, M., Characterization and laboratory simulation of turbine airfoil surface roughness and associated heat transfer. Journal of Turbomachinery, 120, pp. 337–342, 1998.
[79] Barlow, D., Kim, Y. & Florschuetz, L., Transient liquid crystal technique for convective heat transfer on rough surfaces. Journal of Turbomachinery, 119, pp. 14–22, 1997.
[80] Goldstein, R.J., Eckert, E.R.G., Chiang, H.D. & Elovic, E., Effect of surface roughness on fi lm cooling performance. Journal of Engineering for Gas Tur-bines and Power, 107(1), pp. 111–116, 1985.
[81] Taylor, R., Scaggs, W. & Coleman, H., Measurement and prediction of the effects of nonuniform surface roughness on turbulent fl ow friction coeffi -cients. Journal of Fluids Engineering, 110, pp. 380–384, 1998.
[82] Turner, A., Hubbe-Walker, S. & Bayley, F., Fluid fl ow and heat transfer over straight and curved rough surfaces. International Journal of Heat and Mass Transfer, 43, pp. 251–262, 2000.
[83] Hoffs, A., Drost, U. & Bolcs, A., Heat transfer measurements on a turbine airfoil at various Reynolds numbers and turbulence intensities including ef-fects of surface roughness, ASME paper 96-GT-169, 1996.
[84] Bunker, R.S., Separate and combined effects of surface roughness and turbu-lence intensity on vane heat transfer, ASME paper 07-GT-135, 1997.
[85] Maciejewski, P.K. & Moffat, R.J., Heat transfer with very high free-stream turbulence Part I: Experimental data. Journal of Heat Transfer, 114, pp. 827–833, 1992.
[86] Maciejewski, P.K. & Moffat, R.J., Heat transfer with very high free-stream turbulence Part II: Analysis of results. Journal of Heat Transfer, 114, pp. 834–839, 1992.
[87] Ames, F.E., The infl uence of large-scale high-intensity turbulence on vane heat transfer. Journal of Turbomachinery, 119, pp. 23–30, 1997.
[88] Garg, V.K., Heat transfer on a fi lm-cooled rotating blade. International Jour-nal of Heat and Fluid Flow, 21, pp. 134–145, 2000.
[89] Librizzi, J. & Cresci, R.J., Transpiration cooling of a turbulent boundary layer in an axisymmetric nozzle. AIAA Journal, 2, p. 617, 1964.
[90] Mick, W.J. & Mayle, R.E., Stagnation fi lm cooling and heat transfer includ-ing its effect within the hole pattern. Journal of Turbomachinery, 110, pp. 66–72, 1998.
[91] Burd, S.W. & Simon, T.W., Measurements of discharge coeffi cients in fi lm cooling. Journal of Turbomachinery, 121(2), pp. 243–248, 1999.
[92] Gritsch, M., Schulz, A. & Wittig, S., Adiabatic wall effectiveness measure-ments of fi lm cooling holes with expanded exits. Journal of Turbomachinery, 120, pp. 549–556, 1998a.
[93] Hay, N. & Lampard, D., Discharge coeffi cient of turbine cooling holes: a review, ASME paper 96-GT-492, 1996.
[94] Friedrichs, S., Hodson, H.P. & Dawes, W.N., Distribution of fi lm cooling effectiveness on a turbine endwall measured using the ammonia and diazo technique. Journal of Turbomachinery, 118, pp. 613–621, 1996.
www.witpress.com, ISSN 1755-8336 (on-line) WIT Transactions on State of the Art in Science and Engineering, Vol , © 20 WIT Press42 08