Embed Size (px)
Citation preview

ISIJ International, Vol, 32 (1 992), No. 7, pp. 865-872
Heat Transfer
Injection
between Bubbles and Liquid during Cold Gas
ManabuIGUCHl. Zen-ichiro MORITA.Hirohiko TOKUNAGAI) and Hideo TATEMICH11)
Faculty of Engineering, Yamadaoka.Suita. Osaka-fu, 565Japan. I)KakogawaWorks. KobeSteel. Ltd., Kanazawa-cho.Kakogawa,Hyogo-ken, 675-01 Japan.
(Received on February 17. 7992, accepted in final form on April 24. 1992)
In the steelmaking and refining processes, bottom gas blowing is a widely-used method. In these
systems, the gas is blown into liquid from the bottom of the vessel at a temperature lower than liquid
temperature. The mechanismof heat transfer between bubbles and liquid and the effect of heat transfer onthe formation of bubbles and the rising characteristics of the bubbles were investigated, using air andhelium in a water model. The injection temperature of the gases wasabout - 11O'C. Heat transfer betweenbubbles and liquid wasalmost fully completed near the nozzle. Bubble expansion due to the heat transfer
resulted in the increase of gas holdup in the radial direction. In the region far from the nozzle, the
bubble characteristics accompanyingcold gas injection were the sameas those initiated by an ambienttemperature gas injection at the samemassflow rate.
KEYWORDS:steelmaking; injection; bubbling jet heat transfer; gas holdup, bubble frequency; electro-
resistivity probe, microthermocouple.
1. Introduction
In the steelmaking and refining processes, bottom gasblowing is a method widely utilized to homogenizetemperature and chemical concentrations, and to ac-celerate the chemical reactions. An additional benefit
is the fact that gas injection enhances the mixing ofpowders such as soda ash into molten iron. In anexamination of the efficiency of these methods ofoperation, or the facilities involved, whenusing molteniron, it is difficult to measure the physical phenomena.For this reason, most previous investigations have beenmadeusing ambient temperature water, mercury, andgas,1 ~4) This methodhas manyadvantages, but underreal conditions, gas is blown into molten iron fromthe bottom of the vessel at a temperature lower than theliquid temperature and hence heat transfer takes place
betweenbubbles and liquid.
Apparently very few researches have been carried out
on how the difference in temperature or heat transferaffects the formation of bubbles and the rising char-acteristics of the bubbling jets. This study, in which air
and helium cooled to - 110'C were blown into water,examines these influences. Since an analogy is expectedto exist betweenheat transfer and masstransfer, it maybe possible to predict the masstransfer from the data ofheat transfer.
2. Experiment
2.1. Experimental ApparatusFigure I shows a schematic diagram of the experi-
mental apparatus. Compressedair was fed into a heatexchanger through a dehumidifier (thus preventing both
o o
ocoo
/NozzIe
T
Acryl ic pipe
Mass f lowmeter
Bypass valve
ReguIato r
Si I icage l
Liquid ni trogenHeat exchanger
865
ooCompressor
Dehumidif ier
Fig. 1.
Experimental apparatus (1).
C 1992 ISIJ

ISIJ International, Vol. 32
a decrease in the heat transfer and choking due tofrosting), a regulator and a massflowmeter. Theair w.ascooled to - 185'C by a heat exchanger filled with liquid
nitrogen. The air temperature was controlled by abypass valve and blown into the cylindrical vessel
through a single hole nozzle located at the center of the
bottom plate. In the case of helium blowing, the gascontained in a gas cylinder was fed to the regulatordirectly. The gas pipe and the heat exchanger wereinsulated with polyethylene foam. The vessel, madeofacrylic, had an inner diameter of 200mmand a height
of 400mm,and the nozzle inner diameters were l, 2,
and 5mm.2.2. Measurementof Heat Transfer
The cooled air exchanges sensible heat with waterduring its passage through the bath, and leaves the
system. By changing the bath depth, H~, the region
ThermocoupIe
Acryl ic ~
Acrylsquarvesse
oQ (, 9oo o oa
a Qo oo o
l\\Thermocou le
ThermocoupIe
pipe
Acry I ic
square
vesse l
E~c\~
ThermocoupIeFig. 2. Experimental apparatus (2).
Fi Iter
(1 992). No. 7
~~
o:::Amp.
AID
L'
near ize r
Micro computer
~\ Bare thermocouple
(c5,t/m)hi~~6mm
Fig. 3. Microthermocouple and schematic diagram of signal
processing.
C 1992 ISIJ 866
where most of the heat transfer occurs can be deter-
mined. Thetemperature of the injected air wasmeasuredby use of a thermocouple which was installed inside the
gas pipe near the nozzle. The gas which left the bathsurface was separated from droplets and collected
by a cap-shaped container, and its temperature wasmeasuredevery 5sec by use of a thermocouple (Type-K,ip I .5 mm).At the sametime, the bath temperature wasmeasured using three thermocouples installed in the
upper, middle, and lower parts of the bath in the sameway (e.g. Fig. 2). Change in the temperature of the
bubbles was measured directly using a microthermo-couple in order to measure the heat transfer betweenbubbles and liquid moreexactly. Figure 3is a schematicillustration of the microthermocouple with a diagramof the signal processing. In this measurement, barethermocouple wire 5klm in diameter, with a hot junctiondiameter of 12.5 ,xm, was employed. The filtered signal
was A/D-converted at a s~mpling frequency of I or
2kHz. Using these instruments, the change in bubbletemperature wasmeasuredat an axial position z located
between 20 and 70mmon the center line, where z wasmeasuredfrom the nozzle exit.
2.3. Observation of Bubble FormationBubbles expanded as a result of the heat transfer.
The phenomenonwas recorded by a high-speed video
camera. The meanbubble diameter and the bubblefrequency were analyzed in order to compare theresults for cooled air injection with those for ambienttemperature air injection.
2.4. Bubble Rising Characteristics
Bubble frequency fB, gas holdup ce, meanbubble chordlength LB, and meanbubble rising velocity tiB Weremeasuredwith an electro-resistivity probe for a bathdepth of 200mm.The single probe signal was A/D-converted at a sampling frequency of I kHZ and atotal of 105 data points were processed to obtain the
bubble frequency and gas holdup at each measurementlocation.
In the same way, the double probe signal wasA/D-converted at a sampling frequency of lOkHz anda total of 2400 bubble signals were processed to
determine the meanbubble rising velocity and meanbubble chord length.
3. Experimental Results and Discussion
3.1. TemperatureChangesof GasandLiquid in the Bathduring Cold Air Injection
The experimental conditions are shown in Table 1.
The gas flow rate wasevaluated at the nozzle exit.
Figures 4 and 5 show examples of the temperaturechange of the injection gas and the water in the bath.
The temperature of the injection gas fluctuated around
- I lO'C within a scatter of ~5'C. The temperature in
the gas collector decreased monotonically along withthe temperature of the bath. If it can be assumedthat
the heat transfer from the vessel wall and the surface ofthe bath is negligible, then the following approximateequation holds due to turbulent mixing in the gas

ISIJ
Table l. Experimental conditions.
International. Vol. 32 (1 992), No. 7
Nozzle diameter (mm)Gasflow rate at nozzle exit (crn3/s)
Inlet gas temperature ('C)
Bath depth (mm)Bath temperature ('C)
l, 2, 541.4-179.6
- ~l0~5, 20
l0-30020-50
Ci
-40
1, O Q_,/'~~'~~Cl:i::~7~~~T: Cl ~l-(Il-~~.. - -_/O,/ -
O
(D
:S
~CQ
,D
QE:~i
-80
-~ 20
-1 60
Inlet gas (air)
O IO 15 205Time (min. )
Fig. 4. Changein the temperature of inlet gas.
50
25
d~= 2~Im
Hw= 40mmO*= 179. 6cm=/s
water
"'[]/'/'
,
/'/'
ila' 9 A'
i!
D!
o40
q)
*~~*(1)c~
E 30~~ /
Gas(air)
20O 5 1O 15 20 25
Time (min.)
Fig. 5. Changein the temperature ofwater and gas
collector:
cgmg(eg,i. - eg,~) =cgygVg(deg.~/dt) +c~y~V~(de~/dt).(1)
where cg: specific heat of the gas, thg: massflow rate ofthe gas, Og,i.: temperature of the injection gas, eg,~'
temperature of the gas in the gas collector, c~: specific
heat of water, y~: specific gravity of water, yg: specific
gravity of gas, V~: volume of water, Vg: volume of gasin the gas collector, O~: temperature of bulk water, andt: time.
The first term on the right hand side of Eq. (1) is theheat to cool the gas in the gas collector and relatively
small comparedwith the second term; hence Eq. (1)
becomes:
cgmg(Og,i~- eg,~) =c~y~V*(de~/dt). . . . .. . . .. . .
.(2)
Theexperimental data revealed that this equation holdswithin a scatter of + 150/0.
3.2. Heat Transfer Efficiency
Figure 6 shows a relation between bath depth. H~,
867
O d~=1mm
A d~=2mm
C] d~=5mm
Gas:a rO,= 179. 6c~ls
O. 84T 10 50 100 200 300
H~ (mm)
Flg 6 Measuredvatues ofheat transrer efficiency n.
and the measuredvalue of heat transfer efficiency, n, at
a nozzle exit air flow rate of 179.6cm3/s and a gastemperature of - I lO'C. Here n is defined by
n=(i~-ii)/(i~- ii)...
.....,....(3)
where i~: enthalpy of the gas in the gas collector, i*:
enthalpy of the gas at the sametemperature as the bathand ii: enthalpy of the injected gas.
For all cases of nozzle diameter (d,, = I ,2, or 5mm),
n begins to decrease at a bath depth H~ from 50 tolOOmm.It decreases drastically around H~=20mmford,* =2and 5mm.
It is possible to conclude that the heat transferbetween bubbles and liquid takes place in the regionjust above the nozzle. In the case of d~=1mmthe
'pronounced decrease in n around H~=20mmcannotbe seen. This is becausebubble formation is jetting-1ike,
so that there are manydroplets above the free surface,
and the heat transfer can take place there. Since thebubble diameter increases with an increase in the nozzlediameter, the interfacial area between bubbles andliquid being reievant to heat transfer is the smallest in
the case of d~=5mm.The heat transfer efficiency nbecomessmall comparedwith other cases.
3.3. Observation of the Bubble Formation ProcessFigures 7 and 8 show the appearance of bubble
expansion recorded by a high-speed video camera.Bubbles injected at a low temperature clearly expanddue to heat transfer. In addition, bubbles injected atambient temperature have a rugged surface. In contrast,bubbles injected at low temperatures have a smoothsurface like that of ari inflated balloon. The smoothsurface indicates that the bubble pushes the surroundingliquid with almost the samevelocity in all directions.Therefore, it is possible to say that the flow around thecold temperature bubbles has a less turbulent intensitythan that around ambient temperature bubbles.
3.4. Coefficient of Heat Transmission between Bubbleand Liquid
At low gas flow rates, the shape of bubbles is almostspherical, but as the gas flow rate increases, the bubbles
r.'~~J~ 1992 ISIJ

ISIJ International, Vol. 32 (1992). No. 7
Fig. 7. The appearance of bubble at ambient temperaturegas injection (d~=5mm,air temperature: 20"C, air
velocity at nozzle exit: 8.6m/s, water temperature:20'C).
Fig. 8. The appearance of bubble at cold gas injection
(d~=5mm,air temperature: - I lO'C, air velocity at
nozzle exit: 8.6m/s, water temperature: 20'C).
take a rotating ellipsoidal shape. In this discussion, abubble is assumedto be a rotating ellipsoid, and therotating ellipsoid is further assumedto be a spherical
body with the samevolume. The equivalent diameter is
denoted by dB. Onthe basis of this approximation, theNusselt number(definition being mentioned later) wasestimated and compared with previous experimentalresults.
Several nondimensional correlations for forced con-vection heat transfer around a solid sphere have beenproposed. The Nusselt number is represented as afunction of the Reynolds number and the Prandtlnumber. The present authors demonstrated that turbu-lence intensity plays an important role in the forcedconvection heat transfer around a solid sphere, andproposed the following correlation after Whitaker'sequation5,6).
(Nu~p- 2) = (0.4Re~/2 +0.06Re~/3)pr0.4
x (~*/~o)1/4(1 +T) .......(4)~
1.36
l 500,
5.7T~ and 0.46
where Pr: Prandtl numberof bulk water. Rep: Reynoldsnumberof bubble = (~BdB)/v~, ~B: meanbubble rising
velocity, dB: mean bubble diameter, v~: kinematicviscosity of bulk water, p~: dynamic viscosity of bulkwater, uo: dynamicviscosity of water around the sphere,
and T~: turbulence intensity = u:ms/~~, u:ms: root meansquare value of turbulence componentof axial velocityof water.
Onthe other hand. Weber, considering the fact thatthe fluid inside the sphere is driven by fluid motion outsideit, represented the Nusselt number around the fluid
sphere as follows7):
-Ji/22 lNu~p
Rel/2(2.89+2 151co 64
.
' ) Pel/2l=J;~.(5)
Rep>70 and Kwhere K: (viscosity of fluid inside 'he fluid sphere)/(viscosity of fluid outside the fluid blr -\ Pe: Peclet
numberof bubble (Pe = Rep' Pr).
Provided that a bubble is assumedto be a solid sphere,the heat transfer coefficient outside the sphere calculatedfrorn Eq. (4) or (5) becomes6OO0-7OOOW/m2K underthe present experimental conditions.
Kronig and Brink solved an eigen value problemrelated to a Hadamard-typefiuid flow,8~ Io) and deter-
mined the time-dependent mass transfer coefficient.
Replacing the Sherwood number by the Nusseltnumber, the following expression for the heat transfercoefficient inside the sphere can be obtained:
"(32/3) ~A~~~exp(-16A,,Tp)
Nup=" = I
. . . . . . . . . .
(6)"~A~exp(- 16A~Tp)
~= l
where Tp=4at/d~B2 (a: temperature conductivity, t: time,dB: diameter of fluid sphere) is the non-dimensionaltime, A~ and ~~ are the coefficient and the eigen value,
respectively (see Ref. 8)).
Hijikata et al.11) pointed out that the vibration anddeformation of droplets promote heat transfer due tothe breaking of the stream lines in the fluid circulation,
which exhibits a similar effect of turbulence. However,there is no investigation on the Nusselt number, whichincludes the effect of bubble deformation behavior.Although it is not easy to obtain the precise heattransfer coefficient between bubbles and liquid due tothe difficulty of the estimation of the bubble diameterand deformation behavior, an attempt was madetoestimate the heat transfer coefficient by using the overallcoefficient of heat transmission.
3.5. Overall Coefficient of Heat Transmission
The overall coefficient of heat transmission betweenbubbles and liquid is represented as follows:
U~=l/(1/hl+ 1lhg).....
..........(7)
where ht=Nu,~p,l~l/dB: heat transfer coefficient fromliquid to bubble sphere, and hg=Nu~p,g~g/dB: heat
transfer coefficient from gas inside the bubble to liquid,
C 1992 ISIJ 868
ISIJ International. Vol, 32 (1992), No. 7
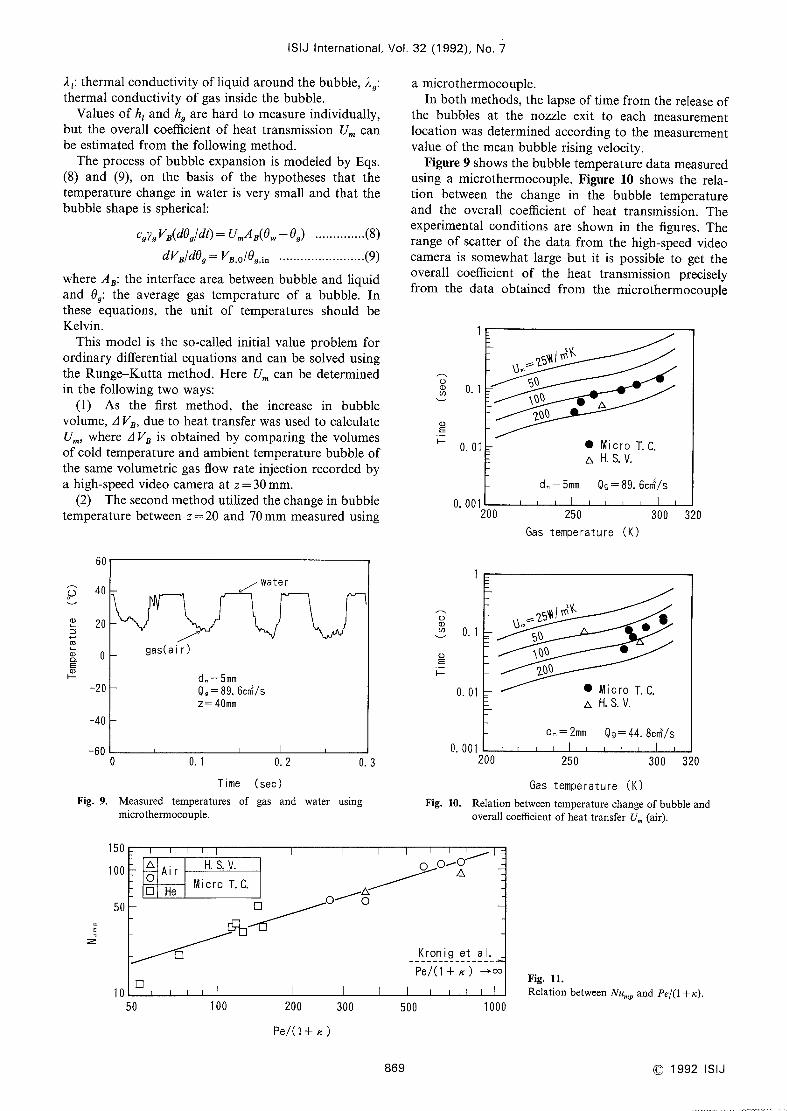
~l: thermal conductivity of liquid around the bubble, Ag:
thermal conductivity of gas inside the bubble.Values of hl and hg are hard to measureindividually,
but the overall coefficient of heat transmission U~canbe estimated from the following method.
The process of bubble expansion is modeledby Eqs.(8) and (9), on the basis of the hypotheses that the
temperature change in water is very small and that thebubble shape is spherical:
cgygVB(dOg/dt) = U~AB(e~-Og) ..............(8)
dV /de =V /O ........(9)g B,o g,i* """"""""
where AB: the interface area betweenbubble and liquid
and Og: the average gas temperature of a bubble. Inthese equations, the unit of temperatures should beKelvin.
This model is the so-called initial value problem forordinary differential equations and can be solved usingthe Runge-Kutta method. Here U~can be determinedin the following two ways:
(1) As the first method, the increase in bubblevolume, AVB, due to heat transfer wasused to calculate
U~, where AVB is obtained by comparing the volumesof cold temperature and ambient temperature bubble ofthe samevolumetric gas flow rate injection recorded bya high-speed video cameraat z=30mm.
(2) Thesecondmethodutilized the change in bubbletemperature between z=20 and 70mmmeasuredusing
50
a microthermocouple.In both methods, the lapse of time from the release of
the bubbles at the nozzle exit to each measurementlocation wasdetermined according to the measurementvalue of the meanbubble rising velocity.
Figure 9showsthe bubble temperature data measuredusing a microthermocouple. Figure 10 shows the rela-tion between the change in the bubble temperatureand the overall coefficient of heat transmission. Theexperimental conditions are shown in the figures. Therange of scatter of the data from the high-speed videocamera is somewhatlarge but it is possible to get theoverall coefficient of the heat transmission preciselyfrom the data obtained from the microthermocouple
oe) O.(1'
1
1
q)E~
H o. ol
o. oO1
~~~=~s~l m~
5Q
~Q~ e A~Q~
e micro T. C.
A H. S. V.
d 5mm Qg= 89. 6c~/s
/ Water 1
200 250 300 320
Gas temperature (K)
Oe)
:s
P(Q(1)
c~~~Q)
H
40
20
o
-20
-40
-60
gas(a ir )d. = 5mm0~ = 89. 6c~/s
z=40mm
O O. I O. 2 O. 3Time (sec)
Fig. 9. Measured temperatures of gas and water usingmicrothermocouple.
Oa)Cl)
(D
~H
o. 1
O. ol
O, ool
~~==~5~1((1~
o eS~~~~ e~~~
O Micro T. C.
A H. S. V.
d 2mm Qg=44. 8c~/s
150
1oO
200 250 300 320
Gas temperature (K)
Fig. 10. Relation between temperature changeof bubble andoverall coefficient of heat transfer U~(air).
z
50
10
AOCl
Ai rHe
H. S. V.
Micro T. C.
CII
C]
~~~
C] o-l
O~o:lA
Kronig et al.
Pe/(1+ k) -co
50 lOO 200 300
Pe/( I+ k )500 1000
Fig. 11.
Relation betweenNu~Fand Pe/(1 + 1().
869 @1992 ISIJ

ISIJ International, Vol.
measurement. The value U~ was found to be aboutlOOW/m2K.
Consequently, the term (1/hl) on the right hand sideof Eq. (7) is negligible since the measurementvalue ofthe overall coefficient, about 100W/m2K,is relatively
small compared with the liquid side heat transfercoefficient of 6OO(~7OOOW/m2K. The following equa-tions, therefore, are obtained:
hg~{U~...........
..........(10)
Nu~p~~hgdB/Ag.....
..........(11)
Figure 11 showsthe relation betweenthe experimentalvalues of Nu~pand Pe/(1 + 1(:). In this experiment, Pewaschanged, using nozzles of 2and 5mmin diameter.
Under the present experimental conditions, the non-dimensional time Tp takes a value of 50-200 duringthe bubble formation process and 200-700 until thebubble reaches the location of 30mmabove the nozzle.
As Eq. (6) converges at a Tp of about O, l, the measuredvalue of Nu~pshould be comparedwith the calculatedvalue for T.H,oo. The solution of Eq. (6) is 17.66 for
TpH,co, and 6.58 for TpH*0.10)
Theexperimental values are well correlated in Fig. I land are higher than the theoretical solution of Kronigand Brink at Pe/(1 +1()~oo and ~pH•QO.The reason forthis maybe that the bubbles are deformed from spheresand that the inertia of the gas jet from the nozzle exit
remains in the bubbles.
The following expression, drawnby a solid line in Fig.
l I , wasproposed to estimate the Nusselt numberbetweenbubbles and liquid:
0.7Nu~p= I . I[Pe/(1 + 1(:)].................
(12)
3.6. Bubble Rising Characteristics
The effects of heat transfer between bubbles andliquid upon bubble rising characteristics such as gasholdup, bubble frequency and mean bubble rising
velocity, were examined, comparing the results for thefollowing three experimental conditions:
32 (1992), No. 7
l) Cold gas injection.
2) Ambient temperature gas injection which has the
same volumetric gas flow rate as the cold gasinjection.
3) Ambient temperature gas injection which has the
samemassflow rate as the cold gas injection.
Figure 12 shows the axial distribution of gas holdupoc*1 on the center line. The experimental conditions areshownin the figure. In the region near the nozzle, theoc.1 value for the bubbling jets with cold gas injection fell
between those of the two kinds of ambient temperaturegas injections. But in the region above z=50mm,thebubbling jet with cold gas injection behaves in the sameway as the bubbling jets with ambient temperatureinjection at the samemassfiow rate.
Figure 13 shows the radial distributions of bubble
80
~~
ts
50
40
30
20
10
o
DAo
Fig. 13.
GasAmbientCoIdAmbient
O* (c~/s ) ' z= 30mrl[]_+~ d~ = 2~]m41' 4
Ai r
6//' cl~\~ [1>
...'~ I ~~.
'l "~~'~,'.~ , ~ ***
C5/A' +'
"'/ ! '~..
~./L_~\ '\'b
,,'l/C] D\L~
"'/\~O~
//'
\'\
L/"'C] Ck~\A)~f.V \~~-
,~\.~itll
60
40
20
o
Cl,
~.
20 O IO 2010
r(mm)
Radial distributions of bubble frequency fB and gasholdup a at z=30mm.
1oo
50
~~
- Io
ts
1
100
'o
8~~
~C1 O IO 20 30
~C]~C] Q ~L QQCI
Gas Q. (c~/s)C] [] CD
[] Amblent 41 4A Cold 41. 4O Amblent TT.8
d~= 2mmAi r
O 50 1OO 150
Z (mm)
Fig. 12. Axial distributions of gas holdup e(*1'
C 1992 iSIJ 870
~~
t$
15
10
5
o
Gas o' (c~/s)z= 80mm
c] Ambient 41'4A .
,o ' o d' =2mm
o Am lent 77.8
f
!2~:~l~~T-lLC]]~oJ,~J~~~
.,,
Ai r
j~f/ \~,,
.
LI>[h)LA4C]
' ' \' \'q '\A'/~;~(Do'//
~
i '
Cl~\.\
=~p. ::g
40
Fig. 14.
..~rA,_ ~o\,~p"cr -~!\~)
o/ ~/ \L,~,,' / ,
~\\~~
[]'\'A
~cl'.41 l \9. Acl"\
'~i:. 4 c] ' ~:' '\[]
_/ ~~
20
15 -(1)
\10
5
o
20 O 4020
r(mm)
Radial distributions of bubble frequency fB and gasholdup e( at z=80mm.

ISIJ International, Vol. 32 (1992), No. 7
l. O
Aird~= 2mm
~~~fz= 80~m
o o o~~ ~~>
z=30mm
GasD Ambient~~ A A oldO Ambient
1. o
o. 5
v'
\~l:'
(1'
\~I~ O. 5:; ~s
^
~OO* (c~/s)
5
\
e)
\c;'
~( 1J:)
41. 4O. 5
41. 477. 8
O40 20 O 20 40
r(mm)Fig. 15. Radial distributions of meanbubble rising velocity
aB at z=30mmand z=80mm.
C:l
Ao
GasAmbient
Ambient
O. (o~/s)41. 477' 8
JL]
olALll
Ai rlguchi et al.
~~
~
1Oo
50
10
5
A~I AoF~~{D~\A~~C] ~Iguchl et al.
AI r
o\JL~~l
~Gas O.(c~/s) dl)lL
D Ambient 41.4 (~~C~LA odO Ambient 77. 8 []
O. 5 1 5 1O(zlzo )2~
Fig. 16. Comparison between previously obtained data ofgas holdup c(.] and those of present work.
frequency fB and gas holdup oc at z=30mm.Bothmeasured values of fB and oc for cold gas injectionbecamelarger than those for the two kinds of ambienttemperature injection in the outer part of the bubblingjet. This fact suggested that bubbles tended to spread inthe radial direction rather than upward. Thereason mustbe left for a future study.
Figure 14 shows the radial distributions of bubblefrequency fB and gas holdup c( at z=80mm.Thedistributions for both bubble frequency fB and gasholdup ce are similar to those at z=30mm.This fact
implies that the effect of the radial motion of bubblesremains in the region far from the nozzle.
Figure 15 showsthe radial distributions of the bubblerising velocity aB at z=30mmand z=80mm.A fewdifferences between the three types of gas injection canbe seen in either case.
3.7. Comparisonof the Present GasHoldup Data withPrevious Research
The experimental results of gas holdup were com-pared with those obtained previously. Figure 16 showsthe relation between the axial distribution of gas holdupoc*1 and (z/zo)2~, where zo and n are the function of themodified Froude numberFr~.12)
O. 1O. 2 O. 5 1 5 10
(zlzo )"
Fig. 17. Comparison between previously obtained data ofhalf-value radius of gas holdup b* and those ofpresent work.
z0=5d~Fr~•3 .....,....(13)
n=0.0338 IogloFr~+0.505....
..........(14)
Fr~=pgQ2,. /pl9d~5......g '~
"""""(15)
where pg : density of gaspl: density of liquid.
For calculation of the modified Froude number, thedensity and velocity of the gas were evaluated under thecondition of no heat transfer. The solid line representsthe equation derived previously by the present authorsand is applicable in the region of cc.1 ~50-100/0. Thedata from the present work fall on the scattering bandinherent in the equation.
Figure 17 shoivs the relation between the value of thehalf-value radius of gas holdup b. divided by (Q~/9)1/5
and (z/zo)"' The data for ambient temperature injection
agree with the equation obtained previously, but thedata for cold gas injection are slightly higher than theequation. In other words, a cold gas injection bubbletends to spread in the radial direction due to expansioncaused by heat transfer.
4. Summaryand Conclusions
Air or helium gas cooled to - 110'C wasblown into
water in a cylindrical vessel. Theheat transfer coefficientbetween bubbles and liquid, bubble formation, andbubble characteristics were examined. The results canbe summarizedas follows.
(1) The heat transfer between bubbles and liquid
wasalmost fully completed at a location just above thenozzle.
(2) The coefficient of heat transmission U~ underthe conditions of the present research was aboutlOOW/m2K. The heat transmission was governed bythe heat transfer between the gas inside the bubble andthe liquid. The meanNusselt number of the bubblestakes a larger value than the theoretical solution ofKronig and Brink. Finally, Eq. (12) was proposed for
871 C 1992 ISIJ

ISIJ International, Vol. 32
the meanNusselt number.(3) For cold gas injection, in the region near the
nozzle, the gas holdup oe*1 fell between the measuredvalues of the two ambient temperature gas injections asshownin Fig. 12. However, in the region far from thenozzle bubbling jet behaved in the sameway as thebubbling jet with ambient temperature injection at the
samemassflow rate.(4) Bubbles tended to spread in the radial direction
rather than upward. Bubble frequency fB and gasholdup oc for a cold gas injection becamerelatively large
comparedwith two types of ambient gas injections in
the outer part of the jet as shownin Figs. 14 and 15.
REFERENCESl) K. Mori and M. Sano: Tetsu-to-Hagan~, 67 (1981), 672.2) M. Sano, H. Makino, Y. Ozawaand K. Mori: Trans. Iron Steel
3)
4)
5)
6)
7)
8)
9)
lO)
ll)
12)
(1992). No. 7
Inst. Jpn., 26 (1986), 298.
M. Kawakami,T. Tomimotoand K. Ito: Tetsu-to-Hagan~, 68(1982), 774.
S. Taniguchi, A. Kikuchi, H. Matsuzaki and N. Bessho: Trans.lron Steel Inst. Jpn., 28 (1988), 262.
S. Whitaker: AIChEJ., 18 (1972), 361.
M, Iguchi, Z. Morita, T. Uemuraand J. Tani: Proc. 5th Symp.Flow Measurement.Osaka, (1989), 162.
M. E. Weber: Ind. Eng. Chem.Fundam., 14 (1975), 365.R. Kronig and J. C. Brink: Appl. Sci. Res. Sect.. A2 (1950), 142.
R. Clift, J. R. Grace and M. E. Weber: Bubbles, Drops andParticles, AcademicPress, NewYork, (1978), 46.
Handbookof Heat Transfer, 4th ed. Jpn, Soc. Mech. Eng.,(1986).
K. Hijikata, Y. Mori and S. Kawaguchi: Trans. JSME,51-461 B(1985), 152.
M. Iguchi, H. Kawabata,T. Iwasaki, K. Nozawaand Z. Morita:Tetsu-to-Hagan~, 76 (1990), 840.
(Originally published in Tetsu-to-Hagan~, 78 (1992), 41 5, in Japanese)
C 1992 ISIJ 872