Embed Size (px)
Citation preview
Final Environmental Impact Statement/Final Environment Impact Report
8.0 – Financial Analysis and Comparison of Alternatives
C R E N S H A W / L A X T R A N S I T C O R R I D O R P R O J E C T August 2011
CHAPTER 8
Financial Analysis and Comparison of Alternatives
C R E N S H A W / L A X T R A N S I T C O R R I D O R P R O J E C T August 2011
Final Environmental Impact Statement/Final Environmental Impact Report 8.0 – Financial Analysis and Comparison of Alternatives
THIS PAGE INTENTIONALLY BLANK

Final Environmental Impact Statement/Final Environment Impact Report
8.0 – Financial Analysis and Comparison of Alternatives
C R E N S H A W / L A X T R A N S I T C O R R I D O R P R O J E C T August 2011 Page 8-1
8.0 FINANCIAL ANALYSIS AND COMPARISON OF ALTERNATIVES
This chapter presents the financial analysis and comparison of alternatives conducted for the Crenshaw/Los Angeles International Airport (LAX) Transit Corridor Project alternatives.
Chapter 2.0, Alternatives Considered, presents the alternatives evaluated in this Final Environmental Impact Statement/Final Environmental Impact Report (FEIS/FEIR). The alternatives include a No-Build Alternative and the Locally Preferred Alternative (LPA). The LPA has five design options and two minimum operable segment (MOS) alternatives. Chapters 3.0, Transportation Impacts, Chapter 4.0, Affected Environment/Environmental Consequences of the Alignment and Stations, and Chapter 5.0, Affected Environment/Environmental Consequences of the Maintenance Facility, describe in detail the effects of the alternatives on the environment. The Executive Summary provides a summary of these environmental effects.
8.1 Financial Analysis
The financial analysis performed for the project describes Metro’s capacity to finance the estimated capital and operating and maintenance (O&M) costs of the LPA and design options. Capital costs are the construction and start-up costs for the project, including the costs of guideway construction, vehicles, and any system facilities necessary before the project can begin operation. O&M costs are the costs associated with the regular operation of the new transportation facility and vehicles. Costs for labor, vehicle maintenance, and overall facility maintenance are all included in this category of operating and maintenance costs.
This section discusses both types of costs, presents the proposed capital and O&M financing plans, and then identifies Metro’s ability to finance the proposed project using anticipated sources of revenues. The cost and revenues presented in this chapter reflect an update to the costs and revenues presented in the Draft Environmental Impact Statement/Draft Environmental Impact Report (DEIS/DEIR). This analysis will assist the Federal Transit Administration (FTA), Metro, city officials, and the general public in understanding and evaluating Metro’s financial capacity to construct the Crenshaw/LAX Transit Corridor Project LPA and to operate and maintain the existing transit system.
8.1.1 Capital Costs
This section presents the capital cost estimates for the LPA and design options. The No-Build Alternative does not have any associated capital costs for comparative purposes as they are considered in the overall financial capability of Metro.
The capital cost estimates were developed using FTA guidelines for estimating capital costs by Standard Cost Category (SCC). The SCC estimate summarizes the capital cost of the components of the project by cost category, such as guideway, stations, support facilities, site work and special conditions, systems, right-of-way, and vehicles. The estimates also include costs for professional services and unallocated contingency. The capital costs are expressed in 2010 dollars and are based on the cost methodology presented in the In-Progress Capital

C R E N S H A W / L A X T R A N S I T C O R R I D O R P R O J E C T August 2011
Final Environmental Impact Statement/Final Environmental Impact Report 8.0 – Financial Analysis and Comparison of Alternatives
Page 8-2
Cost Estimate and Preliminary Engineering drawing set completed in April 2011. Labor, materials and equipments costs are based on current market prices in the project area.
In addition to base year costs, year-of-expenditure (YOE) cost estimates were developed for the financial analysis of the project. The YOE capital cost estimates are based on the project implementation schedule and escalation rates established by Metro for its Long Range Transportation Plan (LRTP). The expenditures are planned to occur between 2011 and 2020. Most of the major expenditures for construction of the major components of the project are expected to occur between 2013 and 2018. As the project schedule is developed further through the remainder of Preliminary Engineering, cash flow and YOE dollars will be updated.
Table 8-1 presents the estimated capital cost (in thousands of 2010 dollars) by SCC, total capital cost, and YOE capital costs for the revised LPA, which includes an extended below-grade section between Exposition Boulevard and 48th Street. The revised LPA is estimated to cost a total of $1.589 billion in 2010 dollars. The YOE capital costs are estimated to total $1.810 billion.
Table 8-1. Capital Cost Estimates Refined LPA (with Incorporated Design Options to the Project Definition)
(Thousands 2010 Dollars)
SCC Code Cost Categories 2010 Base Year
Cost YOE Costs
10 Guideway and Track Elements $424,280 $487,608
20 Stations, Stops, Terminals, Intermodal $128,337 $150,736
30 Support Facilities: Yards, Shops, Administrative Buildings $65,732 $75,255
40 Sitework and Special Conditions $242,392 $276,913
50 Systems $111,013 $133,414
Subtotal Construction (10-50) $971,754 $1,123,926
60 Right-of-Way, Land, Existing Improvements $133,913 $145,321
70 Vehicles $87,780 $87,780
80 Professional Services $255,982 $293,754
90 Unallocated Contingency $115,525 $135,318
Metro Planning/Environmental Costs $24,200 $24,200
Total Cost $1,589,154 $1,810,299
Note-Project costs include the incorporation of the Partially-Covered LAX Trench Option. Source: Hatch Mott McDonald, 2011.
Table 8-2 presents the estimate capital costs (in thousands of 2010 dollars and year of expenditure dollars) for each of the design options and MOSs. The cost estimates for the design options providing for the additional stations range from $9.42 million, or $11.58 million in YOE dollars, for the at-grade optional Aviation/Manchester Station to $106.31 million, or $130.74 million in YOE dollars, for the optional Crenshaw/Vernon Station. The cut-and-cover crossing at Centinela is estimated to cost $20.6 million, or $25.33 million in YOE dollars. The Partially-Covered LAX Trench Option would result in a cost savings of $41 million or $46.4 million in YOE. (Since consultation with FAA suggests that the

Final Environmental Impact Statement/Final Environment Impact Report
8.0 – Financial Analysis and Comparison of Alternatives
C R E N S H A W / L A X T R A N S I T C O R R I D O R P R O J E C T August 2011 Page 8-3
Table 8-2. Capital Cost Estimates for Design Options and MOSs (Thousands 2010 Dollars)
Design Options and MOSs Change in Cost
over LPA Change in YOE Cost over LPA
Optional Crenshaw/Vernon Station +$106,306 +$130,742
Optional Aviation/Manchester Station (Aerial) +$66,500 +$81,786
Optional Aviation/Manchester Station (At-grade) +$9,416 +$11,581
Cut-and-Cover Crossing at Centinela +$20,599 +$25,334
Partially-Covered LAX Trench Option -$40,964 -$46,463
MOS-Century with Southern Terminus at Aviation/Century Station -$122,850 -$140,230
MOS-King with Northern Terminus at Crenshaw/King Station -$257.52 -$293,960
Source: Hatch Mott McDonald, 2011.
Partially-Covered LAX Trench Option is potentially acceptable for the initial temporary period, these savings will be accounted for in the costs of the Project Definition).
The MOSs would reduce capital costs because of the shorter alignment over the LPA. MOS-Century, with the southern terminus at the Aviation/Century Station, would reduce the base year capital cost by $122.85 million, or $140.23 million in YOE dollars. MOS-King, with the northern terminus at the Crenshaw/ King Station, would reduce the base year capital cost by $257.52 million, or $293.96 million in YOE dollars. No cost estimate was developed for the alternative southwest portal at the Crenshaw/King Station and would only be implemented with private funding or dedication of property or permanent construction easement by the adjacent property owner. Implementation of the alternative portal location could result in a potential savings to the project.
The capital cost estimates developed for the project have incorporated a number of value engineering changes designed to reduce the estimated cost of the project. Value engineering is defined as an organized effort to analyze the various functions of the project (i.e., facilities, systems, equipment) by a multi-disciplined group for the purpose of achieving the required function at the lowest total cost. The changes incorporated into the Preliminary Engineering drawing set include:
Alignment revisions and reduced right-of-way acquisitions along the Harbor Subdivision
La Brea Station shifted from La Brea Avenue to just east of Market Street along Florence Avenue
Aerial alignment modifications at Manchester Avenue
Modification of ventilation system in cut-and-cover segments
Reduced right-of-way acquisitions along Crenshaw Boulevard
Modification of guideway and station configuration at Aviation/Century Station

C R E N S H A W / L A X T R A N S I T C O R R I D O R P R O J E C T August 2011
Final Environmental Impact Statement/Final Environmental Impact Report 8.0 – Financial Analysis and Comparison of Alternatives
Page 8-4
Additional value engineering will continue throughout the preliminary engineering phase in an attempt to further reduce the cost of the project. Certain changes are included in the current capital cost estimates shown in Table 8-1 and include items, such as:
Abandonment of the Burlington Northern Santa Fe (BNSF) freight track with reduced property acquisitions and utility relocations
Incorporating the Partially Covered LAX Trench design option as an interim solution – This involves modifying the fully covered trench along LAX segment between 111th and 104th Streets to partially covered segments immediately adjacent to south runways subject to conclusion of discussions with FAA. The full build-out of a fully covered trench will be deferred to a future date when Metro funding is planned and budgeted to support the additional covered segments.
Table 8-3 shows the total cost of the project accounting for the Partially-Covered LAX Trench Option. This project definition (with the Partially-Covered LAX Trench Option included) and cost will be used in the development of the project financial plan. It is important to note that funding for the maintenance facility at Arbor Vitae/Bellanca is designated to come from several projects, including the Crenshaw/LAX Transit Project. In December 2010, the Metro Board adopted a policy to pursue a Consolidated Development Strategy for the development of maintenance and service facilities. According to the policy, planning for maintenance facilities in southwestern Los Angeles County should account for the fleet requirements of several lines and projects and the costs of the consolidated yard will be allocated according to each project’s need. In this case, the Arbor Vitae/Bellanca site is planned for an initial opening day capacity of 45 LRVs and an ultimate build-out capacity of 82 LRVs. The Crenshaw/LAX Transit Corridor Project accounts for approximately 49 percent of the 2035 capacity and is therefore assigned 49 percent of the cost (including construction and right-of-way) of the maintenance facility. In addition to the Crenshaw/LAX Transit Corridor Project, funding for the remaining share of the maintenance facility will be assigned to the general growth of the existing segments of the Metro Green Line and two other transit extensions – the South Bay Metro Green Line Extension, and the Metro Green Line Extension to LAX. These other projects are primarily funded by the same local sources of funding, primarily the Measure R Sales Tax, so their contributions to the development of the maintenance facility is anticipated to come from Measure R.
Table 8-3. Capital Cost Estimates for Revised LPA, Partially-Covered LAX Trench, and Project Definition
Project Elements Cost (2010 Base Year Dollars) Cost (YOE Dollars)
LPA $1,589,154 $1,810,299
Partially-Covered LAX Trench $(40,964) $ (46,463)
Project Definition (total with included design option)
$1,548,190 $ 1,763,836
Source: Hatch Mott McDonald, 2011.
Final Environmental Impact Statement/Final Environment Impact Report
8.0 – Financial Analysis and Comparison of Alternatives
C R E N S H A W / L A X T R A N S I T C O R R I D O R P R O J E C T August 2011 Page 8-5
8.1.2 Operating and Maintenance Costs
This section summarizes the O&M cost estimates for the Project (LPA with Partially-Covered LAX Trench Option), in comparison to the No-Build Alternative. The O&M costs were estimated using a resource cost build-up model based on the current Metro heavy rail transit (HRT), LRT, Bus Rapid Transit (BRT), and bus operating costs and then converted to YOE dollars for input to the financial plan.
Based on the O&M cost model, it is estimated that the Project (LPA with Partially-Covered LAX Trench Option) in 2030 will cost an additional $51.3 million annually to operate and maintain, compared to the No-Build Alternative. The provision of rail security for the LPA is estimated to cost an additional $10.4 million, resulting in a total annual increase of $61.7 million. The inclusion of the Aviation/Manchester Station and Crenshaw/Vernon Station options would result in a slight increase in the annual O&M cost, as compared to the LPA. The MOSs would reduce the length of the Crenshaw line by approximately 0.5 to 1 mile, which would reduce the annual O&M cost compared to the full length LPA.
8.1.3 Capital Financial Plan
This section summarizes the proposed capital financial plan for the Project including a general description of the proposed funding sources, funds from these sources, identification of any shortfalls, and results of cash flow analysis.
8.1.3.1 Capital Funding Sources The proposed funding sources include the following:
Federal:
► Federal Transportation Infrastructure Finance and Innovation Act (TIFIA) - The TIFIA of 1998 established a Federal credit program for eligible transportation projects of national or regional significance under which the U.S. Department of Transportation (may provide three forms of credit assistance – secured (direct) loans, loan guarantees, and standby lines of credit.
► Section 5309 Bus Discretionary - The Section 5309 Bus and Bus Related Equipment and Facilities program (Bus program) provides capital assistance for new and replacement buses, related equipment, and facilities. It is a discretionary program to supplement formula funding in both urbanized and rural areas. This was allocated in two separate grants. An initial grant supported the alternatives analysis and preliminary design. A second grant, initially intended for Los Angeles World Airports, supports the design of an intermodal transfer facility to serve the airport.
► Congestion Mitigation and Air Quality (CMAQ) - The CMAQ program is a federal formula grant program for use on projects that contribute to attainment of national ambient air quality standards. As part of the 2009 LRTP, Metro has programmed CMAQ funds as a source of capital funding for new rail and bus transit lines including the Metro Expo Line (Phase 1), Crenshaw/LAX Line, Regional Connector, rail system improvements, rail fleet procurement, and for Metro Bus and Metro Rapid Bus projects. CMAQ is also programmed for rail and bus operations and can be used for the first three years of operation of individual new rail and bus projects.
C R E N S H A W / L A X T R A N S I T C O R R I D O R P R O J E C T August 2011
Final Environmental Impact Statement/Final Environmental Impact Report 8.0 – Financial Analysis and Comparison of Alternatives
Page 8-6
► Regional Surface Transportation Program (RSTP) - The RSTP provides capital costs identified in Section 133 of Title 23 of the United States Code for transit projects eligible for assistance under the Federal Transit Act and other transportation enhancement activities
► Section 5339 Alternatives Analysis Program - The Section 5339 Alternatives Analysis Program assists potential sponsors of major capital investments in the evaluation of all reasonable modal and multimodal alternatives and general alignment options to address transportation needs in a defined travel corridor.
Local/State:
► Los Angeles County Transportation Sales Tax, Measure R - Measure R is a half-cent transportation sales tax approved in November 2008 by Los Angeles County voters to meet the transportation needs of Los Angeles County.
► Los Angeles County Proposition A and Proposition C Countywide Transportation Sales Tax - Collection of the tax began on July 1, 2009 for public transit purposes (rail expansion, local street improvements, traffic reduction, better public transportation, and quality of life) for a period of 30 years.
► Los Angeles County local cities and county contributions - To assist in funding the Measure R program of projects, Metro has proposed for consideration that local jurisdictions provide a three percent local match for projects. Metro is working with cities, the County of Los Angeles, the Metro Technical Advisory Committee, and sub-regional entities on an appropriate policy to support this. Issues currently being addressed include timing, clarification as to what constitutes a local match, definition of how to determine proportional share, and discussion of whether the three percent match changes if there is an increase or decrease in total project cost.
► State Proposition 1B Public Transportation Modernization, Improvement, and Service Enhancement Account (PTMISEA) - Approved by California voters statewide in 2007, Proposition 1B PTMISEA funds are distributed by formula to transit operators and regional agencies for use in rehabilitation, safety or modernization improvements, capital service enhancements or expansions, new capital projects, bus rapid transit improvements, or for rolling stock procurement, rehabilitation or replacement.
► State Regional Improvement Program (STIP) - RIP funding is programmed in the State Transportation Improvement Program (STIP). Within the STIP, 75 percent of the funding is allocated and programmed by the regional transportation planning agencies such as Metro under the RIP. The remaining 25 percent is programmed by the State under the Interregional Improvement Program. The primary source of RIP funding is the federal Surface Transportation Program (STP).
The Los Angeles County Measure R program would be the primary capital funding source for the project. This is the third half-cent transportation sales tax within the Los Angeles County with the others being Proposition A and Proposition C. Metro is responsible for administering Measure R revenues.
Measure R revenues flow to Metro which then allocates the revenues in accordance with legally binding allocation rules delineated by Los Angeles County Ordinance #08-01, Metro

Final Environmental Impact Statement/Final Environment Impact Report
8.0 – Financial Analysis and Comparison of Alternatives
C R E N S H A W / L A X T R A N S I T C O R R I D O R P R O J E C T August 2011 Page 8-7
Formula Allocation Procedure, and Metro Board actions. Ordinance #08-01 mandates that 65 percent of Measure R revenues are to be allocated to rail or bus transit. Further, Ordinance #08-01 specifies that 35 percent of Measure R revenues must be allocated to the 12 capital expansion projects included in the Long-Range Capital Plan that it delineates. The Crenshaw/LAX Transit Corridor Project is included in these 12 projects.
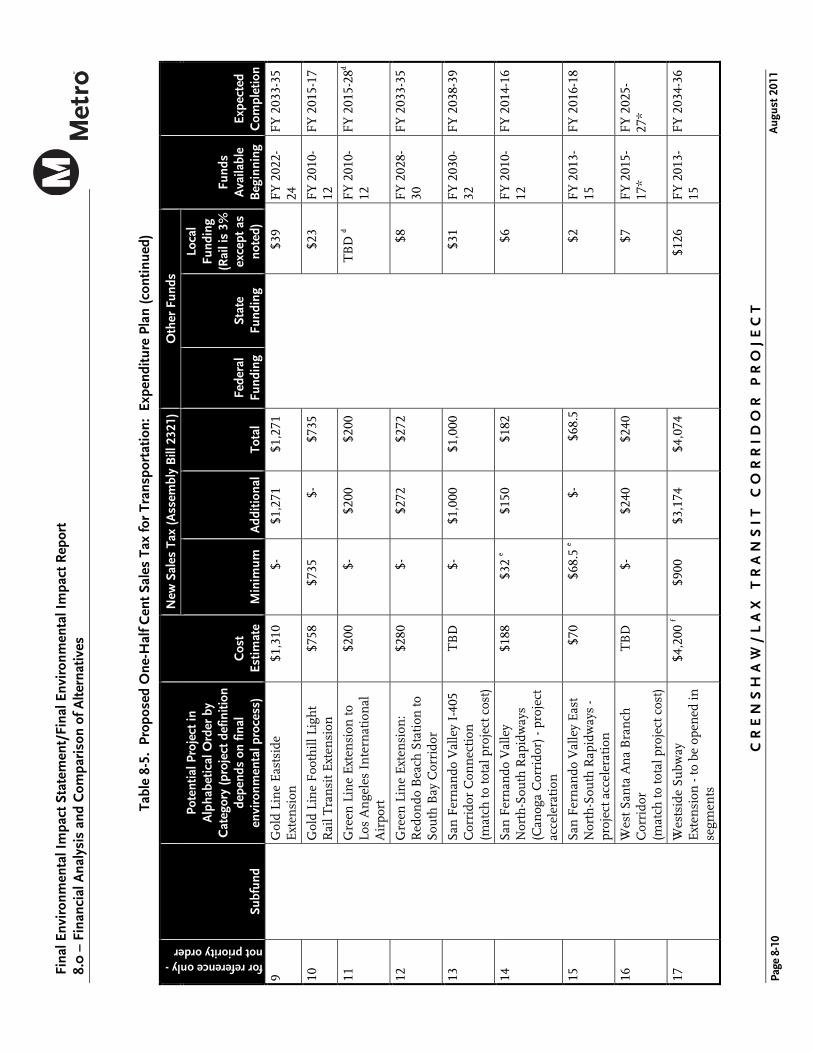
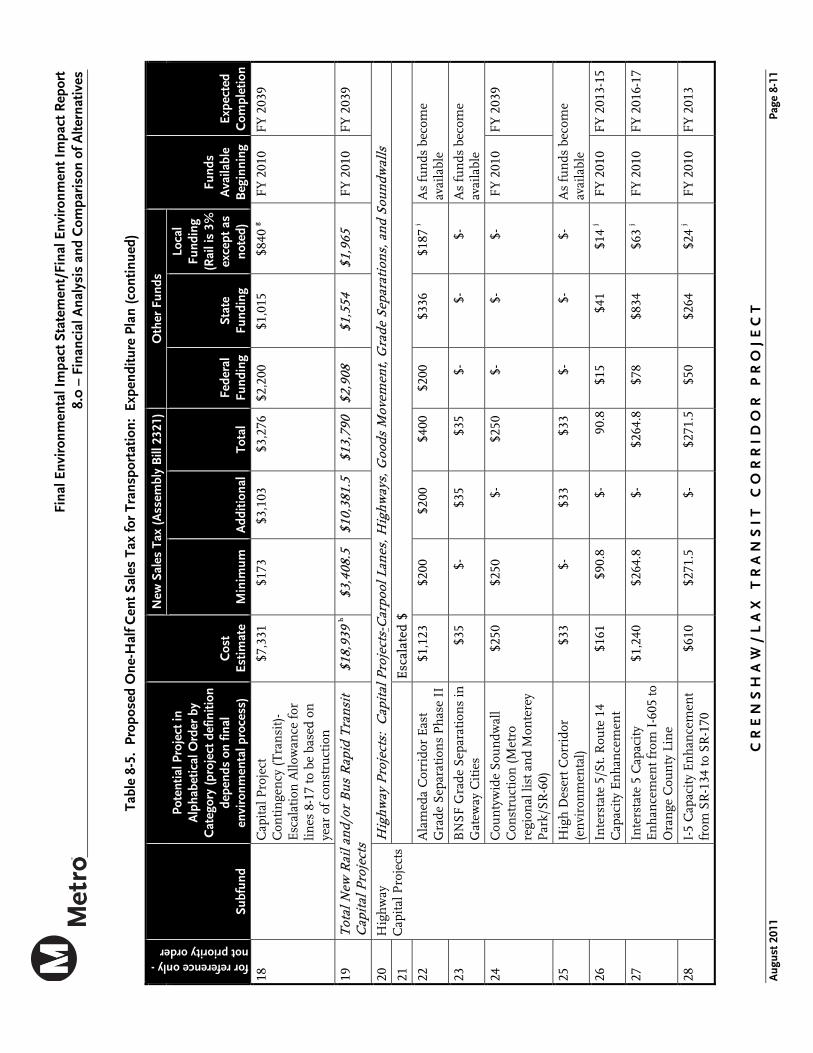
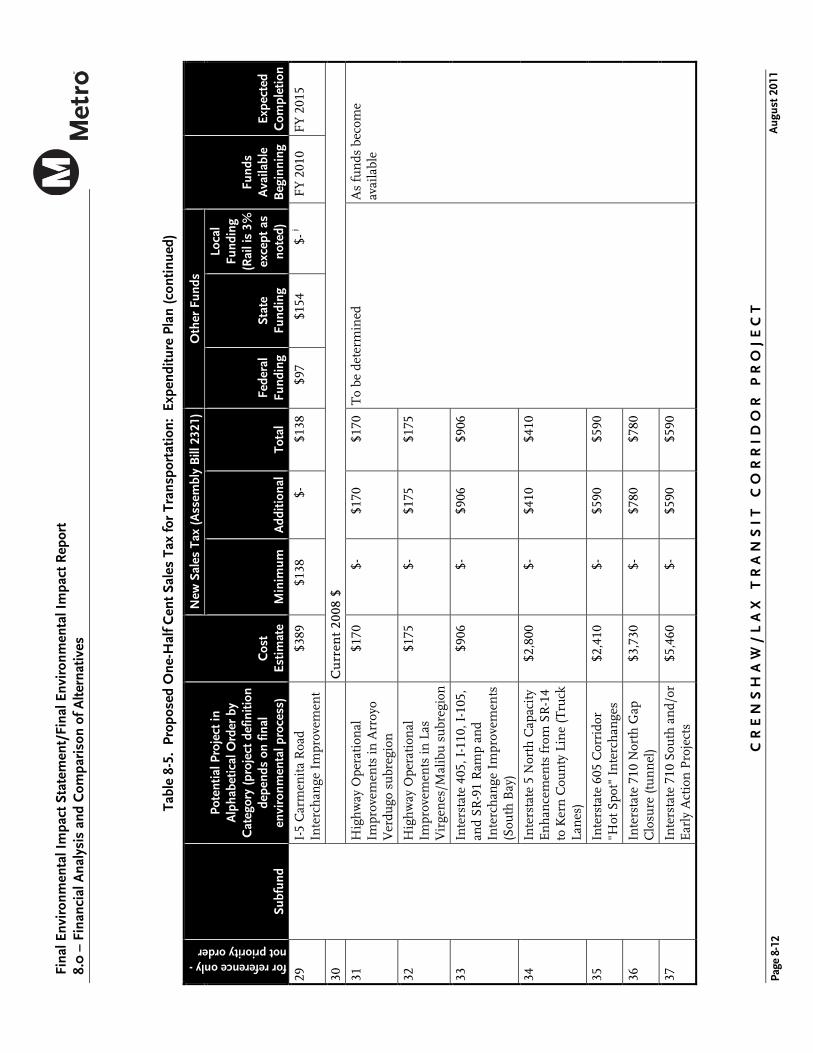
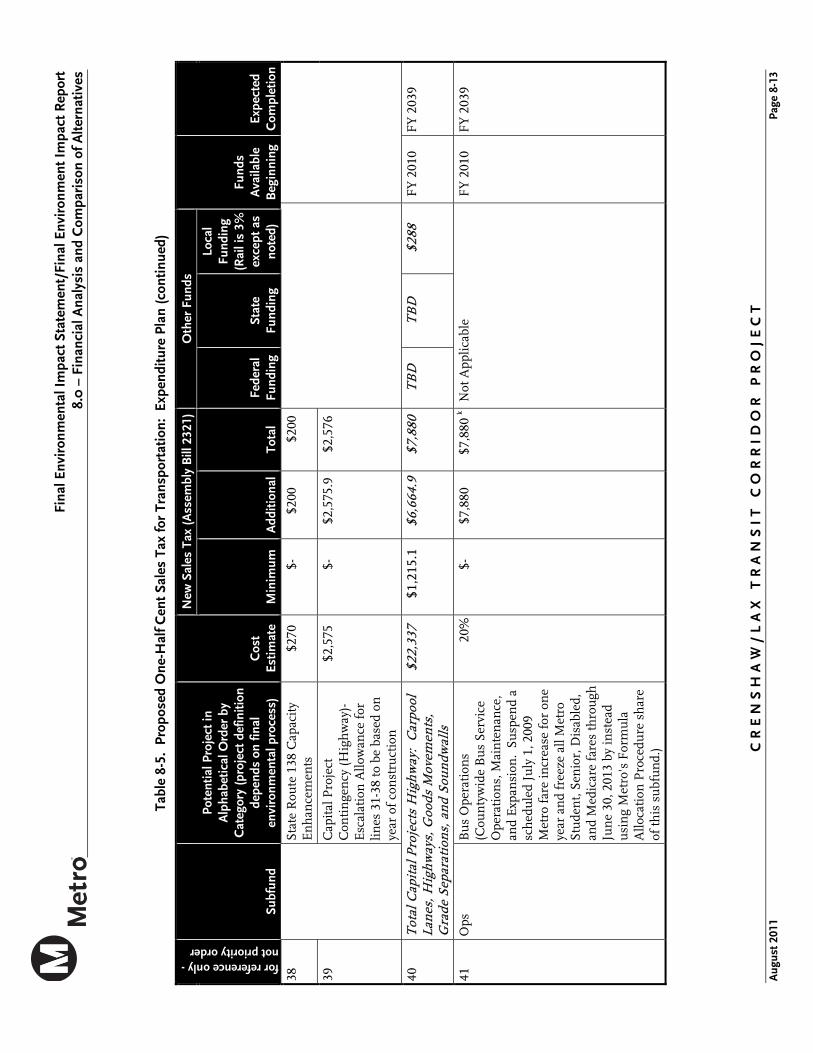
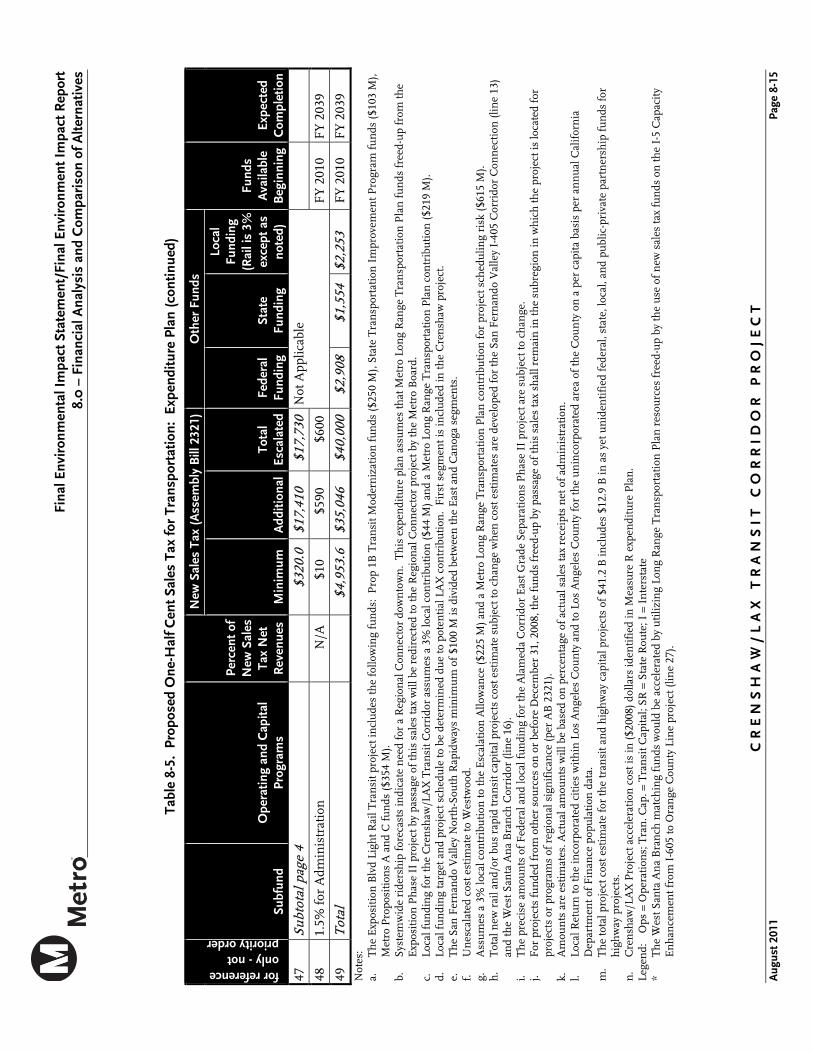
Table 8-4 provides the Outline of the Measure R Expenditure Categories for the 30 years, FY 2010-2039. Table 8-5 provides the details of the Measure R Expenditure Plan for the 30 years, FY 2010-2039, as adopted by the Metro Board of Directors on July 24, 2008.
As originally planned, Measure R was expected to generate a portion of the revenues necessary to fund the Crenshaw/LAX Transit Corridor Project on a pay-as-you-go basis. However, in October 2010 Metro received a TIFIA federal loan to assure the project implementations time frame and potentially accelerate the schedule of the project. The TIFIA loan is to be repaid through Measure R funds.
In addition to sales tax revenues from Measure R and Proposition A and C, the other major funding sources are State Proposition 1B (PTMISEA), and CMAQ funds.

CR
EN
SH
AW
/L
AX
TR
AN
SI
T C
OR
RI
DO
R P
RO
JE
CT
A
ugus
t 201
1
Fina
l Env
iron
men
tal I
mpa
ct S
tate
men
t/Fi
nal E
nvir
onm
enta
l Im
pact
Rep
ort
8.0
– F
inan
cial
Ana
lysi
s an
d C
ompa
riso
n of
Alte
rnat
ives
Page
8-8
Tabl
e 8-
4. P
ropo
sed
One
-Hal
f Cen
t Sal
es T
ax fo
r Tr
ansp
orta
tion
Out
line
of E
xpen
ditu
re C
ateg
orie
s Su
nset
s in
30
Year
s: F
isca
l Yea
r (F
Y) 2
010-
2039
(m
illio
ns)
Subf
und
Prog
ram
%
of S
ales
Tax
(net
of
adm
inis
trat
ion)
Fi
rst Y
ear
Am
ount
10
-Yea
r A
mou
nt
30-Y
ear
Am
ount
Tra
nsi
t Cap
ital
N
ew R
ail a
nd/
or B
us
Rap
id T
ran
sit C
apit
al P
roje
cts
- pro
ject
def
init
ion
de
pen
ds o
n f
inal
en
viro
nm
enta
l rev
iew
pro
cess
35
%
$241
$2
,930
$
13,7
90
Tra
nsi
t Cap
ital
M
etro
link
Cap
ital
Im
prov
emen
t Pro
ject
s w
ith
in L
os A
nge
les
Cou
nty
(O
pera
tion
s, M
ain
ten
ance
, an
d E
xpan
sion
) 3%
$2
1 $2
51
$1,
182
Tra
nsi
t Cap
ital
M
etro
Rai
l Cap
ital
- Sy
stem
Im
prov
emen
ts, R
ail Y
ards
, an
d R
ail C
ars
2%
$14
$167
$
788
Hig
hw
ay C
apit
al
Car
pool
Lan
es, H
igh
way
s, G
oods
Mov
emen
t, G
rade
Sep
arat
ion
s, a
nd
Sou
ndw
alls
20
%
$138
$1
,675
$
7,88
0
Ope
rati
ons
Rai
l Ope
rati
ons
(New
Tra
nsi
t Pro
ject
Ope
rati
ons
and
Mai
nte
nan
ce)
5%
$34
$419
$
1,97
0
Ope
rati
ons
Bu
s O
pera
tion
s (C
oun
tyw
ide
Bu
s Se
rvic
e O
pera
tion
s, M
ain
ten
ance
, an
d E
xpan
sion
. Su
spen
d a
sch
edu
led
July
1, 2
009
Met
ro f
are
incr
ease
for
on
e ye
ar a
nd
free
ze a
ll M
etro
Stu
den
t, Se
nio
r, D
isab
led,
an
d M
edic
are
fare
s th
rou
gh J
un
e 30
, 201
3 by
inst
ead
usi
ng
Met
ro's
For
mu
la A
lloca
tion
P
roce
dure
sh
are
of th
is s
ubf
un
d.)
20%
$1
38
$1,6
75
$7,
880
Loca
l Ret
urn
M
ajor
str
eet r
esu
rfac
ing,
reh
abili
tati
on a
nd
reco
nst
ruct
ion
; pot
hol
e re
pair
; le
ft tu
rn s
ign
als;
bik
eway
s; p
edes
tria
n im
prov
emen
ts; s
tree
tsca
pes;
sig
nal
sy
nch
ron
izat
ion
; an
d tr
ansi
t.
15%
$1
03
$1,2
56
$5,
910
(Loc
al R
etu
rn to
the
Inco
rpor
ated
Cit
ies
wit
hin
Los
An
gele
s C
oun
ty a
nd
to
Los
An
gele
s C
oun
ty f
or th
e U
nin
corp
orat
ed A
rea
of th
e C
oun
ty o
n a
Per
C
apit
a B
asis
.)
TO
TA
L P
RO
GR
AM
S 10
0%
$68
9
$8,3
73
$39,
400
1.5%
for
Adm
inis
trat
ion
$11
$1
27
$600
GR
AN
D T
OT
AL
$
700
$
8,50
0 $
40,0
00

Fina
l Env
iron
men
tal I
mpa
ct S
tate
men
t/Fi
nal E
nvir
onm
ent I
mpa
ct R
epor
t 8.
0 –
Fin
anci
al A
naly
sis
and
Com
pari
son
of A
ltern
ativ
es
CR
EN
SH
AW
/L
AX
TR
AN
SI
T C
OR
RI
DO
R P
RO
JE
CT
A
ugus
t 201
1 Pa
ge 8
-9
Tabl
e 8-
5. P
ropo
sed
One
-Hal
f Cen
t Sal
es T
ax fo
r Tr
ansp
orta
tion:
Exp
endi
ture
Pla
n 30
Yea
rs, F
isca
l Yea
r (F
Y) 2
010
- 203
9
As
Ado
pted
by
the
Los
Ang
eles
Cou
nty
Met
ropo
litan
Tra
nspo
rtat
ion
Aut
hori
ty B
oard
of D
irec
tors
July
24,
200
8 ($
in m
illio
ns)
for reference only - not priority order
Subf
und
Pote
ntia
l Pro
ject
in
Alp
habe
tical
Ord
er b
y C
ateg
ory
(pro
ject
def
initi
on
depe
nds
on fi
nal
envi
ronm
enta
l pro
cess
) C
ost
Estim
ate
New
Sal
es T
ax (A
ssem
bly
Bill
232
1)
Oth
er F
unds
Fund
s A
vaila
ble
Beg
inni
ng
Expe
cted
C
ompl
etio
n M
inim
um
Add
ition
al
Tota
l Fe
dera
l Fu
ndin
g St
ate
Fund
ing
Loca
l Fu
ndin
g (R
ail i
s 3%
exc
ept
as n
oted
)
1 T
ran
sit
Cap
ital
P
roje
cts
Tra
nsi
t P
roje
cts:
New
Rai
l an
d/or
Bus
Rap
id T
ran
sit C
apit
al P
roje
cts.
Cou
ld in
clu
de r
ail i
mpr
ovem
ents
or
excl
usi
ve b
us
rapi
d tr
ansi
t im
prov
emen
ts in
des
ign
ated
cor
rido
rs.
2
Esc
alat
ed $
3 E
asts
ide
Ligh
t Rai
l Acc
ess
(Gol
d Li
ne)
$3
0 $3
0 $-
$3
0 $-
$-
$-
F
Y 2
010
FY
201
3
4 E
xpos
itio
n B
oule
vard
Lig
ht
Rai
l Tra
nsi
t $1
,632
a$9
25
$-
$925
$-
$3
53
$354
F
Y 2
010-
12
FY
201
3-15
5 M
etro
an
d M
un
icip
al
Reg
ion
al C
lean
Fu
el B
us
Cap
ital
Fac
iliti
es a
nd
Rol
ling
Stoc
k (M
etro
's
shar
e to
be
use
d fo
r cl
ean
fu
el b
use
s)
$150
$1
50
$-
$150
$-
$-
$-
F
Y 2
010
FY
203
9
6 R
egio
nal
Con
nec
tor
(lin
ks
loca
l rai
l lin
es)
$1,3
20
$160
$-
$1
60
$708
$1
86
$266
b F
Y 2
014-
16
FY
202
3-25
7
Cu
rren
t 20
08$
8 C
ren
shaw
/LA
X T
ran
sit
Cor
rido
r - p
roje
ct
acce
lera
tion
$1,4
70 n
$235
.5
$971
.5
$1,2
07
To
be d
eter
min
ed
$263
c F
Y 2
010-
12
FY
201
6-18
CR
EN
SH
AW
/L
AX
TR
AN
SI
T C
OR
RI
DO
R P
RO
JE
CT
A
ugus
t 201
1
Fina
l Env
iron
men
tal I
mpa
ct S
tate
men
t/Fi
nal E
nvir
onm
enta
l Im
pact
Rep
ort
8.0
– F
inan
cial
Ana
lysi
s an
d C
ompa
riso
n of
Alte
rnat
ives
Page
8-1
0
Tabl
e 8-
5. P
ropo
sed
One
-Hal
f Cen
t Sal
es T
ax fo
r Tr
ansp
orta
tion:
Exp
endi
ture
Pla
n (c
ontin
ued)
for reference only - not priority order
Subf
und
Pote
ntia
l Pro
ject
in
Alp
habe
tical
Ord
er b
y C
ateg
ory
(pro
ject
def
initi
on
depe
nds
on fi
nal
envi
ronm
enta
l pro
cess
) C
ost
Estim
ate
New
Sal
es T
ax (A
ssem
bly
Bill
232
1)
Oth
er F
unds
Fund
s A
vaila
ble
Beg
inni
ng
Expe
cted
C
ompl
etio
n M
inim
um
Add
ition
al
Tota
l Fe
dera
l Fu
ndin
g St
ate
Fund
ing
Loca
l Fu
ndin
g (R
ail i
s 3%
ex
cept
as
note
d)
9
Gol
d Li
ne
Eas
tsid
e E
xten
sion
$1
,310
$-
$1
,271
$1
,271
$39
F
Y 2
022-
24
FY
203
3-35
10
Gol
d Li
ne
Foo
thill
Lig
ht
Rai
l Tra
nsi
t Ext
ensi
on
$758
$7
35
$-
$735
$2
3 F
Y 2
010-
12
FY
201
5-17
11
Gre
en L
ine
Ext
ensi
on to
Lo
s A
nge
les
Inte
rnat
ion
al
Air
port
$200
$-
$2
00
$200
T
BD
d F
Y 2
010-
12
FY
201
5-28
d
12
Gre
en L
ine
Ext
ensi
on:
Red
ondo
Bea
ch S
tati
on to
So
uth
Bay
Cor
rido
r
$280
$-
$2
72
$272
$8
F
Y 2
028-
30
FY
203
3-35
13
San
Fer
nan
do V
alle
y I-
405
Cor
rido
r C
onn
ecti
on
(mat
ch to
tota
l pro
ject
cos
t)
TB
D
$-
$1,0
00
$1,0
00
$31
FY
203
0-32
F
Y 2
038-
39
14
San
Fer
nan
do V
alle
y N
orth
-Sou
th R
apid
way
s (C
anog
a C
orri
dor)
- pr
ojec
t ac
cele
rati
on
$188
$3
2 e
$150
$1
82
$6
FY
201
0-12
F
Y 2
014-
16
15
San
Fer
nan
do V
alle
y E
ast
Nor
th-S
outh
Rap
idw
ays
- pr
ojec
t acc
eler
atio
n
$70
$68.
5 e
$-
$68.
5 $2
F
Y 2
013-
15
FY
201
6-18
16
Wes
t San
ta A
na
Bra
nch
C
orri
dor
(m
atch
to to
tal p
roje
ct c
ost)
TB
D
$-
$240
$2
40
$7
FY
201
5-17
* F
Y 2
025-
27*
17
Wes
tsid
e Su
bway
E
xten
sion
- to
be
open
ed in
se
gmen
ts
$4,2
00 f
$900
$3
,174
$4
,074
$1
26
FY
201
3-15
F
Y 2
034-
36
Fina
l Env
iron
men
tal I
mpa
ct S
tate
men
t/Fi
nal E
nvir
onm
ent I
mpa
ct R
epor
t 8.
0 –
Fin
anci
al A
naly
sis
and
Com
pari
son
of A
ltern
ativ
es
CR
EN
SH
AW
/L
AX
TR
AN
SI
T C
OR
RI
DO
R P
RO
JE
CT
A
ugus
t 201
1 Pa
ge 8
-11
Tabl
e 8-
5. P
ropo
sed
One
-Hal
f Cen
t Sal
es T
ax fo
r Tr
ansp
orta
tion:
Exp
endi
ture
Pla
n (c
ontin
ued)
for reference only - not priority order
Subf
und
Pote
ntia
l Pro
ject
in
Alp
habe
tical
Ord
er b
y C
ateg
ory
(pro
ject
def
initi
on
depe
nds
on fi
nal
envi
ronm
enta
l pro
cess
) C
ost
Estim
ate
New
Sal
es T
ax (A
ssem
bly
Bill
232
1)
Oth
er F
unds
Fund
s A
vaila
ble
Beg
inni
ng
Expe
cted
C
ompl
etio
n M
inim
um
Add
ition
al
Tota
l Fe
dera
l Fu
ndin
g St
ate
Fund
ing
Loca
l Fu
ndin
g (R
ail i
s 3%
ex
cept
as
note
d)
18
Cap
ital
Pro
ject
C
onti
nge
ncy
(Tra
nsi
t)-
Esc
alat
ion
Allo
wan
ce f
or
lines
8-1
7 to
be
base
d on
ye
ar o
f co
nst
ruct
ion
$7,3
31
$173
$3
,103
$3
,276
$2
,200
$1
,015
$8
40 g
FY
201
0
FY
203
9
19
Tot
al N
ew R
ail a
nd/
or B
us
Rap
id T
ran
sit
Cap
ital
Pro
ject
s $1
8,93
9 h
$3,4
08.5
$1
0,38
1.5
$13,
790
$2,9
08
$1,5
54
$1,9
65
FY
201
0
FY
203
9
20
Hig
hway
C
apit
al P
roje
cts
Hig
hway
Pro
ject
s: C
apit
al P
roje
cts-
Car
pool
Lan
es, H
ighw
ays,
Goo
ds M
ovem
ent,
Gra
de S
epar
atio
ns,
an
d So
un
dwal
ls
21
E
scal
ated
$
22
Ala
med
a C
orri
dor
Eas
t G
rade
Sep
arat
ion
s P
has
e II
$1
,123
$2
00
$200
$4
00
$200
$3
36
$187
i A
s fu
nds
bec
ome
avai
labl
e
23
BN
SF G
rade
Sep
arat
ion
s in
G
atew
ay C
itie
s $3
5 $-
$3
5 $3
5 $-
$-
$-
A
s fu
nds
bec
ome
avai
labl
e
24
Cou
nty
wid
e So
un
dwal
l C
onst
ruct
ion
(Met
ro
regi
onal
list
an
d M
onte
rey
Par
k/SR
-60)
$250
$2
50
$-
$250
$-
$-
$-
F
Y 2
010
F
Y 2
039
25
Hig
h D
eser
t Cor
rido
r (e
nvi
ron
men
tal)
$3
3 $-
$3
3 $3
3 $-
$-
$-
A
s fu
nds
bec
ome
avai
labl
e
26
Inte
rsta
te 5
/St.
Rou
te 1
4 C
apac
ity
En
han
cem
ent
$161
$9
0.8
$-
90.8
$1
5 $4
1 $1
4 j
FY
201
0
FY
201
3-15
27
Inte
rsta
te 5
Cap
acit
y E
nh
ance
men
t fro
m I
-605
to
Ora
nge
Cou
nty
Lin
e
$1,2
40
$264
.8
$-
$264
.8
$78
$834
$6
3 j
FY
201
0
FY
201
6-17
28
I-5
Cap
acit
y E
nh
ance
men
t fr
om S
R-1
34 to
SR
-170
$6
10
$271
.5
$-
$271
.5
$50
$264
$2
4 j
FY
201
0
FY
201
3
CR
EN
SH
AW
/L
AX
TR
AN
SI
T C
OR
RI
DO
R P
RO
JE
CT
A
ugus
t 201
1
Fina
l Env
iron
men
tal I
mpa
ct S
tate
men
t/Fi
nal E
nvir
onm
enta
l Im
pact
Rep
ort
8.0
– F
inan
cial
Ana
lysi
s an
d C
ompa
riso
n of
Alte
rnat
ives
Page
8-1
2
Tabl
e 8-
5. P
ropo
sed
One
-Hal
f Cen
t Sal
es T
ax fo
r Tr
ansp
orta
tion:
Exp
endi
ture
Pla
n (c
ontin
ued)
for reference only - not priority order
Subf
und
Pote
ntia
l Pro
ject
in
Alp
habe
tical
Ord
er b
y C
ateg
ory
(pro
ject
def
initi
on
depe
nds
on fi
nal
envi
ronm
enta
l pro
cess
) C
ost
Estim
ate
New
Sal
es T
ax (A
ssem
bly
Bill
232
1)
Oth
er F
unds
Fund
s A
vaila
ble
Beg
inni
ng
Expe
cted
C
ompl
etio
n M
inim
um
Add
ition
al
Tota
l Fe
dera
l Fu
ndin
g St
ate
Fund
ing
Loca
l Fu
ndin
g (R
ail i
s 3%
ex
cept
as
note
d)
29
I-5
Car
men
ita
Roa
d In
terc
han
ge I
mpr
ovem
ent
$389
$1
38
$-
$138
$9
7 $1
54
$- j
FY
201
0
FY
201
5
30
C
urr
ent
2008
$
31
Hig
hway
Ope
rati
onal
Im
prov
emen
ts in
Arr
oyo
Ver
dugo
su
breg
ion
$170
$-
$1
70
$170
T
o be
det
erm
ined
A
s fu
nds
bec
ome
avai
labl
e
32
Hig
hway
Ope
rati
onal
Im
prov
emen
ts in
Las
V
irge
nes
/Mal
ibu
su
breg
ion
$175
$-
$1
75
$175
33
Inte
rsta
te 4
05, I
-110
, I-1
05,
and
SR-9
1 R
amp
and
Inte
rch
ange
Im
prov
emen
ts
(Sou
th B
ay)
$906
$-
$9
06
$906
34
Inte
rsta
te 5
Nor
th C
apac
ity
En
han
cem
ents
fro
m S
R-1
4 to
Ker
n C
oun
ty L
ine
(Tru
ck
Lan
es)
$2,8
00
$-
$410
$4
10
35
Inte
rsta
te 6
05 C
orri
dor
"Hot
Spo
t" I
nte
rch
ange
s $2
,410
$-
$5
90
$590
36
Inte
rsta
te 7
10 N
orth
Gap
C
losu
re (t
un
nel
) $3
,730
$-
$7
80
$780
37
Inte
rsta
te 7
10 S
outh
an
d/or
E
arly
Act
ion
Pro
ject
s $5
,460
$-
$5
90
$590
Fina
l Env
iron
men
tal I
mpa
ct S
tate
men
t/Fi
nal E
nvir
onm
ent I
mpa
ct R
epor
t 8.
0 –
Fin
anci
al A
naly
sis
and
Com
pari
son
of A
ltern
ativ
es
CR
EN
SH
AW
/L
AX
TR
AN
SI
T C
OR
RI
DO
R P
RO
JE
CT
A
ugus
t 201
1 Pa
ge 8
-13
Tabl
e 8-
5. P
ropo
sed
One
-Hal
f Cen
t Sal
es T
ax fo
r Tr
ansp
orta
tion:
Exp
endi
ture
Pla
n (c
ontin
ued)
for reference only - not priority order
Subf
und
Pote
ntia
l Pro
ject
in
Alp
habe
tical
Ord
er b
y C
ateg
ory
(pro
ject
def
initi
on
depe
nds
on fi
nal
envi
ronm
enta
l pro
cess
) C
ost
Estim
ate
New
Sal
es T
ax (A
ssem
bly
Bill
232
1)
Oth
er F
unds
Fund
s A
vaila
ble
Beg
inni
ng
Expe
cted
C
ompl
etio
n M
inim
um
Add
ition
al
Tota
l Fe
dera
l Fu
ndin
g St
ate
Fund
ing
Loca
l Fu
ndin
g (R
ail i
s 3%
ex
cept
as
note
d)
38
Stat
e R
oute
138
Cap
acit
y E
nh
ance
men
ts
$270
$-
$2
00
$200
39
Cap
ital
Pro
ject
C
onti
nge
ncy
(Hig
hw
ay)-
Esc
alat
ion
Allo
wan
ce f
or
lines
31-
38 to
be
base
d on
ye
ar o
f co
nst
ruct
ion
$2,5
75
$-
$2,5
75.9
$2
,576
40
Tot
al C
apit
al P
roje
cts
Hig
hway
: C
arpo
ol
Lan
es, H
ighw
ays,
Goo
ds M
ovem
ents
, G
rade
Sep
arat
ion
s, a
nd
Sou
ndw
alls
$22,
337
$1,
215.
1 $6
,664
.9$7
,880
T
BD
T
BD
$2
88
FY
201
0
FY
203
9
41
Ops
B
us
Ope
rati
ons
(Cou
nty
wid
e B
us
Serv
ice
Ope
rati
ons,
Mai
nte
nan
ce,
and
Exp
ansi
on.
Susp
end
a sc
hed
uled
Ju
ly 1
, 200
9 M
etro
far
e in
crea
se f
or o
ne
year
an
d fr
eeze
all
Met
ro
Stu
den
t, Se
nio
r, D
isab
led,
an
d M
edic
are
fare
s th
roug
h
Jun
e 30
, 201
3 by
inst
ead
usi
ng
Met
ro's
For
mu
la
Allo
cati
on P
roce
dure
sh
are
of th
is s
ubf
und.
)
20%
$-
$7,8
80
$7,8
80 k
Not
App
licab
le
FY
201
0
FY
203
9

CR
EN
SH
AW
/L
AX
TR
AN
SI
T C
OR
RI
DO
R P
RO
JE
CT
A
ugus
t 201
1
Fina
l Env
iron
men
tal I
mpa
ct S
tate
men
t/Fi
nal E
nvir
onm
enta
l Im
pact
Rep
ort
8.0
– F
inan
cial
Ana
lysi
s an
d C
ompa
riso
n of
Alte
rnat
ives
Page
8-1
4
Tabl
e 8-
5. P
ropo
sed
One
-Hal
f Cen
t Sal
es T
ax fo
r Tr
ansp
orta
tion:
Exp
endi
ture
Pla
n (c
ontin
ued)
for reference only - not priority order
Subf
und
Ope
ratin
g an
d C
apita
l Pr
ogra
ms
Perc
ent o
f N
ew S
ales
Ta
x N
et
Rev
enue
s
New
Sal
es T
ax (A
ssem
bly
Bill
232
1)
Oth
er F
unds
Fund
s A
vaila
ble
Beg
inni
ng
Expe
cted
C
ompl
etio
nM
inim
um
Add
ition
al
Tota
l Es
cala
ted
Fede
ral
Fund
ing
Stat
e Fu
ndin
g
Loca
l Fu
ndin
g (R
ail i
s 3%
ex
cept
as
note
d)
42
Ops
R
ail O
pera
tion
s (N
ew
Tra
nsi
t Pro
ject
Ope
rati
ons
and
Mai
nte
nan
ce)
5%$-
$1
,970
$1
,970
k F
Y 2
010
F
Y 2
039
43
Loca
l Ret
urn
M
ajor
str
eet r
esu
rfac
ing,
re
hab
ilita
tion
an
d re
con
stru
ctio
n; p
oth
ole
repa
ir; l
eft t
urn
sig
nal
s;
bike
way
s; p
edes
tria
n
impr
ovem
ents
; st
reet
scap
es; s
ign
al
syn
chro
niz
atio
n; a
nd
tran
sit.
15%
l$2
50
$5,6
60
$5,9
10 k
FY
201
0
FY
203
9
44
Tra
n. C
ap.
Met
ro R
ail C
apit
al P
roje
cts
- Sys
tem
Im
prov
emen
ts,
Rai
l Yar
ds, a
nd
Rai
l Car
s
2%$-
$7
88
$788
k F
Y 2
010
F
Y 2
039
45
Tra
n. C
ap.
Met
rolin
k C
apit
al
Impr
ovem
ent P
roje
cts
wit
hin
Los
An
gele
s C
oun
ty
(Ope
rati
ons,
Mai
nte
nan
ce,
and
Exp
ansi
on)
3%$7
0 $1
,112
$1
,182
k F
Y 2
010
F
Y 2
039
46
Subt
otal
Tra
nsi
t an
d H
ighw
ay C
apit
al
Pro
ject
s $4
1,27
6 m$4
,623
.6
$17,
046
$21,
670
$2,9
08
$1,5
54
$2,2
53
FY
201
0
FY
203
9
Fina
l Env
iron
men
tal I
mpa
ct S
tate
men
t/Fi
nal E
nvir
onm
ent I
mpa
ct R
epor
t 8.
0 –
Fin
anci
al A
naly
sis
and
Com
pari
son
of A
ltern
ativ
es
CR
EN
SH
AW
/L
AX
TR
AN
SI
T C
OR
RI
DO
R P
RO
JE
CT
A
ugus
t 201
1 Pa
ge 8
-15
Tabl
e 8-
5. P
ropo
sed
One
-Hal
f Cen
t Sal
es T
ax fo
r Tr
ansp
orta
tion:
Exp
endi
ture
Pla
n (c
ontin
ued)
for reference only - not priority order
Subf
und
Ope
ratin
g an
d C
apita
l Pr
ogra
ms
Perc
ent o
f N
ew S
ales
Ta
x N
et
Rev
enue
s
New
Sal
es T
ax (A
ssem
bly
Bill
232
1)
Oth
er F
unds
Fund
s A
vaila
ble
Beg
inni
ng
Expe
cted
C
ompl
etio
nM
inim
um
Add
ition
al
Tota
l Es
cala
ted
Fede
ral
Fund
ing
Stat
e Fu
ndin
g
Loca
l Fu
ndin
g (R
ail i
s 3%
ex
cept
as
note
d)
47
Subt
otal
pag
e 4
$3
20.0
$1
7,41
0 $1
7,73
0 N
ot A
pplic
able
48
1.5%
for
Adm
inis
trat
ion
N
/A
$10
$590
$6
00
FY
201
0
FY
203
9
49
Tot
al
$4
,953
.6
$35,
046
$40,
000
$2,9
08
$1,5
54
$2,2
53
FY
201
0
FY
203
9 N
otes
: a.
T
he
Exp
osit
ion
Blv
d Li
ght R
ail T
ran
sit p
roje
ct in
clu
des
the
follo
win
g fu
nds
: P
rop
1B T
ran
sit M
oder
niz
atio
n f
un
ds ($
250
M),
Stat
e T
ran
spor
tati
on I
mpr
ovem
ent P
rogr
am f
un
ds ($
103
M),
Met
ro P
ropo
siti
ons
A a
nd
C f
un
ds (
$354
M).
b.
Sys
tem
wid
e ri
ders
hip
for
ecas
ts in
dica
te n
eed
for
a R
egio
nal
Con
nec
tor
dow
nto
wn
. T
his
exp
endi
ture
pla
n a
ssu
mes
that
Met
ro L
ong
Ran
ge T
ran
spor
tati
on P
lan
fu
nds
fre
ed-u
p fr
om th
e E
xpos
itio
n P
has
e II
pro
ject
by
pass
age
of th
is s
ales
tax
will
be
redi
rect
ed to
the
Reg
ion
al C
onn
ecto
r pr
ojec
t by
the
Met
ro B
oard
. c.
Lo
cal f
un
din
g fo
r th
e C
ren
shaw
/LA
X T
ran
sit C
orri
dor
assu
mes
a 3
% lo
cal c
ontr
ibu
tion
($4
4 M
) an
d a
Met
ro L
ong
Ran
ge T
ran
spor
tati
on P
lan
con
trib
uti
on ($
219
M).
d.
Loca
l fu
ndi
ng
targ
et a
nd
proj
ect s
ched
ule
to b
e de
term
ined
du
e to
pot
enti
al L
AX
con
trib
uti
on.
Fir
st s
egm
ent i
s in
clu
ded
in th
e C
ren
shaw
pro
ject
. e.
T
he
San
Fer
nan
do V
alle
y N
orth
-Sou
th R
apid
way
s m
inim
um
of
$100
M is
div
ided
bet
wee
n th
e E
ast a
nd
Can
oga
segm
ents
. f.
U
nes
cala
ted
cost
est
imat
e to
Wes
twoo
d.
g.
Ass
um
es a
3%
loca
l con
trib
uti
on to
the
Esc
alat
ion
Allo
wan
ce (
$225
M)
and
a M
etro
Lon
g R
ange
Tra
nsp
orta
tion
Pla
n c
ontr
ibu
tion
for
pro
ject
sch
edu
ling
risk
($61
5 M
). h
. T
otal
new
rai
l an
d/or
bu
s ra
pid
tran
sit c
apit
al p
roje
cts
cost
est
imat
e su
bjec
t to
chan
ge w
hen
cos
t est
imat
es a
re d
evel
oped
for
the
San
Fer
nan
do V
alle
y I-
405
Cor
rido
r C
onn
ecti
on (l
ine
13)
and
the
Wes
t San
ta A
na
Bra
nch
Cor
rido
r (l
ine
16).
i. T
he
prec
ise
amou
nts
of
Fed
eral
an
d lo
cal f
un
din
g fo
r th
e A
lam
eda
Cor
rido
r E
ast G
rade
Sep
arat
ion
s P
has
e II
pro
ject
are
su
bjec
t to
chan
ge.
j. F
or p
roje
cts
fun
ded
from
oth
er s
ourc
es o
n o
r be
fore
Dec
embe
r 31
, 200
8, th
e fu
nds
fre
ed-u
p by
pas
sage
of
this
sal
es ta
x sh
all r
emai
n in
the
subr
egio
n in
wh
ich
the
proj
ect i
s lo
cate
d fo
r pr
ojec
ts o
r pr
ogra
ms
of r
egio
nal
sig
nif
ican
ce (p
er A
B 2
321)
. k.
A
mou
nts
are
est
imat
es. A
ctu
al a
mou
nts
will
be
base
d on
per
cen
tage
of
actu
al s
ales
tax
rece
ipts
net
of
adm
inis
trat
ion
. l.
Loca
l Ret
urn
to th
e in
corp
orat
ed c
itie
s w
ith
in L
os A
nge
les
Cou
nty
an
d to
Los
An
gele
s C
oun
ty f
or th
e u
nin
corp
orat
ed a
rea
of th
e C
oun
ty o
n a
per
cap
ita
basi
s pe
r an
nu
al C
alif
orn
ia
Dep
artm
ent o
f F
inan
ce p
opu
lati
on d
ata.
m
. T
he
tota
l pro
ject
cos
t est
imat
e fo
r th
e tr
ansi
t an
d h
igh
way
cap
ital
pro
ject
s of
$41
.2 B
incl
ude
s $1
2.9
B in
as
yet u
nid
enti
fied
fed
eral
, sta
te, l
ocal
, an
d pu
blic
-pri
vate
par
tner
ship
fu
nds
for
h
igh
way
pro
ject
s.
n.
Cre
nsh
aw/L
AX
Pro
ject
acc
eler
atio
n c
ost i
s in
($20
08) d
olla
rs id
enti
fied
in M
easu
re R
exp
endi
ture
Pla
n.
Lege
nd:
O
ps =
Ope
rati
ons;
Tra
n. C
ap. =
Tra
nsi
t Cap
ital
; SR
= S
tate
Rou
te; I
= I
nte
rsta
te
* T
he
Wes
t San
ta A
na
Bra
nch
mat
chin
g fu
nds
wou
ld b
e ac
cele
rate
d by
uti
lizin
g Lo
ng
Ran
ge T
ran
spor
tati
on P
lan
res
ourc
es f
reed
-up
by th
e u
se o
f n
ew s
ales
tax
fun
ds o
n th
e I-
5 C
apac
ity
En
han
cem
ent f
rom
I-6
05 to
Ora
nge
Cou
nty
Lin
e pr
ojec
t (lin
e 27
).
C R E N S H A W / L A X T R A N S I T C O R R I D O R P R O J E C T August 2011
Final Environmental Impact Statement/Final Environmental Impact Report 8.0 – Financial Analysis and Comparison of Alternatives
Page 8-16
8.1.3.2 Capital Funds by Source Table 8-6 provides a summary of the revenues estimated from each of the identified capital funding sources, and compares the revenues to the YOE cost estimated for the LPA. As identified in the table, Measure R and other capital funding sources are estimated to provide the following revenues in year of expenditure dollars for the Crenshaw/LAX Transit Corridor Project:
$1,207 million from Measure R
$93.4 million from Proposition C
$13.9 million from Proposition A
$51.4 million from local cities/County contribution assumed in Measure R
$201.2 million from State Proposition 1B PTMISEA
$50.2 million from State Regional Improvement Program, STIP
$68.2 million from CMAQ
$20.0 million from RSTP
$8.6 million from FTA Section 5309 Bus Program
$1.2 million from federal earmarked funds in prior years (Section 5339 Alternatives Analysis program)
The above listed sources would provide a total of $1,715 million in capital revenues in YOE dollars. Based on the YOE capital cost estimate of $1,763.8 million for the LPA, and the estimated revenues, a capital shortfall of $48.8 million is estimated for the LPA. This shortfall would need to be addressed by identification of additional funds or by other actions, including the value engineering actions previously described.
8.1.3.3 Identified Capital Funding Shortfalls To address shortfalls with Measure R projects, the Metro Board has adopted a Unified Cost Management Process and Policy for actions to take prior to the project advancing to the next project milestone, which for the Crenshaw/LAX Corridor would be the approval of this FEIS/FEIR and entry into final design. These actions, in order of completion, are:
Value engineering and scope reduction
New local agency funding resources
Shorter segmentation
Other cost reductions within transit corridor
Other cost reductions within the same sub-region
Countywide transit cost reductions
As identified previously, Metro has completed a number of value engineering refinements to the project and will continue to refine the project through completion of the preliminary engineering phase to further reduce the cost of the project.
Final Environmental Impact Statement/Final Environment Impact Report
8.0 – Financial Analysis and Comparison of Alternatives
C R E N S H A W / L A X T R A N S I T C O R R I D O R P R O J E C T Page 8-17 August 2011
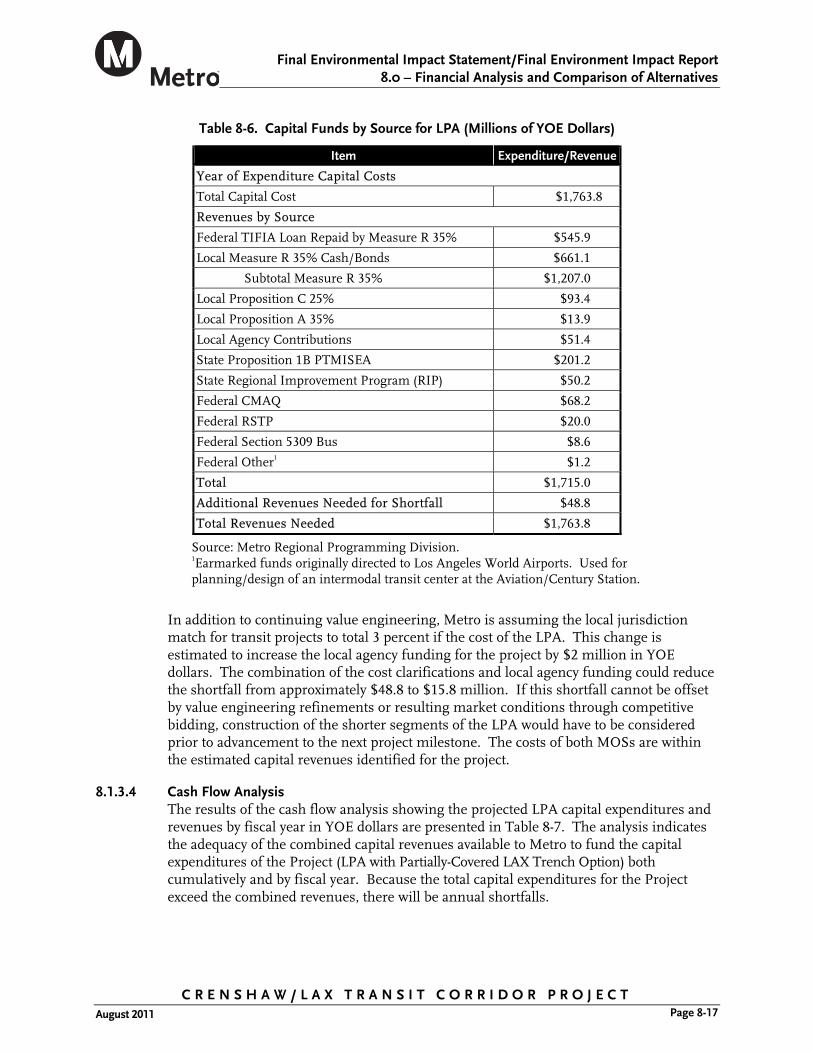
Table 8-6. Capital Funds by Source for LPA (Millions of YOE Dollars)
Item Expenditure/Revenue
Year of Expenditure Capital Costs
Total Capital Cost $1,763.8
Revenues by Source
Federal TIFIA Loan Repaid by Measure R 35% $545.9
Local Measure R 35% Cash/Bonds $661.1
Subtotal Measure R 35% $1,207.0
Local Proposition C 25% $93.4
Local Proposition A 35% $13.9
Local Agency Contributions $51.4
State Proposition 1B PTMISEA $201.2
State Regional Improvement Program (RIP) $50.2
Federal CMAQ $68.2
Federal RSTP $20.0
Federal Section 5309 Bus $8.6
Federal Other1 $1.2
Total $1,715.0
Additional Revenues Needed for Shortfall $48.8
Total Revenues Needed $1,763.8
Source: Metro Regional Programming Division. 1Earmarked funds originally directed to Los Angeles World Airports. Used for planning/design of an intermodal transit center at the Aviation/Century Station.
In addition to continuing value engineering, Metro is assuming the local jurisdiction match for transit projects to total 3 percent if the cost of the LPA. This change is estimated to increase the local agency funding for the project by $2 million in YOE dollars. The combination of the cost clarifications and local agency funding could reduce the shortfall from approximately $48.8 to $15.8 million. If this shortfall cannot be offset by value engineering refinements or resulting market conditions through competitive bidding, construction of the shorter segments of the LPA would have to be considered prior to advancement to the next project milestone. The costs of both MOSs are within the estimated capital revenues identified for the project.
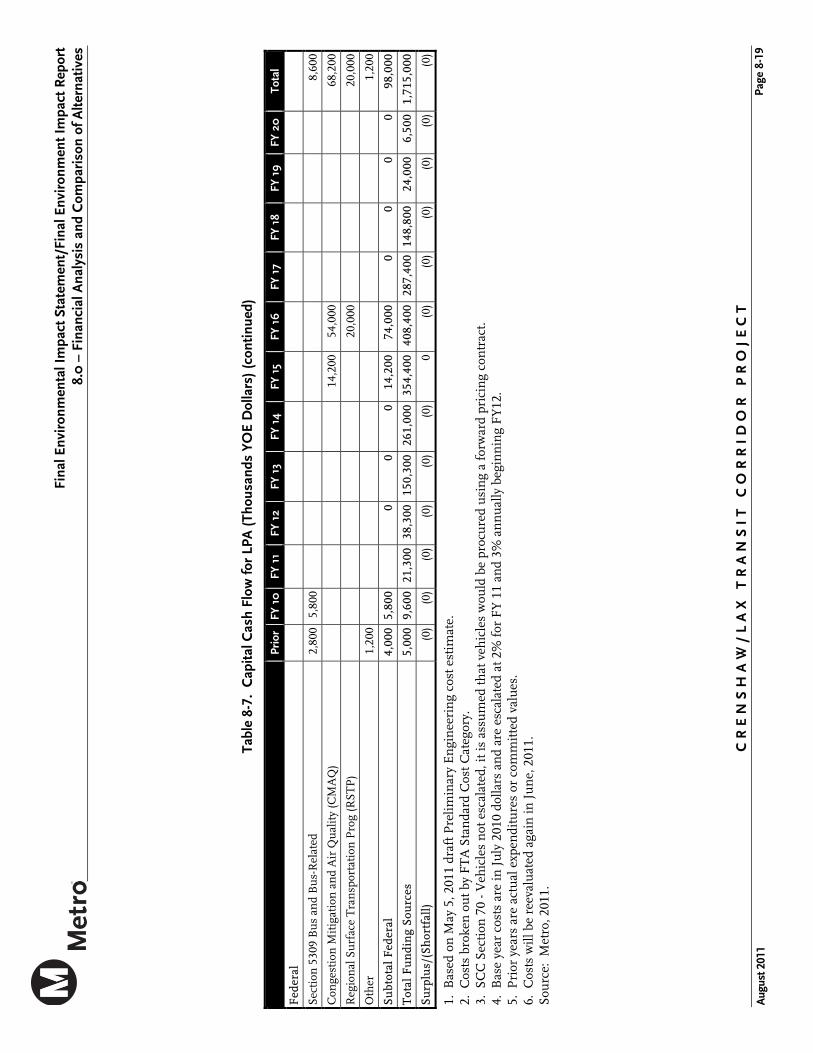
8.1.3.4 Cash Flow Analysis The results of the cash flow analysis showing the projected LPA capital expenditures and revenues by fiscal year in YOE dollars are presented in Table 8-7. The analysis indicates the adequacy of the combined capital revenues available to Metro to fund the capital expenditures of the Project (LPA with Partially-Covered LAX Trench Option) both cumulatively and by fiscal year. Because the total capital expenditures for the Project exceed the combined revenues, there will be annual shortfalls.

CR
EN
SH
AW
/L
AX
TR
AN
SI
T C
OR
RI
DO
R P
RO
JE
CT
A
ugus
t 201
1
Fina
l Env
iron
men
tal I
mpa
ct S
tate
men
t/Fi
nal E
nvir
onm
enta
l Im
pact
Rep
ort
8.0
– F
inan
cial
Ana
lysi
s an
d C
ompa
riso
n of
Alte
rnat
ives
Page
8-1
8
Tabl
e 8-
7. C
apita
l Cas
h Fl
ow fo
r LP
A (T
hous
ands
YO
E D
olla
rs)
Pr
ior
FY 1
0FY
11
FY 1
2 FY
13
FY 1
4 FY
15
FY 1
6 FY
17
FY 1
8 FY
19
FY 2
0
Tota
l
YE
AR
OF
EX
PE
ND
ITU
RE
DO
LLA
RS
10 G
UID
EW
AY
& T
RA
CK
ELE
ME
NT
S -
--
-25
,800
106,
100
145,
700
122,
000
48,3
005,
000
2,60
02,
600
458,
000
20 S
TA
TIO
NS,
ST
OP
S, T
ER
MIN
ALS
, IN
TE
RM
OD
AL
--
--
-6,
500
22,4
0028
,800
32,0
0026
,900
--
116,
500
30 S
UP
PO
RT
FA
CIL
ITIE
S: Y
AR
DS,
SH
OP
S, A
DM
IN. B
LDG
S -
--
--
51
,300
38,4
0014
,800
15,3
00-
-11
9,80
0
40 S
ITE
WO
RK
& S
PE
CIA
L C
ON
DIT
ION
S -
--
2,50
020
,500
58,1
00
59,9
0075
,700
43,3
004,
100
3,10
0-
267,
200
50 S
YST
EM
S -
--
--
- 6,
700
43,9
0056
,500
32,0
001,
500
-14
0,60
0
60 R
OW
, LA
ND
, EX
IST
ING
IM
PR
OV
EM
EN
TS
-
--
14,4
0070
,000
43,8
00
--
--
--
128,
300
70 V
EH
ICLE
S (2
0)
--
--
--
-30
,700
39,5
0017
,600
--
87,8
00
80 P
RO
FE
SSIO
NA
L SE
RV
(app
lies
to C
ats.
10-
50)
--
11,7
0018
,900
27,6
0039
,000
44
,300
42,5
0027
,700
25,1
0012
,400
3,80
025
3,00
0
90 U
NA
LLO
CA
TE
D C
ON
TIN
GE
NC
Y
--
200
2,30
06,
400
7,50
0 24
,200
26,5
0025
,200
22,9
004,
500
-11
9,70
0
SUB
TO
TA
L -
-11
,900
38,1
0015
0,30
026
1,00
0 35
4,40
040
8,40
028
7,40
014
8,80
024
,000
6,50
01,
690,
800
PLA
NN
ING
/EN
VIR
ON
ME
NT
AL
5,00
09,
600
9,40
020
0
24,2
00
TO
TA
L P
RO
JEC
T C
OS
TS
5,
000
9,60
021
,300
38,3
0015
0,30
026
1,00
0 35
4,40
040
8,40
028
7,40
014
8,80
024
,000
6,50
01,
715,
000
FU
ND
ING
SO
UR
CE
S (
subj
ect
to c
han
ge)
Loca
l
Pro
posi
tion
A 3
5%
4,80
0
6,70
02,
400
13,9
00
Pro
posi
tion
C 2
5%
457
3,60
02,
200
68,7
0018
,400
93,4
00
TIF
IA L
oan
(Mea
sure
R)
12
5,50
027
2,40
014
7,70
030
054
5,90
0
Mea
sure
R C
ash
3,
800
11,1
0024
6,30
0 27
1,50
010
7,80
015
,000
1,10
04,
500
661,
100
Loca
l Age
ncy
Con
trib
uti
ons
3%
51
,400
51,4
00
Su
btot
al L
ocal
45
73,
,800
19,5
0024
8,50
0 34
0,20
030
3,10
028
7,40
014
8,80
011
,500
2,40
01,
365,
700
Sta
te
Pro
p 1B
PT
MIS
EA
38
,300
150,
300
12,5
00
201,
200
Reg
ion
al I
mpr
ovem
ent P
rogr
am
535
1,80
0
31,3
0012
,500
4,10
050
,200
Su
btot
al S
tate
53
50
1,80
038
,300
150,
300
12,5
00
31,3
000
012
,500
4,10
025
1,40
0
Fina
l Env
iron
men
tal I
mpa
ct S
tate
men
t/Fi
nal E
nvir
onm
ent I
mpa
ct R
epor
t 8.
0 –
Fin
anci
al A
naly
sis
and
Com
pari
son
of A
ltern
ativ
es
CR
EN
SH
AW
/L
AX
TR
AN
SI
T C
OR
RI
DO
R P
RO
JE
CT
Pa
ge 8
-19
Aug
ust 2
011
Tabl
e 8-
7. C
apita
l Cas
h Fl
ow fo
r LP
A (T
hous
ands
YO
E D
olla
rs) (
cont
inue
d)
Pr
ior
FY 1
0FY
11
FY 1
2 FY
13
FY 1
4 FY
15
FY 1
6 FY
17
FY 1
8 FY
19
FY 2
0
Tota
l
Fed
eral
Sect
ion
530
9 B
us
and
Bu
s-R
elat
ed
2,80
05,
800
8,
600
Con
gest
ion
Mit
igat
ion
an
d A
ir Q
ual
ity
(CM
AQ
)
14,2
0054
,000
68,2
00
Reg
ion
al S
urf
ace
Tra
nsp
orta
tion
Pro
g (R
STP
)
20,0
0020
,000
Oth
er
1,20
0
1,20
0
Su
btot
al F
eder
al
4,00
05,
800
00
0 14
,200
74,0
000
00
098
,000
Tot
al F
un
din
g S
ourc
es
5,00
09,
600
21,3
0038
,300
150,
300
261,
000
354,
400
408,
400
287,
400
148,
800
24,0
006,
500
1,71
5,00
0
Su
rplu
s/(S
hor
tfal
l)
(0)
(0)
(0)
(0)
(0)
(0)
0(0
)(0
)(0
)(0
)(0
)(0
)
1. B
ased
on
May
5, 2
011
draf
t Pre
limin
ary
En
gin
eeri
ng
cost
est
imat
e.
2. C
osts
bro
ken
ou
t by
FT
A S
tan
dard
Cos
t Cat
egor
y.
3. S
CC
Sec
tion
70
- Veh
icle
s n
ot e
scal
ated
, it i
s as
sum
ed th
at v
ehic
les
wou
ld b
e pr
ocu
red
usi
ng
a fo
rwar
d pr
icin
g co
ntr
act.
4. B
ase
year
cos
ts a
re in
Jul
y 20
10 d
olla
rs a
nd
are
esca
late
d at
2%
for
FY
11
and
3% a
nn
ual
ly b
egin
nin
g F
Y12
. 5.
Pri
or y
ears
are
act
ual
exp
endi
ture
s or
com
mit
ted
valu
es.
6. C
osts
will
be
reev
alu
ated
aga
in in
Ju
ne,
201
1.
Sou
rce:
Met
ro, 2
011.

C R E N S H A W / L A X T R A N S I T C O R R I D O R P R O J E C T August 2011
Final Environmental Impact Statement/Final Environmental Impact Report 8.0 – Financial Analysis and Comparison of Alternatives
Page 8-20
8.1.4 Operations and Maintenance Finance Plan
This section summarizes the proposed O&M financial plan for the LPA including a general description of the proposed funding sources, funds from these sources, and cash flow analysis.
The proposed Metro LRTP provides sufficient funding through the existing local sources (Prop A/Prop C) and additional Measure R revenues to fund the operating and maintenance costs of any of the LPA and design options assuming revenue service operation in 2018. Table 8-8 shows a summary of sources and uses of funds for the operations and maintenance of the Crenshaw/LAX Transit Corridor. All O&M costs are covered by projected revenues. Furthermore, there is sufficient capacity within projected revenue sources to support the operation of Metro’s full program of transit services as identified in Measure R and the LRTP. Table 8-9 shows a summary of sources and uses of funds for the operation of Metro’s rail system. This analysis demonstrates the ability for Metro to not only construct the identified projects in the LRTP, but to operate and maintain them through 2040.
8.1.5 Cost Risks and Uncertainties
As with any large infrastructure project in its planning stages, the LPA includes several sources of risks and uncertainties that could potentially affect the capital and operating cost and revenue assumptions.
From a capital cost perspective, they include inflationary risks, the construction schedule, scope, and the cost and schedule of the other Metro projects. On the revenue side, major risks include Measure R revenue shortfalls, the inability to obtain necessary financing, and the availability and timing of funds.
Key areas of risk from an O&M cost perspective are related to cost escalation for labor or fuel and real increases in unit O&M costs for the project or system upon completion. From a revenue perspective, areas of uncertainty include ridership and fare revenue forecasts and sales tax revenues.
8.2 Comparative Analysis of the Alternatives
This section presents the results of the comparative analysis of the LPA and No-Build Alternative across a variety of performance criteria typically used to assess transportation projects. The following criteria were used to compare the performance of the alternatives.
Regional Connectivity
Environmental Effects
Economic Development/Land Use
Community Support
Capital and Operating Costs
Cost-Effectiveness
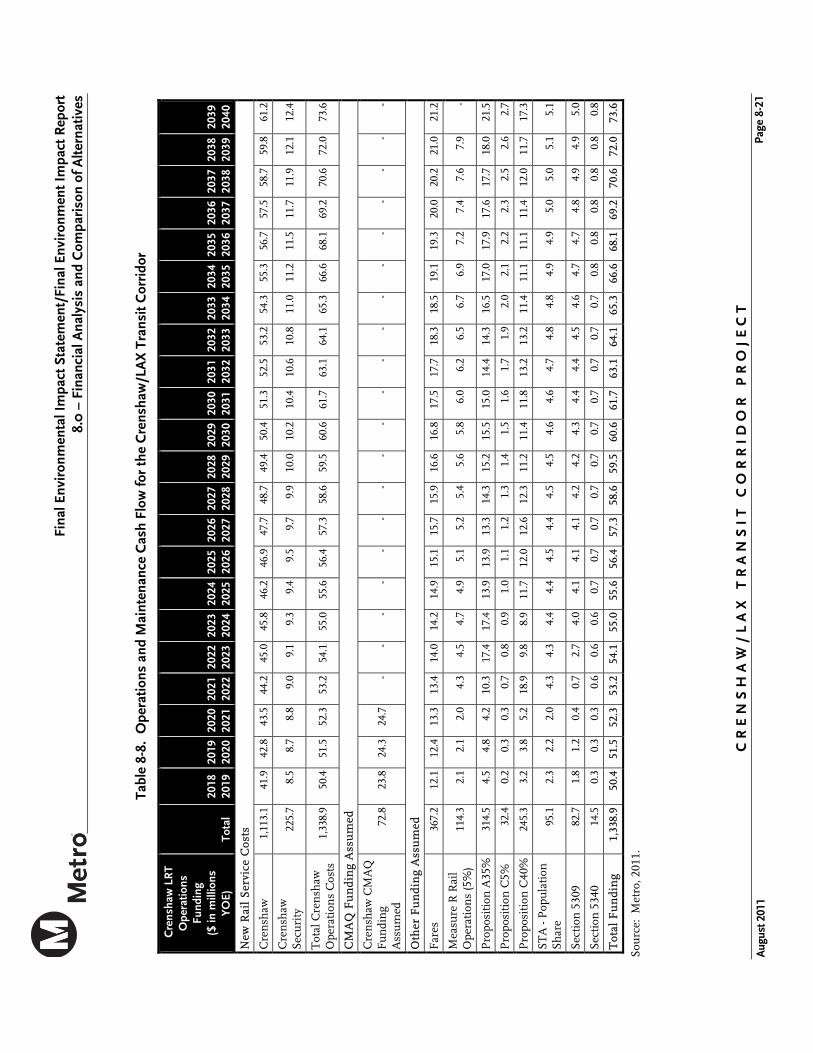
Fina
l Env
iron
men
tal I
mpa
ct S
tate
men
t/Fi
nal E
nvir
onm
ent I
mpa
ct R
epor
t 8.
0 –
Fin
anci
al A
naly
sis
and
Com
pari
son
of A
ltern
ativ
es
CR
EN
SH
AW
/L
AX
TR
AN
SI
T C
OR
RI
DO
R P
RO
JE
CT
Pa
ge 8
-21
Aug
ust 2
011
Tabl
e 8-
8. O
pera
tions
and
Mai
nten
ance
Cas
h Fl
ow fo
r th
e C
rens
haw
/LA
X T
rans
it C
orri
dor
Cre
nsha
w L
RT
Ope
ratio
ns
Fund
ing
($ in
mill
ions
YO
E)
Tota
l 20
18
2019
20
19
2020
20
2020
2120
2120
2220
2220
2320
2320
2420
2420
2520
2520
2620
2620
2720
2720
2820
2820
2920
29
2030
20
3020
3120
3120
3220
3220
3320
3320
3420
3420
3520
3520
3620
3620
3720
3720
3820
3820
3920
3920
40
New
Rai
l S
ervi
ce C
osts
Cre
nsh
aw
1,11
3.1
41.9
42
.8
43.5
44.2
45.0
45.8
46.2
46.9
47.7
48.7
49.4
50.4
51
.352
.553
.254
.355
.356
.757
.558
.759
.861
.2
Cre
nsh
aw
Secu
rity
22
5.7
8.5
8.7
8.8
9.0
9.1
9.3
9.4
9.5
9.7
9.9
10.0
10.2
10
.410
.610
.811
.011
.211
.511
.711
.912
.112
.4
Tot
al C
ren
shaw
O
pera
tion
s C
osts
1,
338.
9 50
.4
51.5
52
.353
.254
.155
.055
.656
.457
.358
.659
.560
.6
61.7
63.1
64.1
65.3
66.6
68.1
69.2
70.6
72.0
73.6
CM
AQ
Fu
ndi
ng
Ass
um
ed
Cre
nsh
aw C
MA
Q
Fu
ndi
ng
Ass
um
ed
72.8
23
.8
24.3
24
.7-
--
--
--
--
--
--
--
--
--
Oth
er F
un
din
g A
ssu
med
Far
es
367.
2 12
.1
12.4
13
.313
.414
.014
.214
.915
.115
.715
.916
.616
.8
17.5
17.7
18.3
18.5
19.1
19.3
20.0
20.2
21.0
21.2
Mea
sure
R R
ail
Ope
rati
ons
(5%
) 11
4.3
2.1
2.1
2.0
4.3
4.5
4.7
4.9
5.1
5.2
5.4
5.6
5.8
6.0
6.2
6.5
6.7
6.9
7.2
7.4
7.6
7.9
-
Pro
posi
tion
A35
%
314.
5 4.
5 4.
8 4.
210
.317
.417
.413
.913
.913
.314
.315
.215
.5
15.0
14.4
14.3
16.5
17.0
17.9
17.6
17.7
18.0
21.5
Pro
posi
tion
C5%
32
.4
0.2
0.3
0.3
0.7
0.8
0.9
1.0
1.1
1.2
1.3
1.4
1.5
1.6
1.7
1.9
2.0
2.1
2.2
2.3
2.5
2.6
2.7
Pro
posi
tion
C40
%
245.
3 3.
2 3.
8 5.
218
.99.
88.
911
.712
.012
.612
.311
.211
.4
11.8
13.2
13.2
11.4
11.1
11.1
11.4
12.0
11.7
17.3
STA
- P
opu
lati
on
Shar
e 95
.1
2.3
2.2
2.0
4.3
4.3
4.4
4.4
4.5
4.4
4.5
4.5
4.6
4.6
4.7
4.8
4.8
4.9
4.9
5.0
5.0
5.1
5.1
Sect
ion
530
9 82
.7
1.8
1.2
0.4
0.7
2.7
4.0
4.1
4.1
4.1
4.2
4.2
4.3
4.4
4.4
4.5
4.6
4.7
4.7
4.8
4.9
4.9
5.0
Sect
ion
534
0 14
.5
0.3
0.3
0.3
0.6
0.6
0.6
0.7
0.7
0.7
0.7
0.7
0.7
0.7
0.7
0.7
0.7
0.8
0.8
0.8
0.8
0.8
0.8
Tot
al F
un
din
g 1,
338.
9 50
.4
51.5
52
.353
.254
.155
.055
.656
.457
.358
.659
.560
.6
61.7
63.1
64.1
65.3
66.6
68.1
69.2
70.6
72.0
73.6
Sou
rce:
Met
ro, 2
011.
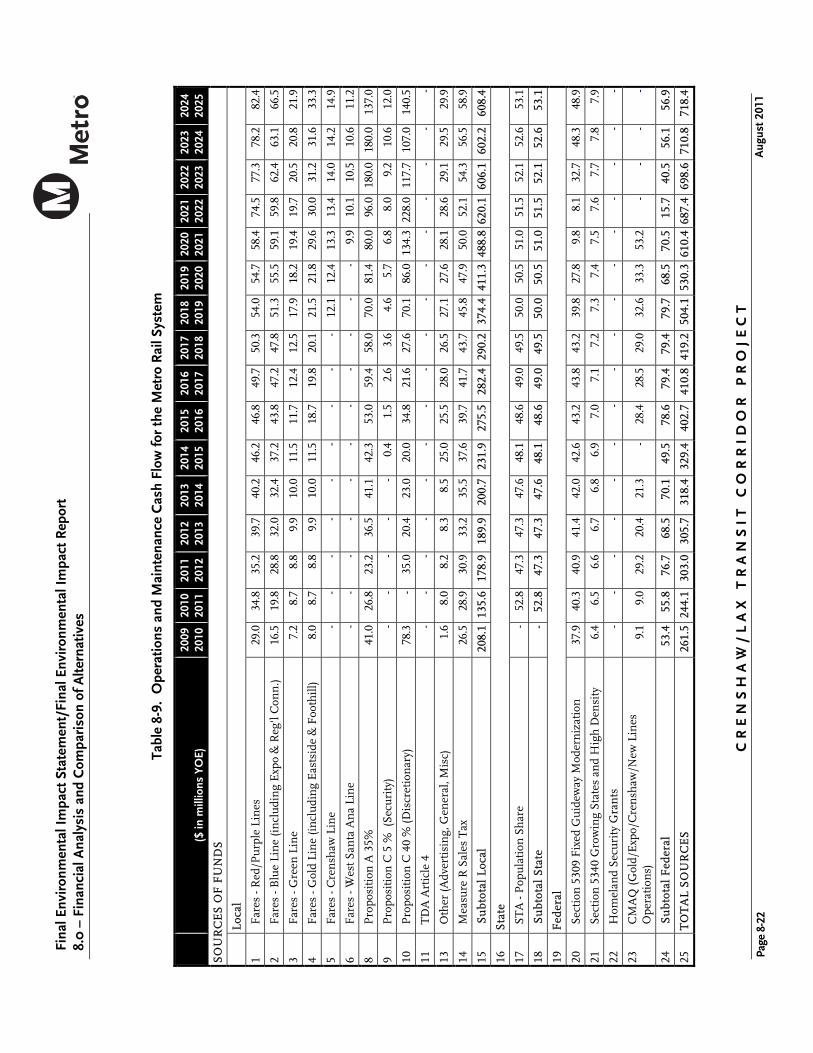
CR
EN
SH
AW
/L
AX
TR
AN
SI
T C
OR
RI
DO
R P
RO
JE
CT
A
ugus
t 201
1
Fina
l Env
iron
men
tal I
mpa
ct S
tate
men
t/Fi
nal E
nvir
onm
enta
l Im
pact
Rep
ort
8.0
– F
inan
cial
Ana
lysi
s an
d C
ompa
riso
n of
Alte
rnat
ives
Page
8-2
2
Tabl
e 8-
9. O
pera
tions
and
Mai
nten
ance
Cas
h Fl
ow fo
r th
e M
etro
Rai
l Sys
tem
($
in m
illio
ns Y
OE)
20
0920
10
2010
2011
2011
2012
20
1220
13
2013
2014
20
1420
15
2015
20
16
2016
2017
20
1720
18
2018
2019
20
1920
20
2020
2021
2021
2022
2022
2023
20
2320
24
2024
2025
SO
UR
CE
S O
F F
UN
DS
Lo
cal
1 F
ares
- R
ed/P
urp
le L
ines
29
.034
.835
.239
.740
.246
.2
46.8
49
.750
.354
.054
.758
.474
.577
.378
.282
.4
2 F
ares
- B
lue
Lin
e (i
ncl
udi
ng
Exp
o &
Reg
'l C
onn
.) 16
.519
.828
.832
.032
.437
.2
43.8
47
.247
.851
.355
.559
.159
.862
.463
.166
.5
3 F
ares
- G
reen
Lin
e 7.
28.
78.
89.
910
.011
.5
11.7
12
.412
.517
.918
.219
.419
.720
.520
.821
.9
4 F
ares
- G
old
Lin
e (i
ncl
udi
ng
Eas
tsid
e &
Foo
thill
) 8.
08.
78.
89.
910
.011
.5
18.7
19
.820
.121
.521
.829
.630
.031
.231
.633
.3
5 F
ares
- C
ren
shaw
Lin
e -
--
--
- -
--
12.1
12.4
13.3
13.4
14.0
14.2
14.9
6 F
ares
- W
est S
anta
An
a Li
ne
--
--
--
- -
--
-9.
910
.110
.510
.611
.2
8 P
ropo
siti
on A
35%
41
.026
.823
.236
.541
.142
.3
53.0
59
.458
.070
.081
.480
.096
.018
0.0
180.
013
7.0
9 P
ropo
siti
on C
5 %
(Se
curi
ty)
--
--
-0.
4 1.
5 2.
63.
64.
65.
76.
88.
09.
210
.612
.0
10
Pro
posi
tion
C 4
0 %
(Dis
cret
ion
ary)
78
.3-
35.0
20.4
23.0
20.0
34
.8
21.6
27.6
70.1
86.0
134.
322
8.0
117.
710
7.0
140.
5
11
TD
A A
rtic
le 4
-
--
--
- -
--
--
--
--
-
13
Oth
er (A
dver
tisi
ng,
Gen
eral
, Mis
c)
1.6
8.0
8.2
8.3
8.5
25.0
25
.5
28.0
26.5
27.1
27.6
28.1
28.6
29.1
29.5
29.9
14
Mea
sure
R S
ales
Tax
26
.528
.930
.933
.235
.537
.6
39.7
41
.743
.745
.847
.950
.052
.154
.356
.558
.9
15
Su
btot
al L
ocal
20
8.1
135.
617
8.9
189.
920
0.7
231.
9 27
5.5
282.
429
0.2
374.
441
1.3
488.
862
0.1
606.
160
2.2
608.
4
16
Sta
te
17
ST
A -
Pop
ula
tion
Sh
are
-52
.847
.347
.347
.648
.1
48.6
49
.049
.550
.050
.551
.051
.552
.152
.653
.1
18
Su
btot
al S
tate
-
52.8
47.3
47.3
47.6
48.1
48
.6
49.0
49.5
50.0
50.5
51.0
51.5
52.1
52.6
53.1
19
Fed
eral
20
Sec
tion
530
9 F
ixed
Gu
idew
ay M
oder
niz
atio
n
37.9
40.3
40.9
41.4
42.0
42.6
43
.2
43.8
43.2
39.8
27.8
9.8
8.1
32.7
48.3
48.9
21
Sec
tion
534
0 G
row
ing
Stat
es a
nd
Hig
h D
ensi
ty
6.4
6.5
6.6
6.7
6.8
6.9
7.0
7.1
7.2
7.3
7.4
7.5
7.6
7.7
7.8
7.9
22
Hom
elan
d S
ecu
rity
Gra
nts
-
--
--
- -
--
--
--
--
-
23
CM
AQ
(Gol
d/E
xpo/
Cre
nsh
aw/N
ew L
ines
O
pera
tion
s)
9.1
9.0
29.2
20.4
21.3
- 28
.4
28.5
29.0
32.6
33.3
53.2
--
--
24
Su
btot
al F
eder
al
53.4
55.8
76.7
68.5
70.1
49.5
78
.6
79.4
79.4
79.7
68.5
70.5
15.7
40.5
56.1
56.9
25
TO
TA
L S
OU
RC
ES
26
1.5
244.
130
3.0
305.
731
8.4
329.
4 40
2.7
410.
841
9.2
504.
153
0.3
610.
468
7.4
698.
671
0.8
718.
4
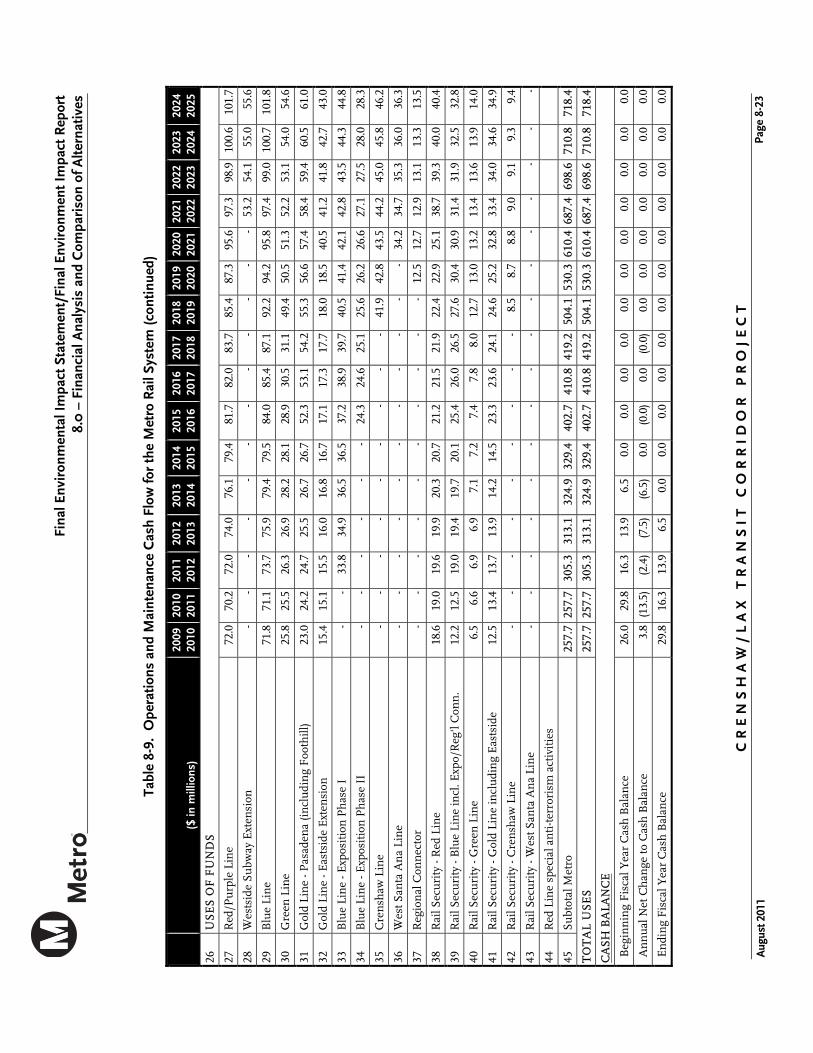
Fina
l Env
iron
men
tal I
mpa
ct S
tate
men
t/Fi
nal E
nvir
onm
ent I
mpa
ct R
epor
t 8.
0 –
Fin
anci
al A
naly
sis
and
Com
pari
son
of A
ltern
ativ
es
CR
EN
SH
AW
/L
AX
TR
AN
SI
T C
OR
RI
DO
R P
RO
JE
CT
Pa
ge 8
-23
Aug
ust 2
011
Tabl
e 8-
9. O
pera
tions
and
Mai
nten
ance
Cas
h Fl
ow fo
r th
e M
etro
Rai
l Sys
tem
(con
tinue
d)
($
in m
illio
ns)
2009
2010
20
1020
1120
1120
12
2012
2013
20
1320
14
2014
2015
20
15
2016
20
1620
17
2017
2018
20
1820
19
2019
2020
20
2020
2120
2120
2220
2220
23
2023
2024
20
2420
25
26
US
ES
OF
FU
ND
S
27
Red
/Pu
rple
Lin
e 72
.070
.272
.074
.076
.179
.4
81.7
82
.083
.785
.487
.395
.697
.398
.910
0.6
101.
7
28
Wes
tsid
e Su
bway
Ext
ensi
on
--
--
--
- -
--
--
53.2
54.1
55.0
55.6
29
Blu
e Li
ne
71.8
71.1
73.7
75.9
79.4
79.5
84
.0
85.4
87.1
92.2
94.2
95.8
97.4
99.0
100.
710
1.8
30
Gre
en L
ine
25.8
25.5
26.3
26.9
28.2
28.1
28
.9
30.5
31.1
49.4
50.5
51.3
52.2
53.1
54.0
54.6
31
Gol
d Li
ne
- Pas
aden
a (i
ncl
udi
ng
Foo
thill
) 23
.024
.224
.725
.526
.726
.7
52.3
53
.154
.255
.356
.657
.458
.459
.460
.561
.0
32
Gol
d Li
ne
- Eas
tsid
e E
xten
sion
15
.415
.115
.516
.016
.816
.7
17.1
17
.317
.718
.018
.540
.541
.241
.842
.743
.0
33
Blu
e Li
ne
- Exp
osit
ion
Ph
ase
I -
-33
.834
.936
.536
.5
37.2
38
.939
.740
.541
.442
.142
.843
.544
.344
.8
34
Blu
e Li
ne
- Exp
osit
ion
Ph
ase
II
--
--
--
24.3
24
.625
.125
.626
.226
.627
.127
.528
.028
.3
35
Cre
nsh
aw L
ine
--
--
--
- -
-41
.942
.843
.544
.245
.045
.846
.2
36
Wes
t San
ta A
na
Lin
e -
--
--
- -
--
--
34.2
34.7
35.3
36.0
36.3
37
Reg
ion
al C
onn
ecto
r -
--
--
- -
--
-12
.512
.712
.913
.113
.313
.5
38
Rai
l Sec
uri
ty -
Red
Lin
e 18
.619
.019
.619
.920
.320
.7
21.2
21
.521
.922
.422
.925
.138
.739
.340
.040
.4
39
Rai
l Sec
uri
ty -
Blu
e Li
ne
incl
. Exp
o/R
eg'l
Con
n.
12.2
12.5
19.0
19.4
19.7
20.1
25
.4
26.0
26.5
27.6
30.4
30.9
31.4
31.9
32.5
32.8
40
Rai
l Sec
uri
ty -
Gre
en L
ine
6.5
6.6
6.9
6.9
7.1
7.2
7.4
7.8
8.0
12.7
13.0
13.2
13.4
13.6
13.9
14.0
41
Rai
l Sec
uri
ty -
Gol
d Li
ne
incl
udi
ng
Eas
tsid
e 12
.513
.413
.713
.914
.214
.5
23.3
23
.624
.124
.625
.232
.833
.434
.034
.634
.9
42
Rai
l Sec
uri
ty -
Cre
nsh
aw L
ine
--
--
--
- -
-8.
58.
78.
89.
09.
19.
39.
4
43
Rai
l Sec
uri
ty -
Wes
t San
ta A
na
Lin
e -
--
--
- -
--
--
--
--
-
44
Red
Lin
e sp
ecia
l an
ti-t
erro
rism
act
ivit
ies
45
Subt
otal
Met
ro
257.
725
7.7
305.
331
3.1
324.
932
9.4
402.
7 41
0.8
419.
250
4.1
530.
361
0.4
687.
469
8.6
710.
871
8.4
TO
TA
L U
SE
S
257.
725
7.7
305.
331
3.1
324.
932
9.4
402.
7 41
0.8
419.
250
4.1
530.
361
0.4
687.
469
8.6
710.
871
8.4
CA
SH B
ALA
NC
E
Beg
inn
ing
Fis
cal Y
ear
Cas
h B
alan
ce
26.0
29.8
16.3
13.9
6.5
0.0
0.0
0.0
0.0
0.0
0.0
0.0
0.0
0.0
0.0
0.0
An
nu
al N
et C
han
ge to
Cas
h B
alan
ce
3.8
(13.
5)(2
.4)
(7.5
)(6
.5)
0.0
(0.0
) 0.
0(0
.0)
0.0
0.0
0.0
0.0
0.0
0.0
0.0
En
din
g F
isca
l Yea
r C
ash
Bal
ance
29
.816
.313
.96.
50.
00.
0 0.
0 0.
00.
00.
00.
00.
00.
00.
00.
00.
0

CR
EN
SH
AW
/L
AX
TR
AN
SI
T C
OR
RI
DO
R P
RO
JE
CT
A
ugus
t 201
1
Fina
l Env
iron
men
tal I
mpa
ct S
tate
men
t/Fi
nal E
nvir
onm
enta
l Im
pact
Rep
ort
8.0
– F
inan
cial
Ana
lysi
s an
d C
ompa
riso
n of
Alte
rnat
ives
Page
8-2
4
Tabl
e 8-
9. O
pera
tions
and
Mai
nten
ance
Cas
h Fl
ow fo
r th
e M
etro
Rai
l Sys
tem
(con
tinue
d)
($
in m
illio
ns)
2025
2026
20
2620
27
2027
2028
20
2820
2920
2920
30
2030
20
31
2031
2032
2032
2033
20
3320
34
2034
2035
20
3520
3620
3620
37
2037
2038
20
3820
39
2039
2040
SO
UR
CE
S O
F F
UN
DS
Lo
cal
1 F
ares
- R
ed/P
urp
le L
ines
83
.486
.988
.091
.892
.996
.4
97.6
100.
810
2.0
105.
310
6.6
110.
111
1.5
115.
711
7.1
2 F
ares
- B
lue
Lin
e (i
ncl
udi
ng
Exp
o &
Reg
'l C
onn
.) 67
.370
.271
.074
.175
.077
.8
78.8
81.3
82.3
85.0
86.1
88.9
90.0
93.4
94.5
3 F
ares
- G
reen
Lin
e 22
.123
.123
.424
.424
.725
.6
25.9
26.8
27.1
28.0
28.3
29.2
29.6
30.7
31.1
4 F
ares
- G
old
Lin
e (i
ncl
udi
ng
Eas
tsid
e &
Foo
thill
) 33
.735
.135
.637
.137
.538
.9
39.4
40.7
41.2
42.6
43.1
44.5
45.1
46.7
47.3
5 F
ares
- C
ren
shaw
Lin
e 15
.115
.715
.916
.616
.817
.5
17.7
18.3
18.5
19.1
19.3
20.0
20.2
21.0
21.2
6 F
ares
- W
est S
anta
An
a Li
ne
11.3
11.8
12.0
12.5
12.6
13.1
13
.313
.713
.914
.314
.515
.015
.215
.715
.9
8 P
ropo
siti
on A
35%
13
6.0
132.
014
3.0
153.
015
6.0
150.
0 14
2.0
138.
016
5.0
170.
018
0.0
175.
017
6.0
179.
022
0.0
9 P
ropo
siti
on C
5 %
(Se
curi
ty)
13.5
14.8
16.2
17.5
18.8
20.0
21
.322
.624
.125
.526
.928
.329
.831
.232
.6
10
Pro
posi
tion
C 4
0 %
(Dis
cret
ion
ary)
14
3.6
154.
115
0.4
136.
213
9.1
144.
3 16
1.0
159.
313
8.4
134.
413
4.8
138.
214
5.0
141.
520
8.9
11
TD
A A
rtic
le 4
-
--
--
- -
--
--
--
--
13
Oth
er (A
dver
tisi
ng,
Gen
eral
, Mis
c)
30.3
30.8
31.4
32.0
32.6
33.2
33
.834
.435
.135
.836
.537
.238
.038
.739
.4
14
Mea
sure
R S
ales
Tax
61
.363
.766
.268
.671
.173
.5
75.9
78.5
81.2
84.0
86.6
89.5
92.4
95.1
-
15
Su
btot
al L
ocal
61
7.7
638.
365
3.0
663.
667
7.0
690.
2 70
6.6
714.
372
8.8
744.
076
2.7
775.
879
2.6
808.
682
8.1
16
Sta
te
17
ST
A -
Pop
ula
tion
Sh
are
53.6
54.2
54.7
55.3
55.8
56.4
56
.957
.558
.158
.759
.259
.860
.461
.061
.7
18
Su
btot
al S
tate
53
.654
.254
.755
.355
.856
.4
56.9
57.5
58.1
58.7
59.2
59.8
60.4
61.0
61.7
19
Fed
eral
20
Sec
tion
530
9 F
ixed
Gu
idew
ay M
oder
niz
atio
n
49.6
50.3
51.0
51.7
52.5
53.2
54
.054
.755
.556
.257
.057
.858
.659
.560
.3
21
Sec
tion
534
0 G
row
ing
Stat
es a
nd
Hig
h D
ensi
ty
8.0
8.2
8.3
8.4
8.5
8.6
8.7
8.9
9.0
9.1
9.2
9.4
9.5
9.6
9.8
22
Hom
elan
d S
ecu
rity
Gra
nts
-
--
--
- -
--
--
--
--
23
CM
AQ
(Gol
d/E
xpo/
Cre
nsh
aw/N
ew L
ines
O
pera
tion
s)
--
--
--
--
--
--
--
-
24
Su
btot
al F
eder
al
57.7
58.5
59.3
60.1
61.0
61.8
62
.763
.664
.565
.466
.367
.268
.269
.170
.1
25
TO
TA
L S
OU
RC
ES
72
9.0
751.
076
7.1
779.
079
3.8
808.
4 82
6.2
835.
485
1.4
868.
088
8.3
902.
992
1.2
938.
895
9.9
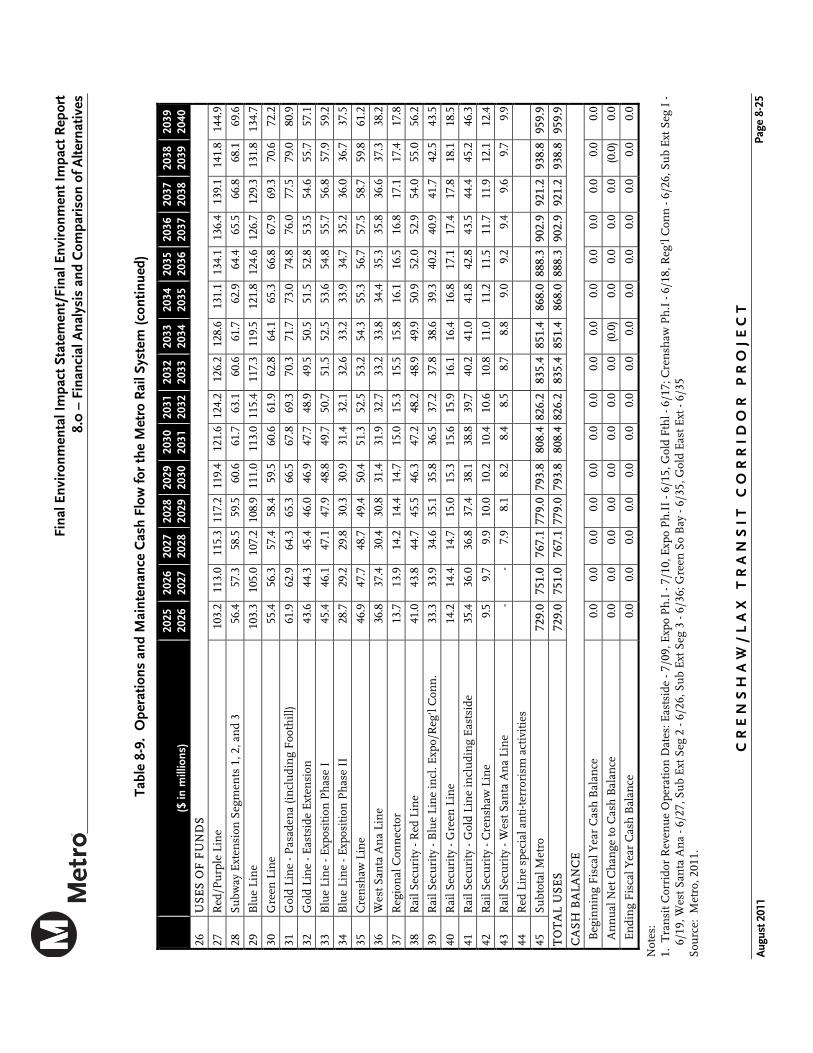
Fina
l Env
iron
men
tal I
mpa
ct S
tate
men
t/Fi
nal E
nvir
onm
ent I
mpa
ct R
epor
t 8.
0 –
Fin
anci
al A
naly
sis
and
Com
pari
son
of A
ltern
ativ
es
CR
EN
SH
AW
/L
AX
TR
AN
SI
T C
OR
RI
DO
R P
RO
JE
CT
Pa
ge 8
-25
Aug
ust 2
011
Tabl
e 8-
9. O
pera
tions
and
Mai
nten
ance
Cas
h Fl
ow fo
r th
e M
etro
Rai
l Sys
tem
(con
tinue
d)
($
in m
illio
ns)
2025
2026
20
2620
27
2027
2028
20
2820
2920
2920
30
2030
20
31
2031
2032
2032
2033
20
3320
34
2034
2035
20
3520
3620
3620
37
2037
2038
20
3820
39
2039
2040
26
US
ES
OF
FU
ND
S
27
Red
/Pu
rple
Lin
e 10
3.2
113.
011
5.3
117.
211
9.4
121.
6 12
4.2
126.
212
8.6
131.
113
4.1
136.
413
9.1
141.
814
4.9
28
Subw
ay E
xten
sion
Seg
men
ts 1
, 2, a
nd
3 56
.457
.358
.559
.560
.661
.7
63.1
60.6
61.7
62.9
64.4
65.5
66.8
68.1
69.6
29
Blu
e Li
ne
103.
310
5.0
107.
210
8.9
111.
011
3.0
115.
411
7.3
119.
512
1.8
124.
612
6.7
129.
313
1.8
134.
7
30
Gre
en L
ine
55.4
56.3
57.4
58.4
59.5
60.6
61
.962
.864
.165
.366
.867
.969
.370
.672
.2
31
Gol
d Li
ne
- Pas
aden
a (i
ncl
udi
ng
Foo
thill
) 61
.962
.964
.365
.366
.567
.8
69.3
70.3
71.7
73.0
74.8
76.0
77.5
79.0
80.9
32
Gol
d Li
ne
- Eas
tsid
e E
xten
sion
43
.644
.345
.446
.046
.947
.7
48.9
49.5
50.5
51.5
52.8
53.5
54.6
55.7
57.1
33
Blu
e Li
ne
- Exp
osit
ion
Ph
ase
I 45
.446
.147
.147
.948
.849
.7
50.7
51.5
52.5
53.6
54.8
55.7
56.8
57.9
59.2
34
Blu
e Li
ne
- Exp
osit
ion
Ph
ase
II
28.7
29.2
29.8
30.3
30.9
31.4
32
.132
.633
.233
.934
.735
.236
.036
.737
.5
35
Cre
nsh
aw L
ine
46.9
47.7
48.7
49.4
50.4
51.3
52
.553
.254
.355
.356
.757
.558
.759
.861
.2
36
Wes
t San
ta A
na
Lin
e 36
.837
.430
.430
.831
.431
.9
32.7
33.2
33.8
34.4
35.3
35.8
36.6
37.3
38.2
37
Reg
ion
al C
onn
ecto
r 13
.713
.914
.214
.414
.715
.0
15.3
15.5
15.8
16.1
16.5
16.8
17.1
17.4
17.8
38
Rai
l Sec
uri
ty -
Red
Lin
e 41
.043
.844
.745
.546
.347
.2
48.2
48.9
49.9
50.9
52.0
52.9
54.0
55.0
56.2
39
Rai
l Sec
uri
ty -
Blu
e Li
ne
incl
. Exp
o/R
eg'l
Con
n.
33.3
33.9
34.6
35.1
35.8
36.5
37
.237
.838
.639
.340
.240
.941
.742
.543
.5
40
Rai
l Sec
uri
ty -
Gre
en L
ine
14.2
14.4
14.7
15.0
15.3
15.6
15
.916
.116
.416
.817
.117
.417
.818
.118
.5
41
Rai
l Sec
uri
ty -
Gol
d Li
ne
incl
udi
ng
Eas
tsid
e 35
.436
.036
.837
.438
.138
.8
39.7
40.2
41.0
41.8
42.8
43.5
44.4
45.2
46.3
42
Rai
l Sec
uri
ty -
Cre
nsh
aw L
ine
9.5
9.7
9.9
10.0
10.2
10.4
10
.610
.811
.011
.211
.511
.711
.912
.112
.4
43
Rai
l Sec
uri
ty -
Wes
t San
ta A
na
Lin
e -
-7.
98.
18.
28.
4 8.
58.
78.
89.
09.
29.
49.
69.
79.
9
44
Red
Lin
e sp
ecia
l an
ti-t
erro
rism
act
ivit
ies
45
Subt
otal
Met
ro
729.
075
1.0
767.
177
9.0
793.
880
8.4
826.
283
5.4
851.
486
8.0
888.
390
2.9
921.
293
8.8
959.
9
TO
TA
L U
SE
S
729.
075
1.0
767.
177
9.0
793.
880
8.4
826.
283
5.4
851.
486
8.0
888.
390
2.9
921.
293
8.8
959.
9
CA
SH
BA
LAN
CE
Beg
inn
ing
Fis
cal Y
ear
Cas
h B
alan
ce
0.0
0.0
0.0
0.0
0.0
0.0
0.0
0.0
0.0
0.0
0.0
0.0
0.0
0.0
0.0
An
nu
al N
et C
han
ge to
Cas
h B
alan
ce
0.0
0.0
0.0
0.0
0.0
0.0
0.0
0.0
(0.0
)0.
00.
00.
00.
0(0
.0)
0.0
En
din
g F
isca
l Yea
r C
ash
Bal
ance
0.
00.
00.
00.
00.
00.
0 0.
00.
00.
00.
00.
00.
00.
00.
00.
0
Not
es:
1. T
ran
sit C
orri
dor
Rev
enu
e O
pera
tion
Dat
es: E
asts
ide
- 7/0
9, E
xpo
Ph
.I -
7/10
, Exp
o P
h.I
I - 6
/15,
Gol
d F
thl -
6/1
7; C
ren
shaw
Ph
.I -
6/18
, Reg
'l C
onn
- 6/
26, S
ub
Ext
Seg
I -
6/19
, Wes
t San
ta A
na
- 6/2
7, S
ub
Ext
Seg
2 -
6/26
, Su
b E
xt S
eg 3
- 6/
36; G
reen
So
Bay
- 6/
35, G
old
Eas
t Ext
- 6/
35
Sou
rce:
Met
ro, 2
011.
C R E N S H A W / L A X T R A N S I T C O R R I D O R P R O J E C T August 2011
Final Environmental Impact Statement/Final Environmental Impact Report 8.0 – Financial Analysis and Comparison of Alternatives
Page 8-26
Financial Capability
Ridership
Travel Time Savings
8.2.1 Regional Connectivity
The LPA would increase regional connectivity and improve access to major activity centers and travel markets in West Los Angeles, Hollywood and Downtown Los Angeles. However, the No-Build Alternative would not increase regional connectivity and improve access to major activity centers and travel markets in West Los Angeles, Hollywood and Downtown Los Angeles.
8.2.2 Environmental Effects
The No-Build Alternative would not include construction activity, as a result, it would not have impacts related to displacement (no property acquisition or relocation would be necessary), or construction air quality. The LPA would result in potentially adverse construction effects. Implementation of mitigation would reduce all of these effects to less than adverse. However, the project would result in a significant impact to air quality during construction under CEQA (no adverse effect under NEPA). The LPA would result in lower regional vehicle miles of travel (VMT) and a reduction in Greenhouse Gases when compared to the No-Build Alternative.
The design options and MOSs would not result in any additional adverse effects than described for the LPA. The Site #14 – Arbor Vitae/Bellanca maintenance facility would result in adverse effects from displacement and relocation, economic and fiscal effects, noise and air quality during construction. All other potential adverse effects would be mitigated to less than adverse levels.
8.2.3 Economic Development and Land Use
The No-Build Alternative would not be consistent with several existing land use policies encouraging transit-oriented uses. The No-Build Alternative in particular would limit future opportunities for development at stations.
The LPA, design options, and MOSs would increase accessibility to Edward Vincent Jr. (from Florence/West Station), Leimert Park (from Crenshaw/Vernon or Crenshaw/King Stations, and Grevillea Park (from Florence/La Brea Station) and would improve public transit access to 33 community facilities and public services located within 0.25 mile. The LPA would also result in 400 additional construction jobs and a $73.2 million increase in economic output during construction and 250 additional jobs and $20.9 million increase in economic output during operation. The No-Build Alternative would not result in additional jobs or economic output.
The LPA, design options and MOSs follow the same general alignment and the same land use policies apply. The response of developers to invest in station areas may be slightly higher for the LPA compared to the MOSs. The optional stations (Aviation/Manchester and Crenshaw/Vernon) could provide additional development opportunities when compared to the LPA.

Final Environmental Impact Statement/Final Environment Impact Report
8.0 – Financial Analysis and Comparison of Alternatives
C R E N S H A W / L A X T R A N S I T C O R R I D O R P R O J E C T Page 8-27 August 2011
8.2.4 Community Support
There were 1,234 comments received during the circulation period for the DEIS/DEIR. There were 198 written comments and oral comments made by 53 speakers received during the circulation period for the Supplemental Draft Environmental Impact Statement/Recirculated Draft Environmental Impact Report (SDEIS/RDEIR). Comments were received from federal, state, and local agencies, elected officials, community organizations, transit advocates, and from members of the general public. The most frequent comment topics for the DEIS/DEIR included alignments/routes, mode, public safety, traffic and parking, historic and cultural resources, connectivity, environmental justice and economic development. The most frequent comment topics for the SDEIS/RDEIR were regarding the proposed maintenance facility alternatives, focusing on noise, economics, displacement, construction, traffic and air quality.
Alignments/Routes
Many of the received comments concerned potential connections to existing transit lines, particularly the Metro Red, Purple, Blue, and Green Lines, as well as the Exposition Light Rail Transit LRT Line (under construction). Particular interests focused on regional connectivity, especially active venues and destination centers, such as Hollywood, LAX, South Bay, Downtown Los Angeles, and the Westside. Recommendations were made to design new routes, such as an alignment from La Brea Avenue/Wilshire Boulevard with connections to Venice Boulevard/San Vicente Boulevard then south along Crenshaw Boulevard. Several comments indicated less desire for a connection at Wilshire Boulevard/Crenshaw Boulevard.
Mode
Mode was a frequent comment topic. Most remarks expressed support for light rail transit (LRT), as opposed to bus-based services. Stakeholders urged the consideration of grade separations (either below grade or at grade). Many commenters urged for a fully-grade separated alignment. There was concern that an at-grade alignment would degrade the aesthetics, culture, and history of portions of the Crenshaw/LAX Transit Corridor, particularly in the Leimert Park area. Comments were received pertaining to the safety of LRT at crossings and the interaction of vehicular traffic with LRT. There were several comments from residents who requested the same level of service and amenities that affluent communities receive.
Comments relating to bus services varied. Some of the comments were in support of bus services because they were perceived as having less of a negative impact on the aesthetics and culture of the area. Some felt that buses were safer, as opposed to light rail, and would cause less disruption, would cost less, and could be implemented sooner. Some comments were not in support of any additional bus services. Other comments suggested a continued need for local and circulator bus services.
Maintenance Facility
Comments received related to maintenance facilities, primarily related to noise, economics, displacement, construction, traffic and air quality. Primarily these comments were related to the Site #17 – Marine/Redondo Beach and Division 22 Northern
C R E N S H A W / L A X T R A N S I T C O R R I D O R P R O J E C T August 2011
Final Environmental Impact Statement/Final Environmental Impact Report 8.0 – Financial Analysis and Comparison of Alternatives
Page 8-28
Expansion Alternatives, which were not selected as the preferred maintenance facility site.
Public Safety
Stakeholders articulated concern over LRT with regard to its proximity to schools and the safe interaction between LRT and vehicular/pedestrian traffic, particularly at grade-crossings.
Traffic and Parking
Generally, the concerns regarded potential increases in congestion during construction and potentially during LRT operations. Specifically, Slauson Avenue was cited as a concern for many commenters.
Historic and Cultural Resources
Preservation of the character, culture, and history of the Crenshaw/LAX Transit Corridor were paramount. Stakeholders expressed a fear that the community would change, and that minority and small business owners could be impacted. Leimert Park Village and Hyde Park were areas mentioned frequently with regard to preservation.
Connectivity
Participants expressed a desire for regional connectivity and efficiency, with a focused attention on connections to LAX, the Westside, Downtown Los Angeles, the South Bay and the Metro Red, Green, Blue, and Purple Lines.
Environmental Justice
Equity issues were strongly expressed. Community stakeholders wanted the same level of investment and consideration that more affluent communities would receive. Comments expressed that negative impacts should be mitigated to the extent possible and that the quality of life should be protected from degradation.
Economic Development
A few comments referenced the potential for transit to allow for enhanced economic vitality. Others expressed concern for the perceived potential loss of existing businesses along Crenshaw Boulevard.
8.2.5 Capital and Operating Costs
The capital cost for the Project (LPA with Partially-Covered LAX Trench Option) is estimated at $1.55 billion in 2010 dollars, or $1.76 billion in YOE dollars (see Table 8-1). The cost estimates for each of the design options providing for the additional stations range from $9.42 million, or $11.58 million in YOE dollars, for the at-grade optional Aviation/Manchester Station to $106.31 million, or $130.74 million in YOE dollars, for the optional Crenshaw/Vernon Station. The cut-and-cover crossing at Centinela is estimated to cost $20.6 million, or $25.33 million in YOE dollars. The Partially-Covered LAX Trench Option, which is included in the project costs, would result in a cost savings of $41 million or $46.5 million in YOE. This savings is already reflected in the cost

Final Environmental Impact Statement/Final Environment Impact Report
8.0 – Financial Analysis and Comparison of Alternatives
C R E N S H A W / L A X T R A N S I T C O R R I D O R P R O J E C T Page 8-29 August 2011
estimate. The MOSs would reduce capital costs because of the shorter alignment over the LPA. MOS-Century, with the southern terminus at the Aviation/Century Station, would reduce the base year capital cost by $122.85 million, or $140.23 million in YOE dollars. MOS-King, with the northern terminus at the Crenshaw/King Station, would reduce the base year capital cost by $257.52 million, or $293.96 million in YOE dollars.
The Project will cost an additional $51.3 million annually to operate and maintain, compared to the No-Build Alternative. The provision of rail security for the Project is estimated to cost an additional $10.4 million, resulting in a total annual increase of $61.7 million. The inclusion of the Aviation/Manchester Station and Crenshaw/Vernon Station options would result in a slight increase in the annual O&M cost, as compared to the Project. The MOSs would reduce the annual O&M cost compared to the full length Project.
8.2.6 Cost Effectiveness
The LPA, MOSs, and design options were determined to rate less than the FTA Medium rating necessary to qualify for a cost effectiveness rating under FTA guidance in effect as of September 2009.
8.2.7 Financial Capability
The Los Angeles County Measure R program, approved by the voters in November 2008, would be the primary capital funding source for the proposed project. Measure R along with other sources of funds would provide a total of $1,715.0 million in year of expenditure funds that could be used to finance the capital costs of the LPA. The Measure R funds would be used to repay the TFIA loan obtained to accelerate or maintain the implementation of the project.
Based on the year of expenditure capital costs of the LPA and the estimated revenues, a combination of cost reductions and/or additional revenues will need to be identified to fully fund the capital costs of the LPA and design options. Only the MOSs could be funded without cost reductions or additional funding. The gap, or shortfall in funding for the LPA, is estimated at $48.8 million.
As identified previously, Metro has completed a number of value engineering refinements to the project and will continue to refine the project through completion of the preliminary engineering phase to further reduce the cost of the project. The combination of the $31 million funding transfer and local agency funding would reduce the shortfall from $48.8 to $15.8 million. Despite the need to close a small gap between the project cost and budget, this estimated shortfall for LPA would not present a great enough revenue shortfall to render the project as financially infeasible.
The current Metro LRTP provides funding through the existing local sources (Prop A/Prop C) and additional Measure R revenues to fund the operating and maintenance costs of the LPA and design options, including the MOSs.

C R E N S H A W / L A X T R A N S I T C O R R I D O R P R O J E C T August 2011
Final Environmental Impact Statement/Final Environmental Impact Report 8.0 – Financial Analysis and Comparison of Alternatives
Page 8-30
8.2.8 Ridership
The LPA would result in 12,625 daily boarding in 2030. The optional stations would increase ridership by approximately 500 daily boardings. The MOSs would decrease ridership by approximately 4,500 daily boardings.
8.2.9 Travel Time Savings
The LPA would have a travel time savings of 21.6 minutes saved traveling from the Exposition Line to the Metro Green Line in 2030. The No-Build Alternative would not result in any travel time savings. The optional station design options would increase travel times by approximately two minutes compared to the LPA. The cut-and-cover crossing at Centinela would increase travel times compared to the LPA. The alternate southwest portal at King would have no effect on travel time. The MOSs would not connect the two rail lines and travel times would increase significantly with a rail to bus transfer needed to complete the connection.
8.3 Trade Offs Analysis
Consideration of all alternatives is required in order to draw a conclusion about the proper investment for the Crenshaw/LAX Transit Corridor. Each alternative – the No-Build Alternative, the LPA, the design options, and the MOSs must be evaluated against many different factors and variables. Weighing each of the factors inevitably involves tradeoffs among features of each alternative and between alternatives.
The No-Build Alternative would not achieve the level of mobility and accessibility needed by communities within the Crenshaw/LAX Transit Corridor. These communities contain a disproportionately high concentration of minority and low income households. Additionally, the No-Build Alternative would not create the infrastructure necessary to shift the corridor communities from fossil fuel-oriented travel to a viable transit alternative. As a result, VMT within the corridor would continue to increase, greenhouse gas emissions would remain unchecked and the corridor communities would continue to rely on non-renewable energy sources.
The LPA contains a combination of exclusive right-of-way segments (at-grade, below grade and elevated), which minimizes conflicts with traffic and provides faster and more reliable travel times. The speeds associated with the LPA offers the greatest potential improvement in ridership over the No-Build Alternative. Travel times are more reliable over the long run as congestion on the roadway network affect vehicle traffic. The LPA is also able to take advantage of existing transit investments, such as the Metro Green Line. Consequently, service on the LPA can provide connections more deeply into the South Bay Area along the Metro Green Line. In addition, a portion of the LPA also facilitates the extension of the Metro Green Line in the direction of LAX. Importantly, the substantial infrastructure investment associated with the LPA is typically more catalytic in encouraging transit-supportive land uses envisioned by many communities within the corridor. Two of the design options for the LPA include optional stations at Manchester near Westchester and Vernon near Leimert Park. The inclusion of stations at these locations could spur transit-oriented development and provide access to these communities. However, a station at Vernon Avenue would be required to be below-grade

Final Environmental Impact Statement/Final Environment Impact Report
8.0 – Financial Analysis and Comparison of Alternatives
C R E N S H A W / L A X T R A N S I T C O R R I D O R P R O J E C T Page 8-31 August 2011
and would cost approximately $130.74 million in YOE dollars. In addition, the Crenshaw/King Station is located approximately 0.6-mile from the optional Crenshaw/Vernon Station, which would lead to duplicated service. The Aviation/Manchester Station has one of the lower ridership projections and many members of the community expressed concern about locating transit infrastructure, such as a park-and-ride lot adjacent to their community. The cut-and-cover crossing at Centinela would provide a grade-separation across Centinela Avenue which could improve operational reliability along this segment of the Harbor Subdivision and facilitate the flow of vehicular traffic along Centinela Avenue. However, the lack of significant traffic and safety impacts at this intersection does not require its inclusion into the LPA. The alternate southwest portal at the Crenshaw/King Station would provide increased access to the Baldwin Hills Crenshaw Plaza. Inclusion of this option would require the granting of easements for the portal and/or private funding.
The LPA has significantly higher capital costs compared to the No-Build Alternative, requiring greater financial resources. The at-grade portion of the alignment from 39th Street to Exposition Boulevard that was determined to be infeasible introduced significant new costs above those for the Base LRT Alternative in the DEIS/DEIR that caused the LPA to exceed the limits of the established financial plan for the project. The cost for the LPA increased to $1.76 billion in YOE dollars, which exceeds the projected revenues of $1.715 billion in the financial plan. Additional cost savings and potential funding sources need to be identified which could help bridge the gap in funding should the final cost estimate after further value engineering exceed the financial plan. The MOSs offer shorter project alignment alternatives which would fit within the financial plan for the project.
In general, the environmental effects of the MOSs are similar to those described for the LPA. However, a shorter terminus would shift some of the local circulation patterns and parking demand to the new termini at either the Crenshaw/King or Aviation/Century Stations. The implementation of one of the MOSs would result in a substantial reduction in regional connectivity compared to the LPA. The bus connection to make the additional connections between the Metro Green and Exposition Lines would substantially increase travel times for both MOSs and ridership projections show a 60 percent decrease in daily boardings. This would result in a significant reduction in the ability to achieve the project goals of regional connectivity and mobility when compared to the LPA.
C R E N S H A W / L A X T R A N S I T C O R R I D O R P R O J E C T August 2011
Final Environmental Impact Statement/Final Environmental Impact Report 8.0 – Financial Analysis and Comparison of Alternatives
Page 8-32
THIS PAGE INTENTIONALLY BLANK