Embed Size (px)
Citation preview
Regional Connector Transit Corridor
Draft Environmental Impact Statement/
Draft Environmental Impact Report
APPENDIX HH
FINANCIAL ANALYSIS REPORT
State Clearinghouse Number: 2009031043

Regional Connector Transit Corridor
Draft Financial Analysis Report
April 2010
Prepared for
Los Angeles County Metropolitan Transportation Authority
One Gateway Plaza
Los Angeles, CA 90012
State Clearinghouse Number: 2009031043

R e g i o n a l C o n n e c t o r T r a n s i t C o r r i d o r
D r a f t F i n a n c i a l A n a l y s i s R e p o r t
Draft Environmental Impact Statement/Environmental Impact Report Page i
This technical memorandum was prepared by:
CDM
523 West Sixth Street Suite 400 Los Angeles, CA 90014
Sharon Greene + Associates 1100 South Coast Highway Suite 318 Laguna Beach, CA 92651

R e g i o n a l C o n n e c t o r T r a n s i t C o r r i d o r
D r a f t F i n a n c i a l A n a l y s i s R e p o r t
Draft Environmental Impact Statement/Environmental Impact Report Page iii
TABLE OF CONTENTS 1.0 Introduction .................................................................................................................... 1
1.1 Purpose of the Financial Report ........................................................................................ 1 1.2 Description of Alternatives ................................................................................................ 2 1.2.1 No Build Alternative ................................................................................................ 2 1.2.2 TSM Alternative ....................................................................................................... 2 1.2.3 At Grade Emphasis LRT Alternative ........................................................................ 3 1.2.4 Underground Emphasis LRT Alternative ................................................................ 4 1.2.5 Fully Underground LRT Alternative ......................................................................... 6 1.3 Contents of this Report ...................................................................................................... 7
2.0 Capital Costs and Revenues .................................................................................................... 9
2.1 Capital Costs ....................................................................................................................... 9 2.1.1 Capital Costs in 2009 Dollars .................................................................................. 9 2.1.2 Capital Costs in YOE Dollars ................................................................................. 13 2.2 Capital Revenue Sources .................................................................................................. 16 2.2.1 Federal Funding Sources ........................................................................................ 19 2.2.2 State Funding Sources ........................................................................................... 21 2.2.3 Local Funding Sources ............................................................................................ 22 2.2.4 Refined Local, State, and Federal Funding Levels ................................................. 25
3.0 Operating And Maintenance Costs & Revenues .................................................................. 27
3.1 O&M Costs ....................................................................................................................... 27 3.2 O&M Revenue Sources .................................................................................................... 29 3.2.1 Farebox Revenues and Farebox Recovery ............................................................. 29 3.2.2 Level of Operating Support from Metro ................................................................. 31 3.2.3 Sources of O&M Funding Sources ......................................................................... 32
4.0 Risks And Uncertainties ......................................................................................................... 37
4.1 Key Risks and Uncertainties ............................................................................................. 37 4.1.1 Availability of Federal Funds ................................................................................. 37 4.1.2 Revenue Risk .......................................................................................................... 38 4.1.3 Construction Cost Risk .......................................................................................... 38 4.1.4 Operating Risk ....................................................................................................... 39 4.2 Strategies to Address Risk ............................................................................................... 39
5.0 Summary Of Key Findings ..................................................................................................... 41
R e g i o n a l C o n n e c t o r T r a n s i t C o r r i d o r
D r a f t F i n a n c i a l A n a l y s i s R e p o r t
Draft Environmental Impact Statement/Environmental Impact Report Page iv
Tables
2-1: Capital Costs Estimates in 2009 Dollars and YOE Dollars ($ in Millions) ............... 9
2-2: Capital Cost Estimates by Alternative, by FTA Standard Cost Category (2009 $ in Millions) ................................................................................................................. 11
2-3: Year of Expenditure Dollar Escalation Rates ............................................................ 13
2-4: Cost Curve Assumptions .......................................................................................... 14
2-5: Capital Costs by Alternative (YOE $ in Millions) ..................................................... 16
2-6: Proposed Sources of Capital Funding (YOE $ in Millions) .................................... 17
2-7: Projected Total and Annual New Starts Funding for the Regional Connector LRT Alternatives: FY 2012 to FY 2018 (YOE $ in Millions) ...................................... 20
3-1: FY 2035 Heavy Rail, Light Rail, and Bus O&M Costs by Alternative (2009 $ in Millions) ...................................................................................................................... 27
3-2: Comparison of FY 2035 O&M Costs to the No Build Alternative (2009 $ in Millions) ...................................................................................................................... 28
3-3: Comparison of FY 2035 O&M Costs to the TSM Alternative (2009 $ in Millions) 29
3-4: FY 2035 Annual Fare Revenues and Farebox Recovery by Alternative (2009 $ in Millions) ...................................................................................................................... 31
3-5: FY 2035 Reduction in Annual Operating Support Relative to the TSM Alternative (2009 $, Millions) ....................................................................................................... 32
3-6: Funding Support for Rail Operations, by Source FY 2019 – FY 2035 (YOE $ in Millions) ...................................................................................................................... 32
Figures
1-1: TSM Alternative ........................................................................................................... 3
1-2: At-Grade Emphasis LRT Alternative ........................................................................... 4
1-3: Underground Emphasis LRT Alternative ................................................................... 5
1-4: Fully Underground LRT Alternative ............................................................................6
R e g i o n a l C o n n e c t o r T r a n s i t C o r r i d o r
D r a f t F i n a n c i a l A n a l y s i s R e p o r t
Draft Environmental Impact Statement/Environmental Impact Report Page v
2-1: Build Alternatives Capital Cost Estimates by Standard Cost Category (2009 $ in Millions) ................................................................................................................. 12
2-2: Annual Capital Costs by Alternative (YOE $ in Millions) ....................................... 15
2-3: Proposed Sources of Capital Funding (YOE $ in Millions) .................................... 19

R e g i o n a l C o n n e c t o r T r a n s i t C o r r i d o r
D r a f t F i n a n c i a l A n a l y s i s R e p o r t
Draft Environmental Impact Statement/Environmental Impact Report Page vii
ACRONYMS AA Alternatives Analysis
CALTRANS California Department of Transportation
CEQA California Environmental Quality Act
CMAQ Congestion Mitigation and Air Quality
EIR Environmental Impact Report
EIS Environmental Impact Statement
FFGA Fully Funded Grant Agreement
FTA Federal Transit Administration
FY Fiscal Year
LONP Letter of No Prejudice
LPA Locally Preferred Alternative
LRT Light Rail Transit
LRTP Long Range Transportation Plan
LTF Local Transportation Fund
Metro Los Angeles County Metropolitan Transportation Authority (LACMTA)
NEPA National Environmental Policy Act
RIP Regional Improvement Program
RTP Regional Transportation Plan
SAFETEA-LU Safe, Accountable, Flexible, Efficient Transportation Equity Act – A Legacy for Users
SCAG Southern California Association of Governments
STA State Transportation Assistance
R e g i o n a l C o n n e c t o r T r a n s i t C o r r i d o r
D r a f t F i n a n c i a l A n a l y s i s R e p o r t
Draft Environmental Impact Statement/Environmental Impact Report Page viii
STIP State Transportation Improvement Plan
STP Surface Transportation Plan
TCRP Traffic Congestion Relief Plan
TIP Transit Improvement Plan
TSM Transportation Management System
YOE Year of Expenditure
R e g i o n a l C o n n e c t o r T r a n s i t C o r r i d o r
D r a f t F i n a n c i a l A n a l y s i s R e p o r t
Draft Environmental Impact Statement/Environmental Impact Report Page 1
1.0 INTRODUCTION The Los Angeles County Metropolitan Transportation Authority (Metro) has completed an Alternatives Analysis (AA) and is moving forward with the preparation of a Draft Environmental Impact Statement/Environmental Impact Report (DEIS/DEIR) for the Regional Connector Transit Corridor project. Metro is serving as the lead agency for purposes of the California Environmental Quality Act (CEQA) environmental clearance, and the Federal Transit Administration (FTA) is serving as lead agency for purposes of the National Environmental Policy Act (NEPA).
The project has been organized into two phases or stages. Stage 1 consists of the AA, including conceptual engineering and preparation of the DEIS/DEIR, which will lead to the selection of a Locally Preferred Alternative (LPA). Stage 2, consists of the preparation of the Final EIS/EIR (FEIS/FEIR). The project will be conducted in accordance with the most recent FTA guidelines for project development and Section 5309 New Starts, and all environmental documentation prepared will satisfy the requirements of NEPA and CEQA.
The Regional Connector Transit Corridor is proposed to create a connection in downtown Los Angeles that will link the Metro Blue Line terminus at the 7th Street/Metro Center LRT Station to the Metro Gold Line Eastside Station at 1st and Alameda streets. This connection will provide through service between the Metro Blue Line, Metro Gold Line Pasadena, Metro Gold Line Eastside, and Metro Exposition Line light rail corridors. With the implementation of the Regional Connector Transit Corridor project, these four lines will link at a station in Downtown Los Angeles. The result of this connection will be enhanced regional connectivity by providing continuing operation from Azusa to Long Beach and Santa Monica to Interstate 605 (I-605) without the need to transfer, thus making it easier for potential riders to get to and from Downtown Los Angeles.
The project area is primarily in the Los Angeles central business district. The 1.6 square mile study area includes Little Tokyo, Central City East, Toy District, Financial Core, Historic Core, Jewelry District, Bunker Hill, Civic Center, and the Fashion District and is bounded by the I-110 freeway to the west and north, Alameda Street to the east, and 9th and 7th Street to the south.
1.1 Purpose of the Financial Report This financial report supports the Stage 1 development of the DEIS/DEIR and the selection of an LPA. The purpose of the financial report is to compare the capital and operating and maintenance (O&M) costs and revenues associated with the alternatives under consideration for the Regional Connector Transit Corridor project. The alternatives being evaluated in the DEIS/DEIR include a No Build, Transportation Systems Management (TSM) and three Build Alternatives. The Build Alternatives reflect an At-Grade Emphasis Light Rail Transit (LRT) Alternative; the Underground Emphasis LRT Alternative and the Fully Underground LRT
R e g i o n a l C o n n e c t o r T r a n s i t C o r r i d o r
D r a f t F i n a n c i a l A n a l y s i s R e p o r t
Draft Environmental Impact Statement/Environmental Impact Report Page 2
Alternative, which includes two alignment variations. Descriptions of the alternatives are provided in Section 1.2.
Following the selection of the LPA and as part of the project Stage 2 activities, the financial analysis will reflect the development of a detailed financial plan for the LPA. The purpose of the detailed financial plan is to document Metro’s financial capacity to construct and operate the Regional Connector consistent with FTA requirements for grants awarded under the Section 5309 New Starts Program. This document will assist the FTA, Metro, other City Officials and the general public in the understanding and evaluation of Metro’s financial capacity to construct the Regional Connector Transit Corridor as well as the agency’s capacity to operate and maintain the existing transit system.
1.2 Description of Alternatives The following provides an overview of the alternatives under consideration in the DEIS/DEIR.
1.2.1 No Build Alternative The No-Build Alternative includes all existing transportation facilities as well as all committed transportation projects outlined in the Metro Long Range Transportation Plan (LRTP) (2009) and the Southern California Association of Governments (SCAG) Regional Transportation Plan (RTP) (2004). This includes the Metro Gold Line Eastside Extension opened in 2009, and the first and second phase of the Metro Exposition Line scheduled to open in 2010. An update to Metro’s LRTP was released for public review in March 2008 and was finalized and approved by Metro’s Board in November 2009. The No Build Alternative would preserve existing service levels, as well as the projects listed in the LRTP and RTP.
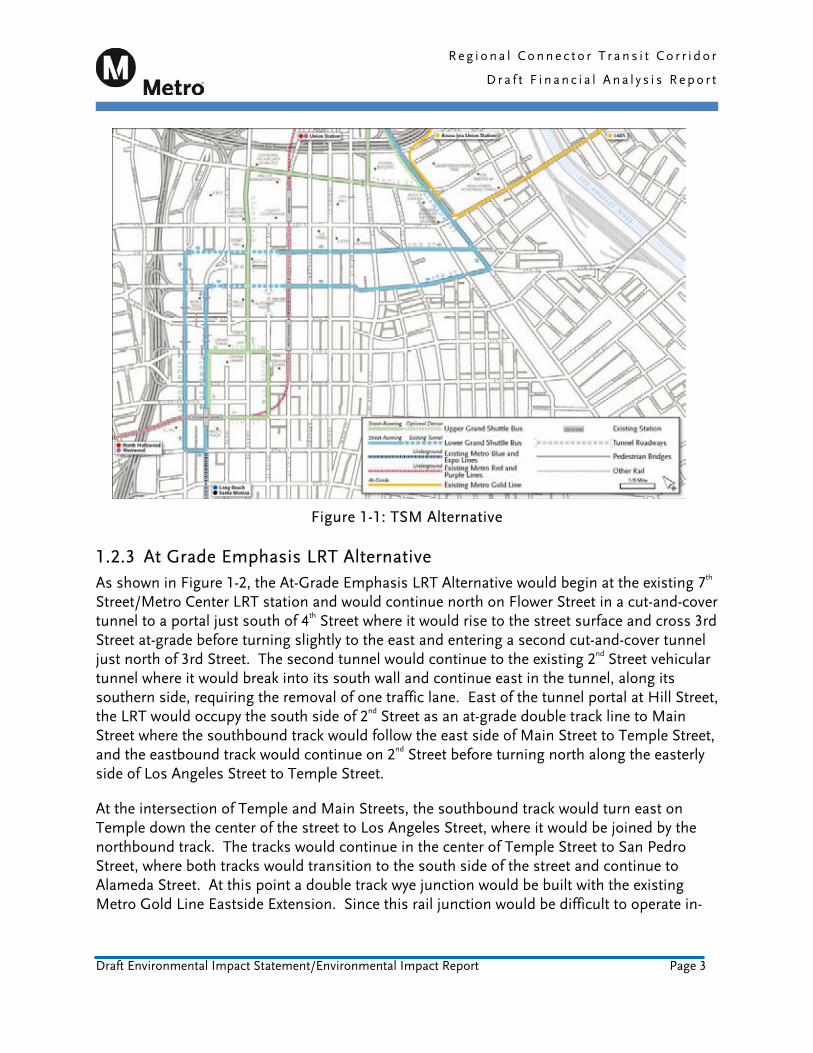
1.2.2 TSM Alternative The TSM Alternative includes all services defined in the No Build Alternative plus two new express shuttle bus lines that would provide frequent service between the 7th Street/Metro Center LRT Station and Union Station (see Figure 1-1). The buses may also have traffic signal priority similar to the Metro Rapid system, where the traffic signal control system grants longer green time to ongoing vehicles. Enhanced transit stops would be located every two to three blocks to maximize coverage of the area surrounding the routes.
R e g i o n a l C o n n e c t o r T r a n s i t C o r r i d o r
D r a f t F i n a n c i a l A n a l y s i s R e p o r t
Draft Environmental Impact Statement/Environmental Impact Report Page 3
Figure 1-1: TSM Alternative
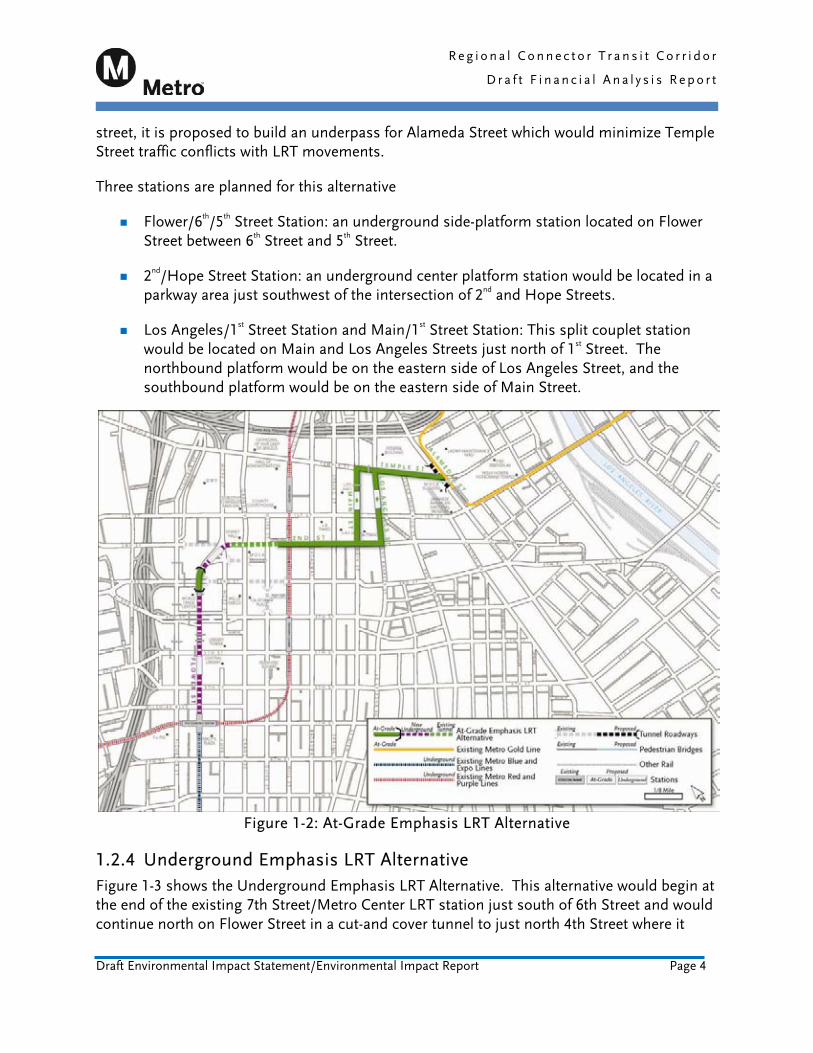
1.2.3 At Grade Emphasis LRT Alternative As shown in Figure 1-2, the At-Grade Emphasis LRT Alternative would begin at the existing 7th Street/Metro Center LRT station and would continue north on Flower Street in a cut-and-cover tunnel to a portal just south of 4th Street where it would rise to the street surface and cross 3rd Street at-grade before turning slightly to the east and entering a second cut-and-cover tunnel just north of 3rd Street. The second tunnel would continue to the existing 2nd Street vehicular tunnel where it would break into its south wall and continue east in the tunnel, along its southern side, requiring the removal of one traffic lane. East of the tunnel portal at Hill Street, the LRT would occupy the south side of 2nd Street as an at-grade double track line to Main Street where the southbound track would follow the east side of Main Street to Temple Street, and the eastbound track would continue on 2nd Street before turning north along the easterly side of Los Angeles Street to Temple Street.
At the intersection of Temple and Main Streets, the southbound track would turn east on Temple down the center of the street to Los Angeles Street, where it would be joined by the northbound track. The tracks would continue in the center of Temple Street to San Pedro Street, where both tracks would transition to the south side of the street and continue to Alameda Street. At this point a double track wye junction would be built with the existing Metro Gold Line Eastside Extension. Since this rail junction would be difficult to operate in-
R e g i o n a l C o n n e c t o r T r a n s i t C o r r i d o r
D r a f t F i n a n c i a l A n a l y s i s R e p o r t
Draft Environmental Impact Statement/Environmental Impact Report Page 4
street, it is proposed to build an underpass for Alameda Street which would minimize Temple Street traffic conflicts with LRT movements.
Three stations are planned for this alternative
Flower/6th/5th Street Station: an underground side-platform station located on Flower Street between 6th Street and 5th Street.
2nd/Hope Street Station: an underground center platform station would be located in a parkway area just southwest of the intersection of 2nd and Hope Streets.
Los Angeles/1st Street Station and Main/1st Street Station: This split couplet station would be located on Main and Los Angeles Streets just north of 1st Street. The northbound platform would be on the eastern side of Los Angeles Street, and the southbound platform would be on the eastern side of Main Street.
Figure 1-2: At-Grade Emphasis LRT Alternative
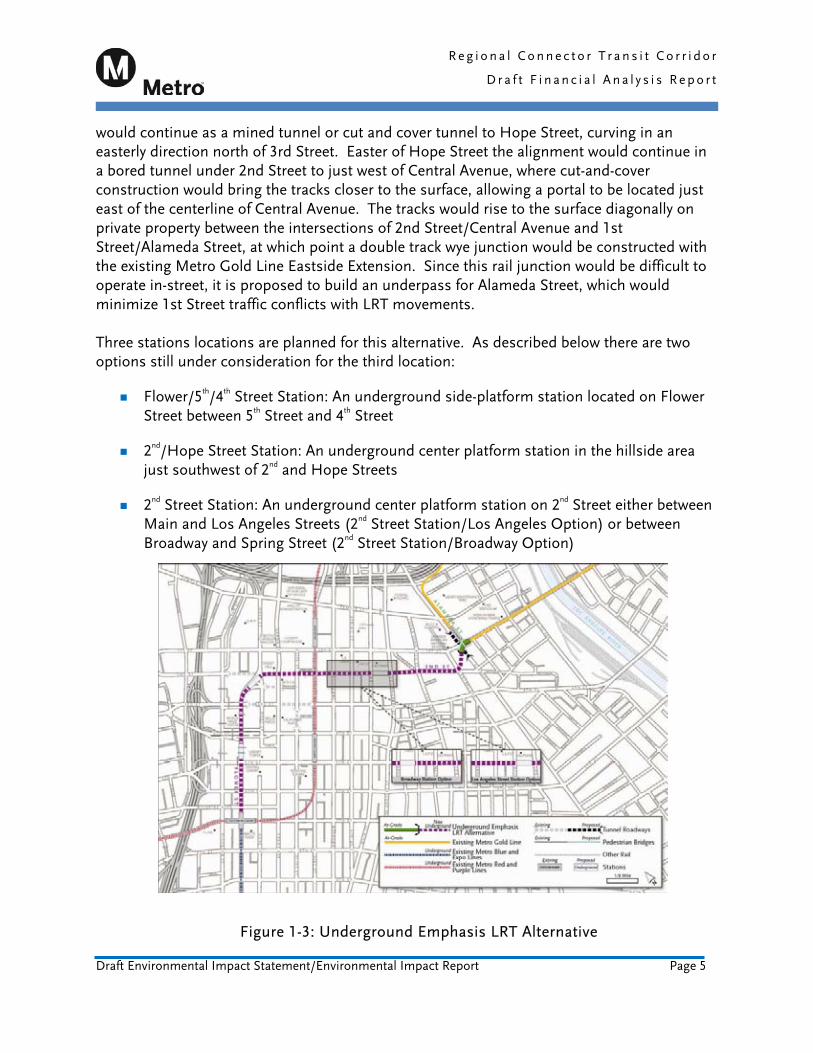
1.2.4 Underground Emphasis LRT Alternative Figure 1-3 shows the Underground Emphasis LRT Alternative. This alternative would begin at the end of the existing 7th Street/Metro Center LRT station just south of 6th Street and would continue north on Flower Street in a cut-and cover tunnel to just north 4th Street where it
R e g i o n a l C o n n e c t o r T r a n s i t C o r r i d o r
D r a f t F i n a n c i a l A n a l y s i s R e p o r t
Draft Environmental Impact Statement/Environmental Impact Report Page 5
would continue as a mined tunnel or cut and cover tunnel to Hope Street, curving in an easterly direction north of 3rd Street. Easter of Hope Street the alignment would continue in a bored tunnel under 2nd Street to just west of Central Avenue, where cut-and-cover construction would bring the tracks closer to the surface, allowing a portal to be located just east of the centerline of Central Avenue. The tracks would rise to the surface diagonally on private property between the intersections of 2nd Street/Central Avenue and 1st Street/Alameda Street, at which point a double track wye junction would be constructed with the existing Metro Gold Line Eastside Extension. Since this rail junction would be difficult to operate in-street, it is proposed to build an underpass for Alameda Street, which would minimize 1st Street traffic conflicts with LRT movements. Three stations locations are planned for this alternative. As described below there are two options still under consideration for the third location:
Flower/5th/4th Street Station: An underground side-platform station located on Flower Street between 5th Street and 4th Street
2nd/Hope Street Station: An underground center platform station in the hillside area just southwest of 2nd and Hope Streets
2nd Street Station: An underground center platform station on 2nd Street either between Main and Los Angeles Streets (2nd Street Station/Los Angeles Option) or between Broadway and Spring Street (2nd Street Station/Broadway Option)
Figure 1-3: Underground Emphasis LRT Alternative
R e g i o n a l C o n n e c t o r T r a n s i t C o r r i d o r
D r a f t F i n a n c i a l A n a l y s i s R e p o r t
Draft Environmental Impact Statement/Environmental Impact Report Page 6
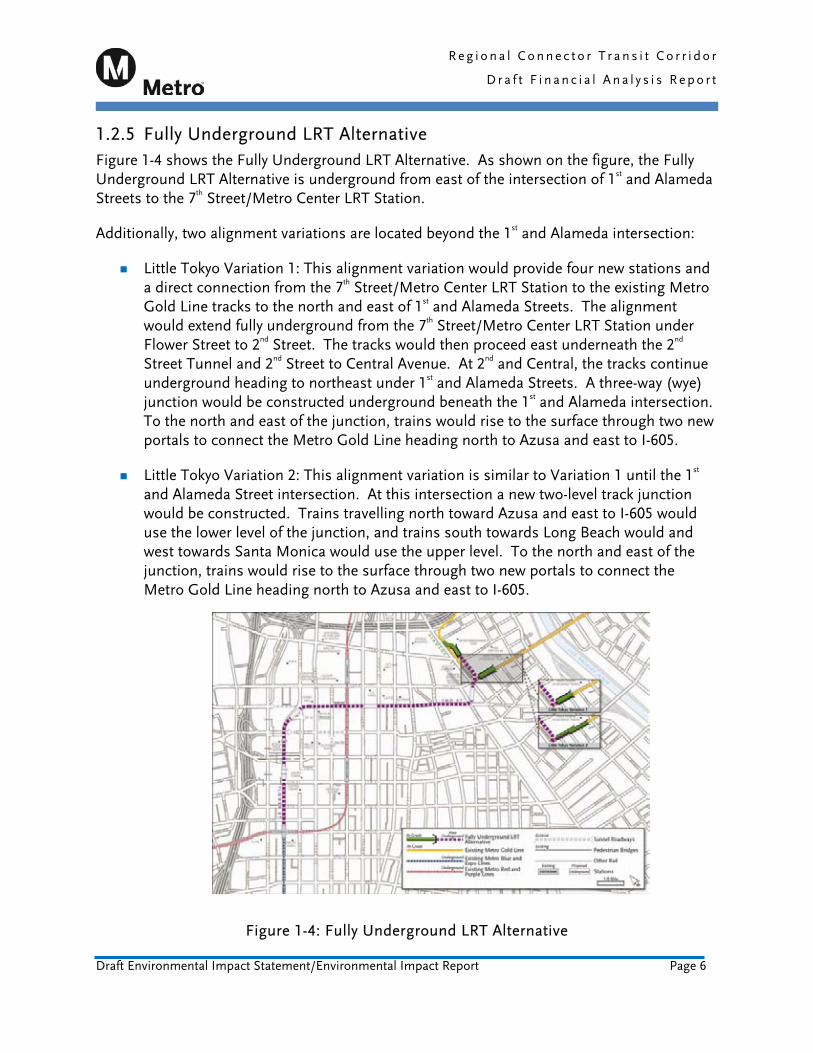
1.2.5 Fully Underground LRT Alternative Figure 1-4 shows the Fully Underground LRT Alternative. As shown on the figure, the Fully Underground LRT Alternative is underground from east of the intersection of 1st and Alameda Streets to the 7th Street/Metro Center LRT Station.
Additionally, two alignment variations are located beyond the 1st and Alameda intersection:
Little Tokyo Variation 1: This alignment variation would provide four new stations and a direct connection from the 7th Street/Metro Center LRT Station to the existing Metro Gold Line tracks to the north and east of 1st and Alameda Streets. The alignment would extend fully underground from the 7th Street/Metro Center LRT Station under Flower Street to 2nd Street. The tracks would then proceed east underneath the 2nd Street Tunnel and 2nd Street to Central Avenue. At 2nd and Central, the tracks continue underground heading to northeast under 1st and Alameda Streets. A three-way (wye) junction would be constructed underground beneath the 1st and Alameda intersection. To the north and east of the junction, trains would rise to the surface through two new portals to connect the Metro Gold Line heading north to Azusa and east to I-605.
Little Tokyo Variation 2: This alignment variation is similar to Variation 1 until the 1st and Alameda Street intersection. At this intersection a new two-level track junction would be constructed. Trains travelling north toward Azusa and east to I-605 would use the lower level of the junction, and trains south towards Long Beach would and west towards Santa Monica would use the upper level. To the north and east of the junction, trains would rise to the surface through two new portals to connect the Metro Gold Line heading north to Azusa and east to I-605.
Figure 1-4: Fully Underground LRT Alternative
R e g i o n a l C o n n e c t o r T r a n s i t C o r r i d o r
D r a f t F i n a n c i a l A n a l y s i s R e p o r t
Draft Environmental Impact Statement/Environmental Impact Report Page 7
1.3 Contents of this Report
The remainder of this report reflects the following:
Section 2 of this report focuses on the capital costs of the alternatives. Costs are presented in both base year and Year of Expenditure (YOE) dollars using annual inflation rates and the project’s current implementation schedule. In order to understand the financial impact of actual funds that would need to be expended in the actual year of expenditure and the relative effects of inflation on costs and revenues, an inflation rate is used to project from base year dollars to YOE dollars. More specifically, YOE dollar values are computed by multiplying base year dollar values by the compounded escalation factor for the year in which funds would be expended. For example, in YOE dollars, $1.00 in 2010 is equivalent to $1.03 in 2011, using an inflation rate of 3.0 percent.
Additionally, the capital costs are presented using FTA’s Standard Cost Categories (SCC). FTA implemented the SCC to establish a consistent format for the reporting, estimating and managing of capital costs for projects that intend to proceed through the New Starts major capital project development process.
Finally, this section describes the federal, State, and local capital revenue sources and funding strategies identified to date for the Regional Connector Transit Corridor project.
Section 3 compares projected O&M costs of the alternatives and projected farebox revenues assuming fares consistent with Metro services and fare payment media. This section also identifies potential system-wide operating savings that could be realized due to improved efficiency of service associated with the selected alternatives. An estimate is also provided of the potential level of operating support required.
Section 4 summarizes key potential risks and uncertainties that could affect project costs and revenues over the course of the refinement of the Regional Connector financial plan.
Section 5 reviews key findings of the DEIS/DEIR financial analysis and highlights the differences among the alternatives.

R e g i o n a l C o n n e c t o r T r a n s i t C o r r i d o r
D r a f t F i n a n c i a l A n a l y s i s R e p o r t
Draft Environmental Impact Statement/Environmental Impact Report Page 9
2.0 CAPITAL COSTS AND REVENUES This section describes the capital costs of the alternatives and the federal, State, and local revenue sources proposed.
2.1 Capital Costs Capital costs of the alternatives were estimated based on concept drawings developed in 2009 dollars to an approximate 10 percent level of engineering completion. Where the level of design does not support quantity measurements, parametric estimating techniques were utilized. Detail on capital cost estimation is provided in the Regional Connector Transit Corridor: Final Capital Cost Estimate Report dated April 12, 2010.
As shown in Table 2-1, capital costs are presented in 2009 constant dollars and in Year of Expenditure dollars inclusive of inflation. The capital costs of the alternatives range from $67.3 million ($80.0 million in YOE dollars) for the TSM Alternative to $1,360.2 million ($1,575.8 million in YOE dollars) for the Fully Underground LRT Alternative – Little Tokyo Variation 2. The YOE cost for the TSM and Build Alternatives reflect the implementation plan assumed in the LRTP. As the Regional Connector’s LPA moves through the FTA’s major capital project development process the costs and implementation schedule will be further refined.
Table 2-1: Capital Costs Estimates in 2009 Dollars and YOE Dollars ($ in Millions)
Alternative 2009 Dollars YOE Dollars
TSM $67.3 $80.0
At Grade Emphasis $899.2 $1,042.2
Underground Emphasis $1,120.1 $1,297.0
Fully Underground Little Tokyo - Variation 1 $1,245.2 $1,442.0
Fully Underground Little Tokyo - Variation 2 $1,360.2 $1,575.8
2.1.1 Capital Costs in 2009 Dollars Table 2 and Figure 5 present the capital costs of the alternatives in 2009 dollars using the FTA’s Standard Cost Categories. FTA requires submission of capital costs in the SCC format at key milestones in the major capital project development process, including the application to enter Preliminary Engineering, which will follow selection of the LPA.
R e g i o n a l C o n n e c t o r T r a n s i t C o r r i d o r
D r a f t F i n a n c i a l A n a l y s i s R e p o r t
Draft Environmental Impact Statement/Environmental Impact Report Page 10
FTA’s ten required cost categories are:
10 Guideway and Track Elements
20 Stations, Stops, Terminals, Intermodal
30 Support Facilities: Yards, Shops, Administration Buildings
40 Sitework and Special Conditions (removal of structures or existing trackwork, utility relocations, roadway modifications, and environmental mitigation)
50 Systems (overhead catenaries and communication infrastructure)
60 Row, Land, Existing Improvements
70 Vehicles
80 Professional Services
90 Unallocated Contingency
100 Finance Charges
Cost categories 10 through 60 are the construction and right of way elements associated with each alternative. Category 70 is the cost of vehicles and includes buses (TSM Alternative) and/or light rail vehicles (Build Alternatives). Categories 80 through 100 represent “soft costs.” These costs include allowances for Professional Services (Category 80) such as engineering and design, construction management, agency program management, project management oversight, project implementation, and training/start-up/testing. The allowances are computed by applying a percentage to the total construction cost estimated for each cost category (Categories 10 through 50). The Unallocated Contingency (Category 90) is an overall project contingency, which is typically higher during the early stage of project development and decreases as more detailed planning and engineering is completed. Finally, Finance Charges (Category 100) are estimated if the financial plan for the project includes the issuance of bonds. At this point in the project development process no financing charges have been assumed at this time.
R e g i o n a l C o n n e c t o r T r a n s i t C o r r i d o r
D r a f t F i n a n c i a l A n a l y s i s R e p o r t
Draft Environmental Impact Statement/Environmental Impact Report Page 11
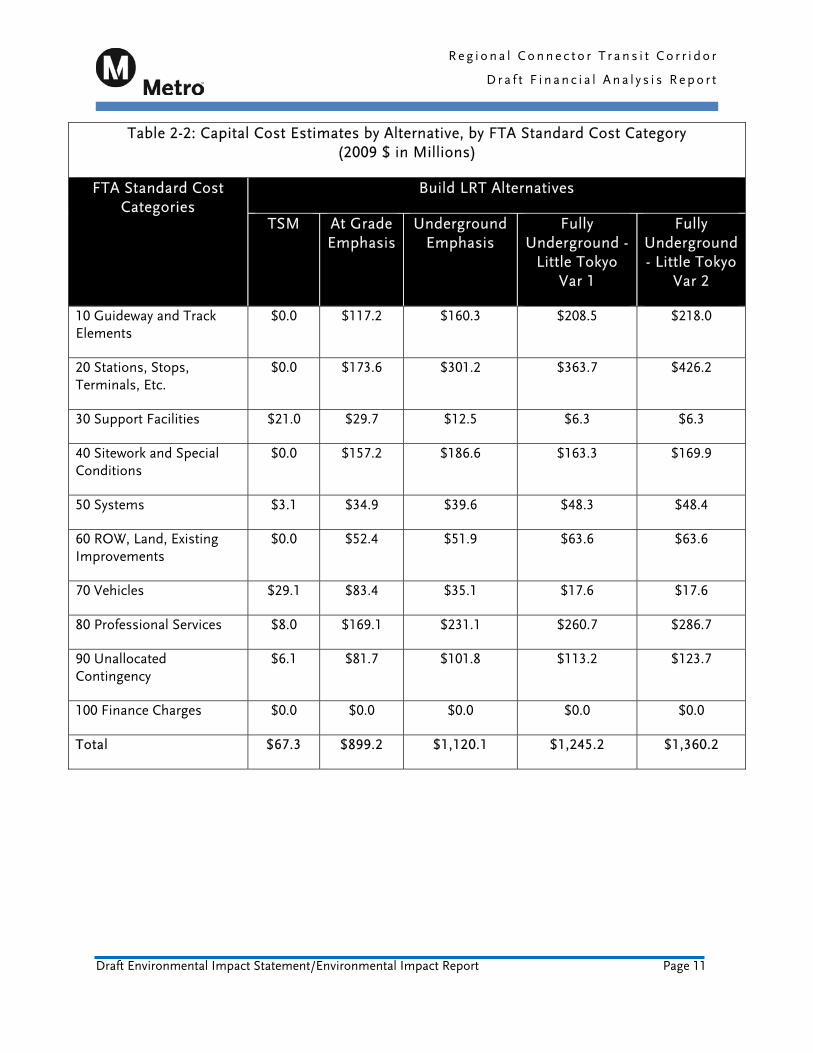
Table 2-2: Capital Cost Estimates by Alternative, by FTA Standard Cost Category (2009 $ in Millions)
FTA Standard Cost Categories
Build LRT Alternatives
TSM At Grade Emphasis
Underground Emphasis
Fully Underground -
Little Tokyo Var 1
Fully Underground - Little Tokyo
Var 2
10 Guideway and Track Elements
$0.0 $117.2 $160.3 $208.5 $218.0
20 Stations, Stops, Terminals, Etc.
$0.0 $173.6 $301.2 $363.7 $426.2
30 Support Facilities $21.0 $29.7 $12.5 $6.3 $6.3
40 Sitework and Special Conditions
$0.0 $157.2 $186.6 $163.3 $169.9
50 Systems $3.1 $34.9 $39.6 $48.3 $48.4
60 ROW, Land, Existing Improvements
$0.0 $52.4 $51.9 $63.6 $63.6
70 Vehicles $29.1 $83.4 $35.1 $17.6 $17.6
80 Professional Services $8.0 $169.1 $231.1 $260.7 $286.7
90 Unallocated Contingency
$6.1 $81.7 $101.8 $113.2 $123.7
100 Finance Charges $0.0 $0.0 $0.0 $0.0 $0.0
Total $67.3 $899.2 $1,120.1 $1,245.2 $1,360.2
R e g i o n a l C o n n e c t o r T r a n s i t C o r r i d o r
D r a f t F i n a n c i a l A n a l y s i s R e p o r t
Draft Environmental Impact Statement/Environmental Impact Report Page 12
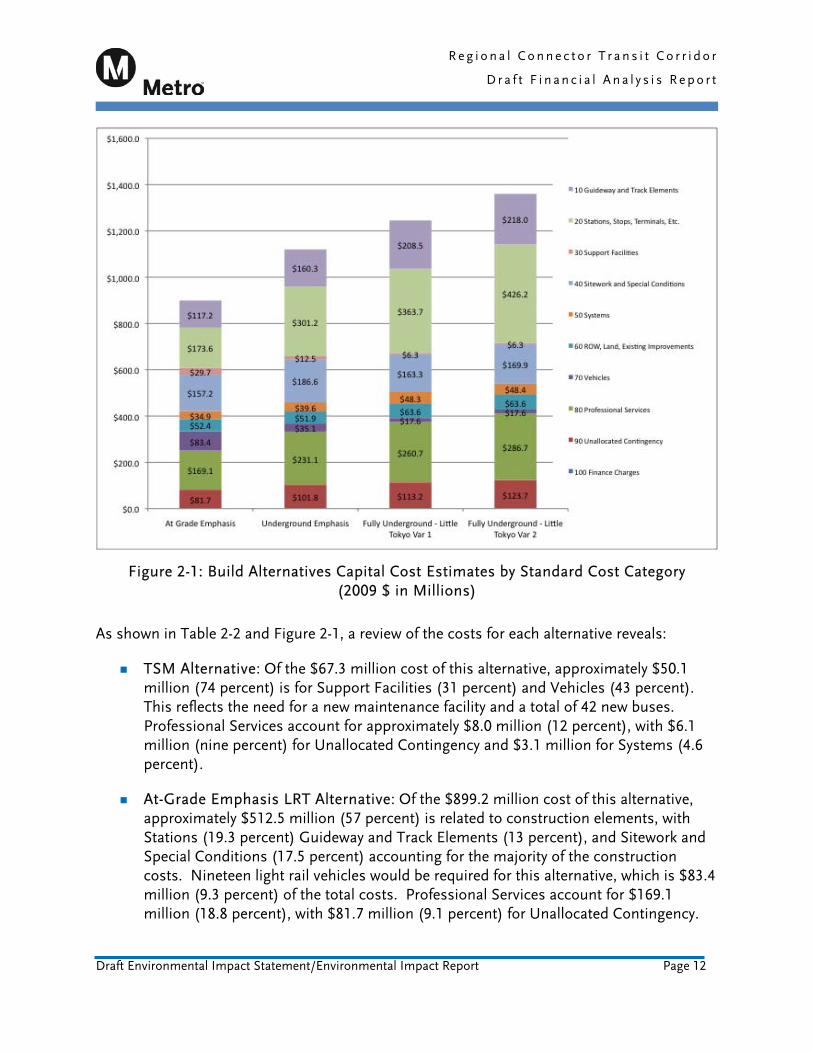
Figure 2-1: Build Alternatives Capital Cost Estimates by Standard Cost Category (2009 $ in Millions)
As shown in Table 2-2 and Figure 2-1, a review of the costs for each alternative reveals:
TSM Alternative: Of the $67.3 million cost of this alternative, approximately $50.1 million (74 percent) is for Support Facilities (31 percent) and Vehicles (43 percent). This reflects the need for a new maintenance facility and a total of 42 new buses. Professional Services account for approximately $8.0 million (12 percent), with $6.1 million (nine percent) for Unallocated Contingency and $3.1 million for Systems (4.6 percent).
At-Grade Emphasis LRT Alternative: Of the $899.2 million cost of this alternative, approximately $512.5 million (57 percent) is related to construction elements, with Stations (19.3 percent) Guideway and Track Elements (13 percent), and Sitework and Special Conditions (17.5 percent) accounting for the majority of the construction costs. Nineteen light rail vehicles would be required for this alternative, which is $83.4 million (9.3 percent) of the total costs. Professional Services account for $169.1 million (18.8 percent), with $81.7 million (9.1 percent) for Unallocated Contingency.
R e g i o n a l C o n n e c t o r T r a n s i t C o r r i d o r
D r a f t F i n a n c i a l A n a l y s i s R e p o r t
Draft Environmental Impact Statement/Environmental Impact Report Page 13
Underground Emphasis LRT Alternative: Similar to the At Grade Emphasis Alternative, of the $1,120.0 million cost of this alternative, approximately $700.2 million (63 percent) is related to construction, with Stations (26.9 percent), Guideway and Track (14.3 percent), and Sitework and Special Conditions (16 percent) accounting for the majority of the construction costs. Eight light rail vehicles would be required for this alternative at a cost of $35.1 million (3.1 percent) of the total costs. Professional Services account for $231.1 million (20.6 percent), with $101.8 million (9.1 percent) for Unallocated Contingency.
Fully Underground LRT Alternative – Little Tokyo Variation 1: Of the $1,245.2 million cost of this alternative, $790.1 million (63 percent) is related to construction, with Stations (29.2 percent), Guideway and Track (16.7 percent), and Sitework and Special Conditions (13 percent) accounting for the majority of the construction costs. Four light rail vehicles would be required for this alternative, which is $17.6 million (1.4 percent) of total costs. Professional Services account for $260.7 (20.9 percent), with $113.2 million (9.1 percent) for Unallocated Contingency.
Fully Underground LRT Alternative – Little Tokyo Variation 2: Of the $1,360.2 million cost of this alternative, $868.7 million (64 percent) is related to construction, with Stations (31.3 percent), Guideway and Track (16 percent), and Sitework and Special Conditions (12.5 percent) accounting for the majority of the construction costs. Four light rail vehicles would be required for this alternative, which is $17.6 million (1.3 percent) of total costs. Professional Services account for $286.7 (21.1 percent), with $123.7 million (9.1 percent) for Unallocated Contingency.
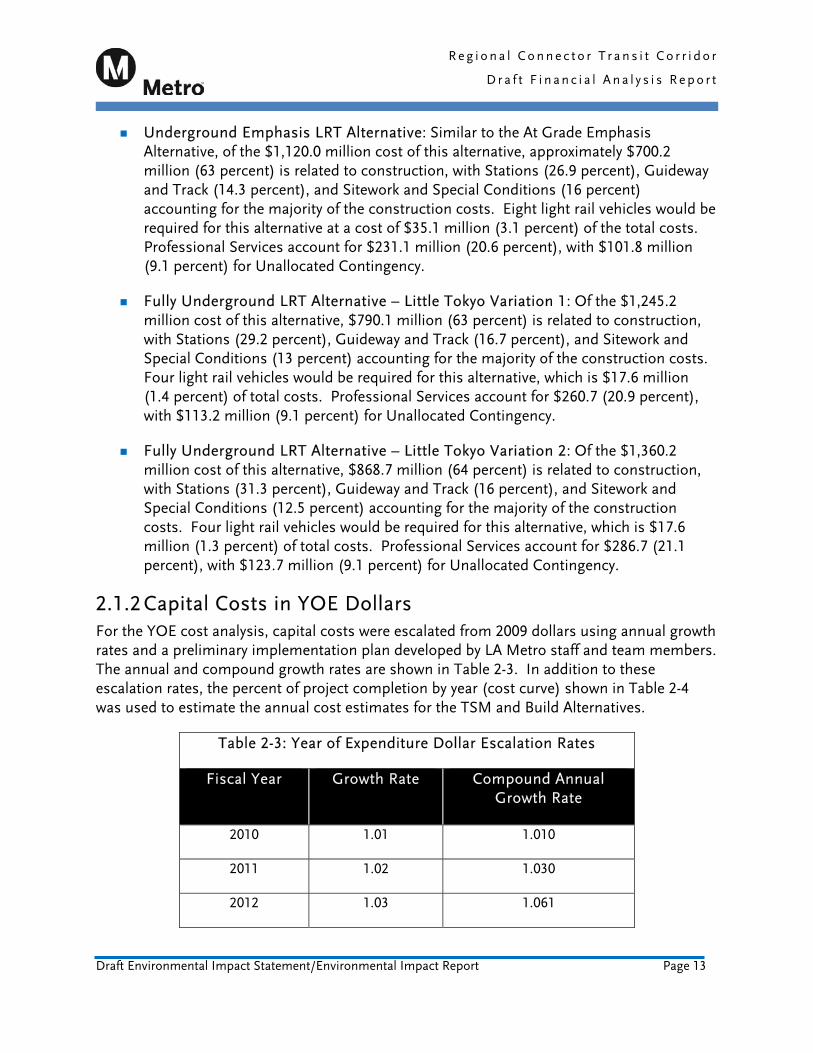
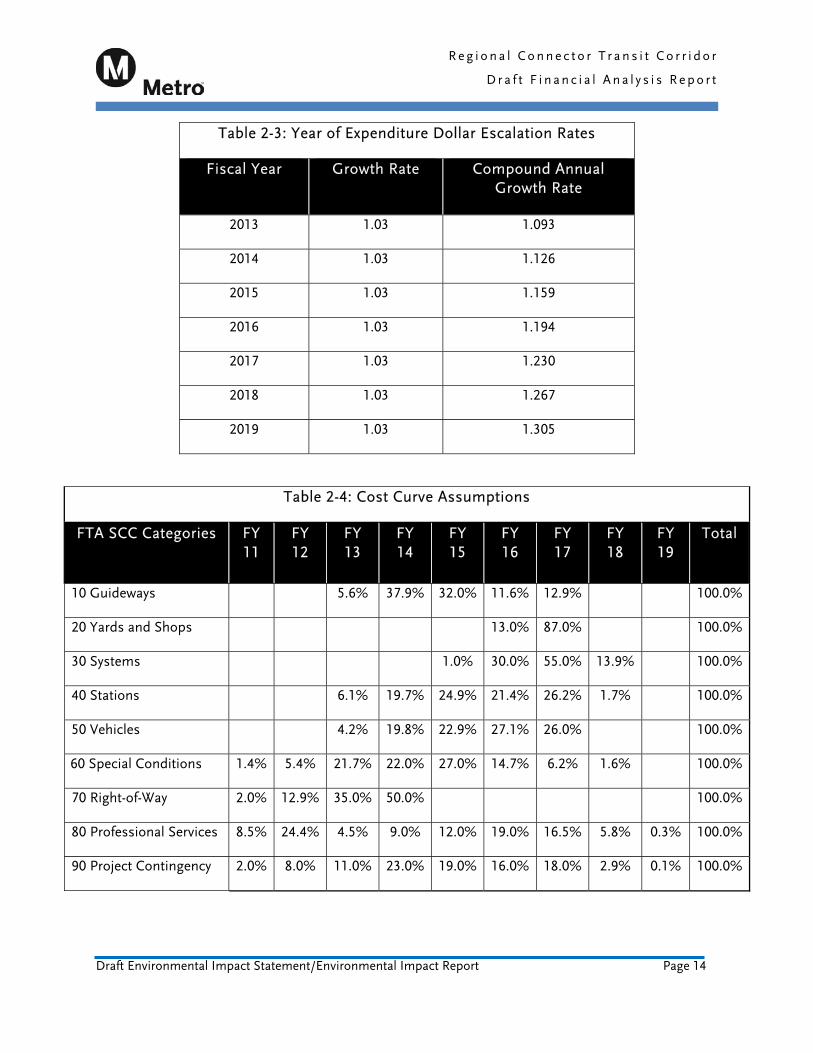
2.1.2 Capital Costs in YOE Dollars For the YOE cost analysis, capital costs were escalated from 2009 dollars using annual growth rates and a preliminary implementation plan developed by LA Metro staff and team members. The annual and compound growth rates are shown in Table 2-3. In addition to these escalation rates, the percent of project completion by year (cost curve) shown in Table 2-4 was used to estimate the annual cost estimates for the TSM and Build Alternatives.
Table 2-3: Year of Expenditure Dollar Escalation Rates
Fiscal Year Growth Rate Compound Annual Growth Rate
2010 1.01 1.010
2011 1.02 1.030
2012 1.03 1.061
R e g i o n a l C o n n e c t o r T r a n s i t C o r r i d o r
D r a f t F i n a n c i a l A n a l y s i s R e p o r t
Draft Environmental Impact Statement/Environmental Impact Report Page 14
Table 2-3: Year of Expenditure Dollar Escalation Rates
Fiscal Year Growth Rate Compound Annual Growth Rate
2013 1.03 1.093
2014 1.03 1.126
2015 1.03 1.159
2016 1.03 1.194
2017 1.03 1.230
2018 1.03 1.267
2019 1.03 1.305
Table 2-4: Cost Curve Assumptions
FTA SCC Categories FY 11
FY 12
FY 13
FY 14
FY 15
FY 16
FY 17
FY 18
FY 19
Total
10 Guideways 5.6% 37.9% 32.0% 11.6% 12.9% 100.0%
20 Yards and Shops 13.0% 87.0% 100.0%
30 Systems 1.0% 30.0% 55.0% 13.9% 100.0%
40 Stations 6.1% 19.7% 24.9% 21.4% 26.2% 1.7% 100.0%
50 Vehicles 4.2% 19.8% 22.9% 27.1% 26.0% 100.0%
60 Special Conditions 1.4% 5.4% 21.7% 22.0% 27.0% 14.7% 6.2% 1.6% 100.0%
70 Right-of-Way 2.0% 12.9% 35.0% 50.0% 100.0%
80 Professional Services 8.5% 24.4% 4.5% 9.0% 12.0% 19.0% 16.5% 5.8% 0.3% 100.0%
90 Project Contingency 2.0% 8.0% 11.0% 23.0% 19.0% 16.0% 18.0% 2.9% 0.1% 100.0%
R e g i o n a l C o n n e c t o r T r a n s i t C o r r i d o r
D r a f t F i n a n c i a l A n a l y s i s R e p o r t
Draft Environmental Impact Statement/Environmental Impact Report Page 15
$0
$50
$100
$150
$200
$250
$300
$350
2011 2012 2013 2014 2015 2016 2017 2018 2019
TSM At Grade Emphasis Underground Emphasis Fully Underground Variation 1 Fully Underground Variation 2
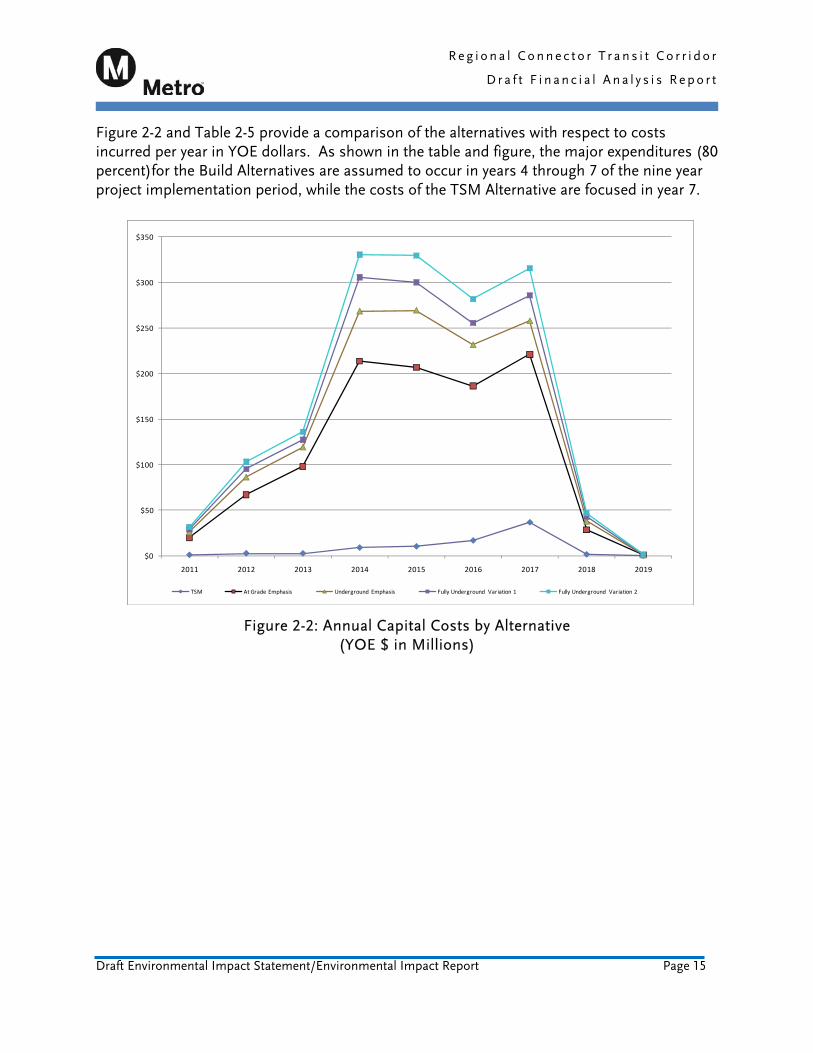
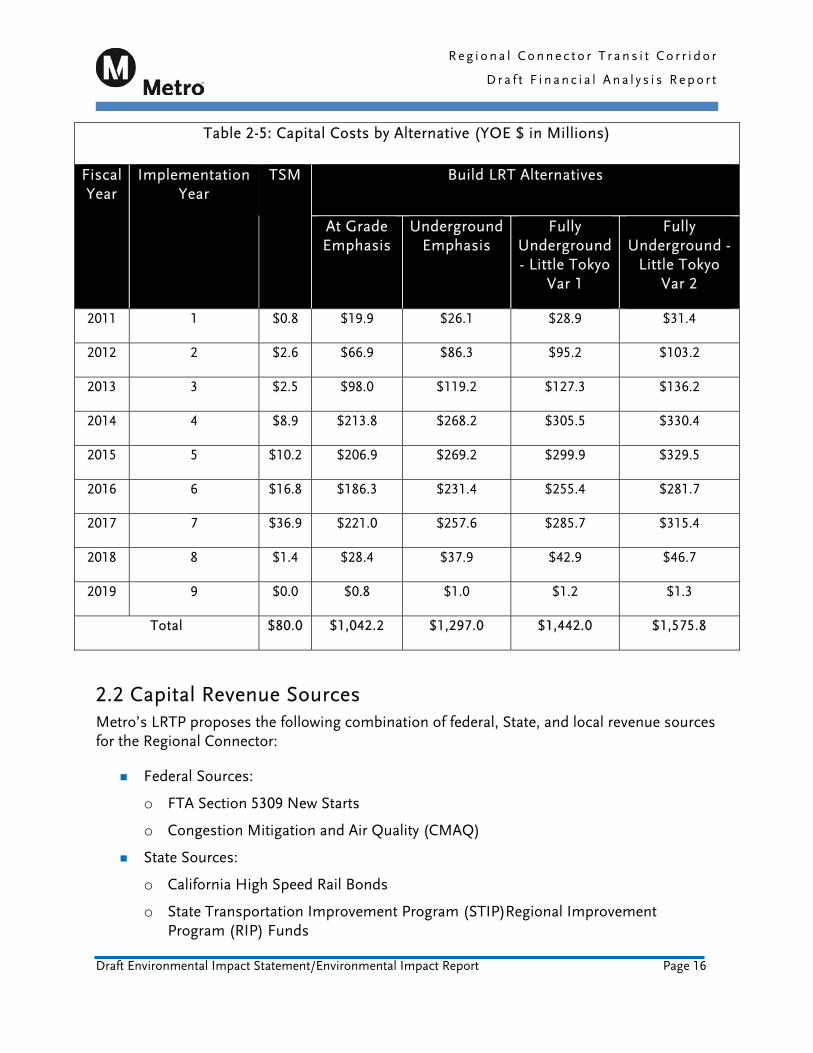
Figure 2-2 and Table 2-5 provide a comparison of the alternatives with respect to costs incurred per year in YOE dollars. As shown in the table and figure, the major expenditures (80 percent)for the Build Alternatives are assumed to occur in years 4 through 7 of the nine year project implementation period, while the costs of the TSM Alternative are focused in year 7.
Figure 2-2: Annual Capital Costs by Alternative (YOE $ in Millions)
R e g i o n a l C o n n e c t o r T r a n s i t C o r r i d o r
D r a f t F i n a n c i a l A n a l y s i s R e p o r t
Draft Environmental Impact Statement/Environmental Impact Report Page 16
Table 2-5: Capital Costs by Alternative (YOE $ in Millions)
Fiscal Year
Implementation Year
TSM Build LRT Alternatives
At Grade Emphasis
Underground Emphasis
Fully Underground - Little Tokyo
Var 1
Fully Underground -
Little Tokyo Var 2
2011 1 $0.8 $19.9 $26.1 $28.9 $31.4
2012 2 $2.6 $66.9 $86.3 $95.2 $103.2
2013 3 $2.5 $98.0 $119.2 $127.3 $136.2
2014 4 $8.9 $213.8 $268.2 $305.5 $330.4
2015 5 $10.2 $206.9 $269.2 $299.9 $329.5
2016 6 $16.8 $186.3 $231.4 $255.4 $281.7
2017 7 $36.9 $221.0 $257.6 $285.7 $315.4
2018 8 $1.4 $28.4 $37.9 $42.9 $46.7
2019 9 $0.0 $0.8 $1.0 $1.2 $1.3
Total $80.0 $1,042.2 $1,297.0 $1,442.0 $1,575.8
2.2 Capital Revenue Sources Metro’s LRTP proposes the following combination of federal, State, and local revenue sources for the Regional Connector:
Federal Sources:
o FTA Section 5309 New Starts
o Congestion Mitigation and Air Quality (CMAQ)
State Sources:
o California High Speed Rail Bonds
o State Transportation Improvement Program (STIP)Regional Improvement Program (RIP) Funds
R e g i o n a l C o n n e c t o r T r a n s i t C o r r i d o r
D r a f t F i n a n c i a l A n a l y s i s R e p o r t
Draft Environmental Impact Statement/Environmental Impact Report Page 17
Local Sources
o Measure R Sales Tax
o Lease Revenue
o Letter of No Prejudice (LONP) Reimbursement Fund
o Local Agency Funds
Additional Local, State and Federal Funding Levels
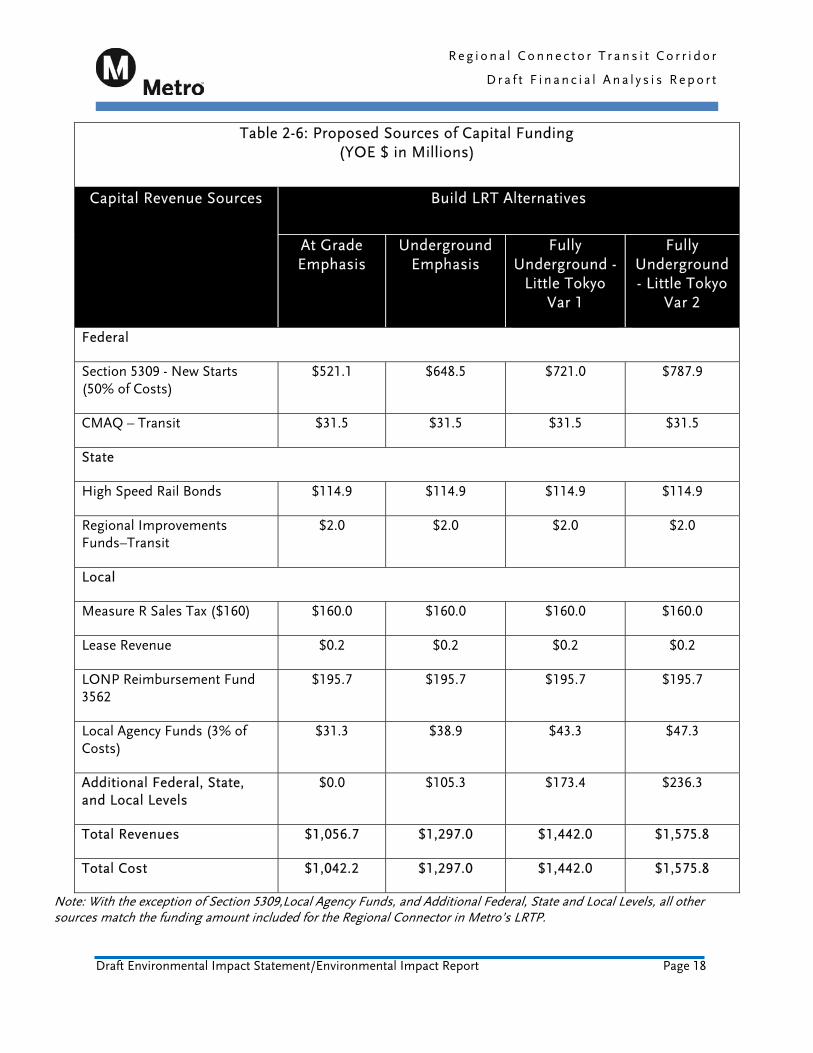
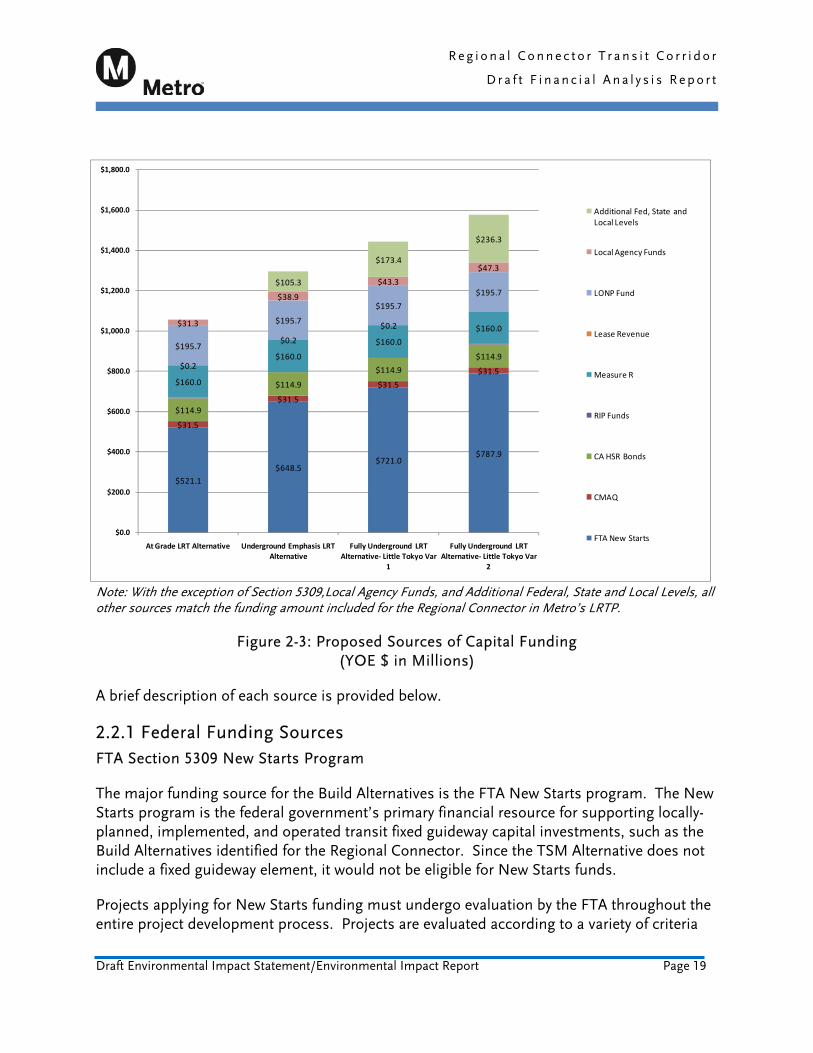
Table 2-6 and Figure 2-3 summarize the composition of funding proposed from each source. In order of contribution, FTA Section 5309 New Starts funding is the largest source and is proposed to fund 50 percent of the cost of each alternative. LONP Reimbursement funds is the second largest source, followed by Measure R, High Speed Rail bond proceeds, Local Agency Funds, and CMAQ, with minor contributions from lease revenues and STIP RIP funds. As shown in the table and figure, additional revenues will need to be identified to fully fund the most recent capital cost estimates of the Build Alternatives. The required revenues range from $105.3 million for the At Grade Emphasis LRT Alternative to $236.3 million for the Fully Underground LRT Alternative – Little Tokyo Variation 2.
R e g i o n a l C o n n e c t o r T r a n s i t C o r r i d o r
D r a f t F i n a n c i a l A n a l y s i s R e p o r t
Draft Environmental Impact Statement/Environmental Impact Report Page 18
Table 2-6: Proposed Sources of Capital Funding (YOE $ in Millions)
Capital Revenue Sources Build LRT Alternatives
At Grade Emphasis
Underground Emphasis
Fully Underground -
Little Tokyo Var 1
Fully Underground - Little Tokyo
Var 2
Federal
Section 5309 - New Starts (50% of Costs)
$521.1 $648.5 $721.0 $787.9
CMAQ – Transit $31.5 $31.5 $31.5 $31.5
State
High Speed Rail Bonds $114.9 $114.9 $114.9 $114.9
Regional Improvements Funds–Transit
$2.0 $2.0 $2.0 $2.0
Local
Measure R Sales Tax ($160) $160.0 $160.0 $160.0 $160.0
Lease Revenue $0.2 $0.2 $0.2 $0.2
LONP Reimbursement Fund 3562
$195.7 $195.7 $195.7 $195.7
Local Agency Funds (3% of Costs)
$31.3 $38.9 $43.3 $47.3
Additional Federal, State, and Local Levels
$0.0 $105.3 $173.4 $236.3
Total Revenues $1,056.7 $1,297.0 $1,442.0 $1,575.8
Total Cost $1,042.2 $1,297.0 $1,442.0 $1,575.8
Note: With the exception of Section 5309,Local Agency Funds, and Additional Federal, State and Local Levels, all other sources match the funding amount included for the Regional Connector in Metro’s LRTP.
R e g i o n a l C o n n e c t o r T r a n s i t C o r r i d o r
D r a f t F i n a n c i a l A n a l y s i s R e p o r t
Draft Environmental Impact Statement/Environmental Impact Report Page 19
$521.1
$648.5$721.0
$787.9
$31.5
$31.5
$31.5
$31.5
$114.9
$114.9
$114.9
$114.9
$160.0
$160.0
$160.0
$160.0
$0.2
$0.2
$0.2
$195.7
$195.7
$195.7
$195.7
$31.3
$38.9
$43.3
$47.3
$105.3
$173.4
$236.3
$0.0
$200.0
$400.0
$600.0
$800.0
$1,000.0
$1,200.0
$1,400.0
$1,600.0
$1,800.0
At Grade LRT Alternative Underground Emphasis LRT Alternative
Fully Underground LRT Alternative‐ Little Tokyo Var
1
Fully Underground LRT Alternative‐ Little Tokyo Var
2
Additional Fed, State and Local Levels
Local Agency Funds
LONP Fund
Lease Revenue
Measure R
RIP Funds
CA HSR Bonds
CMAQ
FTA New Starts
Note: With the exception of Section 5309,Local Agency Funds, and Additional Federal, State and Local Levels, all other sources match the funding amount included for the Regional Connector in Metro’s LRTP.
Figure 2-3: Proposed Sources of Capital Funding (YOE $ in Millions)
A brief description of each source is provided below.
2.2.1 Federal Funding Sources FTA Section 5309 New Starts Program
The major funding source for the Build Alternatives is the FTA New Starts program. The New Starts program is the federal government’s primary financial resource for supporting locally-planned, implemented, and operated transit fixed guideway capital investments, such as the Build Alternatives identified for the Regional Connector. Since the TSM Alternative does not include a fixed guideway element, it would not be eligible for New Starts funds.
Projects applying for New Starts funding must undergo evaluation by the FTA throughout the entire project development process. Projects are evaluated according to a variety of criteria
R e g i o n a l C o n n e c t o r T r a n s i t C o r r i d o r
D r a f t F i n a n c i a l A n a l y s i s R e p o r t
Draft Environmental Impact Statement/Environmental Impact Report Page 20
such as mobility improvements, environmental benefits, cost-effectiveness, operating efficiencies, transit supportive land use, and local financial capacity.
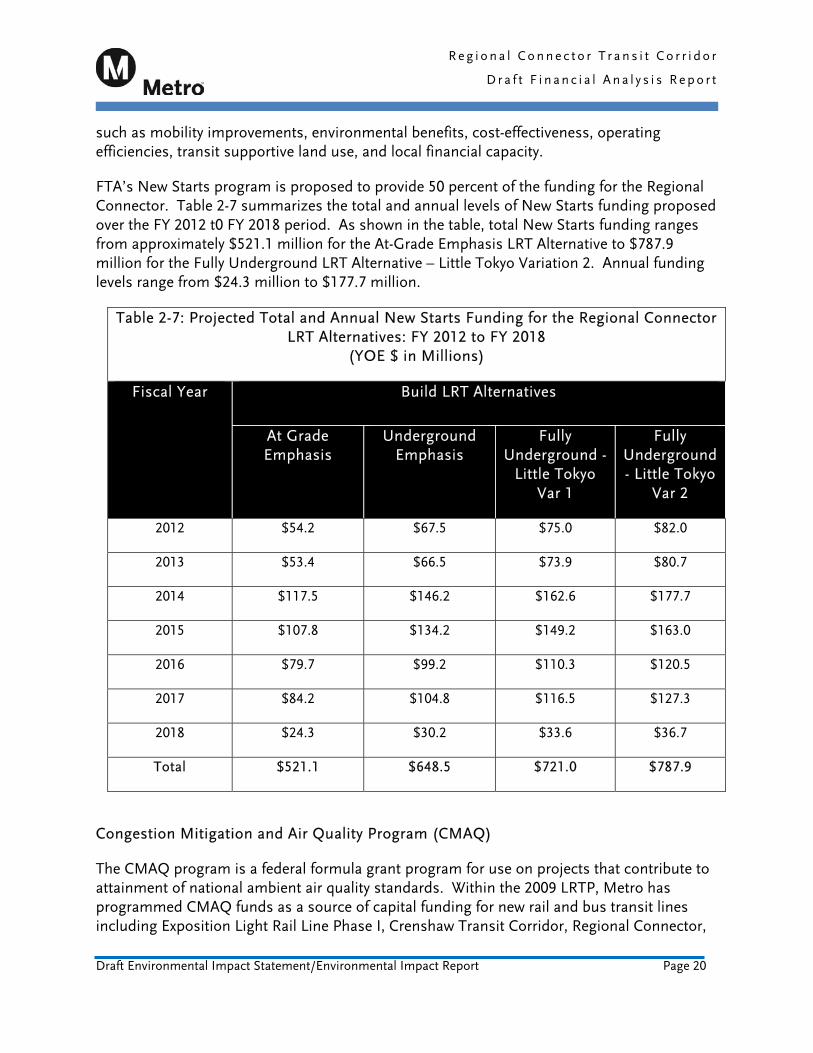
FTA’s New Starts program is proposed to provide 50 percent of the funding for the Regional Connector. Table 2-7 summarizes the total and annual levels of New Starts funding proposed over the FY 2012 t0 FY 2018 period. As shown in the table, total New Starts funding ranges from approximately $521.1 million for the At-Grade Emphasis LRT Alternative to $787.9 million for the Fully Underground LRT Alternative – Little Tokyo Variation 2. Annual funding levels range from $24.3 million to $177.7 million.
Table 2-7: Projected Total and Annual New Starts Funding for the Regional Connector LRT Alternatives: FY 2012 to FY 2018
(YOE $ in Millions)
Fiscal Year Build LRT Alternatives
At Grade Emphasis
Underground Emphasis
Fully Underground -
Little Tokyo Var 1
Fully Underground - Little Tokyo
Var 2
2012 $54.2 $67.5 $75.0 $82.0
2013 $53.4 $66.5 $73.9 $80.7
2014 $117.5 $146.2 $162.6 $177.7
2015 $107.8 $134.2 $149.2 $163.0
2016 $79.7 $99.2 $110.3 $120.5
2017 $84.2 $104.8 $116.5 $127.3
2018 $24.3 $30.2 $33.6 $36.7
Total $521.1 $648.5 $721.0 $787.9
Congestion Mitigation and Air Quality Program (CMAQ)
The CMAQ program is a federal formula grant program for use on projects that contribute to attainment of national ambient air quality standards. Within the 2009 LRTP, Metro has programmed CMAQ funds as a source of capital funding for new rail and bus transit lines including Exposition Light Rail Line Phase I, Crenshaw Transit Corridor, Regional Connector,
R e g i o n a l C o n n e c t o r T r a n s i t C o r r i d o r
D r a f t F i n a n c i a l A n a l y s i s R e p o r t
Draft Environmental Impact Statement/Environmental Impact Report Page 21
rail system improvements, rail fleet procurement and for Metro Bus and Metro Rapid Bus projects. CMAQ is also programmed for rail and bus operations and can be used for the first three years of operation of individual new rail and bus projects.
The Regional Connector is programmed to receive $31.5 million in CMAQ funds. These funds are projected to be received over three years, with $28.9 million proposed in FY 2017, $2.6 million in FY 2018, and $0.1 million in FY 2019.
2.2.2 State Funding Sources
Safe, Reliable High Speed Rail Passenger Train Bond for the 21st Century (AB 3034):
As approved by California voters in November 2008, the high-speed rail bond allows for $9.95 billion of general obligation bonds to be issued for the California high speed rail project Of the $9.95 billion, $9.0 billion dollars is designated to provide a portion of the local share of funding for the first segment of the high speed rail network which is Los Angeles Union Station to San Francisco’s Transbay Terminal.
The remaining $950.0 million has been designated for capital projects to connect existing passenger rail lines to the high-speed rail system as well as to enhance capacity and improve safety. The $950.0 million is proposed to be allocated to the following programs:
Twenty percent ($190.0 million) will be allocated to the Department of Transportation for state supported intercity rail lines that provide regular service and operate and maintain their rail facilities, right of way and equipment with public funds. A minimum of 25 percent of the $190.0 million, approximately $47.5 million, will be allocated to California’s three intercity rail corridors.
Eighty percent ($760.0 million) will be allocated upon appropriation to eligible recipients according to the percent amount calculated of the following provisions:
o One third of the eligible recipient’s share of statewide track miles
o One third of the eligible recipient’s percentage share of statewide annual vehicle miles
o One-third of the eligible recipient’s percentage share of statewide annual passenger trips
Metro’s LRTP assumes Metro will receive a total of $240.9 million in High Speed Rail Bond proceeds. Of this total, $114.9 million is proposed to be available for the Regional Connector, with $102.2 million in funding proposed in FY 2014 and $12.7 million in FY 2015. The remaining $126.0 million is proposed for improvements to the Metrolink commuter rail system.
R e g i o n a l C o n n e c t o r T r a n s i t C o r r i d o r
D r a f t F i n a n c i a l A n a l y s i s R e p o r t
Draft Environmental Impact Statement/Environmental Impact Report Page 22
Regional Improvement Program (RIP)
The State’s funding for transportation is programmed in the State Transportation Improvement Program (STIP). Within the STIP, 75 percent of the funding is allocated and programmed by the regional transportation planning agencies such as Metro under the Regional Improvement Program (RIP). The remaining 25 percent is programmed by the State under the Interregional Improvement Program. The primary source of RIP funding is the federal Surface Transportation Program (STP).
Based on a fund estimate prepared by Caltrans, the California Transportation Commission develops the annual RIP programming targets for each agency. Metro selects and programs the projects to be funded through its Call for Projects process and the Metro Long and Short Range Transportation Plans. Metro has programmed and re-programmed its STIP projects to conform to the targets, which have been subject to change based on level of funds available and the extent of borrowing of transit revenues by the State for use in balancing the State Budget.
Metro’s LRTP reflects expenditure of $2.0 million in RIP funding in FY 2008 for the Regional Connector.
2.2.3 Local Funding Sources
Measure R Sales Tax
The Regional Connector is programmed to receive $160.0 million in Measure R funds. These revenues are programmed over FY 2015 to FY 2017, with $95.9 million in FY 2015, $48.9 million in FY 2016, and $15.2 million in FY 2017.
Measure R is a 30-year ½-cent local sales tax approved by LA County voters is 2008 for rail expansion, local street improvements, traffic reduction, better public transportation, and quality of life. The tax went into effect on July 1, 2009. Metro is responsible for administering the funds. Funds flow to Metro which allocates to itself and other agencies according to the ordinance, Metro’s Formula Allocation Procedure, and Metro Board actions. The voter-approved ordinance specifies the following apportionments:
35 Percent Transit Capital Specific Projects: Allocated to Metro for new Rail and/or Bus Rapid Transit Capital Projects listed in the Ordinance. The Regional Connector is one of the named projects in the legislation and will receive $160 million from the Measure R sales tax.
20 Percent Highway Projects: Capital project allocations per Metro Board action which can include construction of specific list of carpool lanes, highways, goods movement, grade separations, and soundwalls
R e g i o n a l C o n n e c t o r T r a n s i t C o r r i d o r
D r a f t F i n a n c i a l A n a l y s i s R e p o r t
Draft Environmental Impact Statement/Environmental Impact Report Page 23
20 Percent Bus Operations: Allocated to Metro and non-Metro operators and agencies for bus operations. Suspends a scheduled July 1, 2009 Metro fare increase for one year and freeze all Metro Student, Senior, Disabled, and Medicare fares through June 30, 2013 by instead using Metro's Formula Allocation Procedure share of this subfund
15 Percent Local Return: Distributed to the incorporated cities within Los Angeles County and to Los Angeles County for the unincorporated area of the County on a per capita basis to support major street resurfacing, rehabilitation and reconstruction; pothole repair; left turn signals; bikeways; pedestrian improvements; streetscapes; signal synchronization; and transit
5 Percent Rail Operations: Provides funding for operation and maintenance of new transit projects
3 Percent Metrolink: Allocated to the Southern California Regional Rail Authority (SCRRA) for capital improvements to the Metrolink commuter rail system. Funds may be used for Metrolink capital improvement projects within Los Angeles County as well as funding operations and maintenance costs.
2 Percent Rail Capital General Improvements: Allocated to Metro for capital improvements to Metro’s rail system including, system improvements, rail yards, and rail cars
Administration: Metro may use 1.5 percent for program administration including planning, management, execution, use and conduct of the projects and programs funded by Measure R.
On March 25, 2010, the Metro Board approved the LRTP Near-Term Strategies, Priority Setting Criteria, and 2011 Los Angeles County Transportation Improvement Program. The purpose of this policy document is to define near-term strategies and priority-setting criteria for developing the FY 2011 Los Angeles County Transportation Improvement Program (TIP) and to address current and projected revenue shortfalls.
The Regional Connector Transit Corridor project has been included in the fourth priority category - projects seeking funds to begin or continue development phases. Based on the Board-approved criteria, projects in this category are the highest priority after: 1) projects currently under construction; 2) projects with construction bids advertised as of February 25, 2010; and 3) projects requiring right-of-way acquisition to continue with the project development process. Additionally projects in the fourth category are limited to those that are funded for construction completion in the first decade (through FY 2019) of the 2009 LRTP. The Regional Connector is included in this category to complete the environmental clearance phase of project development.
R e g i o n a l C o n n e c t o r T r a n s i t C o r r i d o r
D r a f t F i n a n c i a l A n a l y s i s R e p o r t
Draft Environmental Impact Statement/Environmental Impact Report Page 24
The Regional Connector is also included in the fifth priority category which reflects criteria for selecting projects to advance to construction. The top criterion in this category is Safety and New Starts. Under this criterion, rail safety projects are recommended as a first priority followed closely by New Starts projects that demonstrate high likelihood of successfully competing for discretionary federal funds.
Lease Revenue
Metro receives approximately $12.0 million annually in revenue from leases of property and assets. Lease revenues are assumed to be available to fund administration, rail and bus capital, and bus operations. Metro’s LRTP reflects $0.2 million in lease revenue expended on the Regional Connector in FY 2007.
LONP Reimbursement Fund
The FY 2010 Metro budget includes a “Special Revenue Other” fund balance of $297.0 million in AB 3090 and Traffic Congestion Relief Program (TCRP) LONP reimbursements from the State of California. These capital reimbursements are for advances made by Metro to the State in lieu of capital project funding that could not be provided by the State on the originally programmed schedule. In the LRTP Metro assumed that these funds must be used for capital purposes only. As they are reimbursements for prior capital expenses, the funds are flexible for many transportation capital purposes, including subway uses now prohibited by Proposition A and Proposition C.
The LRTP takes advantage of the flexibility by assuming the use of the funds, in part, for leveraging federal New Starts funds for planned subway construction projects, including the Regional Connector.
Metro’s LRTP assumes $195.7 million in LONP Reimbursement Fund revenue will be available for the Regional Connector. These funds are programmed for receipt over FY 2009 through FY 2019.
Local Agency Funds
To assist in funding the Measure R program of projects, Metro has proposed for consideration that local jurisdictions provide a three percent local match for projects. Metro is working with cities, the County of Los Angeles, the Technical Advisory Committee, and subregional entities on an appropriate policy to support this. Issues currently being addressed include timing, clarification as to what constitutes a local match, definition of how to determine proportional share, and discussion of whether the three percent match changes if there is an increase or decrease in total project cost.
R e g i o n a l C o n n e c t o r T r a n s i t C o r r i d o r
D r a f t F i n a n c i a l A n a l y s i s R e p o r t
Draft Environmental Impact Statement/Environmental Impact Report Page 25
Metro’s LRTP assumes 3 percent of total project costs of the Regional Connector will be provided from Local Agency Funds. This would result in $31.3 to $47.3 million for the Regional Connector depending on the Build Alternative recommended.
2.2.4 Refined Local, State, and Federal Funding Levels Based on a comparison of the sources and funding levels for the Regional Connector identified in the LRTP compared to the updated capital cost estimates in the environmental document, the Underground Emphasis LRT Alternative and the Fully Underground LRT Alternative – Little Tokyo Variations 1 and 2 would require additional funding ranging from $105.3 million to $236.4 million. Prior to selection of the LPA for the Regional Connector, Metro staff will refine the long range financial plan to reflect the prioritization criteria adopted by the Board on March 25, 2010 as well as other policy actions associated with accelerating the Measure R program. It is anticipated that the results of this refinement will identify local, State and federal revenue levels to fully fund the Regional Connector as well as other LRTP projects identified as priorities for construction. Supplementary funding could potentially be secured from use of Proposition C 25% funds for eligible project elements, additional LONP Reimbursement Funds, STIP RIP funds, CMAQ, and other sources to be defined.

R e g i o n a l C o n n e c t o r T r a n s i t C o r r i d o r
D r a f t F i n a n c i a l A n a l y s i s R e p o r t
Draft Environmental Impact Statement/Environmental Impact Report Page 27
3.0 OPERATING AND MAINTENANCE COSTS AND REVENUES This section describes the O&M costs of the alternatives and the revenue sources proposed to fund them.
3.1 O&M Costs System-wide O&M cost estimates were developed for the heavy rail, light rail, and bus components of the alternatives and reflect operating plans for the year 2035. The resource build-up methodology for estimating O&M costs was designed to satisfy FTA guidance. Detailed information regarding O&M costs is provided in the Regional Connector Transit Corridor: Operating and Maintenance Cost Estimate Report dated January 26, 2010
For this report, O&M costs are shown in 2009 dollars. In the next iteration of the financial analysis, O&M costs will be shown in YOE dollars and will be included in a detailed cash flow analysis reflecting costs and revenues from opening year to the horizon year of FY 2035.
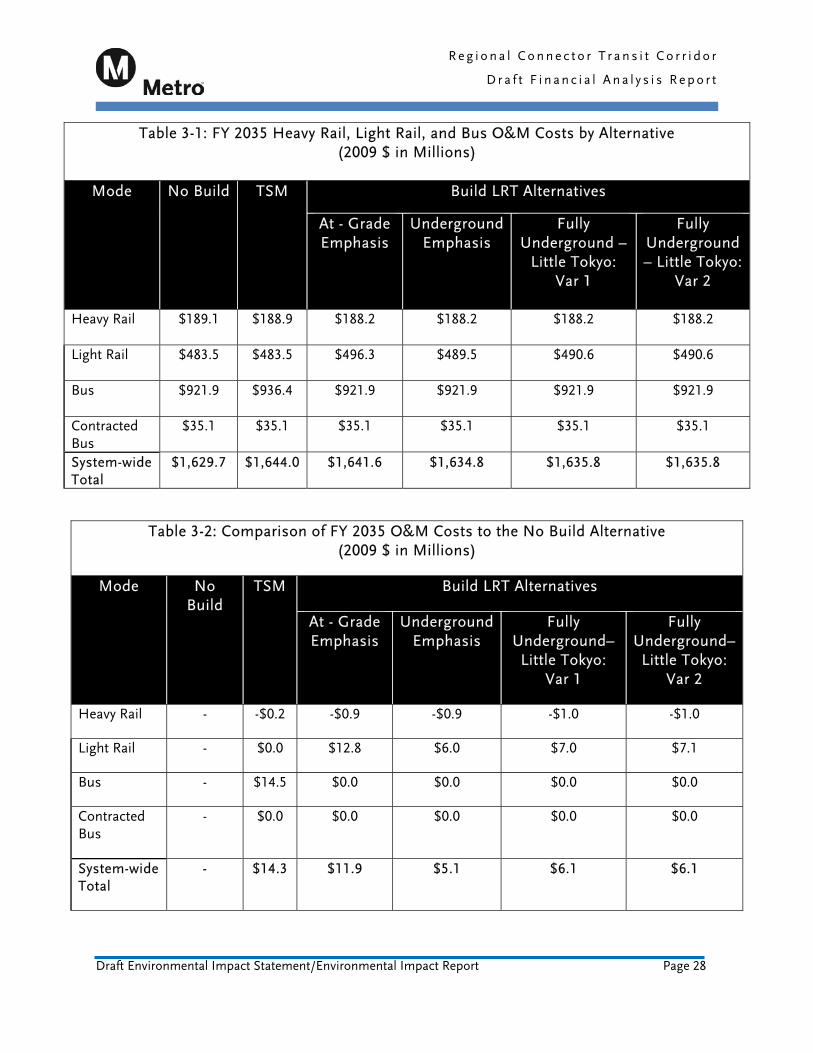
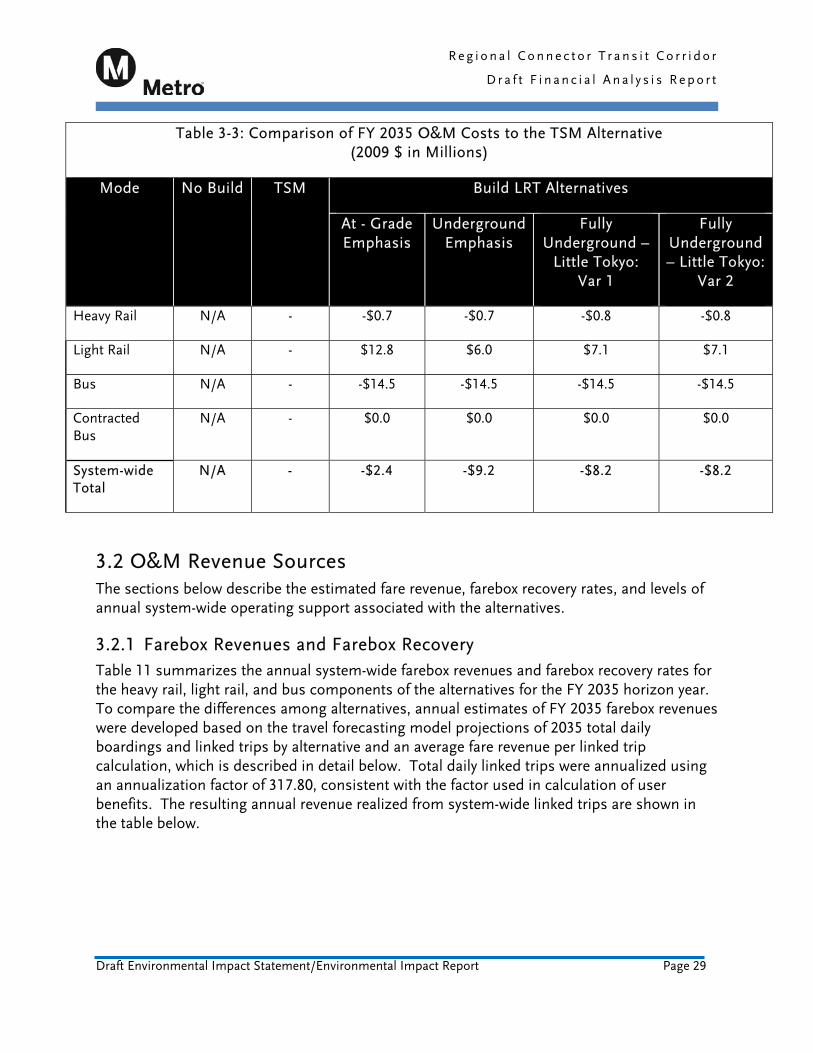
Table 3-1 summarizes Metro’s FY 2035 heavy rail, light rail, and bus O&M cost by mode for each alternative. As shown in the table, total FY 2035 O&M cost for these modes in the Build Alternatives ranges from $1,634.8 million for the Underground Emphasis LRT Alternative to $1,644.0 million for the TSM Alternative. Table 3-2 compares the change in annual O&M costs relative to the No Build Alternative, while Table 3-3 compares the change in O&M costs relative to the TSM Alternative. Key findings from these comparisons are summarized below.
In comparison to the No Build Alternative:
o All of the alternatives increase O&M costs relative to the No Build Alternative. The Underground Emphasis LRT Alternative has the lowest annual increase in O&M cost ($5.1 million), followed by the Fully Underground LRT Alternatives ($6.1 million for both variations) and At-Grade Emphasis LRT Alternative ($11.9 millions). The TSM Alternative has the largest increase in annual O&M costs ($14.3 million) due to the significant increase in bus service and relatively small savings in heavy rail and light rail costs (approximately $0.2 million).
In comparison to the TSM Alternative:
o All of the Build Alternatives reduce O&M costs relative to the TSM Alternative. The Underground Emphasis LRT Alternative provides the largest annual savings (approximately $9.2 million in savings), followed by the Fully Underground LRT Alternatives (approximately $8.2 million in savings for both variations) and the At-Grade Emphasis LRT Alternative (approximately $2.4 million in savings).
R e g i o n a l C o n n e c t o r T r a n s i t C o r r i d o r
D r a f t F i n a n c i a l A n a l y s i s R e p o r t
Draft Environmental Impact Statement/Environmental Impact Report Page 28
Table 3-1: FY 2035 Heavy Rail, Light Rail, and Bus O&M Costs by Alternative (2009 $ in Millions)
Mode No Build TSM Build LRT Alternatives
At - Grade Emphasis
Underground Emphasis
Fully Underground –
Little Tokyo: Var 1
Fully Underground – Little Tokyo:
Var 2
Heavy Rail $189.1 $188.9 $188.2 $188.2 $188.2
$188.2
Light Rail $483.5 $483.5 $496.3 $489.5 $490.6
$490.6
Bus $921.9 $936.4 $921.9 $921.9 $921.9
$921.9
Contracted Bus
$35.1 $35.1 $35.1 $35.1 $35.1
$35.1
System-wide Total
$1,629.7 $1,644.0 $1,641.6 $1,634.8 $1,635.8
$1,635.8
Table 3-2: Comparison of FY 2035 O&M Costs to the No Build Alternative (2009 $ in Millions)
Mode No Build
TSM Build LRT Alternatives
At - Grade Emphasis
Underground Emphasis
Fully Underground–
Little Tokyo: Var 1
Fully Underground–
Little Tokyo: Var 2
Heavy Rail - -$0.2 -$0.9 -$0.9 -$1.0 -$1.0
Light Rail - $0.0 $12.8 $6.0 $7.0 $7.1
Bus - $14.5 $0.0 $0.0 $0.0 $0.0
Contracted Bus
- $0.0 $0.0 $0.0 $0.0 $0.0
System-wide Total
- $14.3 $11.9 $5.1 $6.1 $6.1
R e g i o n a l C o n n e c t o r T r a n s i t C o r r i d o r
D r a f t F i n a n c i a l A n a l y s i s R e p o r t
Draft Environmental Impact Statement/Environmental Impact Report Page 29
Table 3-3: Comparison of FY 2035 O&M Costs to the TSM Alternative (2009 $ in Millions)
Mode No Build TSM Build LRT Alternatives
At - Grade Emphasis
Underground Emphasis
Fully Underground –
Little Tokyo: Var 1
Fully Underground – Little Tokyo:
Var 2
Heavy Rail N/A - -$0.7 -$0.7 -$0.8 -$0.8
Light Rail N/A - $12.8 $6.0 $7.1 $7.1
Bus N/A - -$14.5 -$14.5 -$14.5 -$14.5
Contracted Bus
N/A - $0.0 $0.0 $0.0 $0.0
System-wide Total
N/A - -$2.4 -$9.2 -$8.2 -$8.2
3.2 O&M Revenue Sources The sections below describe the estimated fare revenue, farebox recovery rates, and levels of annual system-wide operating support associated with the alternatives.
3.2.1 Farebox Revenues and Farebox Recovery Table 11 summarizes the annual system-wide farebox revenues and farebox recovery rates for the heavy rail, light rail, and bus components of the alternatives for the FY 2035 horizon year. To compare the differences among alternatives, annual estimates of FY 2035 farebox revenues were developed based on the travel forecasting model projections of 2035 total daily boardings and linked trips by alternative and an average fare revenue per linked trip calculation, which is described in detail below. Total daily linked trips were annualized using an annualization factor of 317.80, consistent with the factor used in calculation of user benefits. The resulting annual revenue realized from system-wide linked trips are shown in the table below.
R e g i o n a l C o n n e c t o r T r a n s i t C o r r i d o r
D r a f t F i n a n c i a l A n a l y s i s R e p o r t
Draft Environmental Impact Statement/Environmental Impact Report Page 30
The following process was used to develop total fare revenue for each alternative:
Three sources of data were used by Metro to derive the average fare paid for heavy rail, light rail, and bus linked trips with multiple boardings. These sources are:
o Metro’s 2002 On-Board survey, which provided data on the distribution of linked trips by number of boardings and by fare instrument used
o Service Performance Branch data for 2002 on the number of boardings by fare instrument used
o Records of the units sold in 2002 of each fare instrument (cash, weekly pass, monthly pass, elderly and disabled discounts, etc)
Using these three sources in combination, Metro staff calculated the average fare paid for each segment of a linked trip with multiple boardings. The analysis indicated that the average fare for the first boarding was approximately $1.07, and the incremental fare for additional boardings was approximately $0.22.
In order to incorporate these results into Metro travel demand model, the values were deflated to 1999 dollars. Based on the LA region’s consumer price index (CPI) over the 1999 to 2002 period, the values were deflated by 0.91 which resulted in the first boarding average fare equivalent to approximately $0.98 and the incremental fare for additional boardings equivalent to approximately $0.20. These are equivalent to the values used in the travel demand model runs for the Regional Connector.
Based on the results of the Regional Connector travel demand model runs, total heavy rail, light rail, and bus boardings and total linked trips were calculated for each alternative.
Fare revenues for each alternative were developed using a two step process. First, total linked trips were multiplied by the 1999 first boarding fare equivalent ($0.98). Second, to account for linked trips that required multiple boarding, the incremental fare for additional boardings ($0.20) was multiplied by the number of additional boardings (total boardings minus total linked trips) for each alternative.
Finally the total fare revenue for each alternative was inflated to 2009 dollars using an inflation factor of 1.34 which represents the change in CPI over the 1999 to 2009 period. The resulting fare in 2009 dollars is equivalent to approximately $1.31 for the initial boarding and $0.26 for each additional boarding.
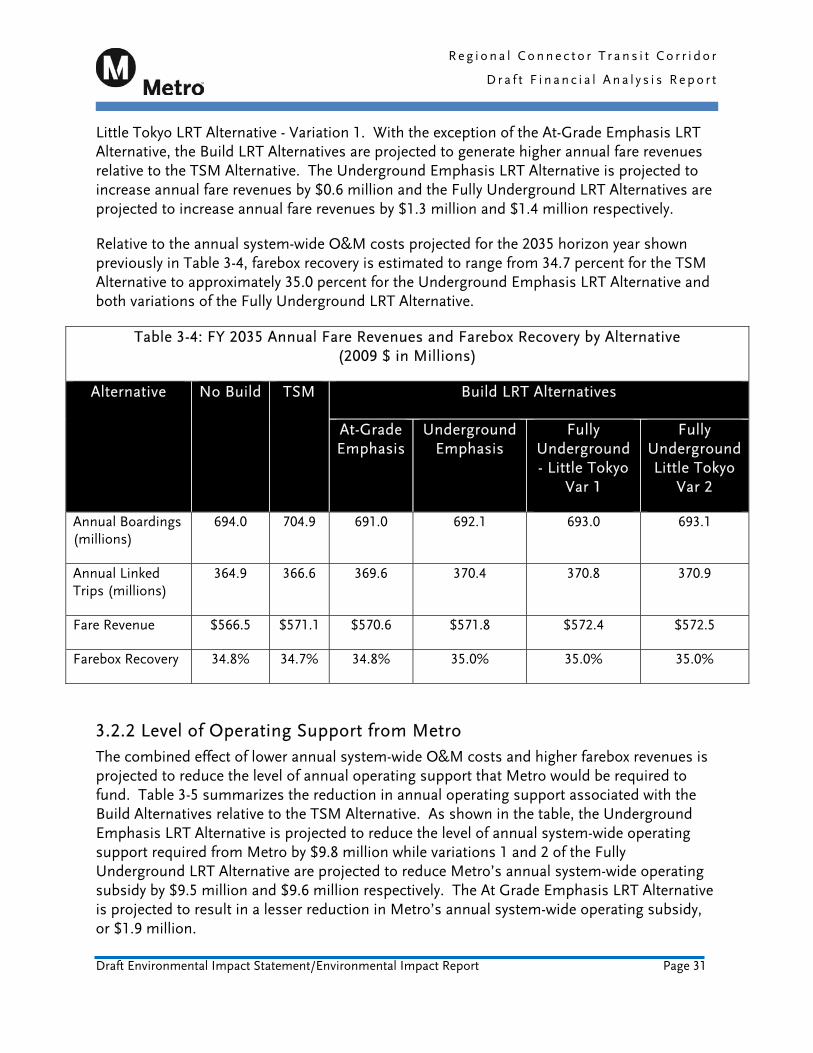
Table 3-4 provides the summary results of the fare revenue analysis process. As shown in the table, annual system-wide farebox revenues for the 2035 horizon year are projected to range from $566.4 million for the No Build Alternative to $572.4 million for the Fully Underground
R e g i o n a l C o n n e c t o r T r a n s i t C o r r i d o r
D r a f t F i n a n c i a l A n a l y s i s R e p o r t
Draft Environmental Impact Statement/Environmental Impact Report Page 31
Little Tokyo LRT Alternative - Variation 1. With the exception of the At-Grade Emphasis LRT Alternative, the Build LRT Alternatives are projected to generate higher annual fare revenues relative to the TSM Alternative. The Underground Emphasis LRT Alternative is projected to increase annual fare revenues by $0.6 million and the Fully Underground LRT Alternatives are projected to increase annual fare revenues by $1.3 million and $1.4 million respectively.
Relative to the annual system-wide O&M costs projected for the 2035 horizon year shown previously in Table 3-4, farebox recovery is estimated to range from 34.7 percent for the TSM Alternative to approximately 35.0 percent for the Underground Emphasis LRT Alternative and both variations of the Fully Underground LRT Alternative.
Table 3-4: FY 2035 Annual Fare Revenues and Farebox Recovery by Alternative (2009 $ in Millions)
Alternative No Build TSM Build LRT Alternatives
At-Grade Emphasis
Underground Emphasis
Fully Underground - Little Tokyo
Var 1
Fully Underground Little Tokyo
Var 2
Annual Boardings (millions)
694.0 704.9 691.0 692.1 693.0 693.1
Annual Linked Trips (millions)
364.9 366.6 369.6 370.4 370.8 370.9
Fare Revenue $566.5 $571.1 $570.6 $571.8 $572.4 $572.5
Farebox Recovery 34.8% 34.7% 34.8% 35.0% 35.0% 35.0%
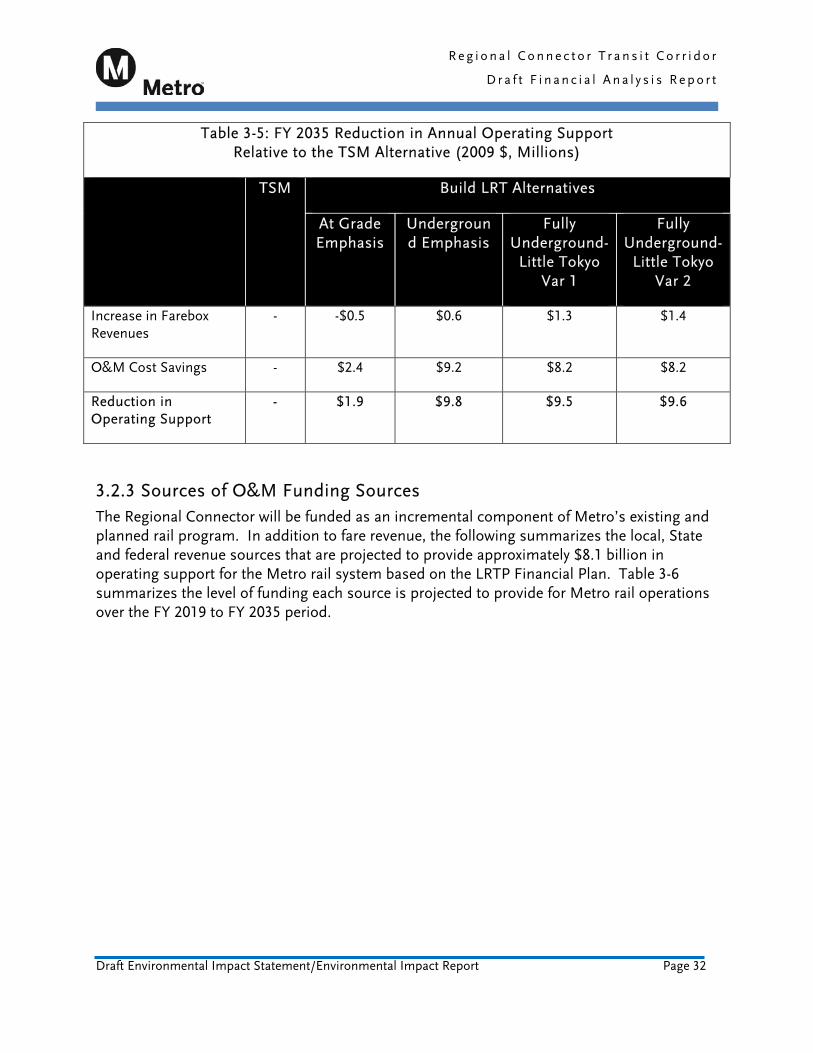
3.2.2 Level of Operating Support from Metro The combined effect of lower annual system-wide O&M costs and higher farebox revenues is projected to reduce the level of annual operating support that Metro would be required to fund. Table 3-5 summarizes the reduction in annual operating support associated with the Build Alternatives relative to the TSM Alternative. As shown in the table, the Underground Emphasis LRT Alternative is projected to reduce the level of annual system-wide operating support required from Metro by $9.8 million while variations 1 and 2 of the Fully Underground LRT Alternative are projected to reduce Metro’s annual system-wide operating subsidy by $9.5 million and $9.6 million respectively. The At Grade Emphasis LRT Alternative is projected to result in a lesser reduction in Metro’s annual system-wide operating subsidy, or $1.9 million.
R e g i o n a l C o n n e c t o r T r a n s i t C o r r i d o r
D r a f t F i n a n c i a l A n a l y s i s R e p o r t
Draft Environmental Impact Statement/Environmental Impact Report Page 32
Table 3-5: FY 2035 Reduction in Annual Operating Support Relative to the TSM Alternative (2009 $, Millions)
TSM Build LRT Alternatives
At Grade Emphasis
Underground Emphasis
Fully Underground-
Little Tokyo Var 1
Fully Underground-
Little Tokyo Var 2
Increase in Farebox Revenues
- -$0.5 $0.6 $1.3 $1.4
O&M Cost Savings - $2.4 $9.2 $8.2 $8.2
Reduction in Operating Support
- $1.9 $9.8 $9.5 $9.6
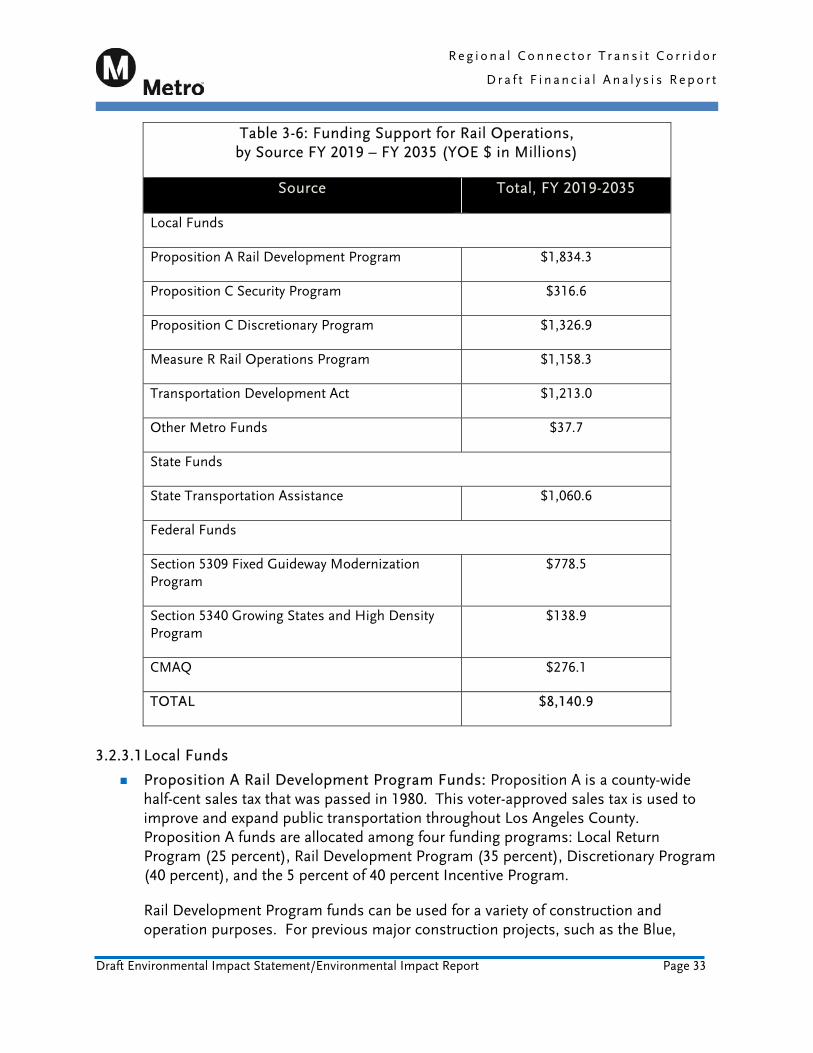
3.2.3 Sources of O&M Funding Sources The Regional Connector will be funded as an incremental component of Metro’s existing and planned rail program. In addition to fare revenue, the following summarizes the local, State and federal revenue sources that are projected to provide approximately $8.1 billion in operating support for the Metro rail system based on the LRTP Financial Plan. Table 3-6 summarizes the level of funding each source is projected to provide for Metro rail operations over the FY 2019 to FY 2035 period.
R e g i o n a l C o n n e c t o r T r a n s i t C o r r i d o r
D r a f t F i n a n c i a l A n a l y s i s R e p o r t
Draft Environmental Impact Statement/Environmental Impact Report Page 33
Table 3-6: Funding Support for Rail Operations, by Source FY 2019 – FY 2035 (YOE $ in Millions)
Source Total, FY 2019-2035
Local Funds
Proposition A Rail Development Program $1,834.3
Proposition C Security Program $316.6
Proposition C Discretionary Program $1,326.9
Measure R Rail Operations Program $1,158.3
Transportation Development Act $1,213.0
Other Metro Funds $37.7
State Funds
State Transportation Assistance $1,060.6
Federal Funds
Section 5309 Fixed Guideway Modernization Program
$778.5
Section 5340 Growing States and High Density Program
$138.9
CMAQ $276.1
TOTAL $8,140.9
3.2.3.1 Local Funds
Proposition A Rail Development Program Funds: Proposition A is a county-wide half-cent sales tax that was passed in 1980. This voter-approved sales tax is used to improve and expand public transportation throughout Los Angeles County. Proposition A funds are allocated among four funding programs: Local Return Program (25 percent), Rail Development Program (35 percent), Discretionary Program (40 percent), and the 5 percent of 40 percent Incentive Program.
Rail Development Program funds can be used for a variety of construction and operation purposes. For previous major construction projects, such as the Blue,
R e g i o n a l C o n n e c t o r T r a n s i t C o r r i d o r
D r a f t F i n a n c i a l A n a l y s i s R e p o r t
Draft Environmental Impact Statement/Environmental Impact Report Page 34
Green and Red Lines, Metro has leveraged these funds by bonding in accordance with the agency’s adopted debt policy. Bond debt service has the first claim of funds from this program. Other eligible uses include the acquisition, renovation, rehabilitation, and replacement of rail vehicles, rail facilities, and wayside systems; operation of rail systems, and acquisition and maintenance of rights of way.
2019-2035 Funding Projection: $1,834.3 million
Proposition C Security and Discretionary Programs: Proposition C is a county-wide half-cent sales tax that was passed in 1990. This voter-approved sales tax is used for public transit purposes throughout Los Angeles County. Proposition C funds are allocated among five funding programs: Rail and Bus Security (5 percent), Commuter Rail/Transit Centers (10 percent), Local Returns (20 percent), Transit-related Improvements to Freeways and State Highways and Public Mass Transit Improvements to Railroad Rights-of-Way (25 percent) and Discretionary program (40 percent).
Security funds improve and expand rail and bus security services such as new rail line security, transit service and facilities security, security incentives, security improvements, and demonstration projects.
2019-2035 Funding Projection: $316.6 million
Discretionary Program funds are currently allocated at the discretion of Metro Board to Metro and non-Metro operators and agencies after all other funding opportunities are exhausted.
2019-2035 Funding Projection: $1,326.9 million
Measure R Rail Operations Program: As stated earlier, 5 percent of Measure R sales tax revenue is to be used to support operating costs of new rail projects.
2019-2035 Funding Projection: $1,158.3 million
Transportation Development Act (TDA) Funding: Each California County receives funding from the Local Transportation Fund (LTF) which is derived from a ¼ cent of the 7.25 cent statewide retail sales tax. The funds are apportioned by the State Board of Equalization according to the amount of tax collected within the each county.
2019-2035 Funding Projection: $1,213.0 million
Other Metro Funds: This category reflects fees collected by Metro for advertising, chartering, leasing, ridesharing, and other miscellaneous services.
2019-2035 Funding Projection: $37.7 million
R e g i o n a l C o n n e c t o r T r a n s i t C o r r i d o r
D r a f t F i n a n c i a l A n a l y s i s R e p o r t
Draft Environmental Impact Statement/Environmental Impact Report Page 35
3.2.3.2 State Funds
State Transportation Assistance (STA): Through FY 2008, funding was provided through 50 percent of the Public Transportation Account (PTA) revenue. Funds were apportioned to counties based 50 percent on population share and 50 percent to operator revenue share (the ratio of each transit operator’s revenues to the revenues of operators in the State) In 2007, Senate Bill 717 (SB 717) changed the allocation of the PTA program beginning in FY 2009. Under SB 717, STA has been funded from 75 percent of the PTA revenue and is apportioned 50 percent based on population share and 50 percent based on operator revenue share. Applicants for funds must meet one of the following eligibility tests:
o Latest audited operating cost per revenue vehicle hour does not exceed the sum of the preceding year’s operating cost per revenue vehicle hour and an amount equal to the product of the percentage change in CPI for the same period multiplied by the preceding year’s operating cost per revenue vehicle hour.
o Latest audited 3-year average operating cost per revenue vehicle hour does not exceed the sum of the average of the operating cost per revenue vehicle hour in the 3 years preceding the latest audited year and an amount equal to the product of the average percentage change in CPI for the same period multiplied by the average operating cost per revenue vehicle hour in the same 3 years.
Metro’s policy has been to allocate the population share of STA funds for rail operations, which is also reflected in the long range financial plan. It should be noted that legislation passed in 2010 to eliminate the sales tax on motor fuels will change the level of funding in the STA by eliminating the PTA.
2019-2035 Funding Projection: $1,060.6 million
3.2.3.3 Federal Funds
Section 5309 Fixed Guideway Modernization Funds: A federal formula program that is allocated to urbanized areas with populations greater than 200,000 with fixed guideway systems that have been in operation for at least seven years. These funds can be used for preventive maintenance activities incorporated into the operating plan. These activities can include preservation of fixed guideway infrastructure such as maintenance of vehicles, buildings, equipment, electric power facilities, vehicle movement control systems, fare collection and counting equipment, structures, tunnels, subways, and roadways.
2019-2035 Funding Projection: $778.5 million
Section 5340 Growing States and High Density Program: Funds from this program are allocated based on two categories. First, 50 percent of funds are made available under the Growing States factors and are apportioned based on State population
R e g i o n a l C o n n e c t o r T r a n s i t C o r r i d o r
D r a f t F i n a n c i a l A n a l y s i s R e p o r t
Draft Environmental Impact Statement/Environmental Impact Report Page 36
forecasts for 15 years beyond the most recent census. Amounts apportioned for each State are then allocated to urbanized and rural areas based on the State’s urban/rural population ratio. Second, the remaining 50 percent is allocate based on the High Density States factor which distributes funds to States with population densities greater than 370 people per square mile and are apportioned only to urbanized areas within those States. The State of California does not qualify for High Density funds since its population density is 217 people per square mile. Metro uses the Growing States funds for rail operations.
2019-2035 Funding Projection: $138.9 million
CMAQ: In addition to the capital use of CMAQ funds as described earlier, these funds can also be used for operating costs.
2019-2035 Funding Projection: $176.1 million
R e g i o n a l C o n n e c t o r T r a n s i t C o r r i d o r
D r a f t F i n a n c i a l A n a l y s i s R e p o r t
Draft Environmental Impact Statement/Environmental Impact Report Page 37
4.0 RISKS AND UNCERTAINTIES This report has summarized the proposed costs and revenues that would provide Metro sufficient funding to support the construction, operation and maintenance of the Regional Connector and at the same time allow for operation, maintenance, and expansion of the existing transit system.
The implementation of the LPA selected for the Regional Connector is proposed to receive 50 percent federal participation through the FTA New Starts program. The magnitude of this investment demands that Metro have complete assurance that at the time of construction, federal funding will follow the distribution schedule detail in a New Starts Full Funding Grant Agreement (FFGA). Conversely, the FTA must have assurance that limited federal funds will be fully and productively utilized and leveraged to the greatest extent possible. If the Regional Connector LPA is carried forward, these mutual assurances will be negotiated and described in an FFGA between FTA and Metro, which would occur during the project’s final design stage.
4.1 Key Risks and Uncertainties Although Metro has proposed a most likely scenario based on the funding and cost assumptions presented above, there are a number of capital and operating risks and uncertainties that could influence the financial plan in future phases of project development. The following sections discuss risks and uncertainties related to:
Availability of Federal Funds
Revenue Risk
Construction Cost Risk
Operating Risk
Strategies to address risk are also described.
4.1.1 Availability of Federal Funds The guaranteed transit funding levels that were included in SAFETEA-LU provided
greater certainty about the annual flow of federal transit monies. However FTA funds are appropriated on a yearly basis. As result, annually there continued to be a level of uncertainty regarding the amount and timing of the discretionary and formula funds that would be available to transit agencies.
Although SAFETEA-LU was to expire in 2009, the next surface transportation authorization legislation has not been approved and SAFETEA-LU has been extended until December 31, 2010. At this time there is considerable uncertainty regarding
R e g i o n a l C o n n e c t o r T r a n s i t C o r r i d o r
D r a f t F i n a n c i a l A n a l y s i s R e p o r t
Draft Environmental Impact Statement/Environmental Impact Report Page 38
when Congress will pass new transportation authorization legislation, if the annual appropriation process will remain unchanged, and the level of funding that will be provided for the New Starts program.
4.1.2 Revenue Risk Capital Funding Availability - The availability of capital funds from various sources
(e.g., federal level and match of Section 5309 and Section 5307, and local sources) affects the timing and overall cost of the project. Insufficient annual allocations require an extension of the construction schedule so that costs do not exceed available resources.
Tax Revenues: Variations in tax revenues affect the availability of resources to fund capital and operating needs.
4.1.3 Construction Cost Risk Construction Costs: The Regional Connector requires underground construction
through a densely developed area. Differences in construction costs may occur because of: (1) unforeseen conditions not evaluated at the current conceptual level of engineering, such as soil conditions or utility relocation; (2) variations in construction unit costs, bid quantities and other contingencies; and (3) changes in design elements.
Real Growth: The rate of real growth (i.e., the difference between the rate of inflation for a specific commodity or service and the baseline rate of inflation, as measured by the local Consumer Price Index or Construction Cost Index), may vary. These variations in the real rate of cost growth are particularly important for certain commodities or services which constitute a significant element of the capital and O&M cost structure of the transit system (e.g., labor, electricity, fuel, parts and construction).
Schedule: A number of issues could result in construction delay including but not limited to unforeseen construction challenges or the local decision-making process. At this early stage in the project development process, the exact timing of the construction phases is not finalized. This uncertainty could impact the availability and timing of local and federal funds. However, both of Metro’s federal rail projects, Red Line and Eastside Gold Line, were delivered on the FFGA schedule and budget.
R e g i o n a l C o n n e c t o r T r a n s i t C o r r i d o r
D r a f t F i n a n c i a l A n a l y s i s R e p o r t
Draft Environmental Impact Statement/Environmental Impact Report Page 39
4.1.4 Operating Risk Fares, Fare Policy and Cost Recovery: Changes in fare level and structure affect
ridership, fare revenue and cost recovery. Changes in ridership affect the level of service required which, in turn, affects capital and operating costs and revenue.
Service Levels: The frequency of service and hours of operation affect ridership, fare revenue and capital and operating costs.
4.2 Strategies to Address Risk As the Regional Connector Transit Corridor project is implemented, there are several strategies that Metro could utilize to address risks, if one or more should occur. These strategies include: redefining project schedules; short term financing strategies such as grant anticipation notes and revenue anticipation notes or federal loans which can be used to close gaps between needed and available revenues. These types of strategies will be considered in subsequent iterations of the financial plan.
In addition, Metro, with support from the City of Los Angeles and a coalition of local civic leaders and organizations, is seeking to accelerate delivery of the Measure R program through public-private partnerships and a “30/10” initiative. This initiative calls for Metro to leverage Measure R sales tax through an innovative program involving advanced federal infrastructure funding and federally-back debt.

R e g i o n a l C o n n e c t o r T r a n s i t C o r r i d o r
D r a f t F i n a n c i a l A n a l y s i s R e p o r t
Draft Environmental Impact Statement/Environmental Impact Report Page 41
5.0 SUMMARY OF KEY FINDINGS The key findings of the financial analysis are summarized below.
Regional Connector Priority in Policy and Planning Documents:
o The Regional Connector is included in both of the existing long range financial planning documents for the region: LA Metro’s 2009 LRTP and the Southern California Association of Governments 2008 Regional Transportation Plan. Within the LRTP, the Regional Connector is identified as one of the priority transit corridor projects to be funded and implemented by 2019. With regard to the SCAG’s RTP, the Regional Connector is included in the financially constrained plan as a funded project (project identification number 1TR0404).
o Based on the adopted March 25, 2010 Board policy, the Regional Connector has been prioritized for funding in the first category of projects after construction and right-of-way related activities to complete environmental clearance. Additionally, the Regional Connector is included in the highest priority category to fund the next set of long range projects that will be constructed.
Capital Costs
o The capital costs of the TSM Alternative and three Regional Connector Build Alternatives in 2009 dollars range from $67.3 million for the TSM Alternative to $1.36 billion for the Fully Underground LRT Alternative Little Tokyo Variation 2. Capital costs by alternative are summarized below. These costs reflect a nine year implementation schedule, which is consistent with planning estimates in the LRTP. In future iterations of the financial analysis, the costs and implementation schedule will be refined.
TSM Alternative: $67.3 million ($80.0 million YOE dollars);
At-Grade Emphasis LRT Alternative: $899.2 million ($1,042.2 million YOE dollars);
Underground Emphasis LRT Alternative: $1,120.1 million ($1,297.0 million YOE dollars);
Fully Underground LRT Alternative - Little Tokyo Variation 1: $1,245.2 million ($1,442.0 million YOE dollars); and
Fully Underground LRT Alternative - Little Tokyo Variation 2: $1,360.2 million ($1,595.8 million YOE dollars).
R e g i o n a l C o n n e c t o r T r a n s i t C o r r i d o r
D r a f t F i n a n c i a l A n a l y s i s R e p o r t
Draft Environmental Impact Statement/Environmental Impact Report Page 42
Capital Revenue Sources
o The capital costs of the Build Alternatives are proposed to be funded from the sources listed below. Prior to submittal of an application for FTA authorization to advance to the next stage of New Starts project development, Metro will refine the proposed funding plan to reflect Board policies related to LRTP prioritization and anticipated changes in projected revenue levels and financing opportunities.
Federal:
• FTA Section 5309 New Starts: 50 percent of capital costs.
• Congestion Mitigation and Air Quality (CMAQ): $31.5 million.
Local/State:
• California High Speed Rail Bonds: $114.9 million.
• Region Improvement Plan: $2.0 million.
• Measure R Sales Tax: $160.0 million.
• Lease Revenue: $0.20 million.
• Letter of No Prejudice Reimbursement: $195.7 million.
• Local Agency Funds: 3 percent of capital costs.
Additional Capital Funding Sources to be Defined:
o Additional local, State, and federal revenues are needed to fund the Underground Emphasis LRT Alternative and the Fully Underground LRT Alternative – Little Tokyo Variations 1 and 2. These alternatives require identification of sources for unfunded balances of $105.3 million, $173.4 million, and $236.4 million respectively.
o Prior to selection of the LPA for the Regional Connector, Metro staff will refine the long range financial plan to reflect the prioritization criteria adopted by the Board on March 25, 2010 as well as other policy actions associated with accelerating the Measure R program. It is anticipated that the results of this refinement will identify local, State and federal revenue levels to fully fund the Regional Connector as well as other LRTP projects identified as priorities for construction. Supplementary funding could potentially be secured from use of Proposition C 25% funds for eligible project elements, additional LONP Reimbursement Funds, STIP RIP funds, CMAQ, and other sources to be defined.
R e g i o n a l C o n n e c t o r T r a n s i t C o r r i d o r
D r a f t F i n a n c i a l A n a l y s i s R e p o r t
Draft Environmental Impact Statement/Environmental Impact Report Page 43
Level of FTA New Starts Funding Proposed:
o The FTA New Starts program is proposed to fund 50 percent of the cost of each Build LRT Alternative. The range of FTA New Starts funding proposed ranges from $521.1 million for the At-Grade Emphasis LRT Alternative to $787.9 million for the Fully Underground LRT Alternative - Little Tokyo Variation 2. These funds are proposed to be provided over the FY 2012 to FY 2018 period.
O&M Cost Savings Relative to the TSM Alternative:
o All of the Build Alternatives are projected to reduce O&M costs relative to the TSM Alternative. The Underground Emphasis LRT Alternative provides the largest annual savings (approximately $9.2 million in savings), followed by the Fully Underground LRT Alternatives (approximately $8.2 million in savings for both variations) and the At-Grade Emphasis LRT Alternative (approximately $2.4 million in savings).
Higher Farebox Revenues Relative to the TSM Alternative:
o With the exception of the At-Grade Emphasis LRT Alternative, the Build LRT Alternatives are projected to generate higher annual fare revenues relative to the TSM Alternative. The Underground Emphasis LRT Alternative is projected to increase annual fare revenues by $0.6 million and both variations of the Fully Underground LRT Alternatives are projected to increase annual fare revenues by $0.6 million. The At-Grade Emphasis LRT Alternative is projected to reduce annual farebox revenues by $0.5 million.
Reduction in Metro Funding Support Required for Rail Operations Relative to the TSM Alternative:
o The combined effect of lower annual system-wide O&M costs and higher farebox revenues for the Underground Emphasis and Fully Underground LRT Build Alternatives is projected to reduce the level of annual operating support that Metro would be required to fund relative to the TSM Alternative.
o The Underground Emphasis LRT Alternative is projected to reduce the level of annual system-wide operating support required from Metro by $9.8 million while variations 1 and 2 of the Fully Underground LRT Alternative are projected to reduce Metro’s annual system-wide operating subsidy by $9.5 million and $9.6 million respectively. The At Grade Emphasis LRT Alternative is projected to result in a lesser reduction in Metro’s annual system-wide operating subsidy, or $1.9 million.
R e g i o n a l C o n n e c t o r T r a n s i t C o r r i d o r
D r a f t F i n a n c i a l A n a l y s i s R e p o r t
Draft Environmental Impact Statement/Environmental Impact Report Page 44
Key Risks and Uncertainties:
o As the Regional Connector Transit Corridor project advances to subsequent stages of project development, strategies will be identified to address key risks and uncertainties related to:
Availability of Federal Funds
Revenue Risk
Construction Cost Risk
Operating Risk
Future Actions:
o Metro, with support from the City of Los Angeles and a coalition of local civic leaders and organizations, is seeking to accelerate delivery of the Measure R program through public-private partnerships and a “30/10” initiative. This initiative calls for Metro to leverage Measure R sales tax through an innovative program involving advanced federal infrastructure funding and federally-back debt.
o As the alternatives selection process moves forward, future iterations of the financial analysis will be conducted, with increasing levels of detail and refinement. The refined financial analysis will identify revenue sources for the unfunded balances of the Build LRT Alternatives. In addition, detailed cash flow analyses will be conducted to document Metro’s financial capacity to implement the Regional Connector and to maintain, operate, and expand the overall transit network through the project horizon year of 2035.