Embed Size (px)
Citation preview
- 122 -
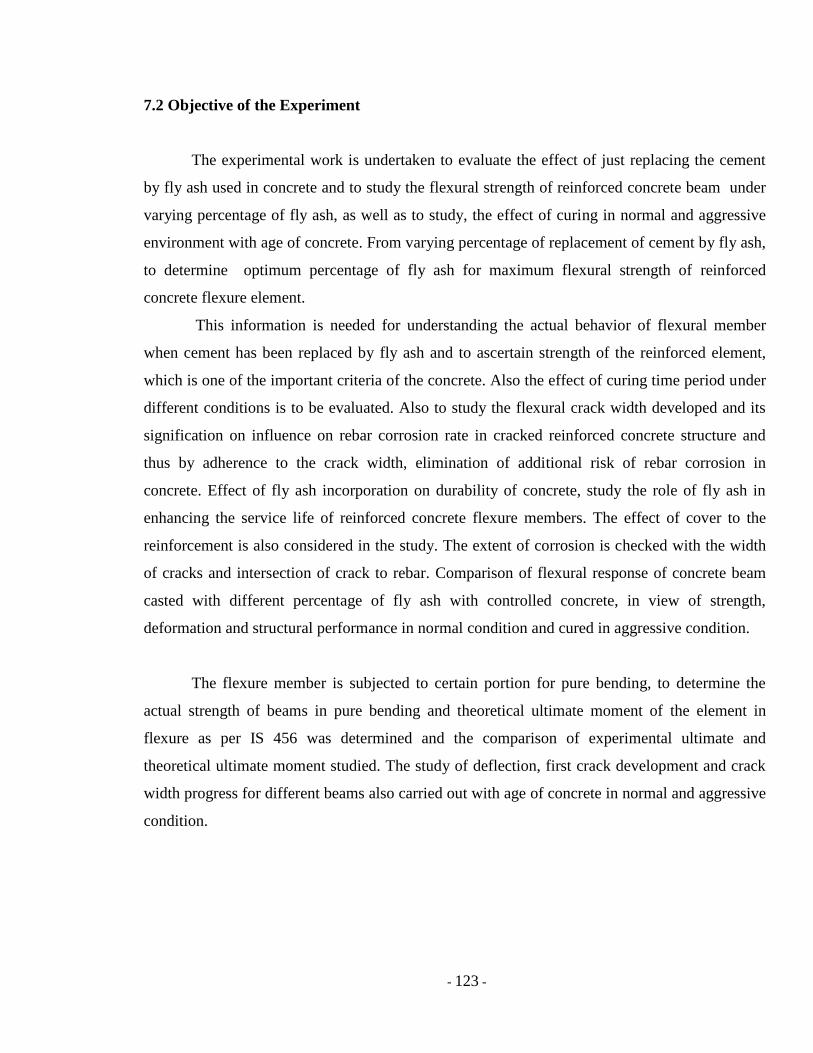
CHAPTER 7
EXPERIMENTAL INVESTIGATION OF EFFECT OF FLY ASH ON FLEXURE
STRENGTH OF R. C. BEAMS IN AGGRESSIVE AND NORMAL CONDITION.
7.1 Introduction
Nowadays in the electric power generation become viable with coal-based thermal power
plants ,which producing a large volume of environmentally polluting fly ash with disposal
problem. Fly ash has a great virtue of being pozzolanic. This beneficial aspect of fly ash can be
advantageously used with cement. This leads to replacing cement with larger percentage of fly
ash. The content of fly ash incorporated in the blended cement, sold in market currently is of the
order of 20 to 30 %by weight of cement. The addition of such moderate percentage of fly ash
results in great benefits such as reduction in heat of hydration, minimisation of potential alkali-
aggregate reaction, significant reduction of steel corrosion, improvement of durability of
concrete, reduction in cost and the same time, this kind of substitution did not substantially affect
the early-age strength.
This experimental study is to investigate the flexure behavior of reinforced concrete
beams that were casted replacing upto 40 % cement by good quality of fly ash obtained from
thermal power plant at Sikka- Jamnagar Gujarat. The flexure behavior of beams casted with fly
ash were compared with that of control concrete beams, cured in normal condition (in potable
water) and cured in aggressive condition(sea water). The behavior in strength, deformation and
structural performance were compared in both curing conditions for both types of beams.
The test programme was designed to study the flexure response of conventional
reinforced concrete beams made of two different kinds of concrete, one of different percentage
of fly ash and the other control concrete for comparison. The percentage of reinforcement used
in the beams ranged from less than the minimum specified in the code to over reinforcement in
flexure members.
- 123 -
7.2 Objective of the Experiment
The experimental work is undertaken to evaluate the effect of just replacing the cement
by fly ash used in concrete and to study the flexural strength of reinforced concrete beam under
varying percentage of fly ash, as well as to study, the effect of curing in normal and aggressive
environment with age of concrete. From varying percentage of replacement of cement by fly ash,
to determine optimum percentage of fly ash for maximum flexural strength of reinforced
concrete flexure element.
This information is needed for understanding the actual behavior of flexural member
when cement has been replaced by fly ash and to ascertain strength of the reinforced element,
which is one of the important criteria of the concrete. Also the effect of curing time period under
different conditions is to be evaluated. Also to study the flexural crack width developed and its
signification on influence on rebar corrosion rate in cracked reinforced concrete structure and
thus by adherence to the crack width, elimination of additional risk of rebar corrosion in
concrete. Effect of fly ash incorporation on durability of concrete, study the role of fly ash in
enhancing the service life of reinforced concrete flexure members. The effect of cover to the
reinforcement is also considered in the study. The extent of corrosion is checked with the width
of cracks and intersection of crack to rebar. Comparison of flexural response of concrete beam
casted with different percentage of fly ash with controlled concrete, in view of strength,
deformation and structural performance in normal condition and cured in aggressive condition.
The flexure member is subjected to certain portion for pure bending, to determine the
actual strength of beams in pure bending and theoretical ultimate moment of the element in
flexure as per IS 456 was determined and the comparison of experimental ultimate and
theoretical ultimate moment studied. The study of deflection, first crack development and crack
width progress for different beams also carried out with age of concrete in normal and aggressive
condition.
- 124 -
7.3 Experimental Work
7.3.1 Materials
The constituents of concrete mix, Cement, fly ash, Fine Aggregate, Coarse Aggregate,
water and mid steel as a reinforcement are used in casting of flexure concrete elements. The
detailed descriptions and test properties of materials are as follows.
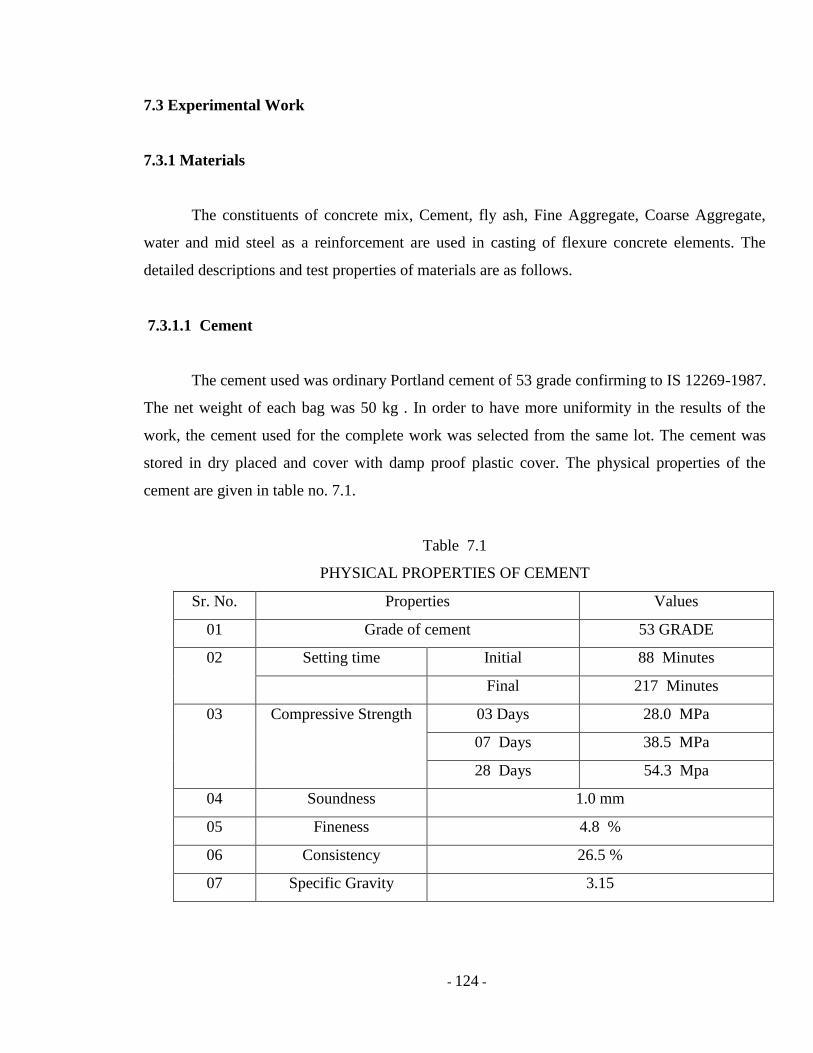
7.3.1.1 Cement
The cement used was ordinary Portland cement of 53 grade confirming to IS 12269-1987.
The net weight of each bag was 50 kg . In order to have more uniformity in the results of the
work, the cement used for the complete work was selected from the same lot. The cement was
stored in dry placed and cover with damp proof plastic cover. The physical properties of the
cement are given in table no. 7.1.
Table 7.1
PHYSICAL PROPERTIES OF CEMENT
Sr. No. Properties Values
01 Grade of cement 53 GRADE
02 Setting time Initial 88 Minutes
Final 217 Minutes
03 Compressive Strength 03 Days 28.0 MPa
07 Days 38.5 MPa
28 Days 54.3 Mpa
04 Soundness 1.0 mm
05 Fineness 4.8 %
06 Consistency 26.5 %
07 Specific Gravity 3.15
- 125 -
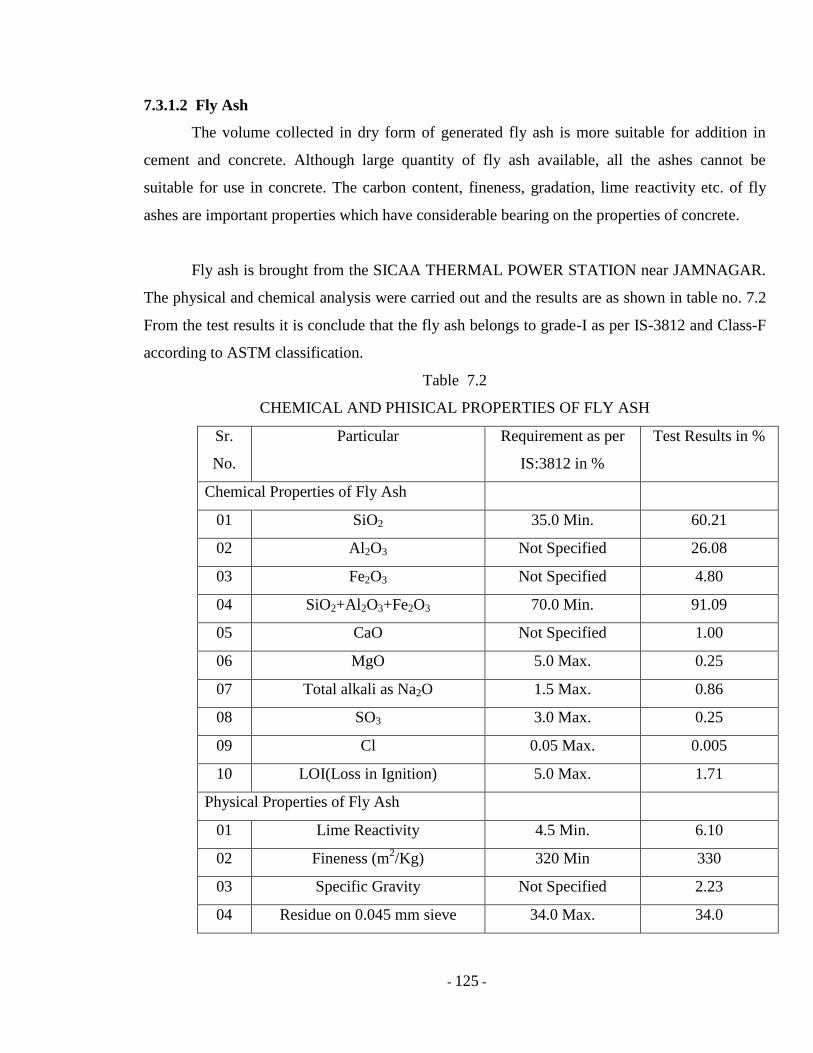
7.3.1.2 Fly Ash
The volume collected in dry form of generated fly ash is more suitable for addition in
cement and concrete. Although large quantity of fly ash available, all the ashes cannot be
suitable for use in concrete. The carbon content, fineness, gradation, lime reactivity etc. of fly
ashes are important properties which have considerable bearing on the properties of concrete.
Fly ash is brought from the SICAA THERMAL POWER STATION near JAMNAGAR.
The physical and chemical analysis were carried out and the results are as shown in table no. 7.2
From the test results it is conclude that the fly ash belongs to grade-I as per IS-3812 and Class-F
according to ASTM classification.
Table 7.2
CHEMICAL AND PHISICAL PROPERTIES OF FLY ASH
Sr.
No.
Particular Requirement as per
IS:3812 in %
Test Results in %
Chemical Properties of Fly Ash
01 SiO2 35.0 Min. 60.21
02 Al2O3 Not Specified 26.08
03 Fe2O3 Not Specified 4.80
04 SiO2+Al2O3+Fe2O3 70.0 Min. 91.09
05 CaO Not Specified 1.00
06 MgO 5.0 Max. 0.25
07 Total alkali as Na2O 1.5 Max. 0.86
08 SO3 3.0 Max. 0.25
09 Cl 0.05 Max. 0.005
10 LOI(Loss in Ignition) 5.0 Max. 1.71
Physical Properties of Fly Ash
01 Lime Reactivity 4.5 Min. 6.10
02 Fineness (m2/Kg) 320 Min 330
03 Specific Gravity Not Specified 2.23
04 Residue on 0.045 mm sieve 34.0 Max. 34.0
- 126 -
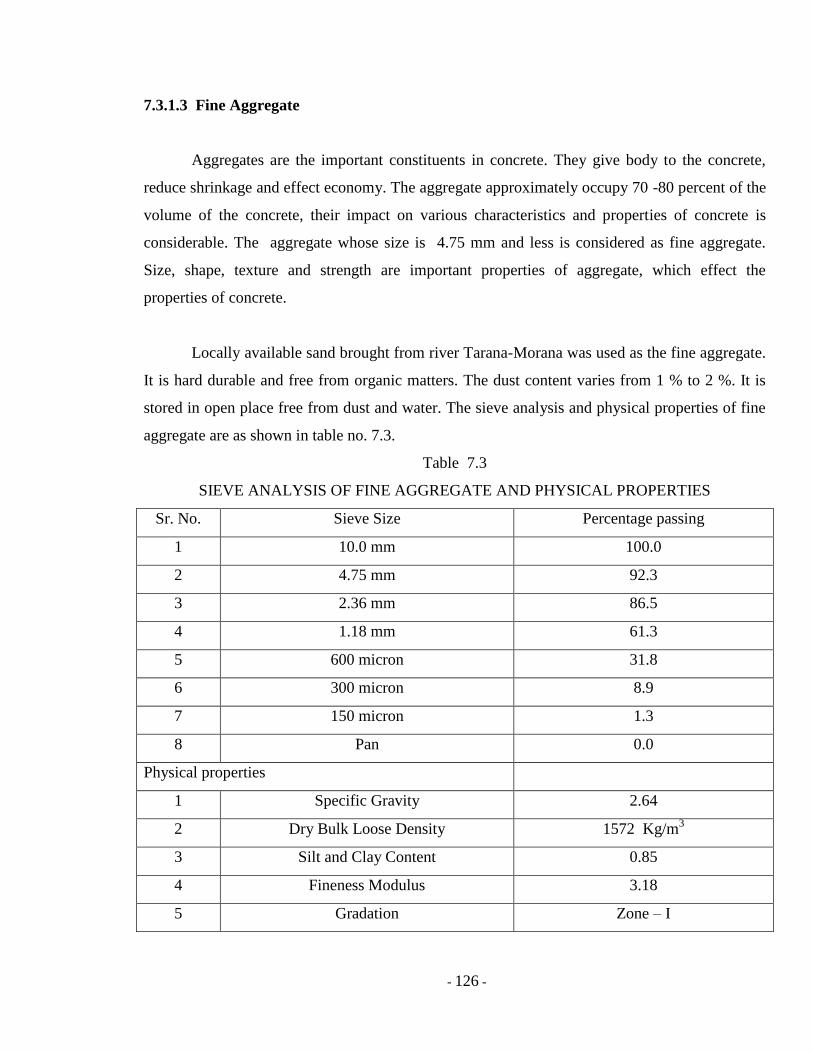
7.3.1.3 Fine Aggregate
Aggregates are the important constituents in concrete. They give body to the concrete,
reduce shrinkage and effect economy. The aggregate approximately occupy 70 -80 percent of the
volume of the concrete, their impact on various characteristics and properties of concrete is
considerable. The aggregate whose size is 4.75 mm and less is considered as fine aggregate.
Size, shape, texture and strength are important properties of aggregate, which effect the
properties of concrete.
Locally available sand brought from river Tarana-Morana was used as the fine aggregate.
It is hard durable and free from organic matters. The dust content varies from 1 % to 2 %. It is
stored in open place free from dust and water. The sieve analysis and physical properties of fine
aggregate are as shown in table no. 7.3.
Table 7.3
SIEVE ANALYSIS OF FINE AGGREGATE AND PHYSICAL PROPERTIES
Sr. No. Sieve Size Percentage passing
1 10.0 mm 100.0
2 4.75 mm 92.3
3 2.36 mm 86.5
4 1.18 mm 61.3
5 600 micron 31.8
6 300 micron 8.9
7 150 micron 1.3
8 Pan 0.0
Physical properties
1 Specific Gravity 2.64
2 Dry Bulk Loose Density 1572 Kg/m3
3 Silt and Clay Content 0.85
4 Fineness Modulus 3.18
5 Gradation Zone – I
- 127 -
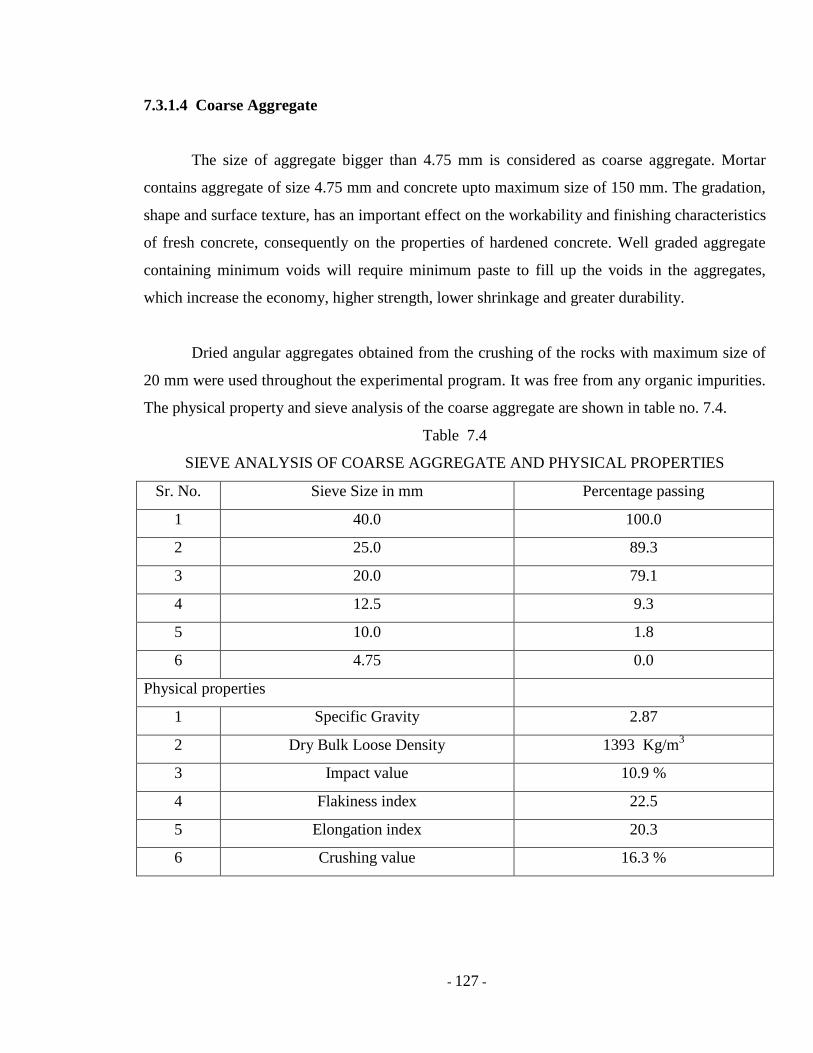
7.3.1.4 Coarse Aggregate
The size of aggregate bigger than 4.75 mm is considered as coarse aggregate. Mortar
contains aggregate of size 4.75 mm and concrete upto maximum size of 150 mm. The gradation,
shape and surface texture, has an important effect on the workability and finishing characteristics
of fresh concrete, consequently on the properties of hardened concrete. Well graded aggregate
containing minimum voids will require minimum paste to fill up the voids in the aggregates,
which increase the economy, higher strength, lower shrinkage and greater durability.
Dried angular aggregates obtained from the crushing of the rocks with maximum size of
20 mm were used throughout the experimental program. It was free from any organic impurities.
The physical property and sieve analysis of the coarse aggregate are shown in table no. 7.4.
Table 7.4
SIEVE ANALYSIS OF COARSE AGGREGATE AND PHYSICAL PROPERTIES
Sr. No. Sieve Size in mm Percentage passing
1 40.0 100.0
2 25.0 89.3
3 20.0 79.1
4 12.5 9.3
5 10.0 1.8
6 4.75 0.0
Physical properties
1 Specific Gravity 2.87
2 Dry Bulk Loose Density 1393 Kg/m3
3 Impact value 10.9 %
4 Flakiness index 22.5
5 Elongation index 20.3
6 Crushing value 16.3 %
- 128 -
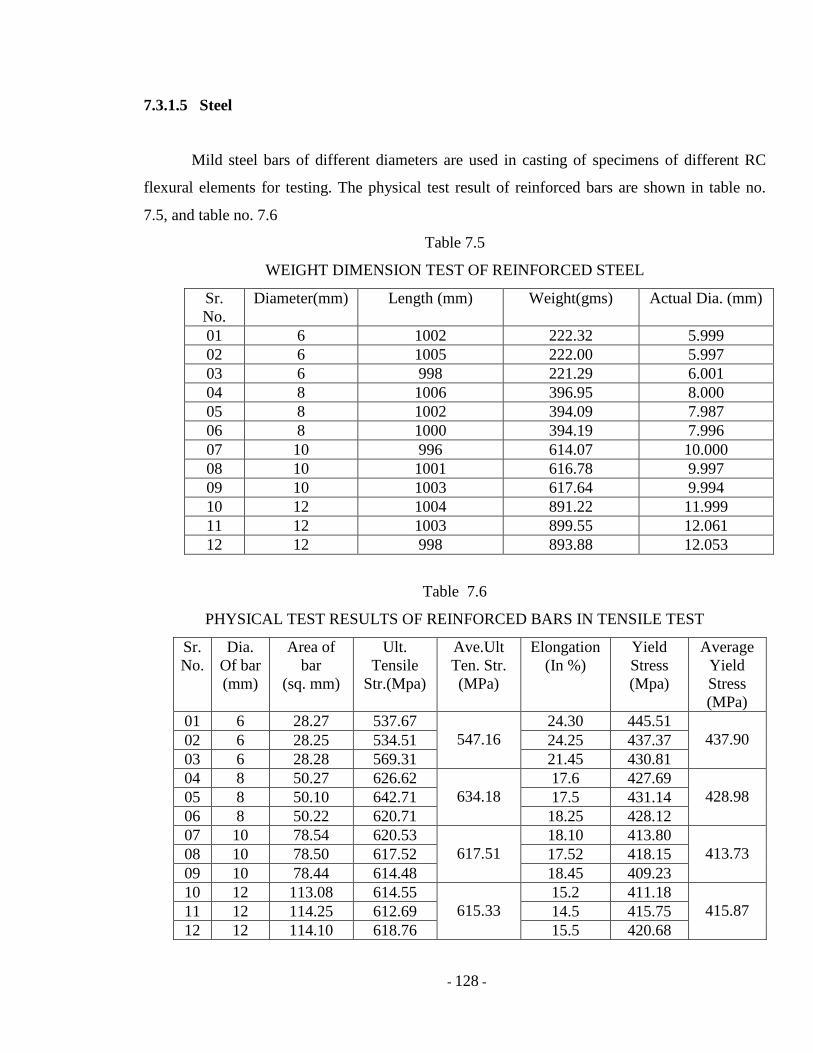
7.3.1.5 Steel
Mild steel bars of different diameters are used in casting of specimens of different RC
flexural elements for testing. The physical test result of reinforced bars are shown in table no.
7.5, and table no. 7.6
Table 7.5
WEIGHT DIMENSION TEST OF REINFORCED STEEL
Sr.
No.
Diameter(mm) Length (mm) Weight(gms) Actual Dia. (mm)
01 6 1002 222.32 5.999
02 6 1005 222.00 5.997
03 6 998 221.29 6.001
04 8 1006 396.95 8.000
05 8 1002 394.09 7.987
06 8 1000 394.19 7.996
07 10 996 614.07 10.000
08 10 1001 616.78 9.997
09 10 1003 617.64 9.994
10 12 1004 891.22 11.999
11 12 1003 899.55 12.061
12 12 998 893.88 12.053
Table 7.6
PHYSICAL TEST RESULTS OF REINFORCED BARS IN TENSILE TEST
Sr.
No.
Dia.
Of bar
(mm)
Area of
bar
(sq. mm)
Ult.
Tensile
Str.(Mpa)
Ave.Ult
Ten. Str.
(MPa)
Elongation
(In %)
Yield
Stress
(Mpa)
Average
Yield
Stress
(MPa)
01 6 28.27 537.67
547.16
24.30 445.51
437.90 02 6 28.25 534.51 24.25 437.37
03 6 28.28 569.31 21.45 430.81
04 8 50.27 626.62
634.18
17.6 427.69
428.98 05 8 50.10 642.71 17.5 431.14
06 8 50.22 620.71 18.25 428.12
07 10 78.54 620.53
617.51
18.10 413.80
413.73 08 10 78.50 617.52 17.52 418.15
09 10 78.44 614.48 18.45 409.23
10 12 113.08 614.55
615.33
15.2 411.18
415.87 11 12 114.25 612.69 14.5 415.75
12 12 114.10 618.76 15.5 420.68
- 129 -
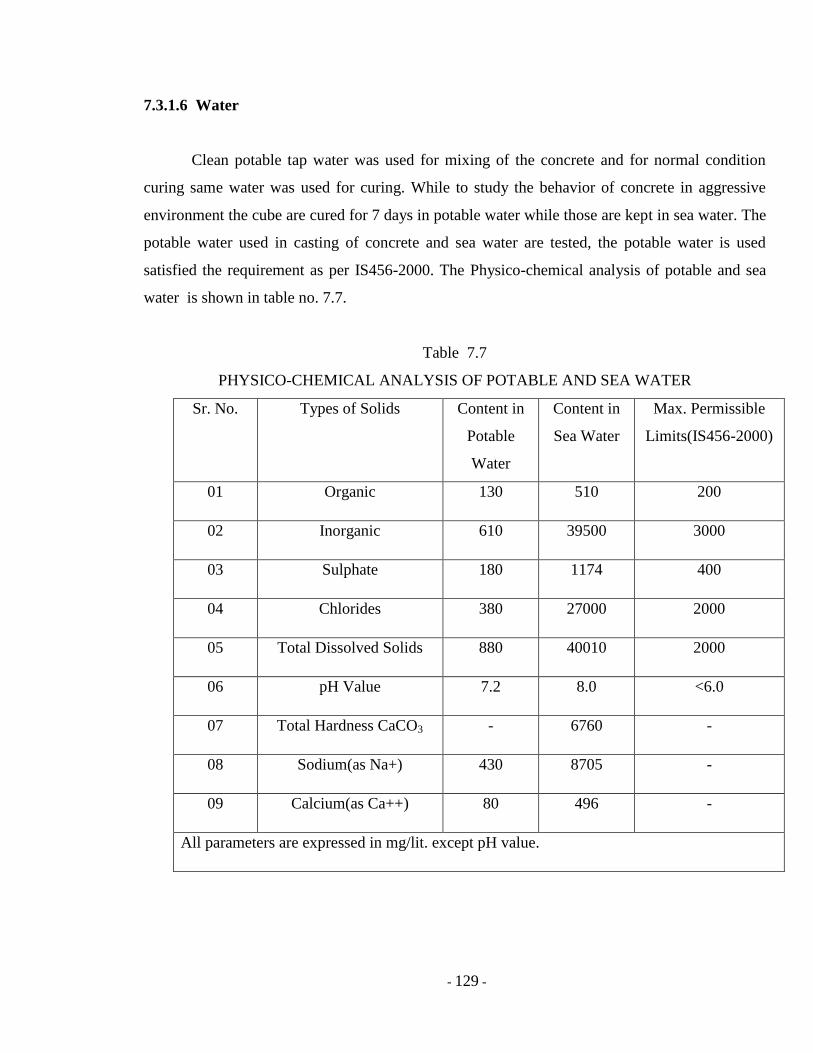
7.3.1.6 Water
Clean potable tap water was used for mixing of the concrete and for normal condition
curing same water was used for curing. While to study the behavior of concrete in aggressive
environment the cube are cured for 7 days in potable water while those are kept in sea water. The
potable water used in casting of concrete and sea water are tested, the potable water is used
satisfied the requirement as per IS456-2000. The Physico-chemical analysis of potable and sea
water is shown in table no. 7.7.
Table 7.7
PHYSICO-CHEMICAL ANALYSIS OF POTABLE AND SEA WATER
Sr. No. Types of Solids Content in
Potable
Water
Content in
Sea Water
Max. Permissible
Limits(IS456-2000)
01 Organic 130 510 200
02 Inorganic 610 39500 3000
03 Sulphate 180 1174 400
04 Chlorides 380 27000 2000
05 Total Dissolved Solids 880 40010 2000
06 pH Value 7.2 8.0 <6.0
07 Total Hardness CaCO3 - 6760 -
08 Sodium(as Na+) 430 8705 -
09 Calcium(as Ca++) 80 496 -
All parameters are expressed in mg/lit. except pH value.

- 130 -
7.3.2 Concrete Mix Design
In this research the fly ash concrete was produced by replacing cement with fly ash, the
replacement level varied from 10 percent to 40 percent. The replacement level of fly ash is
primarily based on the required compressive strength of concrete among all other things. In
current investigation, to arrive at the content of fly ash to be blended with cement. The question
for new materials is always on, for better efficiency, functional utility, easy availability,
environmental acceptability and finally lesser cost.
All the R. C. elements and cubes are casted with concrete Mix -20, the mix is design as
per IS method and the proportion of materials required per m3 are shown in table no. 7.8
Table 7.8
CONTENT PER m3 OF CONCRETE
Sr.
No.
Description Content per m3 of concrete
01 Coarse Agg. [kg] 1240.0 1240.0 1240.0 1240.0 1240.0
02 Fine Agg. [kg] 614.0 614.0 614.0 614.0 614.0
03 Water[lit.] 191.6 191.6 191.6 191.6 191.6
04 Fly Ash % replacement of
cement
0 10 20 30 40
05 Fly Ash [kg] 0.0 38.3 76.6 114.9 153.2
06 Cement[ kg ] 383.0 344.7 306.4 268.1 229.8
07 Water/Cementitious
material
0.5 0.5 0.5 0.5 0.5
- 131 -
7.3.3 Instruments
To test the materials used in the casting of reinforced flexural concrete elements, i. e.
cement, fine aggregate, coarse aggregate, water and fly ash, some of the instruments used in
laboratory are already described in chapter 6 in para 6.3.3 and addition instruments used are as
follows.
1, Dial gauge: 0.01 mm x 25 mm travel.
Baker make high sensitive with dual dial
having least count 0.01 mm and travel of 25
mm
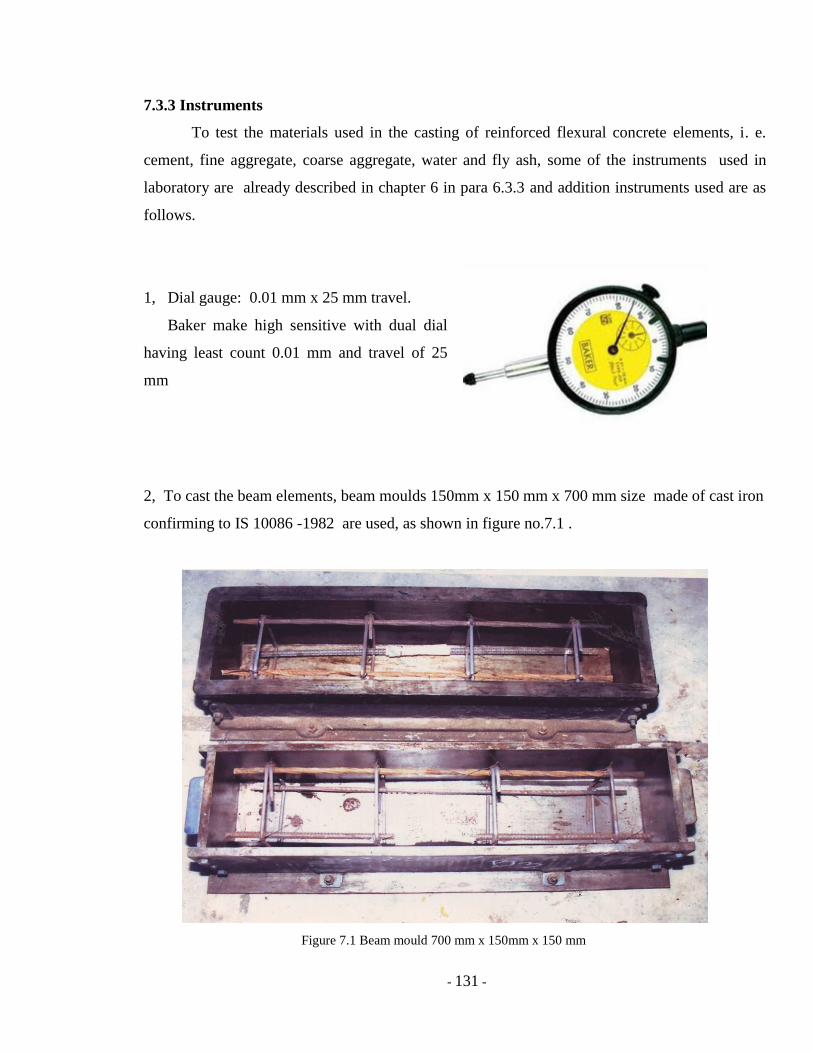
2, To cast the beam elements, beam moulds 150mm x 150 mm x 700 mm size made of cast iron
confirming to IS 10086 -1982 are used, as shown in figure no.7.1 .
Figure 7.1 Beam mould 700 mm x 150mm x 150 mm

- 132 -
3, Universal Testing Machine : To test the tensile strength of reinforcement steel of different
diameter and flexural test on reinforced concrete beam in pure bending the universal testing
machine as shown in figure 7.2, with three measuring range of maximum capacity of 400 kN.
was used.
Figure 7.2 Universal Testing Machine
The machine has the facilities for flexure loading for pure bending and load stabilizer
device for the consistent load. Electrically operated with facility of to apply uniform rate of
loading, with following specification and standard accessories was used.

- 133 -
Specifications of Universal Testing Machine
Model detail ENKAY ENTERPRISE
Load Dial Range I, 0 - 40 kN Least count 0.1 kN
II , 0 - 200 kN Least count 0.5 kN
III, 0 - 400 kN Least count 1 kN
Clearance for Tension test 0- 700mm
Clearance for compression test 0 - 700 mm
Clearance between column 500 mm
Ram stroke 200 mm
Straining/piston speed at no load 0 – 150 mm/min.
Standard Accessories:
For tension clamping jaws for round specimens 6 – 20 mm and 25 – 40 mm
Pair of compression plate of diameter 120 mm
For transverse test,
Table with adjustable rollers width of rollers
160 mm
Diameter of rollers 30 mm
Maximum clearance between supports 700 mm
Radius of punch tops 12 mm and 16 mm
Operation Hydraulic pressure
- 134 -
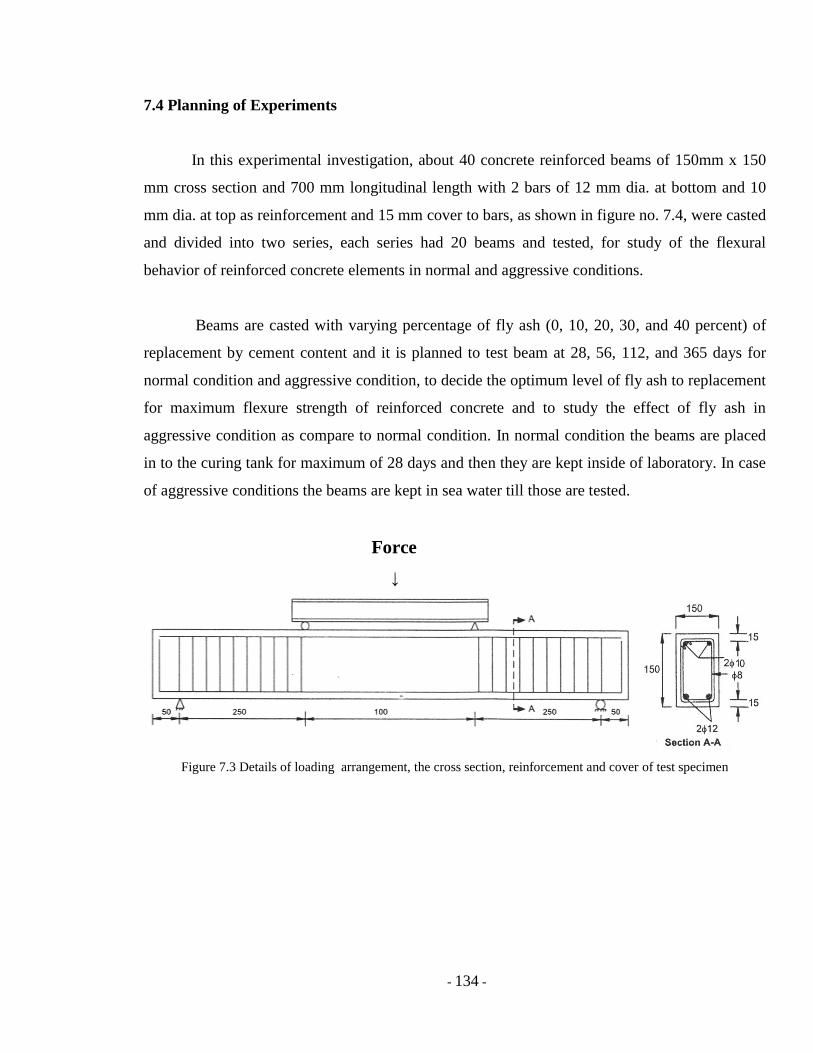
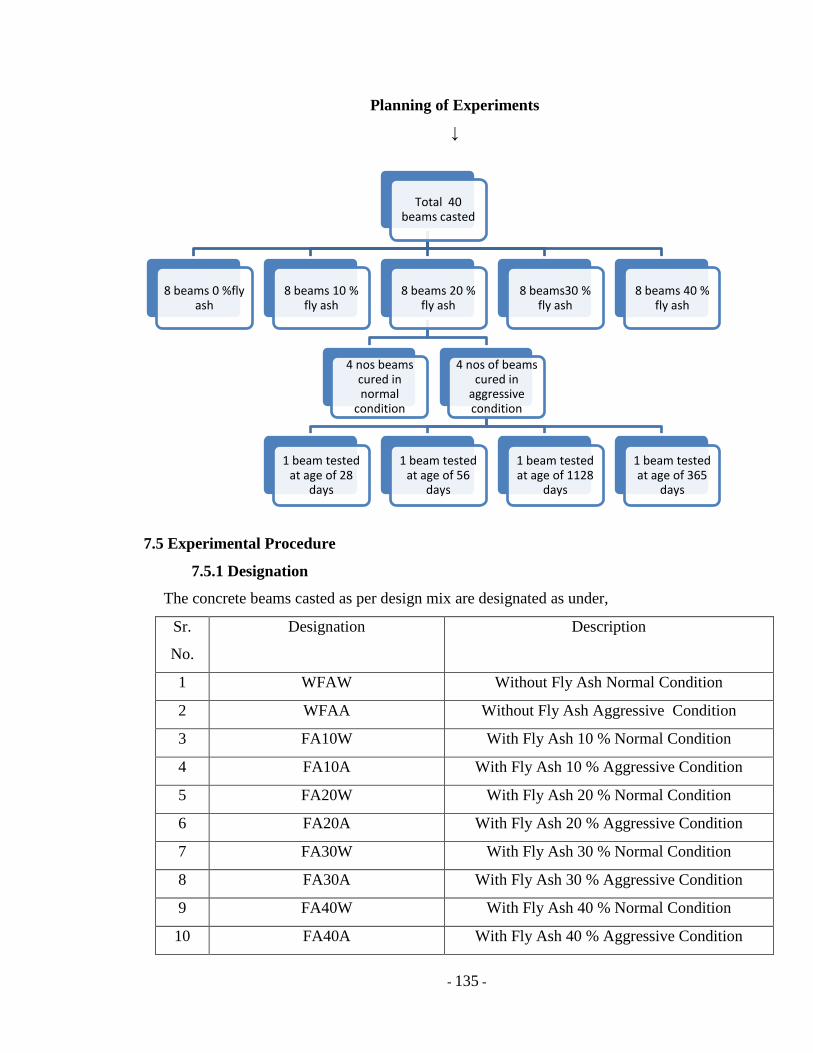
7.4 Planning of Experiments
In this experimental investigation, about 40 concrete reinforced beams of 150mm x 150
mm cross section and 700 mm longitudinal length with 2 bars of 12 mm dia. at bottom and 10
mm dia. at top as reinforcement and 15 mm cover to bars, as shown in figure no. 7.4, were casted
and divided into two series, each series had 20 beams and tested, for study of the flexural
behavior of reinforced concrete elements in normal and aggressive conditions.
Beams are casted with varying percentage of fly ash (0, 10, 20, 30, and 40 percent) of
replacement by cement content and it is planned to test beam at 28, 56, 112, and 365 days for
normal condition and aggressive condition, to decide the optimum level of fly ash to replacement
for maximum flexure strength of reinforced concrete and to study the effect of fly ash in
aggressive condition as compare to normal condition. In normal condition the beams are placed
in to the curing tank for maximum of 28 days and then they are kept inside of laboratory. In case
of aggressive conditions the beams are kept in sea water till those are tested.
Force
↓
Figure 7.3 Details of loading arrangement, the cross section, reinforcement and cover of test specimen
- 135 -
Planning of Experiments
↓
7.5 Experimental Procedure
7.5.1 Designation
The concrete beams casted as per design mix are designated as under,
Sr.
No.
Designation Description
1 WFAW Without Fly Ash Normal Condition
2 WFAA Without Fly Ash Aggressive Condition
3 FA10W With Fly Ash 10 % Normal Condition
4 FA10A With Fly Ash 10 % Aggressive Condition
5 FA20W With Fly Ash 20 % Normal Condition
6 FA20A With Fly Ash 20 % Aggressive Condition
7 FA30W With Fly Ash 30 % Normal Condition
8 FA30A With Fly Ash 30 % Aggressive Condition
9 FA40W With Fly Ash 40 % Normal Condition
10 FA40A With Fly Ash 40 % Aggressive Condition
Total 40 beams casted
8 beams 0 %fly ash
8 beams 10 % fly ash
8 beams 20 % fly ash
4 nos beams cured in normal
condition
4 nos of beams cured in
aggressive condition
1 beam tested at age of 28
days
1 beam tested at age of 56
days
1 beam tested at age of 1128
days
1 beam tested at age of 365
days
8 beams30 % fly ash
8 beams 40 % fly ash

- 136 -
7.5.2 Moulds and Their Preparation
Utmost care was taken in selecting the moulds for the preparation of the test specimens.
The moulds were made so as to facilitate the removal of the molded specimen without any
damage. The moulds used for casting the concrete beams specimens were of the size 150mm ×
150mm × 700 mm. Each was inspected to prevent any leakage during compaction and that
dimension of the mould was accurate within the allowable limit. Before filling the concrete, the
inner face of the moulds was oiled to prevent sticking of the concrete to the sides of the moulds.
The care was taken to kept uniform cover to reinforcement with standard cement cover pieces.
Simultaneously concrete cubes are also casted for checking of characteristic compressive
strength and concrete cylinders are also casted for splitting tensile strength of concrete.
7.5.3 Preparation of the concrete mix
Dried materials were taken, as per weight batching system. First coarse aggregate
dumped in the hopper of concrete mixer, and fine aggregate, cement and fly ash are in sequence
pored in hoper. All materials are transferred in drum of mixer and then with help of gauged
container, water pored in the drum as per water /cemititious material ratio. Mixed materials until
the concrete appeared to be homogenous had a desired consistency.
7.5.4 Casting of the Specimens
In order to obtain a dense mix of the concrete, it was essential to compact it well.
Compaction of the concrete was achieved by using an electrically driven vibrating table. At a
time, three moulds were filled with wet concrete and were vibrated on the vibrating table.
Concrete was fully compacted by giving vibration on the vibrating table. Sufficient care was
taken to see that the wet concrete was properly filled in the corners and the edges of the mould
and proper cover to the reinforcement bars. As soon as air bubble stopped to rise to the top
surface, the mould was removed from the vibrating table and the surface was finished with
trowel. It was then carefully stored at a suitable space in laboratory.

- 137 -
7.5.5 Vibrating Period
At a time, three specimens of beams were vibrated on table. The time of vibration to
properly compacted the concrete in the mould is variable depending on the grade of concrete and
water – cementitious materials ratio. It depends upon the type of coarse aggregate, proportion of
fine to coarse aggregate and water- cementitious materials ratio of the concrete mix. In short, it
depends on the workability of the concrete mix. Mixes prepared with crushed stone and greater
water cement ratio requires less time than that with lower water cement ratio. The time required
for compacting concrete by vibration in this experimental work is 1 minute. As such the exact
time of vibration on the table vibrator cannot be specified and is to be continued till a smooth top
surface is obtained. The air bubble must cease to rise to the top of the mould.
7.5.6 Demoulding and Numbering of the Specimens
After casting of the concrete beams, they were left undisturbed in the mould for the first
24 hours. Then the specimens were carefully removed from the moulds without damaging the
edges of the beams. The concrete beams are then placed carefully on the floor and numbered.
The date of casting and the designation of the mix were mentioned on two faces of the concrete
cubes with paint or marker. A table was prepared on each day, which could immediately identify
any specimen cast on that day and the method of curing used for those specimens.
7.5.7 Curing of the Specimens
After casting of the specimens, for water curing the beams are placed inside curing tank
and they are allowed for water curing maximum up to 28 days then they are kept inside the
laboratory. In case of curing in aggressive environment the cubes were kept in sea water for the
curing up to testing period. All the specimens were properly grouped according their different
mix designation so the removal of the specimen from place for testing work, could be
conveniently done in a proper sequence.
- 138 -
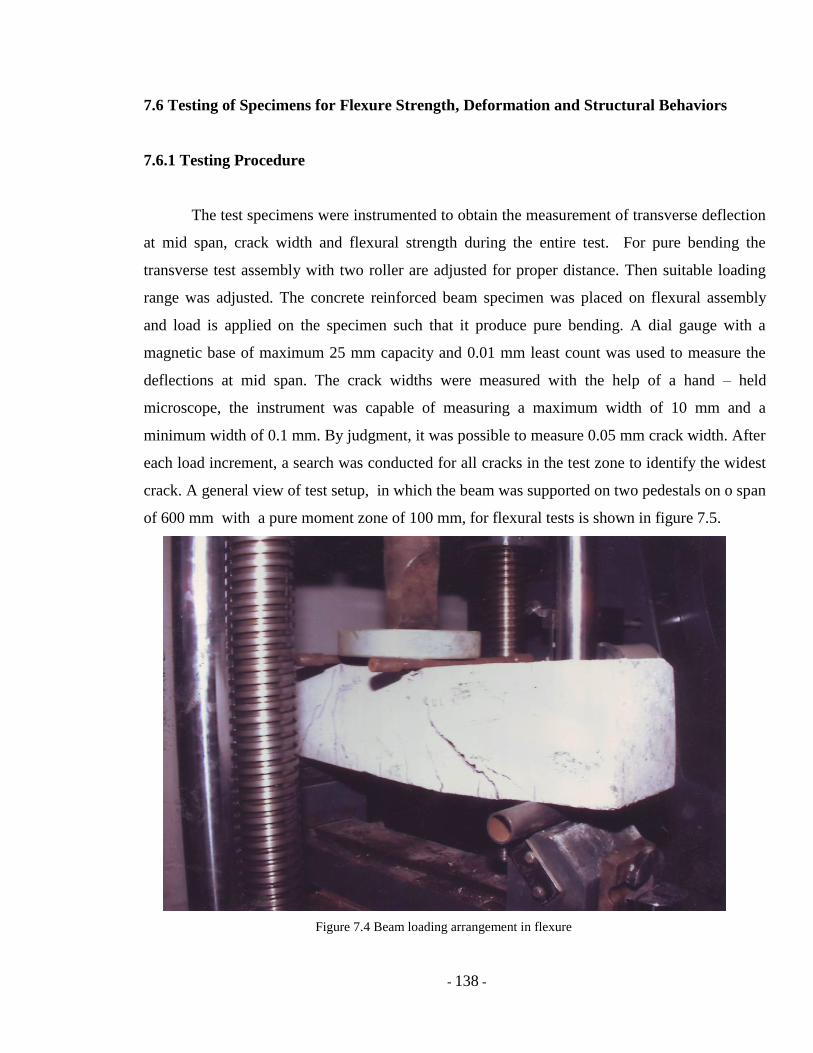
7.6 Testing of Specimens for Flexure Strength, Deformation and Structural Behaviors
7.6.1 Testing Procedure
The test specimens were instrumented to obtain the measurement of transverse deflection
at mid span, crack width and flexural strength during the entire test. For pure bending the
transverse test assembly with two roller are adjusted for proper distance. Then suitable loading
range was adjusted. The concrete reinforced beam specimen was placed on flexural assembly
and load is applied on the specimen such that it produce pure bending. A dial gauge with a
magnetic base of maximum 25 mm capacity and 0.01 mm least count was used to measure the
deflections at mid span. The crack widths were measured with the help of a hand – held
microscope, the instrument was capable of measuring a maximum width of 10 mm and a
minimum width of 0.1 mm. By judgment, it was possible to measure 0.05 mm crack width. After
each load increment, a search was conducted for all cracks in the test zone to identify the widest
crack. A general view of test setup, in which the beam was supported on two pedestals on o span
of 600 mm with a pure moment zone of 100 mm, for flexural tests is shown in figure 7.5.
Figure 7.4 Beam loading arrangement in flexure
- 139 -
Each beam was tested to failure by applying loads in a series of increments of 5 kN load.
It took one and one half minute for increasing the load to the specified limit. The holding period
for each increment varied from two to three minutes, during which load and deformation data
were noted and stored. The load was stabilized to a certain value with increment by help of load
stabilizer device attached with the machine.
7.6.2 Test Results
The testing of beam specimens of cross section 150 mm x 150 mm over the simply
supported span of 600 mm. The beam is supported on two pedestals and the load was applied to
the beam with help of flexure load assembly, to create the pure bending in a certain middle part
of the beam, which served as test zone. The beam has reinforcement at bottom 2 -12 mm dia.
and 2- 10 mm dia. at top, with effective cover of 15mm, tests were carried out as per testing
procedure, for the beams of control concrete and the beams having various percentage of fly ash.
The tests were carried out for two same groups of beams kept in normal condition and aggressive
condition.
The results were tabulated for the flexure load and respective central deflection and crack
width, for different load increment. For each beam the first crack load were observed and
beams was tested to the failure by applying loads in a series of increments.
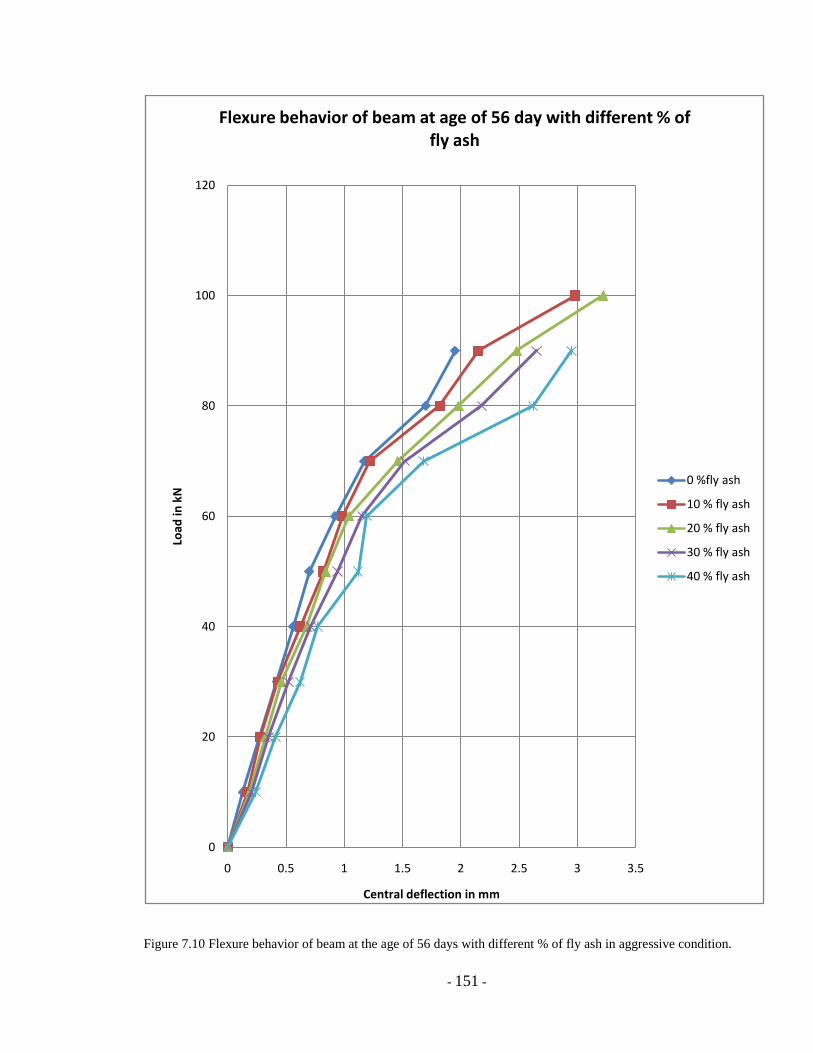
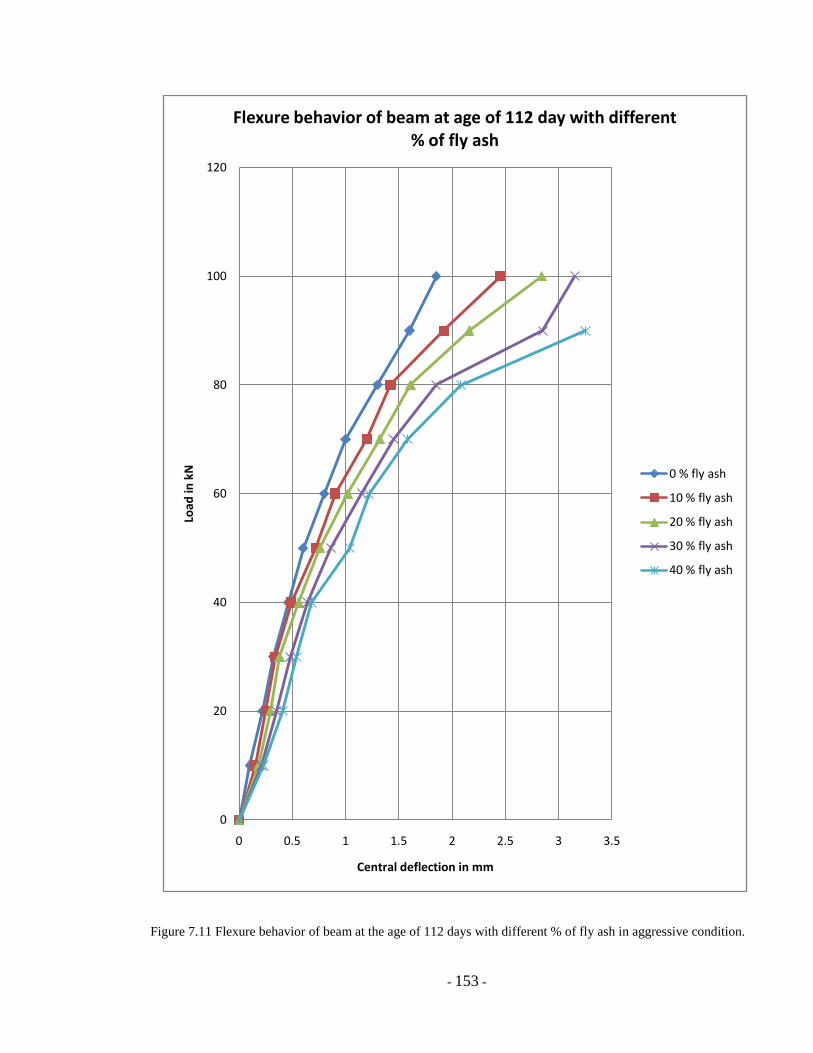
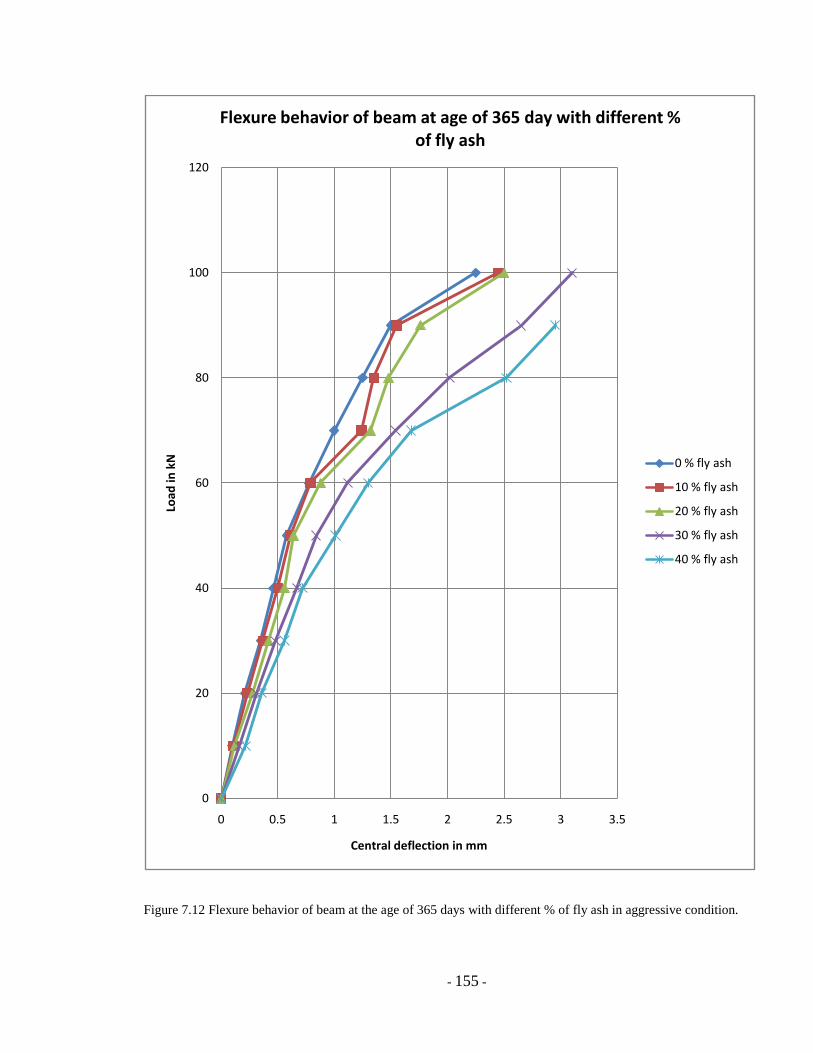
Load – deflection curves for all the beams at the age of 28 days, 56 days 112 days and
365 days in normal condition are shown in figure 7.5 to 7.8 and similarly Load – deflection
curves for all the beams at the age of 28 days, 56 days 112 days and 365 days in aggressive
condition are shown in figure 7.9 to 7.12.
- 140 -
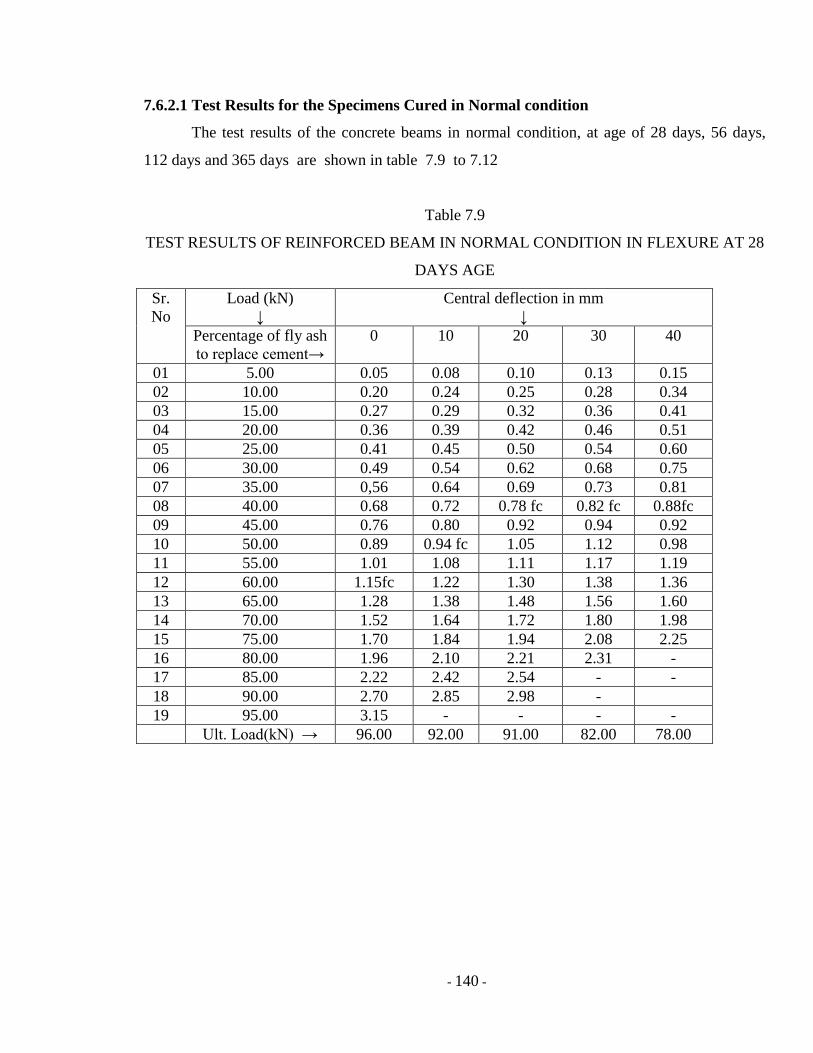
7.6.2.1 Test Results for the Specimens Cured in Normal condition
The test results of the concrete beams in normal condition, at age of 28 days, 56 days,
112 days and 365 days are shown in table 7.9 to 7.12
Table 7.9
TEST RESULTS OF REINFORCED BEAM IN NORMAL CONDITION IN FLEXURE AT 28
DAYS AGE
Sr.
No
Load (kN)
↓
Central deflection in mm
↓
Percentage of fly ash
to replace cement→
0 10 20 30 40
01 5.00 0.05 0.08 0.10 0.13 0.15
02 10.00 0.20 0.24 0.25 0.28 0.34
03 15.00 0.27 0.29 0.32 0.36 0.41
04 20.00 0.36 0.39 0.42 0.46 0.51
05 25.00 0.41 0.45 0.50 0.54 0.60
06 30.00 0.49 0.54 0.62 0.68 0.75
07 35.00 0,56 0.64 0.69 0.73 0.81
08 40.00 0.68 0.72 0.78 fc 0.82 fc 0.88fc
09 45.00 0.76 0.80 0.92 0.94 0.92
10 50.00 0.89 0.94 fc 1.05 1.12 0.98
11 55.00 1.01 1.08 1.11 1.17 1.19
12 60.00 1.15fc 1.22 1.30 1.38 1.36
13 65.00 1.28 1.38 1.48 1.56 1.60
14 70.00 1.52 1.64 1.72 1.80 1.98
15 75.00 1.70 1.84 1.94 2.08 2.25
16 80.00 1.96 2.10 2.21 2.31 -
17 85.00 2.22 2.42 2.54 - -
18 90.00 2.70 2.85 2.98 -
19 95.00 3.15 - - - -
Ult. Load(kN) → 96.00 92.00 91.00 82.00 78.00

- 141 -
Figure 7.5 Flexure behavior of beam at the age of 28 days with different % of fly ash in normal condition.
0
10
20
30
40
50
60
70
80
90
100
0 0.5 1 1.5 2 2.5 3 3.5
Load
in k
N
Central deflection in mm
Flexure behavior of beam at age of 28 day with different % of fly ash
0 % fly ash
10 % fly ash
20 % fly ash
30% fly ash
40 % fly ash

- 142 -
Table 7.10
TEST RESULTS OF REINFORCED BEAM IN NORMAL CONDITION IN FLEXURE AT 56
DAYS AGE
Sr.
No
Load (kN)
↓
Central deflection in mm
↓
Percentage of fly ash
to replace cement→
0 10 20 30 40
01 5.00 0.15 0.18 0.20 0.22 0.30
02 10.00 0.19 0.22 0.25 0.27 0.32
03 15.00 0.26 0.29 0.32 0.34 0.39
04 20.00 0.33 0.34 0.40 0.42 0.47
05 25.00 0.38 0.42 0.49 0.51 0.58
06 30.00 0.43 0.51 0.58 0.60 0.70
07 35.00 0.53 0.62 0.65 0.71 0.78
08 40.00 0.63 0.70 0.72 fc 0.79 fc 0.86 fc
09 45.00 0.71 0.82 0.86 0.95 1.08
10 50.00 0.80 0.90 fc 1.00 1.10 1.24
11 55.00 0.88 1.02 1.10 1.21 1.28
12 60.00 1.00 fc 1.18 1.25 1.36 1.36
13 65.00 1.11 1.25 1.42 1.52 1.64
14 70.00 1.23 1.42 1.66 1.72 1.98
15 75.00 1.38 1.65 1.86 1.98 2.20
16 80.00 1.50 1.95 2.15 2.28 3.42
17 85.00 1.62 2.12 2.46 2.66 -
18 90.00 1.80 2.35 2.98 3.05 -
19 95.00 1.98 2.62 3.08 - -
20 100.00 2.22 2.98 3.22 - -
Ult. load (kN → 102.00 104.00 105.00 94.00 84.00
- 143 -
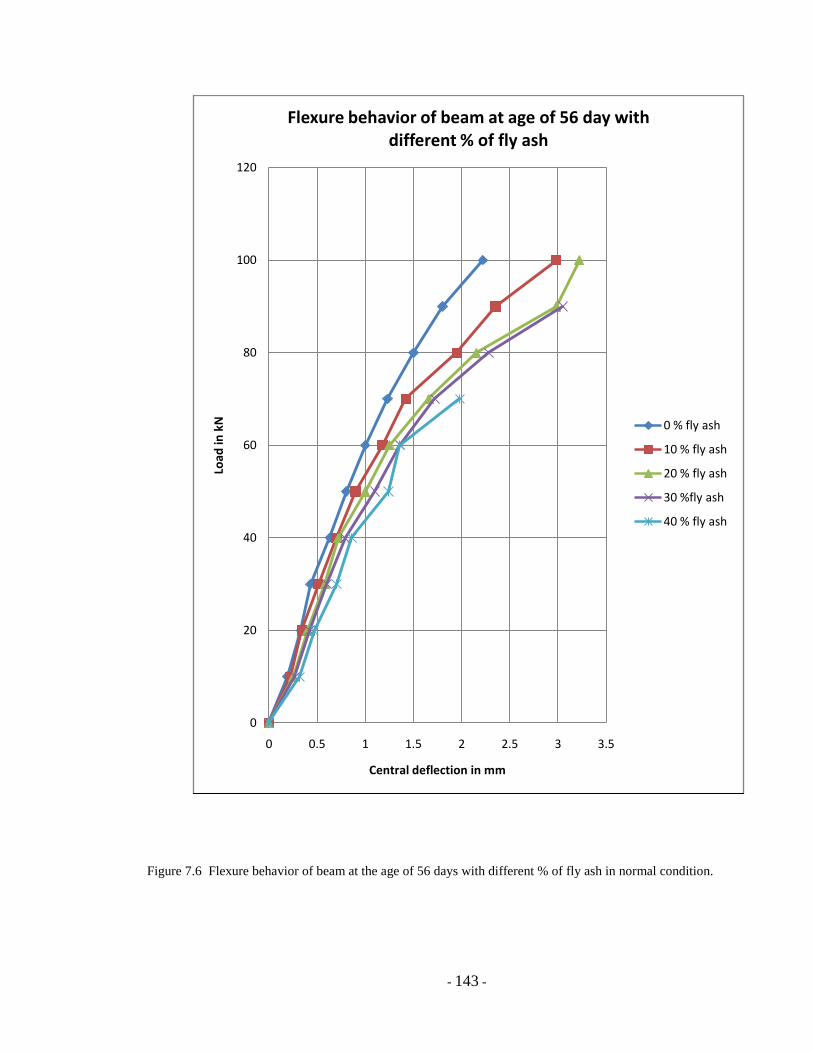
Figure 7.6 Flexure behavior of beam at the age of 56 days with different % of fly ash in normal condition.
0
20
40
60
80
100
120
0 0.5 1 1.5 2 2.5 3 3.5
Load
in k
N
Central deflection in mm
Flexure behavior of beam at age of 56 day with different % of fly ash
0 % fly ash
10 % fly ash
20 % fly ash
30 %fly ash
40 % fly ash
- 144 -
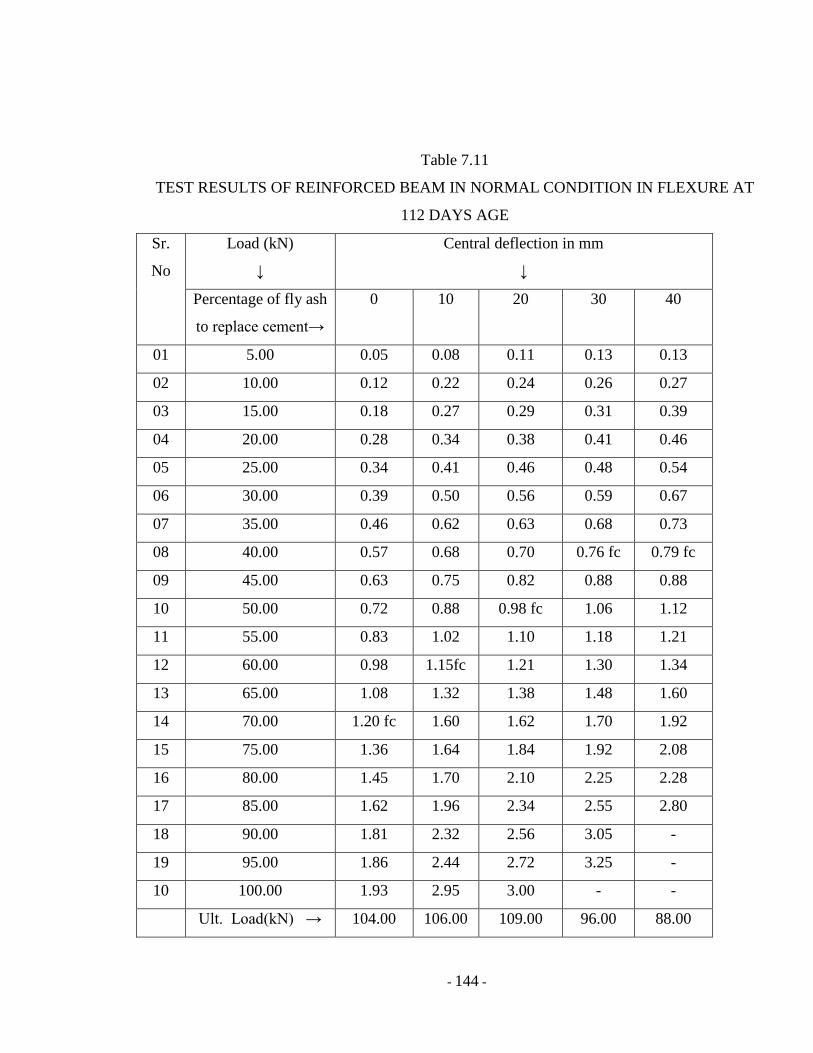
Table 7.11
TEST RESULTS OF REINFORCED BEAM IN NORMAL CONDITION IN FLEXURE AT
112 DAYS AGE
Sr.
No
Load (kN)
↓
Central deflection in mm
↓
Percentage of fly ash
to replace cement→
0 10 20 30 40
01 5.00 0.05 0.08 0.11 0.13 0.13
02 10.00 0.12 0.22 0.24 0.26 0.27
03 15.00 0.18 0.27 0.29 0.31 0.39
04 20.00 0.28 0.34 0.38 0.41 0.46
05 25.00 0.34 0.41 0.46 0.48 0.54
06 30.00 0.39 0.50 0.56 0.59 0.67
07 35.00 0.46 0.62 0.63 0.68 0.73
08 40.00 0.57 0.68 0.70 0.76 fc 0.79 fc
09 45.00 0.63 0.75 0.82 0.88 0.88
10 50.00 0.72 0.88 0.98 fc 1.06 1.12
11 55.00 0.83 1.02 1.10 1.18 1.21
12 60.00 0.98 1.15fc 1.21 1.30 1.34
13 65.00 1.08 1.32 1.38 1.48 1.60
14 70.00 1.20 fc 1.60 1.62 1.70 1.92
15 75.00 1.36 1.64 1.84 1.92 2.08
16 80.00 1.45 1.70 2.10 2.25 2.28
17 85.00 1.62 1.96 2.34 2.55 2.80
18 90.00 1.81 2.32 2.56 3.05 -
19 95.00 1.86 2.44 2.72 3.25 -
10 100.00 1.93 2.95 3.00 - -
Ult. Load(kN) → 104.00 106.00 109.00 96.00 88.00

- 145 -
Figure 7.7 Flexure behavior of beam at the age of112 days with different % of fly ash in normal condition.
0
20
40
60
80
100
120
0 0.5 1 1.5 2 2.5 3 3.5
Load
in k
N
Central deflection in mm
Flexure behavior of beam at age of 112 day with different % of fly ash
0 % fly ash
10 % fly ash
20 % fly ash
30 % fly ash
40 % fly ash
- 146 -
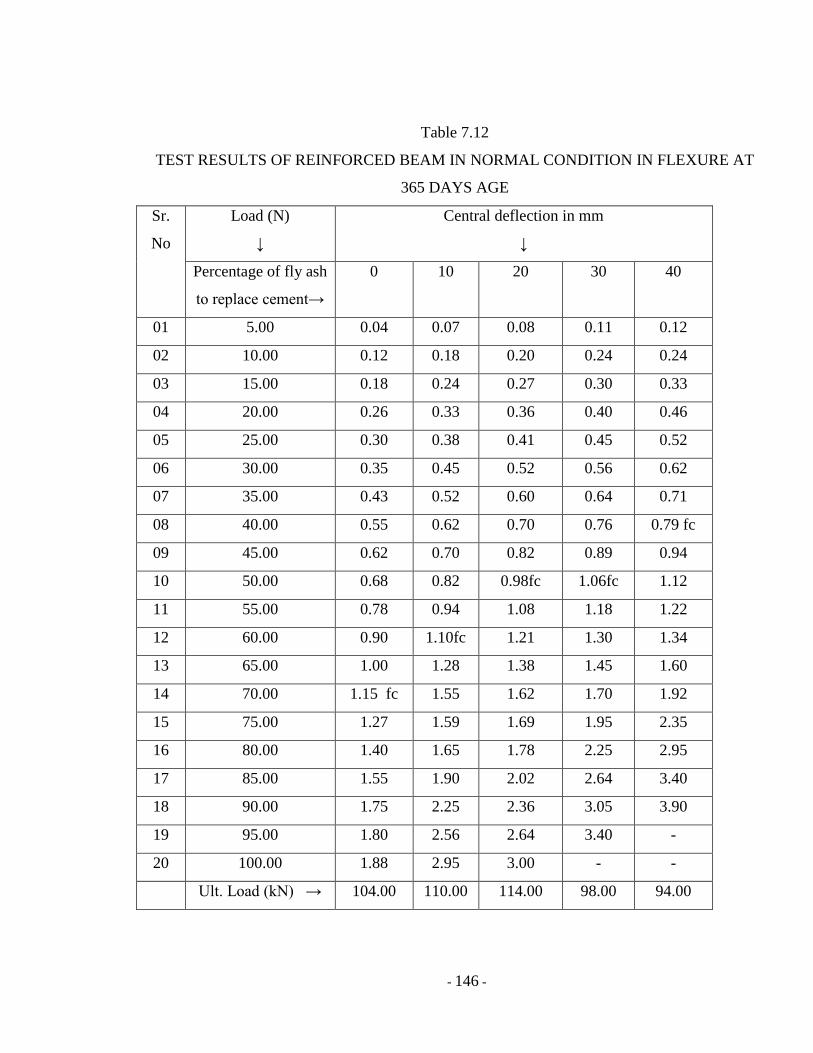
Table 7.12
TEST RESULTS OF REINFORCED BEAM IN NORMAL CONDITION IN FLEXURE AT
365 DAYS AGE
Sr.
No
Load (N)
↓
Central deflection in mm
↓
Percentage of fly ash
to replace cement→
0 10 20 30 40
01 5.00 0.04 0.07 0.08 0.11 0.12
02 10.00 0.12 0.18 0.20 0.24 0.24
03 15.00 0.18 0.24 0.27 0.30 0.33
04 20.00 0.26 0.33 0.36 0.40 0.46
05 25.00 0.30 0.38 0.41 0.45 0.52
06 30.00 0.35 0.45 0.52 0.56 0.62
07 35.00 0.43 0.52 0.60 0.64 0.71
08 40.00 0.55 0.62 0.70 0.76 0.79 fc
09 45.00 0.62 0.70 0.82 0.89 0.94
10 50.00 0.68 0.82 0.98fc 1.06fc 1.12
11 55.00 0.78 0.94 1.08 1.18 1.22
12 60.00 0.90 1.10fc 1.21 1.30 1.34
13 65.00 1.00 1.28 1.38 1.45 1.60
14 70.00 1.15 fc 1.55 1.62 1.70 1.92
15 75.00 1.27 1.59 1.69 1.95 2.35
16 80.00 1.40 1.65 1.78 2.25 2.95
17 85.00 1.55 1.90 2.02 2.64 3.40
18 90.00 1.75 2.25 2.36 3.05 3.90
19 95.00 1.80 2.56 2.64 3.40 -
20 100.00 1.88 2.95 3.00 - -
Ult. Load (kN) → 104.00 110.00 114.00 98.00 94.00

- 147 -
Figure 7.8 Flexure behavior of beam at the age of 365 days with different % of fly ash in normal condition.
0
20
40
60
80
100
120
0 0.5 1 1.5 2 2.5 3 3.5
Load
in k
N
Central deflection in mm
Flexure behavior of beam at age of 365 day with different % of fly ash
0 % fly ash
10 %fly ash
20 % fly ash
30 % fly ash
40 % fly ash
- 148 -
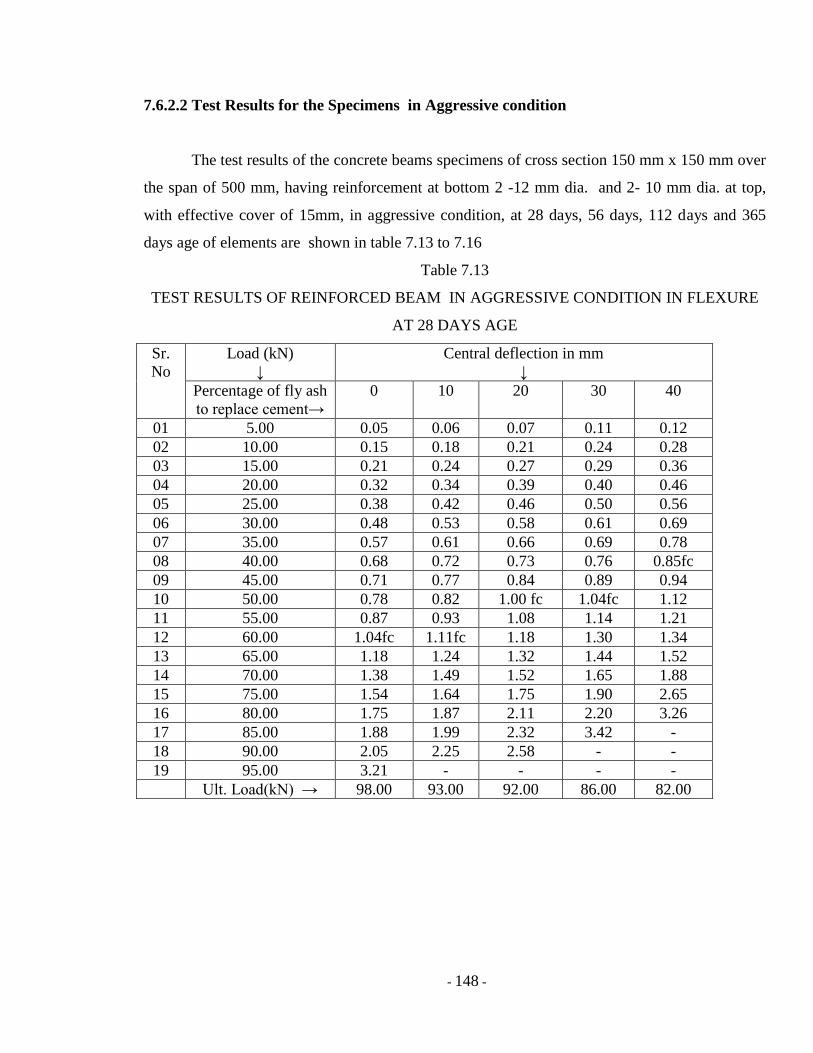
7.6.2.2 Test Results for the Specimens in Aggressive condition
The test results of the concrete beams specimens of cross section 150 mm x 150 mm over
the span of 500 mm, having reinforcement at bottom 2 -12 mm dia. and 2- 10 mm dia. at top,
with effective cover of 15mm, in aggressive condition, at 28 days, 56 days, 112 days and 365
days age of elements are shown in table 7.13 to 7.16
Table 7.13
TEST RESULTS OF REINFORCED BEAM IN AGGRESSIVE CONDITION IN FLEXURE
AT 28 DAYS AGE
Sr.
No
Load (kN)
↓
Central deflection in mm
↓
Percentage of fly ash
to replace cement→
0 10 20 30 40
01 5.00 0.05 0.06 0.07 0.11 0.12
02 10.00 0.15 0.18 0.21 0.24 0.28
03 15.00 0.21 0.24 0.27 0.29 0.36
04 20.00 0.32 0.34 0.39 0.40 0.46
05 25.00 0.38 0.42 0.46 0.50 0.56
06 30.00 0.48 0.53 0.58 0.61 0.69
07 35.00 0.57 0.61 0.66 0.69 0.78
08 40.00 0.68 0.72 0.73 0.76 0.85fc
09 45.00 0.71 0.77 0.84 0.89 0.94
10 50.00 0.78 0.82 1.00 fc 1.04fc 1.12
11 55.00 0.87 0.93 1.08 1.14 1.21
12 60.00 1.04fc 1.11fc 1.18 1.30 1.34
13 65.00 1.18 1.24 1.32 1.44 1.52
14 70.00 1.38 1.49 1.52 1.65 1.88
15 75.00 1.54 1.64 1.75 1.90 2.65
16 80.00 1.75 1.87 2.11 2.20 3.26
17 85.00 1.88 1.99 2.32 3.42 -
18 90.00 2.05 2.25 2.58 - -
19 95.00 3.21 - - - -
Ult. Load(kN) → 98.00 93.00 92.00 86.00 82.00

- 149 -
Figure 7.9 Flexure behavior of beam at the age of 28 days with different % of fly ash in aggressive condition.
0
10
20
30
40
50
60
70
80
90
100
0 0.5 1 1.5 2 2.5 3
Load
in k
N
Central deflection in mm
Flexure behavior of beam at age of 28 day with different % of fly ash
0 % fly ash
10 % fly ash
20 % fly ash
30 % fly ash
40 % fly ash

- 150 -
Table 7.14
TEST RESULTS OF REINFORCED BEAM IN AGGRESSIVE CONDITION IN FLEXURE
AT 56 DAYS AGE
Sr.
No
Load (kN)
↓
Central deflection in mm
↓
Percentage of fly ash to
replace cement→
0 10 20 30 40
01 5.00 0.05 0.06 0.08 0.08 0.11
02 10.00 0.13 0.17 0.19 0.20 0.24
03 15.00 0.18 0.21 0.25 0.27 0.28
04 20.00 0.27 0.28 0.32 0.35 0.41
05 25.00 0.34 0.36 0.39 0.42 0.49
06 30.00 0.42 0.43 0.46 0.52 0.62
07 35.00 0.48 0.51 0.55 0.60 0.68
08 40.00 0.56 0.62 0.68 0.71 fc 0.77 fc
09 45.00 0.61 0.70 0.74 0.80 0.89
10 50.00 0.70 0.82 fc 0.84fc 0.94 1.12
11 55.00 0.78 0.89 0.92 0.99 1.20
12 60.00 0.92fc 0.98 1.04 1.15 1.29
13 65.00 1.01 1.10 1.18 1.32 1.48
14 70.00 1.17 1.22 1.46 1.52 1.68
15 75.00 1.35 1.50 1.62 1.78 1.90
16 80.00 1.70 1.82 1.98 2.18 2.62
17 85.00 1.81 1.94 2.18 2.32 2.75
18 90.00 1.95 2.15 2.48 2.65 2.95
19 95.00 - 2.60 2.80 2.95 -
20 100.00 - 2.98 3.22 - -
Ult. load (kN → 93.00 103.00 108.00 96.00 91.00
- 151 -
Figure 7.10 Flexure behavior of beam at the age of 56 days with different % of fly ash in aggressive condition.
0
20
40
60
80
100
120
0 0.5 1 1.5 2 2.5 3 3.5
Load
in k
N
Central deflection in mm
Flexure behavior of beam at age of 56 day with different % of fly ash
0 %fly ash
10 % fly ash
20 % fly ash
30 % fly ash
40 % fly ash
- 152 -
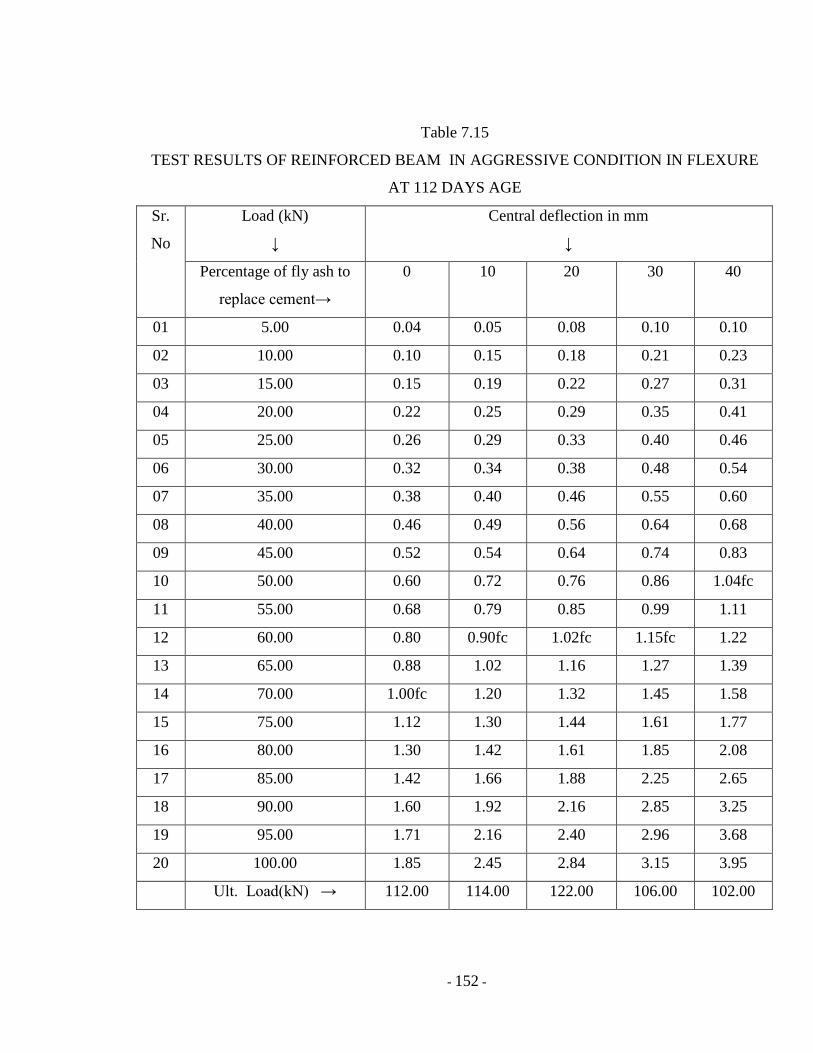
Table 7.15
TEST RESULTS OF REINFORCED BEAM IN AGGRESSIVE CONDITION IN FLEXURE
AT 112 DAYS AGE
Sr.
No
Load (kN)
↓
Central deflection in mm
↓
Percentage of fly ash to
replace cement→
0 10 20 30 40
01 5.00 0.04 0.05 0.08 0.10 0.10
02 10.00 0.10 0.15 0.18 0.21 0.23
03 15.00 0.15 0.19 0.22 0.27 0.31
04 20.00 0.22 0.25 0.29 0.35 0.41
05 25.00 0.26 0.29 0.33 0.40 0.46
06 30.00 0.32 0.34 0.38 0.48 0.54
07 35.00 0.38 0.40 0.46 0.55 0.60
08 40.00 0.46 0.49 0.56 0.64 0.68
09 45.00 0.52 0.54 0.64 0.74 0.83
10 50.00 0.60 0.72 0.76 0.86 1.04fc
11 55.00 0.68 0.79 0.85 0.99 1.11
12 60.00 0.80 0.90fc 1.02fc 1.15fc 1.22
13 65.00 0.88 1.02 1.16 1.27 1.39
14 70.00 1.00fc 1.20 1.32 1.45 1.58
15 75.00 1.12 1.30 1.44 1.61 1.77
16 80.00 1.30 1.42 1.61 1.85 2.08
17 85.00 1.42 1.66 1.88 2.25 2.65
18 90.00 1.60 1.92 2.16 2.85 3.25
19 95.00 1.71 2.16 2.40 2.96 3.68
20 100.00 1.85 2.45 2.84 3.15 3.95
Ult. Load(kN) → 112.00 114.00 122.00 106.00 102.00
- 153 -
Figure 7.11 Flexure behavior of beam at the age of 112 days with different % of fly ash in aggressive condition.
0
20
40
60
80
100
120
0 0.5 1 1.5 2 2.5 3 3.5
Load
in k
N
Central deflection in mm
Flexure behavior of beam at age of 112 day with different % of fly ash
0 % fly ash
10 % fly ash
20 % fly ash
30 % fly ash
40 % fly ash

- 154 -
Table 7.16
TEST RESULTS OF REINFORCED BEAM IN AGGRESSIVE CONDITION IN FLEXURE
AT 365 DAYS AGE
Sr.
No
Load (N)
↓
Central deflection in mm
↓
Percentage of fly ash to
replace cement→
0 10 20 30 40
01 5.00 0.04 0.04 0.05 0.07 0.08
02 10.00 0.10 0.11 0.12 0.16 0.22
03 15.00 0.14 0.16 0.19 0.22 0.26
04 20.00 0.21 0.23 0.28 0.31 0.36
05 25.00 0.26 0.29 0.34 0.37 0.44
06 30.00 0.35 0.37 0.42 0.48 0.56
07 35.00 0.39 0.42 0.48 0.57 0.63
08 40.00 0.46 0.50 0.56 0.67 0.72
09 45.00 0.51 0.55 0.58 0.73 0.86
10 50.00 0.58 0.61 0.64fc 0.84fc 1.01fc
11 55.00 0.66 0.69 0.73 0.92 1.14
12 60.00 0.78 fc 0.79fc 0.88 1.12 1.30
13 65.00 0.87 0.96 1.05 1.29 1.48
14 70.00 1.00 1.24 1.32 1.54 1.68
15 75.00 1.11 1.29 1.38 1.74 1.98
16 80.00 1.25 1.35 1.48 2.02 2.52
17 85.00 1.38 1.44 1.62 2.25 2.71
18 90.00 1.50 1.55 1.76 2.65 2.95
19 95.00 1.82 1.90 2.06 2.84 3.24
20 100.00 2.25 2.45 2.50 3.10 -
Ult. Load (kN) → 115.00 124.00 128.00 102.00 98.00
- 155 -
Figure 7.12 Flexure behavior of beam at the age of 365 days with different % of fly ash in aggressive condition.
0
20
40
60
80
100
120
0 0.5 1 1.5 2 2.5 3 3.5
Load
in k
N
Central deflection in mm
Flexure behavior of beam at age of 365 day with different % of fly ash
0 % fly ash
10 % fly ash
20 % fly ash
30 % fly ash
40 % fly ash

- 156 -
7.6.2.3 Test Results of the Concrete Cubes for Characteristic Compressive Strengths
The concrete cubes of the same mix were casted during casting of beam specimens for
flexure. The results of characteristic compressive strength were tabulated for different percentage
of fly ash and control concrete for different conditions. The results are used to calculate the
flexure strength of beam theoretically and to compare with practical values. The characteristic
compressive strength tabulated in table 7.17 as follows.
Table 7.17
AVERAGE CHARACTERISTIC COMPRESSIVE STRENGTH OF CONCRETE MIX
Curing period
↓
Compressive Strength of Concrete in N/mm2
↓
Condition of
Environment
↓ Percentage of fly ash to
replace cement→
0 10 20 30 40
28 Days 29.33 28.89 26.22 24.44 20.44 Normal
32.44 32.44 32.00 28.00 26.67 Aggressive
56 Days 37.78 37.33 39.11 32.44 28.89 Normal
41.78 42.22 41.77 37.33 35.56 Aggressive
112 Days 42.22 44.88 45.78 37.33 30.67 Normal
45.33 46.67 46.22 39.11 36.00 Aggressive
365 Days 44.88 47.55 48.00 38.67 32.00 Normal
44.00 47.11 48.00 40.88 38.22 Aggressive
7.6.2.4 Calculation Of Theoretical Ultimate Moment Of The Beams
For flexural strength prediction, ultimate theory is used for the fly ash concrete beams
and for control concrete beams, Ultimate flexural moment is calculated as per IS 456-2000
clause 38.1 by using the value of respective characteristic compressive strength at respective age
as shown in table 7.17 and yield stress in steel 415.787 N/mm2
obtain as shown in table 7.6 are
tabulated in table 7.18.
- 157 -
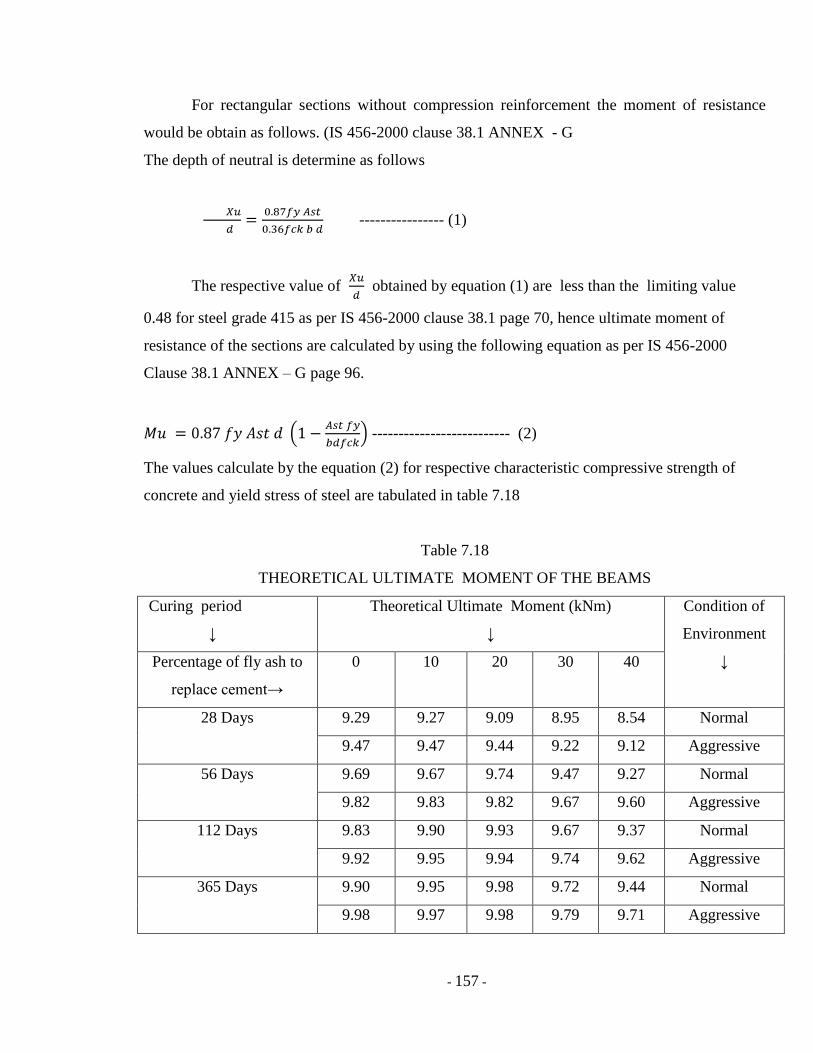
For rectangular sections without compression reinforcement the moment of resistance
would be obtain as follows. (IS 456-2000 clause 38.1 ANNEX - G
The depth of neutral is determine as follows
---------------- (1)
The respective value of obtained by equation (1) are less than the limiting value
0.48 for steel grade 415 as per IS 456-2000 clause 38.1 page 70, hence ultimate moment of
resistance of the sections are calculated by using the following equation as per IS 456-2000
Clause 38.1 ANNEX – G page 96.
-------------------------- (2)
The values calculate by the equation (2) for respective characteristic compressive strength of
concrete and yield stress of steel are tabulated in table 7.18
Table 7.18
THEORETICAL ULTIMATE MOMENT OF THE BEAMS
Curing period
↓
Theoretical Ultimate Moment (kNm)
↓
Condition of
Environment
↓ Percentage of fly ash to
replace cement→
0 10 20 30 40
28 Days 9.29 9.27 9.09 8.95 8.54 Normal
9.47 9.47 9.44 9.22 9.12 Aggressive
56 Days 9.69 9.67 9.74 9.47 9.27 Normal
9.82 9.83 9.82 9.67 9.60 Aggressive
112 Days 9.83 9.90 9.93 9.67 9.37 Normal
9.92 9.95 9.94 9.74 9.62 Aggressive
365 Days 9.90 9.95 9.98 9.72 9.44 Normal
9.98 9.97 9.98 9.79 9.71 Aggressive

- 158 -
7.6.2.5 Calculation Of Experimental Ultimate Moment Of The Beams
The beam specimen of 150 mm x 150 mm x 700 mm is supported as shown in figure 7.5 over the
span of 600 mm with pure bending arrangement by applying load through two point load, in pure
bending are tested and the ultimate moment of the beams calculated and are tabulated as shown
in table 7.19
Table 7.19
EXPERIMENTAL ULTIMATE MOMENT OF THE BEAMS
Curing period
↓
Experimental Ultimate Moment (kNm)
↓
Condition of
Environment
↓ Percentage of fly ash to
replace cement→
0 10 20 30 40
28 Days 12.00 11.50 11.38 10.25 9.75 Normal
12.25 11.62 11.50 10.75 10.25 Aggressive
56 Days 12.75 13.00 13.12 11.75 10.50 Normal
11.62 12.88 13.50 12.00 11.38 Aggressive
112 Days 13.00 13.25 13.62 12.00 11.00 Normal
14.00 14.25 15.25 13.25 12.75 Aggressive
365 Days 13.00 13.75 14.25 12.25 11.75 Normal
14.38 15.50 16.00 12.75 12.25 Aggressive
7.6.2.6 Theoretical Calculation of Crack Width
Cracking of concrete should not adversely affect of the appearance or durability of the
structure, the acceptable limits of cracking would vary with the type of structure and
environment. Where specific attention is required to limit the designed crack width to a
particular value.
If the strain in the tension reinforcement is not more than 0.8fy/Es, the crack width
calculated by the following equation as per IS 456 -2000 ANNEX – F with reference of clause
35.3.2 and 43.1.
- 159 -
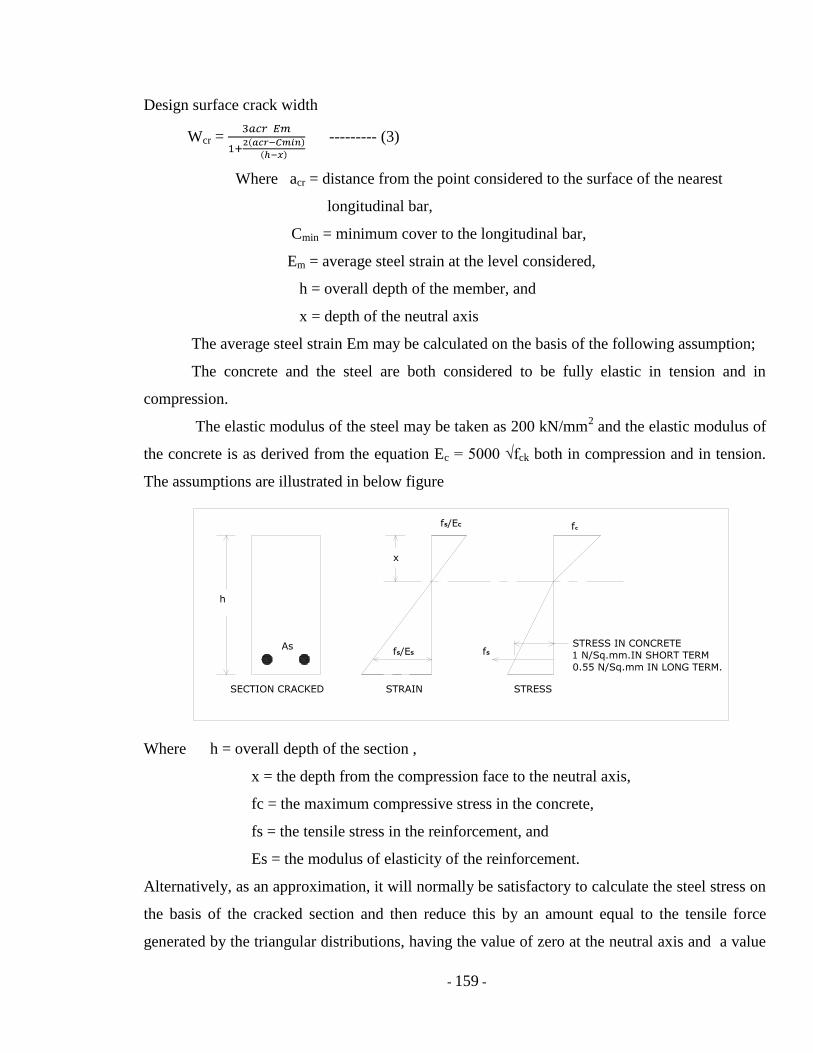
Design surface crack width
Wcr = --------- (3)
Where acr = distance from the point considered to the surface of the nearest
longitudinal bar,
Cmin = minimum cover to the longitudinal bar,
Em = average steel strain at the level considered,
h = overall depth of the member, and
x = depth of the neutral axis
The average steel strain Em may be calculated on the basis of the following assumption;
The concrete and the steel are both considered to be fully elastic in tension and in
compression.
The elastic modulus of the steel may be taken as 200 kN/mm2 and the elastic modulus of
the concrete is as derived from the equation Ec = 5000 √fck both in compression and in tension.
The assumptions are illustrated in below figure
STRESS IN CONCRETE
1 N/Sq.mm.IN SHORT TERM
0.55 N/Sq.mm IN LONG TERM.
fSfS/ES
h
As
x
fc
SECTION CRACKED STRAIN STRESS
fS/EC
Where h = overall depth of the section ,
x = the depth from the compression face to the neutral axis,
fc = the maximum compressive stress in the concrete,
fs = the tensile stress in the reinforcement, and
Es = the modulus of elasticity of the reinforcement.
Alternatively, as an approximation, it will normally be satisfactory to calculate the steel stress on
the basis of the cracked section and then reduce this by an amount equal to the tensile force
generated by the triangular distributions, having the value of zero at the neutral axis and a value

- 160 -
at the centroid of the tension steel of 1 N/mm2 instantaneously, reducing to 0.55 N/mm
2 in the
long-term, acting over the tension zone divided by the steel area. For a rectangular tension zone
this gives
Єm = Єl – --------------- (4)
Where As = area of tension reinforcement,
b = width of the section at the centroid of the tension steel,
Єl = strain at the level considered, calculated ignoring the stiffening
of the concrete in the tension zone,
a = distance from the compression face to the point at which the
crack width is being calculated, and
d = effective depth.
The value of the crack width for the control concrete specimen at the age of 28 days cured in
normal condition, having ultimate moment 12 kNm for the section of 150mm x 150 mm with
reinforcement of 2 bars of 12 mm dia. is calculated as per IS 456-2000 by using the above
equation (3) and (4) as follows,
Using equation (1) and (2) to determine the actual fy,
→0.48 = --------- (A)
and
→ 12X 10 6
= ------ (B)
From (A) and (B) the values of
31.70 N/mm2 and fy = 563.64 N/mm
2
Єl = fy/Es
= 2.818 X 10⁻³
therefore
Єm = 2.818 X 10⁻³
–
Єm = 2.715 X 10⁻³
Hence crack width is given by
Wcr = = 0.122 mm
- 161 -
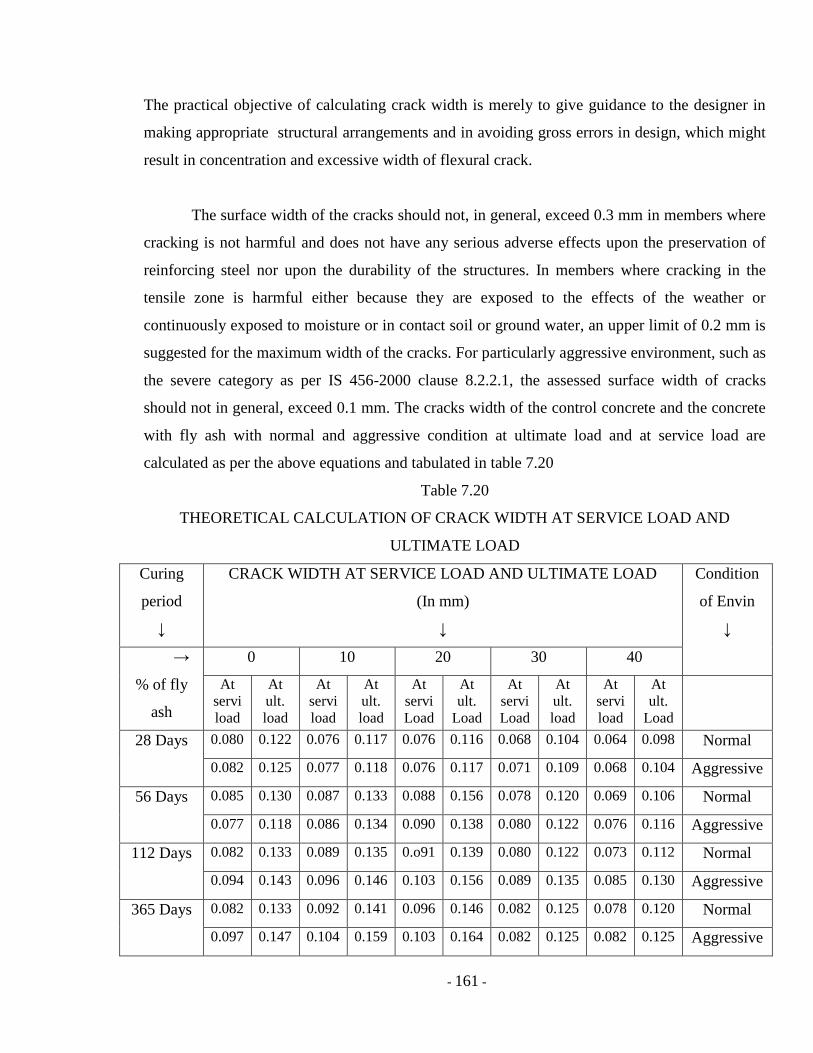
The practical objective of calculating crack width is merely to give guidance to the designer in
making appropriate structural arrangements and in avoiding gross errors in design, which might
result in concentration and excessive width of flexural crack.
The surface width of the cracks should not, in general, exceed 0.3 mm in members where
cracking is not harmful and does not have any serious adverse effects upon the preservation of
reinforcing steel nor upon the durability of the structures. In members where cracking in the
tensile zone is harmful either because they are exposed to the effects of the weather or
continuously exposed to moisture or in contact soil or ground water, an upper limit of 0.2 mm is
suggested for the maximum width of the cracks. For particularly aggressive environment, such as
the severe category as per IS 456-2000 clause 8.2.2.1, the assessed surface width of cracks
should not in general, exceed 0.1 mm. The cracks width of the control concrete and the concrete
with fly ash with normal and aggressive condition at ultimate load and at service load are
calculated as per the above equations and tabulated in table 7.20
Table 7.20
THEORETICAL CALCULATION OF CRACK WIDTH AT SERVICE LOAD AND
ULTIMATE LOAD
Curing
period
↓
CRACK WIDTH AT SERVICE LOAD AND ULTIMATE LOAD
(In mm)
↓
Condition
of Envin
↓
→
% of fly
ash
0 10 20 30 40
At
servi load
At
ult. load
At
servi load
At
ult. load
At
servi Load
At
ult. Load
At
servi Load
At
ult. load
At
servi load
At
ult. Load
28 Days 0.080 0.122 0.076 0.117 0.076 0.116 0.068 0.104 0.064 0.098 Normal
0.082 0.125 0.077 0.118 0.076 0.117 0.071 0.109 0.068 0.104 Aggressive
56 Days 0.085 0.130 0.087 0.133 0.088 0.156 0.078 0.120 0.069 0.106 Normal
0.077 0.118 0.086 0.134 0.090 0.138 0.080 0.122 0.076 0.116 Aggressive
112 Days 0.082 0.133 0.089 0.135 0.o91 0.139 0.080 0.122 0.073 0.112 Normal
0.094 0.143 0.096 0.146 0.103 0.156 0.089 0.135 0.085 0.130 Aggressive
365 Days 0.082 0.133 0.092 0.141 0.096 0.146 0.082 0.125 0.078 0.120 Normal
0.097 0.147 0.104 0.159 0.103 0.164 0.082 0.125 0.082 0.125 Aggressive
- 162 -
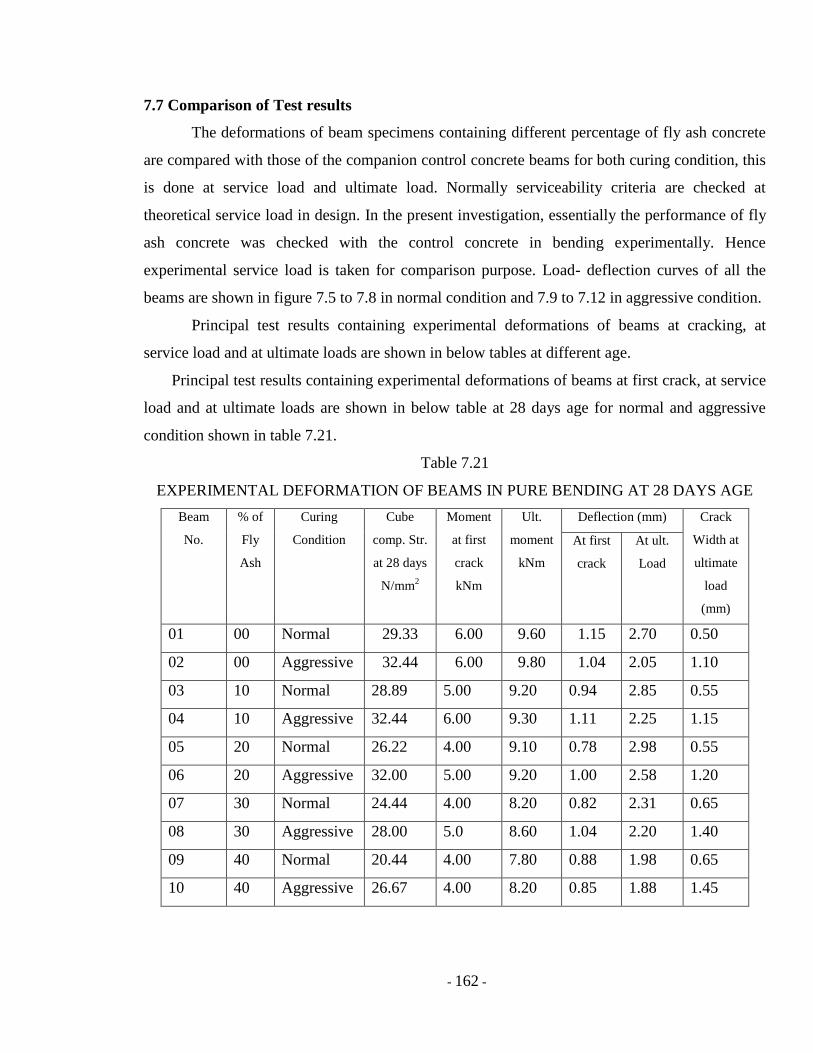
7.7 Comparison of Test results
The deformations of beam specimens containing different percentage of fly ash concrete
are compared with those of the companion control concrete beams for both curing condition, this
is done at service load and ultimate load. Normally serviceability criteria are checked at
theoretical service load in design. In the present investigation, essentially the performance of fly
ash concrete was checked with the control concrete in bending experimentally. Hence
experimental service load is taken for comparison purpose. Load- deflection curves of all the
beams are shown in figure 7.5 to 7.8 in normal condition and 7.9 to 7.12 in aggressive condition.
Principal test results containing experimental deformations of beams at cracking, at
service load and at ultimate loads are shown in below tables at different age.
Principal test results containing experimental deformations of beams at first crack, at service
load and at ultimate loads are shown in below table at 28 days age for normal and aggressive
condition shown in table 7.21.
Table 7.21
EXPERIMENTAL DEFORMATION OF BEAMS IN PURE BENDING AT 28 DAYS AGE
Beam
No.
% of
Fly
Ash
Curing
Condition
Cube
comp. Str.
at 28 days
N/mm2
Moment
at first
crack
kNm
Ult.
moment
kNm
Deflection (mm) Crack
Width at
ultimate
load
(mm)
At first
crack
At ult.
Load
01 00 Normal 29.33 6.00 9.60 1.15 2.70 0.50
02 00 Aggressive 32.44 6.00 9.80 1.04 2.05 1.10
03 10 Normal 28.89 5.00 9.20 0.94 2.85 0.55
04 10 Aggressive 32.44 6.00 9.30 1.11 2.25 1.15
05 20 Normal 26.22 4.00 9.10 0.78 2.98 0.55
06 20 Aggressive 32.00 5.00 9.20 1.00 2.58 1.20
07 30 Normal 24.44 4.00 8.20 0.82 2.31 0.65
08 30 Aggressive 28.00 5.0 8.60 1.04 2.20 1.40
09 40 Normal 20.44 4.00 7.80 0.88 1.98 0.65
10 40 Aggressive 26.67 4.00 8.20 0.85 1.88 1.45

- 163 -
Principal test results containing experimental deformations of beams at first crack, at
service load and at ultimate loads are shown in below tables at 56 days age for normal and
aggressive condition shown in table 7.22.
Table 7.22
EXPERIMENTAL DEFORMATION OF BEAMS IN PURE BENDING AT 56 DAYS AGE
Beam
No.
% of
Fly
Ash
Curing
Condition
Cube
comp. Str.
at 28 days
N/mm2
Moment
at first
crack
kNm
Ult.
moment
kNm
Deflection (mm) Crack
Width at
ultimate
load
(mm)
At first
crack
At ult.
Load
01 00 Normal 37.78 6.00 10.2 1.00 2.22 0.45
02 00 Aggressive 41.78 6.00 9.30 0.70 3.00 1.30
03 10 Normal 37.33 5.00 10.40 0.90 2.98 0.40
04 10 Aggressive 42.22 5.00 10.3 0.82 2.98 1.35
05 20 Normal 39.11 4.00 10.5 0.72 3.22 0.55
06 20 Aggressive 41.77 5.00 10.8 0.84 3.22 1.35
07 30 Normal 32.44 4.00 9.40 0.79 3.05 0.60
08 30 Aggressive 37.33 4.00 9.60 0.71 2.65 1.45
09 40 Normal 28.89 4.00 8.40 0.86 1.98 0.85
10 40 Aggressive 35.56 4.00 9.10 0.77 2.95 1.60
Principal test results containing experimental deformations of beams at first crack, at
service load and at ultimate loads are shown in below tables at 112 days age for normal and
aggressive condition shown in table 7.23

- 164 -
Table 7.23
EXPERIMENTAL DEFORMATION OF BEAMS IN PURE BENDING AT 112 DAYS AGE
Beam
No.
% of
Fly
Ash
Curing
Condition
Cube
comp. Str.
at 28 days
N/mm2
Moment
at first
crack
kNm
Ult.
moment
kNm
Deflection (mm) Crack
Width at
ultimate
load
(mm)
At first
crack
At ult.
Load
01 00 Normal 42.22 7.00 10.40 1.2 1.83 0.35
02 00 Aggressive 45.33 7.00 11.20 1.00 1.85 0.85
03 10 Normal 44.88 6.00 10.60 1.15 2.95 0.35
04 10 Aggressive 46.67 6.00 11.40 0.72 2.45 0.95
05 20 Normal 45.78 6.00 10.9 0.98 3.00 0.55
06 20 Aggressive 46.22 6.00 11.02 12.20 2.84 1.10
07 30 Normal 37.33 4.00 9.60 0.78 3.07 0.60
08 30 Aggressive 39.11 6.00 10.60 1.15 3.15 1.25
09 40 Normal 30.67 4.00 8.80 0.79 2.28 0.60
10 40 Aggressive 36.00 5.00 10.20 0.68 3.25 1.30
Principal test results containing experimental deformations of beams at first crack, at
service load and at ultimate loads are shown in below tables at 365 days age for normal and
aggressive condition shown in table 7.24
Table 7.24
EXPERIMENTAL DEFORMATION OF BEAMS IN PURE BENDING AT 365 DAYS AGE
Beam
No.
% of
Fly
Ash
Curing
Condition
Cube
comp. Str.
at 28 days
N/mm2
Moment
at first
crack
kNm
Ult.
moment
kNm
Deflection (mm) Crack
Width at
ultimate
load
(mm)
At first
crack
At ult.
Load
01 00 Normal 44.88 7.00 10.40 1.15 1.88 0.35
02 00 Aggressive 44.00 6.00 11.50 0.78 2.25 0.75
03 10 Normal 47.55 6.00 11.00 1.10 2.95 0.40
04 10 Aggressive 47.11 6.00 12.40 0.79 2.45 0.95
05 20 Normal 48.00 5.00 11.40 0.98 3.00 0.55
06 20 Aggressive 48.00 5.00 12.80 0.84 2.50 1.25
07 30 Normal 38.67 5.00 9.80 1.06 3.05 0.65
08 30 Aggressive 40.88 5.00 10.2 0.84 3.10 1.45
09 40 Normal 32.00 4.00 9.40 0.79 2.95 0.85
10 40 Aggressive 38.22 5.00 9.80 1.01 2.95 1.60

- 165 -
7.8 Discussion of Test Results
The fly ash concrete beams contain 10 percent fly ash to replace cement exhibited, 4.34
percent, 20 percent fly ash concrete exhibited 5.5 percent, 30 percent fly ash concrete exhibited
17 percent and 40 percent fly ash concrete exhibited 23 percent lower strength than the control
concrete at 28 days age in normal condition.
The fly ash concrete beams contain 10 percent fly ash to replace cement exhibited, 2
percent, 20 percent fly ash concrete exhibited 3 percent, higher strength and 30 percent fly ash
concrete exhibited 8.5 percent and 40 percent fly ash concrete exhibited 18 percent lower
strength than the control concrete at 56 days age in normal condition.
The fly ash concrete beams contain 10 percent fly ash to replace cement exhibited, 2
percent, 20 percent fly ash concrete exhibited 5 percent, higher strength and 30 percent fly ash
concrete exhibited 8 percent and 40 percent fly ash concrete exhibited 18 percent lower strength
than the control concrete at 112 days age in normal condition.
While the fly ash concrete beams contain 10 percent fly ash to replace cement exhibited,
6 percent, 20 percent fly ash concrete exhibited 9 percent, higher strength and 30 percent fly ash
concrete exhibited 6 percent and 40 percent fly ash concrete exhibited 10 percent lower strength
than the control concrete at 365 days age in normal condition.
The fly ash concrete beams contain 10 percent fly ash to replace cement exhibited, 5.4
percent, 20 percent fly ash concrete exhibited 6.5 percent, 30 percent fly ash concrete exhibited
14 percent and 40 percent fly ash concrete exhibited 19 percent lower strength than the control
concrete at 28 days age in aggressive condition.
The fly ash concrete beams contain 10 percent fly ash to replace cement exhibited, 10
percent, 20 percent fly ash concrete exhibited 16 percent, 30 percent fly ash concrete exhibited 3
percent higher strength and 40 percent fly ash concrete exhibited 2 percent lower strength than
the control concrete at 56 days age in aggressive condition.
- 166 -
The fly ash concrete beams contain 10 percent fly ash to replace cement exhibited, 2
percent, 20 percent fly ash concrete exhibited 9 percent, higher strength and 30 percent fly ash
concrete exhibited 6 percent and 40 percent fly ash concrete exhibited 10 percent lower strength
than the control concrete at 112 days age in aggressive condition.
While the fly ash concrete beams contain 10 percent fly ash to replace cement exhibited,
8 percent, 20 percent fly ash concrete exhibited 11 percent, higher strength and 30 percent fly
ash concrete exhibited 12 percent and 40 percent fly ash concrete exhibited 17 percent lower
strength than the control concrete at 365 days age in aggressive condition.
The companion beam of control concrete and fly ash contain identical beams cured in
aggressive condition and cured in normal condition the strength of elements exhibited more in
most cases 4 to 6 percent, for beam contain 10 and 20 percent fly ash while the beam containing
30 and 40 percent fly ash exhibited nearly same at 28 days age and 56 days age and at 112 days
age and 365 days age, exhibited 5 percent lower strength.
The fly ash concrete beams contain 10 percent fly ash to replace cement the first crack
started at 54 percent load of ultimate load and exhibited deflection was 0.94mm, and 20 percent
fly ash concrete beam exhibited first crack at 44 percent of ultimate load with deflection of 0.78
mm, 30 percent fly ash concrete exhibited first at 49 percent of ultimate load, with deflection of
0.82mm and 40 percent fly ash concrete exhibited first crack at 51 percent of ultimate load with
deflection of 0.88 mm which are lower strength than the control concrete beam exhibited first
crack at 62.5 percent load of ultimate load with deflection of 1.15 mm at 28 days age in normal
condition. Similar results are obtain in other specimens tested at the age of 56 days age, 112 days
age and 365 days age in normal condition.
The fly ash concrete beams contain 10 percent fly ash to replace cement the first crack
started at 64 percent load of ultimate load and exhibited deflection was 1.11mm, and 20 percent
fly ash concrete beam exhibited first crack at 54 percent of ultimate load with deflection of 1.00
- 167 -
mm, 30 percent fly ash concrete exhibited first at 58 percent of ultimate load, with deflection of
1.04 mm and 40 percent fly ash concrete exhibited first crack at 49 percent of ultimate load with
deflection of 0.85 mm which are lower strength than the control concrete beam exhibited first
crack at 61 percent load of ultimate load with deflection of 1.04 mm at 28 days age in aggressive
condition. Similar results are obtain in other specimens tested at the age of 56 days age, 112 days
age and 365 days age in aggressive condition.
The companion beam of control concrete and fly ash contain identical beams cured in
aggressive condition first crack develops early as compared to cured in normal condition. But the
deflection of specimens cured in aggressive are nearly 10 percent less than cured in normal
condition. For beam contain 10 and 20 percent fly ash show similar results, while the beam
containing 30 and 40 percent fly ash exhibited deflections are more or nearly same cured in
aggressive condition as compare to cured in normal condition.
The fly ash concrete beams contain 10 percent fly ash to replace cement exhibited,
0.55mm crack width, which is 10 percent more than control concrete beam. Similarly 20 percent
fly ash concrete shows 0.55 mm crack width, 30 percent fly ash concrete shows 0.65 mm crack
width and 40 percent fly ash concrete beam shows 0.65 mm crack width at ultimate load which
are 10 to 13 percent more as compare to control concrete beam specimen at 28 days age in
normal condition.
The fly ash concrete beams contain 10 percent fly ash to replace cement exhibited, 1.15
mm crack width, which is 5 percent more than control concrete beam. Similarly 20 percent fly
ash concrete shows 1.20 mm crack width, 30 percent fly ash concrete shows 1.40 mm crack
width and 40 percent fly ash concrete beam shows 1.45 mm crack width at ultimate load which
are 09 to 30 percent more as compare to control concrete beam specimen at 28 days age in
aggressive condition.
The crack width at 56 days age of concrete for similar specimen in normal condition
curing the width is 10 to 40 more in fly ash containing specimens as compared to control
concrete specimen, at 112 days age this value varies between10 percent to 55 percent while at

- 168 -
365 days age of concrete the values varies from 10 percent to twice width cured in normal
condition.
The crack width at 56 days age of concrete for similar specimen in aggressive condition
curing the width is 4 percent to 23 percent more in fly ash containing specimens as compared to
control concrete specimen, at 112 days age this value varies between 6 percent to 50 percent
while at 365 days age of concrete the values varies from 13 percent to twice width cured in
normal condition.
The crack width of same age companion specimen cured in normal condition were 50
percent of the specimens cured in aggressive condition for control concrete as well as for the
concrete containing fly ash of similar percentage.
For flexural strength prediction, same ultimate theory as per IS 456-2000 used for control
and fly ash containing specimens cured in normal condition and in aggressive condition. The
ratio of Mu expt and Mu theory are 1.29 for control concrete, 1.24 for 10 percent fly ash concrete
specimen, 1.25 for 20 percent fly ash concrete, 1.14 for 30 percent fly ash concrete and 1.14 for
the specimens containing 40 fly ash at the age of 28 days in normal curing condition. In
aggressive condition the ratio of Mu expt and Mu theory at the age of 28 days are 1.29 for control
concrete, 1.22 for 10 percent fly ash concrete specimen, 1.22 for 20 percent fly ash concrete,
1.16 for 30 percent fly ash concrete and 1.12 for the specimens containing 40 fly ash.
The ratio of Mu expt and Mu theory are 1.32 for control concrete, 1.34 for 10 percent fly ash
concrete specimen, 1.34 for 20 percent fly ash concrete, 1.21 for 30 percent fly ash concrete and
1.13 for the specimens containing 40 fly ash at the age of 56 days in normal curing condition. In
aggressive condition the ratio of Mu expt and Mu theory at the age of 56 days are 1.22 for control
concrete, 1.31 for 10 percent fly ash concrete specimen, 1.37 for 20 percent fly ash concrete,
1.24 for 30 percent fly ash concrete and 1.18 for the specimens containing 40 % fly ash.
The ratio of Mu expt and Mu theory are 1.32 for control concrete, 1.33 for 10 percent fly ash
concrete specimen, 1.37 for 20 percent fly ash concrete, 1.24 for 30 percent fly ash concrete and
- 169 -
1.17 for the specimens containing 40 fly ash at the age of 112 days in normal curing condition. In
aggressive condition the ratio of Mu expt and Mu theory at the age of 112 days are 1.41 for control
concrete, 1.43 for 10 percent fly ash concrete specimen, 1.53 for 20 percent fly ash concrete,
1.36 for 30 percent fly ash concrete and 1.32 for the specimens containing 40 % fly ash.
The ratio of Mu expt and Mu theory are 1.31 for control concrete, 1.38 for 10 percent fly ash
concrete specimen, 1.43 for 20 percent fly ash concrete, 1.26 for 30 percent fly ash concrete and
1.24 for the specimens containing 40 % fly ash at the age of 365 days in normal curing condition.
In aggressive condition the ratio of Mu expt and Mu theory at the age of 365 days are 1.44 for control
concrete, 1.55 for 10 percent fly ash concrete specimen, 1.60 for 20 percent fly ash concrete,
1.30 for 30 percent fly ash concrete and 1.26 for the specimens containing 40 % fly ash.
The ratio of Mu expt and Mu theory at the age of 28 days of concrete for control concrete and
concrete having fly ash 10 percent and 20 percent are nearly same or 4 to 5 percent less in
normal condition and in aggressive condition, while it less 10 to 14 percent in case of specimens
contain 30 and 40 percent fly ash in both conditions. But at 56 days age of concrete the
specimens having 10 and 20 percent fly ash shows same or slightly more values than control
concrete specimens and for 30 percent and 40 percent fly ash the value are less. At the of age
112 days and 365 days this ratio is 5 to 10 percent more in cases of specimen containing 10 and
20 percent fly ash, while it is shows lower values 10 to 15 percent than control concrete in
normal as well as aggressive curing condition.
These companion beams of control concrete and fly ash concrete shows nearly same
strength and deformation characteristics cured in respective condition having fly ash 10 and 20
percent, while fly ash contains are 30 and 40 percent the strength is less with excessive
deformation also in normal condition and aggressive condition also.

- 170 -
7.9 Conclusions
The following conclusions are drawn from the study of flexural behavior of beams on
conventionally reinforced concrete using fly ash concrete beams over the control concrete
beams.
The experimental work undertaken here, produced fly ash concrete replacing 10 percent,
20 percent, 30 percent and 40 percent of cement with STPS fly ash.
At the early age the characteristic compressive strength of concrete with fly ash is less
than control concrete, but at the age of 56 days, the concrete having 10 percent and 20
percent fly ash have same and 3 % more strength respectively in normal condition and in
aggressive condition.
At the age of 112 days, the concrete having 10 percent and 20 percent fly ash have 3 %
and 9 % more strength respectively in normal condition and near to same value in
aggressive condition.
At the age of 365 days, the concrete having 10 percent and 20 percent fly ash have 6 %
and 9 % more strength respectively in normal condition and near to same value in
aggressive condition.
The beams with the reinforcement less than the minimum specified in the code, the
cracking strength was 62 % to 67 % of ultimate strength for control concrete, while it is
42 % to 54% for concrete having fly ash 10 % to 40 % in normal condition. For
aggressive condition the cracking strength was 52 % to 62 % for control concrete while it
is near to 50 % for concrete having fly ash
The concrete contain fly ash cured in aggressive condition shows same or slightly less
ultimate strength than the companion control beams. While it is more in normal
condition.

- 171 -
The theoretical strength prediction of beam in flexure as per IS 456-2000 shows the
average value of 28 days, 56 days, 112 days and 365days of Mu expt / Mu theory was 1.31
for control concrete and 1.32 for 10 percent fly ash, 1.35 for 20 percent fly ash, 1.22 for
30 percent fly ash and 1.17 for 40 percent fly ash concrete in normal condition.
The theoretical strength prediction of beam in flexure as per IS 456-2000 shows the
average value of 28 days, 56 days, 112 days and 365days of Mu expt / Mu theory was 1.34
for control concrete and 1.38 for 10 percent fly ash, 1.44 for 20 percent fly ash, 1.26 for
30 percent fly ash and 1.22 for 40 percent fly ash concrete in aggressive condition.
The ratio of Mu expt in aggressive condition and in normal condition of the companion
beams are near to 1.01 to1.05 at the age of 28 days.
The ratio of Mu expt in aggressive condition and in normal condition of the companion
beams are near to 0.98 to1.08 at the age of 56 days.
The ratio of Mu expt in aggressive condition and in normal condition of the companion
beams are near to 1.01 to1.16 at the age of 112 days.
The ratio of Mu expt in aggressive condition and in normal condition of the companion
beams are near to 1.04 to1.12 at the age of 365 days.
Generally, the fly ash concrete beams with 10 % and 20 % fly ash recorded slightly
higher transverse deflections at service load as compare to control concrete. But the beam
having 30 % and 40 % fly ash have more deflection.
At service load the crack width varying from 0.082 to 1.25 mm for all the beams. The
control shows equal or 4 to 5 % more crack width than the companion fly ash concrete
beams. The crack width in aggressive condition, at service load as well as at ultimate load
was higher than the normal condition for all the companion beams.
- 172 -
The experimental investigation clearly demonstrated that there was no difference in
strength, deformations and structural performance between the control and the having 10
percent fly ash and 20 percent fly ash.
As for design, the theory applied for strength prediction of control beams is equally valid
for that of fly ash concrete beams.
20 percent fly ash concrete beam shows higher strength, permissible deformations and
superior structural performance as compare to control concrete after 56 days age of
concrete. control concrete one cubic meter needs 383 Kg cement and 20 percent replaced
cement by fly ash needs 306 Kg cement which is clear saving of cement of 77 Kg per
cubic meter of concrete.