Embed Size (px)
Citation preview
Chapter 6
Investment in LNG Supply Chain Infrastructure
Estimation
February 2018
This chapter should be cited as
ERIA (2018), ‘Investment in LNG Supply Chain Infrastructure Estimation’, in Uemura T. and K. Ishigami (eds.), Formulating Policy Options for Promoting Natural Gas Utilization in the East Asia Summit Region Volume II: Supply Side Analysis. ERIA Research Project Report 2016-07b, Jakarta: ERIA, pp.67-80.

67
Chapter 6
Investment in LNG supply chain infrastructure estimation
6.1 Introduction
This chapter presents the investment estimates for developing additional LNG supply chain
infrastructures. These estimates are based on the unit investment costs of Japanese companies
in the case studies. The main outputs are total estimated investments for LNG supply chain
infrastructures by country and by infrastructure type.
6.2 Methodology
6.2.1 Unit investment costs of LNG infrastructures and facilities
The scope of the estimation is as follows:
Primary and secondary LNG terminal construction cost (not included in port
development);
Maximum 32.5 km natural gas transmission pipeline construction cost from the nearest
port;
ISO containers for railway freight services and truck transports; and
LNG satellite storage facilities.
The following are not included in the estimation:
Land acquisition costs;
Secondary transport for SSLNG tankers;
Investment for port development like water channels, water brakes, and so on;
Natural gas transmission and distribution pipelines that are more than 32.5 km from
the nearest port;
Rail tracks and the like, and road and bridge enhancements or enforcement costs;
Trailer heads; and
Financial costs like interests.
The unit costs of investment estimation were taken from Japanese cases. Unit costs were
collected for the primary LNG-receiving terminal, secondary terminal, satellite, and the like.

68
Table 20. Scope of the Cost Component
Value
Chain
LNG
Carrier
LNG-Receiving
Terminals
Satellite Pipeline Lorry Train
Container
Component Ocean
tanker
Primary
(onshore)
Satellite Pipeline Lorry Train
Container
Coastal
tanker
Primary
(FSRU)
- - - -
- Secondary
(onshore)
- - - -
FSRU = floating storage and regasification units, LNG = liquefied natural gas.
Source: Authors.
The investment cost for SSLNG carriers is higher per tonne compared to the cost for large-scale
LNG vessels. The primary LNG terminal of Sendai City Gas in Japan has a capacity of 80 thousand
kilolitre (kl) and its size is close to the usual secondary terminals in Japan. An ocean tanker of
18,800 m3 (approximately 8,200 tonnes) serves the terminal and makes a maximum of 20 x
approximately 5,200 km trips annually between Malaysia and Japan. This tanker is in the smallest
category in Table 21. LNG ocean tankers used by Japanese utility companies are usually in the
range of 60,000–90,000 tonnes.
Thus, the unit cost for an ocean tanker serving a large primary terminal is US$6,000/m3, while
the cost for a coastal tanker serving a secondary terminal is US$15,000/m3. The unit cost is much
higher for a small tanker.
Table 21. Typical Investment Cost for LNG Carriers, Crew, and Harbour Cost
(Shell Historic STS database)
Size (m3) CAPEX
(US$ million)
CAPEX
(US$ Thousand/
m3)
Typical crew
number
Typical harbour cost
(Europe)
215,000 250 6.0 30–35 US$100-200K /visit
135,000 170 6.5 25–35 US$75-150K /visit
28,000 80 15.0 15–20 US$25-40 K /visit
K = thousand, LNG = liquefied natural gas, m3 = cubic metre.
Source: Adapted from International Gas Union (2015).
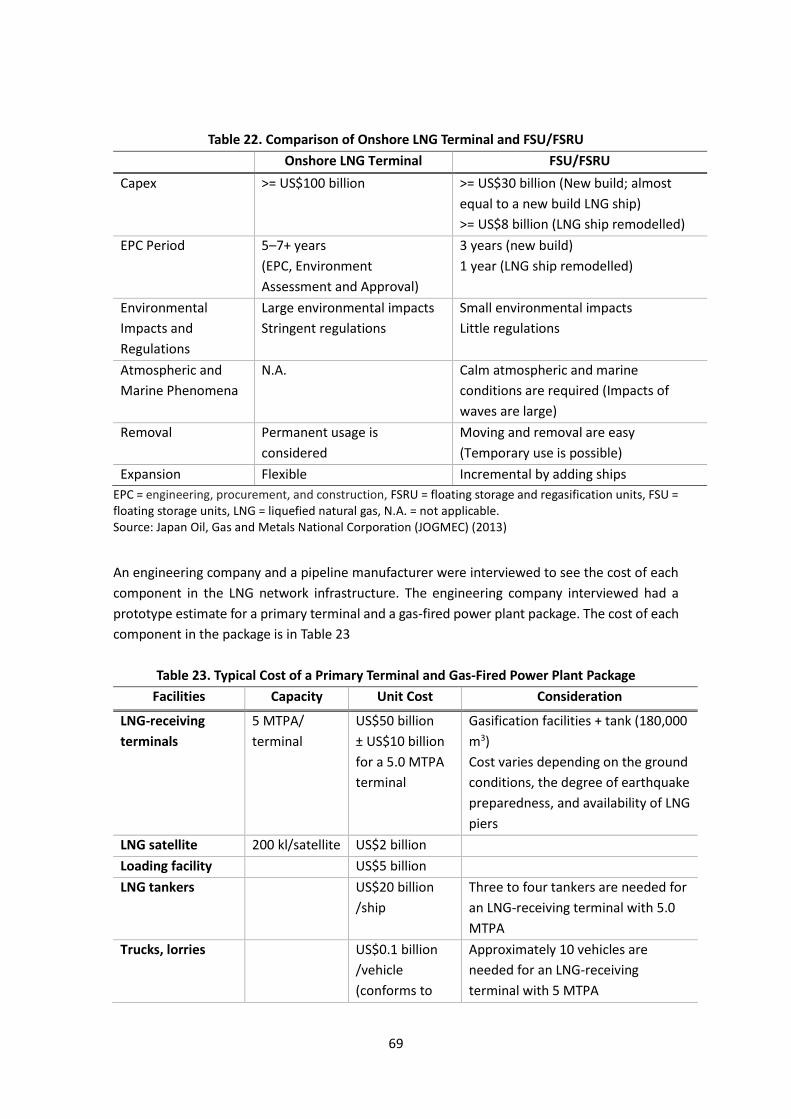
An onshore LNG terminal could cost up to JPY100 billion, while FSRUs cost up to JPY30 billion for
a new build and JPY8 billion for a remodelled used ship. Primary and secondary terminals are
structurally the same, and the size is different.
69
Table 22. Comparison of Onshore LNG Terminal and FSU/FSRU
Onshore LNG Terminal FSU/FSRU
Capex >= US$100 billion
>= US$30 billion (New build; almost
equal to a new build LNG ship)
>= US$8 billion (LNG ship remodelled)
EPC Period 5–7+ years
(EPC, Environment
Assessment and Approval)
3 years (new build)
1 year (LNG ship remodelled)
Environmental
Impacts and
Regulations
Large environmental impacts
Stringent regulations
Small environmental impacts
Little regulations
Atmospheric and
Marine Phenomena
N.A. Calm atmospheric and marine
conditions are required (Impacts of
waves are large)
Removal Permanent usage is
considered
Moving and removal are easy
(Temporary use is possible)
Expansion Flexible Incremental by adding ships
EPC = engineering, procurement, and construction, FSRU = floating storage and regasification units, FSU = floating storage units, LNG = liquefied natural gas, N.A. = not applicable. Source: Japan Oil, Gas and Metals National Corporation (JOGMEC) (2013)
An engineering company and a pipeline manufacturer were interviewed to see the cost of each
component in the LNG network infrastructure. The engineering company interviewed had a
prototype estimate for a primary terminal and a gas-fired power plant package. The cost of each
component in the package is in Table 23
Table 23. Typical Cost of a Primary Terminal and Gas-Fired Power Plant Package
Facilities Capacity Unit Cost Consideration
LNG-receiving
terminals
5 MTPA/
terminal
US$50 billion
± US$10 billion
for a 5.0 MTPA
terminal
Gasification facilities + tank (180,000
m3)
Cost varies depending on the ground
conditions, the degree of earthquake
preparedness, and availability of LNG
piers
LNG satellite 200 kl/satellite US$2 billion
Loading facility
US$5 billion
LNG tankers
US$20 billion
/ship
Three to four tankers are needed for
an LNG-receiving terminal with 5.0
MTPA
Trucks, lorries
US$0.1 billion
/vehicle
(conforms to
Approximately 10 vehicles are
needed for an LNG-receiving
terminal with 5 MTPA

70
Facilities Capacity Unit Cost Consideration
Japanese
standards)
A Chinese
vehicle would
cost a third of
this figure
Gas turbine
generator
50 MW × 2 US$15–20
billion
A 5 MTPA terminal can supply 10
power plants with 100 MW.
Pipeline Costs for pipeline is minimal, however the cost for land expropriation is
approximately US$.3 billion/km
kl = kilolitre, km = kilometre, LNG = liquefied natural gas, MPTA = million tonnes per annum, MW = megawatt.
Source: Interview with an engineering company.
Figure 17 shows the investments and capacity of primary LNG terminals in Japan. When
considering the capacity of LNG terminals and construction types (underground or on the
ground), the estimated unit investment for the construction of an LNG terminal is JPY450
million/1,000 tonnes of LNG. This number will be applied for the estimation of primary and
secondary LNG terminals in the following subsection.
Figure 17: Estimation of Unit Investment on LNG Terminal Construction in Japan
kl = kilolitre, kkl = please supply, LNG = liquefied natural gas, m2 = square metre, m3 = cubic metre, t/h = ton per hour.. Source: authors.
Owner Name of terminalTotal investment
(approximate:100million JPY) Capacity of facility(kl) Area (㎡) LNG vaporizer(t/h)Type of construction
(underground=1)
Hokkaido Gas Ishikari 400 180,000 96,902 200 0
City gas of Sendai Sendai 369 80,000 96,459 90 1
Tokyo Electric Futtsu 1,145 360,000 210,000 570 1
Tokyo Gas Ogishima 1,700 200,000 312,000 300 1
Impex Naoetsu 1,000 360,000 250,000 370 1
Shimizu LNG Sodeshi 500 177,200 89,000 110 0
Chita LNG Chita LNG 915 480,000 319,540 650 0
Toho gas Yokkaichi 290 80,000 86,959 40 0
Chubu Electric Yokkaichi LNG 780 320,000 141,000 560 0
Osaka gas Himeji 700 320,000 465,000 120 0
Kansai Electric Himeji LNG 625 280,000 190,000 600 0
Hiroshima Gas Hatsuka ichi 240 85000 34808 42 0
Chugoku Electric Yanai LNG 660 240000 500000 110 0
Saibu Gas Fukukita LNG 230 35000 64000 40 1
Oita LNG Oita LNG 820 240000 296000 380 0
Nihon Gas Kagoshima LNG 130 36000 67000 15 0
Explanatory variables
Dependent variables
Regression statistics
R 0.777
R2 0.604
Adjusted R2 0.544
Standard errors 276
Observation 16
Coefficients Standard errors t P-value
Intercept 91.219 145.891 0.625 0.543Capacity of facility(kkl) 2.07390 0.541 3.834 0.002Type of construction(underground=1) 368.283 148.885 2.474 0.028
Y=2.0739(100 million JPY/kkl)*Capacity(kkl)+91.219(100 million JPY)Y=2.0739(100 million JPY/1000㎥)*Capacity(1000㎥)+91.219(100 million JPY)Y=4.508486(100 million JPY/1000 ton)*Capacity(1000 ton)+ 91.219(100 million JPY)

71
The cost of developing a pipeline varies considerably, depending on the country. The cost has a
strong regional character as the pipeline development task is very labour intensive. Half of the
cost is allocated to civil engineering and the share of labour cost is large. The price of the pipeline
itself does not vary much among countries. The cost of eminent domain of right-of-way for
pipeline deployment is also high. The state and municipalities often carry out the land clearance
task, though sometimes contractors must do it at their own cost. If the project is backed by
official development assistance, municipalities are responsible for the land clearance.
Table 24. Unit Investment on Natural Gas Transmission Pipeline in Japan
Name of
line
Owner Completion
year
Diameter Investment
(JPY
million)
Length
(m)
Unit
investment/m
(JPY1,000/m)
Tochigi
Line
Tokyo
Gas
2005 400A 16,800 69,400 242
Fukushima
Line
JAPEX 2007 400A 20,000 95,000 211
Gunma
Trunk Line
Tokyo
Gas
2009 500A 5,700 15,700 363
Chiba
Kashima
Tokyo
Gas
2010 600A 25,700 73,100 352
New
Negishi
Trunk
Tokyo
Gas
2013 600A 15,500 14,100 1,099
Yokohama
Trunk ph2
Tokyo
Gas
2013 750A 7,700 6,300 1,222
Central
Trunk
Tokyo
Gas
2010 600A 4,500 10,400 433
New Oumi IMPEX 2009 500A 9,500 49,000 194
S-H Line Shizuoka
Gas
2013 400A
500A
35,000 113,000 310
Himeji
Okayama
Osaka
Gas
2014 600A 30,000 85,000 353
Mie Shiga
Line
Chubu
Electric
and
Osaka
Gas
2011 600A 20,000 60,000 333
Circle
Trunk Line
Toho
Gas
2009 600A 52,000 117,000 444
West
Circle Line
Toho
Gas
2009 600A 6,000 14,000 429
m = metre, NG = natural gas. Source: http://www.meti.go.jp/meti_lib/report/H28FY/000610.pdf.
72
Table 24 shows the cases of natural gas transmission pipeline construction. The range of unit
investment per metre is from JPY194–JPY1,222 thousand. When considering the difference in
labour costs between ASEAN, India, and Japan, the higher unit investment will lead to over
estimation. Therefore, the minimum unit investment of JPY194,000/m can be regarded as the
unit investment for the following estimation.
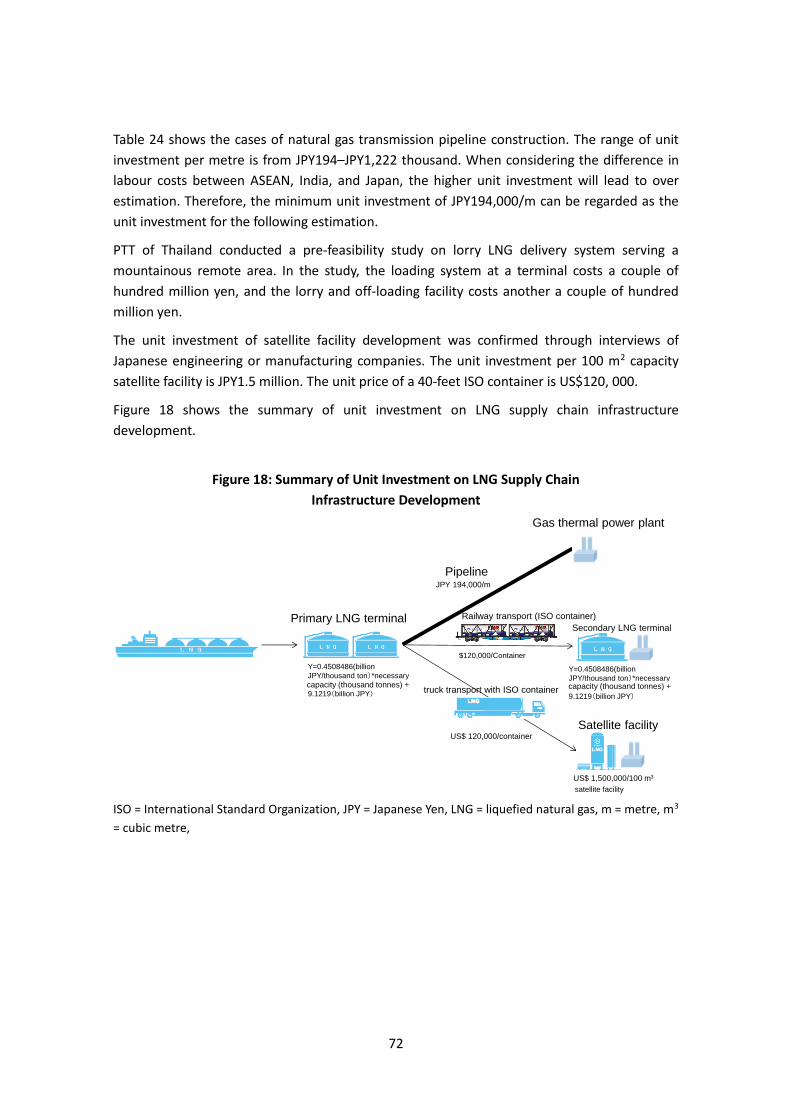
PTT of Thailand conducted a pre-feasibility study on lorry LNG delivery system serving a
mountainous remote area. In the study, the loading system at a terminal costs a couple of
hundred million yen, and the lorry and off-loading facility costs another a couple of hundred
million yen.
The unit investment of satellite facility development was confirmed through interviews of
Japanese engineering or manufacturing companies. The unit investment per 100 m2 capacity
satellite facility is JPY1.5 million. The unit price of a 40-feet ISO container is US$120, 000.
Figure 18 shows the summary of unit investment on LNG supply chain infrastructure
development.
Figure 18: Summary of Unit Investment on LNG Supply Chain
Infrastructure Development
ISO = International Standard Organization, JPY = Japanese Yen, LNG = liquefied natural gas, m = metre, m3
= cubic metre,
Y=0.4508486(billion
JPY/thousand ton)*necessary
capacity (thousand ton)+9.1219(billion JPY)
Primary LNG terminalSecondary LNG terminal
Satellite facility
Gas thermal power plant
Pipeline
Railway transport (ISO container)
truck transport with ISO container
¥194,000/m
$120,000/Container
$120,000/Container
$1,500,000/100 ㎥satellite facility
Y=0.4508486(billion
JPY/thousand ton)*necessary
capacity (thousand ton)+9.1219(billion JPY)
JPY 194,000/m
US$ 120,000/container
US$ 1,500,000/100 m3
capacity (thousand tonnes) + capacity (thousand tonnes) +
73
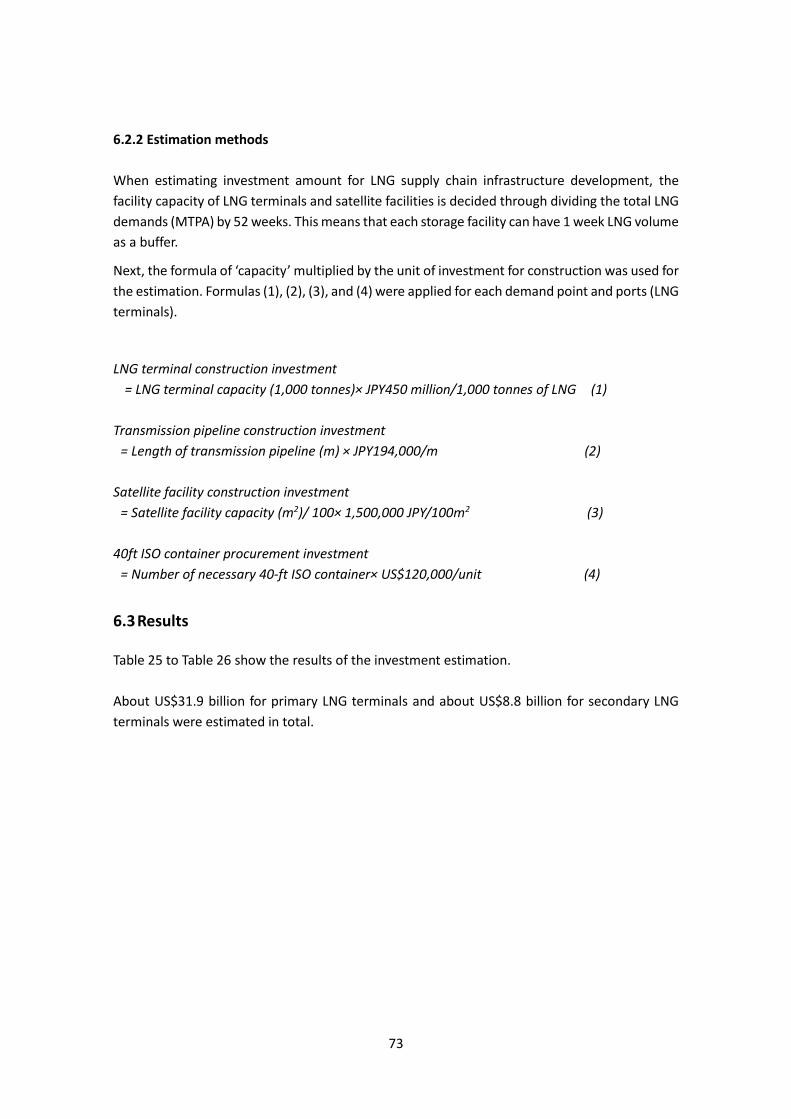
6.2.2 Estimation methods
When estimating investment amount for LNG supply chain infrastructure development, the
facility capacity of LNG terminals and satellite facilities is decided through dividing the total LNG
demands (MTPA) by 52 weeks. This means that each storage facility can have 1 week LNG volume
as a buffer.
Next, the formula of ‘capacity’ multiplied by the unit of investment for construction was used for
the estimation. Formulas (1), (2), (3), and (4) were applied for each demand point and ports (LNG
terminals).
LNG terminal construction investment
= LNG terminal capacity (1,000 tonnes)× JPY450 million/1,000 tonnes of LNG (1)
Transmission pipeline construction investment
= Length of transmission pipeline (m) × JPY194,000/m (2)
Satellite facility construction investment
= Satellite facility capacity (m2)/ 100× 1,500,000 JPY/100m2 (3)
40ft ISO container procurement investment
= Number of necessary 40-ft ISO container× US$120,000/unit (4)
6.3 Results
Table 25 to Table 26 show the results of the investment estimation.
About US$31.9 billion for primary LNG terminals and about US$8.8 billion for secondary LNG
terminals were estimated in total.

74
Table 25. Estimated Investment for Primary Terminal until 2030
Name of Primary LNG Terminal Country MTPA (Integrated)
Investment (US$ billion)
Cat Lai Viet Nam 232 1.03
Hai Phong Viet Nam 121 0.58
Ennur India 79 0.40
Vishakhapatnam India 9 0.12
Haldia Port India 376 1.62
Paradip India 295 1.29
Dahej India 743 3.13
Mandvi India 520 2.21
Ratnagiri India 11 0.13
Kochi (Cochin) India 34 0.22
Jawaharlal Nehru Port (Nhava Shiva)
India 719 3.03
Kakinada Bay India 229 1.02
Mumbai (Bombay) India 204 0.92
Pasir Gudang Malaysia 55 0.31
Butterworth Malaysia 158 0.73
Jurong Island Singapore 641 2.71
Rangoon Myanmar 43 0.26
Celukan Bawang Indonesia 45 0.27
Semarang Indonesia 139 0.65
Jakarta Indonesia 552 2.35
Ujung Pandang Indonesia 30 0.20
Da Nang Viet Nam 66 0.35
Vinh Cam Ranh Viet Nam 104 0.51
Bintulu Port Malaysia 101 0.50
Map Ta Phut Thailand 425 1.82
Bandar Seri Begawan Brunei 63 0.34
Lhokseumawe Indonesia 6 0.11
Banten Indonesia 98 0.48
Cilacap Indonesia 55 0.31
Bontang Lng Terminal Indonesia 47 0.28
Muntok Indonesia 87 0.44
Batangas City Philippines 84 0.43
Hazira India 143 0.67
Melaka Malaysia 10 0.12
Cirebon Indonesia 351 1.52
Probolinggo Indonesia 113 0.55
Sibolga Indonesia 53 0.30 LNG= liquefied natural gas, MTPA = million tonnes per annum.
Source: authors.

75
Table 26. Estimated Investment for Secondary Terminals until 2030
Name of secondary LNG
terminal
Country MTPA
(Integrated)
Investment
(US$ billion)
Nghe Tinh Viet Nam 7 0.11
Machilipatnam India 61 0.33
Chittagong Myanmar 75 0.39
Bhavnagar India 12 0.13
Magdalla India 143 0.67
Navlakhi India 516 2.20
New Mangalore India 6 0.11
Belekeri India 10 0.12
Nagappattinam India 4 0.10
Cuddalore India 28 0.20
Tuticorin India 11 0.13
Kuantan New Port Malaysia 9 0.12
Port Klang Malaysia 58 0.32
Kirteh Oil Terminal Malaysia 11 0.13
Bangkok Thailand 190 0.86
Khanom Thailand 23 0.18
Moulmein Harbor Myanmar 12 0.13
Gresik Indonesia 40 0.25
Belawan Indonesia 26 0.19
Teluk Bayur Indonesia 13 0.13
Nasugbu Philippines 16 0.15
Manila Philippines 28 0.20
Qui Nhon Viet Nam 16 0.15
Phu My Viet Nam 11 0.13
Duong Dong Viet Nam 40 0.25
Karaikal Port India 33 0.22
Pelabuhan Sungai Udang Malaysia 92 0.46
Port Dickson Malaysia 11 0.13
Teluk Anson Malaysia 8 0.12
Sapangar Bay Malaysia 17 0.15
Kuala Trengganu Malaysia 144 0.67
Pelabuhan Bass Malaysia 36 0.23
Si Racha Terminal Thailand 28 0.20
Petchburi Terminal Thailand 67 0.36
Sittwe Myanmar 4 0.10
Dumai Indonesia 23 0.18
Davao Philippines 4 0.10
Tanjung Leman Malaysia 10 0.12

76
Name of secondary LNG
terminal
Country MTPA
(Integrated)
Investment
(US$ billion)
Tanjung Tokong Malaysia 6 0.11
Pelabuhan Sandakan Malaysia 27 0.19
Rayong Tpi Terminal Thailand 23 0.18
Songkhla Harbor Thailand 6 0.11
Keppel (East Singapore) Singapore 274 1.21
Anyer Lor Indonesia 44 0.26
Stagen Indonesia 5 0.10
Kijang Indonesia 9 0.12
Panjang Indonesia 12 0.13
Parepare Indonesia 15 0.14
LNG= liquefied natural gas, MTPA = million tonnes per annum.
Source: Authors.
The estimate for a natural gas pipeline from an LNG terminal to a new gas thermal power plant
is US$2.56 billion.
Table 27. Estimated Investment for Pipelines of New Gas Thermal Power Plants until 2030
Plant name LNG
(MTPA)
Country Port name Distance to
nearest port
(km)
Investment
(US$ billion)
Nhon Hoi Refinery 0.819 Viet Nam Nhon Hoi Refinery 9 0.016
Phu My 0.151 Viet Nam Phu My 9 0.017
Thoi Hoa 1.170 Viet Nam Thoi Hoa 61 0.107
Nhon Trach 1.078 Viet Nam Nhon Trach 19 0.034
Hiep Phuoc 0.890 Viet Nam Hiep Phuoc 22 0.038
Ca Mau City 1.924 Viet Nam Ca Mau City 176 0.310
Prodair Kochi 0.300 India Prodair Kochi 17 0.030
Pillaiperumalnallur 1.613 India Pillaiperumalnallur 27 0.048
Mangalore Refinery 0.291 India Mangalore Refinery 9 0.015
Rajahmundry 3.279 India Rajahmundry 54 0.096
Trombay 4.935 India Trombay 5 0.010
Sugen 5.946 India Sugen 34 0.061
Palatana 1.557 India Palatana 142 0.250
Sultan Iskandar 2.684 Malaysia Sultan Iskandar 2 0.004
Bintulu 2.017 Malaysia Bintulu 11 0.020
Kulim Indust Park 1.240 Malaysia Kulim Indust Park 23 0.041
Kimanis Power 0.867 Malaysia Kimanis Power 55 0.097
Khanom 0.530 Thailand Khanom 4 0.008
Glow Spp Phase 3-5 0.599 Thailand Glow Spp Phase 3-5 3 0.006
77
Plant name LNG
(MTPA)
Country Port name Distance to
nearest port
(km)
Investment
(US$ billion)
Sriracha Ipt 0.169 Thailand Sriracha Ipt 8 0.014
Ratchaburi 1.502 Thailand Ratchaburi 71 0.126
South Bangkok 0.320 Thailand South Bangkok 12 0.021
North Bangkok 0.466 Thailand North Bangkok 34 0.060
Korat 0.547 Thailand Korat 228 0.402
Nong Chok 0.538 Thailand Nong Chok 290 0.511
Jurong Island 9.373 Singapore Jurong Island 6 0.011
Gadong 0.407 Brunei Gadong 11 0.019
Pemaron 0.590 Indonesia Pemaron 26 0.046
Cilegon Nsi 0.940 Indonesia Cilegon Nsi 5 0.009
Cilacap 1.425 Indonesia Cilacap 5 0.010
Petorkima Gresik 1.985 Indonesia Petorkima Gresik 2 0.003
Bontang Works 0.783 Indonesia Bontang Works 1 0.002
Paya Pasir 1.312 Indonesia Paya Pasir 8 0.014
North Duri 1.183 Indonesia North Duri 2 0.003
Muara Tawar 3.969 Indonesia Muara Tawar 13 0.024
Calaca Semirara 0.569 Philippines Calaca Semirara 25 0.043
Santa Rita Batangas 0.580 Philippines Santa Rita Batangas 1 0.002
Therma South 0.165 Philippines Therma South 19 0.033
LNG= liquefied natural gas, MTPA = million tonnes per annum.
Source: Authors.
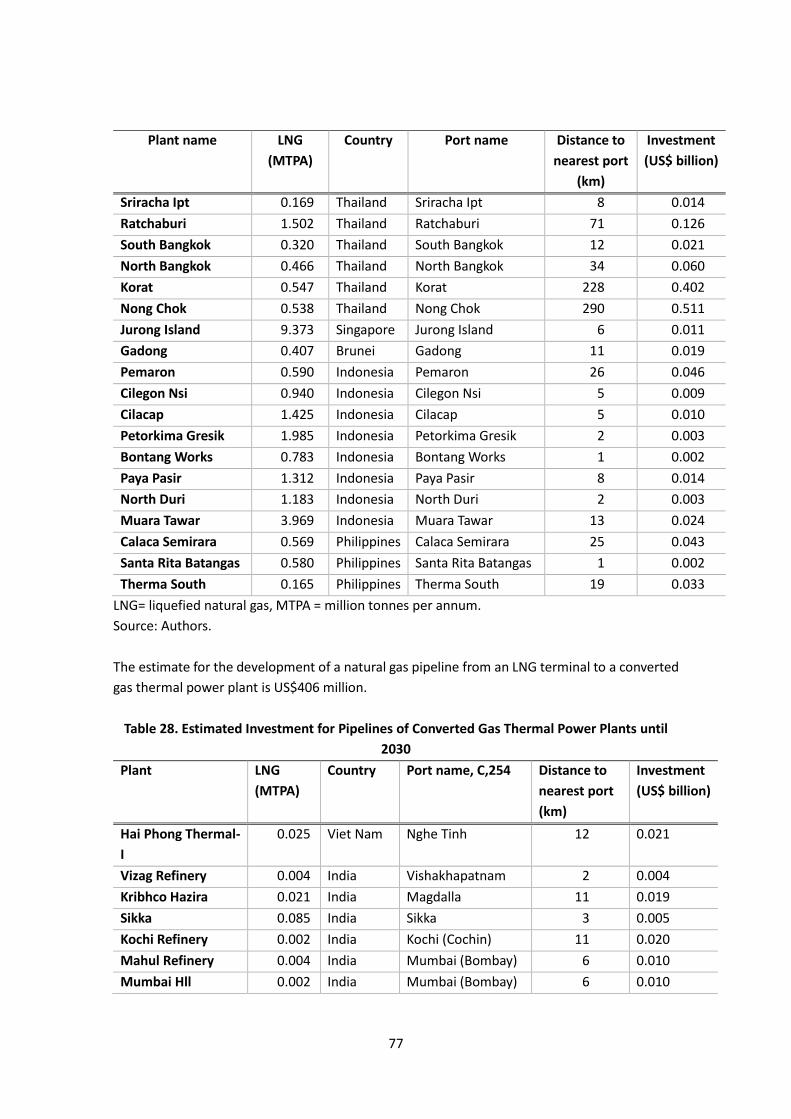
The estimate for the development of a natural gas pipeline from an LNG terminal to a converted
gas thermal power plant is US$406 million.
Table 28. Estimated Investment for Pipelines of Converted Gas Thermal Power Plants until
2030
Plant LNG
(MTPA)
Country Port name, C,254 Distance to
nearest port
(km)
Investment
(US$ billion)
Hai Phong Thermal-
I
0.025 Viet Nam Nghe Tinh 12 0.021
Vizag Refinery 0.004 India Vishakhapatnam 2 0.004
Kribhco Hazira 0.021 India Magdalla 11 0.019
Sikka 0.085 India Sikka 3 0.005
Kochi Refinery 0.002 India Kochi (Cochin) 11 0.020
Mahul Refinery 0.004 India Mumbai (Bombay) 6 0.010
Mumbai Hll 0.002 India Mumbai (Bombay) 6 0.010

78
Plant LNG
(MTPA)
Country Port name, C,254 Distance to
nearest port
(km)
Investment
(US$ billion)
Thane Plant 0.003 India Jawaharlal Nehru
Port (Nhava Shiva)
28 0.049
Paradip Works 0.023 India Paradip 6 0.010
Madras Southern
Petro
0.013 India Chennai (Madras) 3 0.005
Manali Refinery 0.004 India Chennai (Madras) 8 0.014
Durgapur Plant Hfcl 0.025 India Haldia Port 6 0.010
Patau-Patau 0.023 Malaysia Labuan 1 0.001
Kuantan 0.012 Malaysia Kuantan New Port 22 0.038
Perai 0.006 Malaysia Butterworth 2 0.004
Khanom 0.051 Thailand Khanom 4 0.008
Jurong 0.060 Singapore Jurong Island 6 0.011
Pulau Seraya 0.010 Singapore Jurong Island 1 0.002
Mawlamyaing 0.008 Myanmaer Moulmein Harbor 1 0.003
Ywama 0.008 Myanmaer Rangoon 2 0.004
Tambak Lorok 0.029 Indonesia Semarang 3 0.005
Gresik 0.080 Indonesia Gresik 2 0.003
Petak 0.026 Indonesia Surabaya 1 0.002
Perak 0.011 Indonesia Surabaya 1 0.002
Pulogadung 0.039 Indonesia Jakarta 11 0.019
Tanjung Priok 0.015 Indonesia Jakarta 2 0.004
Berushaan 0.007 Indonesia Jakarta 18 0.032
Muara Karang 0.046 Indonesia Jakarta 11 0.019
Belawan 0.030 Indonesia Belawan 2 0.003
Batamindo
Industrial
0.003 Indonesia Sekupang 14 0.025
Tello 0.017 Indonesia Ujung Pandang 8 0.014
Padang 0.014 Indonesia Teluk Bayur 14 0.025
Khanom 0.051 Cambodia Khanom 4 0.008
Total
0.406
LNG= liquefied natural gas, MTPA = million tonnes per annum. C,254 = please include in notes? Source: Authors.
About 10,253 ISO containers are needed and almost US$1.177 billion are needed.

79
Table 29. Estimated Investment for ISO Containers until 2030
Country Number of ISO
containers/day
Investment
(US$ billion)
Cambodia 12 0.001
India 3,650 0.435
Indonesia 3,261 0.322
Malaysia 771 0.137
Myanmar 246 0.027
Philippines 471 0.052
Thailand 342 0.038
Viet Nam 1,501 0.164
Total 10,253 1.177
ISO = International Standard Organization. Source: Authors.
The number of 100 m3 eq. satellite tanks are estimated at 23,509 and investment amount is
estimated at about US$32.06 billion (condition: 1 week amount of LNG will be stored in each
satellite facility).
Table 30. Estimated Investment for Satellite Facilities until 2030
Number of satellite
facilities
Investment
(US$ billion)
Brunei 63 0.086
Cambodia 25 0.034
India 8,353 11.390
Indonesia 6,817 9.296
Malaysia 2,590 3.532
Myanmar 491 0.670
Philippines 1,359 1.853
Thailand 752 1.025
Viet Nam 3,059 4.171
Total 23,509 32.058
Source: Authors.
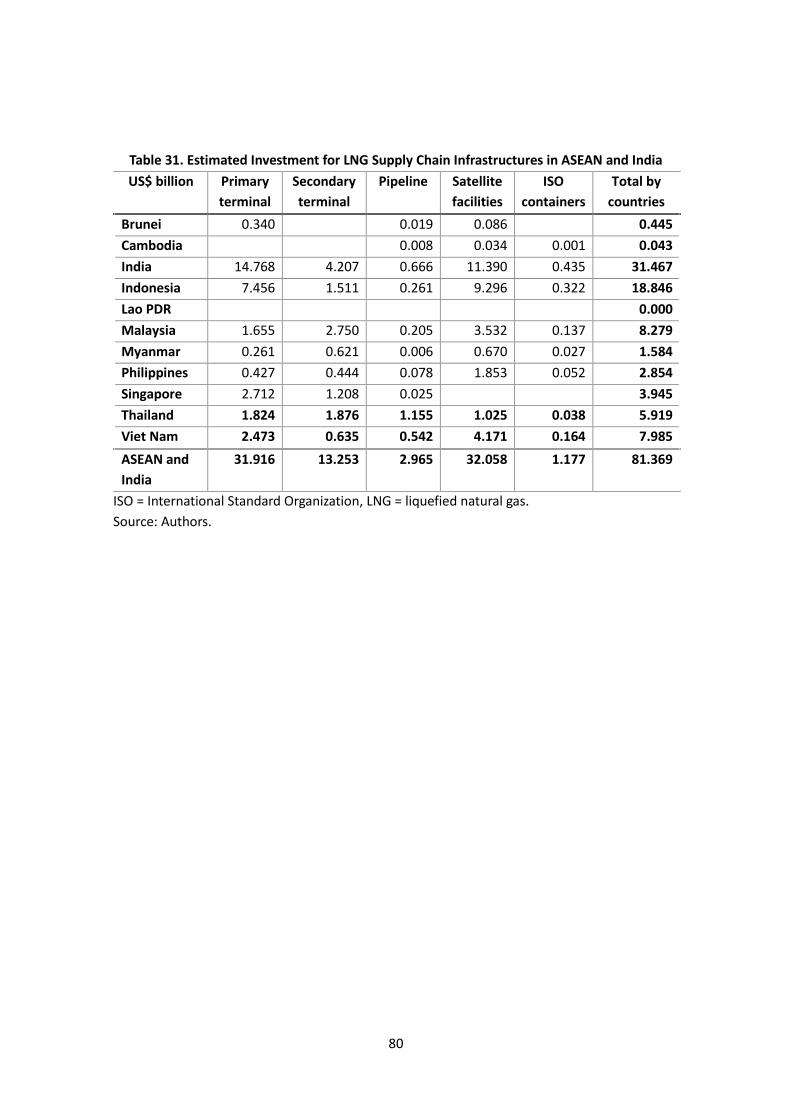
The total additional necessary investment for LNG supply chain infrastructures in ASEAN and
India, in addition to the current LNG supply chain infrastructures, is estimated at US$81.369
billion. Most investments will occur in India and Indonesia. Primary LNG terminal and satellite
facilities are major investment areas.
80
Table 31. Estimated Investment for LNG Supply Chain Infrastructures in ASEAN and India
US$ billion Primary
terminal
Secondary
terminal
Pipeline Satellite
facilities
ISO
containers
Total by
countries
Brunei 0.340 0.019 0.086 0.445
Cambodia
0.008 0.034 0.001 0.043
India 14.768 4.207 0.666 11.390 0.435 31.467
Indonesia 7.456 1.511 0.261 9.296 0.322 18.846
Lao PDR
0.000
Malaysia 1.655 2.750 0.205 3.532 0.137 8.279
Myanmar 0.261 0.621 0.006 0.670 0.027 1.584
Philippines 0.427 0.444 0.078 1.853 0.052 2.854
Singapore 2.712 1.208 0.025
3.945
Thailand 1.824 1.876 1.155 1.025 0.038 5.919
Viet Nam 2.473 0.635 0.542 4.171 0.164 7.985
ASEAN and
India
31.916 13.253 2.965 32.058 1.177 81.369
ISO = International Standard Organization, LNG = liquefied natural gas.
Source: Authors.