Embed Size (px)
Citation preview
Chapter 6 6-3 Piece wise functions
ObjectivesWrite and graph piecewise functions.
Use piecewise functions to describe real-world situations.
Piece Wise Function A piecewise function is a function that
is a combination of one or more functions. The rule for a piecewise function is different for different parts, or pieces, of the domain. For instance, movie ticket prices are often different for different age groups. So the function for movie ticket prices would assign a different value (ticket price) for each domain interval (age group).
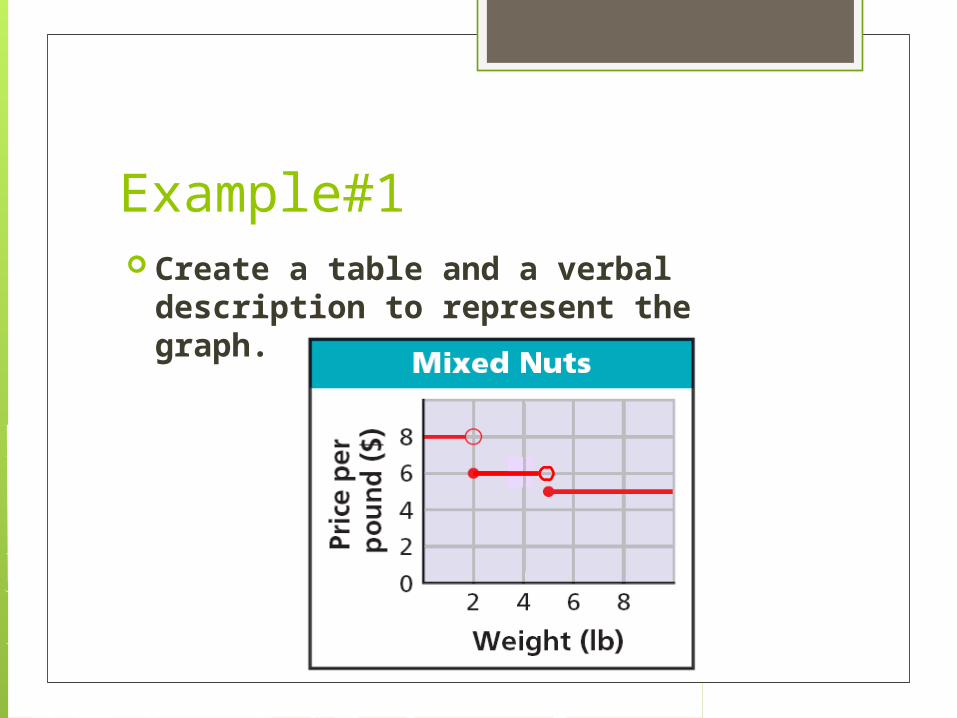
Example#1 Create a table and a verbal
description to represent the graph.
Solution
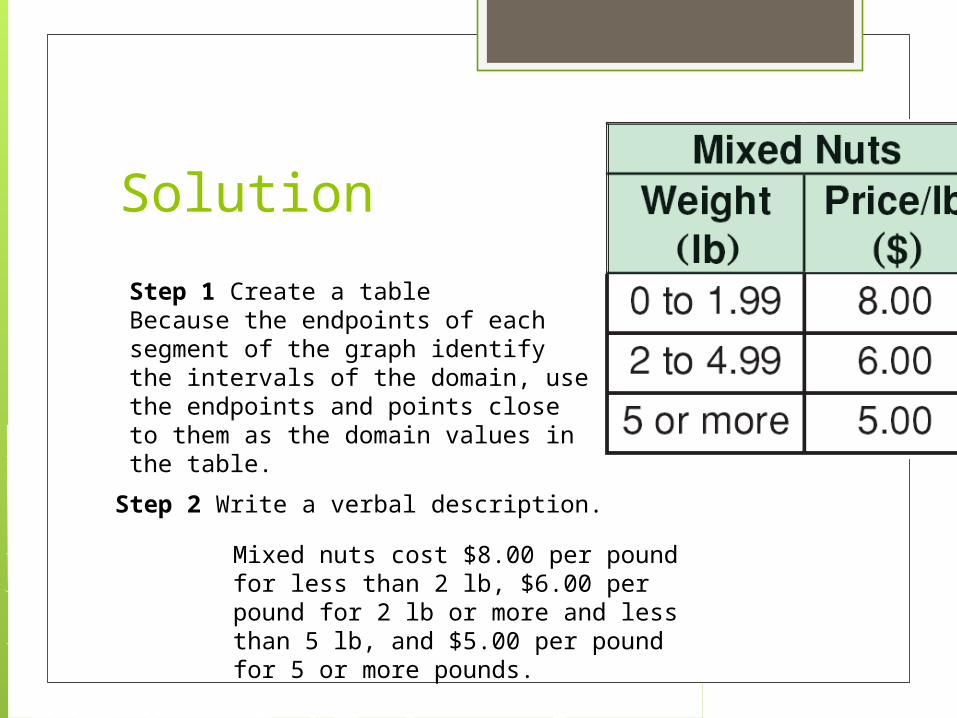
Step 1 Create a tableBecause the endpoints of each segment of the graph identify the intervals of the domain, use the endpoints and points close to them as the domain values in the table.
Step 2 Write a verbal description.
Mixed nuts cost $8.00 per pound for less than 2 lb, $6.00 per pound for 2 lb or more and less than 5 lb, and $5.00 per pound for 5 or more pounds.
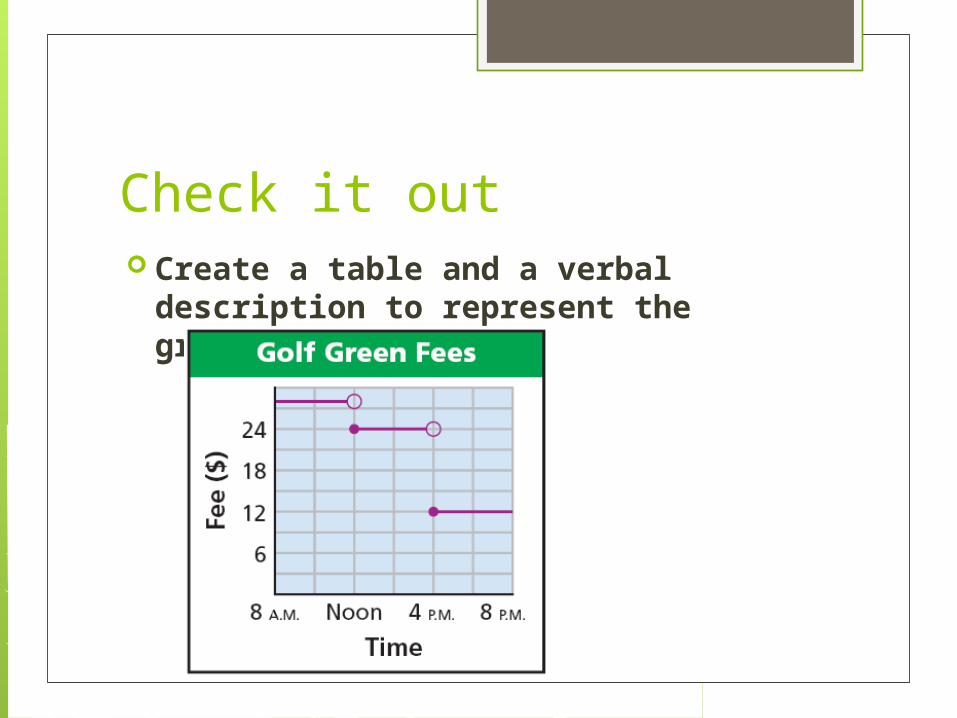
Check it out Create a table and a verbal
description to represent the graph.
Piece wise Function A piecewise function that is constant for
each interval of its domain, such as the ticket price function, is called a step function. You can describe piecewise functions with a function rule. The rule for the movie ticket prices from Example 1 on page 662 is shown.
Piece wise
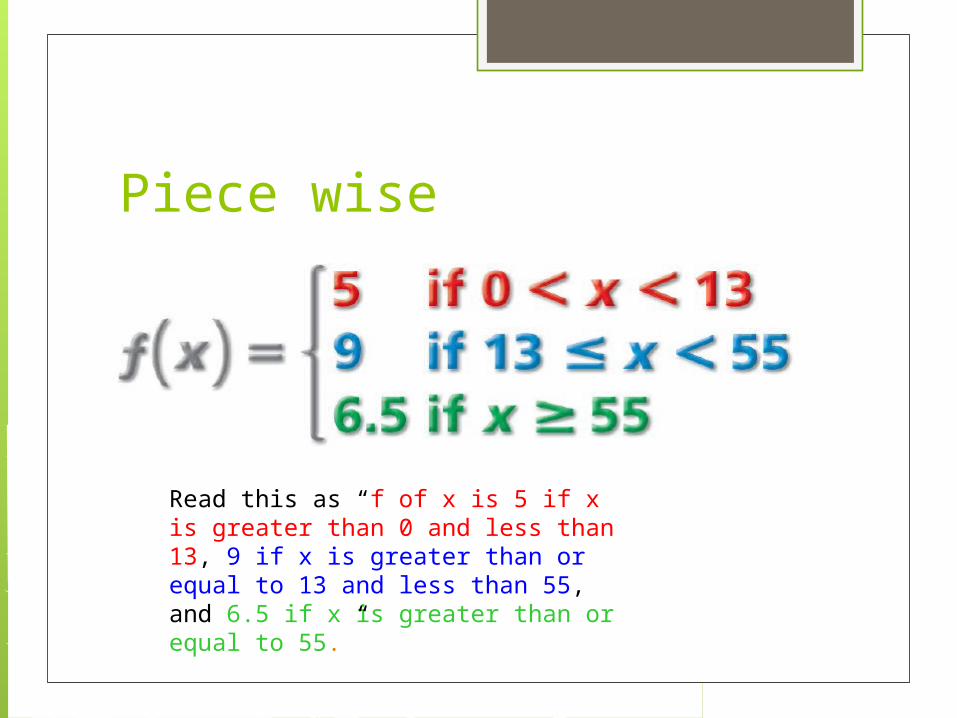
Read this as “f of x is 5 if x is greater than 0 and less than 13, 9 if x is greater than or equal to 13 and less than 55, and 6.5 if x is greater than or equal to 55.”
Evaluating piecewise functions To evaluate any piecewise function for a
specific input, find the interval of the domain that contains that input and then use the rule for that interval
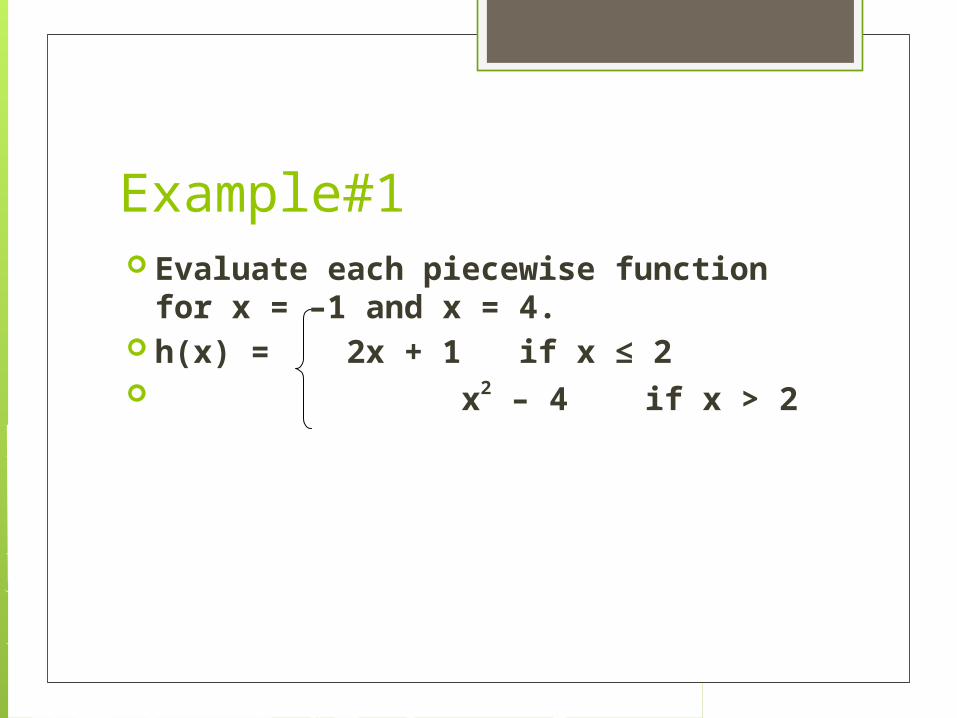
Example#1 Evaluate each piecewise function
for x = –1 and x = 4. h(x) = 2x + 1 if x ≤ 2 x2 – 4 if x > 2
Example#2 g(x) = 2x if x ≤ –1
5x if x > –1
Example#3 Evaluate each piecewise function
for x = –1 and x = 3. f(x) = 12 if x < –3 15 if –3 ≤ x < 6 20 if x ≥ 6
Check it out Evaluate each piecewise function
for x = –1 and x = 3. 3x2 + 1 if x < 0 5x – 2 if x ≥ 0
Graphing piece wise functions You can graph a piecewise function by
graphing each piece of the function.
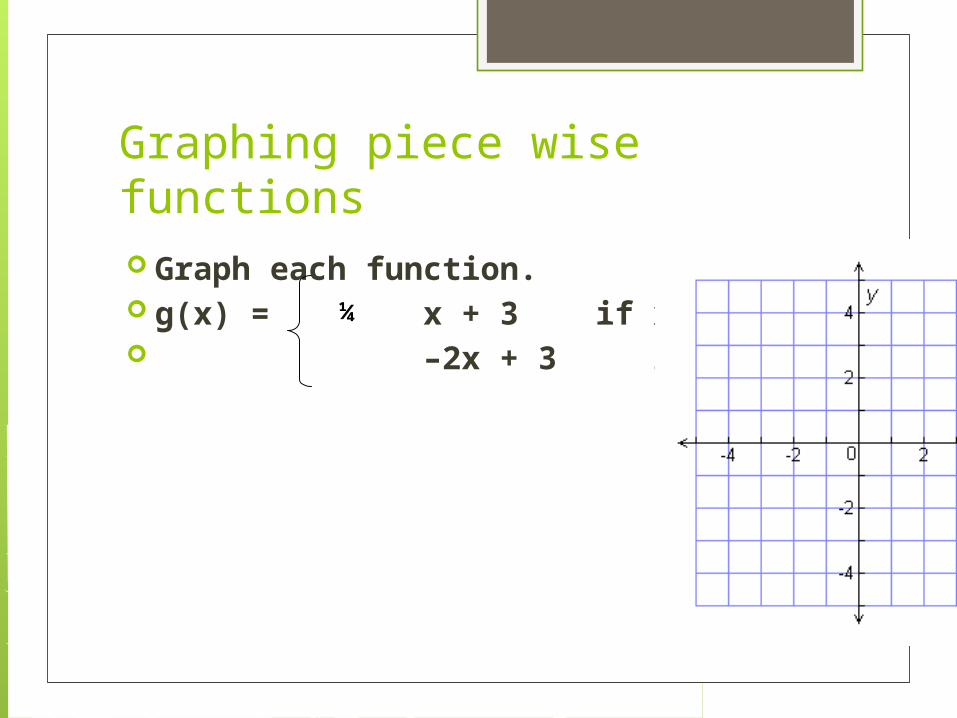
Graphing piece wise functions Graph each function. g(x) = x + 3 if x < 0 –2x + 3 if x ≥ 0
¼
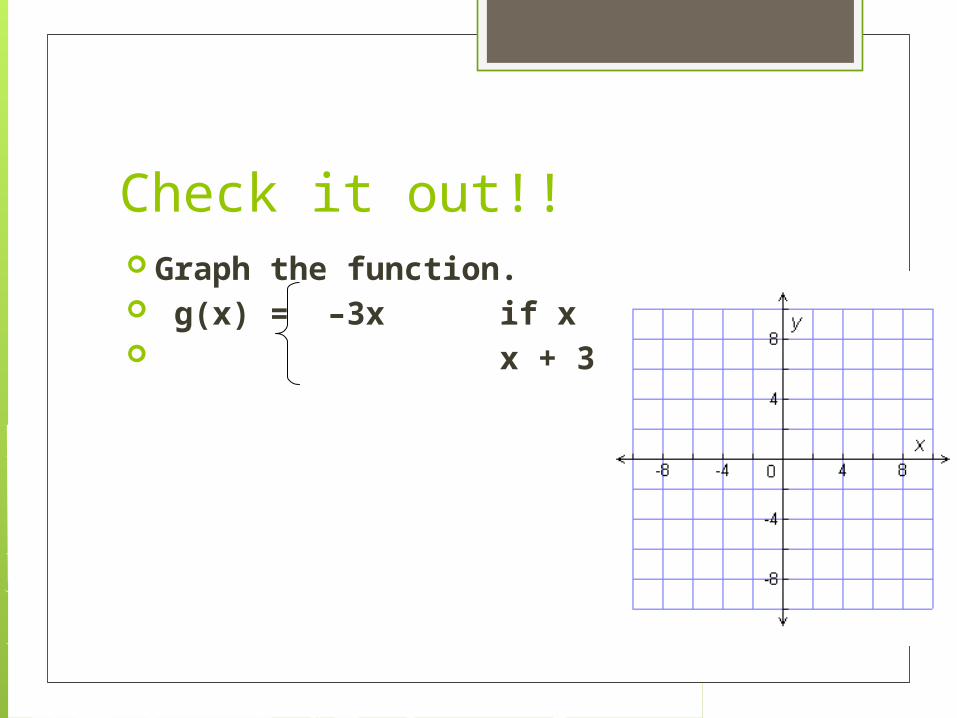
Check it out!! Graph the function. g(x) = –3x if x < 2 x + 3 if x ≥ 2
Application Jennifer is completing a 15.5-mile
triathlon. She swims 0.5 mile in 30 minutes, bicycles 12 miles in 1 hour, and runs 3 miles in 30 minutes. Sketch a graph of Jennifer’s distance versus time. Then write a piecewise function for the graph.
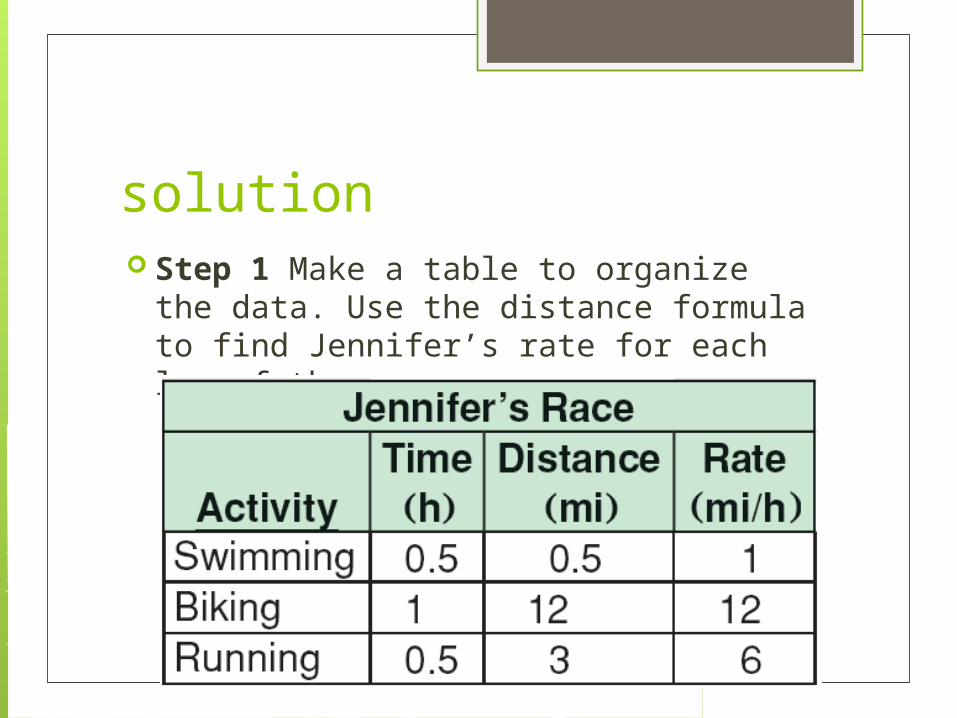
solution Step 1 Make a table to organize the
data. Use the distance formula to find Jennifer’s rate for each leg of the race.
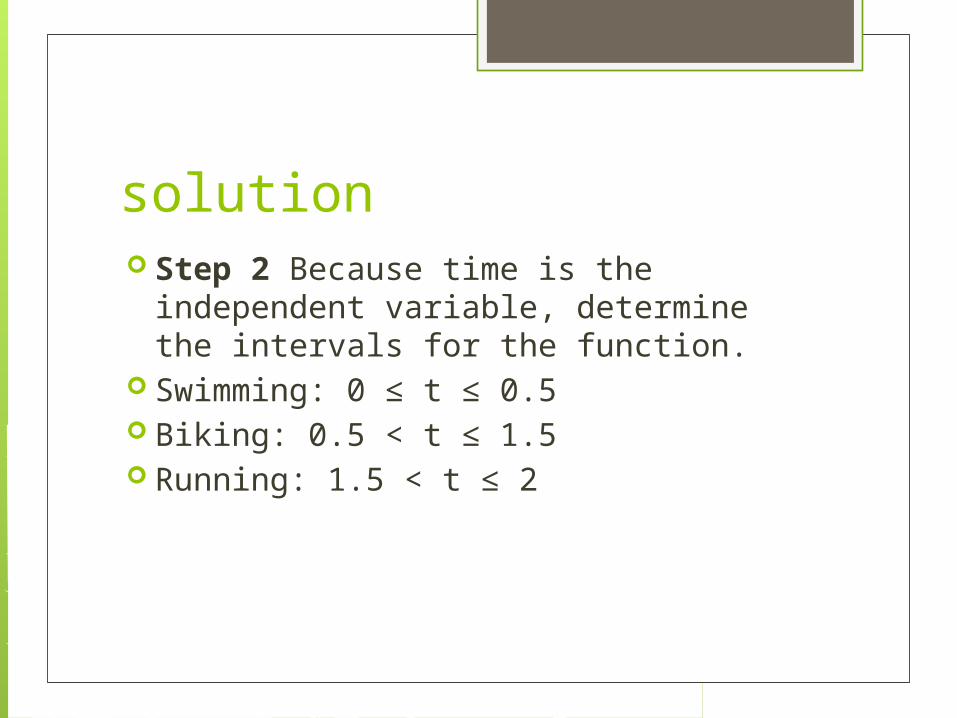
solution Step 2 Because time is the
independent variable, determine the intervals for the function.
Swimming: 0 ≤ t ≤ 0.5 Biking: 0.5 < t ≤ 1.5 Running: 1.5 < t ≤ 2
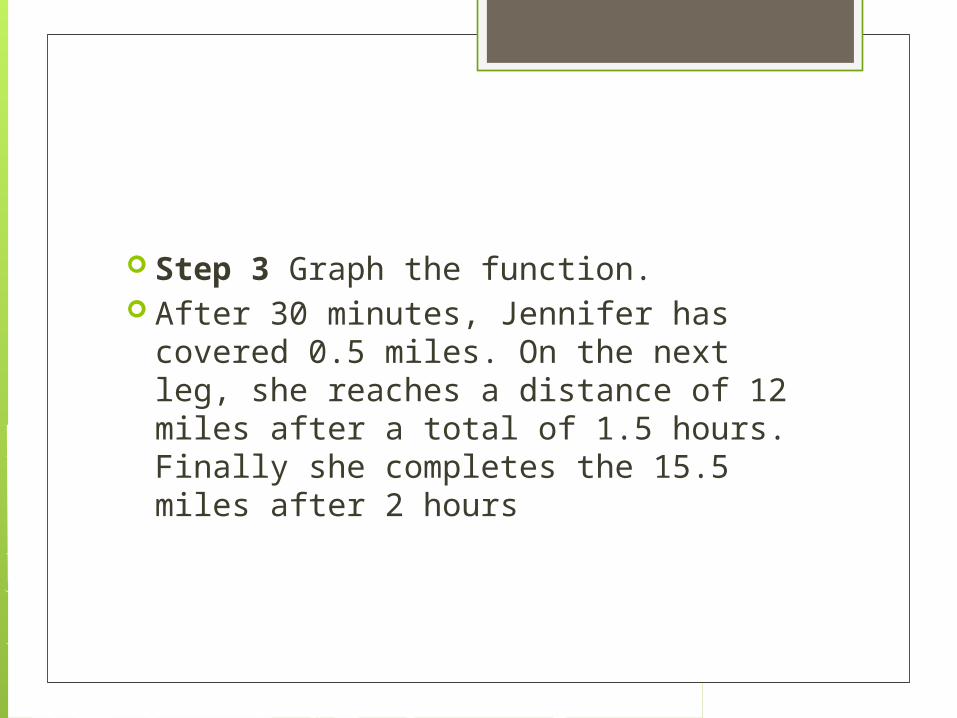
Step 3 Graph the function. After 30 minutes, Jennifer has covered
0.5 miles. On the next leg, she reaches a distance of 12 miles after a total of 1.5 hours. Finally she completes the 15.5 miles after 2 hours
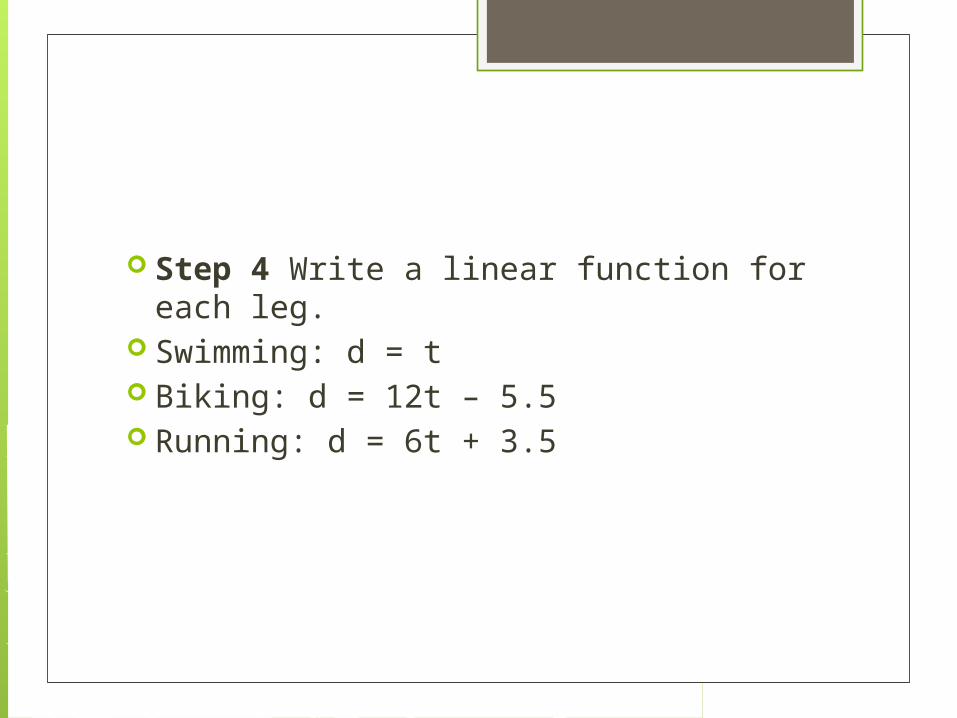
Step 4 Write a linear function for each leg.
Swimming: d = t Biking: d = 12t – 5.5 Running: d = 6t + 3.5
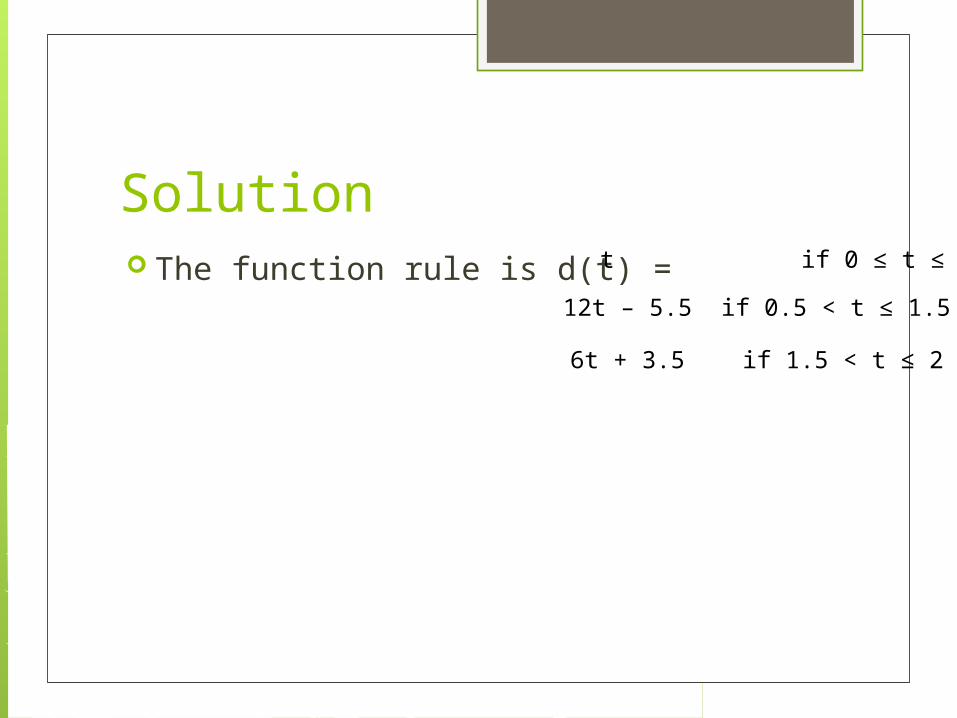
Solution The function rule is d(t) = t if 0 ≤ t ≤ 0.5
12t – 5.5 if 0.5 < t ≤ 1.5
6t + 3.5 if 1.5 < t ≤ 2

Videos Let’s watch some videos

Student guided practice Do problems 2-7 in your book page 426
Homework Do problems 9-14 in your book page
426