Embed Size (px)
DESCRIPTION
Graphs of Piecewise Linear Functions. Define appropriate quantities from a situation, choose and interpret the scale and the origin for the graph, and graph the piecewise linear function. Learning Goal 2 (HS.N-Q.A.1, 2, 3): - PowerPoint PPT Presentation
Citation preview
Graphs of Piecewise Linear FunctionsDefine appropriate quantities from a situation, choose and interpret the scale and the origin for the graph, and graph the piecewise linear function.

Learning Goal 2 (HS.N-Q.A.1, 2, 3):The student will be able to use units to solve multi-step contextual problems.

Video
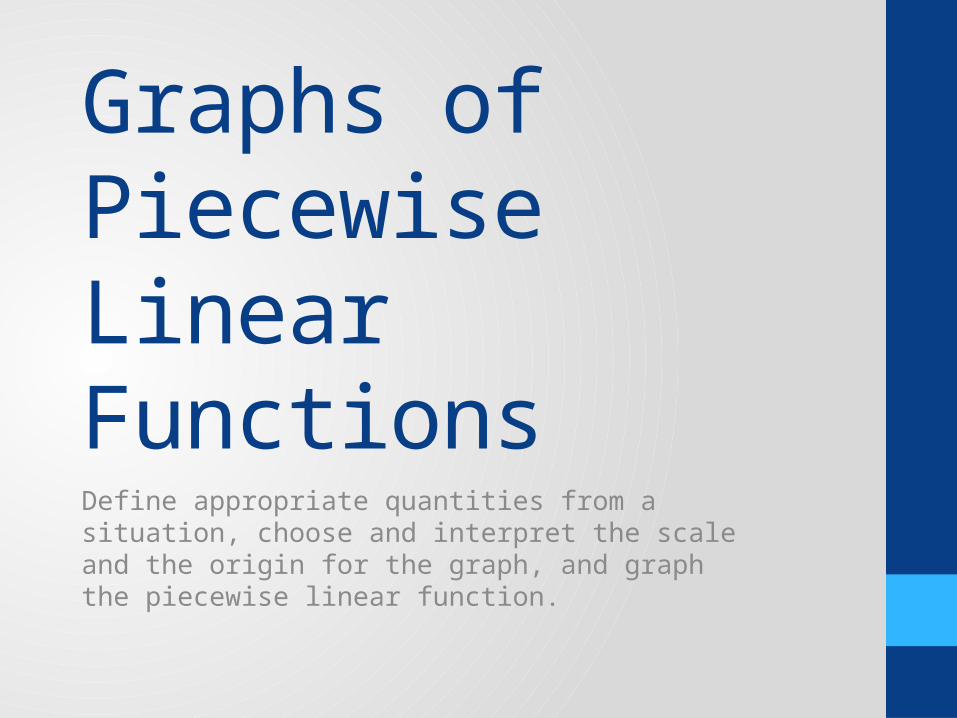
• Watch the following video.• Your goal is to be able to describe the motion of the man
in words.
• Describe the motion of the man in the video.
• Describe the man in terms of change in elevation of the man and the amount of time.
Video…Analyze
• How high do you think the man was at the top of the stairs?• How did you estimate that
elevation?• Were there intervals of time
when his elevation wasn’t changing?• Was he still moving?• Did his elevation ever
increased?• When?
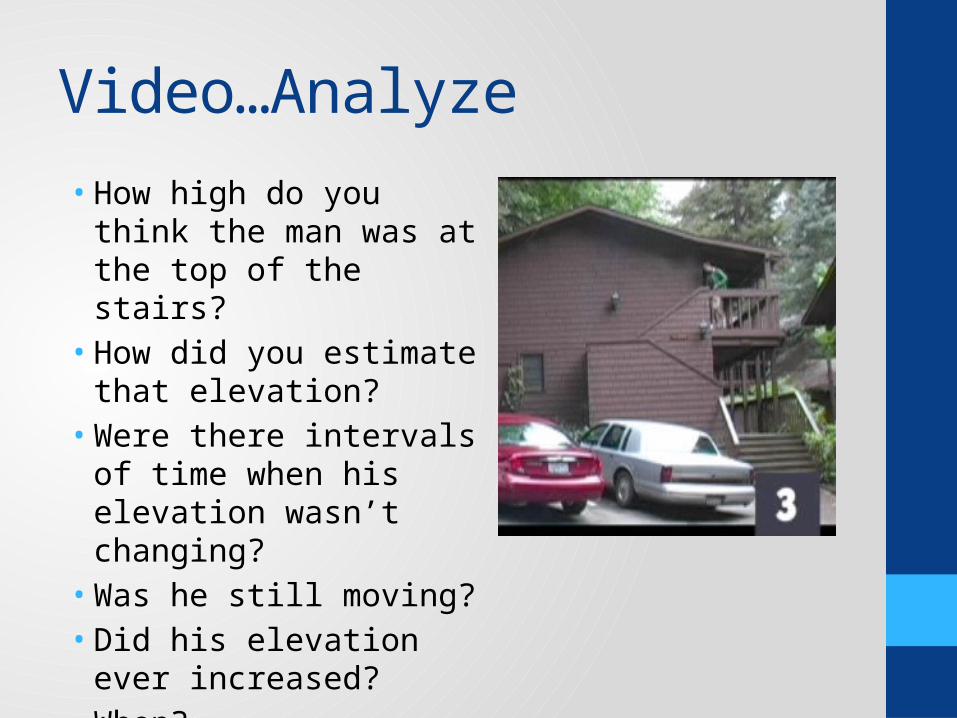
Video…Graph• How should we label the vertical
axis?• What measurement should we
choose (feet or meters)?• How should we label the
horizontal axis?• What unit of measure should we
choose?• Should we measure the man’s
elevation to his feet or to his head on the graph?
• The man starts at the top of the stairs. Where would that be located on the graph?
• Draw the graph.
What the graph could look like.
2 4 6 8 10 12 14 16
Elevation (feet)
Time (Seconds)
Elevation vs. Time GraphMan in Green Jacket
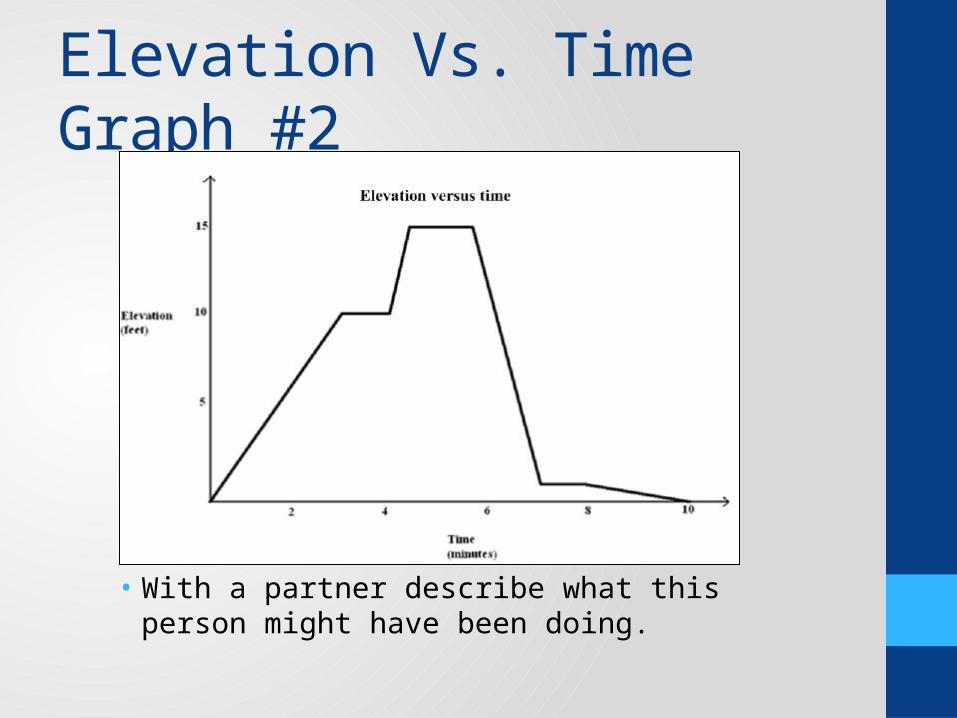
Elevation Vs. Time Graph #2
• With a partner describe what this person might have been doing.
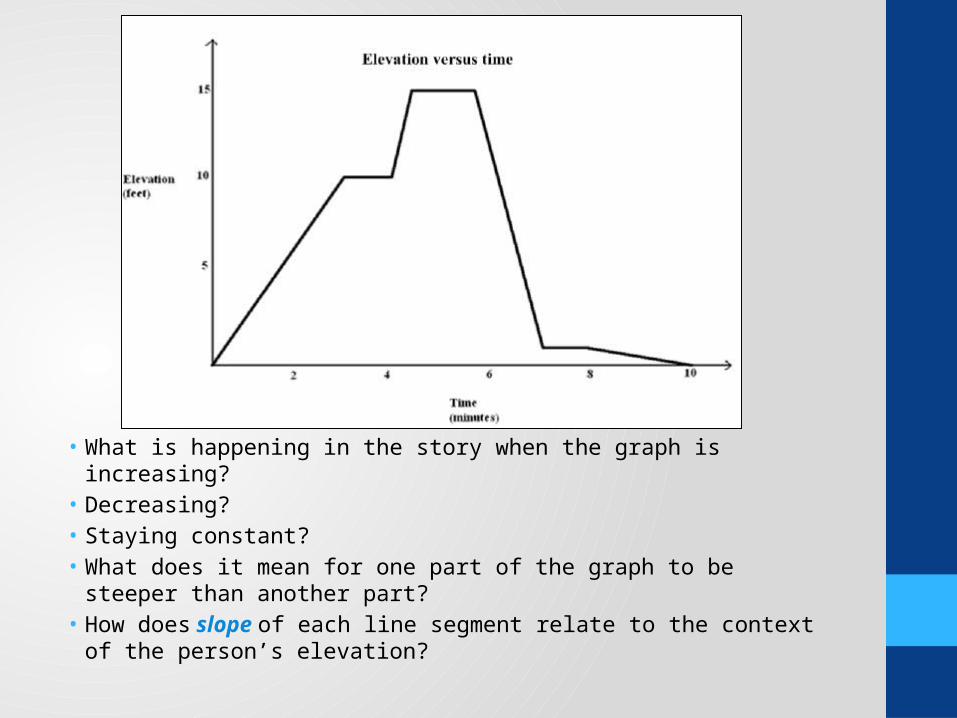
• What is happening in the story when the graph is increasing?• Decreasing?• Staying constant?• What does it mean for one part of the graph to be steeper than
another part?• How does slope of each line segment relate to the context of the
person’s elevation?
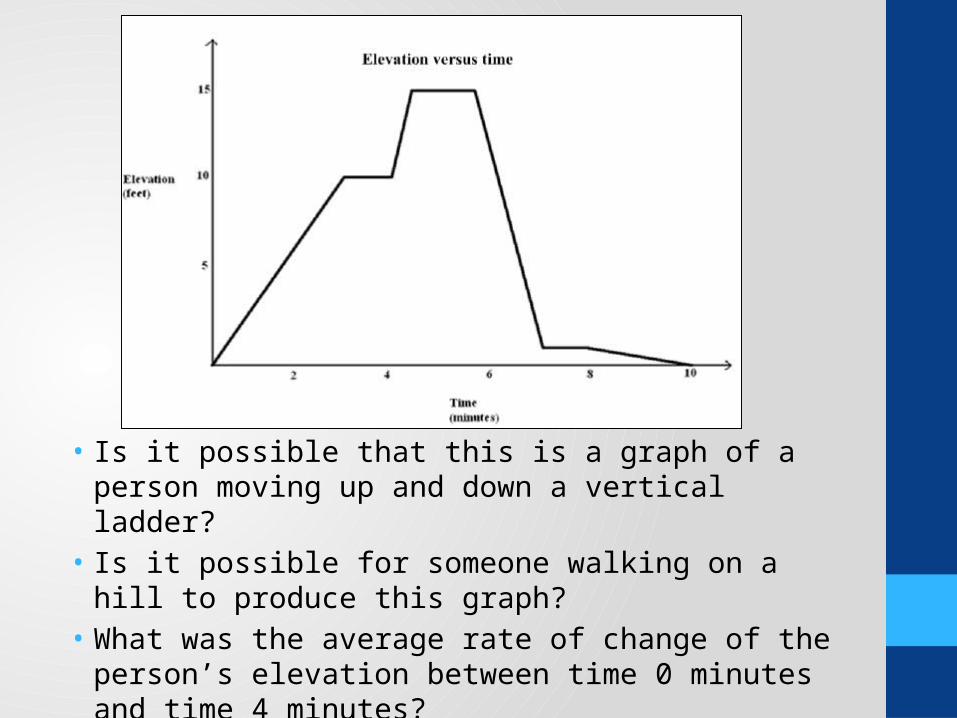
• Is it possible that this is a graph of a person moving up and down a vertical ladder?
• Is it possible for someone walking on a hill to produce this graph?
• What was the average rate of change of the person’s elevation between time 0 minutes and time 4 minutes?• 10/4 feet per minute or 2.5 feet per minute.

• What type of equation (s) would be required to create this graph?

Piecewise Linear Function• Definition: Given non-overlapping intervals on the real
number line, a (real) piecewise linear function is a function from the union of the intervals on the real number line that is defined by (possible different) linear functions on each interval.
• All the graphs we studied today are Piecewise Linear Functions.
• Here are a few more:
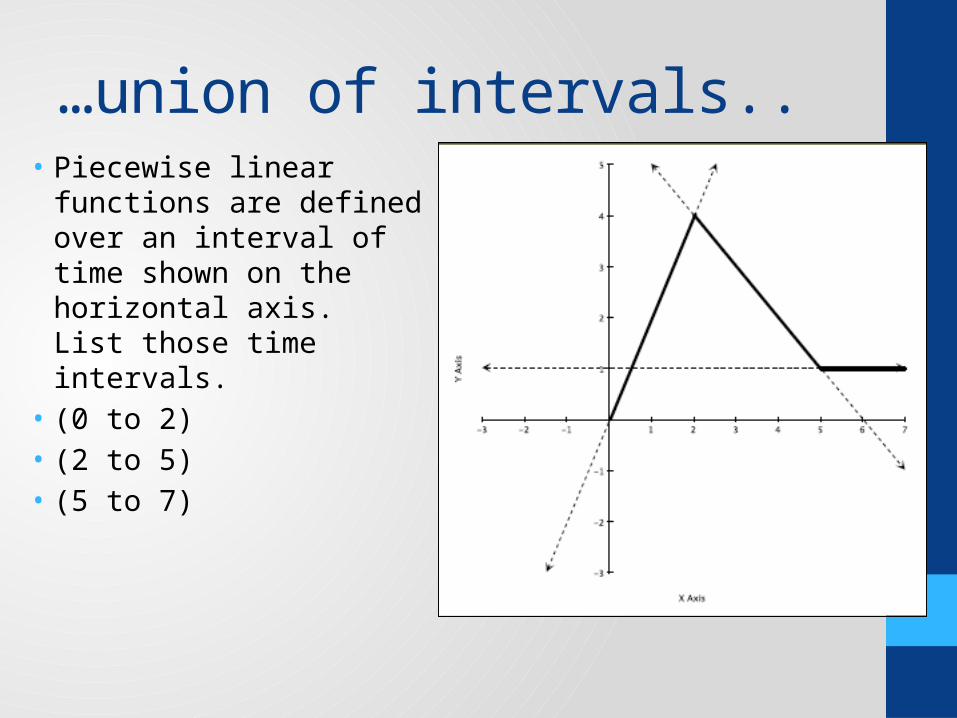
…union of intervals..• Piecewise linear functions are
defined over an interval of time shown on the horizontal axis. List those time intervals.
• (0 to 2)• (2 to 5)• (5 to 7)