Embed Size (px)
Citation preview
© Mike Rother / Improvement Kata Handbook Current Condition 1
The Improvement Kata - Planning Phase
Step 2: GRASP THE CURRENT CONDITIONA Simple Process-Analysis Kata
Routine
Practice this
Chapter 5
© Mike Rother / Improvement Kata Handbook Current Condition 2
Iterate Towardthe Target Condition
C C
T C
Establish the Next Target
ConditionTarget
Condition
Grasp the Current
Condition
Understandthe
Direction
ʻExecutingʼ Coaching
Cycles
Coach Learner
ʻPlanningʼ Coaching Cycles
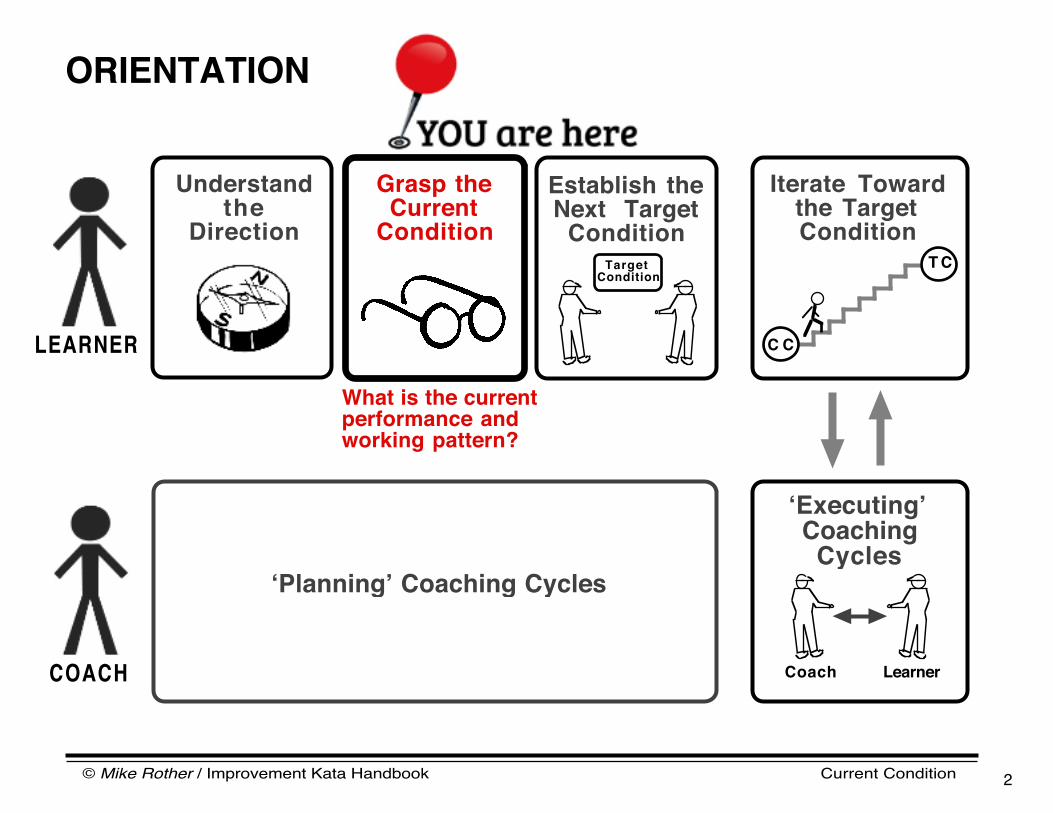
What is the current performance and working pattern?
ORIENTATION
LEARNER
COACH

© Mike Rother / Improvement Kata Handbook Current Condition 3
TargetConditionAchieve by: _______
Focus Process: Challenge:
CurrentCondition
PDCA Cycles Record
Obstacles Parking Lot
LEARNERʻS STORYBOARDLearner and Coach are now concentrating on this field
© Mike Rother / Improvement Kata Handbook Current Condition 4
ConceptOverview
© Mike Rother / Improvement Kata Handbook Current Condition 5
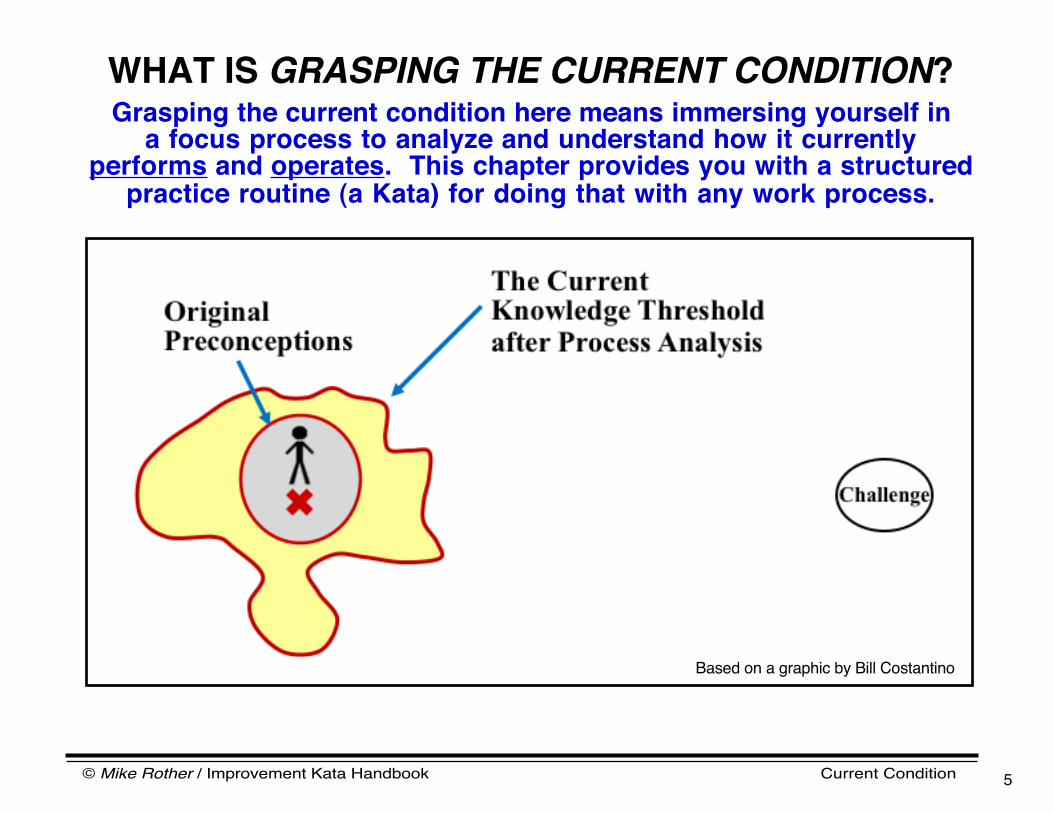
WHAT IS GRASPING THE CURRENT CONDITION?Grasping the current condition here means immersing yourself in
a focus process to analyze and understand how it currentlyperforms and operates. This chapter provides you with a structured
practice routine (a Kata) for doing that with any work process.
Based on a graphic by Bill Costantino

© Mike Rother / Improvement Kata Handbook Current Condition 6
Understand the
Direction(from level above)
Graspthe
Current Condition
Establishthe Next Target
Condition
Value StreamLevel
OrganizationLevel
Process Level P
At the Organization level, how you grasp the current condition depends on the strategic purpose/goals being pursued.
At the Value-Stream level, Current-State Value Stream Mapping is typically used to help grasp the current condition.
At the Process level, the steps presented in this chapter are an excellent routine to practice and use.
THIS CHAPTER PRESENTS A FUNDAMENTAL ROUTINE FOR GRASPING THE CURRENT CONDITION
AT THE PROCESS LEVEL
Current-StateValue Stream
Mapping
© Mike Rother / Improvement Kata Handbook Current Condition 7
Process Process Process
SchedulingProcess
FIFOProcess
OXOX
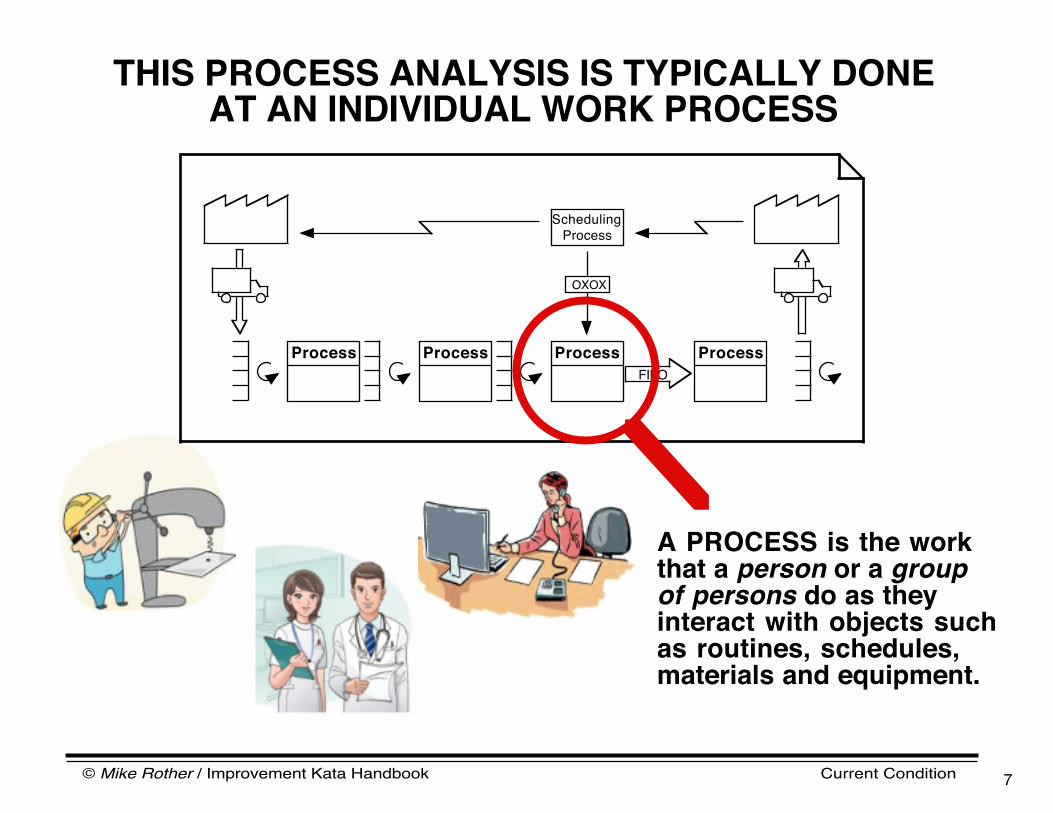
THIS PROCESS ANALYSIS IS TYPICALLY DONEAT AN INDIVIDUAL WORK PROCESS
A PROCESS is the work that a person or a groupof persons do as they interact with objects such as routines, schedules, materials and equipment.

© Mike Rother / Improvement Kata Handbook Current Condition 8
PURPOSEThe purpose of this process analysis Kata is to get a
baseline understanding of the focus process. Thatʼs all.
Grasping the initial current condition is a step toward establishing a first Target Condition. When you are ready to establish a second Target Condition for the same process youʼll have learned a lot about that process through the experimenting in the Executing phase of the Improvement Kata. The process analysis for the second Target Condition may therefore procede more quickly, since you are not starting over.
Process Analysis (or “Grasping the Current Condition”) is about getting an understanding of the current outcome performance and operating characteristics/patterns of the focus process, so you can then define an appropriate next “Target Condition.”
Process Analysis is a prerequisite for establishing a Target Condition. Analyzing the current condition is done to obtain facts & data about whatʼs really going on, which you then use to describe an appropriate next target condition.
Caution! The purpose of this process analysis is not to uncover problems, wastes or potential improvements. Process Analysis is not about identifying issues to work on. Once you have established a target condition and strive to move toward it, then youʼll discover the obstacles that you need to work on.
© Mike Rother / Improvement Kata Handbook Current Condition 9
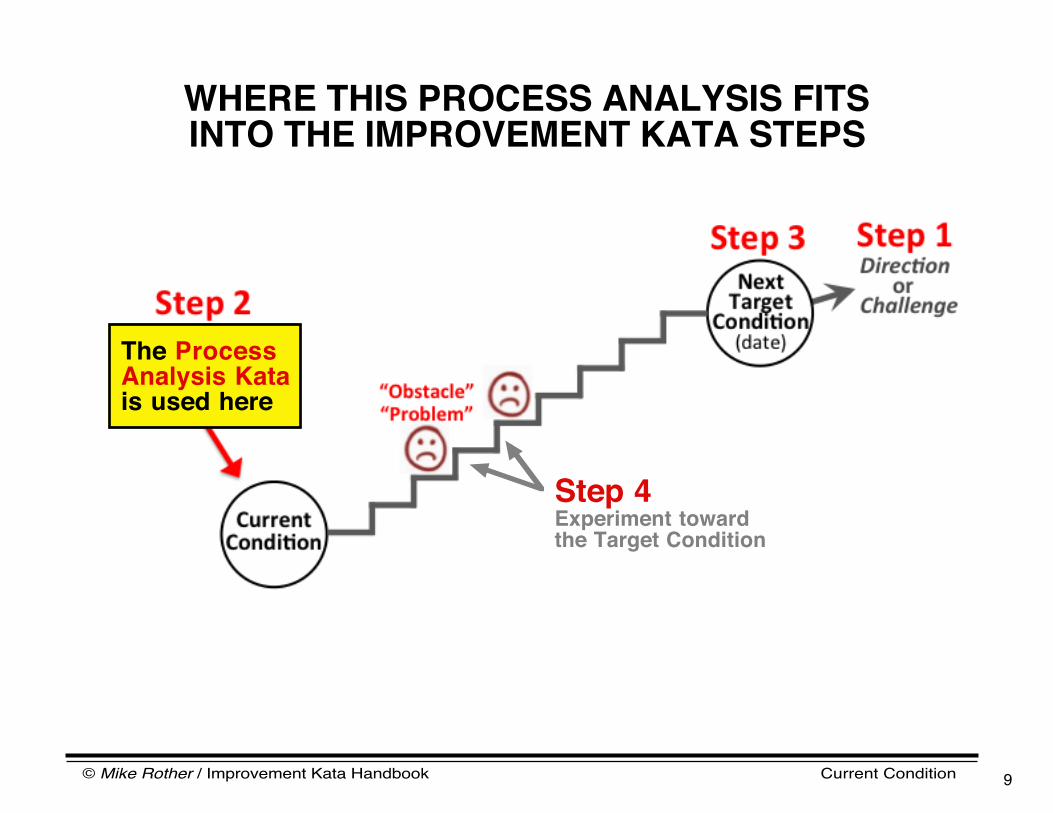
WHERE THIS PROCESS ANALYSIS FITSINTO THE IMPROVEMENT KATA STEPS
The ProcessAnalysis Katais used here
Step 4Experiment toward the Target Condition

© Mike Rother / Improvement Kata Handbook Current Condition 10
We canʼt just use my impressions or ask people what they think. We need to observe and measure!
REALITY IS NOT OBVIOUSWe canʼt depend on our brainʼs intuition for an accurate assessment of the current situation, no matter how well
we think we already know the focus process.
It would be unscientific to start discussing goals and steps to take based on our impressions and intuitions, before objectively analyzing the current operating patterns of the focus process.Practicing the pattern of the process analysis kata helps you develop an open-minded way of looking. Itʼs a procedure to follow in order to see and understand non-obvious characteristics of a work process.
This is a step toward increasing our comfort in crossing the threshold of knowledge and iteratively discoveringthe path to the next target condition through the grey zone.

© Mike Rother / Improvement Kata Handbook Current Condition 11
Being able to grasp the current condition is a foundational skill. This process analysis Kata is a structured way to observe & analyze a current process condition. Benefits of practicing it are:
• Prevents skipping Step 2 in the Improvement Kata model,i.e., jumping to conclusions based on an insufficient understanding of the actual current condition.
• Makes process analysis teachable and transferrable across your organization.
• Communication and coaching are more effective because you have a fundamental & shared way oflooking at and talking about work processes.
This process-analysis Kata can be adapted to almost any work process. Begin by practicing the steps of process analysis as they are described here. As you become proficient and understand the principles behind this Kata you can evolve it into a process-analysis Kata more specific to your organization and processes... as long as the basic principles remain.
WHY PRACTICE THIS KATA?

© Mike Rother / Improvement Kata Handbook Current Condition 12
THIS PROCESS ANALYSIS IS LINEAR BUT RECURSIVEWhat you learn in one step of the process analysis may
lead you to go back and adjust a prior step. Thatʼs normal.
THE STEPS
WEʼLL GO THROUGH
© Mike Rother / Improvement Kata Handbook Current Condition 13
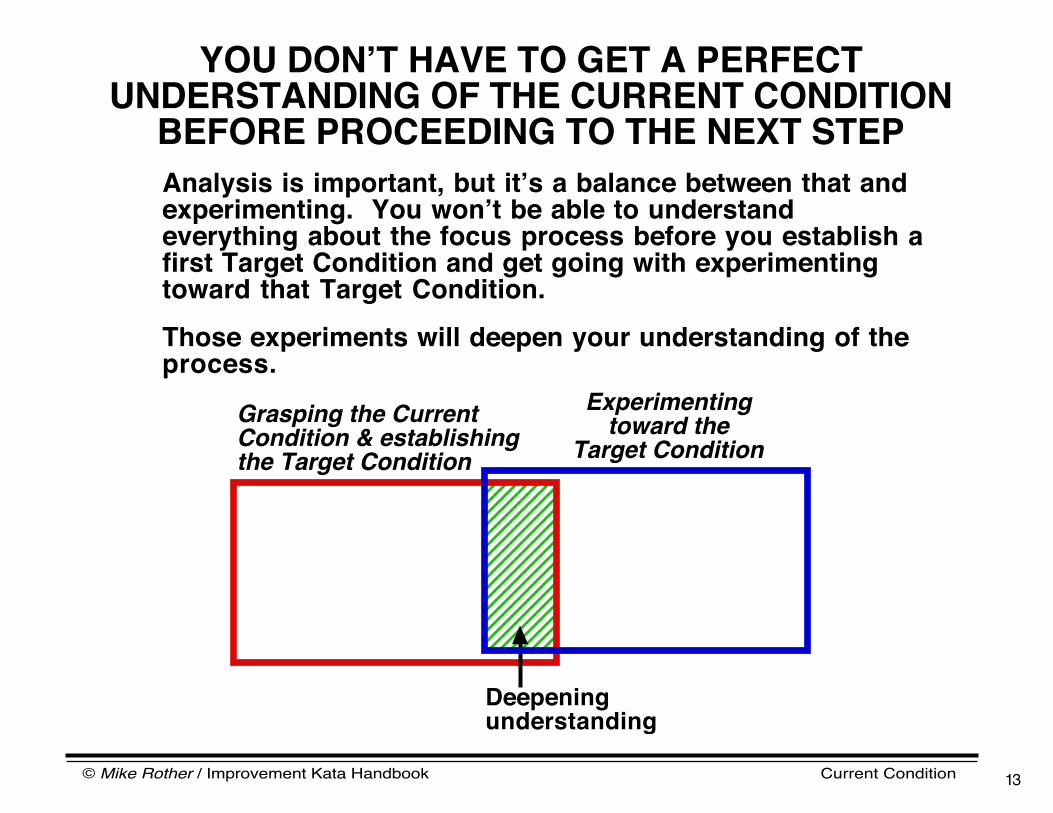
YOU DONʼT HAVE TO GET A PERFECT UNDERSTANDING OF THE CURRENT CONDITION
BEFORE PROCEEDING TO THE NEXT STEPAnalysis is important, but itʼs a balance between that and experimenting. You wonʼt be able to understand everything about the focus process before you establish a first Target Condition and get going with experimenting toward that Target Condition.Those experiments will deepen your understanding of the process.
Experimenting toward the
Target ConditionGrasping the Current Condition & establishing the Target Condition
Deepening understanding
© Mike Rother / Improvement Kata Handbook Current Condition 14
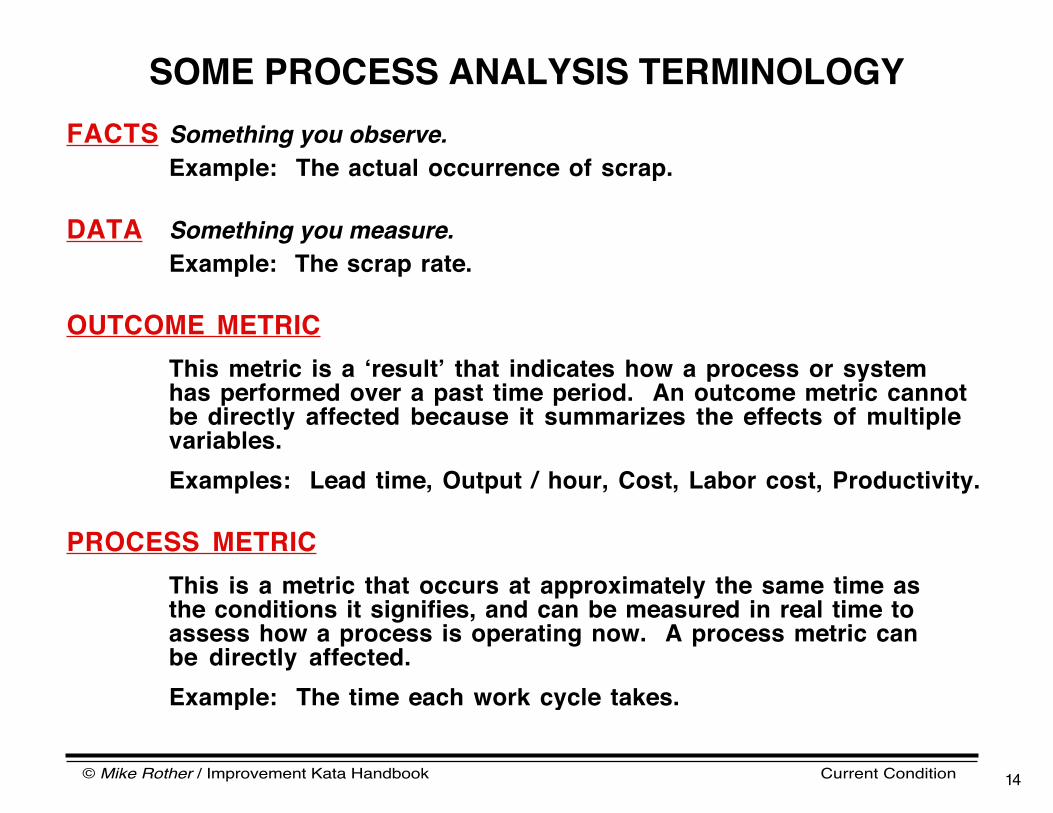
SOME PROCESS ANALYSIS TERMINOLOGYFACTS Something you observe.
Example: The actual occurrence of scrap.
DATA Something you measure.
Example: The scrap rate.
OUTCOME METRICThis metric is a ʻresultʼ that indicates how a process or system has performed over a past time period. An outcome metric cannot be directly affected because it summarizes the effects of multiple variables.Examples: Lead time, Output / hour, Cost, Labor cost, Productivity.
PROCESS METRICThis is a metric that occurs at approximately the same time as the conditions it signifies, and can be measured in real time to assess how a process is operating now. A process metric can be directly affected.Example: The time each work cycle takes.

© Mike Rother / Improvement Kata Handbook Current Condition 15
GUIDELINES FOR THE COACH :TEACHING PROCESS ANALYSIS
As discussed in the ʻRoles & Structureʼ Chapter, for beginner Learners choose a process that is easy to understand and analyze. The first goal in Step 2 of the IK is to internalize the routine of process analysis, not to tackle the most important process to improve. Once the Learner has developed competency they can apply this process analysis to more difficult processes.
Have the Learner follow the process analysis steps as closely as possible. Donʼt let the Learner jump ahead, because youʼre trying to imprint a pattern. Competent-level learners can vary the process analysis and its sequence according to the situation at hand.
As the Learner moves through the analysis steps in order s/he will often have to go back to review or recalculate an earlier step based on what they are learning. Thatʼs normal. You canʼt get each step right the first time.
Break the practicing into ʻchunksʼ:- Have the Learner complete one process analysis step at a time.- After each step have the Learner summarize on a flipchart & present to you.- The Learner should present information in the order shown in the
steps table on page 11. Each time the Learner presents, have him or her begin the presentation at Step 1.
The Coach must go along during the process analysis, and should also analyze the process at the same time, not in advance. This way the Coach will be in a good position to evaluate and correct what the beginner Learner is doing.
At the beginning a process analysis can easily take a couple of days.As one gains experience you can often do it in a few hours. For practice it can be fun to set an increasingly shorter time to do a process analysis. Pick another process and do it again. Can you get to two hours?
q
q
q
q
q
q

© Mike Rother / Improvement Kata Handbook Current Condition 16
PROCESS ANALYSIS WITH OFFICEAND SERVICE PROCESSES
Find the pattern of working
Pattern is a good word to use when you seek to understand any process.
In office and service processes the work content often varies, takes a long time and/or is even invisible. However, there is a "pattern" in nearly all work that humans do. Even if the work content varies, the people carrying out the task will have certain ways (repetitive patterns) of doing it. Thatʼs a key part of what youʼre trying to see and measure in process analysis.
It can takes longer to observe, track and measure the current work pattern in office and service processes. But once you see and can measure the basic pattern of working youʼll then be able to define the next target pattern to aim for.

© Mike Rother / Improvement Kata Handbook Current Condition 17
Start by creating a run chart of output-cycles for the machine, with a target line that indicates the output cycles you expect from this automated processʼs operation.
WHAT ABOUT HIGHLY AUTOMATED PROCESSES?The question of how to handle highly-automated processes comes up regularly. Here's an answer...
You may think you should then apply the steps of the Improvement Kata directly to the automated machine itself, but even in highly-automated processes, the process is still dependent on things that people do. The focus in applying the steps of the Improvement Kata to an automated process is often on the human-centered processes around the machine that influence how the machine operates. These are processes such as:
- Machine tending (incl. monitoring, stocking, loading, adjusting, etc.)- Changeovers- Logistics (moving material in and out)- Reacting to problems- Maintenance
Apply the steps of the IK to these work processes as they become obstacles to the target machine output cycles, with one storyboard per process:
• Carefully study the work process to sketch, measure and understand its current pattern of operating using this chapterʼs process analysis.
• Based on that understanding of the current operating pattern, define the next desired operating pattern (target condition) for the process.
• Then experiment iteratively to move toward that target condition.
© Mike Rother / Improvement Kata Handbook Current Condition 18
Practice Routines

© Mike Rother / Improvement Kata Handbook Current Condition 19
COURTESY AT THE PROCESS• Approach the process via the Manager• Introduce yourself to the people there• Explain what you are doing• Do not interrupt people while theyʼre working• Explain that you are watching the work,
not the person• Show any notes youʼve taken• Say thank you before you leave• Hands out of pockets, because weʼre all
working here
EQUIPMENT YOUʼLL NEED• Stopwatch that measures in seconds• Graph paper• Pencil, eraser & ruler• Calculator
© Mike Rother / Improvement Kata Handbook Current Condition 20
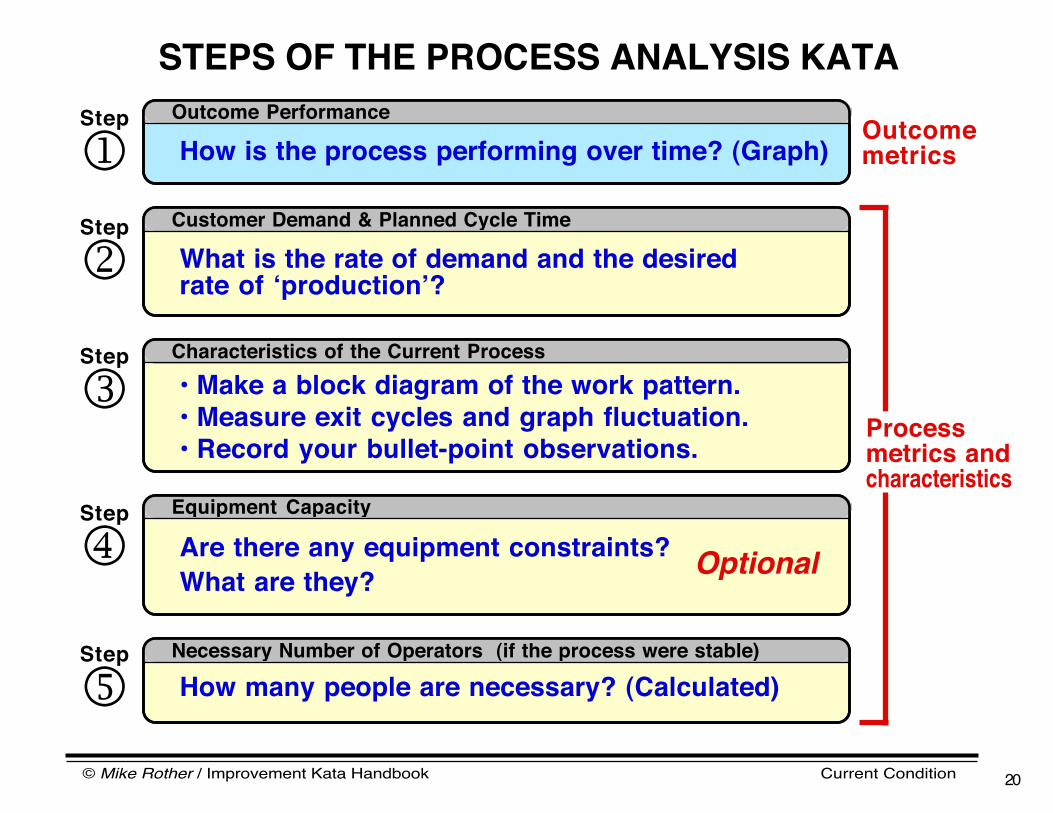
STEPS OF THE PROCESS ANALYSIS KATA
Necessary Number of Operators (if the process were stable)
1
3
4
5
Step Outcome Performance
Equipment Capacity
Characteristics of the Current Process
2Step
Step
Step
Step
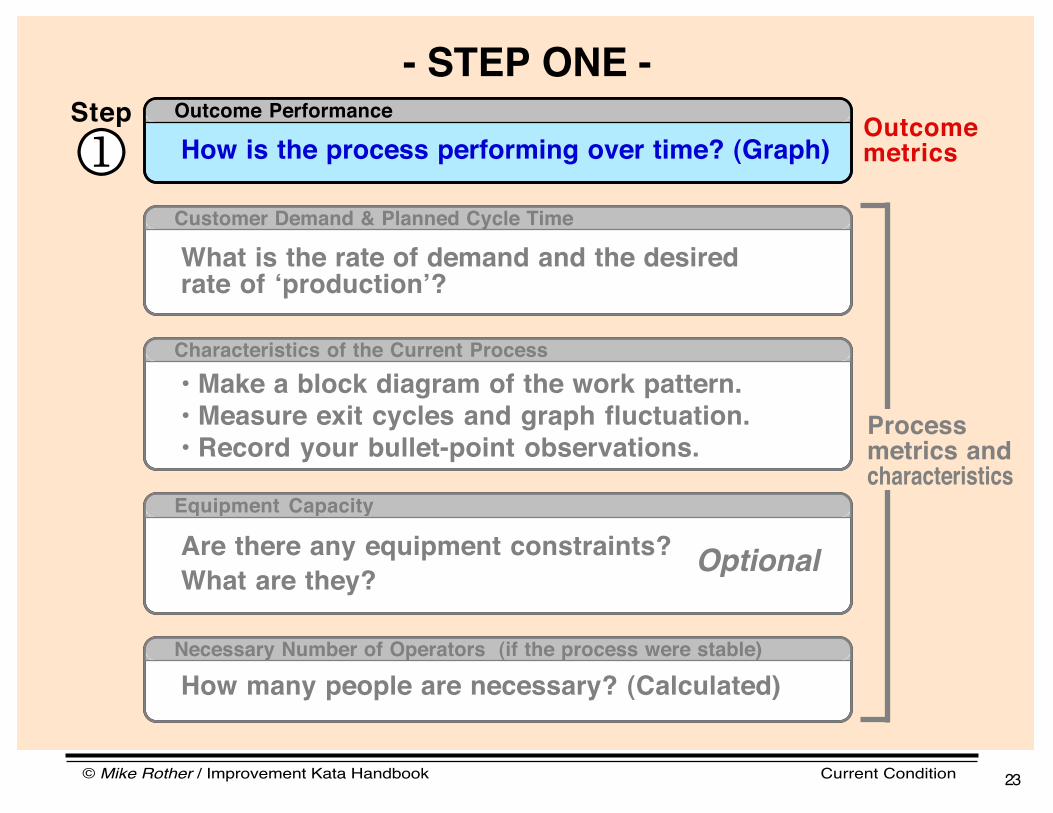
• Make a block diagram of the work pattern.• Measure exit cycles and graph fluctuation.• Record your bullet-point observations.
Are there any equipment constraints?What are they?
How many people are necessary? (Calculated)
How is the process performing over time? (Graph)
What is the rate of demand and the desired rate of ʻproductionʼ?
Customer Demand & Planned Cycle Time
Process metrics and characteristics
Outcomemetrics
Optional
© Mike Rother / Improvement Kata Handbook Current Condition 21
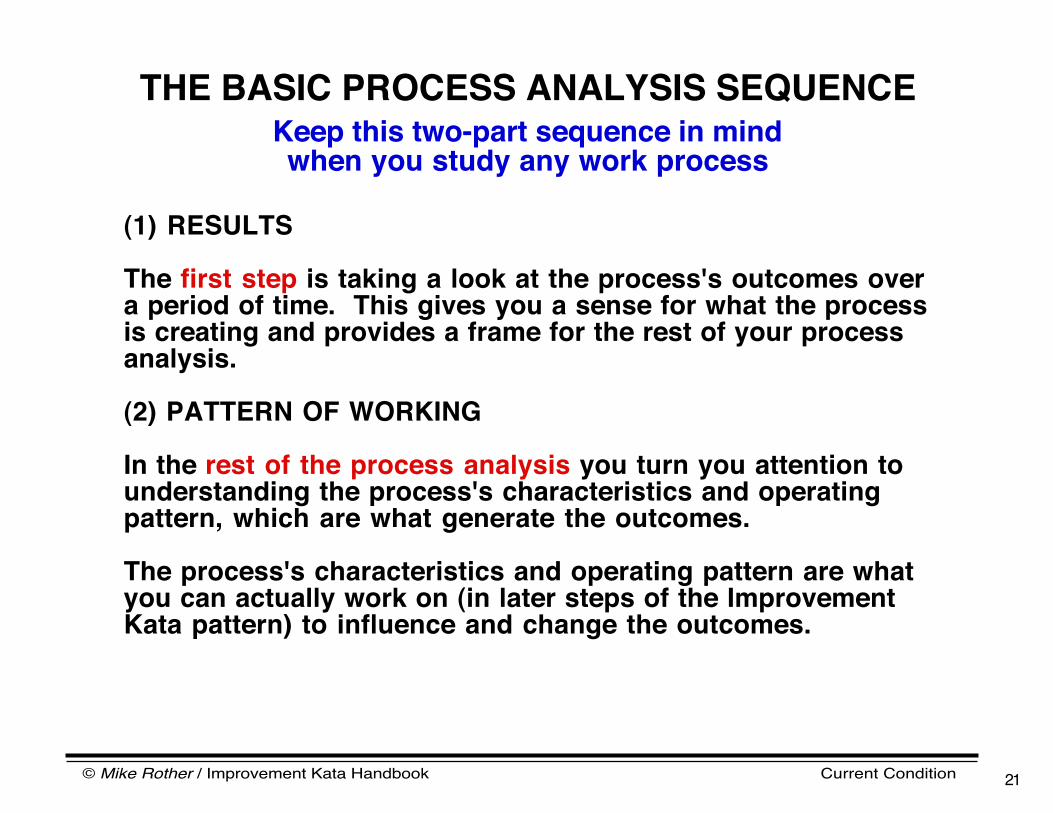
THE BASIC PROCESS ANALYSIS SEQUENCEKeep this two-part sequence in mindwhen you study any work process
(1) RESULTS
The first step is taking a look at the process's outcomes over a period of time. This gives you a sense for what the process is creating and provides a frame for the rest of your process analysis.
(2) PATTERN OF WORKING
In the rest of the process analysis you turn you attention to understanding the process's characteristics and operating pattern, which are what generate the outcomes.
The process's characteristics and operating pattern are what you can actually work on (in later steps of the Improvement Kata pattern) to influence and change the outcomes.
© Mike Rother / Improvement Kata Handbook Current Condition 22
The Process Analysis KataStep-by-Step
5Steps
© Mike Rother / Improvement Kata Handbook Current Condition 23
1Step
Necessary Number of Operators (if the process were stable)
How is the process performing over time? (Graph)
What is the rate of demand and the desired rate of ʻproductionʼ?
Customer Demand & Planned Cycle Time
Process metrics and characteristics
Outcomemetrics
Optional
Characteristics of the Current Process
Equipment Capacity
Outcome Performance
• Make a block diagram of the work pattern.• Measure exit cycles and graph fluctuation.• Record your bullet-point observations.
Are there any equipment constraints?What are they?
How many people are necessary? (Calculated)
- STEP ONE -

© Mike Rother / Improvement Kata Handbook Current Condition 24
PROCESS OUTCOME PERFORMANCEHow is the process performing over time?
Output per Shift Overtime
Once the focus process has been selected, begin your process analysis by looking at data on how the process has been delivering/performing over time. Examples of such outcome metrics include quantity, productivity, quality, cost, etc.It may be possible for you to measure and collect this data, and you should set up a system to do so, but youʼll probably also be relying on historical data. Keep in mind that you cannot tell how accurate historical data is.Be sure to make a graph of the outcome-metric data that you decide to focus on, so you have a visual representation of the focus processʼs current performance. For example...

© Mike Rother / Improvement Kata Handbook Current Condition 25
What is the rate of demand and the desired rate of ʻproductionʼ?
Customer Demand & Planned Cycle Time
2Step
Necessary Number of Operators (if the process were stable)
Process metrics and characteristics
Outcomemetrics
Optional
Characteristics of the Current Process
Equipment Capacity
• Make a block diagram of the work pattern.• Measure exit cycles and graph fluctuation.• Record your bullet-point observations.
Are there any equipment constraints?What are they?
How many people are necessary? (Calculated)
How is the process performing over time? (Graph)Outcome Performance
- STEP TWO -

© Mike Rother / Improvement Kata Handbook Current Condition 26
CUSTOMER DEMAND & PLANNED CYCLE TIMEWhat is the rate of demand and the desired rate of ʻproductionʼ?
In this step of process analysis youʼre trying to figure out (A) the rate of customer demand and (B) the target pace at which the focus process should be cycling. This provides a frame for the rest of the process analysis. Key questions are:
What is the ʻproductʼ?How often does the customer want one?How often do we want to produce one?
Remember, you can come back and fine-tune these numbers as you move forward and learn more.
© Mike Rother / Improvement Kata Handbook Current Condition 27
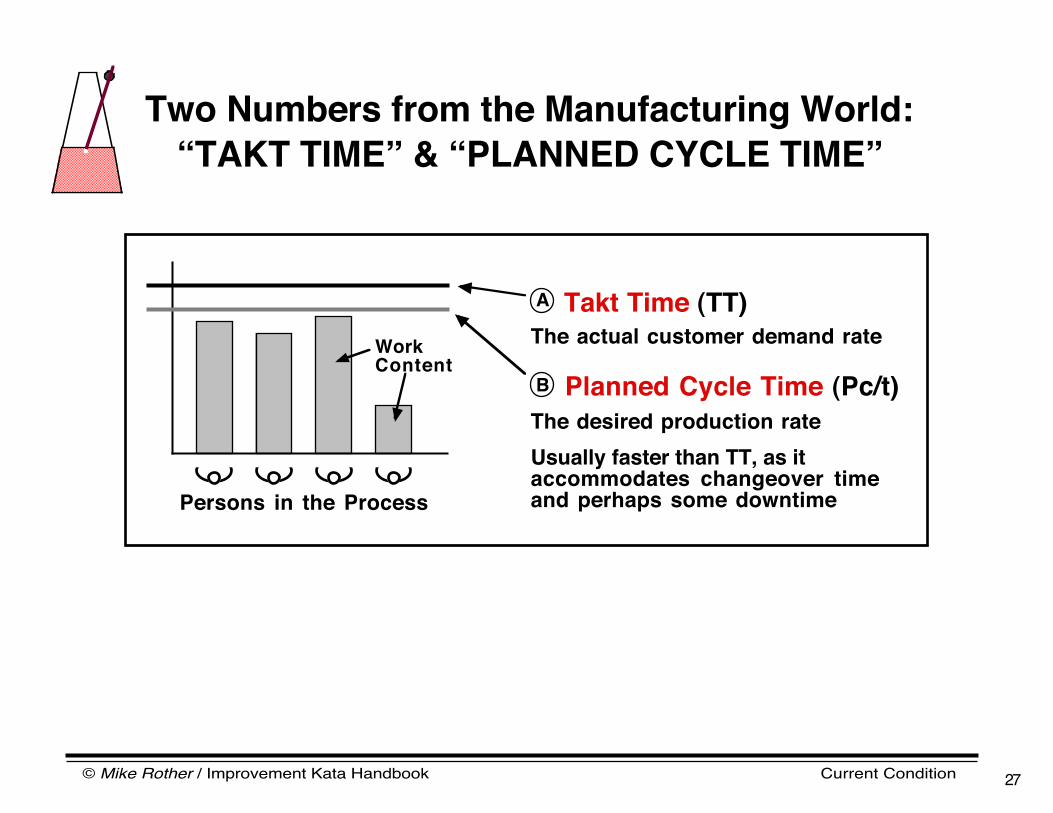
Planned Cycle Time (Pc/t)The desired production rateUsually faster than TT, as it accommodates changeover timeand perhaps some downtime
Takt Time (TT)The actual customer demand rateA
B
Two Numbers from the Manufacturing World:
“TAKT TIME” & “PLANNED CYCLE TIME”
Persons in the Process
WorkContent
© Mike Rother / Improvement Kata Handbook Current Condition 28
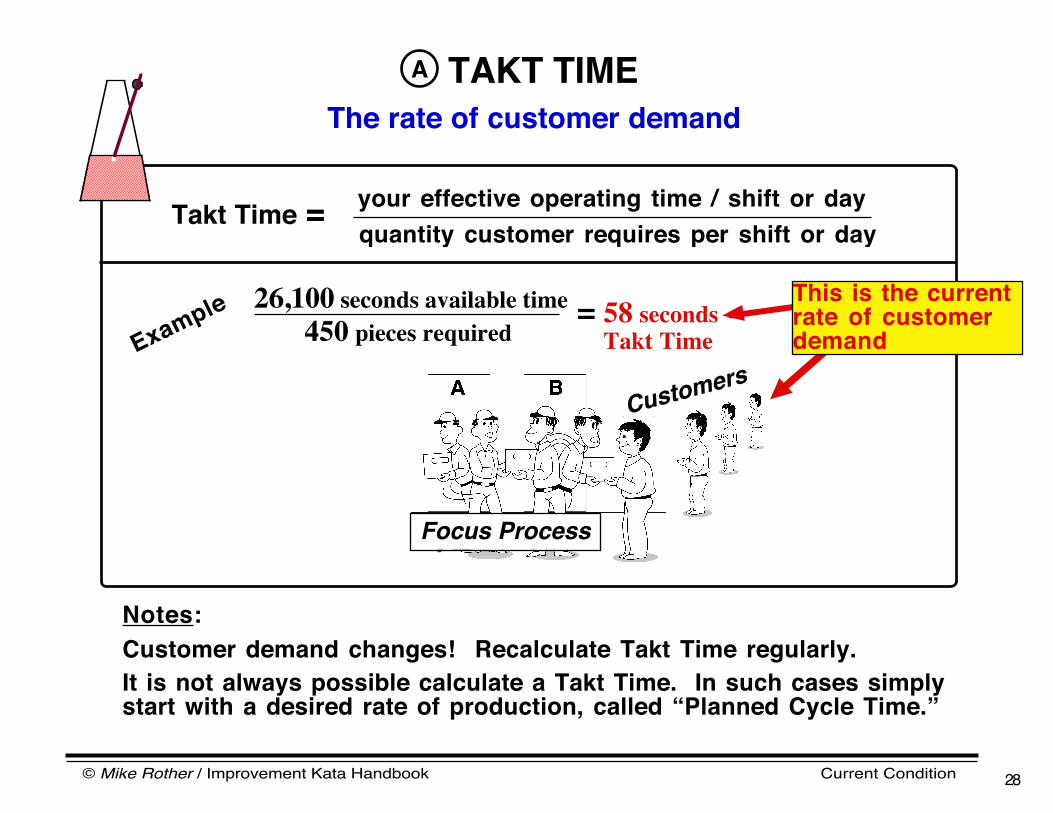
TAKT TIMEThe rate of customer demand
A
your effective operating time / shift or dayquantity customer requires per shift or day
Takt Time =
26,100 seconds available time450 pieces required
= 58 seconds Takt TimeExample
Notes:
Customer demand changes! Recalculate Takt Time regularly.
It is not always possible calculate a Takt Time. In such cases simply start with a desired rate of production, called “Planned Cycle Time.”
This is the current rate of customer demand
ASSEMBLY
Customers
Focus Process
© Mike Rother / Improvement Kata Handbook Current Condition 29
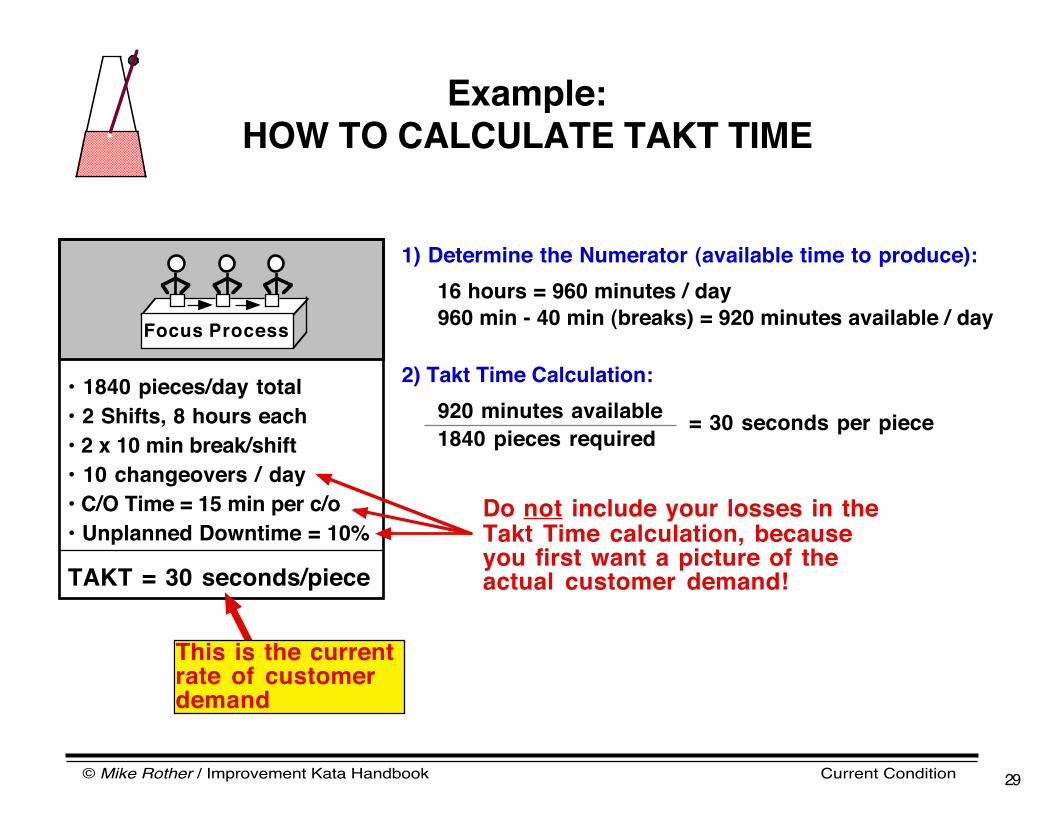
Example:
HOW TO CALCULATE TAKT TIME
• 1840 pieces/day total• 2 Shifts, 8 hours each• 2 x 10 min break/shift• 10 changeovers / day• C/O Time = 15 min per c/o• Unplanned Downtime = 10%
TAKT = 30 seconds/piece
1) Determine the Numerator (available time to produce):
2) Takt Time Calculation:
16 hours = 960 minutes / day
960 min - 40 min (breaks) = 920 minutes available / day
920 minutes available1840 pieces required
= 30 seconds per piece
Do not include your losses in the Takt Time calculation, because you first want a picture of the actual customer demand!
This is the current rate of customer demand
Focus Process
© Mike Rother / Improvement Kata Handbook Current Condition 30
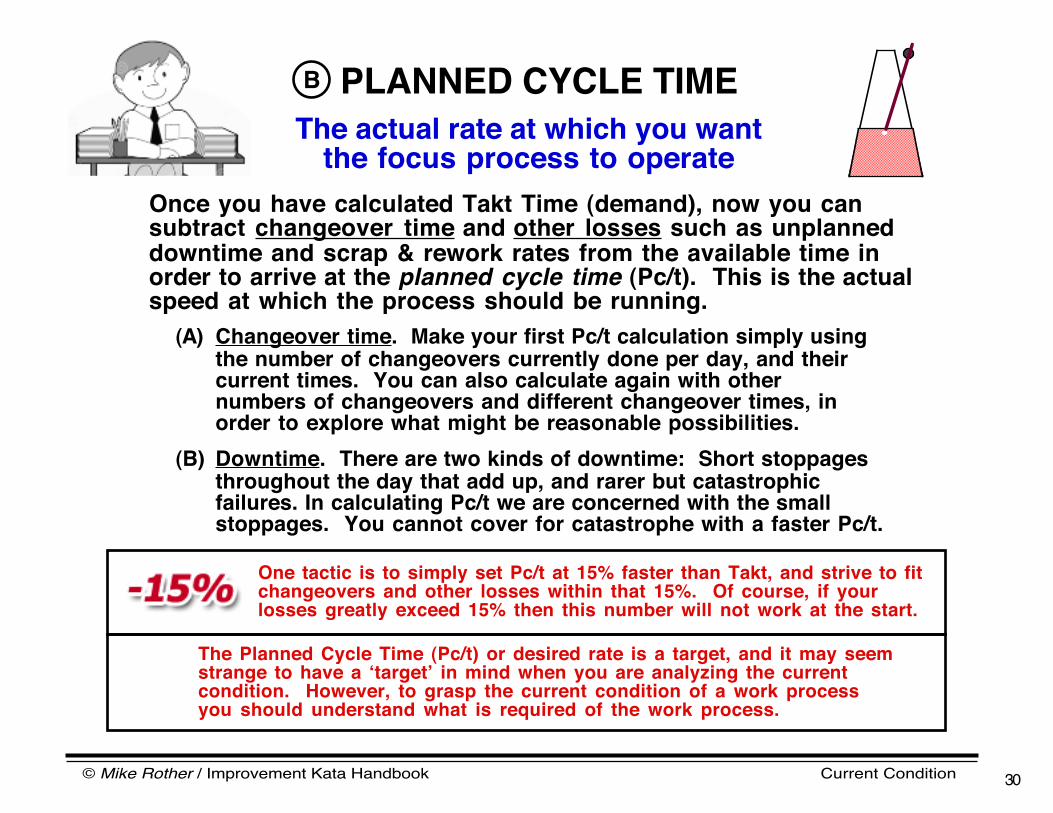
Once you have calculated Takt Time (demand), now you can subtract changeover time and other losses such as unplanned downtime and scrap & rework rates from the available time in order to arrive at the planned cycle time (Pc/t). This is the actual speed at which the process should be running.
PLANNED CYCLE TIMEThe actual rate at which you want
the focus process to operate
B
(A) Changeover time. Make your first Pc/t calculation simply using the number of changeovers currently done per day, and their current times. You can also calculate again with other numbers of changeovers and different changeover times, in order to explore what might be reasonable possibilities.
(B) Downtime. There are two kinds of downtime: Short stoppages throughout the day that add up, and rarer but catastrophic failures. In calculating Pc/t we are concerned with the small stoppages. You cannot cover for catastrophe with a faster Pc/t.
One tactic is to simply set Pc/t at 15% faster than Takt, and strive to fit changeovers and other losses within that 15%. Of course, if your losses greatly exceed 15% then this number will not work at the start.
The Planned Cycle Time (Pc/t) or desired rate is a target, and it may seem strange to have a ʻtargetʼ in mind when you are analyzing the current condition. However, to grasp the current condition of a work process you should understand what is required of the work process.

© Mike Rother / Improvement Kata Handbook Current Condition 31
- STEP THREE -
• Make a block diagram of the work pattern.• Measure exit cycles and graph fluctuation.• Record your bullet-point observations.
Characteristics of the Current ProcessStep
3
Necessary Number of Operators (if the process were stable)
What is the rate of demand and the desired rate of ʻproductionʼ?
Customer Demand & Planned Cycle Time
Process metrics and characteristics
Outcomemetrics
Optional
Equipment Capacity
Are there any equipment constraints?What are they?
How many people are necessary? (Calculated)
How is the process performing over time? (Graph)Outcome Performance
© Mike Rother / Improvement Kata Handbook Current Condition 32
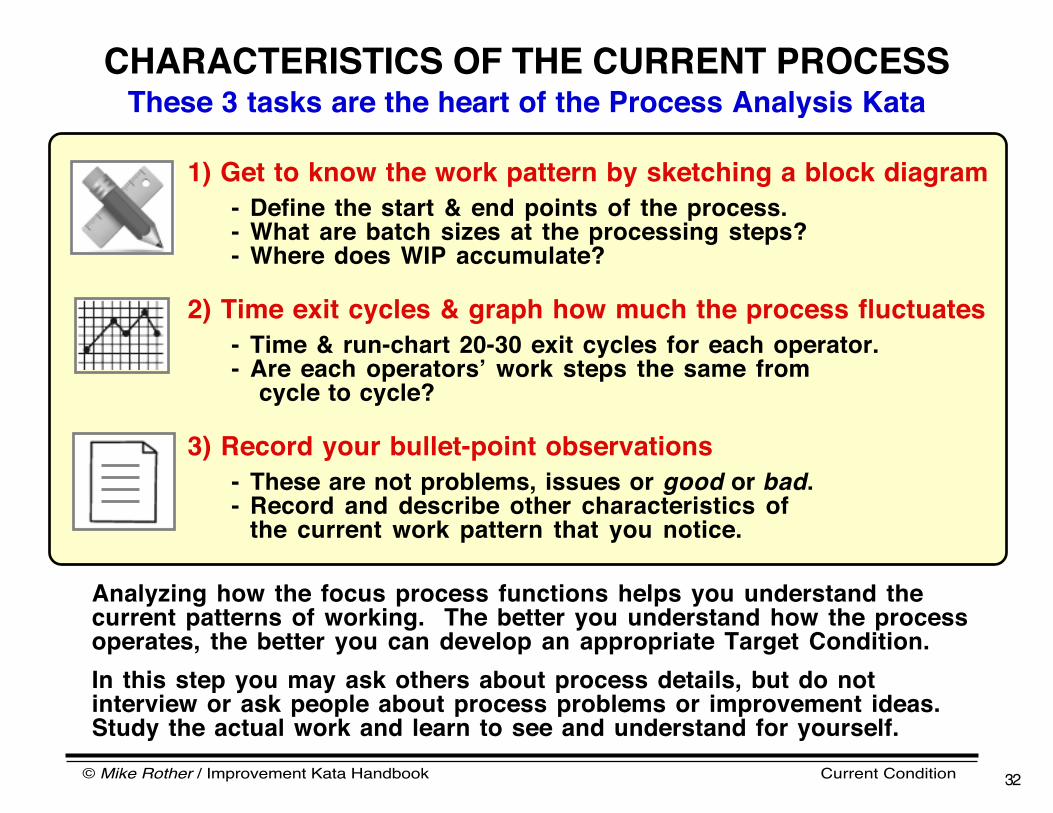
1) Get to know the work pattern by sketching a block diagram- Define the start & end points of the process.- What are batch sizes at the processing steps?- Where does WIP accumulate?
2) Time exit cycles & graph how much the process fluctuates- Time & run-chart 20-30 exit cycles for each operator.- Are each operatorsʼ work steps the same from
cycle to cycle?
3) Record your bullet-point observations- These are not problems, issues or good or bad.- Record and describe other characteristics of
the current work pattern that you notice.
Analyzing how the focus process functions helps you understand the current patterns of working. The better you understand how the process operates, the better you can develop an appropriate Target Condition.In this step you may ask others about process details, but do not interview or ask people about process problems or improvement ideas. Study the actual work and learn to see and understand for yourself.
CHARACTERISTICS OF THE CURRENT PROCESSThese 3 tasks are the heart of the Process Analysis Kata
© Mike Rother / Improvement Kata Handbook Current Condition 33
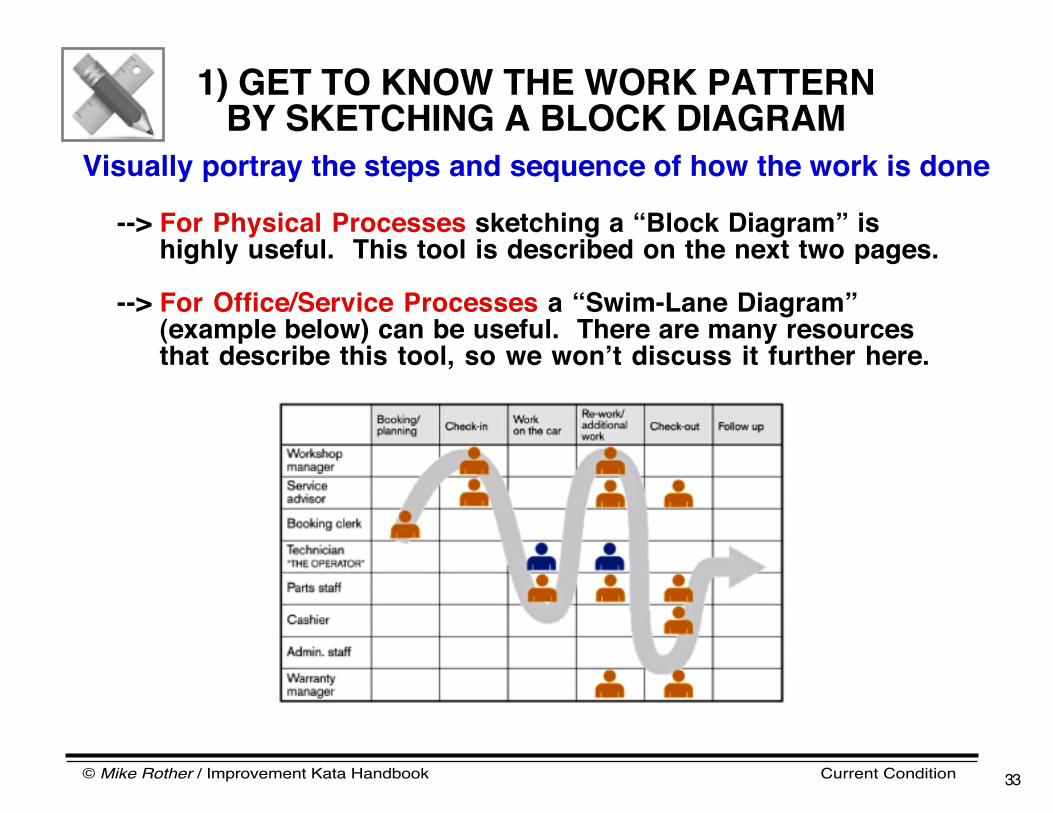
1) GET TO KNOW THE WORK PATTERNBY SKETCHING A BLOCK DIAGRAM
Visually portray the steps and sequence of how the work is done
--> For Physical Processes sketching a “Block Diagram” is highly useful. This tool is described on the next two pages.
--> For Office/Service Processes a “Swim-Lane Diagram”(example below) can be useful. There are many resources that describe this tool, so we wonʼt discuss it further here.
© Mike Rother / Improvement Kata Handbook Current Condition 34
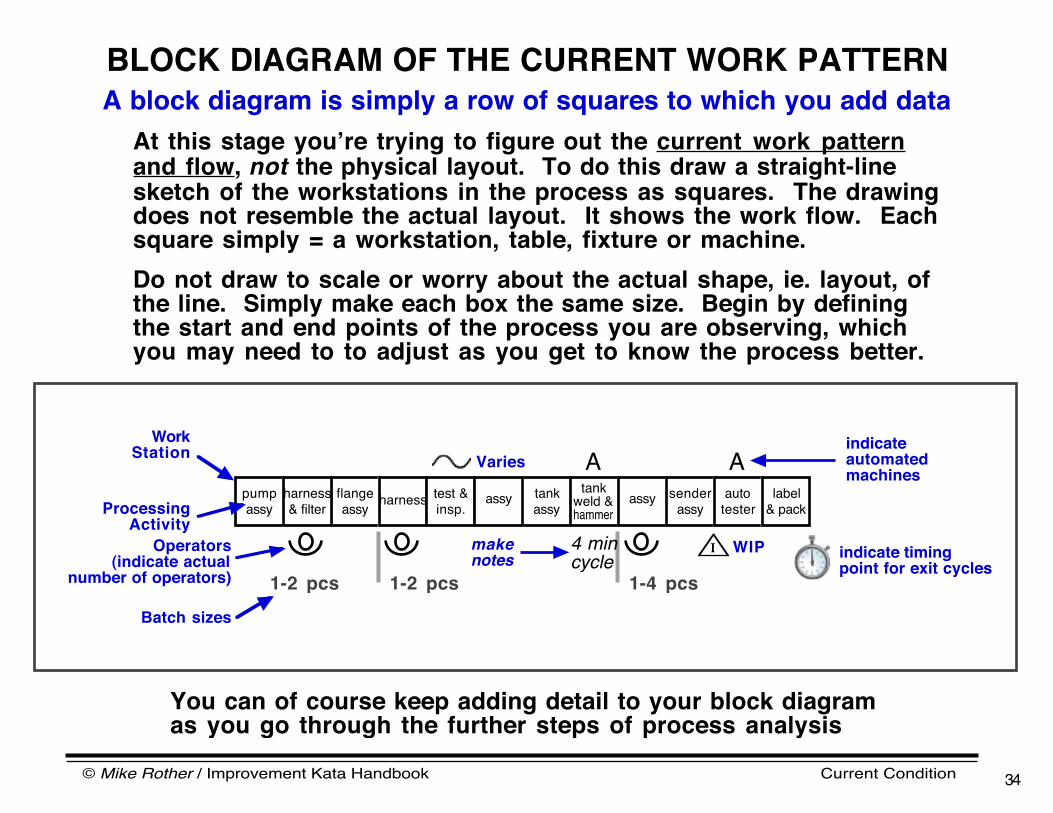
BLOCK DIAGRAM OF THE CURRENT WORK PATTERNA block diagram is simply a row of squares to which you add data
At this stage youʼre trying to figure out the current work pattern and flow, not the physical layout. To do this draw a straight-line sketch of the workstations in the process as squares. The drawing does not resemble the actual layout. It shows the work flow. Each square simply = a workstation, table, fixture or machine.Do not draw to scale or worry about the actual shape, ie. layout, of the line. Simply make each box the same size. Begin by defining the start and end points of the process you are observing, which you may need to to adjust as you get to know the process better.
You can of course keep adding detail to your block diagram as you go through the further steps of process analysis
flangeassy harnesspump
assyharness& filter
tankassy
tankweld &hammer
assy assy senderassy
label& pack
auto tester
AAindicate automated machines
makenotes
WorkStation
ProcessingActivity
test &insp.
I WIP
Varies
Operators(indicate actual
number of operators)indicate timing point for exit cycles
4 mincycle
Batch sizes
1-2 pcs 1-2 pcs 1-4 pcs

© Mike Rother / Improvement Kata Handbook Current Condition 35
THE BLOCK DIAGRAM GETS MESSYThatʼs normal
NOTE that the block diagram is a process-level diagram, not a value-stream map

© Mike Rother / Improvement Kata Handbook Current Condition 36
2) MEASURE EXIT CYCLES AND GRAPHHOW MUCH THE PROCESS FLUCTUATES
Youʼll be making run charts like this one:
Amount of fluctuationTakt
Pc/t
Operator Cycles (time from one piece to next piece)
1 0
2 0
3 0
4 0
5 0
•
••
••
•
• ••
•
•• •
• •
• ••
• •
2 2
Understanding the amount of fluctuation in a process is important because it can affect so many other aspects of the process
Target(Pc/t)
© Mike Rother / Improvement Kata Handbook Current Condition 37
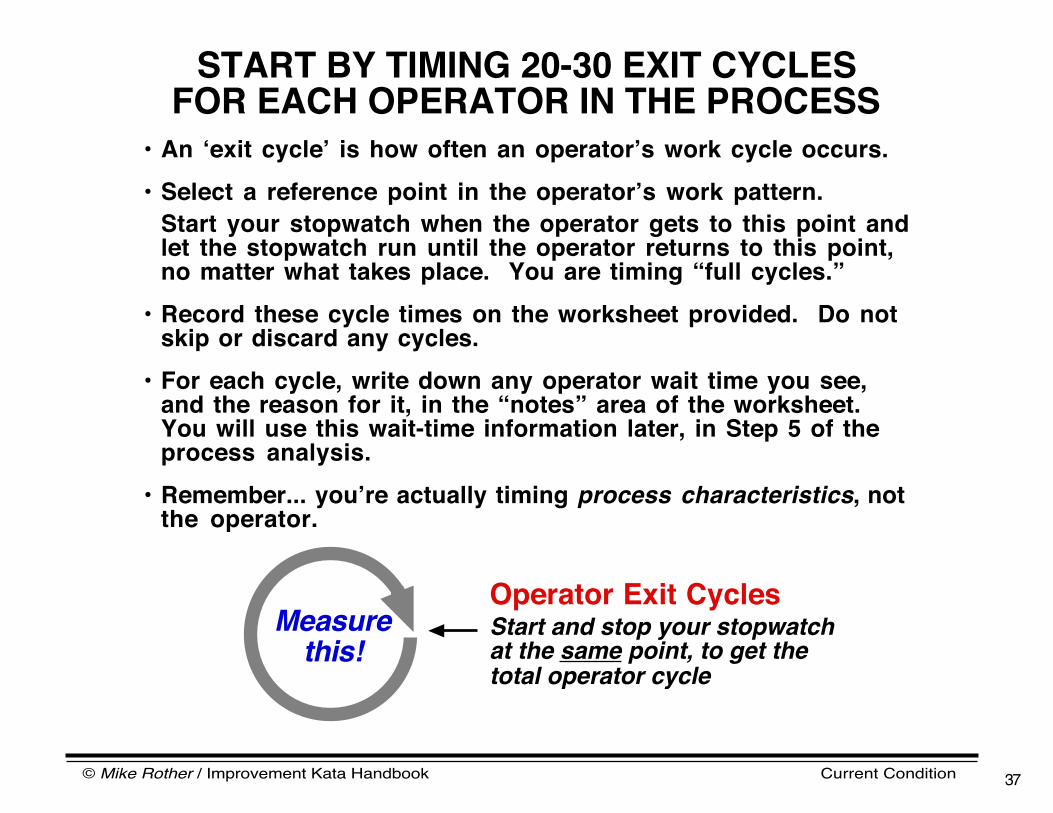
• An ʻexit cycleʼ is how often an operatorʼs work cycle occurs.• Select a reference point in the operatorʼs work pattern.
Start your stopwatch when the operator gets to this point and let the stopwatch run until the operator returns to this point,no matter what takes place. You are timing “full cycles.”
• Record these cycle times on the worksheet provided. Do not skip or discard any cycles.
• For each cycle, write down any operator wait time you see, and the reason for it, in the “notes” area of the worksheet. You will use this wait-time information later, in Step 5 of the process analysis.
• Remember... youʼre actually timing process characteristics, not the operator.
Operator Exit CyclesStart and stop your stopwatch at the same point, to get the total operator cycle
Measure this!
START BY TIMING 20-30 EXIT CYCLESFOR EACH OPERATOR IN THE PROCESS
© Mike Rother / Improvement Kata Handbook Current Condition 38
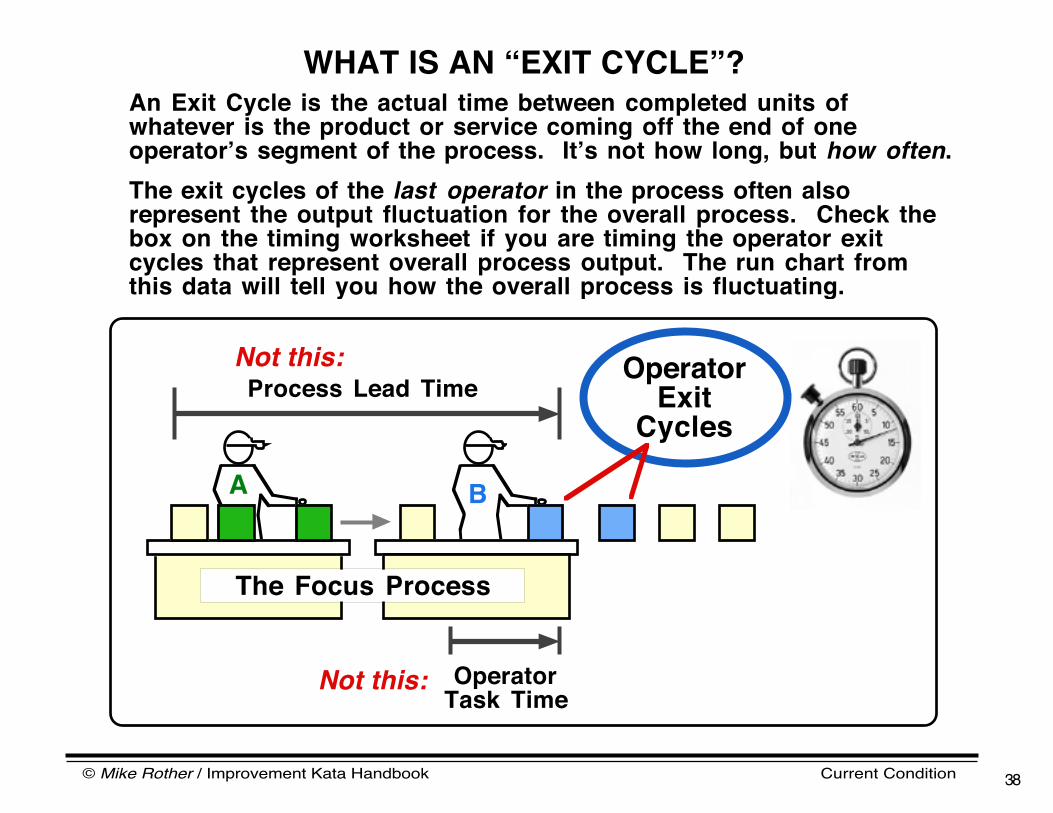
A B
Process Lead Time
Operator Task Time
OperatorExit
Cycles
WHAT IS AN “EXIT CYCLE”?
Not this:
An Exit Cycle is the actual time between completed units of whatever is the product or service coming off the end of one operatorʼs segment of the process. Itʼs not how long, but how often.The exit cycles of the last operator in the process often also represent the output fluctuation for the overall process. Check the box on the timing worksheet if you are timing the operator exit cycles that represent overall process output. The run chart from this data will tell you how the overall process is fluctuating.
Not this:
The Focus Process

© Mike Rother / Improvement Kata Handbook Current Condition 39
Note wait times
here
Observed Times(Data)
Observations about the current operating pattern(Facts)
12345678910111213141516171819202122232425
TIMING WORKSHEET ProcessDate
MetricOperator
Check box if this is process output
Cycle

© Mike Rother / Improvement Kata Handbook Current Condition 40
DRAW A RUN CHART OF THE DATA POINTS,ONE RUN CHART FOR EACH OPERATOR
Run charts help you see and understand process variation
A run chart is a graph that illustrates process variation over time. Run charts are an excellent way to gather and communicate current-state information.
LowestRepeatableTime
Takt
Operator Exit Cycles
1 0
2 0
4 0
5 0
•
••
••
•
• ••
•
•• •
• •
• ••
• •
Pc/t
Range
Target
© Mike Rother / Improvement Kata Handbook Current Condition 41
1 0
2 0
4 0
5 0
Pc/t 22 ••
••
••
• • ••
•• •
• •• •
• • •Takt 30
1 0
2 0
4 0
5 0
Pc/t 22Takt 30
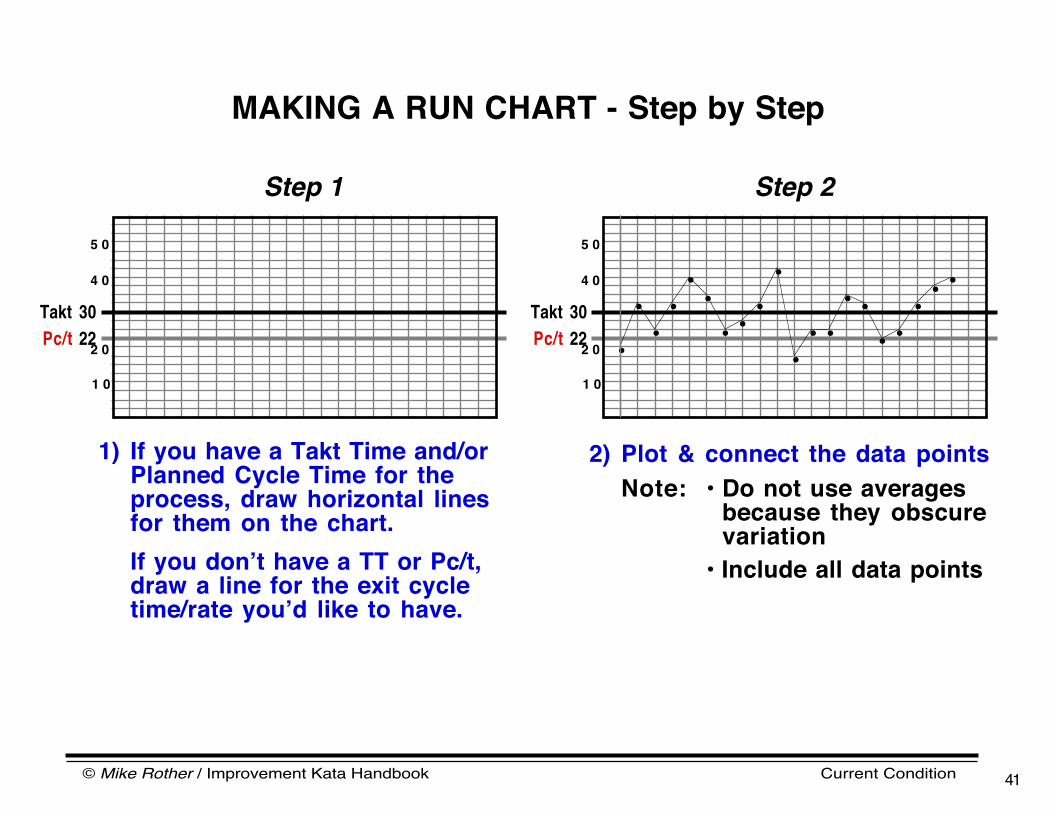
2) Plot & connect the data pointsNote: • Do not use averages
because they obscure variation
• Include all data points
MAKING A RUN CHART - Step by Step
Step 1 Step 2
1) If you have a Takt Time and/orPlanned Cycle Time for theprocess, draw horizontal linesfor them on the chart.If you donʼt have a TT or Pc/t,draw a line for the exit cycletime/rate youʼd like to have.

© Mike Rother / Improvement Kata Handbook Current Condition 42
3) Find the lowest repeatable time by moving a ruler up from the bottom until data points start repeating.
4) Draw a wide bar to show the lowest repeatable time.Draw a thin bar to show the range of fluctuation (highest point to lowest point).
5) Calculate current +/- % variation%+ Var:(Highest point - Pc/t) ÷ Pc/t%- Var:(Lowest point - Pc/t) ÷ Pc/t
RUN CHART - Step by Step
••
••
• •• • •
•
•• •
• •• •
• • •
••
••
• •• • •
•
•• •
• •• •
• • •
1 0
2 0
4 0
5 0
Pc/t 22Takt 30
Step 3 Steps 4 & 5
1 0
2 0
4 0
5 0
Pc/t 22Takt 30
© Mike Rother / Improvement Kata Handbook Current Condition 43
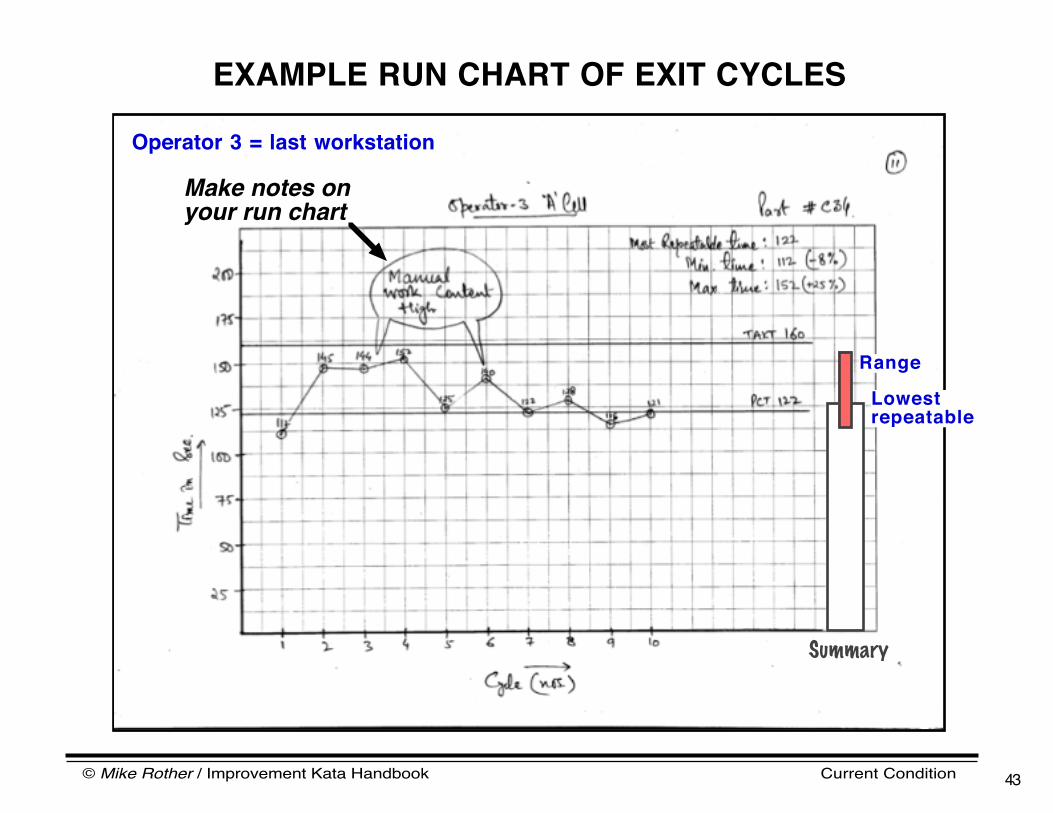
EXAMPLE RUN CHART OF EXIT CYCLES
Operator 3 = last workstation
Lowestrepeatable
Range
Summary
Make notes on your run chart
© Mike Rother / Improvement Kata Handbook Current Condition 44
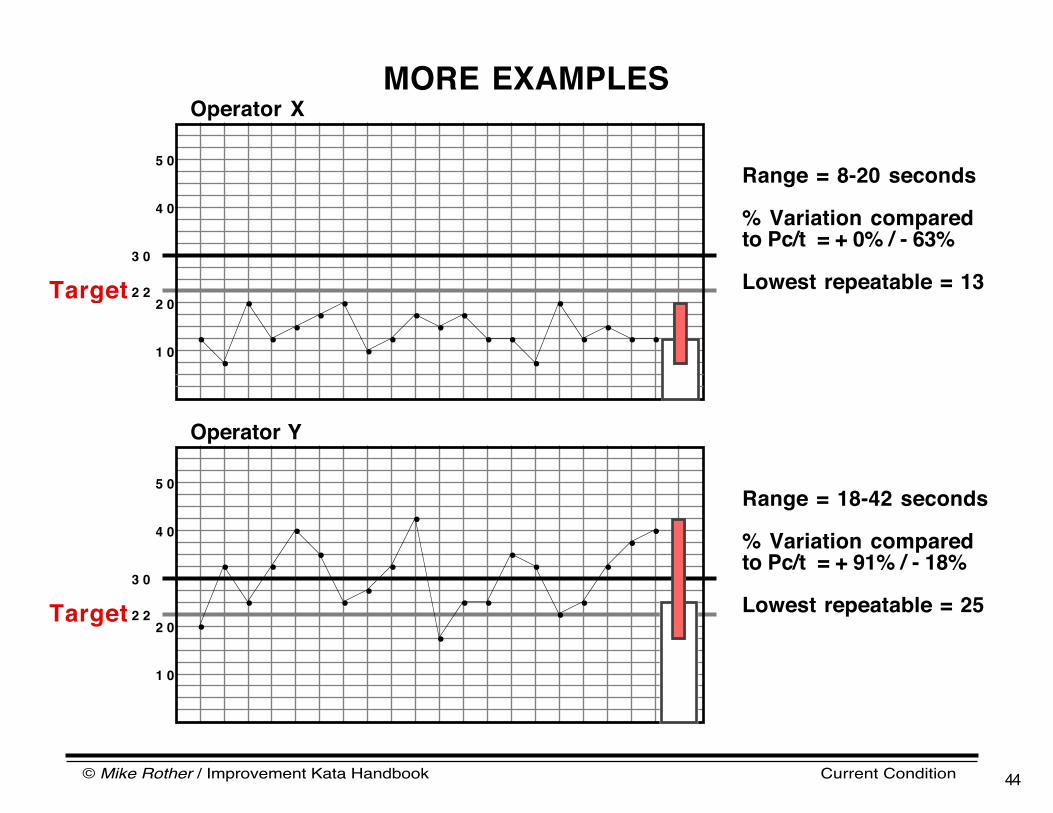
MORE EXAMPLES
1 0
2 0
3 0
4 0
5 0
••
•• • • •
• •• • •
• ••
•• • • •
Operator X
Range = 8-20 seconds
% Variation comparedto Pc/t = + 0% / - 63%
Lowest repeatable = 132 2
Operator Y
Range = 18-42 seconds
% Variation comparedto Pc/t = + 91% / - 18%
Lowest repeatable = 25
1 0
2 0
3 0
4 0
5 0
•
••
••
•
• ••
•
•• •
• •
• ••
• •
2 2
Target
Target

© Mike Rother / Improvement Kata Handbook Current Condition 45
3) RECORD BULLET-POINT OBSERVATIONS
As you draw your block diagram and time exit cycles, what else do you notice about the pattern of how the process is currently being operated?
These are not “issues” or “problems” to address, but simply characteristics of how the focus process currently works. Simply describe what is happening, noting your observations in bullet form.
© Mike Rother / Improvement Kata Handbook Current Condition 46
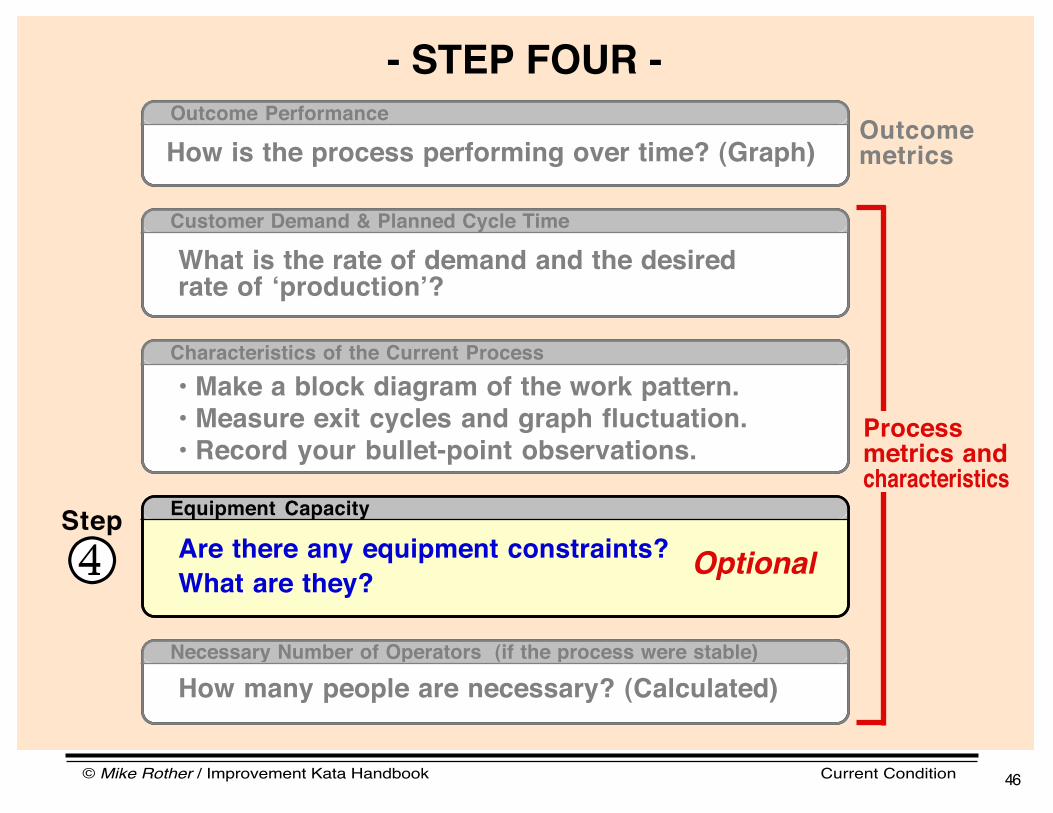
- STEP FOUR -
Are there any equipment constraints?What are they? Optional
Equipment Capacity
4Step
Necessary Number of Operators (if the process were stable)
What is the rate of demand and the desired rate of ʻproductionʼ?
Customer Demand & Planned Cycle Time
Process metrics and characteristics
Outcomemetrics
Characteristics of the Current Process• Make a block diagram of the work pattern.• Measure exit cycles and graph fluctuation.• Record your bullet-point observations.
How many people are necessary? (Calculated)
How is the process performing over time? (Graph)Outcome Performance

© Mike Rother / Improvement Kata Handbook Current Condition 47
Machine Capacity Chart
TT
5
10
20
25
35
10 40 70 90 110
Pc/t90% of Pc/t
loadstart
unload
mach.cycle
15
Machines (Automated equipment)
EQUIPMENT CAPACITY
If this equipment cannot cycle fast enough to meet the planned cycle time then you must address this obstacle!
This is an important check for those processes that use automated equipment. “Automated Equipment” = machines that can run a cycle without requiring constant human oversight or activity.
© Mike Rother / Improvement Kata Handbook Current Condition 48
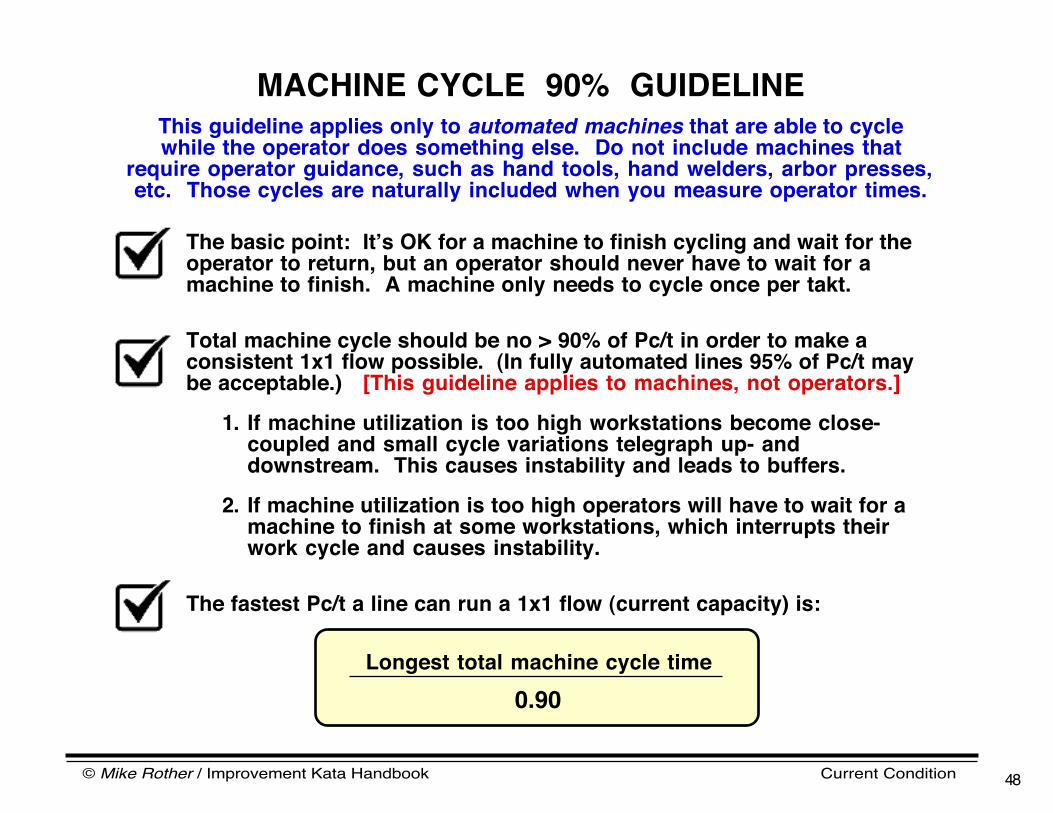
The basic point: Itʼs OK for a machine to finish cycling and wait for the operator to return, but an operator should never have to wait for a machine to finish. A machine only needs to cycle once per takt.
Total machine cycle should be no > 90% of Pc/t in order to make a consistent 1x1 flow possible. (In fully automated lines 95% of Pc/t may be acceptable.) [This guideline applies to machines, not operators.]
1. If machine utilization is too high workstations become close-coupled and small cycle variations telegraph up- and downstream. This causes instability and leads to buffers.
2. If machine utilization is too high operators will have to wait for amachine to finish at some workstations, which interrupts their work cycle and causes instability.
The fastest Pc/t a line can run a 1x1 flow (current capacity) is:
MACHINE CYCLE 90% GUIDELINEThis guideline applies only to automated machines that are able to cyclewhile the operator does something else. Do not include machines that
require operator guidance, such as hand tools, hand welders, arbor presses, etc. Those cycles are naturally included when you measure operator times.
Longest total machine cycle time
0.90

© Mike Rother / Improvement Kata Handbook Current Condition 49
MAKING A MACHINE CAPACITY CHARTStep by Step
Accuracy is important in these charts
Changeovers (+ machine downtime,scrap, rework and other losses if there is no shift gap)
5
10
20
25
15
For fluctuation in equipment cycle
Takt
Pc/t90% of
Pc/t
First draw in lines for the takt time (if calculated), planned cycle time, and 90% of planned cycle time.
1 0 4 0 7 0 9 0 1 1 0
5
10
20
25
15
TT
Pc/t
Next list the automated machines in the process (machines that can cycle without an operator).
90% of Pc/t

© Mike Rother / Improvement Kata Handbook Current Condition 50
MACHINE CAPACITY CHART - Step by Step
Now graph the pure machine time to process one piece, machine start to machine stop
1 0 4 0 7 0 9 0 1 1 0
5
10
20
25
15
TT
Pc/t90% of
Pc/t
Pure machine time is only the time the machine takes from the cycle start to the end of the automatic cycle.
Note: You usually only need to measure a few cycles to obtain this number, since machine cycle times are often relatively consistent.
90% of Pc/t TOTAL
Machine Cycle
1 0 4 0 7 0 9 0 1 1 0
5
10
20
25
15
TT
Pc/t
unloadloadstart unload
loadstart
unloadloadstart
Problem
Finally, add unload and load times to the machine times. This is the time it takes to unload and load the machine, if the machine has to wait during unloading and loading.
The sum of:Pure machine cycle + unload/load time
Equals the:Total machine cycle time (TMc/t)

© Mike Rother / Improvement Kata Handbook Current Condition 51
Machine
1
2
3
4
5
Machine
1
2
3
4
5
Machine
1
2
3
4
5
Machine
1
2
3
4
5
WORKSHEET FOR RECORDING MACHINE TIMESYou donʼt need to time many cycles when timing machine cycles
© Mike Rother / Improvement Kata Handbook Current Condition 52
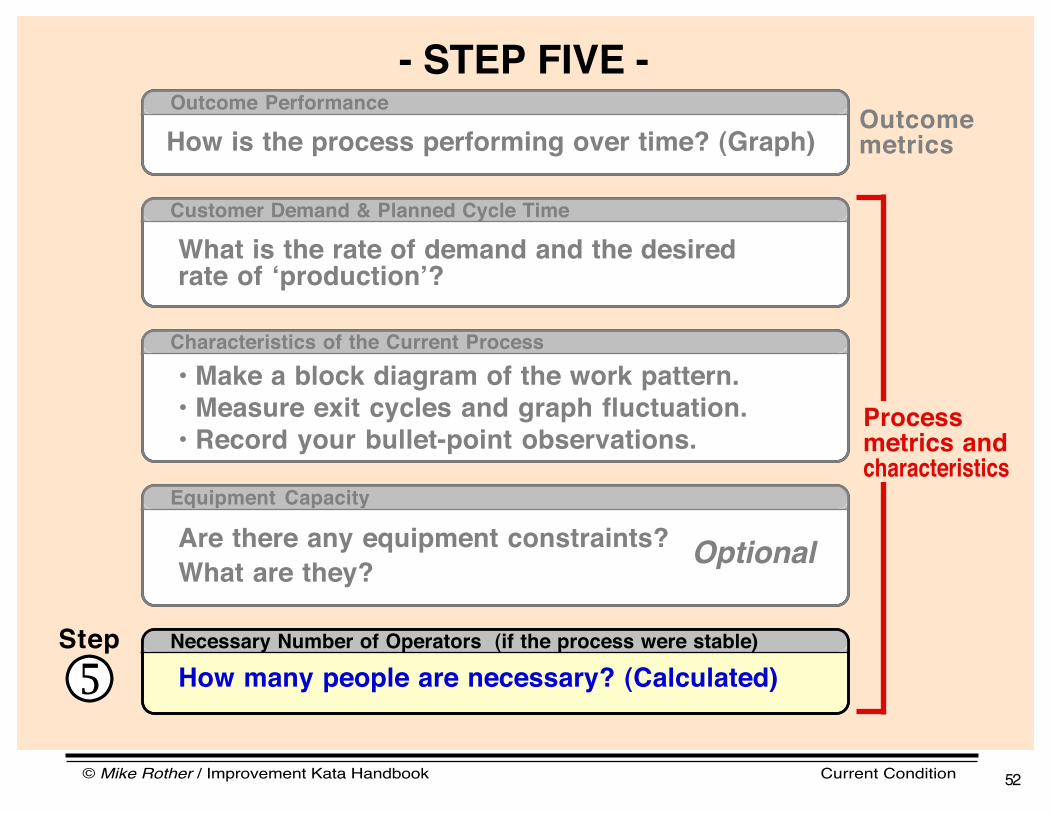
- STEP FIVE -
Necessary Number of Operators (if the process were stable)
How many people are necessary? (Calculated)5Step
What is the rate of demand and the desired rate of ʻproductionʼ?
Customer Demand & Planned Cycle Time
Process metrics and characteristics
Outcomemetrics
Optional
Characteristics of the Current Process
Equipment Capacity
• Make a block diagram of the work pattern.• Measure exit cycles and graph fluctuation.• Record your bullet-point observations.
Are there any equipment constraints?What are they?
How is the process performing over time? (Graph)Outcome Performance

© Mike Rother / Improvement Kata Handbook Current Condition 53
NECESSARY NUMBER OF OPERATORS (calculated)If the process were stable
This is not about reducing the number of operators, but determining the correct number of operators... if the process were stable and there is no out-of-cycle work.
Note that this calculation is only an estimate for getting started.
The calculated number of operators would only be sufficient if you are able to achieve a limited range of fluctuation in the process. The more fluctuation there is in a process, the more extra people will be needed.
Weʼll use the sum of the lowest repeatable times taken from the run charts of each operator, minus any wait time in those cycles, to make this calculation. If you observed wait time in an operatorʼs lowest-repeatable cycles, youʼll subtract that wait time from the lowest repeatable time in order to get closer to the actual task time.
Notes:
© Mike Rother / Improvement Kata Handbook Current Condition 54
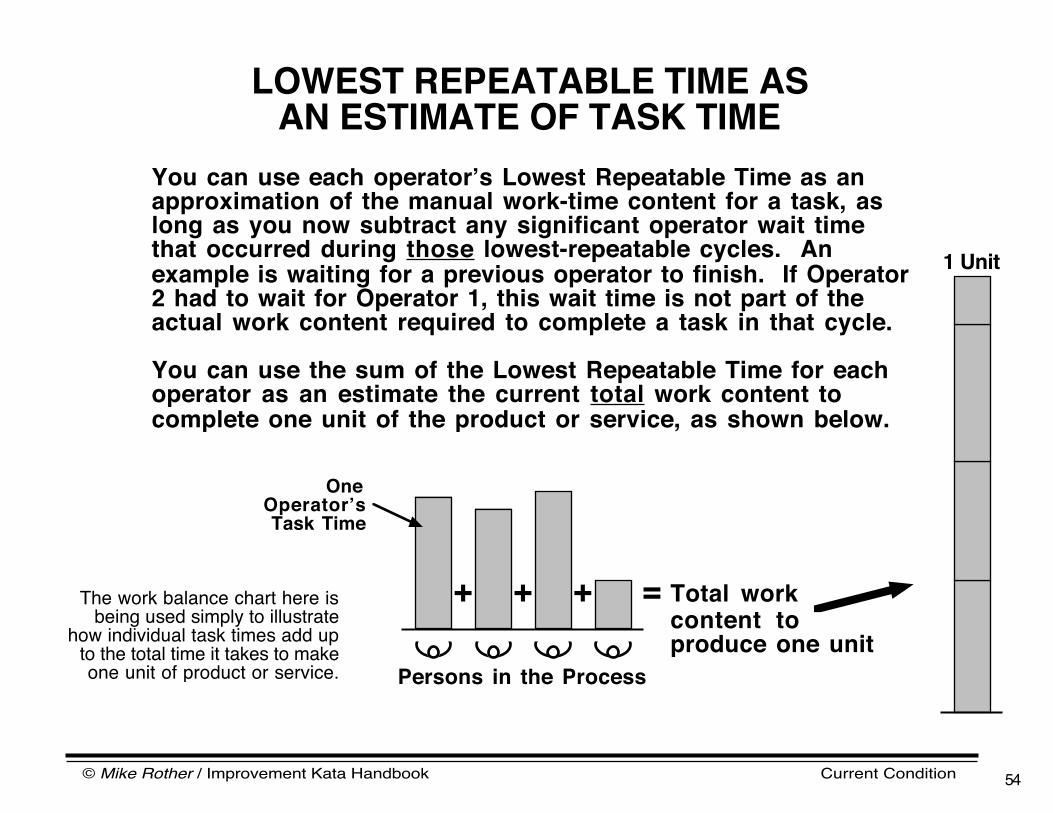
You can use each operatorʼs Lowest Repeatable Time as an approximation of the manual work-time content for a task, as long as you now subtract any significant operator wait time that occurred during those lowest-repeatable cycles. An example is waiting for a previous operator to finish. If Operator 2 had to wait for Operator 1, this wait time is not part of the actual work content required to complete a task in that cycle.
You can use the sum of the Lowest Repeatable Time for each operator as an estimate the current total work content to complete one unit of the product or service, as shown below.
LOWEST REPEATABLE TIME ASAN ESTIMATE OF TASK TIME
Persons in the Process
One OperatorʼsTask Time
+ + + = Total workcontent toproduce one unit
The work balance chart here is being used simply to illustrate
how individual task times add up to the total time it takes to make one unit of product or service.
1 Unit
© Mike Rother / Improvement Kata Handbook Current Condition 55
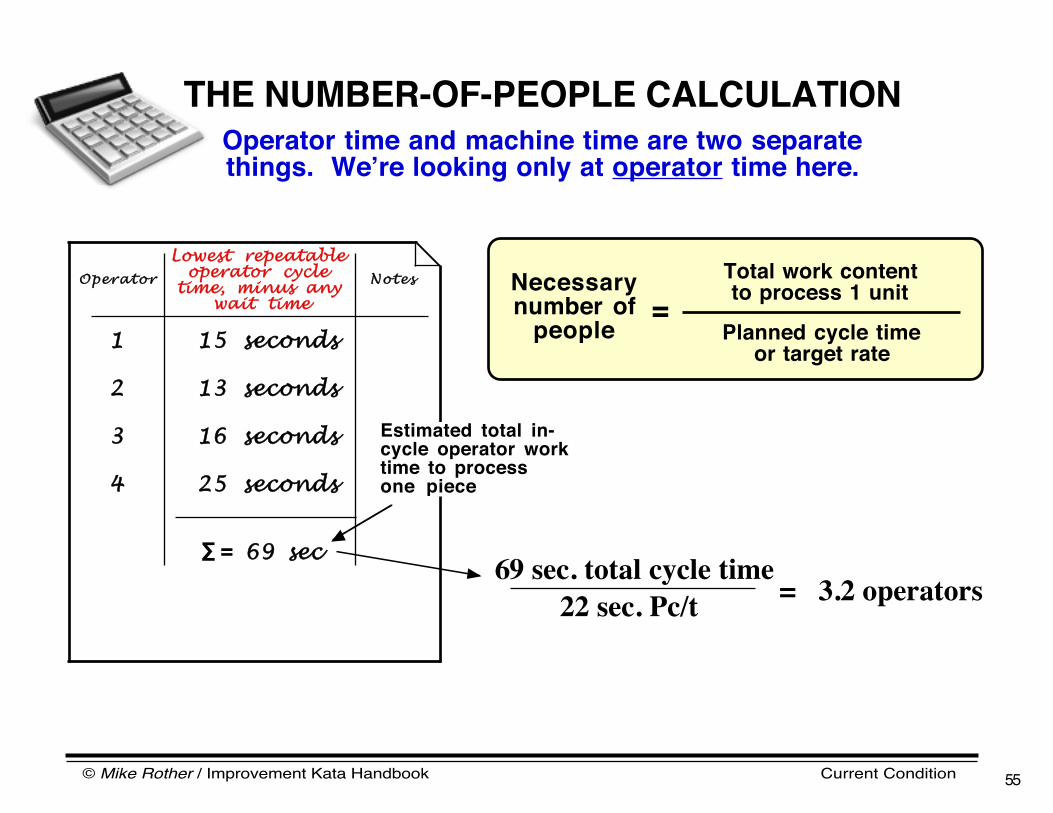
Total work contentto process 1 unit
Planned cycle timeor target rate
Necessarynumber of
people=
Operator
Lowest repeatable operator cycle
time, minus any wait time
Notes
∑ =
1
2
3
4
69 sec
15 seconds
69 sec. total cycle time22 sec. Pc/t = 3.2 operators
Estimated total in-cycle operator work time to process one piece
13 seconds
16 seconds
25 seconds
THE NUMBER-OF-PEOPLE CALCULATIONOperator time and machine time are two separatethings. Weʼre looking only at operator time here.
© Mike Rother / Improvement Kata Handbook Current Condition 56
WHY IS IT OK TO USELOWEST REPEATABLE TIME?
Because these times & the number-of-operatorscalculation are just a starting point for PDCA!
This approach is acceptable if you plan to work with rapid PDCA cycles (as with the improvement kata) and will do so daily. PDCA starts early.
Then the initial times donʼt need to be exact, because you will notice analysis errors and other problems along the way, and adjust as you move forward.
Youʼre not setting a standard at this point. Youʼre getting current-condition information & data to establish your first target condition. As you move toward that first target condition:
• Youʼll learn more about the process, which canbe incorporated into the next target condition
• You can get more detailed times for the workelements if necessary

© Mike Rother / Improvement Kata Handbook Current Condition 57
A FEW SUMMARY POINTS ABOUT TIMING
In Step 3 of Process Analysis:
• You take the unadultered exit cycles as an indication of fluctuation in each operator's work. For the last operator in the process this is often an indication of output fluctuation for the process as a whole.
• As you time the exit cycles you make a note of any significant wait times, but you don't do anything with that information at that point.
In Step 5 of Process Analysis:
• Here you estimate the number of people needed in the process by summing the lowest repeatable time for each operator. If there is significant wait time included in those lowest-repeatable times then you would subtract that wait time at this point, because it is not task time.
© Mike Rother / Improvement Kata Handbook Current Condition 58
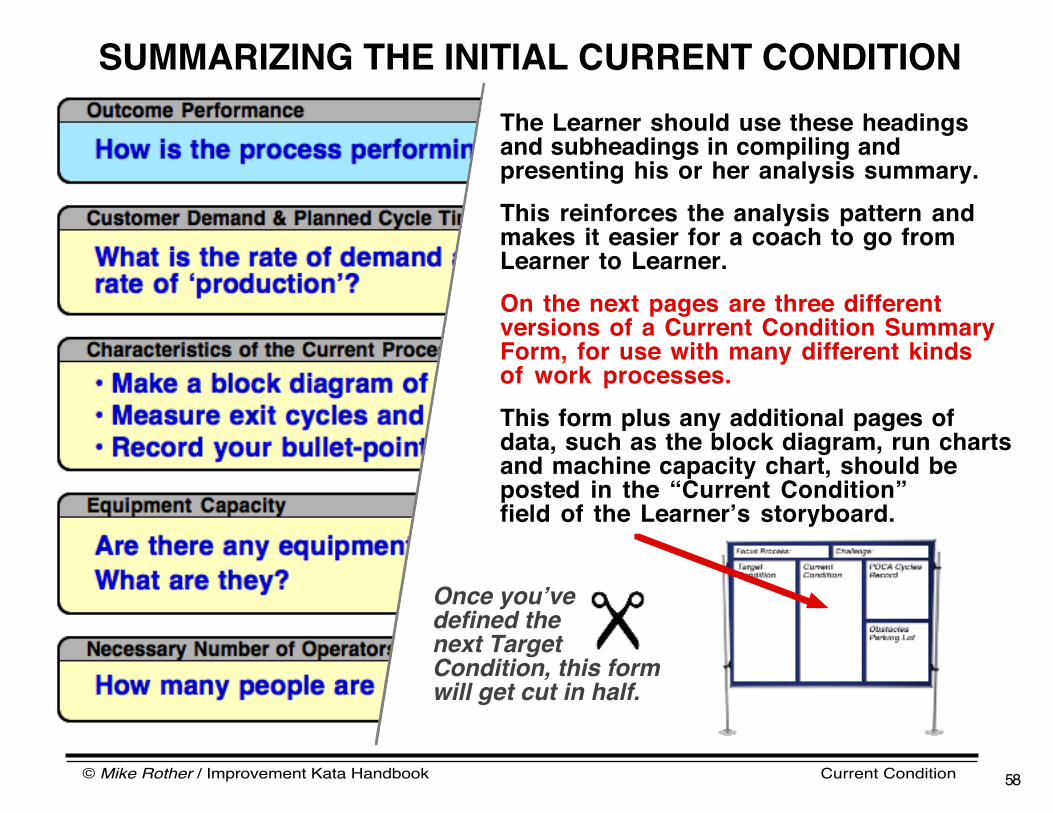
SUMMARIZING THE INITIAL CURRENT CONDITIONThe Learner should use these headings and subheadings in compiling and presenting his or her analysis summary.This reinforces the analysis pattern and makes it easier for a coach to go from Learner to Learner.On the next pages are three different versions of a Current Condition Summary Form, for use with many different kindsof work processes.This form plus any additional pages of data, such as the block diagram, run charts and machine capacity chart, should be posted in the “Current Condition”field of the Learnerʼs storyboard.
Once youʼvedefined thenext Target Condition, this form will get cut in half.

© Mike Rother / Improvement Kata Handbook Current Condition 59
CURRENT CONDITION / TARGET CONDITION
Achieve-By DateCurrent Condition Target ConditionDate
Process MetricLearner: Outcome MetricCoach: Process:
Challenge:
Categories
Process Characteristics and Operating Pattern
(Pattern of Working)
Outcome Performance
(Results)show run chart
show block diagram or
swim-lane diagram

© Mike Rother / Improvement Kata Handbook Current Condition 60
CURRENT CONDITION / TARGET CONDITION
Rate of Demand
Rate of Production
Operating Pattern
Number of People Required
Capacity
2
3
4
5
OutcomePerformance (Results)
1Categories
Process Metric
Achieve-By DateLearner:
Current Condition Target ConditionDate
Outcome MetricCoach: Process:
Challenge:
show block diagram
show chart show chart
show all run chartsshow block diagram
show run chart

© Mike Rother / Improvement Kata Handbook Current Condition 61
CURRENT CONDITION / TARGET CONDITION
Takt time
Pc/t
Number ofoperators
# of ShiftsProcess stepsand sequence
% exit cyclefluctuationOther attributes of the process
Batch size
Calculated numberof operators
Capacity chart
2
3
4
5
Categories Achieve-By DateLearner: Coach: Process:
Current Condition Target ConditionDate
(at end of line)
Rate of Demand &Rate ofProduction
Operating Pattern
Capacity
People Required
show block diagram
show chart show chart
Where WIPAccumulates
+ show all run charts
show block diagram
Actual output / shift
Overtime?
1Outcome Performance
show run chart
Process MetricOutcome Metric
Challenge: