Embed Size (px)
DESCRIPTION
Stratgegy
Citation preview
Olive Garden wants to know. So do Barnes and Noble, PepsiCo, and L.L.Bean. Even your localcar dealer and transit authority are curious. They all want to knowhow well they are doing and how they score against the measuresthey strive to meet. The balanced scorecard can help them answerthis question by evaluating key performance measures. Manycompanies have successfully used the balanced scorecardapproach. Infosys Technologies, one of India’s leading informationtechnology companies, is one of them.
Balanced Scorecard Helps Infosys Transforminto a Leading Consultancy1
In the early 2000s, Infosys Technologies was a company in transition.
The Bangalore-based company was a market leader in information
technology outsourcing, but needed to expand to meet increased
client demand. Infosys invested in many new areas including business
process outsourcing, project management, and management
consulting. This put Infosys in direct competition with established
consulting firms, such as IBM and Accenture.
Led by CEO Kris Gopalakrishnan, the company developed an
integrated management structure that would help align these new,
diverse initiatives. Infosys turned to the balanced scorecard to provide
a framework the company could use to formulate and monitor its
strategy. The balanced scorecard measures corporate performance
along four dimensions—financial, customer, internal business process,
and learning and growth.
The balanced scorecard immediately played a role in the
transformation of Infosys. The executive team used the scorecard to
guide discussion during its meetings. The continual process of
adaptation, execution, and management that the scorecard fostered
helped the team respond to, and even anticipate, its clients’ evolving
needs. Eventually, use of the scorecard for performance measurement
spread to the rest of the organization, with monetary incentives linked
to the company’s performance along the different dimensions.
Over time, the balanced scorecard became part of the Infosys
culture. In recent years, Infosys has begun using the balanced
Learning Objectives
1. Recognize which of two genericstrategies a company is using
2. Understand what comprisesreengineering
3. Understand the four perspectivesof the balanced scorecard
4. Analyze changes in operatingincome to evaluate strategy
5. Identify unused capacity and howto manage it
�
13 Strategy, Balanced Scorecard, andStrategic Profitability Analysis
1 Source: Asis Martinez-Jerez, F., Robert S. Kaplan, and Katherine Miller. 2011. Infosys’s relationship scorecard:Measuring transformational partnerships. Harvard Business School Case No. 9-109-006. Boston: HarvardBusiness School Publishing.
466

scorecard concept to create “relationship scorecards” for many
of its largest clients. Using the scorecard framework, Infosys
began measuring its performance for key clients not only on
project management and client satisfaction, but also on repeat
business and anticipating clients’ future strategic needs.
The balanced scorecard helped successfully steer the
transformation of Infosys from a technology outsourcer to a
leading business consultancy. From 1999 to 2007, the company
had a compound annual growth rate of 50%, with sales growing
from $120 million in 1999 to more than $3 billion in 2007. Infosys
was recognized for its achievements by making the Wired 40,
BusinessWeek IT 100, and BusinessWeek Most Innovative
Companies lists.
This chapter focuses on how management accounting
information helps companies such as Infosys, Merck, Verizon,
and Volkswagen implement and evaluate their strategies.
Strategy drives the operations of a company and guides
managers’ short-run and long-run decisions. We describe the
balanced scorecard approach to implementing strategy and
methods to analyze operating income to evaluate the success
of a strategy. We also show how management accounting
information helps strategic initiatives, such as productivity
improvement, reengineering, and downsizing.
What Is Strategy?Strategy specifies how an organization matches its own capabilities with the opportuni-ties in the marketplace to accomplish its objectives. In other words, strategy describeshow an organization can create value for its customers while differentiating itself fromits competitors. For example, Wal-Mart, the retail giant, creates value for its customersby locating stores in suburban and rural areas, and by offering low prices, a wide rangeof product categories, and few choices within each product category. Consistent with itsstrategy, Wal-Mart has developed the capability to keep costs down by aggressivelynegotiating low prices with its suppliers in exchange for high volumes and by maintain-ing a no-frills, cost-conscious environment.
In formulating its strategy, an organization must first thoroughly understand itsindustry. Industry analysis focuses on five forces: (1) competitors, (2) potential entrantsinto the market, (3) equivalent products, (4) bargaining power of customers, and (5) bar-gaining power of input suppliers.2 The collective effect of these forces shapes an organiza-tion’s profit potential. In general, profit potential decreases with greater competition,stronger potential entrants, products that are similar, and more-demanding customers andsuppliers. We illustrate these five forces for Chipset, Inc., maker of linear integrated circuit
2 M. Porter, Competitive Strategy (New York: Free Press, 1980); M. Porter, Competitive Advantage (New York: Free Press,1985); and M. Porter, “What Is Strategy?” Harvard Business Review (November–December 1996): 61–78.
LearningObjective 1
Recognize which of twogeneric strategies acompany is using
. . . productdifferentiation orcost leadership
468 � CHAPTER 13 STRATEGY, BALANCED SCORECARD, AND STRATEGIC PROFITABILITY ANALYSIS
devices (LICDs) used in modems and communication networks. Chipset produces a singlespecialized product, CX1, a standard, high-performance microchip, which can be used inmultiple applications. Chipset designed CX1 with extensive input from customers.
1. Competitors. The CX1 model faces severe competition with respect to price, timelydelivery, and quality. Companies in the industry have high fixed costs, and persistentpressures to reduce selling prices and utilize capacity fully. Price reductions spurgrowth because it makes LICDs a cost-effective option in new applications such asdigital subscriber lines (DSLs).
2. Potential entrants into the market. The small profit margins and high capital costsdiscourage new entrants. Moreover, incumbent companies such as Chipset are furtherdown the learning curve with respect to lowering costs and building close relation-ships with customers and suppliers.
3. Equivalent products. Chipset tailors CX1 to customer needs and lowers prices bycontinuously improving CX1’s design and processes to reduce production costs. Thisreduces the risk of equivalent products or new technologies replacing CX1.
4. Bargaining power of customers. Customers, such as EarthLink and Verizon, negotiateaggressively with Chipset and its competitors to keep prices down because they buylarge quantities of product.
5. Bargaining power of input suppliers. To produce CX1, Chipset requires high-qualitymaterials (such as silicon wafers, pins for connectivity, and plastic or ceramic packag-ing) and skilled engineers, technicians, and manufacturing labor. The skill-sets suppliersand employees bring gives them bargaining power to demand higher prices and wages.
In summary, strong competition and the bargaining powers of customers and suppliers putsignificant pressure on Chipset’s selling prices. To respond to these challenges, Chipset mustchoose one of two basic strategies: differentiating its product or achieving cost leadership.
Product differentiation is an organization’s ability to offer products or services per-ceived by its customers to be superior and unique relative to the products or services of itscompetitors. Apple Inc. has successfully differentiated its products in the consumer elec-tronics industry, as have Johnson & Johnson in the pharmaceutical industry and Coca-Cola in the soft drink industry. These companies have achieved differentiation throughinnovative product R&D, careful development and promotion of their brands, and therapid push of products to market. Differentiation increases brand loyalty and the willing-ness of customers to pay higher prices.
Cost leadership is an organization’s ability to achieve lower costs relative to competi-tors through productivity and efficiency improvements, elimination of waste, and tightcost control. Cost leaders in their respective industries include Wal-Mart (consumer retail-ing), Home Depot and Lowe’s (building products), Texas Instruments (consumer electron-ics), and Emerson Electric (electric motors). These companies provide products andservices that are similar to—not differentiated from—their competitors, but at a lowercost to the customer. Lower selling prices, rather than unique products or services, pro-vide a competitive advantage for these cost leaders.
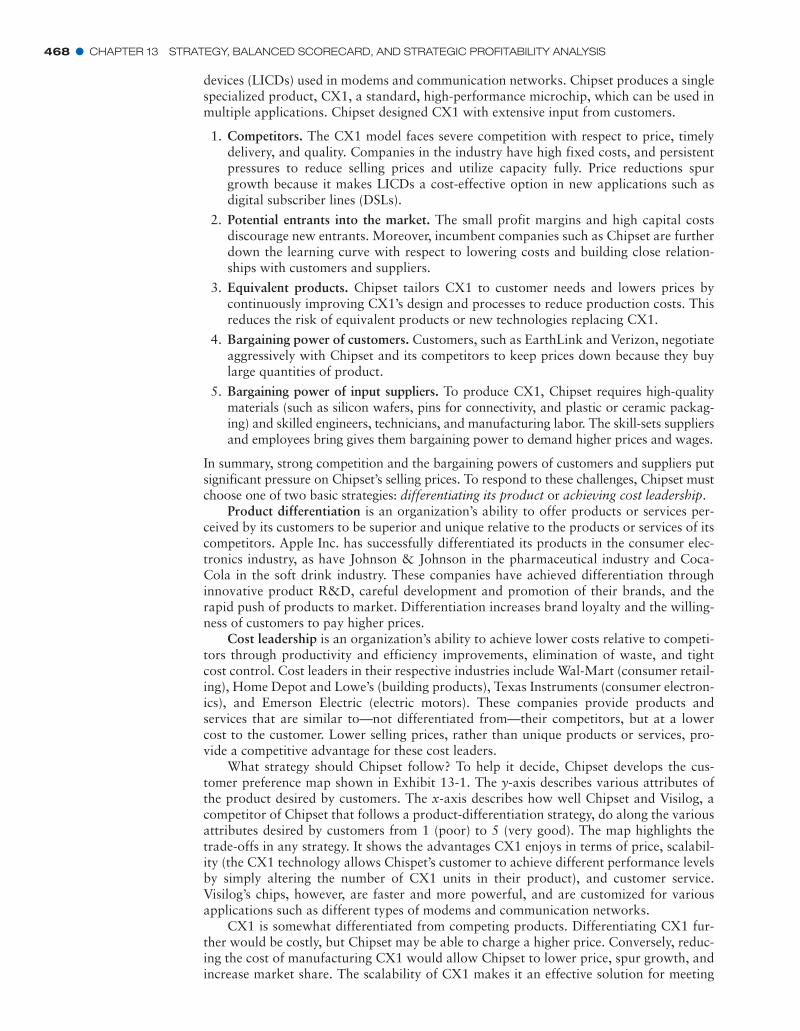
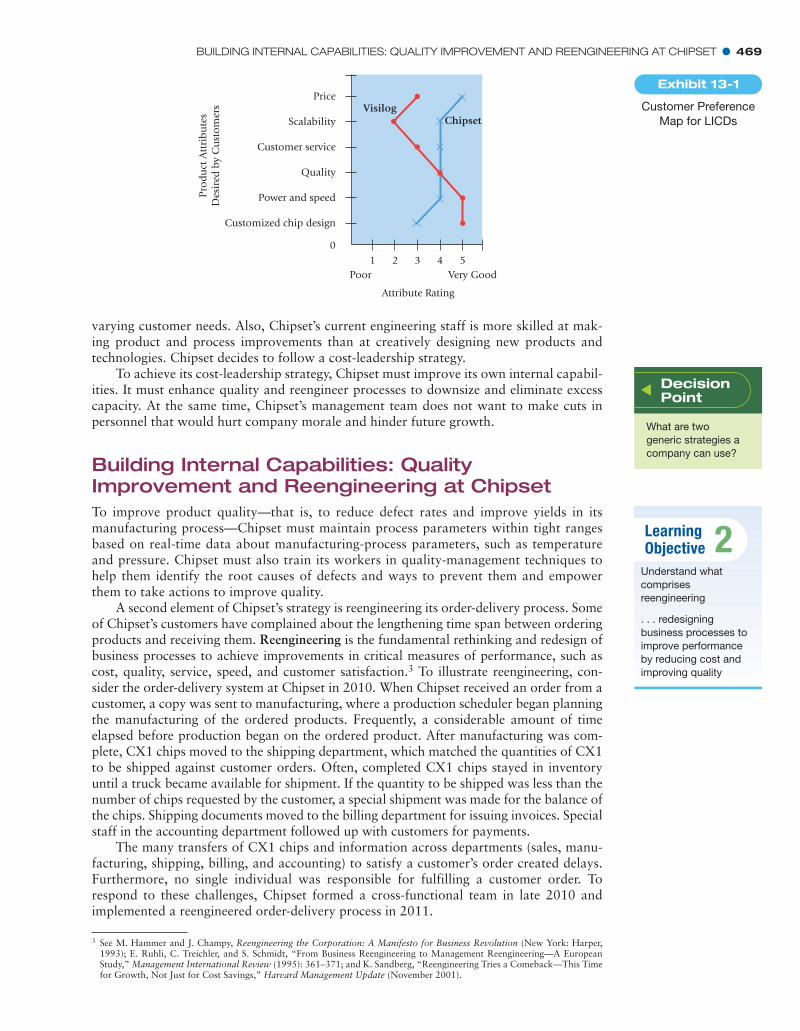
What strategy should Chipset follow? To help it decide, Chipset develops the cus-tomer preference map shown in Exhibit 13-1. The y-axis describes various attributes ofthe product desired by customers. The x-axis describes how well Chipset and Visilog, acompetitor of Chipset that follows a product-differentiation strategy, do along the variousattributes desired by customers from 1 (poor) to 5 (very good). The map highlights thetrade-offs in any strategy. It shows the advantages CX1 enjoys in terms of price, scalabil-ity (the CX1 technology allows Chispet’s customer to achieve different performance levelsby simply altering the number of CX1 units in their product), and customer service.Visilog’s chips, however, are faster and more powerful, and are customized for variousapplications such as different types of modems and communication networks.
CX1 is somewhat differentiated from competing products. Differentiating CX1 fur-ther would be costly, but Chipset may be able to charge a higher price. Conversely, reduc-ing the cost of manufacturing CX1 would allow Chipset to lower price, spur growth, andincrease market share. The scalability of CX1 makes it an effective solution for meeting
BUILDING INTERNAL CAPABILITIES: QUALITY IMPROVEMENT AND REENGINEERING AT CHIPSET � 469
Poor Very Good
Attribute Rating
VisilogPrice
Scalability
Customer service
Customized chip design
Power and speed
Quality
01 4 52 3
Chipset
Pro
du
ct A
ttri
bu
tes
Des
ired
by
Cu
sto
mer
s
varying customer needs. Also, Chipset’s current engineering staff is more skilled at mak-ing product and process improvements than at creatively designing new products andtechnologies. Chipset decides to follow a cost-leadership strategy.
To achieve its cost-leadership strategy, Chipset must improve its own internal capabil-ities. It must enhance quality and reengineer processes to downsize and eliminate excesscapacity. At the same time, Chipset’s management team does not want to make cuts inpersonnel that would hurt company morale and hinder future growth.
Building Internal Capabilities: QualityImprovement and Reengineering at ChipsetTo improve product quality—that is, to reduce defect rates and improve yields in itsmanufacturing process—Chipset must maintain process parameters within tight rangesbased on real-time data about manufacturing-process parameters, such as temperatureand pressure. Chipset must also train its workers in quality-management techniques tohelp them identify the root causes of defects and ways to prevent them and empowerthem to take actions to improve quality.
A second element of Chipset’s strategy is reengineering its order-delivery process. Someof Chipset’s customers have complained about the lengthening time span between orderingproducts and receiving them. Reengineering is the fundamental rethinking and redesign ofbusiness processes to achieve improvements in critical measures of performance, such ascost, quality, service, speed, and customer satisfaction.3 To illustrate reengineering, con-sider the order-delivery system at Chipset in 2010. When Chipset received an order from acustomer, a copy was sent to manufacturing, where a production scheduler began planningthe manufacturing of the ordered products. Frequently, a considerable amount of timeelapsed before production began on the ordered product. After manufacturing was com-plete, CX1 chips moved to the shipping department, which matched the quantities of CX1to be shipped against customer orders. Often, completed CX1 chips stayed in inventoryuntil a truck became available for shipment. If the quantity to be shipped was less than thenumber of chips requested by the customer, a special shipment was made for the balance ofthe chips. Shipping documents moved to the billing department for issuing invoices. Specialstaff in the accounting department followed up with customers for payments.
The many transfers of CX1 chips and information across departments (sales, manu-facturing, shipping, billing, and accounting) to satisfy a customer’s order created delays.Furthermore, no single individual was responsible for fulfilling a customer order. Torespond to these challenges, Chipset formed a cross-functional team in late 2010 andimplemented a reengineered order-delivery process in 2011.
3 See M. Hammer and J. Champy, Reengineering the Corporation: A Manifesto for Business Revolution (New York: Harper,1993); E. Ruhli, C. Treichler, and S. Schmidt, “From Business Reengineering to Management Reengineering—A EuropeanStudy,” Management International Review (1995): 361–371; and K. Sandberg, “Reengineering Tries a Comeback—This Timefor Growth, Not Just for Cost Savings,” Harvard Management Update (November 2001).
Customer PreferenceMap for LICDs
Exhibit 13-1
DecisionPoint
What are twogeneric strategies acompany can use?
LearningObjective 2
Understand whatcomprisesreengineering
. . . redesigningbusiness processes toimprove performanceby reducing cost andimproving quality

470 � CHAPTER 13 STRATEGY, BALANCED SCORECARD, AND STRATEGIC PROFITABILITY ANALYSIS
Under the new system, a customer-relationship manager is responsible for each customerand negotiates long-term contracts specifying quantities and prices. The customer-relationshipmanager works closely with the customer and with manufacturing to specify delivery sched-ules for CX1 one month in advance of shipment. The schedule of customer orders and deliv-ery dates is sent electronically to manufacturing. Completed chips are shipped directly fromthe manufacturing plant to customer sites. Each shipment automatically triggers an elec-tronic invoice and customers electronically transfer funds to Chipset’s bank.
Companies, such as AT&T, Banca di America e di Italia, Cigna Insurance, Cisco,PepsiCo, and Siemens Nixdorf, have realized significant benefits by reengineering theirprocesses across design, production, and marketing (just as in the Chipset example).Reengineering has only limited benefits when reengineering efforts focus on only a singleactivity such as shipping or invoicing rather than the entire order-delivery process. To besuccessful, reengineering efforts must focus on changing roles and responsibilities, elimi-nating unnecessary activities and tasks, using information technology, and developingemployee skills.
Take another look at Exhibit 13-1 and note the interrelatedness and consistency inChipset’s strategy. To help meet customer preferences for price, quality, and customerservice, Chipset decides on a cost-leadership strategy. And to achieve cost leadership,Chipset builds internal capabilities by reengineering its processes. Chipset’s next challengeis to effectively implement its strategy
Strategy Implementation and the BalancedScorecardMany organizations, such as Allstate Insurance, Bank of Montreal, BP, and DowChemical, have introduced a balanced scorecard approach to track progress and managethe implementation of their strategies.
The Balanced ScorecardThe balanced scorecard translates an organization’s mission and strategy into a set ofperformance measures that provides the framework for implementing its strategy.4 Thebalanced scorecard does not focus solely on achieving short-run financial objectives. Italso highlights the nonfinancial objectives that an organization must achieve to meet andsustain its financial objectives. The scorecard measures an organization’s performancefrom four perspectives: (1) financial, the profits and value created for shareholders;(2) customer, the success of the company in its target market; (3) internal businessprocesses, the internal operations that create value for customers; and (4) learning andgrowth, the people and system capabilities that support operations. A company’s strat-egy influences the measures it uses to track performance in each of these perspectives.
Why is this tool called a balanced scorecard? Because it balances the use of financialand nonfinancial performance measures to evaluate short-run and long-run performancein a single report. The balanced scorecard reduces managers’ emphasis on short-runfinancial performance, such as quarterly earnings, because the key strategic nonfinancialand operational indicators, such as product quality and customer satisfaction, measurechanges that a company is making for the long run. The financial benefits of these long-run changes may not show up immediately in short-run earnings; however, strongimprovement in nonfinancial measures usually indicates the creation of future economicvalue. For example, an increase in customer satisfaction, as measured by customer surveysand repeat purchases, signals a strong likelihood of higher sales and income in the future.By balancing the mix of financial and nonfinancial measures, the balanced scorecard
4 See R. S. Kaplan and D. P. Norton, The Balanced Scorecard (Boston: Harvard Business School Press, 1996); R. S. Kaplan andD. P. Norton, The Strategy-Focused Organization: How Balanced Scorecard Companies Thrive in the New BusinessEnvironment (Boston: Harvard Business School Press, 2001); R. S. Kaplan and D. P. Norton, Strategy Maps: ConvertingIntangible Assets into Tangible Outcomes (Boston: Harvard Business School Press, 2004); and R. S. Kaplan and D. P. Norton,Alignment: Using the Balanced Scorecard to Create Corporate Synergies (Boston: Harvard Business School Press, 2006).
For simplicity, this chapter, and much of the literature, emphasizes long-run financial objectives as the primary goal offor-profit companies. For-profit companies interested in long-run financial, environmental, and social objectives adapt the bal-anced scorecard to implement all three objectives.
LearningObjective 3
Understand the fourperspectives of thebalanced scorecard
. . . financial, customer,internal businessprocess, and learningand growth
DecisionPoint
What isreengineering?
STRATEGY IMPLEMENTATION AND THE BALANCED SCORECARD � 471
broadens management’s attention to short-run and long-run performance. Never losesight of the key point. In for-profit companies, the primary goal of the balanced scorecardis to sustain long-run financial performance. Nonfinancial measures simply serve asleading indicators for the hard-to-measure long-run financial performance.
Strategy Maps and the Balanced ScorecardWe use the Chipset example to develop strategy maps and the four perspectives of thebalanced scorecard. The objectives and measures Chipset’s managers choose for eachperspective relates to the action plans for furthering Chipset’s cost leadership strategy:improving quality and reengineering processes.
Strategy Maps
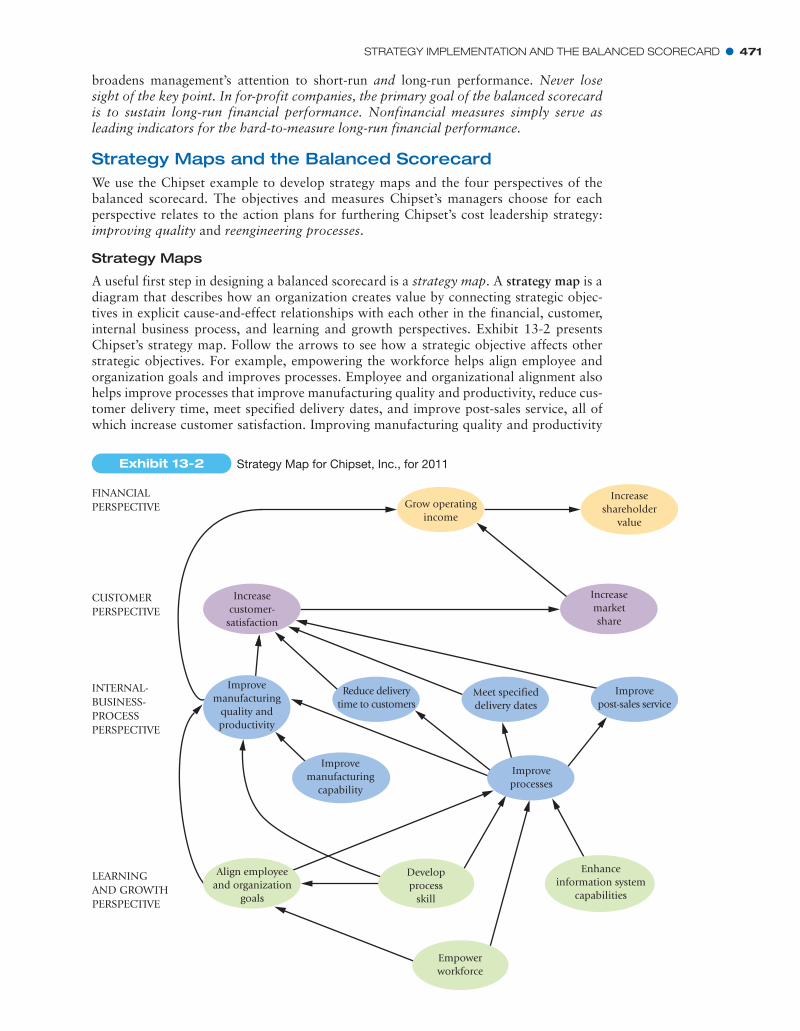
A useful first step in designing a balanced scorecard is a strategy map. A strategy map is adiagram that describes how an organization creates value by connecting strategic objec-tives in explicit cause-and-effect relationships with each other in the financial, customer,internal business process, and learning and growth perspectives. Exhibit 13-2 presentsChipset’s strategy map. Follow the arrows to see how a strategic objective affects otherstrategic objectives. For example, empowering the workforce helps align employee andorganization goals and improves processes. Employee and organizational alignment alsohelps improve processes that improve manufacturing quality and productivity, reduce cus-tomer delivery time, meet specified delivery dates, and improve post-sales service, all ofwhich increase customer satisfaction. Improving manufacturing quality and productivity
Grow operatingincome
Increaseshareholder
value
FINANCIALPERSPECTIVE
CUSTOMERPERSPECTIVE
INTERNAL-BUSINESS-PROCESSPERSPECTIVE
LEARNINGAND GROWTHPERSPECTIVE
Developprocess
skill
Enhanceinformation system
capabilities
Increasecustomer-
satisfaction
Increasemarketshare
Improvemanufacturing
capability
Reduce deliverytime to customers
Meet specifieddelivery dates
Improvepost-sales service
Improvemanufacturing
quality andproductivity
Improveprocesses
Align employeeand organization
goals
Empowerworkforce
Exhibit 13-2 Strategy Map for Chipset, Inc., for 2011
472 � CHAPTER 13 STRATEGY, BALANCED SCORECARD, AND STRATEGIC PROFITABILITY ANALYSIS
grows operating income and increases customer satisfaction that, in turn, increases mar-ket share, operating income, and shareholder value.
Chipset operates in a knowledge-intensive business. To compete successfully, Chipsetinvests in its employees, implements new technology and process controls, improves quality,and reengineers processes. Doing these activities well enables Chipset to build capabilitiesand intangible assets, which are not recorded as assets in its financial books. The strategymap helps Chipset evaluate whether these intangible assets are generating financial returns.
Chipset could include many other cause-and-effect relationships in the strategy mapin Exhibit 13-2. But, Chipset, like other companies implementing the balanced scorecard,focuses on only those relationships that it believes to be the most significant.
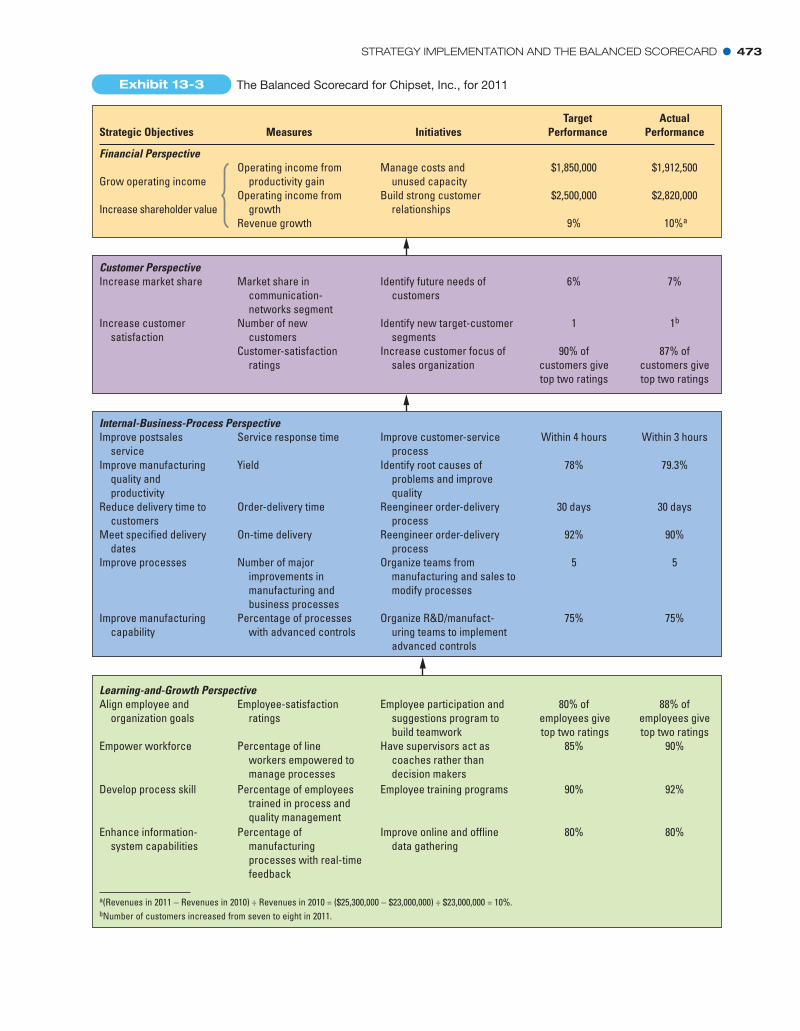
Chipset uses the strategy map from Exhibit 13-2 to build the balanced scorecard pre-sented in Exhibit 13-3. The scorecard highlights the four perspectives of performance:financial, customer, internal business process, and learning and growth. The first columnpresents the strategic objectives from the strategy map in Exhibit 13-2. At the beginningof 2011, the company’s managers specify the strategic objectives, measures, initiatives (theactions necessary to achieve the objectives), and target performance (the first fourcolumns of Exhibit 13-3).
Chipset wants to use the balanced scorecard targets to drive the organization tohigher levels of performance. Managers therefore set targets at a level of performance thatis achievable, yet distinctly better than competitors. Chipset’s managers complete the fifthcolumn, reporting actual performance at the end of 2011. This column comparesChipset’s performance relative to target.
Four Perspectives of the Balanced Scorecard
We next describe the perspectives in general terms and illustrate each perspective usingthe measures chosen by Chipset in the context of its strategy.
1. Financial perspective. This perspective evaluates the profitability of the strategy and thecreation of shareholder value. Because Chipset’s key strategic initiatives are cost reduc-tion relative to competitors’ costs and sales growth, the financial perspective focuses onhow much operating income results from reducing costs and selling more units of CX1.
2. Customer perspective. This perspective identifies targeted customer and market seg-ments and measures the company’s success in these segments. To monitor its customerobjectives, Chipset uses measures such as market share in the communication-networkssegment, number of new customers, and customer-satisfaction ratings.
3. Internal-business-process perspective. This perspective focuses on internal operationsthat create value for customers that, in turn, help achieve financial performance. Chipsetdetermines internal-business-process improvement targets after benchmarking against itsmain competitors using information from published financial statements, prevailingprices, customers, suppliers, former employees, industry experts, and financial analysts.The internal-business-process perspective comprises three subprocesses:� Innovation process: Creating products, services, and processes that will meet the
needs of customers. This is a very important process for companies that follow aproduct-differentiation strategy and must constantly design and develop innovativenew products to remain competitive in the marketplace. Chipset’s innovation focuseson improving its manufacturing capability and process controls to lower costs andimprove quality. Chipset measures innovation by the number of improvements inmanufacturing processes and percentage of processes with advanced controls.
� Operations process: Producing and delivering existing products and services that willmeet the needs of customers. Chipset’s strategic initiatives are (a) improving manu-facturing quality, (b) reducing delivery time to customers, and (c) meeting specifieddelivery dates so it measures yield, order-delivery time, and on-time deliveries.
� Postsales-service process: Providing service and support to the customer after thesale of a product or service. Chipset monitors how quickly and accurately it isresponding to customer-service requests.
STRATEGY IMPLEMENTATION AND THE BALANCED SCORECARD � 473
Target ActualStrategic Objectives Measures Initiatives Performance Performance
Financial PerspectiveOperating income from Manage costs and $1,850,000 $1,912,500
productivity gain unused capacityGrow operating incomeOperating income from Build strong customer $2,500,000 $2,820,000
Increase shareholder value growth relationshipsRevenue growth 9% 10%a
Customer PerspectiveIncrease market share Market share in Identify future needs of 6% 7%
communication- customersnetworks segment
Increase customer Number of new Identify new target-customer 1 1b
satisfaction customers segmentsCustomer-satisfaction Increase customer focus of 90% of 87% of
ratings sales organization customers give customers givetop two ratings top two ratings
Internal-Business-Process Perspective
Improve manufacturing Yield Identify root causes of 78% 79.3%quality and problems and improveproductivity quality
Reduce delivery time to Order-delivery time Reengineer order-delivery 30 days 30 dayscustomers process
Meet specified delivery On-time delivery Reengineer order-delivery 92% 90%dates process
Improve postsales Service response time Improve customer-service Within 4 hours Within 3 hoursservice process
Improve processes Number of major Organize teams from 5 5improvements in manufacturing and sales tomanufacturing and modify processesbusiness processes
Improve manufacturing Percentage of processes Organize R&D/manufact- 75% 75%capability with advanced controls uring teams to implement
advanced controls
Learning-and-Growth PerspectiveAlign employee and Employee-satisfaction Employee participation and 80% of 88% of
organization goals ratings suggestions program to employees give employees givebuild teamwork top two ratings top two ratings
Develop process skill Percentage of employees Employee training programs 90% 92%trained in process and quality management
Empower workforce Percentage of line Have supervisors act as 85% 90%workers empowered to coaches rather thanmanage processes decision makers
Enhance information- Percentage of Improve online and offline 80% 80%system capabilities manufacturing data gathering
processes with real-time feedback
a(Revenues in 2011 − Revenues in 2010) ÷ Revenues in 2010 = ($25,300,000 − $23,000,000) ÷ $23,000,000 = 10%.bNumber of customers increased from seven to eight in 2011.
Exhibit 13-3 The Balanced Scorecard for Chipset, Inc., for 2011

474 � CHAPTER 13 STRATEGY, BALANCED SCORECARD, AND STRATEGIC PROFITABILITY ANALYSIS
4. Learning-and-growth perspective. This perspective identifies the capabilities the organ-ization must excel at to achieve superior internal processes that in turn create value forcustomers and shareholders. Chipset’s learning and growth perspective emphasizesthree capabilities: (1) information-system capabilities, measured by the percentage ofmanufacturing processes with real-time feedback; (2) employee capabilities, measuredby the percentage of employees trained in process and quality management; and(3) motivation, measured by employee satisfaction and the percentage of manufactur-ing and sales employees (line employees) empowered to manage processes.
The arrows in Exhibit 13-3 indicate the broad cause-and-effect linkages: how gains in thelearning-and-growth perspective lead to improvements in internal business processes, whichlead to higher customer satisfaction and market share, and finally lead to superior financialperformance. Note how the scorecard describes elements of Chipset’s strategy implementa-tion. Worker training and empowerment improve employee satisfaction and lead to manu-facturing and business-process improvements that improve quality and reduce deliverytime. The result is increased customer satisfaction and higher market share. These initiativeshave been successful from a financial perspective. Chipset has earned significant operatingincome from its cost leadership strategy, and that strategy has also led to growth.
A major benefit of the balanced scorecard is that it promotes causal thinking. Thinkof the balanced scorecard as a linked scorecard or a causal scorecard. Managers mustsearch for empirical evidence (rather than rely on faith alone) to test the validity andstrength of the various connections. A causal scorecard enables a company to focus on thekey drivers that steer the implementation of the strategy. Without convincing links, thescorecard loses much of its value.
Implementing a Balanced ScorecardTo successfully implement a balanced scorecard requires commitment and leadershipfrom top management. At Chipset, the team building the balanced scorecard (headed bythe vice president of strategic planning) conducted interviews with senior managers,probed executives about customers, competitors, and technological developments, andsought proposals for balanced scorecard objectives across the four perspectives. Theteam then met to discuss the responses and to build a prioritized list of objectives.
In a meeting with all senior managers, the team sought to achieve consensus on thescorecard objectives. Senior management was then divided into four groups, with eachgroup responsible for one of the perspectives. In addition, each group broadened the baseof inputs by including representatives from the next-lower levels of management and keyfunctional managers. The groups identified measures for each objective and the sources ofinformation for each measure. The groups then met to finalize scorecard objectives, meas-ures, targets, and the initiatives to achieve the targets. Management accountants playedan important role in the design and implementation of the balanced scorecard, particu-larly in determining measures to represent the realities of the business. This required man-agement accountants to understand the economic environment of the industry, Chipset’scustomers and competitors, and internal business issues such as human resources, opera-tions, and distribution.
Managers made sure that employees understood the scorecard and the scorecardprocess. The final balanced scorecard was communicated to all employees. Sharing thescorecard allowed engineers and operating personnel, for example, to understand the rea-sons for customer satisfaction and dissatisfaction and to make suggestions for improvinginternal processes directly aimed at satisfying customers and implementing Chipset’s strat-egy. Too often, scorecards are seen by only a select group of managers. By limiting thescorecard’s exposure, an organization loses the opportunity for widespread organizationengagement and alignment.
Chipset (like Cigna Property, Casualty Insurance, and Wells Fargo) also encourageseach department to develop its own scorecard that ties into Chipset’s main scorecarddescribed in Exhibit 13-3. For example, the quality control department’s scorecard hasmeasures that its department managers use to improve yield—number of quality circles,statistical process control charts, Pareto diagrams, and root-cause analyses (see
STRATEGY IMPLEMENTATION AND THE BALANCED SCORECARD � 475
Chapter 19, pp. 675–677 for more details). Department scorecards help align the actionsof each department to implement Chipset’s strategy.
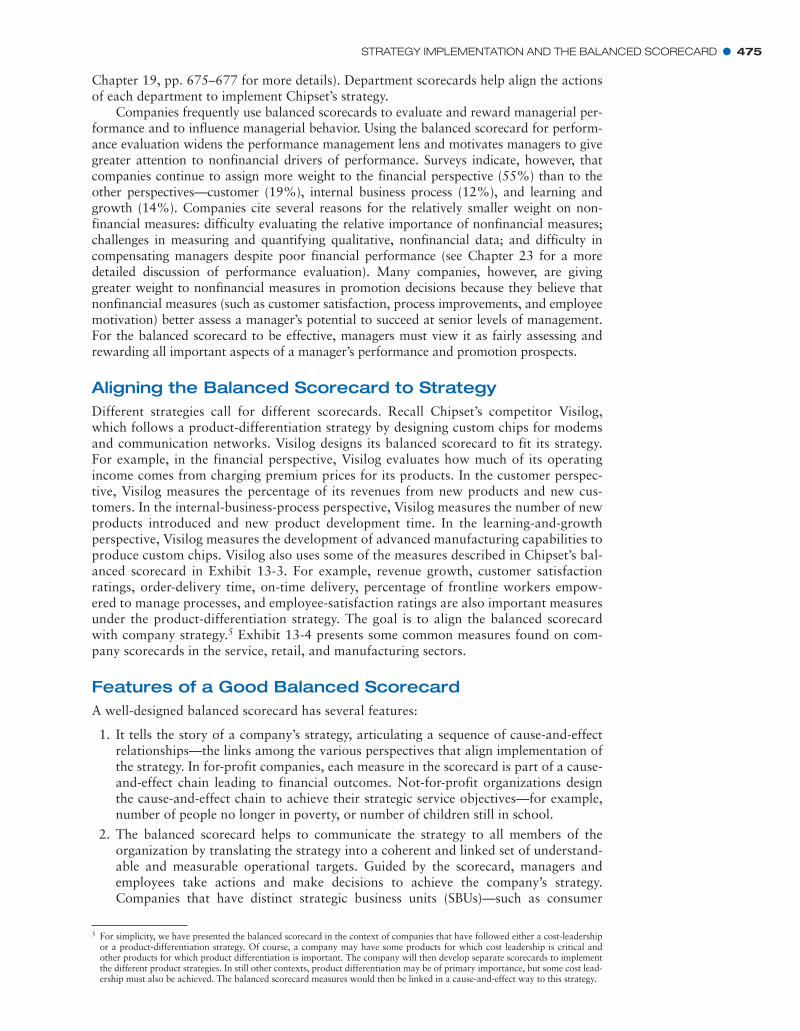
Companies frequently use balanced scorecards to evaluate and reward managerial per-formance and to influence managerial behavior. Using the balanced scorecard for perform-ance evaluation widens the performance management lens and motivates managers to givegreater attention to nonfinancial drivers of performance. Surveys indicate, however, thatcompanies continue to assign more weight to the financial perspective (55%) than to theother perspectives—customer (19%), internal business process (12%), and learning andgrowth (14%). Companies cite several reasons for the relatively smaller weight on non-financial measures: difficulty evaluating the relative importance of nonfinancial measures;challenges in measuring and quantifying qualitative, nonfinancial data; and difficulty incompensating managers despite poor financial performance (see Chapter 23 for a moredetailed discussion of performance evaluation). Many companies, however, are givinggreater weight to nonfinancial measures in promotion decisions because they believe thatnonfinancial measures (such as customer satisfaction, process improvements, and employeemotivation) better assess a manager’s potential to succeed at senior levels of management.For the balanced scorecard to be effective, managers must view it as fairly assessing andrewarding all important aspects of a manager’s performance and promotion prospects.
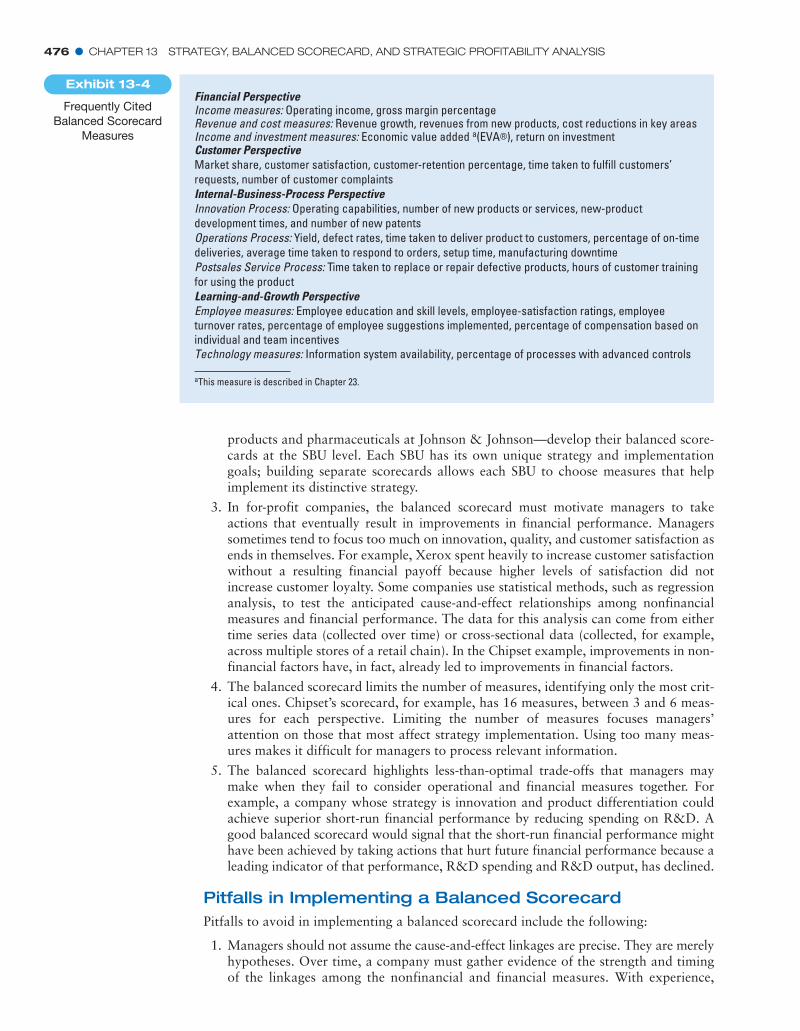
Aligning the Balanced Scorecard to StrategyDifferent strategies call for different scorecards. Recall Chipset’s competitor Visilog,which follows a product-differentiation strategy by designing custom chips for modemsand communication networks. Visilog designs its balanced scorecard to fit its strategy.For example, in the financial perspective, Visilog evaluates how much of its operatingincome comes from charging premium prices for its products. In the customer perspec-tive, Visilog measures the percentage of its revenues from new products and new cus-tomers. In the internal-business-process perspective, Visilog measures the number of newproducts introduced and new product development time. In the learning-and-growthperspective, Visilog measures the development of advanced manufacturing capabilities toproduce custom chips. Visilog also uses some of the measures described in Chipset’s bal-anced scorecard in Exhibit 13-3. For example, revenue growth, customer satisfactionratings, order-delivery time, on-time delivery, percentage of frontline workers empow-ered to manage processes, and employee-satisfaction ratings are also important measuresunder the product-differentiation strategy. The goal is to align the balanced scorecardwith company strategy.5 Exhibit 13-4 presents some common measures found on com-pany scorecards in the service, retail, and manufacturing sectors.
Features of a Good Balanced ScorecardA well-designed balanced scorecard has several features:
1. It tells the story of a company’s strategy, articulating a sequence of cause-and-effectrelationships—the links among the various perspectives that align implementation ofthe strategy. In for-profit companies, each measure in the scorecard is part of a cause-and-effect chain leading to financial outcomes. Not-for-profit organizations designthe cause-and-effect chain to achieve their strategic service objectives—for example,number of people no longer in poverty, or number of children still in school.
2. The balanced scorecard helps to communicate the strategy to all members of theorganization by translating the strategy into a coherent and linked set of understand-able and measurable operational targets. Guided by the scorecard, managers andemployees take actions and make decisions to achieve the company’s strategy.Companies that have distinct strategic business units (SBUs)—such as consumer
5 For simplicity, we have presented the balanced scorecard in the context of companies that have followed either a cost-leadershipor a product-differentiation strategy. Of course, a company may have some products for which cost leadership is critical andother products for which product differentiation is important. The company will then develop separate scorecards to implementthe different product strategies. In still other contexts, product differentiation may be of primary importance, but some cost lead-ership must also be achieved. The balanced scorecard measures would then be linked in a cause-and-effect way to this strategy.
476 � CHAPTER 13 STRATEGY, BALANCED SCORECARD, AND STRATEGIC PROFITABILITY ANALYSIS
Financial Perspective
Income and investment measures: Economic value added a(EVA®), return on investmentRevenue and cost measures: Revenue growth, revenues from new products, cost reductions in key areasIncome measures: Operating income, gross margin percentage
Customer PerspectiveMarket share, customer satisfaction, customer-retention percentage, time taken to fulfill customers’requests, number of customer complaintsInternal-Business-Process PerspectiveInnovation Process: Operating capabilities, number of new products or services, new-productdevelopment times, and number of new patentsOperations Process: Yield, defect rates, time taken to deliver product to customers, percentage of on-timedeliveries, average time taken to respond to orders, setup time, manufacturing downtimePostsales Service Process: Time taken to replace or repair defective products, hours of customer trainingfor using the productLearning-and-Growth PerspectiveEmployee measures: Employee education and skill levels, employee-satisfaction ratings, employeeturnover rates, percentage of employee suggestions implemented, percentage of compensation based onindividual and team incentivesTechnology measures: Information system availability, percentage of processes with advanced controls
aThis measure is described in Chapter 23.
products and pharmaceuticals at Johnson & Johnson—develop their balanced score-cards at the SBU level. Each SBU has its own unique strategy and implementationgoals; building separate scorecards allows each SBU to choose measures that helpimplement its distinctive strategy.
3. In for-profit companies, the balanced scorecard must motivate managers to takeactions that eventually result in improvements in financial performance. Managerssometimes tend to focus too much on innovation, quality, and customer satisfaction asends in themselves. For example, Xerox spent heavily to increase customer satisfactionwithout a resulting financial payoff because higher levels of satisfaction did notincrease customer loyalty. Some companies use statistical methods, such as regressionanalysis, to test the anticipated cause-and-effect relationships among nonfinancialmeasures and financial performance. The data for this analysis can come from eithertime series data (collected over time) or cross-sectional data (collected, for example,across multiple stores of a retail chain). In the Chipset example, improvements in non-financial factors have, in fact, already led to improvements in financial factors.
4. The balanced scorecard limits the number of measures, identifying only the most crit-ical ones. Chipset’s scorecard, for example, has 16 measures, between 3 and 6 meas-ures for each perspective. Limiting the number of measures focuses managers’attention on those that most affect strategy implementation. Using too many meas-ures makes it difficult for managers to process relevant information.
5. The balanced scorecard highlights less-than-optimal trade-offs that managers maymake when they fail to consider operational and financial measures together. Forexample, a company whose strategy is innovation and product differentiation couldachieve superior short-run financial performance by reducing spending on R&D. Agood balanced scorecard would signal that the short-run financial performance mighthave been achieved by taking actions that hurt future financial performance because aleading indicator of that performance, R&D spending and R&D output, has declined.
Pitfalls in Implementing a Balanced ScorecardPitfalls to avoid in implementing a balanced scorecard include the following:
1. Managers should not assume the cause-and-effect linkages are precise. They are merelyhypotheses. Over time, a company must gather evidence of the strength and timingof the linkages among the nonfinancial and financial measures. With experience,
Frequently CitedBalanced Scorecard
Measures
Exhibit 13-4

STRATEGY IMPLEMENTATION AND THE BALANCED SCORECARD � 477
organizations should alter their scorecards to include those nonfinancial strategicobjectives and measures that are the best leading indicators (the causes) of financial per-formance (a lagging indicator or the effect). Understanding that the scorecard evolvesover time helps managers avoid unproductively spending time and money trying todesign the “perfect” scorecard at the outset. Furthermore, as the business environmentand strategy change over time, the measures in the scorecard also need to change.
2. Managers should not seek improvements across all of the measures all of the time.For example, strive for quality and on-time performance but not beyond the point atwhich further improvement in these objectives is so costly that it is inconsistent withlong-run profit maximization. Cost-benefit considerations should always be centralwhen designing a balanced scorecard.
3. Managers should not use only objective measures in the balanced scorecard. Chipset’sbalanced scorecard includes both objective measures (such as operating income fromcost leadership, market share, and manufacturing yield) and subjective measures (suchas customer- and employee-satisfaction ratings). When using subjective measures,though, managers must be careful that the benefits of this potentially rich informationare not lost by using measures that are inaccurate or that can be easily manipulated.
4. Despite challenges of measurement, top management should not ignore nonfinancialmeasures when evaluating managers and other employees. Managers tend to focus onthe measures used to reward their performance. Excluding nonfinancial measureswhen evaluating performance will reduce the significance and importance that man-agers give to nonfinancial measures.
Evaluating the Success of Strategy and ImplementationTo evaluate how successful Chipset’s strategy and its implementation have been, its man-agement compares the target- and actual-performance columns in the balanced scorecard(Exhibit 13-3). Chipset met most targets set on the basis of competitor benchmarks in2011 itself. That’s because, in the Chipset context, improvements in the learning andgrowth perspective quickly ripple through to the financial perspective. Chipset will con-tinue to seek improvements on the targets it did not achieve, but meeting most targetssuggests that the strategic initiatives that Chipset identified and measured for learningand growth resulted in improvements in internal business processes, customer measures,and financial performance.
How would Chipset know if it had problems in strategy implementation? If it did notmeet its targets on the two perspectives that are more internally focused: learning andgrowth and internal business processes.
What if Chipset performed well on learning and growth and internal businessprocesses, but customer measures and financial performance in this year and the next didnot improve? Chipset’s managers would then conclude that Chipset did a good job ofimplementation (the various internal nonfinancial measures it targeted improved) but thatits strategy was faulty (there was no effect on customers or on long-run financial perform-ance and value creation). Management failed to identify the correct causal links. It imple-mented the wrong strategy well! Management would then reevaluate the strategy and thefactors that drive it.
Now what if Chipset performed well on its various nonfinancial measures, andoperating income over this year and the next also increased? Chipset’s managers mightbe tempted to declare the strategy a success because operating income increased.Unfortunately, management still cannot conclude with any confidence that Chipsetsuccessfully formulated and implemented its strategy. Why? Because operating incomecan increase simply because entire markets are expanding, not because a company’sstrategy has been successful. Also, changes in operating income might occur because offactors outside the strategy. For example, a company such as Chipset that has chosen acost-leadership strategy may find that its operating-income increase actually resultedfrom, say, some degree of product differentiation. To evaluate the success of a strategy,managers and management accountants need to link strategy to the sources of operating-income increases.
DecisionPoint
How can anorganization translateits strategy into a setof performancemeasures?
478 � CHAPTER 13 STRATEGY, BALANCED SCORECARD, AND STRATEGIC PROFITABILITY ANALYSIS
For Chipset to conclude that it was successful in implementing its strategy, it mustdemonstrate that improvements in its financial performance and operating income overtime resulted from achieving targeted cost savings and growth in market share.Fortunately, the top two rows of Chipset’s balanced scorecard in Exhibit 13-3 show thatoperating-income gains from productivity ($1,912,500) and growth ($2,820,000)exceeded targets. The next section of this chapter describes how these numbers were cal-culated. Because its strategy has been successful, Chipset’s management can be more con-fident that the gains will be sustained in subsequent years.
Chipset’s management accountants subdivide changes in operating income into com-ponents that can be identified with product differentiation, cost leadership, and growth.Why growth? Because successful product differentiation or cost leadership generallyincreases market share and helps a company to grow. Subdividing the change in operatingincome to evaluate the success of a strategy is conceptually similar to the variance analy-sis discussed in Chapters 7 and 8. One difference, however, is that management account-ants compare actual operating performance over two different periods, not actual tobudgeted numbers in the same time period as in variance analysis.6
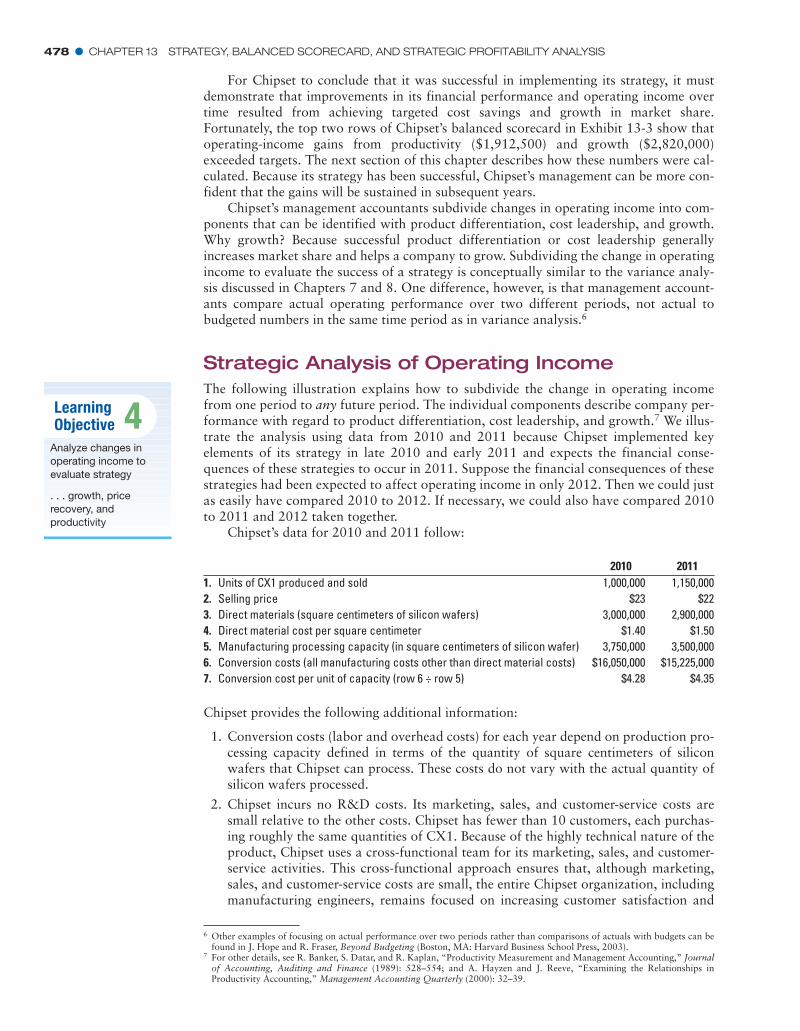
Strategic Analysis of Operating IncomeThe following illustration explains how to subdivide the change in operating incomefrom one period to any future period. The individual components describe company per-formance with regard to product differentiation, cost leadership, and growth.7 We illus-trate the analysis using data from 2010 and 2011 because Chipset implemented keyelements of its strategy in late 2010 and early 2011 and expects the financial conse-quences of these strategies to occur in 2011. Suppose the financial consequences of thesestrategies had been expected to affect operating income in only 2012. Then we could justas easily have compared 2010 to 2012. If necessary, we could also have compared 2010to 2011 and 2012 taken together.
Chipset’s data for 2010 and 2011 follow:
6 Other examples of focusing on actual performance over two periods rather than comparisons of actuals with budgets can befound in J. Hope and R. Fraser, Beyond Budgeting (Boston, MA: Harvard Business School Press, 2003).
7 For other details, see R. Banker, S. Datar, and R. Kaplan, “Productivity Measurement and Management Accounting,” Journalof Accounting, Auditing and Finance (1989): 528–554; and A. Hayzen and J. Reeve, “Examining the Relationships inProductivity Accounting,” Management Accounting Quarterly (2000): 32–39.
2010 20111. Units of CX1 produced and sold 1,000,000 1,150,0002. Selling price $23 $223. Direct materials (square centimeters of silicon wafers) 3,000,000 2,900,0004. Direct material cost per square centimeter $1.40 $1.505. Manufacturing processing capacity (in square centimeters of silicon wafer) 3,750,000 3,500,0006. Conversion costs (all manufacturing costs other than direct material costs) $16,050,000 $15,225,0007. Conversion cost per unit of capacity (row 6 ÷ row 5) $4.28 $4.35
LearningObjective 4
Analyze changes inoperating income toevaluate strategy
. . . growth, pricerecovery, andproductivity
Chipset provides the following additional information:
1. Conversion costs (labor and overhead costs) for each year depend on production pro-cessing capacity defined in terms of the quantity of square centimeters of siliconwafers that Chipset can process. These costs do not vary with the actual quantity ofsilicon wafers processed.
2. Chipset incurs no R&D costs. Its marketing, sales, and customer-service costs aresmall relative to the other costs. Chipset has fewer than 10 customers, each purchas-ing roughly the same quantities of CX1. Because of the highly technical nature of theproduct, Chipset uses a cross-functional team for its marketing, sales, and customer-service activities. This cross-functional approach ensures that, although marketing,sales, and customer-service costs are small, the entire Chipset organization, includingmanufacturing engineers, remains focused on increasing customer satisfaction and
STRATEGIC ANALYSIS OF OPERATING INCOME � 479
market share. (The Problem for Self-Study at the end of this chapter describes a situ-ation in which marketing, sales, and customer-service costs are significant.)
3. Chipset’s asset structure is very similar in 2010 and 2011.
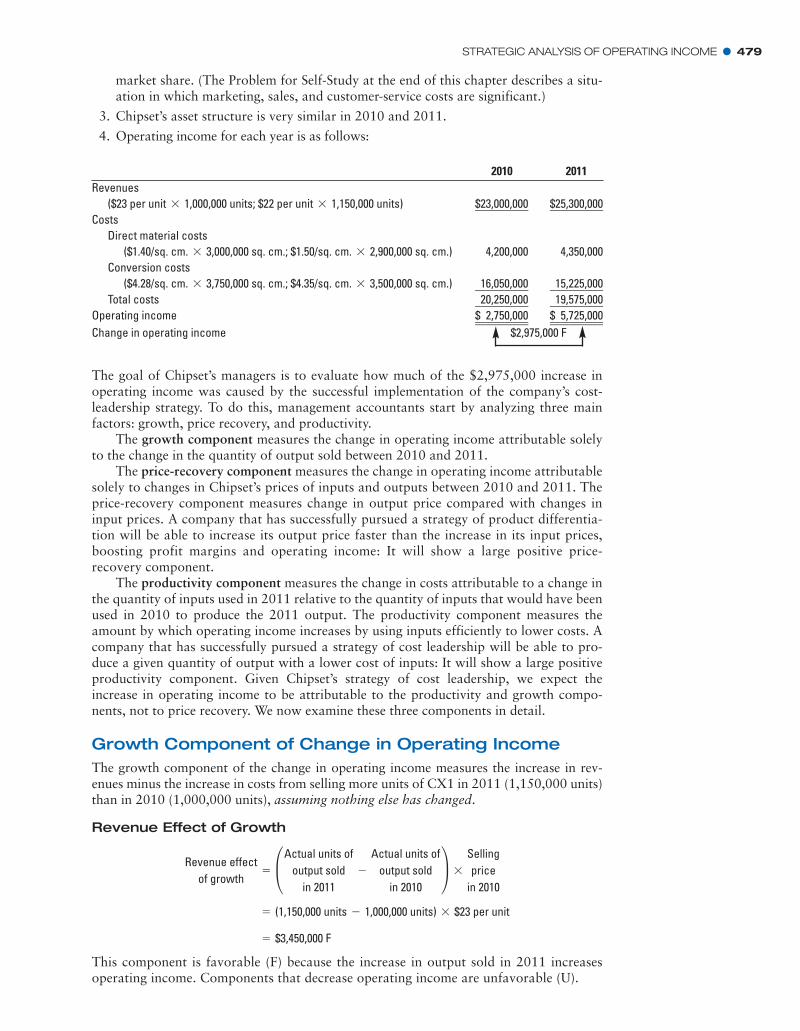
4. Operating income for each year is as follows:
The goal of Chipset’s managers is to evaluate how much of the $2,975,000 increase inoperating income was caused by the successful implementation of the company’s cost-leadership strategy. To do this, management accountants start by analyzing three mainfactors: growth, price recovery, and productivity.
The growth component measures the change in operating income attributable solelyto the change in the quantity of output sold between 2010 and 2011.
The price-recovery component measures the change in operating income attributablesolely to changes in Chipset’s prices of inputs and outputs between 2010 and 2011. Theprice-recovery component measures change in output price compared with changes ininput prices. A company that has successfully pursued a strategy of product differentia-tion will be able to increase its output price faster than the increase in its input prices,boosting profit margins and operating income: It will show a large positive price-recovery component.
The productivity component measures the change in costs attributable to a change inthe quantity of inputs used in 2011 relative to the quantity of inputs that would have beenused in 2010 to produce the 2011 output. The productivity component measures theamount by which operating income increases by using inputs efficiently to lower costs. Acompany that has successfully pursued a strategy of cost leadership will be able to pro-duce a given quantity of output with a lower cost of inputs: It will show a large positiveproductivity component. Given Chipset’s strategy of cost leadership, we expect theincrease in operating income to be attributable to the productivity and growth compo-nents, not to price recovery. We now examine these three components in detail.
Growth Component of Change in Operating IncomeThe growth component of the change in operating income measures the increase in rev-enues minus the increase in costs from selling more units of CX1 in 2011 (1,150,000 units)than in 2010 (1,000,000 units), assuming nothing else has changed.
Revenue Effect of Growth
This component is favorable (F) because the increase in output sold in 2011 increasesoperating income. Components that decrease operating income are unfavorable (U).
= $3,450,000 F
= (1,150,000 units - 1,000,000 units) * $23 per unit
Revenue effectof growth
= £Actual units ofoutput sold
in 2011-
Actual units ofoutput sold
in 2010≥ *
Sellingprice
in 2010
2010 2011Revenues
($23 per unit 1,000,000 units; $22 per unit 1,150,000 units)** $23,000,000 $25,300,000Costs
Direct material costs($1.40/sq. cm. 3,000,000 sq. cm.; $1.50/sq. cm. 2,900,000 sq. cm.)** 4,200,000 4,350,000
Conversion costs($4.28/sq. cm. 3,750,000 sq. cm.; $4.35/sq. cm. 3,500,000 sq. cm.)** ƒ16,050,000 ƒ15,225,000
Total costs ƒ20,250,000 ƒ19,575,000Operating income $ƒ2,750,000 $ƒ5,725,000Change in operating income $2,975,000 F
Note that Chipset uses the 2010 price of CX1 and focuses only on the increase inunits sold between 2010 and 2011, because the revenue effect of growth componentmeasures how much revenues would have changed in 2010 if Chipset had sold1,150,000 units instead of 1,000,000 units.
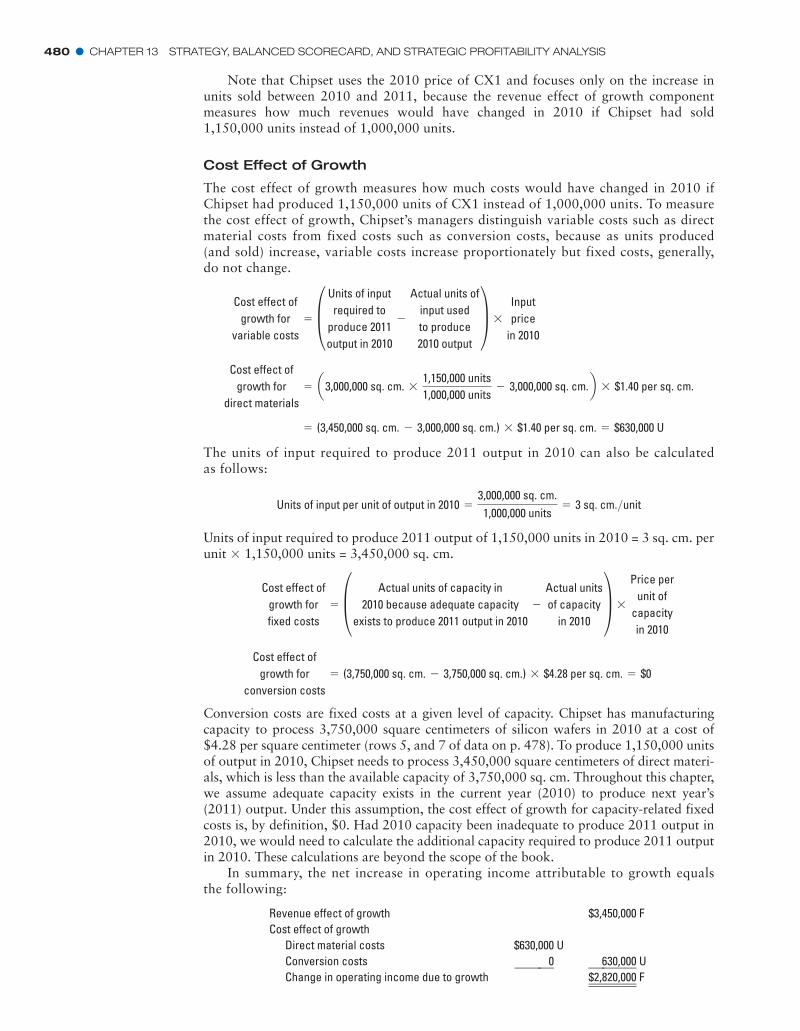
Cost Effect of Growth
The cost effect of growth measures how much costs would have changed in 2010 ifChipset had produced 1,150,000 units of CX1 instead of 1,000,000 units. To measurethe cost effect of growth, Chipset’s managers distinguish variable costs such as directmaterial costs from fixed costs such as conversion costs, because as units produced(and sold) increase, variable costs increase proportionately but fixed costs, generally,do not change.
The units of input required to produce 2011 output in 2010 can also be calculatedas follows:
Units of input required to produce 2011 output of 1,150,000 units in 2010 = 3 sq. cm. perunit 1,150,000 units = 3,450,000 sq. cm.
Conversion costs are fixed costs at a given level of capacity. Chipset has manufacturingcapacity to process 3,750,000 square centimeters of silicon wafers in 2010 at a cost of$4.28 per square centimeter (rows 5, and 7 of data on p. 478). To produce 1,150,000 unitsof output in 2010, Chipset needs to process 3,450,000 square centimeters of direct materi-als, which is less than the available capacity of 3,750,000 sq. cm. Throughout this chapter,we assume adequate capacity exists in the current year (2010) to produce next year’s(2011) output. Under this assumption, the cost effect of growth for capacity-related fixedcosts is, by definition, $0. Had 2010 capacity been inadequate to produce 2011 output in2010, we would need to calculate the additional capacity required to produce 2011 outputin 2010. These calculations are beyond the scope of the book.
In summary, the net increase in operating income attributable to growth equalsthe following:
Cost effect ofgrowth for
conversion costs= (3,750,000 sq. cm. - 3,750,000 sq. cm.) * $4.28 per sq. cm. = $0
Cost effect ofgrowth forfixed costs
= § Actual units of capacity in2010 because adequate capacity
exists to produce 2011 output in 2010-
Actual unitsof capacity
in 2010¥ *
Price perunit of
capacityin 2010
*
Units of input per unit of output in 2010 =3,000,000 sq. cm.1,000,000 units
= 3 sq. cm.>unit
= (3,450,000 sq. cm. - 3,000,000 sq. cm.) * $1.40 per sq. cm. = $630,000 U
Cost effect ofgrowth for
direct materials= a3,000,000 sq. cm. *
1,150,000 units1,000,000 units
- 3,000,000 sq. cm.b * $1.40 per sq. cm.
Cost effect ofgrowth for
variable costs= § Units of input
required toproduce 2011output in 2010
-
Actual units ofinput usedto produce2010 output
¥ *Inputprice
in 2010
480 � CHAPTER 13 STRATEGY, BALANCED SCORECARD, AND STRATEGIC PROFITABILITY ANALYSIS
Revenue effect of growth $3,450,000 FCost effect of growth
Direct material costs $630,000 UConversion costs ƒƒƒƒƒƒƒ0 ƒƒƒ630,000 UChange in operating income due to growth $2,820,000 F
STRATEGIC ANALYSIS OF OPERATING INCOME � 481
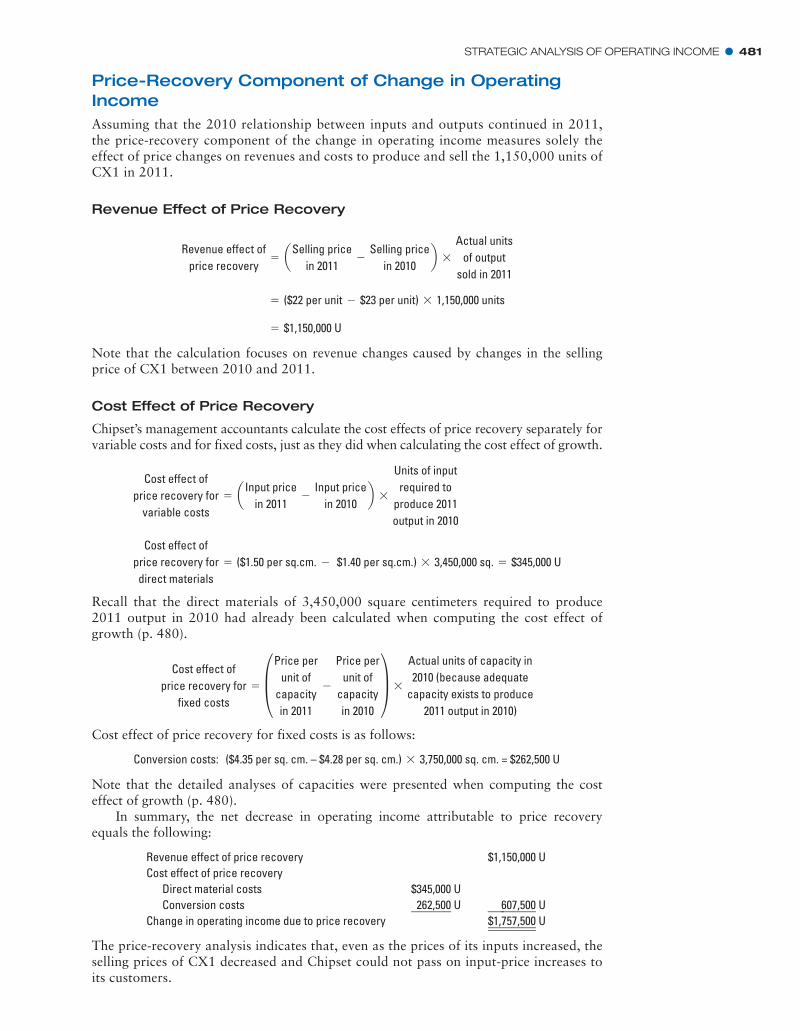
Price-Recovery Component of Change in OperatingIncomeAssuming that the 2010 relationship between inputs and outputs continued in 2011,the price-recovery component of the change in operating income measures solely theeffect of price changes on revenues and costs to produce and sell the 1,150,000 units ofCX1 in 2011.
Revenue Effect of Price Recovery
Note that the calculation focuses on revenue changes caused by changes in the sellingprice of CX1 between 2010 and 2011.
Cost Effect of Price Recovery
Chipset’s management accountants calculate the cost effects of price recovery separately forvariable costs and for fixed costs, just as they did when calculating the cost effect of growth.
Recall that the direct materials of 3,450,000 square centimeters required to produce2011 output in 2010 had already been calculated when computing the cost effect ofgrowth (p. 480).
Cost effect of price recovery for fixed costs is as follows:
Cost effect ofprice recovery for
fixed costs= §Price per
unit ofcapacityin 2011
-
Price perunit of
capacityin 2010
¥ *
Actual units of capacity in2010 (because adequate
capacity exists to produce2011 output in 2010)
Cost effect ofprice recovery for
direct materials= ($1.50 per sq.cm. - $1.40 per sq.cm.) * 3,450,000 sq. = $345,000 U
Cost effect ofprice recovery for
variable costs= a Input price
in 2011-
Input pricein 2010
b *
Units of inputrequired to
produce 2011output in 2010
= $1,150,000 U
= ($22 per unit - $23 per unit) * 1,150,000 units
Revenue effect ofprice recovery
= aSelling pricein 2011
-Selling price
in 2010b *
Actual unitsof output
sold in 2011
Conversion costs: ($4.35 per sq. cm. – $4.28 per sq. cm.) 3,750,000 sq. cm. = $262,500 U*
Note that the detailed analyses of capacities were presented when computing the costeffect of growth (p. 480).
In summary, the net decrease in operating income attributable to price recoveryequals the following:
Revenue effect of price recovery $1,150,000 UCost effect of price recovery
Direct material costs $345,000 UConversion costs ƒ262,500 U ƒƒƒ607,500 U
Change in operating income due to price recovery $1,757,500 U
The price-recovery analysis indicates that, even as the prices of its inputs increased, theselling prices of CX1 decreased and Chipset could not pass on input-price increases toits customers.
482 � CHAPTER 13 STRATEGY, BALANCED SCORECARD, AND STRATEGIC PROFITABILITY ANALYSIS
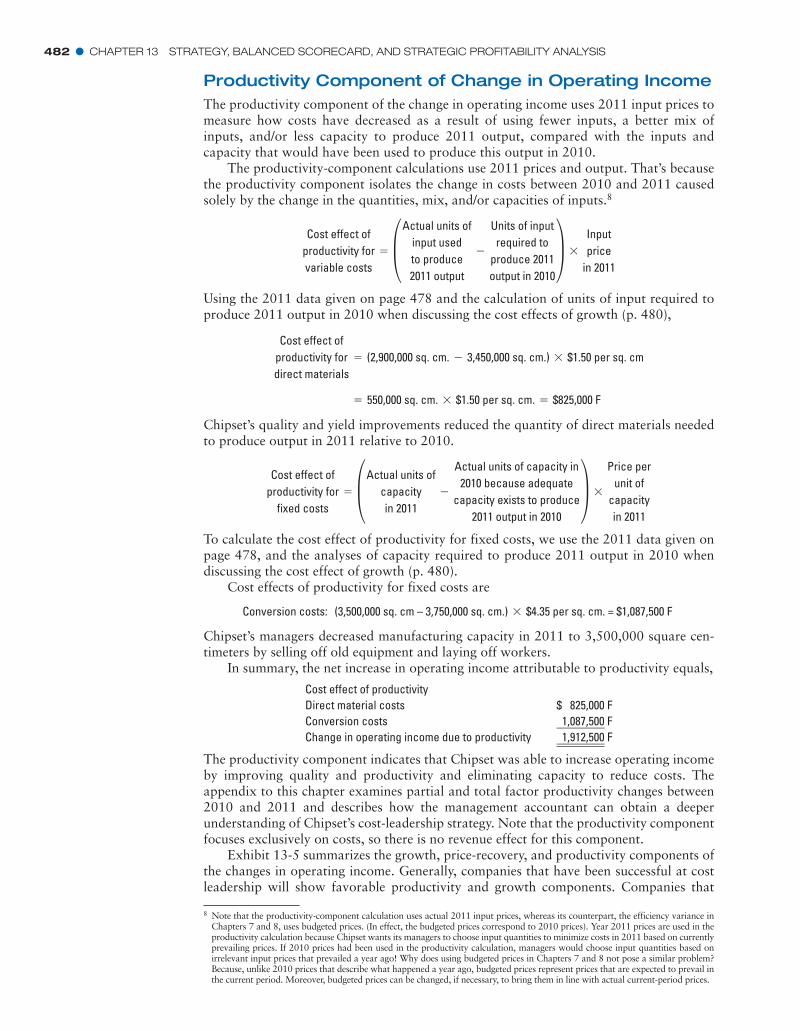
Productivity Component of Change in Operating IncomeThe productivity component of the change in operating income uses 2011 input prices tomeasure how costs have decreased as a result of using fewer inputs, a better mix ofinputs, and/or less capacity to produce 2011 output, compared with the inputs andcapacity that would have been used to produce this output in 2010.
The productivity-component calculations use 2011 prices and output. That’s becausethe productivity component isolates the change in costs between 2010 and 2011 causedsolely by the change in the quantities, mix, and/or capacities of inputs.8
Using the 2011 data given on page 478 and the calculation of units of input required toproduce 2011 output in 2010 when discussing the cost effects of growth (p. 480),
Chipset’s quality and yield improvements reduced the quantity of direct materials neededto produce output in 2011 relative to 2010.
To calculate the cost effect of productivity for fixed costs, we use the 2011 data given onpage 478, and the analyses of capacity required to produce 2011 output in 2010 whendiscussing the cost effect of growth (p. 480).
Cost effects of productivity for fixed costs are
Cost effect ofproductivity for
fixed costs= §Actual units of
capacityin 2011
-
Actual units of capacity in2010 because adequate
capacity exists to produce2011 output in 2010
¥ *
Price perunit of
capacityin 2011
= 550,000 sq. cm. * $1.50 per sq. cm. = $825,000 F
Cost effect ofproductivity fordirect materials
= (2,900,000 sq. cm. - 3,450,000 sq. cm.) * $1.50 per sq. cm
Cost effect ofproductivity forvariable costs
= §Actual units ofinput usedto produce2011 output
-
Units of inputrequired to
produce 2011output in 2010
¥ *Inputprice
in 2011
8 Note that the productivity-component calculation uses actual 2011 input prices, whereas its counterpart, the efficiency variance inChapters 7 and 8, uses budgeted prices. (In effect, the budgeted prices correspond to 2010 prices). Year 2011 prices are used in theproductivity calculation because Chipset wants its managers to choose input quantities to minimize costs in 2011 based on currentlyprevailing prices. If 2010 prices had been used in the productivity calculation, managers would choose input quantities based onirrelevant input prices that prevailed a year ago! Why does using budgeted prices in Chapters 7 and 8 not pose a similar problem?Because, unlike 2010 prices that describe what happened a year ago, budgeted prices represent prices that are expected to prevail inthe current period. Moreover, budgeted prices can be changed, if necessary, to bring them in line with actual current-period prices.
Chipset’s managers decreased manufacturing capacity in 2011 to 3,500,000 square cen-timeters by selling off old equipment and laying off workers.
In summary, the net increase in operating income attributable to productivity equals,
The productivity component indicates that Chipset was able to increase operating incomeby improving quality and productivity and eliminating capacity to reduce costs. Theappendix to this chapter examines partial and total factor productivity changes between2010 and 2011 and describes how the management accountant can obtain a deeperunderstanding of Chipset’s cost-leadership strategy. Note that the productivity componentfocuses exclusively on costs, so there is no revenue effect for this component.
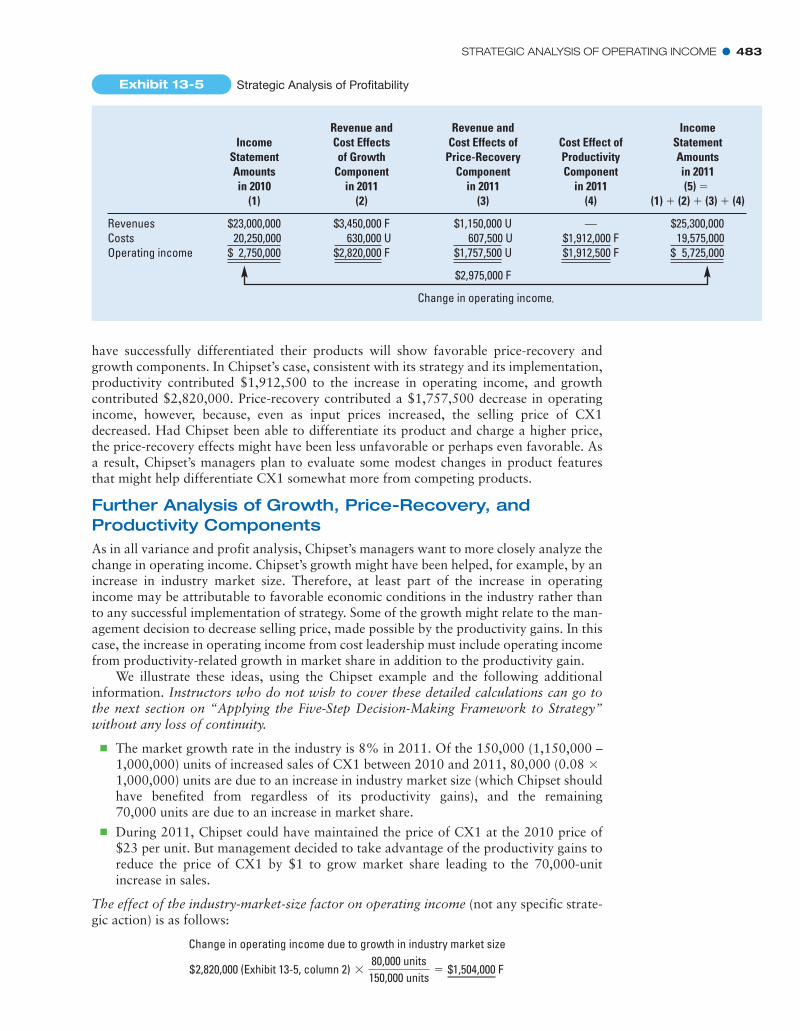
Exhibit 13-5 summarizes the growth, price-recovery, and productivity components ofthe changes in operating income. Generally, companies that have been successful at costleadership will show favorable productivity and growth components. Companies that
Conversion costs: (3,500,000 sq. cm – 3,750,000 sq. cm.) $4.35 per sq. cm. = $1,087,500 F*
Cost effect of productivityDirect material costs $ 825,000 FConversion costs ƒ1,087,500 FChange in operating income due to productivity ƒ1,912,500 F
STRATEGIC ANALYSIS OF OPERATING INCOME � 483
have successfully differentiated their products will show favorable price-recovery andgrowth components. In Chipset’s case, consistent with its strategy and its implementation,productivity contributed $1,912,500 to the increase in operating income, and growthcontributed $2,820,000. Price-recovery contributed a $1,757,500 decrease in operatingincome, however, because, even as input prices increased, the selling price of CX1decreased. Had Chipset been able to differentiate its product and charge a higher price,the price-recovery effects might have been less unfavorable or perhaps even favorable. Asa result, Chipset’s managers plan to evaluate some modest changes in product featuresthat might help differentiate CX1 somewhat more from competing products.
Further Analysis of Growth, Price-Recovery, andProductivity ComponentsAs in all variance and profit analysis, Chipset’s managers want to more closely analyze thechange in operating income. Chipset’s growth might have been helped, for example, by anincrease in industry market size. Therefore, at least part of the increase in operatingincome may be attributable to favorable economic conditions in the industry rather thanto any successful implementation of strategy. Some of the growth might relate to the man-agement decision to decrease selling price, made possible by the productivity gains. In thiscase, the increase in operating income from cost leadership must include operating incomefrom productivity-related growth in market share in addition to the productivity gain.
We illustrate these ideas, using the Chipset example and the following additionalinformation. Instructors who do not wish to cover these detailed calculations can go tothe next section on “Applying the Five-Step Decision-Making Framework to Strategy”without any loss of continuity.
� The market growth rate in the industry is 8% in 2011. Of the 150,000 (1,150,000 –1,000,000) units of increased sales of CX1 between 2010 and 2011, 80,000 (0.081,000,000) units are due to an increase in industry market size (which Chipset shouldhave benefited from regardless of its productivity gains), and the remaining70,000 units are due to an increase in market share.
� During 2011, Chipset could have maintained the price of CX1 at the 2010 price of$23 per unit. But management decided to take advantage of the productivity gains toreduce the price of CX1 by $1 to grow market share leading to the 70,000-unitincrease in sales.
The effect of the industry-market-size factor on operating income (not any specific strate-gic action) is as follows:
Change in operating income due to growth in industry market size
*
Revenue and Revenue and IncomeIncome Cost Effects Cost Effects of Cost Effect of Statement
Statement of Growth Price-Recovery Productivity AmountsAmounts Component Component Component in 2011in 2010 in 2011 in 2011 in 2011 (5) �
(1) (2) (3) (4) (1) � (2) � (3) � (4)
Revenues $23,000,000 $3,450,000 F $1,150,000 U — $25,300,000Costs 20,250,000 630,000 U 607,500 U $1,912,000 F 19,575,000Operating income $ 2,750,000 $2,820,000 F $1,757,500 U $1,912,500 F $ 5,725,000
$2,975,000 F
Change in operating income
Exhibit 13-5 Strategic Analysis of Profitability
$2,820,000 (Exhibit 13-5, column 2) *80,000 units
150,000 units= $1,504,000 F

484 � CHAPTER 13 STRATEGY, BALANCED SCORECARD, AND STRATEGIC PROFITABILITY ANALYSIS
Concepts in Action The Growth Versus Profitability Choiceat Facebook
Competitive advantage comes from product differentiation or costleadership. Successful implementation of these strategies helps a com-pany to be profitable and to grow. Many Internet start-ups pursue astrategy of short-run growth to build a customer base, with the goal oflater benefiting from such growth by either charging user fees or sus-taining a free service for users supported by advertisers. However, dur-ing the 1990s dot-com boom (and subsequent bust), the mostspectacular failures occurred in dot-com companies that followed the“get big fast” model but then failed to differentiate their products orreduce their costs.
Today, many social networking companies (Web-based commu-nities that connect friends, colleagues, and groups with shared interests) face this same challenge. At Facebook,the most notable of the social networking sites, users can create personal profiles that allow them to interact withfriends through messaging, chat, sharing Web site links, video clips, and more. Additionally, Facebook encour-ages other companies to build third-party programs, including games and surveys, for its Web site and mobileapplications on the iPhone and BlackBerry devices. From 2007 to 2010, Facebook grew from 12 million users tomore than 400 million users uploading photos, sharing updates, planning events, and playing games in theFacebook ecosystem.
During this phenomenal growth, the company wrestled with one key question: How could Facebook becomeprofitable? In 2009, experts estimate that Facebook had revenues of $635 million, mostly through advertising andthe sale of virtual gifts (as a private company, Facebook does not publicly disclose its financial information). But thecompany still did not turn a profit. Why not? To keep its global Web site and mobile applications operating,Facebook requires a massive amount of electricity, Internet bandwidth, and storage servers for digital files. In 2009,the company earmarked $100 million to buy 50,000 new servers, along with a new $2 million network storage sys-tem per week.
The cost structure of Facebook means that the company must generate tens of millions a month in revenue tosustain its operations over the long term. But how? Facebook has implemented the following popular methods ofonline revenue generation:
� Additional advertising: To grow its already significant advertising revenue, Facebook recently introduced“Fan Pages” for brands and companies seeking to communicate directly with its users. The company isalso working on a tool that will let users share information about their physical whereabouts via the site,which will allow Facebook to sell targeted advertisements for nearby businesses.
� Transactions: Facebook is also testing a feature that would expand Facebook Credits, its transactions plat-form that allows users to purchase games and gifts, into an Internet-wide “virtual currency,” that could beaccepted by any Web site integrating the Facebook Connect online identity management platform.Facebook currently gets a 30% cut of all transactions conducted through Facebook Credits.
Despite rampant rumors, Facebook has rejected the idea of charging monthly subscription fees for access to itsWeb site or for advanced features and premium content.
With increased growth around the world, Facebook anticipates 2010 revenues to exceed $1 billion. Despite theopportunity to become the “world’s richest twenty-something,” Facebook’s 25-year-old CEO Mark Zuckerberg hasthus far resisted taking the company public through an initial public offering (IPO). “A lot of companies can go offcourse because of corporate pressures,” says Mr. Zuckerberg. “I don’t know what we are going to be building fiveyears from now.” With his company’s focus on facilitating people’s ability to share almost any- and everything withanyone, at any time, via the Internet, mobile phones, and even videogames, Facebook expects to offer users a highlypersonal and differentiated online experience in the years ahead and expects that this product differentiation willdrive its future growth and profitability.
Sources: Vascellaro, Jessica E. 2010. Facebook CEO in no rush to ‘friend’ wall street. Wall Street Journal, March 3. http://online.wsj.com/article/SB10001424052748703787304575075942803630712.html; Eldon, Eric. 2010. Facebook revenues up to $700 million in 2009, on track towards$1.1 billion in 2010. Inside Facebook. Blog, March 2. http://www.insidefacebook.com/2010/03/02/facebook-made-up-to-700-million-in-2009-on-track-towards-1-1-billion-in-2010/; Arrington, Michael. 2010. Facebook may be growing too fast. And hitting the capital markets again. Tech Crunch. Blog,October 31. http://techcrunch.com/2010/10/31/facebooks-growing-problem/
APPLYING THE FIVE-STEP DECISION-MAKING FRAMEWORK TO STRATEGY � 485
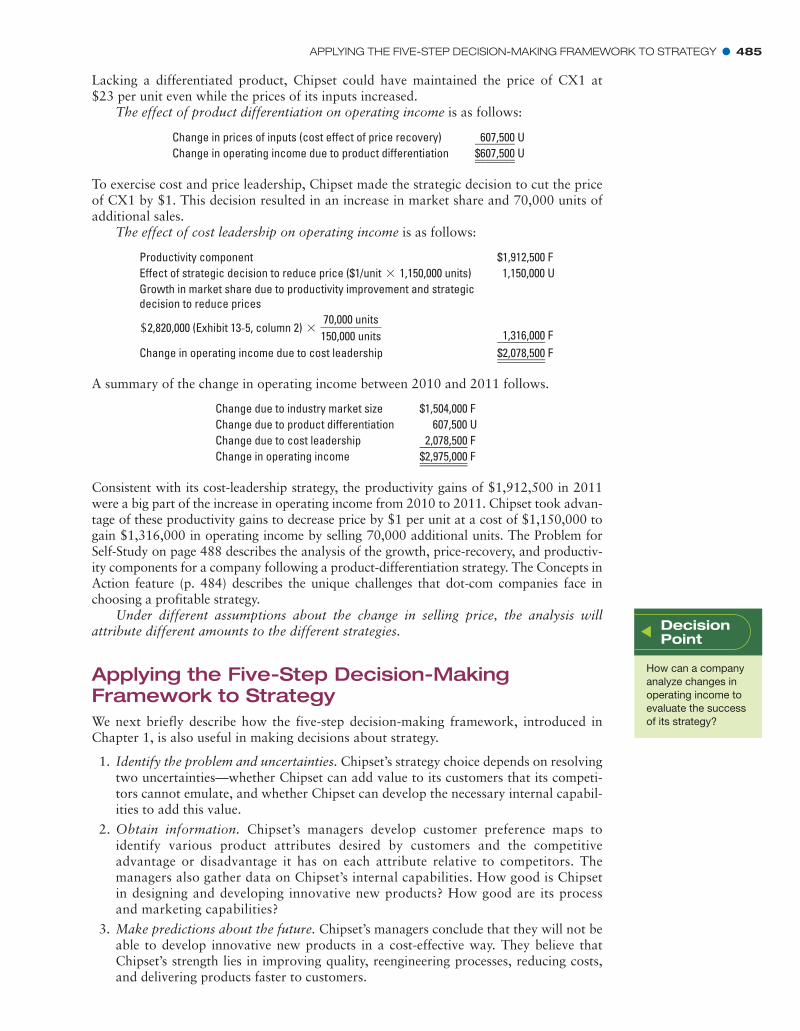
Lacking a differentiated product, Chipset could have maintained the price of CX1 at$23 per unit even while the prices of its inputs increased.
The effect of product differentiation on operating income is as follows:
To exercise cost and price leadership, Chipset made the strategic decision to cut the priceof CX1 by $1. This decision resulted in an increase in market share and 70,000 units ofadditional sales.
The effect of cost leadership on operating income is as follows:
Change in prices of inputs (cost effect of price recovery) ƒ607,500 UChange in operating income due to product differentiation $607,500 U
A summary of the change in operating income between 2010 and 2011 follows.
Consistent with its cost-leadership strategy, the productivity gains of $1,912,500 in 2011were a big part of the increase in operating income from 2010 to 2011. Chipset took advan-tage of these productivity gains to decrease price by $1 per unit at a cost of $1,150,000 togain $1,316,000 in operating income by selling 70,000 additional units. The Problem forSelf-Study on page 488 describes the analysis of the growth, price-recovery, and productiv-ity components for a company following a product-differentiation strategy. The Concepts inAction feature (p. 484) describes the unique challenges that dot-com companies face inchoosing a profitable strategy.
Under different assumptions about the change in selling price, the analysis willattribute different amounts to the different strategies.
Applying the Five-Step Decision-MakingFramework to StrategyWe next briefly describe how the five-step decision-making framework, introduced inChapter 1, is also useful in making decisions about strategy.
1. Identify the problem and uncertainties. Chipset’s strategy choice depends on resolvingtwo uncertainties—whether Chipset can add value to its customers that its competi-tors cannot emulate, and whether Chipset can develop the necessary internal capabil-ities to add this value.
2. Obtain information. Chipset’s managers develop customer preference maps toidentify various product attributes desired by customers and the competitiveadvantage or disadvantage it has on each attribute relative to competitors. Themanagers also gather data on Chipset’s internal capabilities. How good is Chipsetin designing and developing innovative new products? How good are its processand marketing capabilities?
3. Make predictions about the future. Chipset’s managers conclude that they will not beable to develop innovative new products in a cost-effective way. They believe thatChipset’s strength lies in improving quality, reengineering processes, reducing costs,and delivering products faster to customers.
Productivity component $1,912,500 FEffect of strategic decision to reduce price ($1/unit 1,150,000 units)* 1,150,000 UGrowth in market share due to productivity improvement and strategicdecision to reduce prices
$2,820,000 (Exhibit 13-5, column 2) *70,000 units
150,000 units ƒ1,316,000 FChange in operating income due to cost leadership $2,078,500 F
Change due to industry market size $1,504,000 FChange due to product differentiation 607,500 UChange due to cost leadership ƒ2,078,500 FChange in operating income $2,975,000 F
DecisionPoint
How can a companyanalyze changes inoperating income toevaluate the successof its strategy?

4. Make decisions by choosing among alternatives. Chipset’s management decides tofollow a cost leadership rather than a product differentiation strategy. It decides tointroduce a balanced scorecard to align and measure its quality improvement andprocess reengineering efforts.
5. Implement the decision, evaluate performance, and learn. On its balanced scorecard,Chipset’s managers compare actual and targeted performance and evaluate possiblecause-and-effect relationships. They learn, for example, that increasing the percent-age of processes with advanced controls improves yield. As a result, just as they hadanticipated, productivity and growth initiatives result in increases in operatingincome in 2011. The one change Chipset’s managers plan for 2012 is to make modestchanges in product features that might help differentiate CX1 somewhat from com-peting products. In this way, feedback and learning help in the development of futurestrategies and implementation plans.
Downsizing and the Management of ProcessingCapacityAs we saw in our discussion of the productivity component, fixed costs are tied tocapacity. Unlike variable costs, fixed costs do not change automatically with changesin activity level (for example, fixed conversion costs do not change with changes inthe quantity of silicon wafers started into production). How then can managersreduce capacity-based fixed costs? By measuring and managing unused capacity.Unused capacity is the amount of productive capacity available over and above theproductive capacity employed to meet consumer demand in the current period. Tounderstand unused capacity, it is necessary to distinguish engineered costs fromdiscretionary costs.
Engineered and Discretionary CostsEngineered costs result from a cause-and-effect relationship between the cost driver—output—and the (direct or indirect) resources used to produce that output. Engineeredcosts have a detailed, physically observable, and repetitive relationship with output. Inthe Chipset example, direct material costs are direct engineered costs. Conversion costsare an example of indirect engineered costs. Consider 2011. The output of 1,150,000 unitsof CX1 and the efficiency with which inputs are converted into outputs result in2,900,000 square centimeters of silicon wafers being started into production.Manufacturing-conversion-cost resources used equal $12,615,000 ($4.35 per sq. cm.2,900,000 sq. cm.), but actual conversion costs ($15,225,000) are higher becauseChipset has manufacturing capacity to process 3,500,000 square centimeters of siliconwafer ($4.35 per sq. cm. 3,500,000 sq. cm. = $15,225,000). Although these costsare fixed in the short run, over the long run there is a cause-and-effect relationshipbetween output and manufacturing capacity required (and conversion costs needed). Inthe long run, Chipset will try to match its capacity to its needs.
Discretionary costs have two important features: (1) They arise from periodic (usu-ally annual) decisions regarding the maximum amount to be incurred, and (2) theyhave no measurable cause-and-effect relationship between output and resources used.There is often a delay between when a resource is acquired and when it is used.Examples of discretionary costs include advertising, executive training, R&D, andcorporate-staff department costs such as legal, human resources, and public relations.Unlike engineered costs, the relationship between discretionary costs and output is ablackbox because it is nonrepetitive and nonroutine. A noteworthy aspect of discre-tionary costs is that managers are seldom confident that the “correct” amounts arebeing spent. The founder of Lever Brothers, an international consumer-products
*
*
486 � CHAPTER 13 STRATEGY, BALANCED SCORECARD, AND STRATEGIC PROFITABILITY ANALYSIS
LearningObjective 5
Identify unused capacity
. . . capacity availableminus capacity used forengineered costs butdifficult to determine fordiscretionary costs
and how to manage it
. . . downsize to reducecapacity
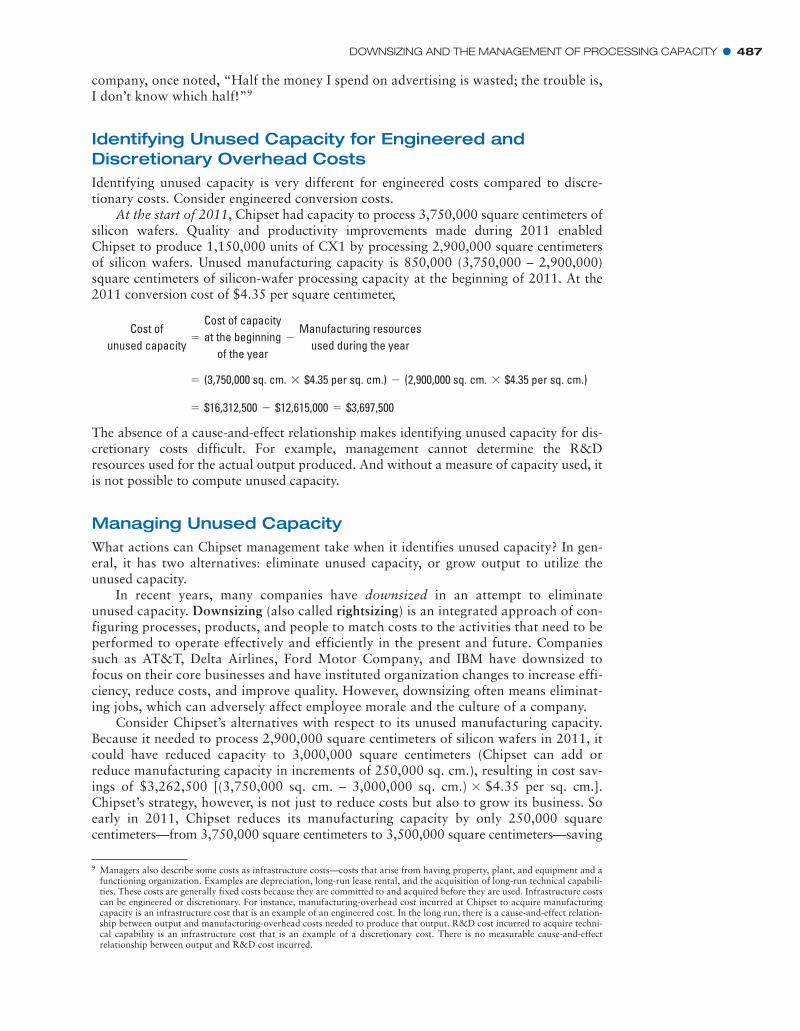
DOWNSIZING AND THE MANAGEMENT OF PROCESSING CAPACITY � 487
company, once noted, “Half the money I spend on advertising is wasted; the trouble is,I don’t know which half!”9
Identifying Unused Capacity for Engineered andDiscretionary Overhead CostsIdentifying unused capacity is very different for engineered costs compared to discre-tionary costs. Consider engineered conversion costs.
At the start of 2011, Chipset had capacity to process 3,750,000 square centimeters ofsilicon wafers. Quality and productivity improvements made during 2011 enabledChipset to produce 1,150,000 units of CX1 by processing 2,900,000 square centimetersof silicon wafers. Unused manufacturing capacity is 850,000 (3,750,000 – 2,900,000)square centimeters of silicon-wafer processing capacity at the beginning of 2011. At the2011 conversion cost of $4.35 per square centimeter,
The absence of a cause-and-effect relationship makes identifying unused capacity for dis-cretionary costs difficult. For example, management cannot determine the R&Dresources used for the actual output produced. And without a measure of capacity used, itis not possible to compute unused capacity.
Managing Unused CapacityWhat actions can Chipset management take when it identifies unused capacity? In gen-eral, it has two alternatives: eliminate unused capacity, or grow output to utilize theunused capacity.
In recent years, many companies have downsized in an attempt to eliminateunused capacity. Downsizing (also called rightsizing) is an integrated approach of con-figuring processes, products, and people to match costs to the activities that need to beperformed to operate effectively and efficiently in the present and future. Companiessuch as AT&T, Delta Airlines, Ford Motor Company, and IBM have downsized tofocus on their core businesses and have instituted organization changes to increase effi-ciency, reduce costs, and improve quality. However, downsizing often means eliminat-ing jobs, which can adversely affect employee morale and the culture of a company.
Consider Chipset’s alternatives with respect to its unused manufacturing capacity.Because it needed to process 2,900,000 square centimeters of silicon wafers in 2011, itcould have reduced capacity to 3,000,000 square centimeters (Chipset can add orreduce manufacturing capacity in increments of 250,000 sq. cm.), resulting in cost sav-ings of $3,262,500 [(3,750,000 sq. cm. – 3,000,000 sq. cm.) $4.35 per sq. cm.].Chipset’s strategy, however, is not just to reduce costs but also to grow its business. Soearly in 2011, Chipset reduces its manufacturing capacity by only 250,000 squarecentimeters—from 3,750,000 square centimeters to 3,500,000 square centimeters—saving
*
= $16,312,500 - $12,615,000 = $3,697,500
= (3,750,000 sq. cm. * $4.35 per sq. cm.) - (2,900,000 sq. cm. * $4.35 per sq. cm.)
Cost ofunused capacity
=Cost of capacityat the beginning
of the year-
Manufacturing resourcesused during the year
9 Managers also describe some costs as infrastructure costs—costs that arise from having property, plant, and equipment and afunctioning organization. Examples are depreciation, long-run lease rental, and the acquisition of long-run technical capabili-ties. These costs are generally fixed costs because they are committed to and acquired before they are used. Infrastructure costscan be engineered or discretionary. For instance, manufacturing-overhead cost incurred at Chipset to acquire manufacturingcapacity is an infrastructure cost that is an example of an engineered cost. In the long run, there is a cause-and-effect relation-ship between output and manufacturing-overhead costs needed to produce that output. R&D cost incurred to acquire techni-cal capability is an infrastructure cost that is an example of a discretionary cost. There is no measurable cause-and-effectrelationship between output and R&D cost incurred.
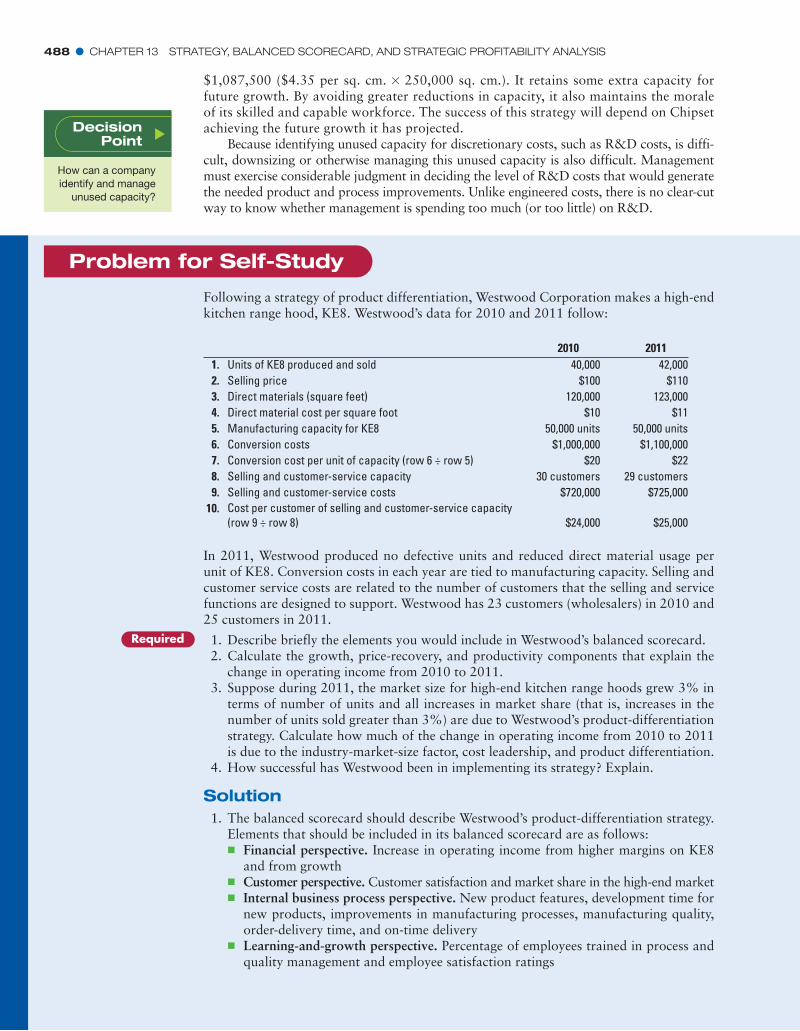
488 � CHAPTER 13 STRATEGY, BALANCED SCORECARD, AND STRATEGIC PROFITABILITY ANALYSIS
$1,087,500 ($4.35 per sq. cm. 250,000 sq. cm.). It retains some extra capacity forfuture growth. By avoiding greater reductions in capacity, it also maintains the moraleof its skilled and capable workforce. The success of this strategy will depend on Chipsetachieving the future growth it has projected.
Because identifying unused capacity for discretionary costs, such as R&D costs, is diffi-cult, downsizing or otherwise managing this unused capacity is also difficult. Managementmust exercise considerable judgment in deciding the level of R&D costs that would generatethe needed product and process improvements. Unlike engineered costs, there is no clear-cutway to know whether management is spending too much (or too little) on R&D.
*
Following a strategy of product differentiation, Westwood Corporation makes a high-endkitchen range hood, KE8. Westwood’s data for 2010 and 2011 follow:
Problem for Self-Study
2010 20111. Units of KE8 produced and sold 40,000 42,0002. Selling price $100 $1103. Direct materials (square feet) 120,000 123,0004. Direct material cost per square foot $10 $115. Manufacturing capacity for KE8 50,000 units 50,000 units6. Conversion costs $1,000,000 $1,100,0007. Conversion cost per unit of capacity (row 6 ÷ row 5) $20 $228. Selling and customer-service capacity 30 customers 29 customers9. Selling and customer-service costs $720,000 $725,000
10. Cost per customer of selling and customer-service capacity(row 9 ÷ row 8) $24,000 $25,000
In 2011, Westwood produced no defective units and reduced direct material usage perunit of KE8. Conversion costs in each year are tied to manufacturing capacity. Selling andcustomer service costs are related to the number of customers that the selling and servicefunctions are designed to support. Westwood has 23 customers (wholesalers) in 2010 and25 customers in 2011.
Required 1. Describe briefly the elements you would include in Westwood’s balanced scorecard.2. Calculate the growth, price-recovery, and productivity components that explain the
change in operating income from 2010 to 2011.3. Suppose during 2011, the market size for high-end kitchen range hoods grew 3% in
terms of number of units and all increases in market share (that is, increases in thenumber of units sold greater than 3%) are due to Westwood’s product-differentiationstrategy. Calculate how much of the change in operating income from 2010 to 2011is due to the industry-market-size factor, cost leadership, and product differentiation.
4. How successful has Westwood been in implementing its strategy? Explain.
Solution1. The balanced scorecard should describe Westwood’s product-differentiation strategy.
Elements that should be included in its balanced scorecard are as follows:� Financial perspective. Increase in operating income from higher margins on KE8
and from growth� Customer perspective. Customer satisfaction and market share in the high-end market� Internal business process perspective. New product features, development time for
new products, improvements in manufacturing processes, manufacturing quality,order-delivery time, and on-time delivery
� Learning-and-growth perspective. Percentage of employees trained in process andquality management and employee satisfaction ratings
DecisionPoint
How can a companyidentify and manage
unused capacity?

PROBLEM FOR SELF-STUDY � 489
2. Operating income for each year is as follows:
2010 2011Revenues
($100 per unit 40,000 units; $110 per unit 42,000 units)** $4,000,000 $4,620,000Costs
Direct material costs($10 per sq. ft. 120,000 sq. ft.; $11 per sq. ft. 123,000 sq. ft.)** 1,200,000 1,353,000
Conversion costs($20 per unit 50,000 units; $22 per unit 50,000 units)** 1,000,000 1,100,000
Selling and customer-service cost($24,000 per customer 30 customers;*$25,000 per customer 29 customers)* ƒƒƒ720,000 ƒƒƒ725,000Total costs ƒ2,920,000 ƒ3,178,000
Operating income $1,080,000 $1,442,000Change in operating income $362,000 F
Growth Component of Operating Income Change
Cost effects of growth for fixed costs are as follows:
In summary, the net increase in operating income attributable to growth equalsthe following:
Selling and customer-service costs: (30 customers - 30 customers) * $24,000 per customer = $0
Conversion costs: (50,000 units - 50,000 units) * $20 per unit = $0
Cost effectof growth forfixed costs
= £ Actual units of capacity in2010, because adequate capacity
exists to produce 2011 output in 2010-
Actual unitsof capacity
in 2010≥ *
Price perunit of
capacityin 2010
= (126,000 sq. ft. - 120,000 sq. ft.) * $10 per sq. ft. = $60,000 U
Cost effectof growth for
direct materials= a120,000 sq. ft. *
42,000 units40,000 units
- 120,000 sq. ft.b * $10 per sq. ft.
Cost effectof growth forvariable costs
= £ Units of inputrequired to produce2011 output in 2010
-Actual units of input
used to produce2010 output
≥ *Inputprice
in 2010
= (42,000 units - 40,000 units) * $100 per unit = $200,000 F
Revenue effectof growth
= £Actual units ofoutput sold
in 2011-
Actual units ofoutput sold
in 2010≥ *
Sellingprice
in 2010
Revenue effect of growth $200,000 FCost effect of growth
Direct material costs $60,000 UConversion costs 0Selling and customer-service costs ƒƒƒƒƒƒ0 ƒƒ60,000 U
Change in operating income due to growth $140,000 F
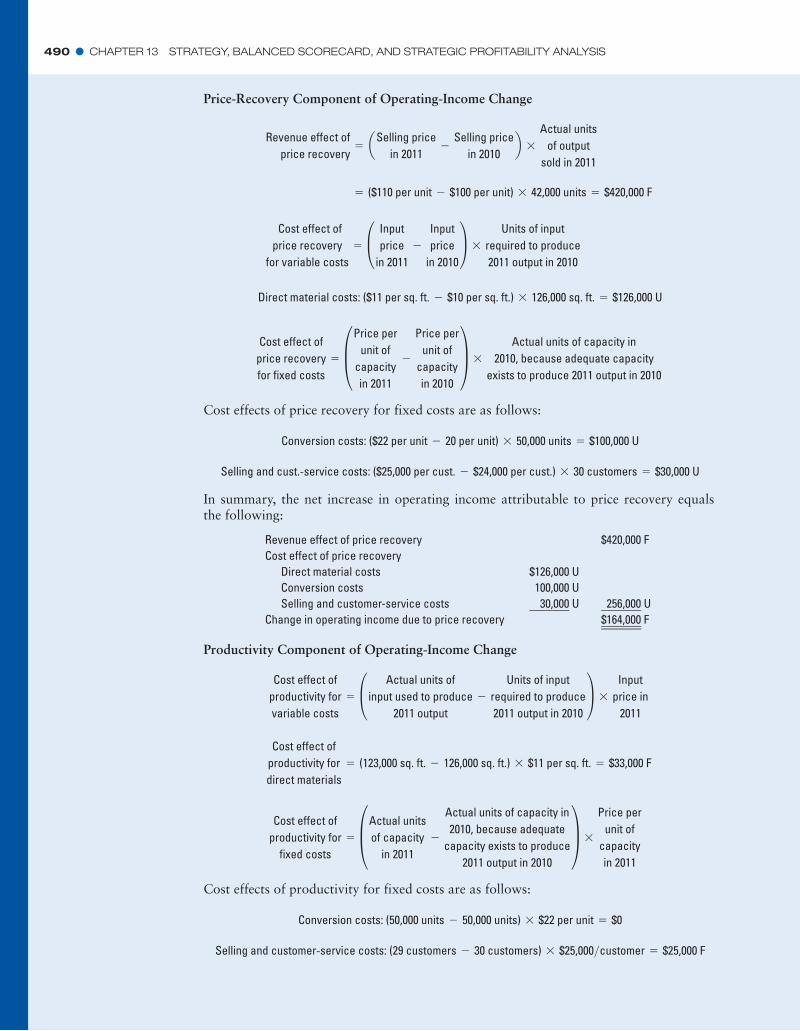
490 � CHAPTER 13 STRATEGY, BALANCED SCORECARD, AND STRATEGIC PROFITABILITY ANALYSIS
Price-Recovery Component of Operating-Income Change
Cost effects of price recovery for fixed costs are as follows:
In summary, the net increase in operating income attributable to price recovery equalsthe following:
Selling and cust.-service costs: ($25,000 per cust. - $24,000 per cust.) * 30 customers = $30,000 U
Conversion costs: ($22 per unit - 20 per unit) * 50,000 units = $100,000 U
Cost effect ofprice recoveryfor fixed costs
= §Price perunit of
capacityin 2011
-
Price perunit of
capacityin 2010
¥ *Actual units of capacity in
2010, because adequate capacityexists to produce 2011 output in 2010
Direct material costs: ($11 per sq. ft. - $10 per sq. ft.) * 126,000 sq. ft. = $126,000 U
Cost effect ofprice recovery
for variable costs= £ Input
pricein 2011
-Inputprice
in 2010≥ *
Units of inputrequired to produce2011 output in 2010
= ($110 per unit - $100 per unit) * 42,000 units = $420,000 F
Revenue effect ofprice recovery
= aSelling pricein 2011
-Selling price
in 2010b *
Actual unitsof output
sold in 2011
Revenue effect of price recovery $420,000 FCost effect of price recovery
Direct material costs $126,000 UConversion costs 100,000 USelling and customer-service costs ƒƒ30,000 U ƒ256,000 U
Change in operating income due to price recovery $164,000 F
Productivity Component of Operating-Income Change
Cost effects of productivity for fixed costs are as follows:
Selling and customer-service costs: (29 customers - 30 customers) * $25,000>customer = $25,000 F
Conversion costs: (50,000 units - 50,000 units) * $22 per unit = $0
Cost effect ofproductivity for
fixed costs= §Actual units
of capacityin 2011
-
Actual units of capacity in2010, because adequate
capacity exists to produce2011 output in 2010
¥ *
Price perunit of
capacityin 2011
Cost effect ofproductivity fordirect materials
= (123,000 sq. ft. - 126,000 sq. ft.) * $11 per sq. ft. = $33,000 F
Cost effect ofproductivity forvariable costs
= £ Actual units ofinput used to produce
2011 output-
Units of inputrequired to produce2011 output in 2010
≥ *Input
price in2011
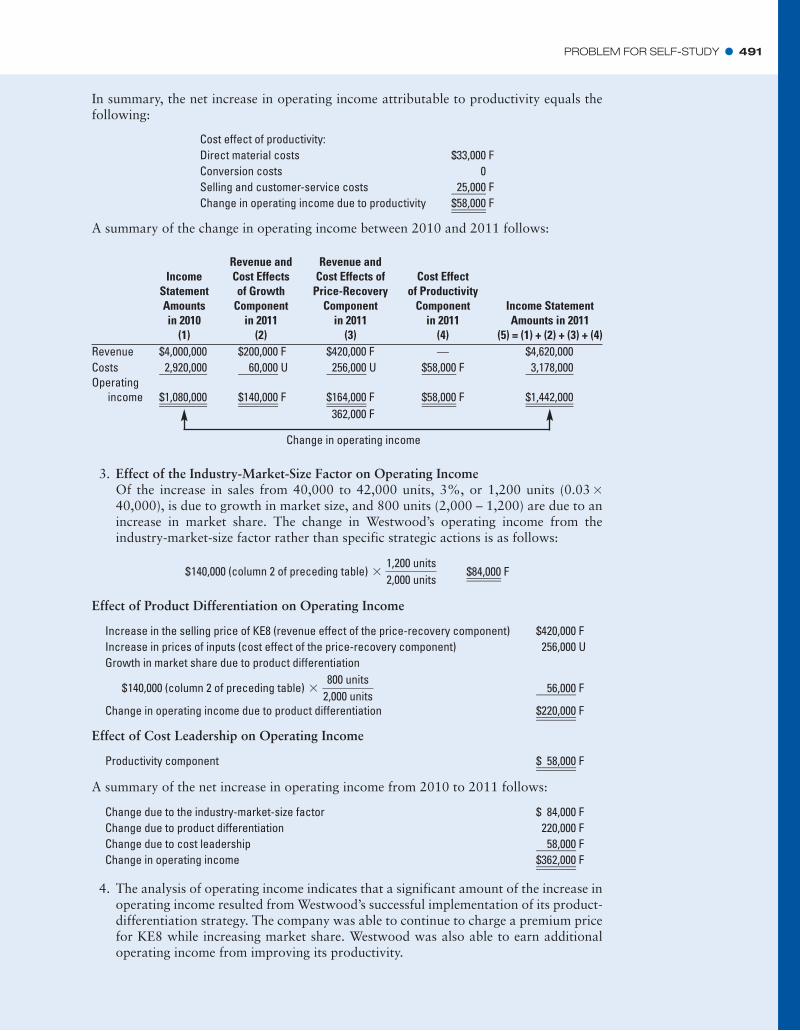
PROBLEM FOR SELF-STUDY � 491
In summary, the net increase in operating income attributable to productivity equals thefollowing:
3. Effect of the Industry-Market-Size Factor on Operating IncomeOf the increase in sales from 40,000 to 42,000 units, 3%, or 1,200 units (0.0340,000), is due to growth in market size, and 800 units (2,000 – 1,200) are due to anincrease in market share. The change in Westwood’s operating income from theindustry-market-size factor rather than specific strategic actions is as follows:
*
IncomeStatementAmountsin 2010
(1)
Revenue andCost Effects of Growth
Componentin 2011
(2)
Revenue andCost Effects of
Price-RecoveryComponent
in 2011 (3)
Cost Effect of Productivity
Componentin 2011
(4)
Income StatementAmounts in 2011
(5) = (1) + (2) + (3) + (4)Revenue $4,000,000 $200,000 F $420,000 F — $4,620,000Costs ƒ2,920,000 ƒƒ60,000 U ƒ256,000 U $58,000 F ƒ3,178,000Operating
income $1,080,000 $140,000 F $164,000 F $58,000 F $1,442,000362,000 F
Change in operating income
Effect of Product Differentiation on Operating Income
Effect of Cost Leadership on Operating Income
$140,000 (column 2 of preceding table) *1,200 units2,000 units
$84,000 F
Increase in the selling price of KE8 (revenue effect of the price-recovery component) $420,000 FIncrease in prices of inputs (cost effect of the price-recovery component) 256,000 UGrowth in market share due to product differentiation
$140,000 (column 2 of preceding table) *800 units
2,000 unitsƒƒ56,000 F
Change in operating income due to product differentiation $220,000 F
A summary of the net increase in operating income from 2010 to 2011 follows:
4. The analysis of operating income indicates that a significant amount of the increase inoperating income resulted from Westwood’s successful implementation of its product-differentiation strategy. The company was able to continue to charge a premium pricefor KE8 while increasing market share. Westwood was also able to earn additionaloperating income from improving its productivity.
Productivity component $ƒ58,000 F
Change due to the industry-market-size factor $ 84,000 FChange due to product differentiation 220,000 FChange due to cost leadership ƒƒ58,000 FChange in operating income $362,000 F
Cost effect of productivity:Direct material costs $33,000 FConversion costs 0Selling and customer-service costs ƒ25,000 FChange in operating income due to productivity $58,000 F
A summary of the change in operating income between 2010 and 2011 follows:
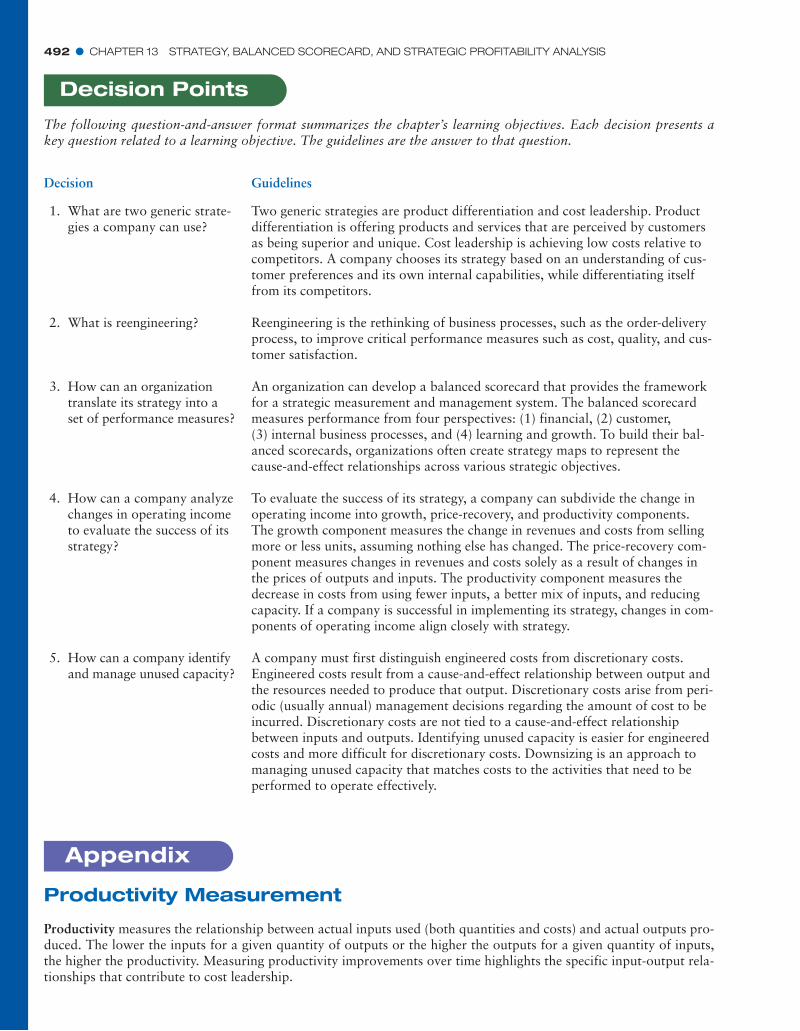
492 � CHAPTER 13 STRATEGY, BALANCED SCORECARD, AND STRATEGIC PROFITABILITY ANALYSIS
Decision Guidelines
1. What are two generic strate-gies a company can use?
Two generic strategies are product differentiation and cost leadership. Productdifferentiation is offering products and services that are perceived by customersas being superior and unique. Cost leadership is achieving low costs relative tocompetitors. A company chooses its strategy based on an understanding of cus-tomer preferences and its own internal capabilities, while differentiating itselffrom its competitors.
2. What is reengineering? Reengineering is the rethinking of business processes, such as the order-deliveryprocess, to improve critical performance measures such as cost, quality, and cus-tomer satisfaction.
3. How can an organizationtranslate its strategy into aset of performance measures?
An organization can develop a balanced scorecard that provides the frameworkfor a strategic measurement and management system. The balanced scorecardmeasures performance from four perspectives: (1) financial, (2) customer,(3) internal business processes, and (4) learning and growth. To build their bal-anced scorecards, organizations often create strategy maps to represent thecause-and-effect relationships across various strategic objectives.
4. How can a company analyzechanges in operating incometo evaluate the success of itsstrategy?
To evaluate the success of its strategy, a company can subdivide the change inoperating income into growth, price-recovery, and productivity components.The growth component measures the change in revenues and costs from sellingmore or less units, assuming nothing else has changed. The price-recovery com-ponent measures changes in revenues and costs solely as a result of changes inthe prices of outputs and inputs. The productivity component measures thedecrease in costs from using fewer inputs, a better mix of inputs, and reducingcapacity. If a company is successful in implementing its strategy, changes in com-ponents of operating income align closely with strategy.
5. How can a company identifyand manage unused capacity?
A company must first distinguish engineered costs from discretionary costs.Engineered costs result from a cause-and-effect relationship between output andthe resources needed to produce that output. Discretionary costs arise from peri-odic (usually annual) management decisions regarding the amount of cost to beincurred. Discretionary costs are not tied to a cause-and-effect relationshipbetween inputs and outputs. Identifying unused capacity is easier for engineeredcosts and more difficult for discretionary costs. Downsizing is an approach tomanaging unused capacity that matches costs to the activities that need to beperformed to operate effectively.
Decision Points
The following question-and-answer format summarizes the chapter’s learning objectives. Each decision presents akey question related to a learning objective. The guidelines are the answer to that question.
Productivity Measurement
Productivity measures the relationship between actual inputs used (both quantities and costs) and actual outputs pro-duced. The lower the inputs for a given quantity of outputs or the higher the outputs for a given quantity of inputs,the higher the productivity. Measuring productivity improvements over time highlights the specific input-output rela-tionships that contribute to cost leadership.
Appendix

APPENDIX � 493
Partial Productivity MeasuresPartial productivity, the most frequently used productivity measure, compares the quantity of output produced withthe quantity of an individual input used. In its most common form, partial productivity is expressed as a ratio:
The higher the ratio, the greater the productivity.Consider direct materials productivity at Chipset in 2011.
Note direct materials partial productivity ignores Chipset’s other input, manufacturing conversion capacity. Partial-productivity measures become more meaningful when comparisons are made that examine productivity changes overtime, either across different facilities or relative to a benchmark. Exhibit 13-6 presents partial-productivity measuresfor Chipset’s inputs for 2011 and the comparable 2010 inputs that would have been used to produce 2011 output,using information from the productivity-component calculations on page 482. These measures compare actualinputs used in 2011 to produce 1,150,000 units of CX1 with inputs that would have been used in 2011 had theinput–output relationship from 2010 continued in 2011.
Evaluating Changes in Partial ProductivitiesNote how the partial-productivity measures differ for variable-cost and fixed-cost components. For variable-cost ele-ments, such as direct materials, productivity improvements measure the reduction in input resources used to produceoutput (3,450,000 square centimeters of silicon wafers to 2,900,000 square centimeters). For fixed-cost elements suchas manufacturing conversion capacity, partial productivity measures the reduction in overall capacity from 2010 to2011 (3,750,000 square centimeters of silicon wafers to 3,500,000 square centimeters) regardless of the amount ofcapacity actually used in each period.
An advantage of partial-productivity measures is that they focus on a single input. As a result, they are simple tocalculate and easily understood by operations personnel. Managers and operators examine these numbers and try tounderstand the reasons for the productivity changes—such as, better training of workers, lower labor turnover, betterincentives, improved methods, or substitution of materials for labor. Isolating the relevant factors helps Chipset imple-ment and sustain these practices in the future.
For all their advantages, partial-productivity measures also have serious drawbacks. Because partial productivityfocuses on only one input at a time rather than on all inputs simultaneously, managers cannot evaluate the effect onoverall productivity, if (say) manufacturing-conversion-capacity partial productivity increases while direct materialspartial productivity decreases. Total factor productivity (TFP), or total productivity, is a measure of productivity thatconsiders all inputs simultaneously.
= 0.397 units of CX1 per sq. cm. of direct materials
=1,150,000 units of CX1
2,900,000 sq. cm. of direct materials
Direct materialspartial productivity
=Quantity of CX1 units produced during 2011
Quantity of direct materials used to produce CX1 in 2011
Partial productivity =Quantity of output produced
Quantity of input used
Comparable PartialPartial Productivity Based Percentage
Productivity on 2010 Input– ChangeInput in 2011 Output Relationships from 2010 to 2011
(1) (2) (3) (4)
Direct materials = 0.397 = 0.333 = 19.2%
Manufacturing= 0.329 = 0.307 = 7.2%conversion capacity
0 329 0 3070 307
. ..−1150 000
3 750 000, ,, ,
1150 0003 500 000, ,, ,
0 397 0 3330 333
. ..−1150 000
3 450 000, ,, ,
1150 0002 900 000, ,, ,
Exhibit 13-6 Comparing Chipset’s Partial Productivities in 2010 and 2011

494 � CHAPTER 13 STRATEGY, BALANCED SCORECARD, AND STRATEGIC PROFITABILITY ANALYSIS
Total Factor ProductivityTotal factor productivity (TFP) is the ratio of the quantity of output produced to the costs of all inputs used based oncurrent-period prices.
TFP considers all inputs simultaneously and the trade-offs across inputs based on current input prices. Do not thinkof all productivity measures as physical measures lacking financial content—how many units of output are producedper unit of input. TFP is intricately tied to minimizing total cost—a financial objective.
Calculating and Comparing Total Factor ProductivityWe first calculate Chipset’s TFP in 2011, using 2011 prices and 1,150,000 units of output produced (based on infor-mation from the first part of the productivity-component calculations on p. 482).
By itself, the 2011 TFP of 0.058748 units of CX1 per dollar of input costs is not particularly helpful. We need some-thing to compare the 2011 TFP against. One alternative is to compare TFPs of other similar companies in 2011.However, finding similar companies and obtaining accurate comparable data are often difficult. Companies, there-fore, usually compare their own TFPs over time. In the Chipset example, we use as a benchmark TFP calculated usingthe inputs that Chipset would have used in 2010 to produce 1,150,000 units of CX1 at 2011 prices (that is, we usethe costs calculated from the second part of the productivity-component calculations on p. 482). Why do we use 2011prices? Because using the current year’s prices in both calculations controls for input-price differences and focuses theanalysis on adjustments the manager made in quantities of inputs in response to changes in prices.
Using 2011 prices, TFP increased 9.8% [(058748 – 0.053519) ÷ 0.053519 = 0.098, or 9.8%] from 2010 to 2011.Note that the 9.8% increase in TFP also equals the $1,912,500 gain (Exhibit 13-5, column 4) divided by the$19,575,000 of actual costs incurred in 2011 (Exhibit 13-5, column 5). Total factor productivity increased becauseChipset produced more output per dollar of input cost in 2011 relative to 2010, measured in both years using 2011prices. The gain in TFP occurs because Chipset increases the partial productivities of individual inputs and, consistentwith its strategy, combines inputs to lower costs. Note that increases in TFP cannot be due to differences in inputprices because we used 2011 prices to evaluate both the inputs that Chipset would have used in 2010 to produce1,150,000 units of CX1 and the inputs actually used in 2011.
Using Partial and Total Factor Productivity MeasuresA major advantage of TFP is that it measures the combined productivity of all inputs used to produce output andexplicitly considers gains from using fewer physical inputs as well as substitution among inputs. Managers can ana-lyze these numbers to understand the reasons for changes in TFP—for example, better human resource managementpractices, higher quality of materials, or improved manufacturing methods.
= 0.053519 units of output per dollar of input cost
=1,150,000
$21,487,500
=1,150,000
(3,450,000 * $1.50) + (3,750,000 * $4.35)
BenchmarkTFP
=Quantity of output produced in 2011
Costs of inputs at 2011 prices that would have been used in 2010to produce 2011 output
= 0.058748 units of output per dollar of input cost
=1,150,000
$19,575,000
=1,150,000
(2,900,000 * $1.50) + (3,500,000 * $4.35)
Total factor productivityfor 2011 using 2011 prices
=Quantity of output produced in 2011
Costs of inputs used in 2011 based on 2011 prices
Total factor productivity =Quantity of output produced
Costs of all inputs used
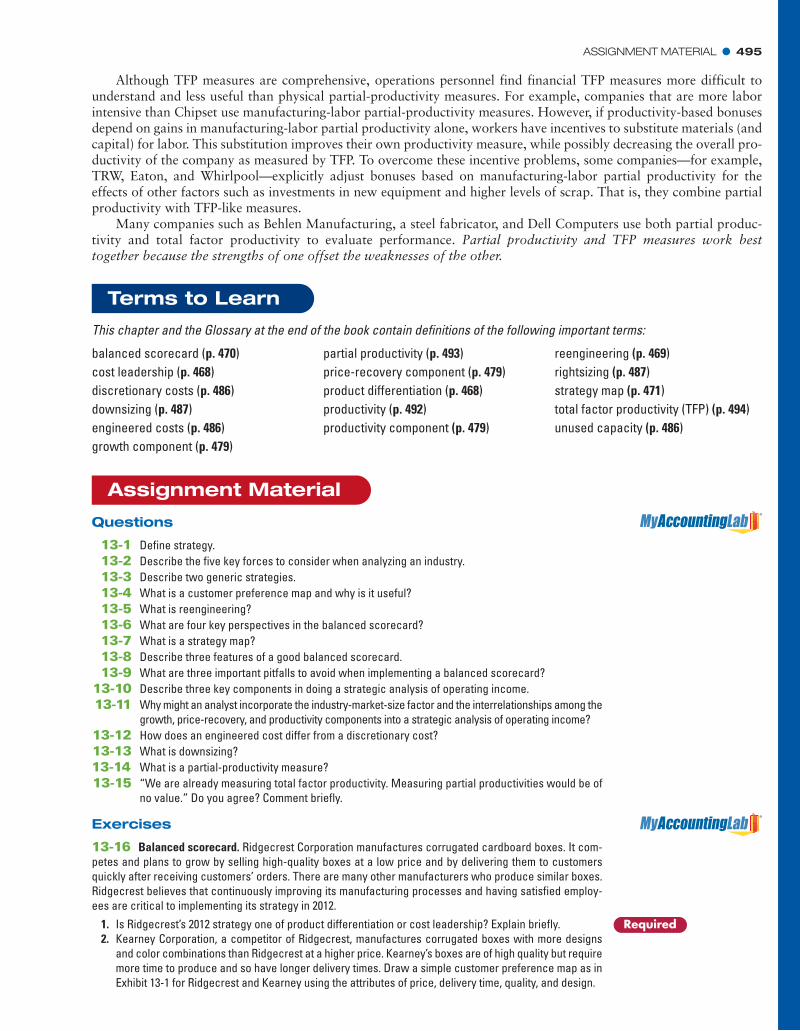
ASSIGNMENT MATERIAL � 495
Although TFP measures are comprehensive, operations personnel find financial TFP measures more difficult tounderstand and less useful than physical partial-productivity measures. For example, companies that are more laborintensive than Chipset use manufacturing-labor partial-productivity measures. However, if productivity-based bonusesdepend on gains in manufacturing-labor partial productivity alone, workers have incentives to substitute materials (andcapital) for labor. This substitution improves their own productivity measure, while possibly decreasing the overall pro-ductivity of the company as measured by TFP. To overcome these incentive problems, some companies—for example,TRW, Eaton, and Whirlpool—explicitly adjust bonuses based on manufacturing-labor partial productivity for theeffects of other factors such as investments in new equipment and higher levels of scrap. That is, they combine partialproductivity with TFP-like measures.
Many companies such as Behlen Manufacturing, a steel fabricator, and Dell Computers use both partial produc-tivity and total factor productivity to evaluate performance. Partial productivity and TFP measures work besttogether because the strengths of one offset the weaknesses of the other.
Terms to Learn
This chapter and the Glossary at the end of the book contain definitions of the following important terms:
balanced scorecard (p. 470)cost leadership (p. 468)discretionary costs (p. 486)downsizing (p. 487)engineered costs (p. 486)growth component (p. 479)
partial productivity (p. 493)price-recovery component (p. 479)product differentiation (p. 468)productivity (p. 492)productivity component (p. 479)
reengineering (p. 469)rightsizing (p. 487)strategy map (p. 471)total factor productivity (TFP) (p. 494)unused capacity (p. 486)
Assignment Material
Questions
13-1 Define strategy.13-2 Describe the five key forces to consider when analyzing an industry.13-3 Describe two generic strategies.13-4 What is a customer preference map and why is it useful?13-5 What is reengineering?13-6 What are four key perspectives in the balanced scorecard?13-7 What is a strategy map?13-8 Describe three features of a good balanced scorecard.13-9 What are three important pitfalls to avoid when implementing a balanced scorecard?
13-10 Describe three key components in doing a strategic analysis of operating income.13-11 Why might an analyst incorporate the industry-market-size factor and the interrelationships among the
growth, price-recovery, and productivity components into a strategic analysis of operating income?13-12 How does an engineered cost differ from a discretionary cost?13-13 What is downsizing?13-14 What is a partial-productivity measure?13-15 “We are already measuring total factor productivity. Measuring partial productivities would be of
no value.” Do you agree? Comment briefly.
Exercises
13-16 Balanced scorecard. Ridgecrest Corporation manufactures corrugated cardboard boxes. It com-petes and plans to grow by selling high-quality boxes at a low price and by delivering them to customersquickly after receiving customers’ orders. There are many other manufacturers who produce similar boxes.Ridgecrest believes that continuously improving its manufacturing processes and having satisfied employ-ees are critical to implementing its strategy in 2012.
Required1. Is Ridgecrest’s 2012 strategy one of product differentiation or cost leadership? Explain briefly.2. Kearney Corporation, a competitor of Ridgecrest, manufactures corrugated boxes with more designs
and color combinations than Ridgecrest at a higher price. Kearney’s boxes are of high quality but requiremore time to produce and so have longer delivery times. Draw a simple customer preference map as inExhibit 13-1 for Ridgecrest and Kearney using the attributes of price, delivery time, quality, and design.

496 � CHAPTER 13 STRATEGY, BALANCED SCORECARD, AND STRATEGIC PROFITABILITY ANALYSIS
3. Draw a strategy map as in Exhibit 13-2 with two strategic objectives you would expect to see undereach balanced scorecard perspective.
4. For each strategic objective indicate a measure you would expect to see in Ridgecrest’s balancedscorecard for 2012.
13-17 Analysis of growth, price-recovery, and productivity components (continuation of 13-16). Ananalysis of Ridgecrest’s operating-income changes between 2011 and 2012 shows the following:
Operating income for 2011 $1,850,000Add growth component 85,000Deduct price-recovery component (72,000)Add productivity component ƒƒƒ150,000Operating income for 2011 $2,013,000
The industry market size for corrugated cardboard boxes did not grow in 2012, input prices did not change,and Ridgecrest reduced the prices of its boxes.
2010 20111 Number of T-shirts purchased 200,000 250,0002 Number of T-shirts discarded 2,000 3,3003 Number of T-shirts sold (row 1 – row 2) 198,000 246,7004 Average selling price $25.00 $26.005 Average cost per T-shirt $10.00 $8.506 Administrative capacity (number of customers) 4,000 3,7507 Administrative costs $1,200,000 $1,162,5008 Administrative cost per customer (row 8 ÷ row 7) $300 $310
Administrative costs depend on the number of customers that Roberto has created capacity to support, noton the actual number of customers served. Roberto had 3,600 customers in 2010 and 3,500 customers in 2011.
Required 1. Was Ridgecrest’s gain in operating income in 2012 consistent with the strategy you identified inrequirement 1 of Exercise 13-16?
2. Explain the productivity component. In general, does it represent savings in only variable costs, onlyfixed costs, or both variable and fixed costs?
13-18 Strategy, balanced scorecard, merchandising operation. Roberto & Sons buys T-shirts in bulk,applies its own trendsetting silk-screen designs, and then sells the T-shirts to a number of retailers.Roberto wants to be known for its trendsetting designs, and it wants every teenager to be seen in a distinc-tive Roberto T-shirt. Roberto presents the following data for its first two years of operations, 2010 and 2011.
Required 1. Is Roberto ‘s strategy one of product differentiation or cost leadership? Explain briefly.2. Describe briefly the key measures Roberto should include in its balanced scorecard and the reasons it
should do so.
13-19 Strategic analysis of operating income (continuation of 13-18). Refer to Exercise 13-18.Required 1. Calculate Roberto‘s operating income in both 2010 and 2011.
2. Calculate the growth, price-recovery, and productivity components that explain the change in operat-ing income from 2010 to 2011.
3. Comment on your answers in requirement 2. What does each of these components indicate?
13-20 Analysis of growth, price-recovery, and productivity components (continuation of 13-19). Refer toExercise 13-19. Suppose that the market for silk-screened T-shirts grew by 10% during 2011. All increases insales greater than 10% are the result of Roberto’s strategic actions.
Required Calculate the change in operating income from 2010 to 2011 due to growth in market size, product differen-tiation, and cost leadership. How successful has Roberto been in implementing its strategy? Explain.
13-21 Identifying and managing unused capacity (continuation of 13-18). Refer to Exercise 13-18.
Required 1. Calculate the amount and cost of unused administrative capacity at the beginning of 2011, based on theactual number of customers Roberto served in 2011.
2. Suppose Roberto can only add or reduce administrative capacity in increments of 250 customers. Whatis the maximum amount of costs that Roberto can save in 2011 by downsizing administrative capacity?
3. What factors, other than cost, should Roberto consider before it downsizes administrative capacity?
13-22 Strategy, balanced scorecard. Stanmore Corporation makes a special-purpose machine, D4H, usedin the textile industry. Stanmore has designed the D4H machine for 2011 to be distinct from its competitors. Ithas been generally regarded as a superior machine. Stanmore presents the following data for 2010 and 2011.

ASSIGNMENT MATERIAL � 497
2010 20111. Units of D4H produced and sold 200 2102. Selling price $40,000 $42,0003. Direct materials (kilograms) 300,000 310,0004. Direct material cost per kilogram $8 $8.505. Manufacturing capacity in units of D4H 250 2506. Total conversion costs $2,000,000 $2,025,0007. Conversion cost per unit of capacity (row 6 ÷ row 5) $8,000 $8,1008. Selling and customer-service capacity 100 customers 95 customers9. Total selling and customer-service costs $1,000,000 $940,500
10. Selling and customer-service capacity cost per customer(row 9 ÷ row 8) $10,000 $9,900
Stanmore produces no defective machines, but it wants to reduce direct materials usage per D4H machinein 2011. Conversion costs in each year depend on production capacity defined in terms of D4H units that canbe produced, not the actual units produced. Selling and customer-service costs depend on the number ofcustomers that Stanmore can support, not the actual number of customers it serves. Stanmore has 75 cus-tomers in 2010 and 80 customers in 2011.
Required1. Is Stanmore’s strategy one of product differentiation or cost leadership? Explain briefly.2. Describe briefly key measures that you would include in Stanmore’s balanced scorecard and the rea-
sons for doing so.
13-23 Strategic analysis of operating income (continuation of 13-22). Refer to Exercise 13-22.
Required1. Calculate the operating income of Stanmore Corporation in 2010 and 2011.2. Calculate the growth, price-recovery, and productivity components that explain the change in operat-
ing income from 2010 to 2011.3. Comment on your answer in requirement 2. What do these components indicate?
13-24 Analysis of growth, price-recovery, and productivity components (continuation of 13-23).Suppose that during 2011, the market for Stanmore’s special-purpose machines grew by 3%. All increases inmarket share (that is, sales increases greater than 3%) are the result of Stanmore’s strategic actions.
RequiredCalculate how much of the change in operating income from 2010 to 2011 is due to the industry-market-sizefactor, product differentiation, and cost leadership. How successful has Stanmore been in implementing itsstrategy? Explain.
13-25 Identifying and managing unused capacity (continuation of 13-22). Refer to Exercise 13-22.
Required1. Calculate the amount and cost of (a) unused manufacturing capacity and (b) unused selling andcustomer-service capacity at the beginning of 2011 based on actual production and actual numberof customers served in 2011.
2. Suppose Stanmore can add or reduce its manufacturing capacity in increments of 30 units. What is themaximum amount of costs that Stanmore could save in 2011 by downsizing manufacturing capacity?
3. Stanmore, in fact, does not eliminate any of its unused manufacturing capacity. Why might Stanmorenot downsize?
13-26 Strategy, balanced scorecard, service company. Westlake Corporation is a small information-systems consulting firm that specializes in helping companies implement standard sales-management soft-ware. The market for Westlake’s services is very competitive. To compete successfully, Westlake mustdeliver quality service at a low cost. Westlake presents the following data for 2010 and 2011.
2010 20111. Number of jobs billed 60 702. Selling price per job $50,000 $48,0003. Software-implementation labor-hours 30,000 32,0004. Cost per software-implementation labor-hour $60 $635. Software-implementation support capacity (number of jobs it can do) 90 906. Total cost of software-implementation support $360,000 $369,0007. Software-implementation support-capacity cost per job (row 6 ÷ row 5) $4,000 $4,100
Software-implementation labor-hour costs are variable costs. Software-implementation support costs foreach year depend on the software-implementation support capacity Westlake chooses to maintain each year(that is the number of jobs it can do each year). It does not vary with the actual number of jobs done that year.

498 � CHAPTER 13 STRATEGY, BALANCED SCORECARD, AND STRATEGIC PROFITABILITY ANALYSIS
2010 20111. Units of Mini produced and sold 8,000 9,0002. Selling price $45 $433. Ounces of direct materials used 32,000 33,0004. Direct material cost per ounce $3.50 $3.505. Manufacturing capacity in units 12,000 11,0006. Total conversion costs $156,000 $143,0007. Conversion cost per unit of capacity (row 6 ÷ row 5) $13 $138. Selling and customer-service capacity 90 customers 90 customers9. Total selling and customer-service costs $45,000 $49,500
10. Selling and customer-service capacity cost per customer (row 9 ÷ row 8) $500 $550
Required 1. Is Westlake Corporation’s strategy one of product differentiation or cost leadership? Explain briefly.2. Describe key measures you would include in Westlake’s balanced scorecard and your reasons for
doing so.
13-27 Strategic analysis of operating income (continuation of 13-26). Refer to Exercise 13-26.
Required 1. Calculate the operating income of Westlake Corporation in 2010 and 2011.2. Calculate the growth, price-recovery, and productivity components that explain the change in operat-
ing income from 2010 to 2011.3. Comment on your answer in requirement 2. What do these components indicate?
13-28 Analysis of growth, price-recovery, and productivity components (continuation of 13-27).Suppose that during 2011 the market for implementing sales-management software increases by 5%.Assume that any decrease in selling price and any increase in market share more than 5% are the result ofstrategic choices by Westlake‘s management to implement its strategy.
Required Calculate how much of the change in operating income from 2010 to 2011 is due to the industry-market-sizefactor, product differentiation, and cost leadership. How successful has Westlake been in implementing itsstrategy? Explain.
13-29 Identifying and managing unused capacity (continuation of 13-26). Refer to Exercise 13-26.
Required 1. Calculate the amount and cost of unused software-implementation support capacity at the beginningof 2011, based on the number of jobs actually done in 2011.
2. Suppose Westlake can add or reduce its software-implementation support capacity in incrementsof 15 units. What is the maximum amount of costs that Westlake could save in 2011 by downsizingsoftware-implementation support capacity?
3. Westlake, in fact, does not eliminate any of its unused software-implementation support capacity. Whymight Westlake not downsize?
Problems
13-30 Balanced scorecard and strategy. Music Master Company manufactures an MP3 player calledthe Mini. The company sells the player to discount stores throughout the country. This player is significantlyless expensive than similar products sold by Music Master’s competitors, but the Mini offers just four giga-bytes of space, compared with eight offered by competitor Vantage Manufacturing. Furthermore, the Minihas experienced production problems that have resulted in significant rework costs. Vantage’s model hasan excellent reputation for quality, but is considerably more expensive.
Required 1. Draw a simple customer preference map for Music Master and Vantage using the attributes of price,quality, and storage capacity. Use the format of Exhibit 13-1.
2. Is Music Master’s current strategy that of product differentiation or cost leadership?3. Music Master would like to improve quality and decrease costs by improving processes and training
workers to reduce rework. Music Master’s managers believe the increased quality will increase sales.Draw a strategy map as in Exhibit 13-2 describing the cause-and-effect relationships among the strate-gic objectives you would expect to see in Music Master’s balanced scorecard.
4. For each strategic objective suggest a measure you would recommend in Music Master’s balancedscorecard.
13-31 Strategic analysis of operating income (continuation of 13-30). Refer to Problem 13-30. As a resultof the actions taken, quality has significantly improved in 2011 while rework and unit costs of the Mini havedecreased. Music Master has reduced manufacturing capacity because capacity is no longer needed tosupport rework. Music Master has also lowered the Mini’s selling price to gain market share and unit saleshave increased. Information about the current period (2011) and last period (2010) follows:
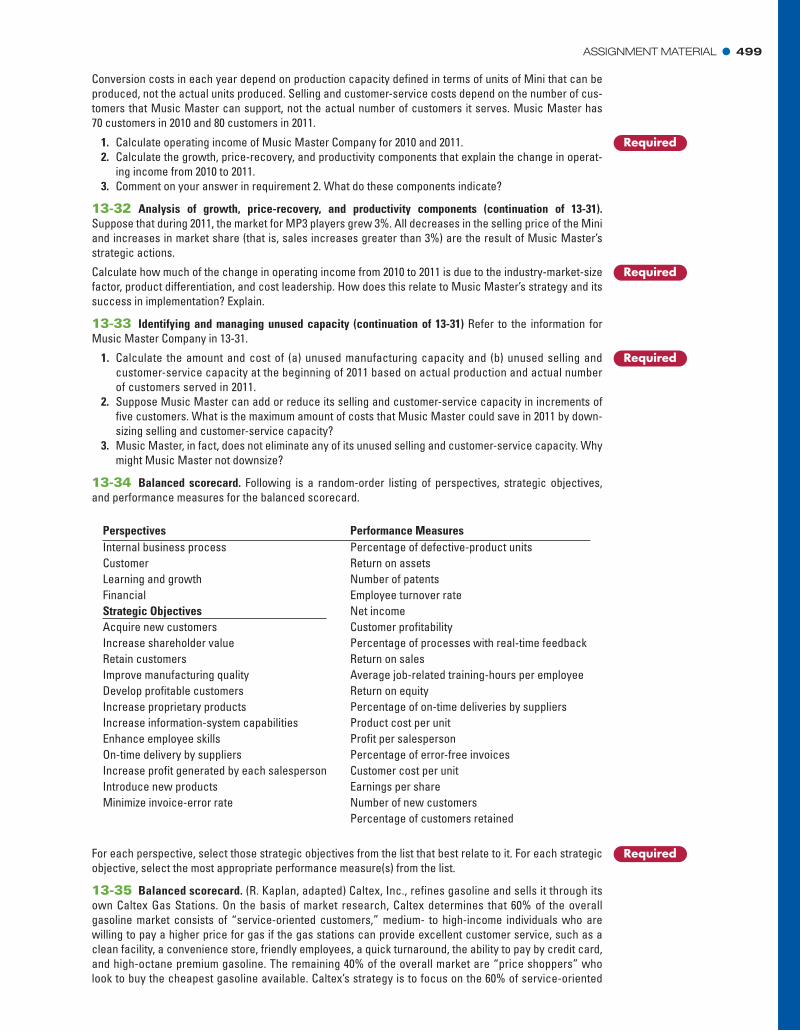
ASSIGNMENT MATERIAL � 499
Conversion costs in each year depend on production capacity defined in terms of units of Mini that can beproduced, not the actual units produced. Selling and customer-service costs depend on the number of cus-tomers that Music Master can support, not the actual number of customers it serves. Music Master has70 customers in 2010 and 80 customers in 2011.
Required1. Calculate operating income of Music Master Company for 2010 and 2011.2. Calculate the growth, price-recovery, and productivity components that explain the change in operat-
ing income from 2010 to 2011.3. Comment on your answer in requirement 2. What do these components indicate?
13-32 Analysis of growth, price-recovery, and productivity components (continuation of 13-31).Suppose that during 2011, the market for MP3 players grew 3%. All decreases in the selling price of the Miniand increases in market share (that is, sales increases greater than 3%) are the result of Music Master’sstrategic actions.
RequiredCalculate how much of the change in operating income from 2010 to 2011 is due to the industry-market-sizefactor, product differentiation, and cost leadership. How does this relate to Music Master’s strategy and itssuccess in implementation? Explain.
13-33 Identifying and managing unused capacity (continuation of 13-31) Refer to the information forMusic Master Company in 13-31.
Required1. Calculate the amount and cost of (a) unused manufacturing capacity and (b) unused selling andcustomer-service capacity at the beginning of 2011 based on actual production and actual numberof customers served in 2011.
2. Suppose Music Master can add or reduce its selling and customer-service capacity in increments offive customers. What is the maximum amount of costs that Music Master could save in 2011 by down-sizing selling and customer-service capacity?
3. Music Master, in fact, does not eliminate any of its unused selling and customer-service capacity. Whymight Music Master not downsize?
13-34 Balanced scorecard. Following is a random-order listing of perspectives, strategic objectives,and performance measures for the balanced scorecard.
Perspectives Performance MeasuresInternal business process Percentage of defective-product unitsCustomer Return on assetsLearning and growth Number of patentsFinancial Employee turnover rateStrategic Objectives Net incomeAcquire new customers Customer profitabilityIncrease shareholder value Percentage of processes with real-time feedbackRetain customers Return on salesImprove manufacturing quality Average job-related training-hours per employeeDevelop profitable customers Return on equityIncrease proprietary products Percentage of on-time deliveries by suppliersIncrease information-system capabilities Product cost per unitEnhance employee skills Profit per salespersonOn-time delivery by suppliers Percentage of error-free invoicesIncrease profit generated by each salesperson Customer cost per unitIntroduce new products Earnings per shareMinimize invoice-error rate Number of new customers
Percentage of customers retained
RequiredFor each perspective, select those strategic objectives from the list that best relate to it. For each strategicobjective, select the most appropriate performance measure(s) from the list.
13-35 Balanced scorecard. (R. Kaplan, adapted) Caltex, Inc., refines gasoline and sells it through itsown Caltex Gas Stations. On the basis of market research, Caltex determines that 60% of the overallgasoline market consists of “service-oriented customers,” medium- to high-income individuals who arewilling to pay a higher price for gas if the gas stations can provide excellent customer service, such as aclean facility, a convenience store, friendly employees, a quick turnaround, the ability to pay by credit card,and high-octane premium gasoline. The remaining 40% of the overall market are “price shoppers” wholook to buy the cheapest gasoline available. Caltex’s strategy is to focus on the 60% of service-oriented
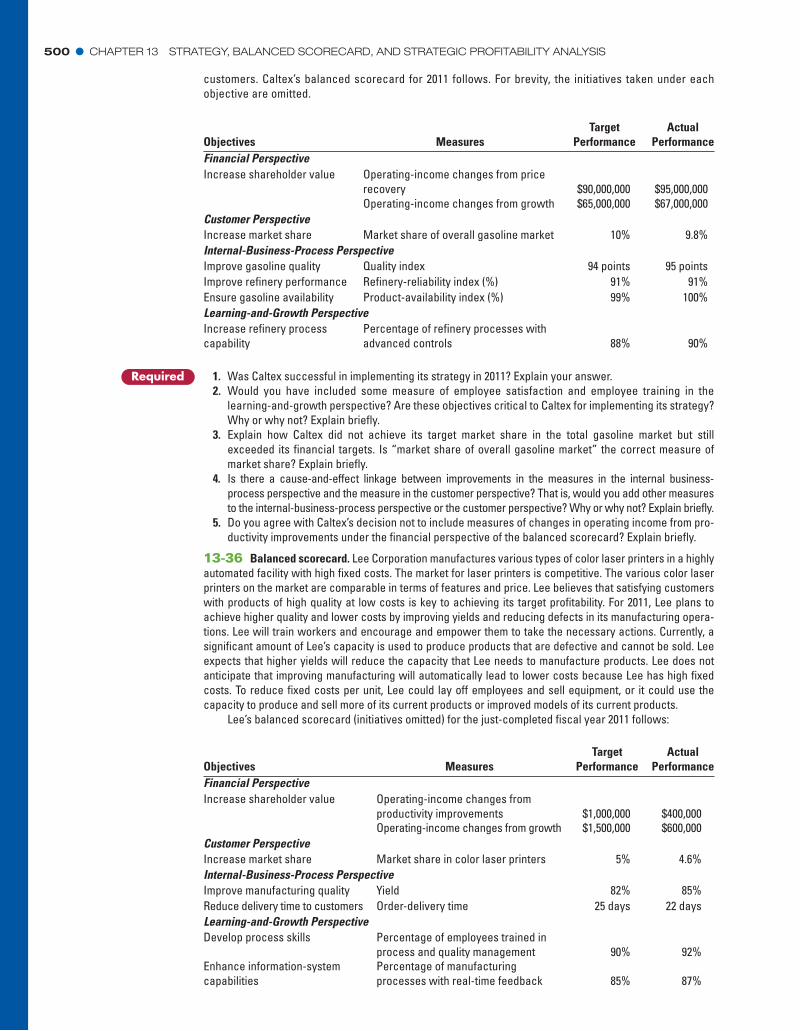
500 � CHAPTER 13 STRATEGY, BALANCED SCORECARD, AND STRATEGIC PROFITABILITY ANALYSIS
customers. Caltex’s balanced scorecard for 2011 follows. For brevity, the initiatives taken under eachobjective are omitted.
Objectives MeasuresTarget
PerformanceActual
PerformanceFinancial PerspectiveIncrease shareholder value Operating-income changes from price
recovery $90,000,000 $95,000,000Operating-income changes from growth $65,000,000 $67,000,000
Customer PerspectiveIncrease market share Market share of overall gasoline market 10% 9.8%Internal-Business-Process PerspectiveImprove gasoline quality Quality index 94 points 95 pointsImprove refinery performance Refinery-reliability index (%) 91% 91%Ensure gasoline availability Product-availability index (%) 99% 100%Learning-and-Growth PerspectiveIncrease refinery processcapability
Percentage of refinery processes withadvanced controls 88% 90%
Objectives MeasuresTarget
PerformanceActual
PerformanceFinancial PerspectiveIncrease shareholder value Operating-income changes from
productivity improvements $1,000,000 $400,000Operating-income changes from growth $1,500,000 $600,000
Customer PerspectiveIncrease market share Market share in color laser printers 5% 4.6%Internal-Business-Process PerspectiveImprove manufacturing quality Yield 82% 85%Reduce delivery time to customers Order-delivery time 25 days 22 daysLearning-and-Growth PerspectiveDevelop process skills Percentage of employees trained in
process and quality management 90% 92%Enhance information-systemcapabilities
Percentage of manufacturingprocesses with real-time feedback 85% 87%
Required 1. Was Caltex successful in implementing its strategy in 2011? Explain your answer.2. Would you have included some measure of employee satisfaction and employee training in the
learning-and-growth perspective? Are these objectives critical to Caltex for implementing its strategy?Why or why not? Explain briefly.
3. Explain how Caltex did not achieve its target market share in the total gasoline market but stillexceeded its financial targets. Is “market share of overall gasoline market” the correct measure ofmarket share? Explain briefly.
4. Is there a cause-and-effect linkage between improvements in the measures in the internal business-process perspective and the measure in the customer perspective? That is, would you add other measuresto the internal-business-process perspective or the customer perspective? Why or why not? Explain briefly.
5. Do you agree with Caltex’s decision not to include measures of changes in operating income from pro-ductivity improvements under the financial perspective of the balanced scorecard? Explain briefly.
13-36 Balanced scorecard. Lee Corporation manufactures various types of color laser printers in a highlyautomated facility with high fixed costs. The market for laser printers is competitive. The various color laserprinters on the market are comparable in terms of features and price. Lee believes that satisfying customerswith products of high quality at low costs is key to achieving its target profitability. For 2011, Lee plans toachieve higher quality and lower costs by improving yields and reducing defects in its manufacturing opera-tions. Lee will train workers and encourage and empower them to take the necessary actions. Currently, asignificant amount of Lee’s capacity is used to produce products that are defective and cannot be sold. Leeexpects that higher yields will reduce the capacity that Lee needs to manufacture products. Lee does notanticipate that improving manufacturing will automatically lead to lower costs because Lee has high fixedcosts. To reduce fixed costs per unit, Lee could lay off employees and sell equipment, or it could use thecapacity to produce and sell more of its current products or improved models of its current products.
Lee’s balanced scorecard (initiatives omitted) for the just-completed fiscal year 2011 follows:

ASSIGNMENT MATERIAL � 501
Total selling and customer-service costs depend on the number of customers that Halsey has createdcapacity to support, not the actual number of customers that Halsey serves. Total purchasing and adminis-trative costs depend on purchasing and administrative capacity that Halsey has created (defined in terms ofthe number of distinct clothing designs that Halsey can purchase and administer). Purchasing and adminis-trative costs do not depend on the actual number of distinct clothing designs purchased. Halsey purchased930 distinct designs in 2010 and 820 distinct designs in 2011.
At the start of 2010, Halsey planned to increase operating income by 10% over operating income in 2011.
Required1. Was Lee successful in implementing its strategy in 2011? Explain.2. Is Lee’s balanced scorecard useful in helping the company understand why it did not reach its target
market share in 2011? If it is, explain why. If it is not, explain what other measures you might want toadd under the customer perspective and why.
3. Would you have included some measure of employee satisfaction in the learning-and-growth perspec-tive and new-product development in the internal-business-process perspective? That is, do you thinkemployee satisfaction and development of new products are critical for Lee to implement its strategy?Why or why not? Explain briefly.
4. What problems, if any, do you see in Lee improving quality and significantly downsizing to eliminateunused capacity?
13-37 Partial productivity measurement. Gerhart Company manufactures wallets from fabric. In 2011,Gerhart made 2,520,000 wallets using 2,000,000 yards of fabric. In 2011, Gerhart has capacity to make3,307,500 wallets and incurs a cost of $9,922,500 for this capacity. In 2012, Gerhart plans to make2,646,000 wallets, make fabric use more efficient, and reduce capacity.
Suppose that in 2012 Gerhart makes 2,646,000 wallets, uses 1,764,000 yards of fabric, and reducescapacity to 2,700,000 wallets, incurring a cost of $8,370,000 for this capacity.
Required1. Calculate the partial-productivity ratios for materials and conversion (capacity costs) for 2012, andcompare them to a benchmark for 2011 calculated based on 2012 output.
2. How can Gerhart Company use the information from the partial-productivity calculations?
13-38 Total factor productivity (continuation of 13-37). Refer to the data for Problem 13-37. Assume thefabric costs $3.70 per yard in 2012 and $3.85 per yard in 2011.
Required1. Compute Gerhart Company’s total factor productivity (TFP) for 2012.2. Compare TFP for 2012 with a benchmark TFP for 2011 inputs based on 2012 prices and output.3. What additional information does TFP provide that partial productivity measures do not?
Collaborative Learning Problem
13-39 Strategic analysis of operating income. Halsey Company sells women’s clothing. Halsey’s strat-egy is to offer a wide selection of clothes and excellent customer service and to charge a premium price.Halsey presents the following data for 2010 and 2011. For simplicity, assume that each customer purchasesone piece of clothing.
2010 20111. Pieces of clothing purchased and sold 40,000 40,0002. Average selling price $60 $593. Average cost per piece of clothing $40 $414. Selling and customer-service capacity 51,000 customers 43,000 customers5. Selling and customer-service costs $357,000 $296,7006. Selling and customer-service capacity cost per customer
(row 5 ÷ row 4) $7 per customer $6.90 per customer7. Purchasing and administrative capacity 980 designs 850 designs8. Purchasing and administrative costs $245,000 $204,0009. Purchasing and administrative capacity cost per distinct
design (row 8 ÷ row 7) $250 per design $240 per design
Required1. Is Halsey’s strategy one of product differentiation or cost leadership? Explain.2. Calculate Halsey’s operating income in 2010 and 2011.3. Calculate the growth, price-recovery, and productivity components of changes in operating income
between 2010 and 2011.4. Does the strategic analysis of operating income indicate Halsey was successful in implementing its
strategy in 2011? Explain.