Embed Size (px)
Citation preview

1
Chapter 5Present-Worth Analysis
Describing Project Cash Flows: Loan versus Project Cash Flows
Initial Project Screening Methods
Present Worth Analysis
Variations of Present Worth Analysis
Comparing Mutually Exclusive Alternatives

2
Chapter Opening Story –Federal Express
Nature of Project: Equip 40,000 couriers
with PowerPads Save 10 seconds per
pickup stop Investment cost: $150
million Expected savings: $20
million per year Federal Express
3
Ultimate Questions
Is it worth investing $150 million to save $20 million per year, say over 10 years?
How long does it take to recover the initial investment?
What kind of interest rate should be used in evaluating business investment opportunities?

4
Mr. Bracewell’s Investment Problem
• Built a hydroelectric plant using his personal savings of $800,000
• Power generating capacity of 6 million kwhs
• Estimated annual power sales after taxes - $120,000
• Expected service life of 50 years
Was Bracewell's $800,000 investment a wise one?
How long does he have to wait to recover his initial investment, and will he ever make a profit?

5
Mr. Bracewell’s Hydro Project
6
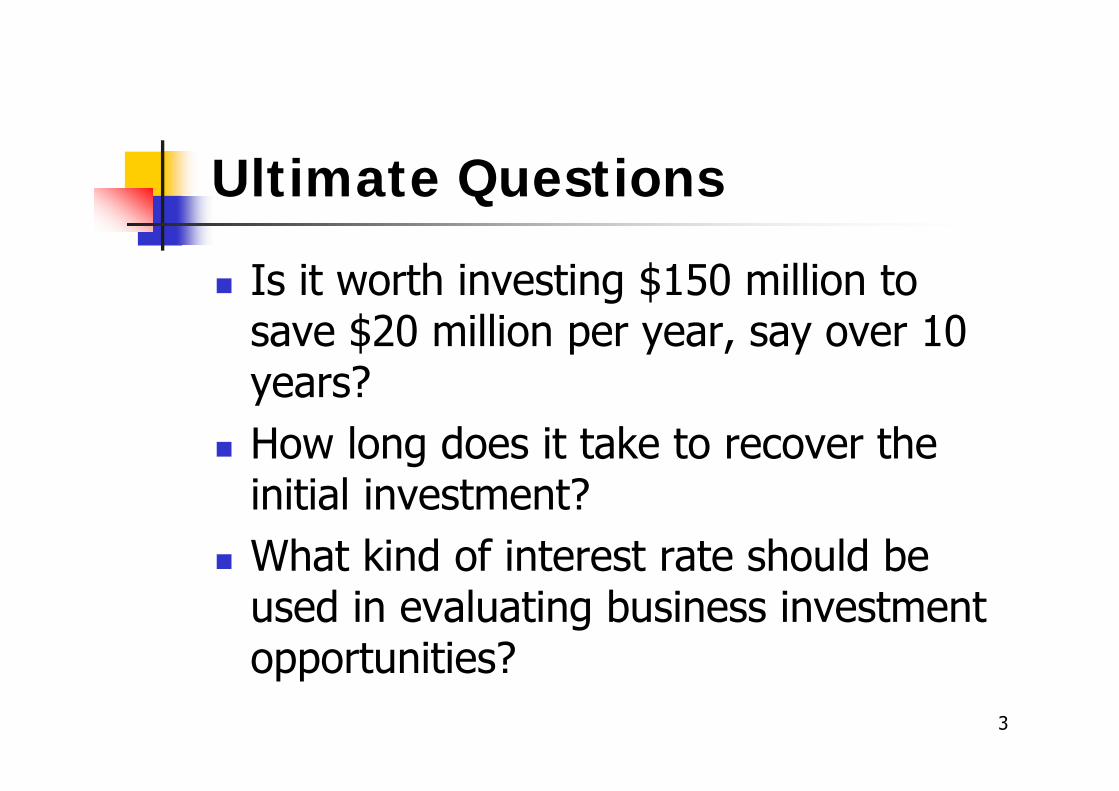
Bank Loan vs. Investment Project
Bank CustomerLoan
Repayment
Company Project
Investment
Return
Bank Loan: Loan cash flow
Investment Project: Project cash flow

7
Independent vs Mutually Exclusive Investment Projects
Computer process control system, new warehouse, CAD system for engineering, etc: The decision on any one project has no effect on the decision made on another project. Such projects are independent.
If there are alternative projects which resolve the same problem or meet the same need, then acceptance of one project means the rejection of all others. Such projects are mutually exclusive.
Capital budgeting: Which projects should be selected with available funds?

8
Payback MethodHow fast can I recover my initial investment?
Conventional payback method (time value of money ignored)
Discounted payback method
Payback screening - If the payback period is within acceptable range, formal project evaluation may start (a high-tech firm may have a short time limit since products rapidly become obsolete).

9
Conventional-Payback Method
Principle:How fast can I recover my initial investment?
Method:Based on cumulative cash flow
Screening Guideline:If the payback period is less than or equal to
some specified payback period, the project would be considered for further analysis.
Weakness:Does not consider the time value of money

10
Example 5.1 Conventional Payback Period
N Cash Flow Cum. Flow0123456
-$105,000+$20,000$15,000$25,000$35,000$45,000$45,000$35,000
-$85,000-$70,000-$45,000-$10,000$35,000$80,000
$115,000
Payback period should occur somewherebetween N = 3 and N = 4.

11
-100,000
-50,000
0
50,000
100,000150,000
0 1 2 3 4 5 6
Years (n)
3.2 years Payback period
$85,000
$15,000$25,000
$35,000$45,000 $45,000
$35,000
01 2 3 4 5 6
Years
Ann
ual c
ash
flow
Cum
ulat
ive
cash
flow
($)

12
Payback Method Pitfall
n Project 1Payback:3 years
Project 2 Payback:3.6 years
0 -90000 -900001 30000 250002 30000 250003 30000 250004 1000 250005 1000 250006 1000 25000
• Fails to measure profitability
• Ignores timing of cash flows

13
Discounted Payback Method Principle:
How fast can I recover my initial investment plus interest?
Method:Based on cumulative discounted cash flow
Screening Guideline:If the discounted payback period (DPP) is less than or equal to some specified payback period, the project would be considered for further analysis.
Weakness:Cash flows occurring after DPP are ignored

14
Discounted Payback Period Calculation
Period Cash Flow Cost of Funds(15%)
CumulativeCash Flow
0 -$85,000 0 -$85,000
1 15,000 -$85,000(0.15)= -$12,750 -82,750
2 25,000 -$82,750(0.15)= -12,413 -70,163
3 35,000 -$70,163(0.15)= -10,524 -45,687
4 45,000 -$45,687(0.15)=-6,853 -7,540
5 45,000 -$7,540(0.15)= -1,131 36,329
6 35,000 $36,329(0.15)= 5,449 76,778
-85000(1.15)+15000= -82750

15
Net Present Worth Measure Principle: Compute the equivalent net surplus at n = 0 for a
given interest rate of i. Decision Rule: Accept the project if the net surplus is positive.
2 3 4 50 1
Inflow
Outflow
0PW(i)inflow
PW(i)outflow
Net surplus
PW(i) > 0

16
MARR: Minimum Attractive Rate of Return
The rate at which the firm can always invest the money in its investment pool.
Possibly change over the life of project
Risk-free returnInflation factorRisk premiums

17
Example 5.3 - Tiger Machine Tool Company
PW P F P FP F
PWPW
( $24 , ( / , ) $27 , ( / , )$55, ( / , )$78,
( $75,( $78, $75,
$3, ,
15% ) 400 15% ,1 340 15% ,2760 15% ,3553
15% ) 00015% ) 553 000
553 0
inflow
outflow
A ccept
$75,000
$24,400 $27,340$55,760
01 2 3
outflow
inflow

18
Present Worth Amounts at Varying Interest Rates: Choice of MARR is critical
i (%) PW(i) i(%) PW(i)0 $32,500 20 -$3,4122 27,743 22 -5,9244 23,309 24 -8,2966 19,169 26 -10,5398 15,296 28 -12,66210 11,670 30 -14,67312 8,270 32 -16,58014 5,077 34 -18,36016 2,076 36 -20,110
17.45* 0 38 -21,74518 -751 40 -23,302
*Break even interest rate

19
-30
-20
-10
0
10
20
30
40
0 5 10 15 20 25 30 35 40
PW (i
) ($
thou
sand
s)
i = MARR (%)
$3553 17.45%
Break even interest rate(or rate of return)
Accept Reject
Present Worth Profile

20
Meaning of Present WorthTwo possible perspectives
Investment pool: All funds in the firm’s treasury can be placed in investments that yield a return equal to the MARR.
Borrowed funds (project balance): If no funds are available for investment, the firm can borrow them at MARR from the capital market.
21
Investment Pool Concept The company has $75000 available for
investment. Two choices: Do not invest, keep the money in the
investment pool and earn at MARR. Invest in the project

22
$75,000
0 1 2 3
$24,400$27,340
$55,760
Investment pool
How much would you have if theInvestment is made?$24,400(F/P,15%,2) = $32,269$27,340(F/P,15%,1) = $31,441$55,760(F/P,15%,0) = $55,760
$119,470
How much would you have if theinvestment was not made?$75,000(F/P,15%,3) = $114,066
What is the net gain from the investment?
$119,470 - $114,066 = $5,404
Project
N = 3
Meaning of Net Present Worth
PW(15%) = $5,404(P/F,15%,3) = $3,553 Net future worth of the project

23
Project Balance Concept (Borrowed funds)
N 0 1 2 3BeginningBalance
Interest
Payment
Project Balance
-$75,000
-$75,000
-$75,000
-$11,250
+$24,400
-$61,850
-$61,850
-$9,278
+$27,340
-$43,788
-$43,788
-$6,568
+$55,760
+$5,404
Net future worth, FW(15%)
PW(15%) = $5,404 (P/F, 15%, 3) = $3,553

24
Project Balance Diagram60,000
40,000
20,000
0
-20,000
-40,000
-60,000
-80,000
-100,000
-120,0000 1 2 3
-$75,000-$61,850
-$43,788
$5,404
Year(n)
Terminal project balance(net future worth, or
project surplus)
Discounted payback period
Proj
ect b
alan
ce ($
)

25
Example:You need to know if the building of a new warehouse is justified under the following conditions:The proposal is for a warehouse costing $100000. The warehouse has an expected useful life of 35 years and a net salvage value of $25000. Annual receipts of $17000 are expected, annual maintenance and administrative costs will be $4000, and annual income taxes are $2000.Given this data, which of the following are correct?(a) The proposal is justified for a MARR of 9%. (b) The proposal has a net present worth of $62730.5, when 6% is used as the interest rate. (c) The proposal is acceptable as long as MARR≤10.77%.

26
(True) %77.10 gives for Solving 0)35,,|(25000)35,,|(11000100000 (c)
True (b)(True) 08.17459
)35%,9,|(25000)35%,9,|(11000100000%)9( (a)
iiiFPiAP
FPAPPW

27
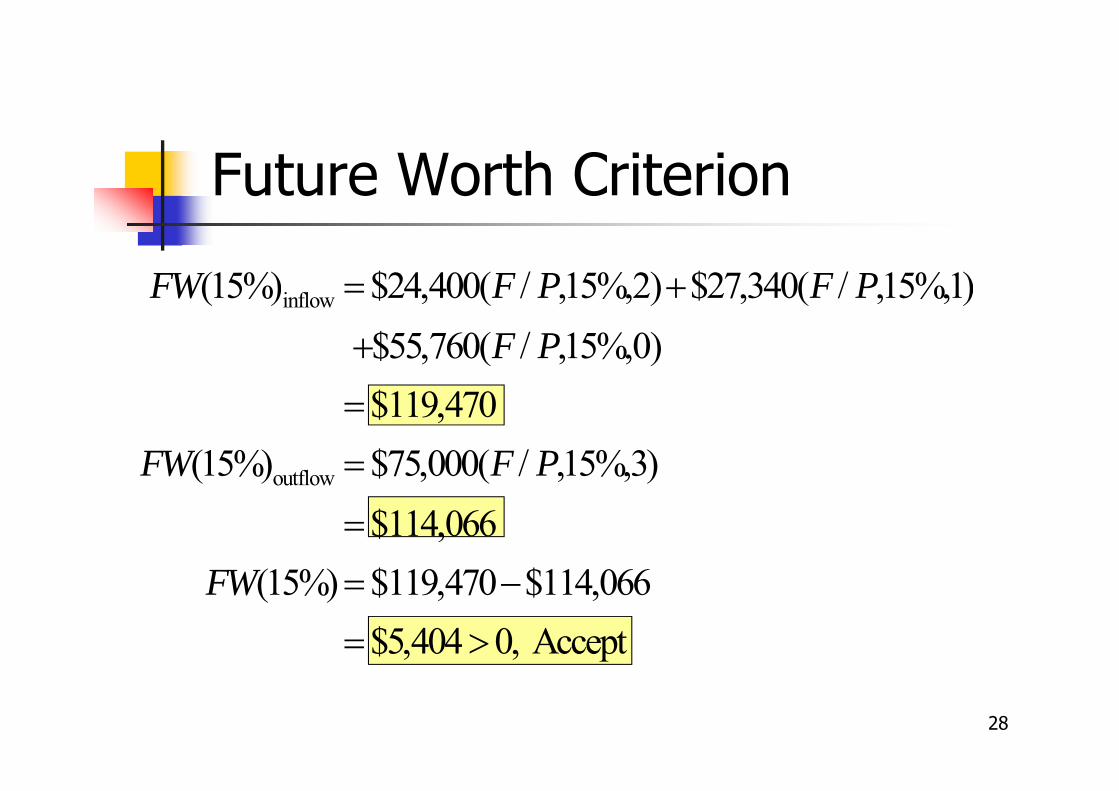
Future Worth Criterion
Given: Cash flows and MARR (i)
Find: The net equivalent worth at a time period other than 0 (typically at the end of project life)
$75,000
$24,400 $27,340$55,760
01 2 3
Project life
28
FW F P F PF P
FW F P
FW
( $24, ( / , ) $27, ( / , )$55, ( / , )$119,
( $75, ( / , )$114,
( $119, $114,$5, ,
15%) 400 15%,2 340 15%,1760 15%,0470
15%) 000 15%,3066
15%) 470 066404 0
inflow
outflow
Accept
Future Worth Criterion

29
Capitalized Equivalent Worth Principle: PW for a project with an annual receipt of A over infinite (or extremely long) service life Equation:
CE(i) = A(P/A, i, ) = A/iA
0
P = CE(i)
N ∞
Computing PW: capitalization of project costCost is called capitalized cost

30
Given: i = 10%, N = Find: P or CE (10%)
10
$1,000$2,000
P = CE (10%) = ?
0
CE P F( $1,.
$1,.
( / , )
$10, ( . )$13,
10%) 000010
000010
10%,10
0001 03855855

31
Example: Bridge Construction
Construction cost = $2,000,000
Annual Maintenance cost = $50,000
Renovation cost = $500,000 every 15 years
Planning horizon = infinite period
Interest rate = 5%

32
$500,000 $500,000 $500,000 $500,000
$2,000,000
$50,000
0 15 30 45 60

33
Solution:•Construction Cost
P1 = $2,000,000• Maintenance Costs
P2 = $50,000/0.05 = $1,000,000• Renovation Costs
P3 = $500,000(P/F, 5%, 15)+ $500,000(P/F, 5%, 30)+ $500,000(P/F, 5%, 45)+ $500,000(P/F, 5%, 60)...= {$500,000(A/F, 5%, 15)}/0.05= $463,423
• Total Present WorthP = P1 + P2 + P3 = $3,463,423

34
Alternate way to calculate P3
• Concept: Find the effective interest rate per payment period
• Effective interest rate for a 15-year cycle
i = (1 + 0.05)15 - 1 = 107.893%
• Capitalized equivalent worthP3 = $500,000/1.07893
= $463,423
15 30 45 600
$500,000 $500,000 $500,000 $500,000

35
Comparing Mutually Exclusive Projects
Mutually Exclusive ProjectFundamental principle in comparing mutually exclusive projects (alternatives)is that they must be compared over an equal time span (or planning horizon)
Do-Nothing Alternative

36
Analysis PeriodThe time span over which the economic effects of an investment will be evaluated (study period or planning horizon).
Required Service PeriodThe time span over which the service of an equipment (or investment) will be needed.
Useful life of a projectCompare projects with different useful
lives over an equal time span

37
Comparing Mutually Exclusive Projects
• Principle: Projects must be compared over an equal time span.
• Rule of Thumb: If the required service period is given, the analysis period should be the same as the required service period.

38
Finite
Required service period
Infinite
Analysis = Requiredperiod service
period
Projectrepeatabilitylikely
Project repeatabilityunlikely
Analysis periodequals
project lives
Analysis period is longestof project lifein the group
Analysis period is lowestcommon multiple
of project lives
Analysis periodequals one of
the project lives
Analysis periodis shorter than
project lives
Analysis period is longer thanproject lives
Case 1
Case 2
Case 3
Case 4
How to Choose An Analysis Period

39
Case 1: Analysis Period Equals Project Lives
Compute the PW for each project over its life
$450$600
$500 $1,400$2,075
$2,110
0
$1,000 $4,000A B
PW (10%) = $283PW (10%) = $579
A
B

40
Comparing projects requiring different levels of investment – Assume that the unused funds will be invested at MARR.
$1,000
$450$600
$500
Project A
$1,000
$600$500$450
$3,000
3,993
$4,000
$1,400
$2,075
$2,110
Project BModifiedProject A
PW(10%)A = $283PW(10%)B = $579
This portionof investmentwill earn 10%return on investment.

41
Example: Consider the following two mutually exclusive investment projects. Assume that MARR=12%. Which alternative would be selected by using the PW criterion? Which alternative would be selected by using the net-future-worth criterion?
Project cash flown A B0 -4500 -29001 2610 12102 2930 17203 2300 1500

42.Select 93.8691500)12.1(1720)12.1(1210)12.1(2900%)12(
)41.2533)12.1(23.1803simply or (
41.25332300)12.1(2930)12.1(2610)12.1(4500%)12(:worth-future-Net
.Select
2.61912.1
150012.1
172012.1
12102900%)12(
23.180312.1
230012.1
293012.1
26104500%)12(
:rthPresent wo
23
3
23
32
32
AFW
FW
A
PW
PW
B
A
B
A

43
Often, project lives do not match the required analysis period and/or do not match each other.
For example, two machines may perform the same functions, but one will last longer, and both of them last longer than the analysis period for which they are being considered.

44
Case 2: Analysis Period Shorter than Project Lives
•Example: 5-year production project when all the alternative equipment have useful lives of 7 years.
•Estimate the salvage value at the end of the required service period. Salvage value is the amount of money for which the equipment could be sold after its service to the project or the dollar measure of its remaining usefulness.
• Compute the PW for each project over the required service period.

45
Comparison of unequal-lived service projects when the required service period is shorter than the individual project life(Required service period =2 years)
PW(15%)A = -$362,000 PW(15%)B = -$364,000
46
PW(15%)A= - $362 PW(15%)B= - $364
Model A would be preferred.

47
Case 3: Analysis Period Longer than Project Lives
• Come up with replacement projects thatmatch or exceed the required serviceperiod.
Same alternative or new technology? Purchase, lease or subcontract?
• Compute the PW for each project overthe required service period.


49
Comparison for Service Projects with Unequal Lives when the required service period is longer than the individual project life
PW(15%)A= - $34359PW(15%)B= - $31031

50
Consider two mutually exclusive processes for natural resource extraction (e.g. coal): 10 years vs 8 years. No need to continue the project if 8-year process is chosen
(all coal extracted).
The two processes can be compared over an analysis period of 10 years (longest of 8 and 10).
Revenues must be included even if total (undiscounted) revenue is the same for both processes, since the faster process has larger present worth.
Case 4: Analysis period coincides with longest project life

51
Case 4: Analysis period coincides with longest project life
PW(15%)drill = $2,208,470
PW(15%)lease = $2,180,210
Example: Natural resource extraction
52
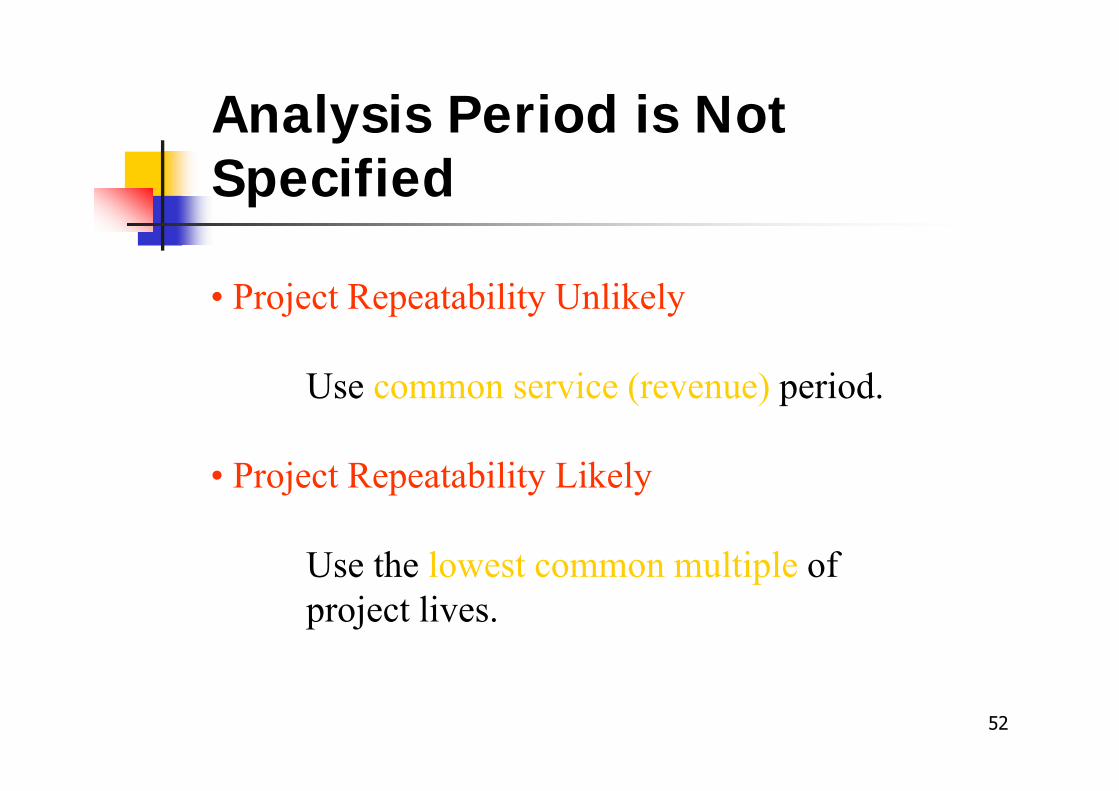
Analysis Period is Not Specified
• Project Repeatability Unlikely
Use common service (revenue) period.
• Project Repeatability Likely
Use the lowest common multiple of project lives.

53
Project Repeatability Likely
PW(15%)A=-$53,657
PW(15%)B=-$48,534
Model A: 3 YearsModel B: 4 yearsLCM (3,4) = 12 years

54
Summary Present worth is an equivalence method of analysis in
which a project’s cash flows are discounted to a lump sum amount at present time.
The MARR or minimum attractive rate of return is the interest rate at which a firm can always earn or borrow money.
MARR is generally dictated by management and is the rate at which NPW analysis should be conducted.
Two measures of investment, the net future worthand the capitalized equivalent worth, are variations to the NPW criterion.

55
The term mutually exclusive means that, when one of several alternatives that meet the same need is selected, the others will be rejected.
Revenue projects are those for which the income generated depends on the choice of project.
Service projects are those for which income remains the same, regardless of which project is selected.
The analysis period (study period) is the time span over which the economic effects of an investment will be evaluated.
The required service period is the time span over which the service of an equipment (or investment) will be needed.

56
The analysis period should be chosen to cover the required service period.
When not specified by management or company policy, the analysis period to use in a comparison of mutually exclusive projects may be chosen by an individual analyst.