Embed Size (px)
Citation preview
221
CHAPTER 5
Expenditure on Gross Domestic Product
Overview and introduction
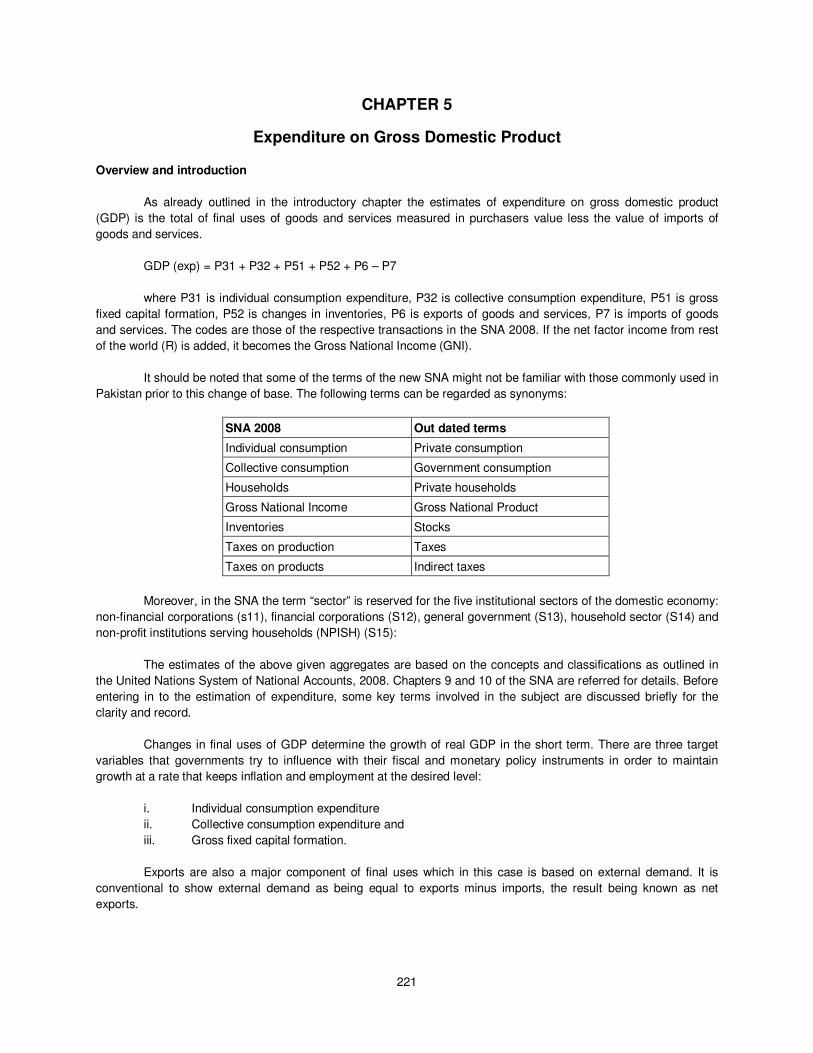
As already outlined in the introductory chapter the estimates of expenditure on gross domestic product
(GDP) is the total of final uses of goods and services measured in purchasers value less the value of imports of
goods and services.
GDP (exp) = P31 + P32 + P51 + P52 + P6 – P7
where P31 is individual consumption expenditure, P32 is collective consumption expenditure, P51 is gross
fixed capital formation, P52 is changes in inventories, P6 is exports of goods and services, P7 is imports of goods
and services. The codes are those of the respective transactions in the SNA 2008. If the net factor income from rest
of the world (R) is added, it becomes the Gross National Income (GNI).
It should be noted that some of the terms of the new SNA might not be familiar with those commonly used in
Pakistan prior to this change of base. The following terms can be regarded as synonyms:
SNA 2008 Out dated terms
Individual consumption Private consumption
Collective consumption Government consumption
Households Private households
Gross National Income Gross National Product
Inventories Stocks
Taxes on production Taxes
Taxes on products Indirect taxes
Moreover, in the SNA the term “sector” is reserved for the five institutional sectors of the domestic economy:
non-financial corporations (s11), financial corporations (S12), general government (S13), household sector (S14) and
non-profit institutions serving households (NPISH) (S15):
The estimates of the above given aggregates are based on the concepts and classifications as outlined in
the United Nations System of National Accounts, 2008. Chapters 9 and 10 of the SNA are referred for details. Before
entering in to the estimation of expenditure, some key terms involved in the subject are discussed briefly for the
clarity and record.
Changes in final uses of GDP determine the growth of real GDP in the short term. There are three target
variables that governments try to influence with their fiscal and monetary policy instruments in order to maintain
growth at a rate that keeps inflation and employment at the desired level:
i. Individual consumption expenditure
ii. Collective consumption expenditure and
iii. Gross fixed capital formation.
Exports are also a major component of final uses which in this case is based on external demand. It is
conventional to show external demand as being equal to exports minus imports, the result being known as net
exports.
222
At first glance it seems as if final uses equals to what in economic literature is called final “demand”. For
good reasons the SNA avoids the term “demand” as only the term final “use” is based on a simple tautology enabling
mathematical operations and applying double-entry based accounting rules involving the production side of GDP,
also. In case of a declining business cycle with decreasing demand the production may not promptly react and may
go on for a while at the same pace. Thus, unsold products may pile up the stocks. In the SNA increases in inventories
(stocks), however, are recorded as gross capital formation. Gross capital formation is the sum of gross fixed capital
formation, changes in inventories and net acquisition of valuables. It is evident that analysts of the business cycle in
their search for indicators for “demand” are much more interested in formation of fixed capital than in the formation of
capital at large (including possibly undesired increases in the stocks).
The GDP viewed from the expenditure side captures uses only in case that they are “final”. In the national
accounts, the uses of resources are described as intermediate or final. Intermediate uses consists of goods and
services that are consumed, used-up or transferred in production process within the economic territory and during the
accounting period. Final uses comprise all other goods and services which are used for final consumption, for capital
formation or for exports (net of imports). Most of the expenditure by general government or NPISH is conventionally
regarded as “final”, either as final consumption expenditure or as gross capital formation. Conversely, all spending by
firms on goods and services is “intermediate” apart from capital formation. Exports are considered as “final” because
they are final sales from the point of view of the exporting country.
The principal components of final uses of GDP are:
i. Individual consumption expenditure (P31-Sector Households, S14)
ii. Collective consumption expenditure (P32-Sector General Government, S13)
iii. NPISH’s individual consumption expenditure (P31-Sector NPISH, S15)
iv. Gross fixed capital formation (P51)
v. Changes in inventories (P52)
vi. Acquisition less disposal of valuables (P53)
vii. Exports (P6)
viii. Minus Imports (P7)
The bracket indicates the SNA’s transaction code (“P”) and in some cases the institutional sector the
transactions by definition are totally allocated to. In a lot of countries, including Pakistan, the individual consumption
expenditure of households and of Non-profit Institutions Serving Households (NPISH) can only be calculated and
shown aggregately. In most cases, Pakistan included, this aggregate also includes the acquisition of valuables (if not
declared as being nil or negligible),
A consumption good or service is used (without further transformation in production as defined in the SNA)
by households, NPISHs or government units for the direct satisfaction of individual needs (or wants) or for the
collective needs of members of the community.
In the case of goods, the distinction between durable and non-durable goods is important. A durable good is
one that may be used repeatedly or continuously over a period of more than a year, assuming a normal or average
rate of physical usage. A consumer durable is a good that may be used for purposes of consumption repeatedly or
continuously over a period of a year or more.
Methodological issues and data resources are explained in the subsequent paragraphs. The estimates of
the expenditure on GDP for the base year 2005-06 are given in the table 32. In general, the methods as well as the
results given in this chapter do not differ substantially from those of the National Accounts pertaining to the previous
base.
A. Individual Consumption Expenditure of Households and NPISH
The final consumption of goods & services of households and non-profit institutions serving households
(NPISHs) is made up of outlays on new durable and non-durable goods & services, reduced by net sales of second
223
hand goods, scraps and wastes and is estimated at purchasers’ value. In principle, the aggregate can be measured
in two ways:
• In a commodity flow approach we would look at the domestic supply and import of products and
delineate thereof those which are absorbed for final consumption purpose of households and
NPISHs.
• In special surveys we directly survey the consumption of households and NPISH by asking them. In
Pakistan this is done in the Household Integrated Economic Survey (HIES).
In Pakistan as in some other countries we apply a third variant which is assessment of this aggregate as the
residual of GDP. In other words it is calculated as GDP as determined from the production side minus the aggregates
which can be calculated on empirical evidence (final consumption of the government, capital formation and exports
minus imports). The reason for refraining from use of figures from HIES is that there are large gaps between HIES
and the residual of GDP. A lot of countries face the problem that household surveys drastically understate the final
consumption as defined in the SNA. However conceptual issues have been highlighted in the following paras that
have been taken from SNA 2008.
Household individual consumption expenditure consists of expenditure incurred by resident households on
consumption goods or services. As well as purchases of consumer goods and services, final consumption
expenditure includes the estimated value of barter transactions, goods and services received in kind, and goods and
services produced and consumed by the same household.
It includes estimates for the values of goods or services produced as outputs of unincorporated enterprises
owned by households that are retained for consumption by members of the household. The production of services for
own consumption within the same household falls outside the production boundary of the SNA, except for housing
services produced by owner-occupiers and services produced by employing paid domestic staff. The main types of
goods and services produced and consumed within the same household are as follows:
a. Food or other agricultural goods produced for own final consumption by farmers, including
subsistence farmers, or others for whom agricultural production is only a secondary, or even a
leisure, activity;
b. Other kinds of goods produced by unincorporated enterprises owned by households that are
consumed by members of the same households;
c. Housing services produced for own final consumption by owner occupiers ; and
d. Domestic or other services produced for own final consumption by households that employ paid
staff for this purpose (domestic staff, cooks, gardeners, chauffeurs, etc.).
Individual consumption expenditure excludes expenditure on fixed assets in the form of dwellings or on
valuables. When a household includes one or more persons who own an unincorporated enterprise, all expenditure
incurred for business purposes is excluded from household individual consumption expenditure. It is necessary to
ensure that only expenditure for the direct satisfaction of human needs and wants is included in household individual
consumption expenditure.
When appropriate, values must be estimated for the expenditures that households incur on services
provided by financial institutions for which no explicit charges are made (see chapter 4, Part C on financial services).
Expenditures on services for which financial institutions do make charges are recorded in the usual way. Persons
who own the dwellings in which they live are treated as owning unincorporated enterprises that produce housing
services that are consumed by the household to which the owner belongs. The housing services produced are
deemed to be equal in value to the rentals that would be paid on the market for accommodation of the same size,
quality and type. The imputed values of the housing services are recorded as final consumption expenditures of the
owners. “Do-it-yourself” activities of decoration and undertaking minor repairs, often of a routine nature, of a kind that
224
would normally be seen as the responsibility of a tenant are treated as falling outside the production boundary.
Purchases of materials used for such decoration or repairs should therefore be treated as individual consumption
expenditure, as should fees and service charges paid to builders, carpenters, plumbers, etc. Maintenance that is the
responsibility of tenants is also treated as individual consumption expenditure. Expenditures that owners, including
owner-occupiers, incur on the decoration, minor repairs and maintenance of the dwelling that would normally be seen
as the responsibility of a landlord should not be treated as household individual consumption expenditure but as
intermediate expenditure incurred in the production of housing services. Expenditures on major improvements (that
is, reconstructions, renovations or enlargements) to dwellings are excluded from household individual consumption
expenditure and are treated as gross fixed capital formation on the part of the owners of those dwellings, including
owner-occupiers.
Expenditures on all repair and maintenance of consumer durables, including vehicles, are treated in the
same way as minor repairs to dwellings of the type carried out by tenants. Repairs and maintenance constitute final
consumption expenditure whether they are carried out by specialist producers or by members of the household as
“do-it-yourself” activities. In the latter case, only the values of the materials purchased should be included in
household consumption expenditure.
Household expenditure is recorded at the purchasers’ prices paid by households including any taxes on
products that may be payable at the time of purchase. Expenditures by residents abroad constitute imports, while
expenditures by non-residents are exports.
Non-Profit Institutions Serving Households (NPISH) is a small sector in the national accounts. NPISH are
units formed by groups of households in order to supply services to themselves or to other households on a non-
commercial basis. Included are political parties, trade unions, religious organizations, sports clubs, cultural
associations, charities associations with philanthropic aims and certain charitable foundations. NPISH do not include
all institutions with non-commercial aims. In order to be defined as NPISH, the funding source should be the
household’s donations or regular subscriptions. Those non-profit institutions that are not directly financed by
households but are financed and controlled by the enterprise (Chambers of commerce, Professional associations,
mutual insurance companies etc.) or government are classified as being in the respective sector. NPISH provide non-
market services, hence their treatment is similar to that of government. By convention, NPISH consume the services
they produce. Therefore final consumption expenditure of NPISHs are equal to their operating costs and all being
individual consumption expenditure in nature.
Summary: In summary, the final consumption expenditure of the household generally includes;
1. Purchases of the goods and services used by households to meet their everyday needs,
2. Partial payments for goods and services provided by general government,
3. Payment to general government for various types of licenses and permits for services
4. Owner occupier’s imputed rents
5. Own-account consumption, i.e., the imputed value of consumption goods produced and consumed
by households themselves
6. Income in kind, valued at their cost to the employer
7. Financial intermediation services indirectly measured (FISIM)
B. Collective Consumption Expenditure (General government)
For short, the collective consumption is output of general government which has neither been utilized for
own-account capital formation (e.g. in-house produced software) nor has been sold. Thus, the calculation of the
collective consumption expenditure of the general government is just a few steps further than the calculation of its
output, its intermediate consumption and its value added (see chapter 4, part E). Collective consumption expenditure
is derived as follows:
The value of all types of output of general government,
225
less the value of output for own account capital formation,
less the value of sales of goods and services at both economically insignificant prices and at
economically significant prices,
plus the value of goods and services purchased from market producers for delivery to households free
or at economically insignificant prices.
The latter position is relevant for countries with a well-developed system of social security funds where these
funds cater for health insurance by purchasing of health services and medical goods on behalf of their member
households who in return pay social contributions. These countries, most of them industrialized ones, make use of an
option of recording a “social transfer in kind” to shift these high amounts of expenditures from collective consumption
to individual consumption of the households the medical goods and services are meant for. Similarly, some other
services provided by the government (education) are also shifted this way. Especially for this option the SNA 1993 as
well as the SNA 2008 foresee a special deviation in the sequence of accounts and in the balancing items (“adjusted
disposable income”). This option has not been chosen for Pakistan.
Though the calculation of collective consumption is straightforward some conceptual discussion and
clarification is given in the following paragraphs. Chapters 9 and 10 of the SNA 2008 are referred for details.
Expenditures on a wide range of consumption goods and services are incurred by general government,
either on collective services or on selected individual goods or services. The collective consumption expenditures can
be classified in several ways. In particular, they may be classified:
a. According to whether the goods or services have been produced by market or non-market
producers;
b. According to whether the expenditures are on collective services or individual goods or services;
c. By function or purpose according to the classification of the functions of government (COFOG); or
d. By type of good or service according to the CPC.
Options ‘b and d’ are not materialized for Pakistan. Option b stands for the above mentioned “social
transfers in kind” while option d cannot be applied due to lack of data and to resource constraints.
For countries like Pakistan whose central banks are providing surveillance services and thus are producing
non-market output the new SNA foresees a special addition to collective consumption. According to SNA 2008 (6.153
and 8.130) a current transfer (“current transfer between the central bank and general government” under
“miscellaneous current transfers”) has to be recorded. The underlying convention is a virtual transfer from the State
Bank to the central government which enhances the government’s disposable income by the amount of the collective
consumption dedicated to the surveillance service of the State Bank. In other words: with the provision of this virtual
money from the State Bank, the government is in a position to virtually purchase the non-market output from the
State Bank. As a result of these virtual transactions the balancing items saving and net lending both of general
government as well as of State Bank remain unaffected. In the base year 2005-06 the collective consumption
resulting from the State Bank’s non-market activity was Rs. 11531 million. For this see also Chapter 4, part C
(financial services) of this methodology.
Expenditures on the outputs of non-market producers that are provided free, or at prices that are not
economically significant, to individual households or the community account for most of the collective consumption
expenditure. Government may produce output for own final use and some market output but most production by units
of general government is non-market in nature. The value of the non-market output is estimated by the sum of the
costs involved in production. Although government delivers some goods and services to individually identifiable
persons, the costs of so doing are shown as collective consumption expenditure. The value of collective consumption
expenditure on non-market goods and services is not necessarily exactly equal to the value of government output of
these goods and services. The values of these expenditures are equal to the estimated values of all types of output
226
less the value of production for own capital formation and less the values of any receipts from sales. These receipts
may be derived from sales of some goods or services at prices that are not economically significant or from sales of a
few goods or services at prices that are economically significant (sales of secondary market output). Examples for the
latter cases are sales from statistical yearbooks or from tickets of public museums and the like. These can safely be
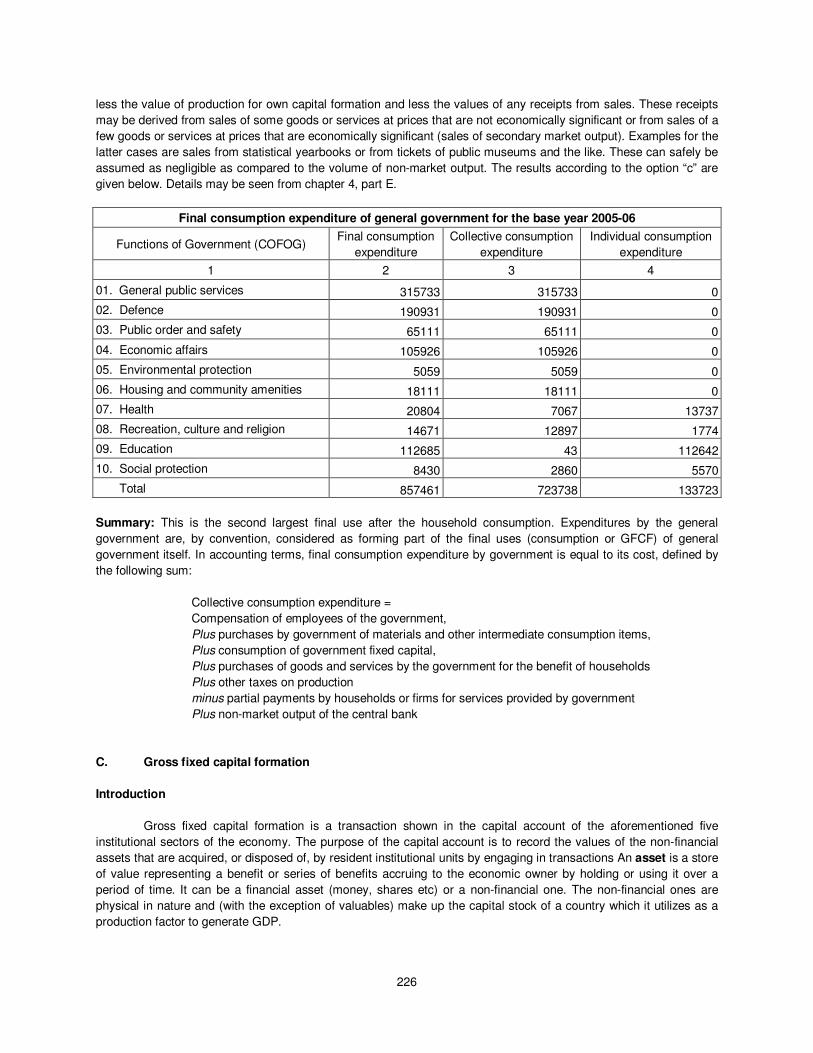
assumed as negligible as compared to the volume of non-market output. The results according to the option “c” are
given below. Details may be seen from chapter 4, part E.
Final consumption expenditure of general government for the base year 2005-06
Functions of Government (COFOG) Final consumption
expenditure
Collective consumption
expenditure
Individual consumption
expenditure
1 2 3 4
01. General public services 315733 315733 0
02. Defence 190931 190931 0
03. Public order and safety 65111 65111 0
04. Economic affairs 105926 105926 0
05. Environmental protection 5059 5059 0
06. Housing and community amenities 18111 18111 0
07. Health 20804 7067 13737
08. Recreation, culture and religion 14671 12897 1774
09. Education 112685 43 112642
10. Social protection 8430 2860 5570
Total 857461 723738 133723
Summary: This is the second largest final use after the household consumption. Expenditures by the general
government are, by convention, considered as forming part of the final uses (consumption or GFCF) of general
government itself. In accounting terms, final consumption expenditure by government is equal to its cost, defined by
the following sum:
Collective consumption expenditure =
Compensation of employees of the government,
Plus purchases by government of materials and other intermediate consumption items,
Plus consumption of government fixed capital,
Plus purchases of goods and services by the government for the benefit of households
Plus other taxes on production
minus partial payments by households or firms for services provided by government
Plus non-market output of the central bank
C. Gross fixed capital formation
Introduction
Gross fixed capital formation is a transaction shown in the capital account of the aforementioned five
institutional sectors of the economy. The purpose of the capital account is to record the values of the non-financial
assets that are acquired, or disposed of, by resident institutional units by engaging in transactions An asset is a store
of value representing a benefit or series of benefits accruing to the economic owner by holding or using it over a
period of time. It can be a financial asset (money, shares etc) or a non-financial one. The non-financial ones are
physical in nature and (with the exception of valuables) make up the capital stock of a country which it utilizes as a
production factor to generate GDP.
227
Two different categories of non-financial assets are distinguished from each other: produced assets and
non-produced assets.
a. Produced assets have come into existence as outputs from production processes that fall within the
production boundary of the SNA. There are three main types of produced assets: fixed assets,
inventories and valuables. Both fixed assets and inventories are assets that are held only by
producers for purposes of production. Valuables may be held by any institutional unit and are
primarily held as stores of value.
b. Non-produced assets are non-financial assets that have come into existence in ways other than
through processes of production. There are three distinct types of non-produced non-financial
assets in the SNA: natural resources, contracts, leases and licences, and goodwill and marketing
assets. These three types of assets have little in common except that they are all non-produced
and non-financial. Natural resources consist of naturally occurring resources such as land, water
resources, uncultivated forests and deposits of minerals that have an economic value. Contracts,
leases and licences are treated as assets only when two conditions are both satisfied.
Fixed assets are produced assets that are used repeatedly or continuously in production processes for
more than one year. The distinguishing feature of a fixed asset is not that it is durable in some physical sense, but
that it may be used repeatedly or continuously in production over a long period of time, which is taken to be more
than one year. Inventories are produced assets that consist of goods and services, which came into existence in the
current period or in an earlier period, and that are held for sale, use in production or other use at a later date.
Valuables are produced goods of considerable value that are not used primarily for purposes of production or
consumption but are held as stores of value over time. Valuables may be held by all sectors of the economy.
Three headings for the net change in the value of non-financial assets are shown in the capital account:
a. Gross capital formation;
b. Consumption of fixed capital;
c. Acquisitions less disposals of non-produced non-financial assets.
Gross capital formation shows the acquisition less disposal of produced assets for purposes of fixed capital
formation, inventories or valuables. It is possible (though uncommon) for the gross capital formation of an individual
institutional unit or sector to be negative if it sells off enough of its existing assets to other units or sectors. Gross
capital formation is measured by the total value of the gross fixed capital formation, changes in inventories and
acquisitions less disposals of valuables.
Consumption of fixed capital is the decline, during the course of the accounting period, in the current value
of the stock of fixed assets owned and used by a producer as a result of physical deterioration, normal obsolescence
or normal accidental damage. The asset boundary for fixed assets consists of goods and services that are used in
production for more than one year. Non-produced non-financial assets have been discussed briefly in the above
paras.
Gross fixed capital formation: boundary and measurement
Gross fixed capital formation is measured by the total value of a producer’s acquisitions, less disposals, of
fixed assets during the accounting period plus certain specified expenditure on services that adds to the value of non-
produced assets.
All goods and services supplied to the economy by means of production, imports or the disposal of produced
assets must be used for exports, consumption (intermediate or final) or as part of capital formation. The boundary line
between those products that are retained in the economy and are used for consumption and those products that are
used for capital formation is known as the asset boundary. The asset boundary for fixed assets consists of goods
and services that are used in production for more than one year.
228
Two exclusions from the asset boundary should be noted at the outset. The first is that consumer durables
are not treated as fixed assets. The services these durables produce are household services outside the production
boundary of the SNA. However, owner-occupied dwellings are not treated as consumer durables but are included
within the asset boundary. The second exclusion concerns small tools. These have been treated as materials or
supplies used for intermediate consumption.
Not all goods included within the asset boundary must be newly produced. Nor are all services included
within the asset boundary immediately recognizable. An existing fixed asset is one whose value was included in the
stock of fixed capital of at least one producer unit in the domestic economy at some earlier point in time either in the
current period or in the immediately previous accounting period. Thus, when the ownership of an existing fixed asset
is transferred from one resident producer to another, the value of the asset sold, bartered or transferred is recorded
as negative gross fixed capital formation by the former and as positive gross fixed capital formation by the latter.
Thus, it is perfectly possible for gross fixed capital formation to be negative as a result of the sale or disposal of
existing fixed assets, although aggregate gross fixed capital formation is unlikely to be negative for large groups of
units such as subsectors, sectors or the economy as a whole.
Gross fixed capital formation may take the form of improvements to existing fixed assets, such as buildings
or computer software that increase their productive capacity, extend their service lives, or both. By definition, such
gross fixed capital formation does not lead to the creation of new assets that can be separately identified and valued,
but to an increase in the value of the asset that has been improved. A different treatment is applied to improvements
to land in its natural state. In this case the improvements are treated as the creation of a new fixed asset and are not
regarded as giving rise to an increase in the value of the natural resource. If land, once improved, is further improved,
then the normal treatment of improvements to existing fixed assets applies.
The distinction between ordinary maintenance and repairs that constitute intermediate consumption and
those that are treated as capital formation is not clear cut. As explained in paragraphs 6.226 to 6.229, of 2008 SNA
ordinary maintenance and repairs are distinguished by two features:
a. They are activities that must be undertaken regularly in order to maintain a fixed asset in working
order over its expected service life. The owner or user of the asset has no choice about whether or
not to undertake ordinary maintenance and repairs if the asset in question is to continue to be used
in production;
b. Ordinary maintenance and repairs do not change the fixed asset’s performance, productive
capacity or expected service life. They simply maintain it in good working order, if necessary by
replacing defective parts by new parts of the same kind.
On the other hand, improvements to existing fixed assets that constitute gross fixed capital formation must
go well beyond the requirements of ordinary maintenance and repairs. They must bring about significant changes in
some of the characteristics of existing fixed assets.
Gross fixed capital formation in a particular category of fixed asset consists of the value of producers’
acquisitions of new and existing products of this type less the value of their disposals of fixed assets of the same
type. Costs incurred on acquisition of an asset are treated as an integral part of the value of that unit’s gross fixed
capital formation. All these costs associated with acquiring and disposing of assets may be described as costs of
ownership transfer. The various components of acquisitions and disposals of fixed assets are listed below:
a. Value of fixed assets purchased;
b. Value of fixed assets acquired through barter;
c. Value of fixed assets received as capital transfers in kind;
d. Value of fixed assets retained by their producers for their own use, including the value of any fixed
assets being produced on own account that are not yet completed or fully mature;
less
229
e. Value of existing fixed assets sold;
f. Value of existing fixed assets surrendered in barter;
g. Value of existing fixed assets surrendered as capital transfers in kind.
Items (a) to (d) include new assets, existing assets, the value of improvements to assets and the cost of
ownership transfers in respect of these assets. Items (e), (f) and (g) include disposals of assets that may cease to be
used as fixed assets by their new owners: for example, vehicles sold by enterprises to households for their personal
use, assets that are scrapped or demolished by their new owners and assets that are exported.
Gross fixed capital formation is usually shown by type of asset. Exhaustive details are given in Chapter 10
(Capital Account) and in the respective paras of the Annex 1 (classification hierarchies) of the SNA. The SNA does
not formally include a division between tangible and intangible assets in the classification. However, the categories of
dwellings, other buildings and structures, machinery and equipment, weapons systems and cultivated biological
resources can be taken to correspond to tangible assets and the other categories to intangible assets. The
classification of assets has been adopted for Pakistan as far as empirically possible. The outcome of this can be seen
in the tables below showing the results of rebasing for GFCF.
Summary
Gross fixed capital formation is precisely defined in the national accounts as the net acquisition of produced
fixed assets, i.e. assets intended for use in the production of other goods and services for a period of more than one
year. The word fixed is used to indicate that additions to inventories are not included in GFCF. It does not mean that
the equipment in question cannot move. The term “fixed” was chosen in contrast to “variable” capital which consists
of inventories. Net acquisition signifies that GFCF records the purchases of fixed assets after deduction of sales of
fixed assets. The term produced assets signifies that only those assets are included in GFCF that are the result of a
production process recognised by the national accounts. Transactions in non-produced assets are included in
balance sheet accounts.
GFCF can be broken down by the nature of the product or by investing industry or by type of asset. Their
cross classification may also be useful for analysis purpose. In Pakistan we classify the GFCF by investing industry
and by type of assets. The types of assets are:
A. Material fixed assets
i. Dwellings,
ii. Other buildings and structures
iii. Machinery and equipment
iv. Cultivated assets
B. Intangible fixed assets
i. Mineral exploration
ii. Software
iii. Literary and artistic originals
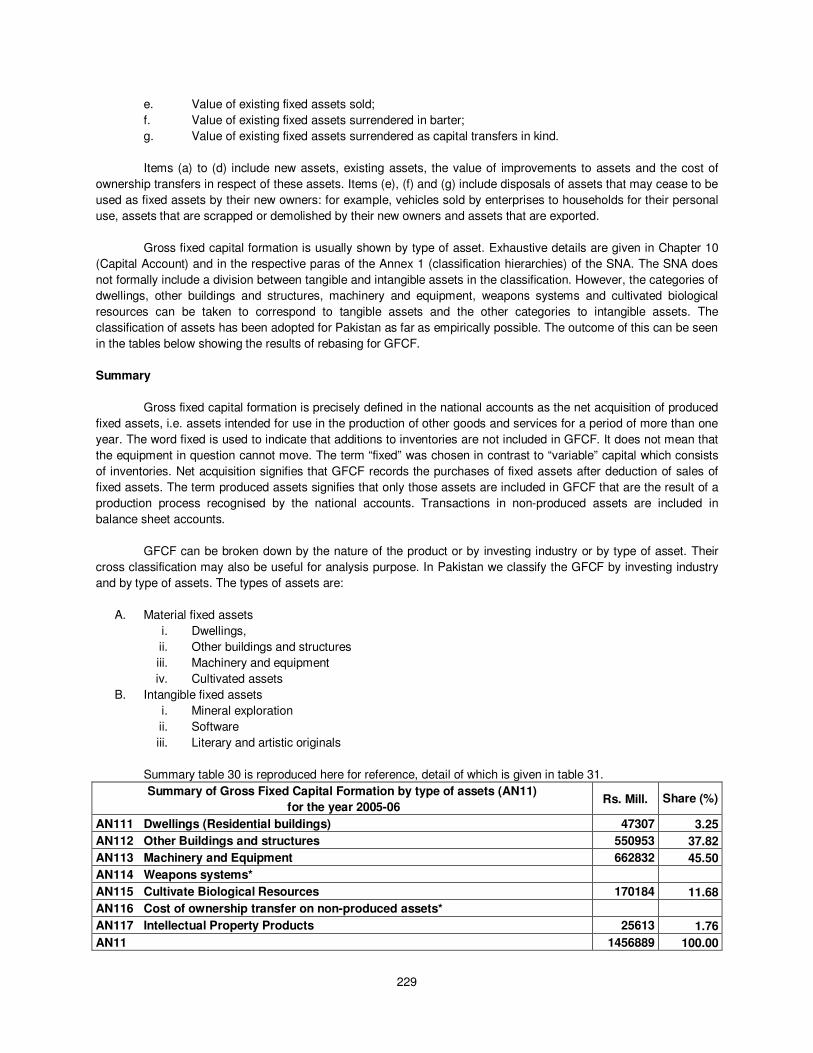
Summary table 30 is reproduced here for reference, detail of which is given in table 31.
Summary of Gross Fixed Capital Formation by type of assets (AN11)
for the year 2005-06 Rs. Mill. Share (%)
AN111 Dwellings (Residential buildings) 47307 3.25
AN112 Other Buildings and structures 550953 37.82
AN113 Machinery and Equipment 662832 45.50
AN114 Weapons systems*
AN115 Cultivate Biological Resources 170184 11.68
AN116 Cost of ownership transfer on non-produced assets*
AN117 Intellectual Property Products 25613 1.76
AN11 1456889 100.00
230
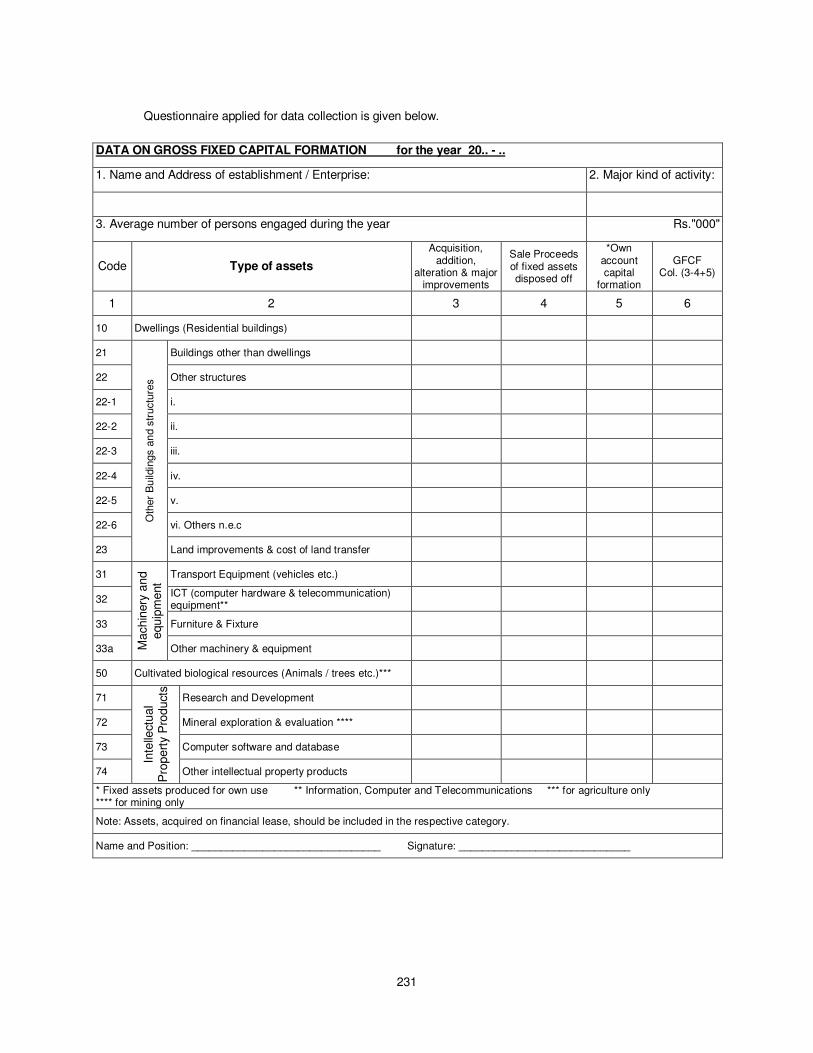
This has been materialized in Pakistan in the questionnaire below which as a standard document is utilized
for surveys on GFCF in various industries. This does not withstand the fact that for empirical reasons we also have
classifications of assets which follow other criteria as, for example, in agriculture.
Gross fixed capital formation is valued at purchasers’ prices, which for the capital goods include
transportation and installation charges as well.
For the measurement of GFCF in Pakistan all four possibilities or a mixture of them are exploited:
• Primary data from surveys by asking the investor
• Secondary data (i.e. without special survey) by utilizing data which are already available
(government budgets and government finance statistics, banking statistics, company reports)
• Commodity flow approach: If information of the investor is not available the amount is derived from
the domestic output or import of goods or services which presumably are object of the capital
formation.
• Proxy estimates from variables which are considered to correlate strongly with capital formation:
loans from banks and other sources.
231
Questionnaire applied for data collection is given below.
DATA ON GROSS FIXED CAPITAL FORMATION for the year 20.. - ..
1. Name and Address of establishment / Enterprise: 2. Major kind of activity:
3. Average number of persons engaged during the year Rs."000"
Code Type of assets
Acquisition, addition,
alteration & major improvements
Sale Proceeds of fixed assets disposed off
*Own account capital
formation
GFCF Col. (3-4+5)
1 2 3 4 5 6
10 Dwellings (Residential buildings)
21
Oth
er
Bu
ildin
gs a
nd s
tructu
res
Buildings other than dwellings
22 Other structures
22-1 i.
22-2 ii.
22-3 iii.
22-4 iv.
22-5 v.
22-6 vi. Others n.e.c
23 Land improvements & cost of land transfer
31
Machin
ery
and
equip
ment
Transport Equipment (vehicles etc.)
32 ICT (computer hardware & telecommunication) equipment**
33 Furniture & Fixture
33a Other machinery & equipment
50 Cultivated biological resources (Animals / trees etc.)***
71
Inte
llect
ual
Pro
pert
y P
roduct
s
Research and Development
72 Mineral exploration & evaluation ****
73 Computer software and database
74 Other intellectual property products
* Fixed assets produced for own use ** Information, Computer and Telecommunications *** for agriculture only **** for mining only
Note: Assets, acquired on financial lease, should be included in the respective category.
Name and Position: ________________________________ Signature: _____________________________
232
Estimation of GFCF
Estimates of private sector are computed by a combination of commodity flow, expenditure (survey method)
and financial approaches. Commodity flow approach which uses the net availability of capital goods in value terms
from domestic production and imports and exports duly adjusted for various margins is applied to the following three
sectors.
i. Agriculture
ii. Construction
iii. Transport
Expenditure approach (survey method) is applied to the following sectors:
i. Mining and quarrying
ii. Large scale manufacturing industries (In-production units)
iii. Small and household manufacturing industries
iv. Electricity generation and distribution, and gas distribution
v. Wholesale and retail trade
vi. Financial institutions
vii. Housing services, real estate including ownership of dwellings
viii. Other private services
ix. General government sector
Financial approach is used to estimate GFCF in under-construction large scale manufacturing industries and
loans disbursed to different industries. Industry wise detailed methodology is given below.
Results of GFCF by Industry
I: Agriculture
Because of different sources of data GFCF in agriculture has been calculated for the private sector and for
the public sector separately. Main components of private GFCF in agriculture are:
i. Imports and domestic production of agriculture machinery
ii. Tube wells installed
iii. Cultivated assets (livestock and timber)
iv. Land improvement
v. Farms and buildings
vi. Wells and bundats
vii. Farm transport
viii. Water courses
ix. Orchards and
x. Non-monetized GFCF.
To estimate GFCF expenditure on farm machinery and implements, the “commodity flow approach” is
applied, using domestic production of agricultural machinery and implements, adjusted for imports and exports. As
the values of this approach are at output prices of the respective manufacturers or at import values, respectively, the
figures have to be enhanced by the trade margins in order to arrive at GFCF at purchasers’ prices. For the old base,
trade margins on imported machinery &equipment and domestic production was taken from study of Wholesale &
Retail Trade 1999-2000 and stood at 42 per cent whereas in new base 2005-06 it has been worked out at 37 per cent
on the basis of CBR publication “Pakistan Custom and Tariff 2005-06”.
In the revised base estimates, the handling charges have been applied @ 3% on total value of imports,
inclusive of all taxes. Note that it is neither trade margin nor transport margin. These are the services rendered by
233
special agents but not independently covered, so as a special case are included over here. A flat rate of 43.7% (taken
from the study on agriculture in 1999-2000) of total (other) monetized GFCF was used to derive the non-monetized
GFCF in the old base and the same has been extrapolated. In the SNA terminology, it is own-account capital
formation and is also a part of output.
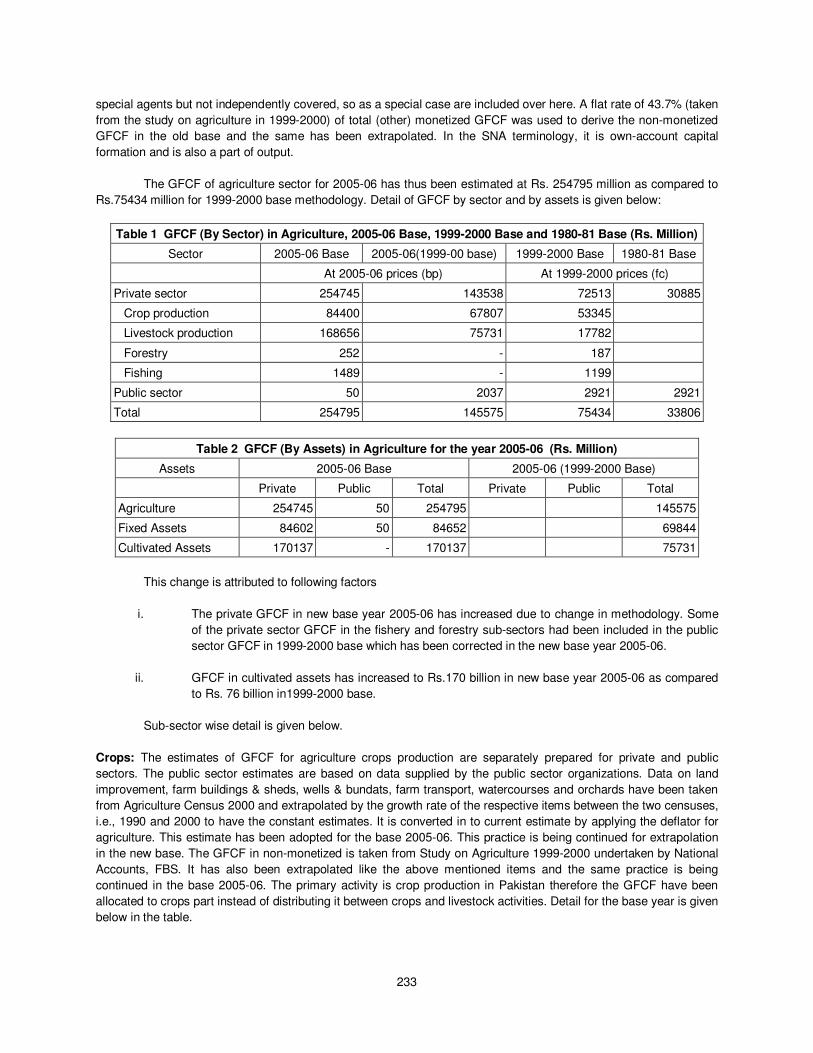
The GFCF of agriculture sector for 2005-06 has thus been estimated at Rs. 254795 million as compared to
Rs.75434 million for 1999-2000 base methodology. Detail of GFCF by sector and by assets is given below:
Table 1 GFCF (By Sector) in Agriculture, 2005-06 Base, 1999-2000 Base and 1980-81 Base (Rs. Million)
Sector 2005-06 Base 2005-06(1999-00 base) 1999-2000 Base 1980-81 Base
At 2005-06 prices (bp) At 1999-2000 prices (fc)
Private sector 254745 143538 72513 30885
Crop production 84400 67807 53345
Livestock production 168656 75731 17782
Forestry 252 - 187
Fishing 1489 - 1199
Public sector 50 2037 2921 2921
Total 254795 145575 75434 33806
Table 2 GFCF (By Assets) in Agriculture for the year 2005-06 (Rs. Million)
Assets 2005-06 Base 2005-06 (1999-2000 Base)
Private Public Total Private Public Total
Agriculture 254745 50 254795 145575
Fixed Assets 84602 50 84652 69844
Cultivated Assets 170137 - 170137 75731
This change is attributed to following factors
i. The private GFCF in new base year 2005-06 has increased due to change in methodology. Some
of the private sector GFCF in the fishery and forestry sub-sectors had been included in the public
sector GFCF in 1999-2000 base which has been corrected in the new base year 2005-06.
ii. GFCF in cultivated assets has increased to Rs.170 billion in new base year 2005-06 as compared
to Rs. 76 billion in1999-2000 base.
Sub-sector wise detail is given below.
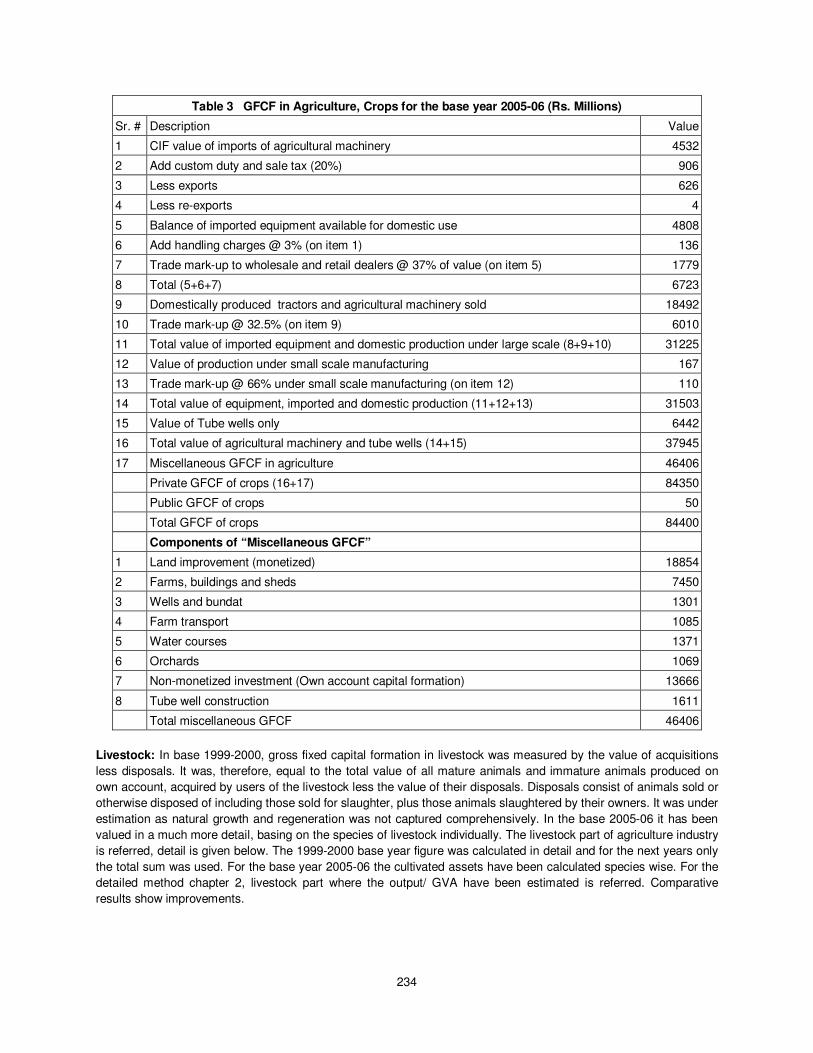
Crops: The estimates of GFCF for agriculture crops production are separately prepared for private and public
sectors. The public sector estimates are based on data supplied by the public sector organizations. Data on land
improvement, farm buildings & sheds, wells & bundats, farm transport, watercourses and orchards have been taken
from Agriculture Census 2000 and extrapolated by the growth rate of the respective items between the two censuses,
i.e., 1990 and 2000 to have the constant estimates. It is converted in to current estimate by applying the deflator for
agriculture. This estimate has been adopted for the base 2005-06. This practice is being continued for extrapolation
in the new base. The GFCF in non-monetized is taken from Study on Agriculture 1999-2000 undertaken by National
Accounts, FBS. It has also been extrapolated like the above mentioned items and the same practice is being
continued in the base 2005-06. The primary activity is crop production in Pakistan therefore the GFCF have been
allocated to crops part instead of distributing it between crops and livestock activities. Detail for the base year is given
below in the table.
234
Table 3 GFCF in Agriculture, Crops for the base year 2005-06 (Rs. Millions)
Sr. # Description Value
1 CIF value of imports of agricultural machinery 4532
2 Add custom duty and sale tax (20%) 906
3 Less exports 626
4 Less re-exports 4
5 Balance of imported equipment available for domestic use 4808
6 Add handling charges @ 3% (on item 1) 136
7 Trade mark-up to wholesale and retail dealers @ 37% of value (on item 5) 1779
8 Total (5+6+7) 6723
9 Domestically produced tractors and agricultural machinery sold 18492
10 Trade mark-up @ 32.5% (on item 9) 6010
11 Total value of imported equipment and domestic production under large scale (8+9+10) 31225
12 Value of production under small scale manufacturing 167
13 Trade mark-up @ 66% under small scale manufacturing (on item 12) 110
14 Total value of equipment, imported and domestic production (11+12+13) 31503
15 Value of Tube wells only 6442
16 Total value of agricultural machinery and tube wells (14+15) 37945
17 Miscellaneous GFCF in agriculture 46406
Private GFCF of crops (16+17) 84350
Public GFCF of crops 50
Total GFCF of crops 84400
Components of “Miscellaneous GFCF”
1 Land improvement (monetized) 18854
2 Farms, buildings and sheds 7450
3 Wells and bundat 1301
4 Farm transport 1085
5 Water courses 1371
6 Orchards 1069
7 Non-monetized investment (Own account capital formation) 13666
8 Tube well construction 1611
Total miscellaneous GFCF 46406
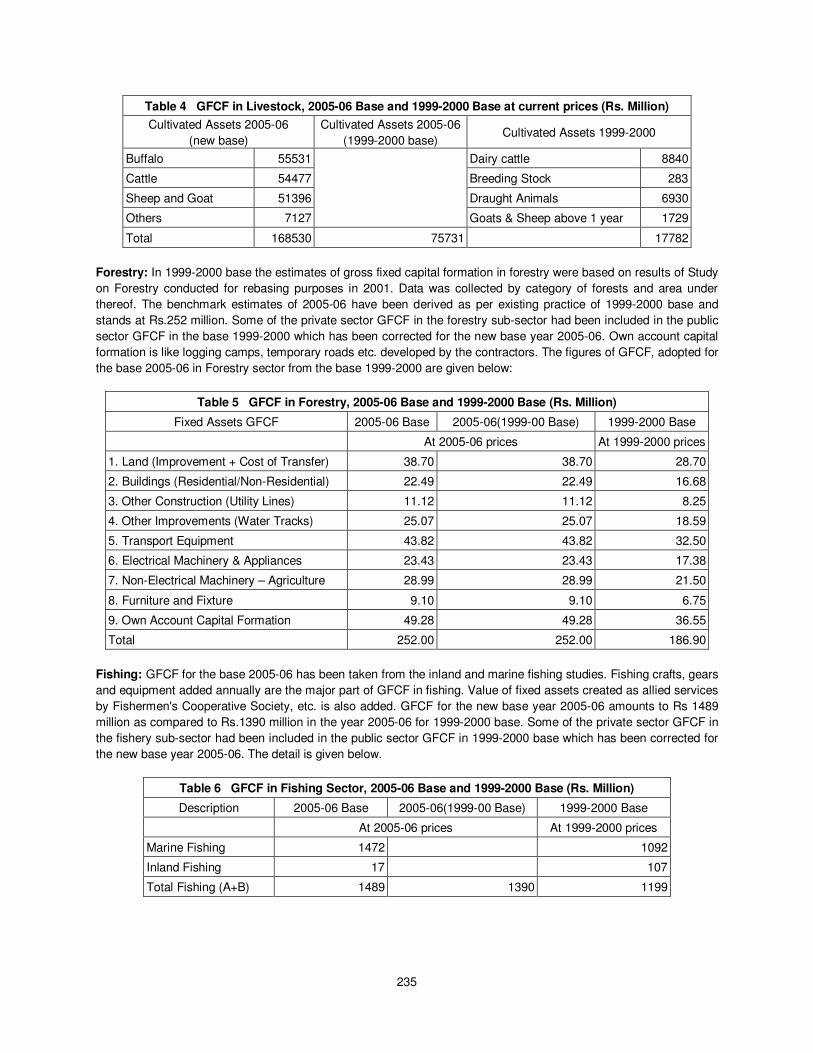
Livestock: In base 1999-2000, gross fixed capital formation in livestock was measured by the value of acquisitions
less disposals. It was, therefore, equal to the total value of all mature animals and immature animals produced on
own account, acquired by users of the livestock less the value of their disposals. Disposals consist of animals sold or
otherwise disposed of including those sold for slaughter, plus those animals slaughtered by their owners. It was under
estimation as natural growth and regeneration was not captured comprehensively. In the base 2005-06 it has been
valued in a much more detail, basing on the species of livestock individually. The livestock part of agriculture industry
is referred, detail is given below. The 1999-2000 base year figure was calculated in detail and for the next years only
the total sum was used. For the base year 2005-06 the cultivated assets have been calculated species wise. For the
detailed method chapter 2, livestock part where the output/ GVA have been estimated is referred. Comparative
results show improvements.
235
Table 4 GFCF in Livestock, 2005-06 Base and 1999-2000 Base at current prices (Rs. Million)
Cultivated Assets 2005-06
(new base)
Cultivated Assets 2005-06
(1999-2000 base) Cultivated Assets 1999-2000
Buffalo 55531
Dairy cattle 8840
Cattle 54477 Breeding Stock 283
Sheep and Goat 51396 Draught Animals 6930
Others 7127 Goats & Sheep above 1 year 1729
Total 168530 75731 17782
Forestry: In 1999-2000 base the estimates of gross fixed capital formation in forestry were based on results of Study
on Forestry conducted for rebasing purposes in 2001. Data was collected by category of forests and area under
thereof. The benchmark estimates of 2005-06 have been derived as per existing practice of 1999-2000 base and
stands at Rs.252 million. Some of the private sector GFCF in the forestry sub-sector had been included in the public
sector GFCF in the base 1999-2000 which has been corrected for the new base year 2005-06. Own account capital
formation is like logging camps, temporary roads etc. developed by the contractors. The figures of GFCF, adopted for
the base 2005-06 in Forestry sector from the base 1999-2000 are given below:
Table 5 GFCF in Forestry, 2005-06 Base and 1999-2000 Base (Rs. Million)
Fixed Assets GFCF 2005-06 Base 2005-06(1999-00 Base) 1999-2000 Base
At 2005-06 prices At 1999-2000 prices
1. Land (Improvement + Cost of Transfer) 38.70 38.70 28.70
2. Buildings (Residential/Non-Residential) 22.49 22.49 16.68
3. Other Construction (Utility Lines) 11.12 11.12 8.25
4. Other Improvements (Water Tracks) 25.07 25.07 18.59
5. Transport Equipment 43.82 43.82 32.50
6. Electrical Machinery & Appliances 23.43 23.43 17.38
7. Non-Electrical Machinery – Agriculture 28.99 28.99 21.50
8. Furniture and Fixture 9.10 9.10 6.75
9. Own Account Capital Formation 49.28 49.28 36.55
Total 252.00 252.00 186.90
Fishing: GFCF for the base 2005-06 has been taken from the inland and marine fishing studies. Fishing crafts, gears
and equipment added annually are the major part of GFCF in fishing. Value of fixed assets created as allied services
by Fishermen's Cooperative Society, etc. is also added. GFCF for the new base year 2005-06 amounts to Rs 1489
million as compared to Rs.1390 million in the year 2005-06 for 1999-2000 base. Some of the private sector GFCF in
the fishery sub-sector had been included in the public sector GFCF in 1999-2000 base which has been corrected for
the new base year 2005-06. The detail is given below.
Table 6 GFCF in Fishing Sector, 2005-06 Base and 1999-2000 Base (Rs. Million)
Description 2005-06 Base 2005-06(1999-00 Base) 1999-2000 Base
At 2005-06 prices At 1999-2000 prices
Marine Fishing 1472 1092
Inland Fishing 17 107
Total Fishing (A+B) 1489 1390 1199
236
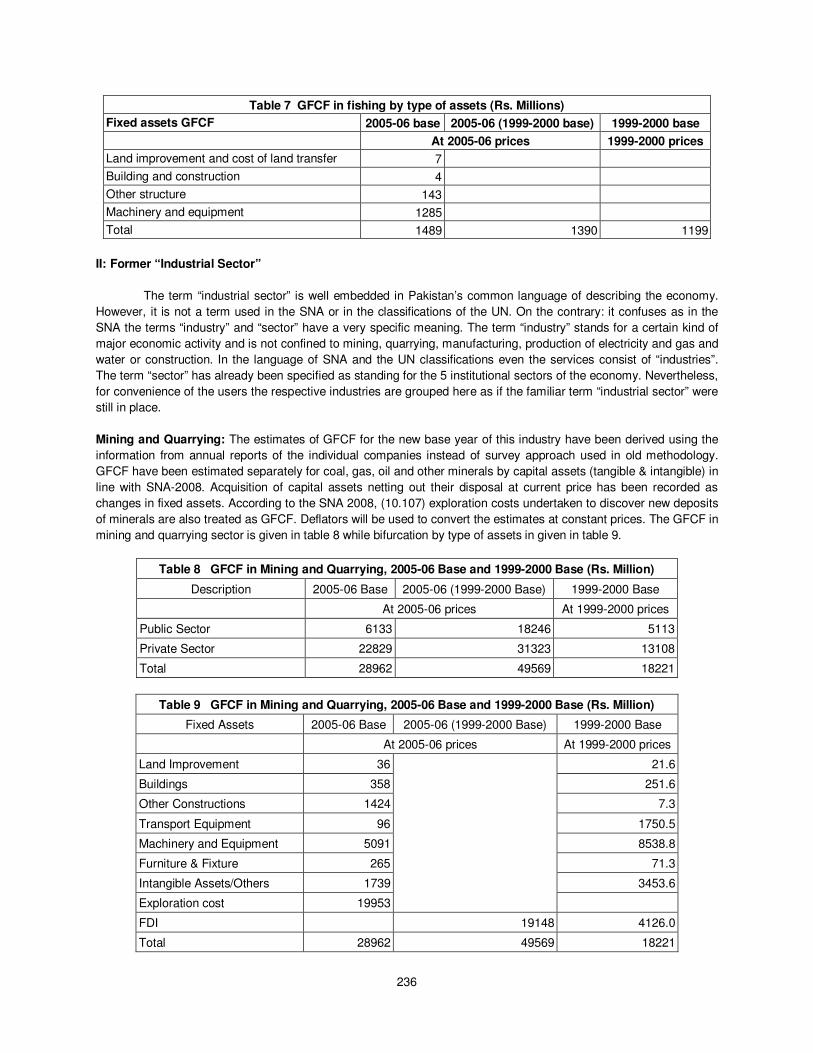
Table 7 GFCF in fishing by type of assets (Rs. Millions)
Fixed assets GFCF 2005-06 base 2005-06 (1999-2000 base) 1999-2000 base
At 2005-06 prices 1999-2000 prices
Land improvement and cost of land transfer 7
Building and construction 4
Other structure 143
Machinery and equipment 1285
Total 1489 1390 1199
II: Former “Industrial Sector”
The term “industrial sector” is well embedded in Pakistan’s common language of describing the economy.
However, it is not a term used in the SNA or in the classifications of the UN. On the contrary: it confuses as in the
SNA the terms “industry” and “sector” have a very specific meaning. The term “industry” stands for a certain kind of
major economic activity and is not confined to mining, quarrying, manufacturing, production of electricity and gas and
water or construction. In the language of SNA and the UN classifications even the services consist of “industries”.
The term “sector” has already been specified as standing for the 5 institutional sectors of the economy. Nevertheless,
for convenience of the users the respective industries are grouped here as if the familiar term “industrial sector” were
still in place.
Mining and Quarrying: The estimates of GFCF for the new base year of this industry have been derived using the
information from annual reports of the individual companies instead of survey approach used in old methodology.
GFCF have been estimated separately for coal, gas, oil and other minerals by capital assets (tangible & intangible) in
line with SNA-2008. Acquisition of capital assets netting out their disposal at current price has been recorded as
changes in fixed assets. According to the SNA 2008, (10.107) exploration costs undertaken to discover new deposits
of minerals are also treated as GFCF. Deflators will be used to convert the estimates at constant prices. The GFCF in
mining and quarrying sector is given in table 8 while bifurcation by type of assets in given in table 9.
Table 8 GFCF in Mining and Quarrying, 2005-06 Base and 1999-2000 Base (Rs. Million)
Description 2005-06 Base 2005-06 (1999-2000 Base) 1999-2000 Base
At 2005-06 prices At 1999-2000 prices
Public Sector 6133 18246 5113
Private Sector 22829 31323 13108
Total 28962 49569 18221
Table 9 GFCF in Mining and Quarrying, 2005-06 Base and 1999-2000 Base (Rs. Million)
Fixed Assets 2005-06 Base 2005-06 (1999-2000 Base) 1999-2000 Base
At 2005-06 prices At 1999-2000 prices
Land Improvement 36 21.6
Buildings 358 251.6
Other Constructions 1424 7.3
Transport Equipment 96 1750.5
Machinery and Equipment 5091 8538.8
Furniture & Fixture 265 71.3
Intangible Assets/Others 1739 3453.6
Exploration cost 19953
FDI 19148 4126.0
Total 28962 49569 18221
237
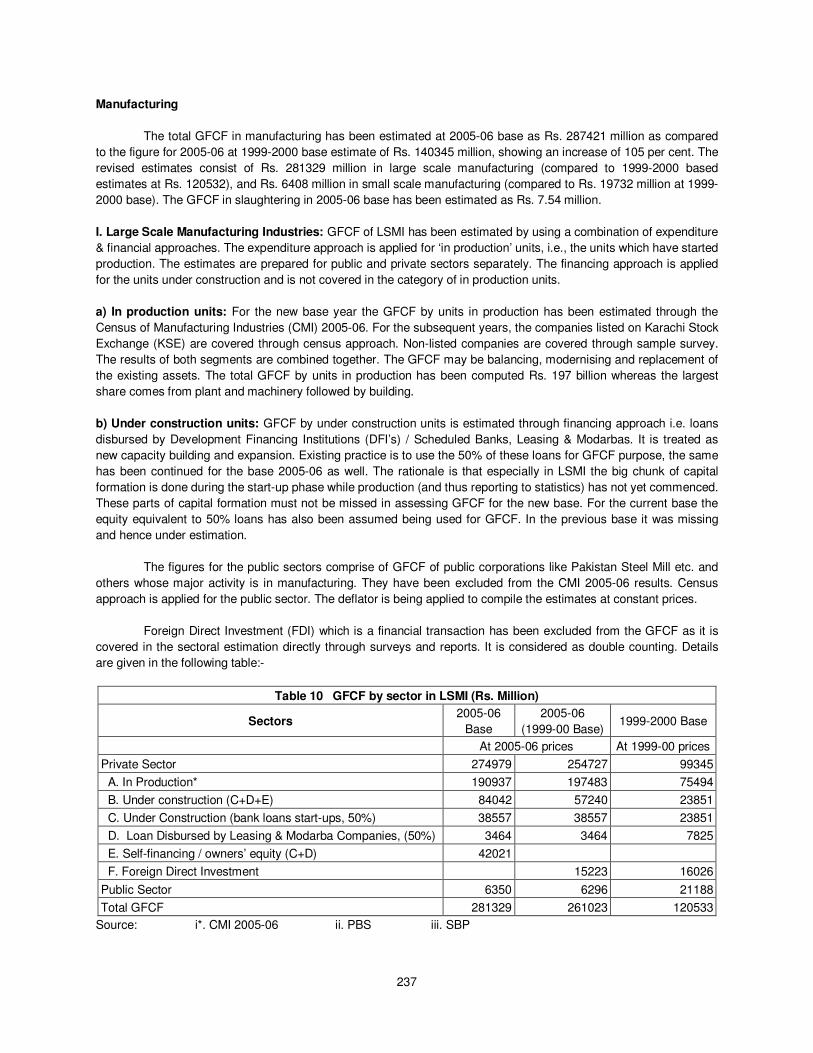
Manufacturing
The total GFCF in manufacturing has been estimated at 2005-06 base as Rs. 287421 million as compared
to the figure for 2005-06 at 1999-2000 base estimate of Rs. 140345 million, showing an increase of 105 per cent. The
revised estimates consist of Rs. 281329 million in large scale manufacturing (compared to 1999-2000 based
estimates at Rs. 120532), and Rs. 6408 million in small scale manufacturing (compared to Rs. 19732 million at 1999-
2000 base). The GFCF in slaughtering in 2005-06 base has been estimated as Rs. 7.54 million.
I. Large Scale Manufacturing Industries: GFCF of LSMI has been estimated by using a combination of expenditure
& financial approaches. The expenditure approach is applied for ‘in production’ units, i.e., the units which have started
production. The estimates are prepared for public and private sectors separately. The financing approach is applied
for the units under construction and is not covered in the category of in production units.
a) In production units: For the new base year the GFCF by units in production has been estimated through the
Census of Manufacturing Industries (CMI) 2005-06. For the subsequent years, the companies listed on Karachi Stock
Exchange (KSE) are covered through census approach. Non-listed companies are covered through sample survey.
The results of both segments are combined together. The GFCF may be balancing, modernising and replacement of
the existing assets. The total GFCF by units in production has been computed Rs. 197 billion whereas the largest
share comes from plant and machinery followed by building.
b) Under construction units: GFCF by under construction units is estimated through financing approach i.e. loans
disbursed by Development Financing Institutions (DFI’s) / Scheduled Banks, Leasing & Modarbas. It is treated as
new capacity building and expansion. Existing practice is to use the 50% of these loans for GFCF purpose, the same
has been continued for the base 2005-06 as well. The rationale is that especially in LSMI the big chunk of capital
formation is done during the start-up phase while production (and thus reporting to statistics) has not yet commenced.
These parts of capital formation must not be missed in assessing GFCF for the new base. For the current base the
equity equivalent to 50% loans has also been assumed being used for GFCF. In the previous base it was missing
and hence under estimation.
The figures for the public sectors comprise of GFCF of public corporations like Pakistan Steel Mill etc. and
others whose major activity is in manufacturing. They have been excluded from the CMI 2005-06 results. Census
approach is applied for the public sector. The deflator is being applied to compile the estimates at constant prices.
Foreign Direct Investment (FDI) which is a financial transaction has been excluded from the GFCF as it is
covered in the sectoral estimation directly through surveys and reports. It is considered as double counting. Details
are given in the following table:-
Table 10 GFCF by sector in LSMI (Rs. Million)
Sectors 2005-06
Base
2005-06
(1999-00 Base) 1999-2000 Base
At 2005-06 prices At 1999-00 prices
Private Sector 274979 254727 99345
A. In Production* 190937 197483 75494
B. Under construction (C+D+E) 84042 57240 23851
C. Under Construction (bank loans start-ups, 50%) 38557 38557 23851
D. Loan Disbursed by Leasing & Modarba Companies, (50%) 3464 3464 7825
E. Self-financing / owners’ equity (C+D) 42021
F. Foreign Direct Investment 15223 16026
Public Sector 6350 6296 21188
Total GFCF 281329 261023 120533
Source: i*. CMI 2005-06 ii. PBS iii. SBP
238
II. Small and Household Manufacturing Industries: In the previous base 1999-2000 the estimates of GFCF in
small scale manufacturing were derived from the study conducted for the change of base and stood at Rs. 19732
million. The same were extrapolated at constant prices by applying the fixed growth rate of 9.44 per cent as proposed
in the study. The estimates of GFCF on old base were on higher side. The estimates for the new base year 2005-06
have been derived from the survey on Small and Household Manufacturing Industries 2006-07 conducted for the
change of base of National Accounts. The GFCF for the year 2006-07 stands at Rs.6758 million. The GFCF at
current prices for the year 2006-07 has been converted into constant prices by applying the deflator and stands at
Rs.6207 million. The GFCF at constant prices for the year 2006-07 has been extrapolated backward by applying the
constant growth rate of 7.36 (the inter survey annual compound growth rate of GFCF between 1996-97 and 2006-07)
and stands at Rs.5781 million for the new base year 2005-06. Once the level of contribution of small scale sub-sector
to GFCF for the base year has been assessed then the annual estimates at constant prices will be extrapolated by
applying the constant growth rate of 7.36 per cent. The estimates at constant prices are converted into current prices
by applying a deflator. GFCF was Rs. 19732 million in the base year 1999-2000 which was Rs. 65767 million in 2005-
06 at current prices for the same base.
III. Slaughtering: The GFCF in slaughtering is made in the construction of buildings, machinery and equipment.
GFCF was estimated through study on slaughtering for the base year 1999-2000. Total GFCF in slaughtering during
2005-06 at 1999-2000 base was estimated as Rs. 7.54 million which has been adopted for the base year 2005-06.
For subsequent years the estimates of GFCF at constant prices for slaughtering subsector is being extrapolated by
using the growth rate of meat production. Deflator will be used to convert the constant prices GFCF estimates into
current prices.
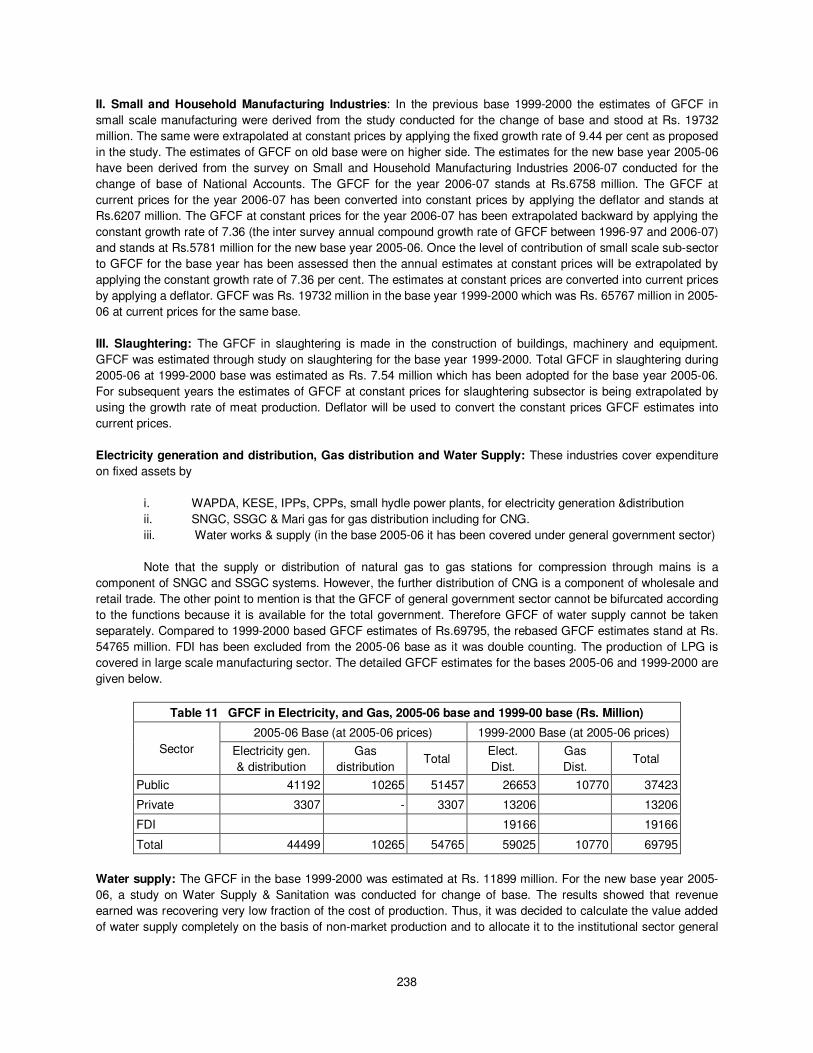
Electricity generation and distribution, Gas distribution and Water Supply: These industries cover expenditure
on fixed assets by
i. WAPDA, KESE, IPPs, CPPs, small hydle power plants, for electricity generation &distribution
ii. SNGC, SSGC & Mari gas for gas distribution including for CNG.
iii. Water works & supply (in the base 2005-06 it has been covered under general government sector)
Note that the supply or distribution of natural gas to gas stations for compression through mains is a
component of SNGC and SSGC systems. However, the further distribution of CNG is a component of wholesale and
retail trade. The other point to mention is that the GFCF of general government sector cannot be bifurcated according
to the functions because it is available for the total government. Therefore GFCF of water supply cannot be taken
separately. Compared to 1999-2000 based GFCF estimates of Rs.69795, the rebased GFCF estimates stand at Rs.
54765 million. FDI has been excluded from the 2005-06 base as it was double counting. The production of LPG is
covered in large scale manufacturing sector. The detailed GFCF estimates for the bases 2005-06 and 1999-2000 are
given below.
Table 11 GFCF in Electricity, and Gas, 2005-06 base and 1999-00 base (Rs. Million)
Sector
2005-06 Base (at 2005-06 prices) 1999-2000 Base (at 2005-06 prices)
Electricity gen.
& distribution
Gas
distribution Total
Elect.
Dist.
Gas
Dist. Total
Public 41192 10265 51457 26653 10770 37423
Private 3307 - 3307 13206 13206
FDI 19166 19166
Total 44499 10265 54765 59025 10770 69795
Water supply: The GFCF in the base 1999-2000 was estimated at Rs. 11899 million. For the new base year 2005-
06, a study on Water Supply & Sanitation was conducted for change of base. The results showed that revenue
earned was recovering very low fraction of the cost of production. Thus, it was decided to calculate the value added
of water supply completely on the basis of non-market production and to allocate it to the institutional sector general
239
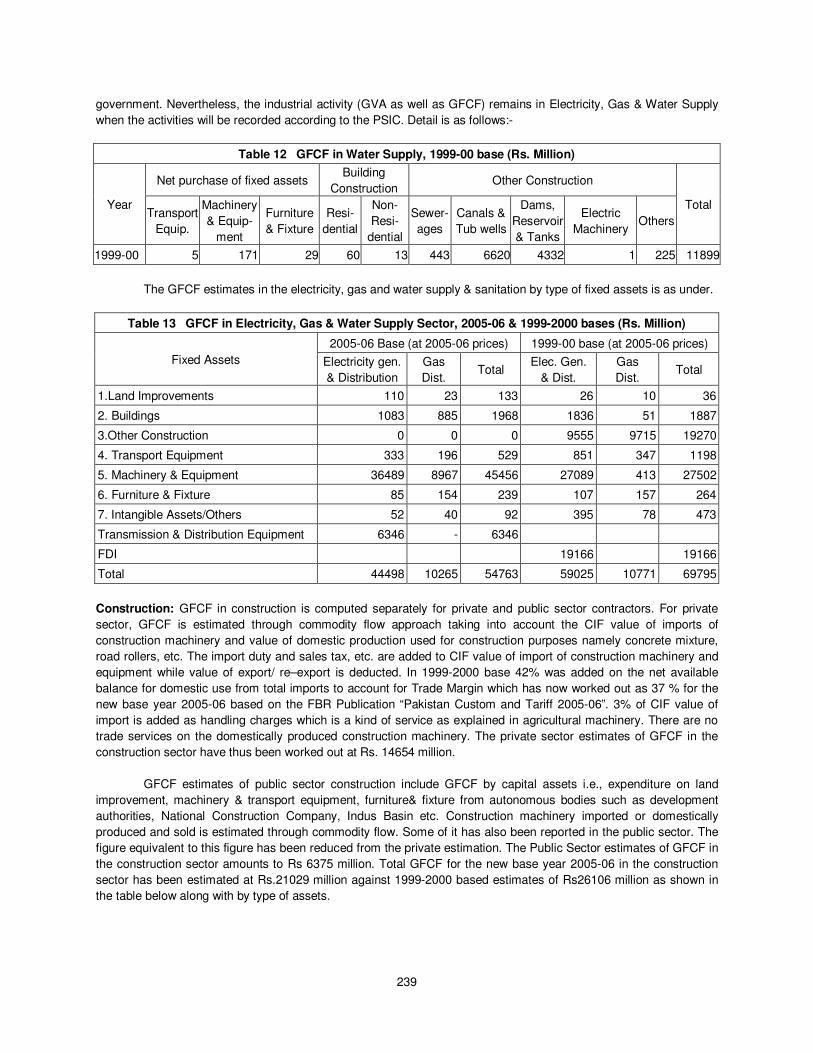
government. Nevertheless, the industrial activity (GVA as well as GFCF) remains in Electricity, Gas & Water Supply
when the activities will be recorded according to the PSIC. Detail is as follows:-
Table 12 GFCF in Water Supply, 1999-00 base (Rs. Million)
Year
Net purchase of fixed assets Building
Construction Other Construction
Total Transport
Equip.
Machinery
& Equip-
ment
Furniture
& Fixture
Resi-
dential
Non-
Resi-
dential
Sewer-
ages
Canals &
Tub wells
Dams,
Reservoir
& Tanks
Electric
Machinery Others
1999-00 5 171 29 60 13 443 6620 4332 1 225 11899
The GFCF estimates in the electricity, gas and water supply & sanitation by type of fixed assets is as under.
Table 13 GFCF in Electricity, Gas & Water Supply Sector, 2005-06 & 1999-2000 bases (Rs. Million)
Fixed Assets
2005-06 Base (at 2005-06 prices) 1999-00 base (at 2005-06 prices)
Electricity gen.
& Distribution
Gas
Dist. Total
Elec. Gen.
& Dist.
Gas
Dist. Total
1.Land Improvements 110 23 133 26 10 36
2. Buildings 1083 885 1968 1836 51 1887
3.Other Construction 0 0 0 9555 9715 19270
4. Transport Equipment 333 196 529 851 347 1198
5. Machinery & Equipment 36489 8967 45456 27089 413 27502
6. Furniture & Fixture 85 154 239 107 157 264
7. Intangible Assets/Others 52 40 92 395 78 473
Transmission & Distribution Equipment 6346 - 6346
FDI 19166 19166
Total 44498 10265 54763 59025 10771 69795
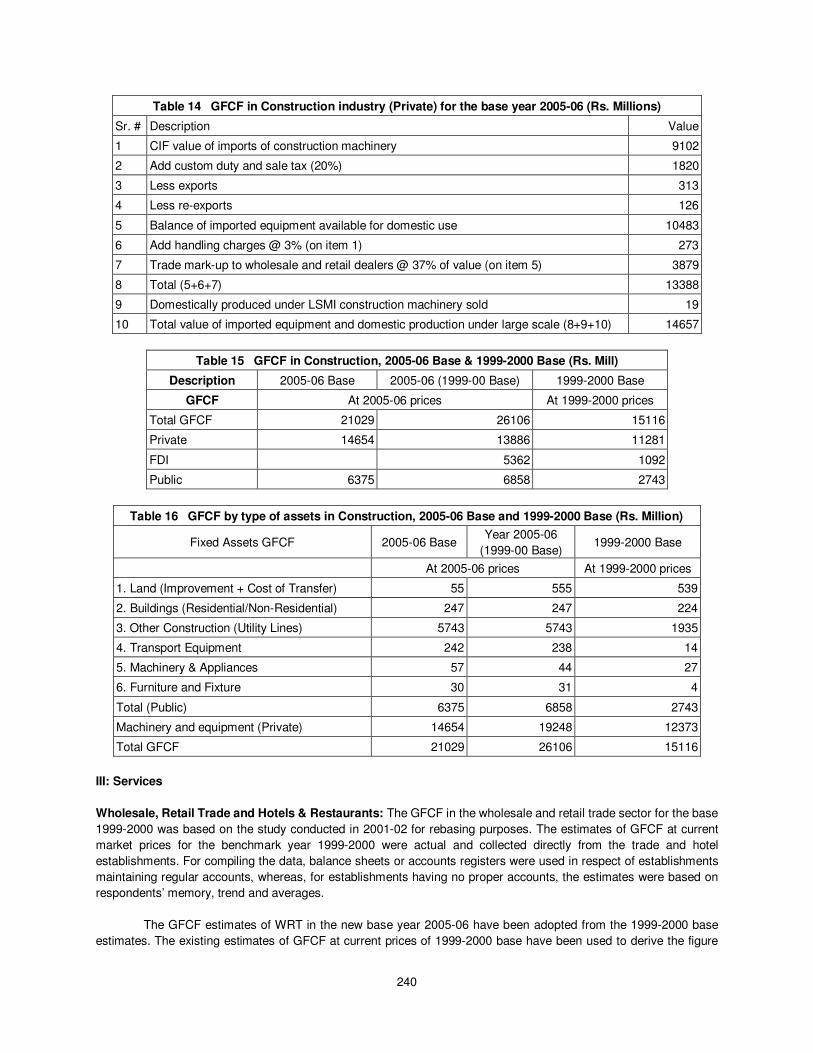
Construction: GFCF in construction is computed separately for private and public sector contractors. For private
sector, GFCF is estimated through commodity flow approach taking into account the CIF value of imports of
construction machinery and value of domestic production used for construction purposes namely concrete mixture,
road rollers, etc. The import duty and sales tax, etc. are added to CIF value of import of construction machinery and
equipment while value of export/ re–export is deducted. In 1999-2000 base 42% was added on the net available
balance for domestic use from total imports to account for Trade Margin which has now worked out as 37 % for the
new base year 2005-06 based on the FBR Publication “Pakistan Custom and Tariff 2005-06”. 3% of CIF value of
import is added as handling charges which is a kind of service as explained in agricultural machinery. There are no
trade services on the domestically produced construction machinery. The private sector estimates of GFCF in the
construction sector have thus been worked out at Rs. 14654 million.
GFCF estimates of public sector construction include GFCF by capital assets i.e., expenditure on land
improvement, machinery & transport equipment, furniture& fixture from autonomous bodies such as development
authorities, National Construction Company, Indus Basin etc. Construction machinery imported or domestically
produced and sold is estimated through commodity flow. Some of it has also been reported in the public sector. The
figure equivalent to this figure has been reduced from the private estimation. The Public Sector estimates of GFCF in
the construction sector amounts to Rs 6375 million. Total GFCF for the new base year 2005-06 in the construction
sector has been estimated at Rs.21029 million against 1999-2000 based estimates of Rs26106 million as shown in
the table below along with by type of assets.
240
Table 14 GFCF in Construction industry (Private) for the base year 2005-06 (Rs. Millions)
Sr. # Description Value
1 CIF value of imports of construction machinery 9102
2 Add custom duty and sale tax (20%) 1820
3 Less exports 313
4 Less re-exports 126
5 Balance of imported equipment available for domestic use 10483
6 Add handling charges @ 3% (on item 1) 273
7 Trade mark-up to wholesale and retail dealers @ 37% of value (on item 5) 3879
8 Total (5+6+7) 13388
9 Domestically produced under LSMI construction machinery sold 19
10 Total value of imported equipment and domestic production under large scale (8+9+10) 14657
Table 15 GFCF in Construction, 2005-06 Base & 1999-2000 Base (Rs. Mill)
Description 2005-06 Base 2005-06 (1999-00 Base) 1999-2000 Base
GFCF At 2005-06 prices At 1999-2000 prices
Total GFCF 21029 26106 15116
Private 14654 13886 11281
FDI 5362 1092
Public 6375 6858 2743
Table 16 GFCF by type of assets in Construction, 2005-06 Base and 1999-2000 Base (Rs. Million)
Fixed Assets GFCF 2005-06 Base Year 2005-06
(1999-00 Base) 1999-2000 Base
At 2005-06 prices At 1999-2000 prices
1. Land (Improvement + Cost of Transfer) 55 555 539
2. Buildings (Residential/Non-Residential) 247 247 224
3. Other Construction (Utility Lines) 5743 5743 1935
4. Transport Equipment 242 238 14
5. Machinery & Appliances 57 44 27
6. Furniture and Fixture 30 31 4
Total (Public) 6375 6858 2743
Machinery and equipment (Private) 14654 19248 12373
Total GFCF 21029 26106 15116
III: Services
Wholesale, Retail Trade and Hotels & Restaurants: The GFCF in the wholesale and retail trade sector for the base
1999-2000 was based on the study conducted in 2001-02 for rebasing purposes. The estimates of GFCF at current
market prices for the benchmark year 1999-2000 were actual and collected directly from the trade and hotel
establishments. For compiling the data, balance sheets or accounts registers were used in respect of establishments
maintaining regular accounts, whereas, for establishments having no proper accounts, the estimates were based on
respondents’ memory, trend and averages.
The GFCF estimates of WRT in the new base year 2005-06 have been adopted from the 1999-2000 base
estimates. The existing estimates of GFCF at current prices of 1999-2000 base have been used to derive the figure
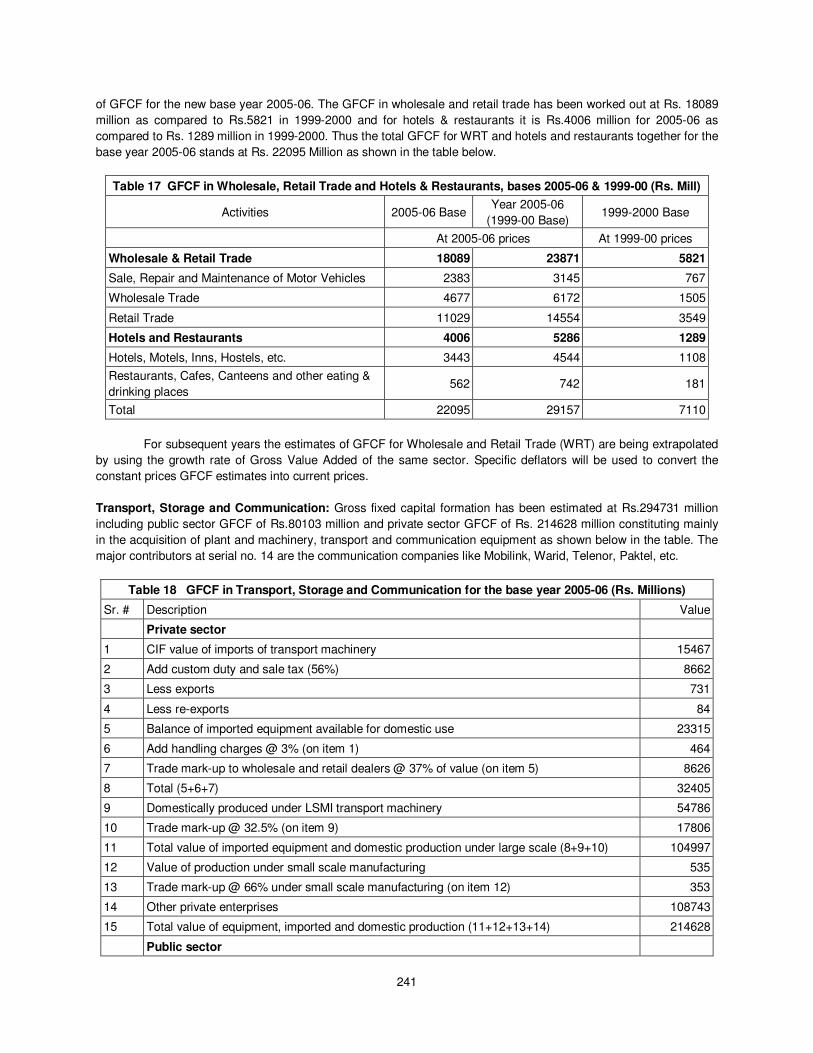
241
of GFCF for the new base year 2005-06. The GFCF in wholesale and retail trade has been worked out at Rs. 18089
million as compared to Rs.5821 in 1999-2000 and for hotels & restaurants it is Rs.4006 million for 2005-06 as
compared to Rs. 1289 million in 1999-2000. Thus the total GFCF for WRT and hotels and restaurants together for the
base year 2005-06 stands at Rs. 22095 Million as shown in the table below.
Table 17 GFCF in Wholesale, Retail Trade and Hotels & Restaurants, bases 2005-06 & 1999-00 (Rs. Mill)
Activities 2005-06 Base Year 2005-06
(1999-00 Base) 1999-2000 Base
At 2005-06 prices At 1999-00 prices
Wholesale & Retail Trade 18089 23871 5821
Sale, Repair and Maintenance of Motor Vehicles 2383 3145 767
Wholesale Trade 4677 6172 1505
Retail Trade 11029 14554 3549
Hotels and Restaurants 4006 5286 1289
Hotels, Motels, Inns, Hostels, etc. 3443 4544 1108
Restaurants, Cafes, Canteens and other eating &
drinking places 562 742 181
Total 22095 29157 7110
For subsequent years the estimates of GFCF for Wholesale and Retail Trade (WRT) are being extrapolated
by using the growth rate of Gross Value Added of the same sector. Specific deflators will be used to convert the
constant prices GFCF estimates into current prices.
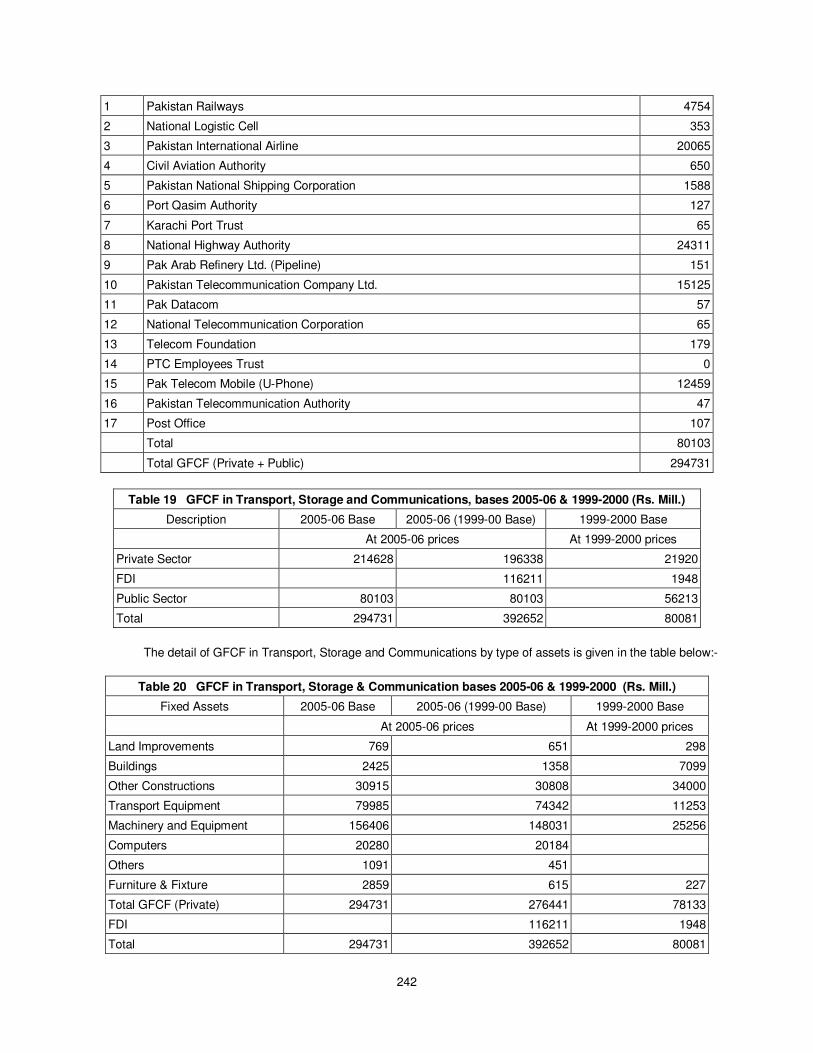
Transport, Storage and Communication: Gross fixed capital formation has been estimated at Rs.294731 million
including public sector GFCF of Rs.80103 million and private sector GFCF of Rs. 214628 million constituting mainly
in the acquisition of plant and machinery, transport and communication equipment as shown below in the table. The
major contributors at serial no. 14 are the communication companies like Mobilink, Warid, Telenor, Paktel, etc.
Table 18 GFCF in Transport, Storage and Communication for the base year 2005-06 (Rs. Millions)
Sr. # Description Value
Private sector
1 CIF value of imports of transport machinery 15467
2 Add custom duty and sale tax (56%) 8662
3 Less exports 731
4 Less re-exports 84
5 Balance of imported equipment available for domestic use 23315
6 Add handling charges @ 3% (on item 1) 464
7 Trade mark-up to wholesale and retail dealers @ 37% of value (on item 5) 8626
8 Total (5+6+7) 32405
9 Domestically produced under LSMI transport machinery 54786
10 Trade mark-up @ 32.5% (on item 9) 17806
11 Total value of imported equipment and domestic production under large scale (8+9+10) 104997
12 Value of production under small scale manufacturing 535
13 Trade mark-up @ 66% under small scale manufacturing (on item 12) 353
14 Other private enterprises 108743
15 Total value of equipment, imported and domestic production (11+12+13+14) 214628
Public sector
242
1 Pakistan Railways 4754
2 National Logistic Cell 353
3 Pakistan International Airline 20065
4 Civil Aviation Authority 650
5 Pakistan National Shipping Corporation 1588
6 Port Qasim Authority 127
7 Karachi Port Trust 65
8 National Highway Authority 24311
9 Pak Arab Refinery Ltd. (Pipeline) 151
10 Pakistan Telecommunication Company Ltd. 15125
11 Pak Datacom 57
12 National Telecommunication Corporation 65
13 Telecom Foundation 179
14 PTC Employees Trust 0
15 Pak Telecom Mobile (U-Phone) 12459
16 Pakistan Telecommunication Authority 47
17 Post Office 107
Total 80103
Total GFCF (Private + Public) 294731
Table 19 GFCF in Transport, Storage and Communications, bases 2005-06 & 1999-2000 (Rs. Mill.)
Description 2005-06 Base 2005-06 (1999-00 Base) 1999-2000 Base
At 2005-06 prices At 1999-2000 prices
Private Sector 214628 196338 21920
FDI 116211 1948
Public Sector 80103 80103 56213
Total 294731 392652 80081
The detail of GFCF in Transport, Storage and Communications by type of assets is given in the table below:-
Table 20 GFCF in Transport, Storage & Communication bases 2005-06 & 1999-2000 (Rs. Mill.)
Fixed Assets 2005-06 Base 2005-06 (1999-00 Base) 1999-2000 Base
At 2005-06 prices At 1999-2000 prices
Land Improvements 769 651 298
Buildings 2425 1358 7099
Other Constructions 30915 30808 34000
Transport Equipment 79985 74342 11253
Machinery and Equipment 156406 148031 25256
Computers 20280 20184
Others 1091 451
Furniture & Fixture 2859 615 227
Total GFCF (Private) 294731 276441 78133
FDI 116211 1948
Total 294731 392652 80081
243
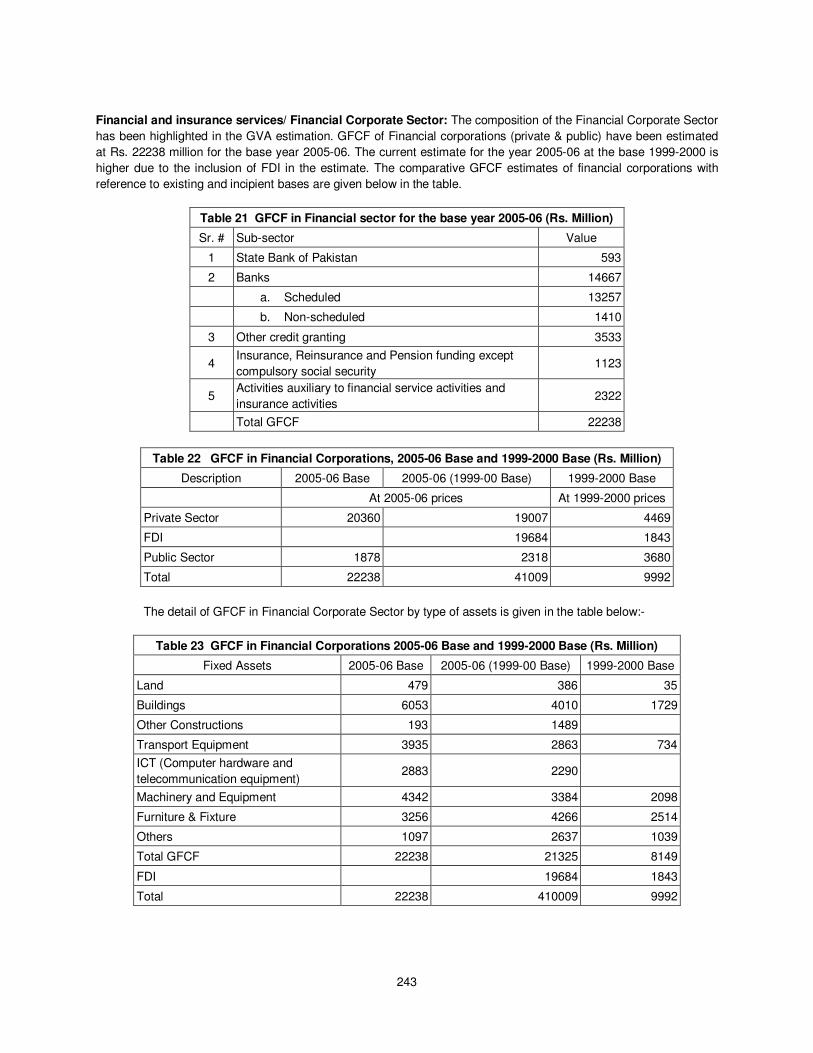
Financial and insurance services/ Financial Corporate Sector: The composition of the Financial Corporate Sector
has been highlighted in the GVA estimation. GFCF of Financial corporations (private & public) have been estimated
at Rs. 22238 million for the base year 2005-06. The current estimate for the year 2005-06 at the base 1999-2000 is
higher due to the inclusion of FDI in the estimate. The comparative GFCF estimates of financial corporations with
reference to existing and incipient bases are given below in the table.
Table 21 GFCF in Financial sector for the base year 2005-06 (Rs. Million)
Sr. # Sub-sector Value
1 State Bank of Pakistan 593
2 Banks 14667
a. Scheduled 13257
b. Non-scheduled 1410
3 Other credit granting 3533
4 Insurance, Reinsurance and Pension funding except
compulsory social security 1123
5 Activities auxiliary to financial service activities and
insurance activities 2322
Total GFCF 22238
Table 22 GFCF in Financial Corporations, 2005-06 Base and 1999-2000 Base (Rs. Million)
Description 2005-06 Base 2005-06 (1999-00 Base) 1999-2000 Base
At 2005-06 prices At 1999-2000 prices
Private Sector 20360 19007 4469
FDI 19684 1843
Public Sector 1878 2318 3680
Total 22238 41009 9992
The detail of GFCF in Financial Corporate Sector by type of assets is given in the table below:-
Table 23 GFCF in Financial Corporations 2005-06 Base and 1999-2000 Base (Rs. Million)
Fixed Assets 2005-06 Base 2005-06 (1999-00 Base) 1999-2000 Base
Land 479 386 35
Buildings 6053 4010 1729
Other Constructions 193 1489
Transport Equipment 3935 2863 734
ICT (Computer hardware and
telecommunication equipment) 2883 2290
Machinery and Equipment 4342 3384 2098
Furniture & Fixture 3256 4266 2514
Others 1097 2637 1039
Total GFCF 22238 21325 8149
FDI 19684 1843
Total 22238 410009 9992
244
Housing Services (including ownership of dwellings): Housing services is comprised of three sub-sectors namely
Ownership of Dwellings, Real Estate and Cooperative Housing Societies. GFCF of this sector is compiled through
expenditure on following by type of fixed assets.
i. New Buildings
ii. Cost of ownership transferred
iii. Alterations/Additions
iv. Major Repair & Maintenance
The methodology for compilation of Gross Fixed Capital Formation in each component of the housing
services is explained below. Other types of assets like computers, furniture and fixture etc. are components acquired
by the real estate and cooperative housing societies and have been included in these sub-components.
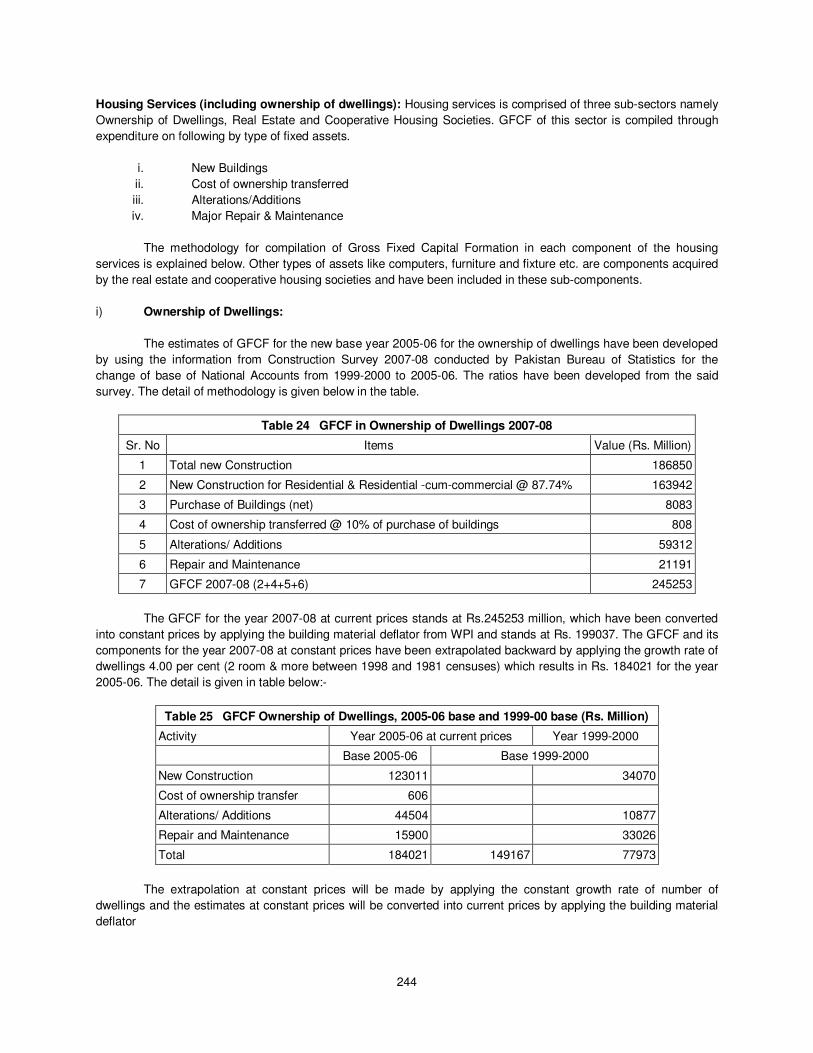
i) Ownership of Dwellings:
The estimates of GFCF for the new base year 2005-06 for the ownership of dwellings have been developed
by using the information from Construction Survey 2007-08 conducted by Pakistan Bureau of Statistics for the
change of base of National Accounts from 1999-2000 to 2005-06. The ratios have been developed from the said
survey. The detail of methodology is given below in the table.
Table 24 GFCF in Ownership of Dwellings 2007-08
Sr. No Items Value (Rs. Million)
1 Total new Construction 186850
2 New Construction for Residential & Residential -cum-commercial @ 87.74% 163942
3 Purchase of Buildings (net) 8083
4 Cost of ownership transferred @ 10% of purchase of buildings 808
5 Alterations/ Additions 59312
6 Repair and Maintenance 21191
7 GFCF 2007-08 (2+4+5+6) 245253
The GFCF for the year 2007-08 at current prices stands at Rs.245253 million, which have been converted
into constant prices by applying the building material deflator from WPI and stands at Rs. 199037. The GFCF and its
components for the year 2007-08 at constant prices have been extrapolated backward by applying the growth rate of
dwellings 4.00 per cent (2 room & more between 1998 and 1981 censuses) which results in Rs. 184021 for the year
2005-06. The detail is given in table below:-
Table 25 GFCF Ownership of Dwellings, 2005-06 base and 1999-00 base (Rs. Million)
Activity Year 2005-06 at current prices Year 1999-2000
Base 2005-06 Base 1999-2000
New Construction 123011 34070
Cost of ownership transfer 606
Alterations/ Additions 44504 10877
Repair and Maintenance 15900 33026
Total 184021 149167 77973
The extrapolation at constant prices will be made by applying the constant growth rate of number of
dwellings and the estimates at constant prices will be converted into current prices by applying the building material
deflator
245
ii) Real Estate and Cooperative Housing Societies
The estimates of GFCF for the new base year 2005-06 for the Real Estate and Cooperative Housing
Societies sub-sectors have been developed by using the information from Survey of “Social, Recreational,
Community & Personal Services, Real Estate Activities and Renting of Machinery /Equipment 2007-08” and “Survey
on Cooperative Societies 2007-08” conducted for the change of base of National Accounts from 1999-2000 to 2005-
06. The GFCF in the year 2007-08 stands at Rs.223 million and Rs.7915 million for the real estate and cooperative
societies respectively. The total GFCF at current prices (Rs.8138 million) real estate and cooperative societies have
been converted into constant prices by applying the deflator of building material and stands at Rs. 6605 million. The
GFCF for the year 2007-08 at constant prices have been extrapolated backward by applying the growth rate of
dwellings i.e., 4.0 per cent and stands at Rs. 6106 million for the new base year 2005-06.
The extrapolation at constant prices will be made by applying the constant growth rate of number of
dwellings and the estimated at constant prices will be converted into current prices by applying the building material
deflator. The total GFCF in Housing Services (including ownership of dwellings) at current prices for the year 2005-06
stands at Rs. 190127 million.
Other Private Services: “Other Private Services” are pure private sector services. It was named as “Social,
Community and Personal Services” in the 1999-2000 base. They comprise Renting of Machinery and Equipment,
Computer Related Activities (Software Export Board), Computer Related Activities (PASHA), Other Business
Activities, Education, Health & Social work, Membership Organizations, NGO’s, Recreational, Cultural and Sporting
Activities and Other Services activities. GFCF for each type of services were estimated separately. The methodology
for compilation of Gross Fixed Capital Formation (GFCF) in each sub-sector of private services is explained below:-
1) Renting of Machinery and Equipment
The GFCF estimates for Renting of Machinery and Equipment have been derived from the Survey of
“Social, Recreational, Community & Personal Services, Real Estate Activities and Renting of Machinery /Equipment
2007-08”. The GFCF for the year 2007-08 stands at Rs.732 million which have been extrapolated backward by
applying the growth rate of Gross Value Added (QIM) of the same industry at current prices and stands at Rs.675
million for the new base year 2005-06. The extrapolation at current prices is made by applying the growth rate of
Gross Value Added of Renting of Machinery and Equipment at current prices.
2) Computer Related Activities (Software Export Board / PASHA)
For the rationale of the partition of this industry into the two components “Software Export Board” and
“PASHA” see chapter 4 part F. The GFCF estimates of Computer Related Activities (Software Export Board) have
been compiled by using the information given in the ‘Study on Computer Related Services 2005-06’ and stands at
Rs.1584 million and Rs.1696 million for the years 2005-06 and 2006-07 respectively. The extrapolation of GFCF at
current prices will be made by applying the growth rate of Gross Value Added of Computer Related Activities
(Software Export Board) at current prices.
The total GFCF at current prices for Computer Related Activities on the base 1999-2000 was Rs.6109
million. The difference between the old base GFCF at current prices (Rs.6109 million) and the Computer Related
Activities covered by Software Export Board (Rs.1584 million) has been used as the GFCF for the Computer Related
Activities covered by PASHA and stands at Rs.4525 million for the new base year 2005-06. The estimates of GFCF
at current prices will be extrapolated by applying the growth rate of Gross Value Added of Computer Related
Activities (PASHA) at current prices.
3) Other Business Activities
The existing estimates of GFCF in ‘Other Business Activities’ at current prices of 1999-2000 base have been
used to derive the figure of GFCF for the new base year 2005-06. The total GFCF for the new base year 2005-06
246
stands at Rs.40447 Million. The extrapolation of Gross Fixed Capital Formation at current prices will be made by
applying the growth rate of Gross Value Added of Other Business Activities at current prices.
4) Education
The GFCF estimates for Education (private sector only) have been derived from the Survey of “Social,
Recreational, Community & Personal Services, Real Estate Activities and Renting of Machinery /Equipment 2007-
08”. The GFCF for the year 2007-08 stands at Rs.2930 million which have been extrapolated backward by applying
the growth rate of Gross Value Added of the same sub-sector at current prices and stands at Rs.2495 million for the
new base year 2005-06. The estimates of Gross Fixed Capital Formation will be extrapolated at current prices by
applying the growth rate of Gross Value Added of (private sector) Education at current prices. NGOs working in
education have also been included here.
5) Health & Social work
The estimates of Gross Fixed Capital Formation for Health & Social Work (private sector only) have been
derived from the data on National Health Accounts for the year 2009-10 which stands at Rs.13783 million. The
estimates of 2009-10 have been extrapolated backward by applying the growth rate of Gross Value Added at current
prices of the same industry and stands at Rs.8200 million for the new base year 2005-06. The extrapolation at current
prices will be made by applying the growth rate of Gross Value Added of Health & Social work (private sector) at
current prices. NGOs working in this group have also been included here.
6) Membership Organizations
The GFCF estimates for Membership Organizations have been derived from the Survey of “Social,
Recreational, Community & Personal Services, Real Estate Activities and Renting of Machinery /Equipment 2007-
08”. The GFCF for the year 2007-08 stands at Rs.1019 million which have been extrapolated backward by applying
the growth rate of Gross Value Added of the same sub-sector at current prices and stands at Rs.760 million for the
new base year 2005-06. The GFCF estimates will be extrapolated at current prices by applying the growth rate of
Gross Value Added of Membership Organizations at current prices.
7) NGOs
This component has been discussed in detail in the GVA estimation, chapter 4, part F is referred. It is a
combination of three sub groups, i.e., NGOs working in education, health and social work. Their contribution has
been separated and merged in the respective groups. The estimates of Gross Fixed Capital Formation for NGOs
have been compiled by using the information given in the ‘Survey of NGOs 2005-06’ conducted for the change of
base of National Accounts from 1999-2000 to 2005-06 and stands at Rs. 20614 million for the new base year 2005-
06. The estimates of Gross Fixed Capital Formation at current prices for NGOs have been extrapolated forward by
applying the growth rate of Gross Value Added of the NGOs at current prices.
8) Recreational, Cultural and Sporting Activities
The existing estimates of Gross Fixed Capital Formation in the Recreational, Cultural and Sporting Activities
at current prices of 1999-2000 base have been used to derive the figure of GFCF for the new base year 2005-06. The
total GFCF for the new base year 2005-06 stands at Rs.2649 Million. The GFCF estimates at current prices will be
extrapolated by applying the growth rate of Gross Value Added of Recreational, Cultural and Sporting Activities at
current prices.
9) Other Services activities
The GFCF estimates for Other Services activities (private sector only) have been derived from the Survey of
“Social, Recreational, Community & Personal Services, Real Estate Activities and Renting of Machinery /Equipment
2007-08” conducted for the change of base of National Accounts from 1999-2000 to 2005-06. The GFCF for the year
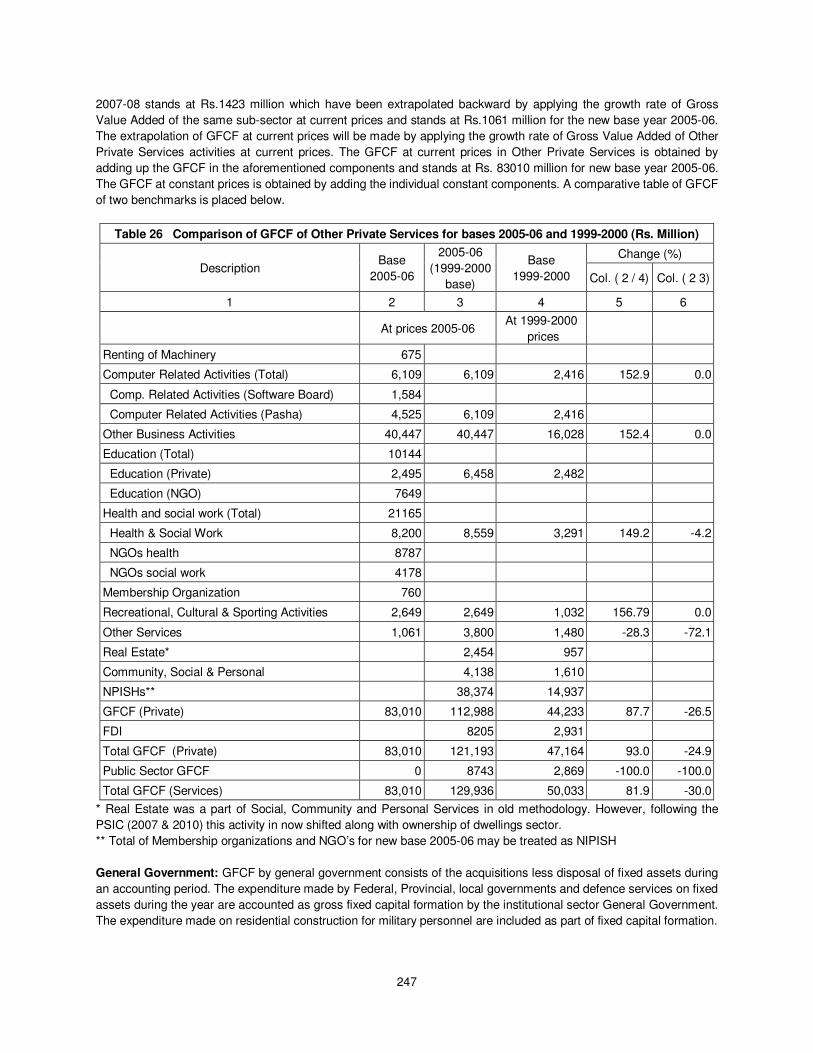
247
2007-08 stands at Rs.1423 million which have been extrapolated backward by applying the growth rate of Gross
Value Added of the same sub-sector at current prices and stands at Rs.1061 million for the new base year 2005-06.
The extrapolation of GFCF at current prices will be made by applying the growth rate of Gross Value Added of Other
Private Services activities at current prices. The GFCF at current prices in Other Private Services is obtained by
adding up the GFCF in the aforementioned components and stands at Rs. 83010 million for new base year 2005-06.
The GFCF at constant prices is obtained by adding the individual constant components. A comparative table of GFCF
of two benchmarks is placed below.
Table 26 Comparison of GFCF of Other Private Services for bases 2005-06 and 1999-2000 (Rs. Million)
Description Base
2005-06
2005-06
(1999-2000
base)
Base
1999-2000
Change (%)
Col. ( 2 / 4) Col. ( 2 3)
1 2 3 4 5 6
At prices 2005-06 At 1999-2000
prices
Renting of Machinery 675
Computer Related Activities (Total) 6,109 6,109 2,416 152.9 0.0
Comp. Related Activities (Software Board) 1,584
Computer Related Activities (Pasha) 4,525 6,109 2,416
Other Business Activities 40,447 40,447 16,028 152.4 0.0
Education (Total) 10144
Education (Private) 2,495 6,458 2,482
Education (NGO) 7649
Health and social work (Total) 21165
Health & Social Work 8,200 8,559 3,291 149.2 -4.2
NGOs health 8787
NGOs social work 4178
Membership Organization 760
Recreational, Cultural & Sporting Activities 2,649 2,649 1,032 156.79 0.0
Other Services 1,061 3,800 1,480 -28.3 -72.1
Real Estate* 2,454 957
Community, Social & Personal 4,138 1,610
NPISHs**
38,374 14,937
GFCF (Private) 83,010 112,988 44,233 87.7 -26.5
FDI 8205 2,931
Total GFCF (Private) 83,010 121,193 47,164 93.0 -24.9
Public Sector GFCF 0 8743 2,869 -100.0 -100.0
Total GFCF (Services) 83,010 129,936 50,033 81.9 -30.0
* Real Estate was a part of Social, Community and Personal Services in old methodology. However, following the
PSIC (2007 & 2010) this activity in now shifted along with ownership of dwellings sector.
** Total of Membership organizations and NGO’s for new base 2005-06 may be treated as NIPISH
General Government: GFCF by general government consists of the acquisitions less disposal of fixed assets during
an accounting period. The expenditure made by Federal, Provincial, local governments and defence services on fixed
assets during the year are accounted as gross fixed capital formation by the institutional sector General Government.
The expenditure made on residential construction for military personnel are included as part of fixed capital formation.
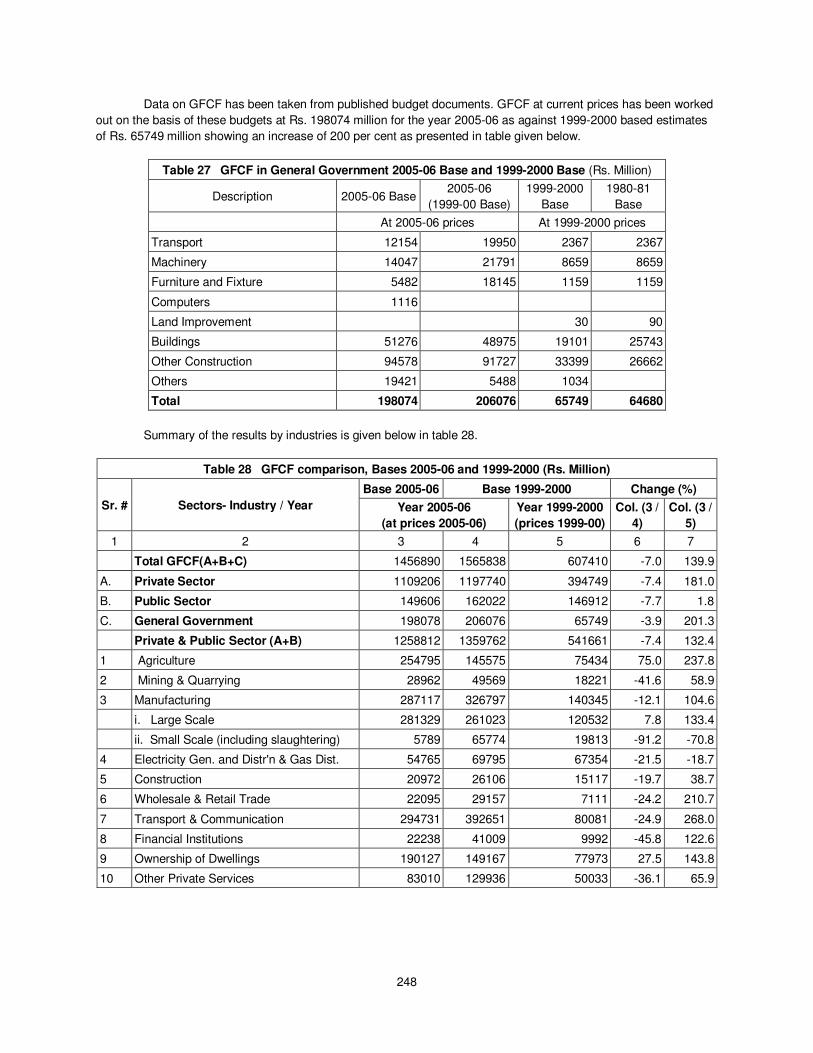
248
Data on GFCF has been taken from published budget documents. GFCF at current prices has been worked
out on the basis of these budgets at Rs. 198074 million for the year 2005-06 as against 1999-2000 based estimates
of Rs. 65749 million showing an increase of 200 per cent as presented in table given below.
Table 27 GFCF in General Government 2005-06 Base and 1999-2000 Base (Rs. Million)
Description 2005-06 Base 2005-06
(1999-00 Base)
1999-2000
Base
1980-81
Base
At 2005-06 prices At 1999-2000 prices
Transport 12154 19950 2367 2367
Machinery 14047 21791 8659 8659
Furniture and Fixture 5482 18145 1159 1159
Computers 1116
Land Improvement 30 90
Buildings 51276 48975 19101 25743
Other Construction 94578 91727 33399 26662
Others 19421 5488 1034
Total 198074 206076 65749 64680
Summary of the results by industries is given below in table 28.
Table 28 GFCF comparison, Bases 2005-06 and 1999-2000 (Rs. Million)
Sr. # Sectors- Industry / Year
Base 2005-06 Base 1999-2000 Change (%)
Year 2005-06
(at prices 2005-06)
Year 1999-2000
(prices 1999-00)
Col. (3 /
4)
Col. (3 /
5)
1 2 3 4 5 6 7
Total GFCF(A+B+C) 1456890 1565838 607410 -7.0 139.9
A. Private Sector 1109206 1197740 394749 -7.4 181.0
B. Public Sector 149606 162022 146912 -7.7 1.8
C. General Government 198078 206076 65749 -3.9 201.3
Private & Public Sector (A+B) 1258812 1359762 541661 -7.4 132.4
1 Agriculture 254795 145575 75434 75.0 237.8
2 Mining & Quarrying 28962 49569 18221 -41.6 58.9
3 Manufacturing 287117 326797 140345 -12.1 104.6
i. Large Scale 281329 261023 120532 7.8 133.4
ii. Small Scale (including slaughtering) 5789 65774 19813 -91.2 -70.8
4 Electricity Gen. and Distr'n & Gas Dist. 54765 69795 67354 -21.5 -18.7
5 Construction 20972 26106 15117 -19.7 38.7
6 Wholesale & Retail Trade 22095 29157 7111 -24.2 210.7
7 Transport & Communication 294731 392651 80081 -24.9 268.0
8 Financial Institutions 22238 41009 9992 -45.8 122.6
9 Ownership of Dwellings 190127 149167 77973 27.5 143.8
10 Other Private Services 83010 129936 50033 -36.1 65.9
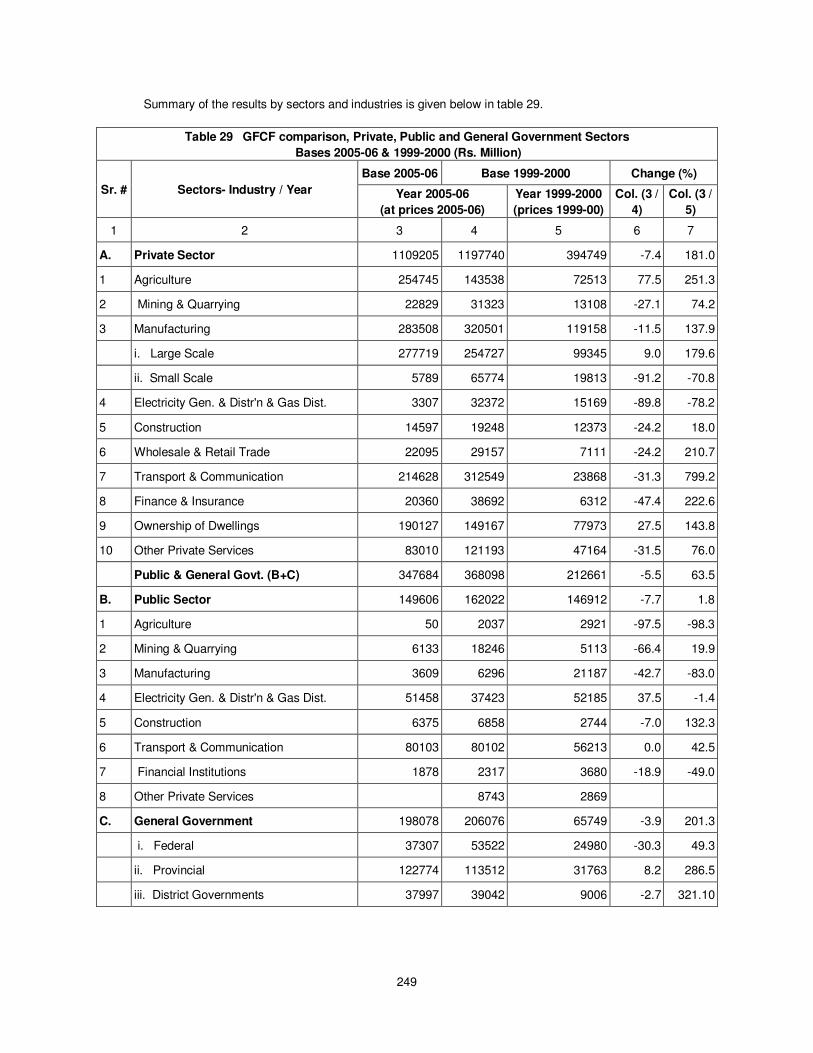
249
Summary of the results by sectors and industries is given below in table 29.
Table 29 GFCF comparison, Private, Public and General Government Sectors
Bases 2005-06 & 1999-2000 (Rs. Million)
Sr. # Sectors- Industry / Year
Base 2005-06 Base 1999-2000 Change (%)
Year 2005-06
(at prices 2005-06)
Year 1999-2000
(prices 1999-00)
Col. (3 /
4)
Col. (3 /
5)
1 2 3 4 5 6 7
A. Private Sector 1109205 1197740 394749 -7.4 181.0
1 Agriculture 254745 143538 72513 77.5 251.3
2 Mining & Quarrying 22829 31323 13108 -27.1 74.2
3 Manufacturing 283508 320501 119158 -11.5 137.9
i. Large Scale 277719 254727 99345 9.0 179.6
ii. Small Scale 5789 65774 19813 -91.2 -70.8
4 Electricity Gen. & Distr'n & Gas Dist. 3307 32372 15169 -89.8 -78.2
5 Construction 14597 19248 12373 -24.2 18.0
6 Wholesale & Retail Trade 22095 29157 7111 -24.2 210.7
7 Transport & Communication 214628 312549 23868 -31.3 799.2
8 Finance & Insurance 20360 38692 6312 -47.4 222.6
9 Ownership of Dwellings 190127 149167 77973 27.5 143.8
10 Other Private Services 83010 121193 47164 -31.5 76.0
Public & General Govt. (B+C) 347684 368098 212661 -5.5 63.5
B. Public Sector 149606 162022 146912 -7.7 1.8
1 Agriculture 50 2037 2921 -97.5 -98.3
2 Mining & Quarrying 6133 18246 5113 -66.4 19.9
3 Manufacturing 3609 6296 21187 -42.7 -83.0
4 Electricity Gen. & Distr'n & Gas Dist. 51458 37423 52185 37.5 -1.4
5 Construction 6375 6858 2744 -7.0 132.3
6 Transport & Communication 80103 80102 56213 0.0 42.5
7 Financial Institutions 1878 2317 3680 -18.9 -49.0
8 Other Private Services 8743 2869
C. General Government 198078 206076 65749 -3.9 201.3
i. Federal 37307 53522 24980 -30.3 49.3
ii. Provincial 122774 113512 31763 8.2 286.5
iii. District Governments 37997 39042 9006 -2.7 321.10
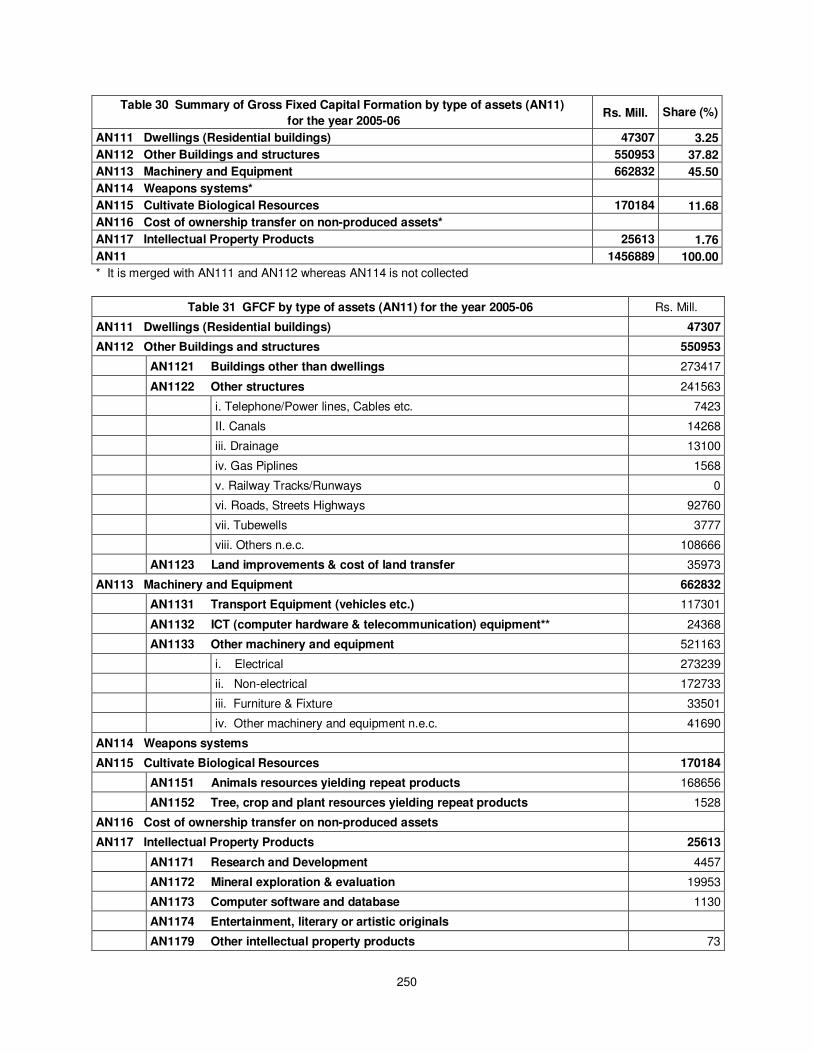
250
Table 30 Summary of Gross Fixed Capital Formation by type of assets (AN11)
for the year 2005-06 Rs. Mill. Share (%)
AN111 Dwellings (Residential buildings) 47307 3.25
AN112 Other Buildings and structures 550953 37.82
AN113 Machinery and Equipment 662832 45.50
AN114 Weapons systems*
AN115 Cultivate Biological Resources 170184 11.68
AN116 Cost of ownership transfer on non-produced assets*
AN117 Intellectual Property Products 25613 1.76
AN11 1456889 100.00
* It is merged with AN111 and AN112 whereas AN114 is not collected
Table 31 GFCF by type of assets (AN11) for the year 2005-06 Rs. Mill.
AN111 Dwellings (Residential buildings) 47307
AN112 Other Buildings and structures 550953
AN1121 Buildings other than dwellings 273417
AN1122 Other structures 241563
i. Telephone/Power lines, Cables etc. 7423
II. Canals 14268
iii. Drainage 13100
iv. Gas Piplines 1568
v. Railway Tracks/Runways 0
vi. Roads, Streets Highways 92760
vii. Tubewells 3777
viii. Others n.e.c. 108666
AN1123 Land improvements & cost of land transfer 35973
AN113 Machinery and Equipment 662832
AN1131 Transport Equipment (vehicles etc.) 117301
AN1132 ICT (computer hardware & telecommunication) equipment** 24368
AN1133 Other machinery and equipment 521163
i. Electrical 273239
ii. Non-electrical 172733
iii. Furniture & Fixture 33501
iv. Other machinery and equipment n.e.c. 41690
AN114 Weapons systems
AN115 Cultivate Biological Resources 170184
AN1151 Animals resources yielding repeat products 168656
AN1152 Tree, crop and plant resources yielding repeat products 1528
AN116 Cost of ownership transfer on non-produced assets
AN117 Intellectual Property Products 25613
AN1171 Research and Development 4457
AN1172 Mineral exploration & evaluation 19953
AN1173 Computer software and database 1130
AN1174 Entertainment, literary or artistic originals
AN1179 Other intellectual property products 73
251
D. Changes in inventories and acquisitions less disposals of valuables
I. Inventory
‘Changes in inventories’ refers to the value of physical change in the stocks of raw material, work-in-
progress and finished goods held by industries and producers of government services as per details given below:
Goods producing industries
- Material and supplies
- Work-in-progress
- Livestock except breeding stock, dairy cattle and the like (which forms GFCF, instead)
- Finished goods
Wholesale & retail trade
Other industries
Producers of government services
Inventories consist of stocks of outputs that are still held by the units that produced them prior to their being
further processed, sold, delivered to other units or used in other ways and stocks of products acquired from other
units that are intended to be used for intermediate consumption or for resale without further processing. Inventories of
services consist of work-in- progress or finished products, for example architectural drawings, which are in the
process of completion or are completed and waiting for the building to which they relate to be started. Inventories
held by government include, but are not limited to, inventories of strategic materials, and grain and other commodities
of special importance to the nation.
Changes in inventories are measured by the value of the entries into inventories less the value of
withdrawals and less the value of any recurrent losses of goods held in inventories during the accounting period.
When a good is entered into inventories it is acquired as an asset by the enterprise in its capacity as owner either by
purchase (or barter) or by an internal transaction with itself as the producer. Conversely, a good leaving inventories
represents the disposal of an asset by the owner either by sale or other use, by an internal transfer to the producer or
possibly as a result of recurrent losses (recurrent wastage, accidental damage or pilfering).
Most goods going into inventories simply remain there until they are withdrawn in the same state as when
they entered. Not infrequently, the price of the goods will have increased while they are in inventories, but these
increases are not due to production but are simply holding gains. The indication that storage is being undertaken as a
production activity is that the price of the good stored, relative to the general level of prices, is expected to increase
by a certain amount over a predetermined time. The goods in storage are classified as work-in-progress and not
finished goods. The increase in value during the accounting period up to the expected level at that time is treated as
production of storage; any difference from this level is treated as a holding gain or loss.
The transactions in the capital account relating to inventories show the change in the level of inventories of
each type. The changes comprise the additions less withdrawals and less regular losses from inventories. Each of
the categories is described and defined below.
Materials and supplies consist of all products that an enterprise holds in inventory with the intention of using
them as intermediate inputs into production.
Work-in-progress consists of output that is not yet sufficiently processed to be sold. Work-in-progress occurs
in all industries, but is especially important in those in which some time is needed to produce the goods, for example,
in agriculture, or in industries producing complex fixed assets such as ships, dwellings, software or films. Work-in-
progress is subdivided between work-in-progress on cultivated assets and other work-in-progress. Work-in-progress
on cultivated biological resources consists of output that is not yet sufficiently mature to be in a state in which it is
normally supplied to other institutional units. Other work-in-progress consists of output (other than on cultivated
biological resources) that is not yet sufficiently processed to be in a state in which it is normally supplied to other
institutional units.
252
Finished goods consist of goods produced as outputs that their producer does not intend to process further
before supplying them to other institutional units. Military inventories consist of single-use items, such as
ammunition, missiles, rockets, bombs, etc., delivered by weapons or weapons systems. Goods for resale are goods
acquired by enterprises, such as wholesalers or retailers, for the purpose of reselling them to their customers. Goods
for resale are not processed further by the enterprises that purchase them, except for presenting them for resale in
ways that are attractive to their customers. Thus, goods for resale may be transported, stored, graded, sorted,
washed, packaged, etc. by their owners but are not otherwise transformed. By convention, goods acquired by
government for distribution as social transfers in kind but that have not yet been so delivered are also included in
goods for resale.
In Pakistan it is not directly estimated. Its estimation is the continuity of the previous bases. Fresh estimation
is needed, a study is recommended.
II. Valuables
Valuables are not used primarily for purposes of production or consumption but are held as stores of value
over time. Valuables are expected to appreciate or at least not to decline in real value, nor to deteriorate over time
under normal conditions. They consist of precious metals and stones, jewellery, works of art, etc. Valuables may be
held by all sectors of the economy. Costs of ownership transfer, such as valuers’ and auctioneers’ margins, are
treated as gross capital formation and included in the value of the items.
Precious metals and stones are treated as valuables when they are not held by enterprises for sale or use
as inputs into processes of production nor are held as monetary gold and are not held as a financial asset in the form
of unallocated metal accounts. Paintings, sculptures, etc., recognized as works of art and antiques are treated as
valuables when they are not held by enterprises for sale. In principle, museum exhibits are included under valuables.
Other valuables not elsewhere classified include such items as collections of stamps, coins, china, books etc. that
have a recognized market value and fine jewellery, fashioned out of precious stones, and metals of significant and
realizable value.
The category of valuables has been introduced with the SNA 1993. It was argued that this category should
fill the gap in the system as jewellery etc, indeed, is neither consumption good nor physical asset in a production
process. For the conceptual purity and beauty and comprehensiveness of the System of National Accounts it is
reasonable to include this item though in most countries the amount is negligible and difficult to estimate. In Pakistan
valuables are mainly hold by households. However, the amount of the overall value or, what is needed most, the
annual amount of net additions to valuables, is not known. For simplicity we assume that the net addition to valuables
is nil. The same holds for produced net additions to the cultural assets in the museums of the country.
E. Exports and Imports of goods and services
In national accounts exports and imports are recorded at the moment at which the legal ownership of the
goods passes between residents and non-residents or the services are rendered by either group or by one transactor
to the other. This is usually the case when they cross the border and then are registered by the customs authorities.
That is, these transactions are recorded on the basis of physical movement of goods and services and not on
financial basis. The basic data on merchandise are taken from the foreign trade statistics of the PBS, whereas non-
factor services and other current transfers are extracted from the SBP’s balance of payments statistics. Besides, it
includes imports under baggage, gifts in cash or in kind but excludes military equipment transferred between
governments.
Like in the balance of payments, imports and exports of goods are recorded in the SNA at border values.
(FOB or free-on-board; that is, at the exporter’s customs frontier). However, within customs declarations, imports are
usually valued CIF (that is, they include cost, insurance and freight) at the point of entry into the importing economy.
This valuation is standard, regardless of whether any of the CIF elements are provided by domestic enterprises
because import duties are typically imposed on the CIF valuation. It also excludes the cost of transport from the
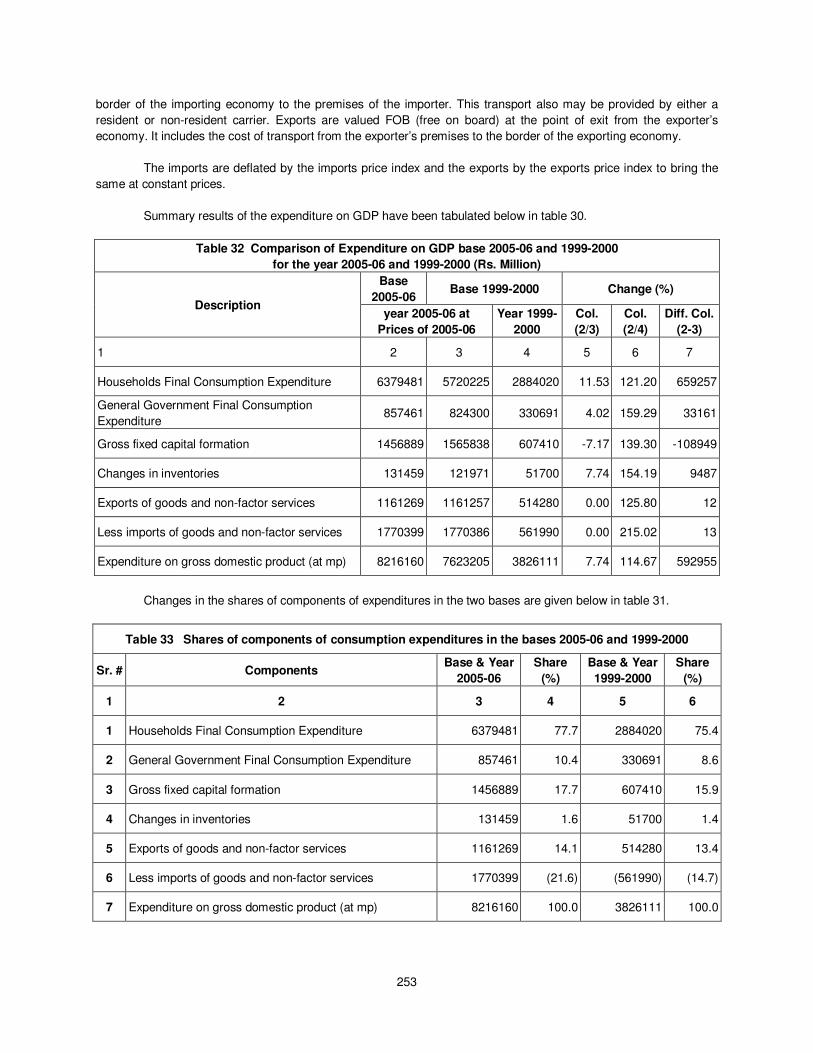
253
border of the importing economy to the premises of the importer. This transport also may be provided by either a
resident or non-resident carrier. Exports are valued FOB (free on board) at the point of exit from the exporter’s
economy. It includes the cost of transport from the exporter’s premises to the border of the exporting economy.
The imports are deflated by the imports price index and the exports by the exports price index to bring the
same at constant prices.
Summary results of the expenditure on GDP have been tabulated below in table 30.
Table 32 Comparison of Expenditure on GDP base 2005-06 and 1999-2000
for the year 2005-06 and 1999-2000 (Rs. Million)
Description
Base
2005-06 Base 1999-2000 Change (%)
year 2005-06 at
Prices of 2005-06
Year 1999-
2000
Col.
(2/3)
Col.
(2/4)
Diff. Col.
(2-3)
1 2 3 4 5 6 7
Households Final Consumption Expenditure 6379481 5720225 2884020 11.53 121.20 659257
General Government Final Consumption
Expenditure 857461 824300 330691 4.02 159.29 33161
Gross fixed capital formation 1456889 1565838 607410 -7.17 139.30 -108949
Changes in inventories 131459 121971 51700 7.74 154.19 9487
Exports of goods and non-factor services 1161269 1161257 514280 0.00 125.80 12
Less imports of goods and non-factor services 1770399 1770386 561990 0.00 215.02 13
Expenditure on gross domestic product (at mp) 8216160 7623205 3826111 7.74 114.67 592955
Changes in the shares of components of expenditures in the two bases are given below in table 31.
Table 33 Shares of components of consumption expenditures in the bases 2005-06 and 1999-2000
Sr. # Components Base & Year
2005-06
Share
(%)
Base & Year
1999-2000
Share
(%)
1 2 3 4 5 6
1 Households Final Consumption Expenditure 6379481 77.7 2884020 75.4
2 General Government Final Consumption Expenditure 857461 10.4 330691 8.6
3 Gross fixed capital formation 1456889 17.7 607410 15.9
4 Changes in inventories 131459 1.6 51700 1.4
5 Exports of goods and non-factor services 1161269 14.1 514280 13.4
6 Less imports of goods and non-factor services 1770399 (21.6) (561990) (14.7)
7 Expenditure on gross domestic product (at mp) 8216160 100.0 3826111 100.0

0

0
The printing of this publication is funded by GIZ project Support to the Pakistan Bureau of Statistics.

0


![SHELL [FYI]realfile.tax.newmexico.gov/FYI-105 - Gross Receipts & Compensating Taxes - An Overview.pdf2.Governmental gross receipts tax payable on transactions reportable for the period;](https://img.pdfslide.us/doc/110x75/5e31f49c0bcdef63e458288f/shell-fyi-gross-receipts-compensating-taxes-an-overviewpdf-2governmental.jpg)


![Mrunal [Budget] Interim Budget 2014 (Part 1of4)_ Revenue Reciepts, Direct Taxes, Indirect Taxes, Gross vs Net Taxes, Shortfalls in Collection » Mrunal](https://img.pdfslide.us/doc/110x75/577cca0f1a28aba711a5424c/mrunal-budget-interim-budget-2014-part-1of4-revenue-reciepts-direct-taxes.jpg)