Embed Size (px)
Citation preview

117
Chapter 4
RESEARCH METHODOLOGY &
DATA ANALYSIS

118
4.1 Research Methodology
This chapter explains the methods used in carrying out the study, giving
special emphasis to the measurement of variables. It should be noted at the
outset that the Methodology was to a certain extent an evolving one that took
definite shape as the study progressed. The content of this chapter is being
organized in logical order i.e., in terms of the relationships of the concepts.
But in the case of organization of procedures, chronological order is followed
i.e. discussing the steps in the order in which they were taken.
General Perspective
The research reported here embodied a quantitative perspective. Even
though this study touches different areas of diagnosis, description and even
exploration in the selection and linking of variables, the type of research is
designated as diagnostic research. The research method used to collect data
was sample survey method. Other methods of data collection were found
unsuitable in this context, especially considering the sample size and hence
ignored.
Variables
This study was designed to explore the impact of Business Communication
strategy on consumers in the service sector especially banking and insurance
sector.
The independent variable in this study is business communication. One factor
of this independent variable is formulation of communication strategy. Two
dependent variables are Communication-Effect and Consumer Purchase
Behavior of any services. Communication-Effect was measured both in terms
of Advertising Effectiveness and Communication Objectives. Each of these

119
variables is elaborated upon the coming section of this chapter.
Sample for the study
Sample for the study was taken from different cities of Gujarat; these cities
are the big cities of Gujarat State. Some of them are being the industrial hub
of Gujarat, have a cosmopolitan environment where people from every nook
and comer of the state reside. Moreover, these areas are centrally located
when compared to other corporation areas. In fact, whole Gujarat state can be
considered as a 'big city' due to its peculiar features like high density of
population and higher consumer orientation. The primary concern of research
was with the behavior of people in response to the communication by the
service sector.
Objectives of the study
To study customer’s perceptions and expectations towards the
communication from companies and to measure the overall
communication pattern in service sector in India.
To study the importance of business communication strategies
influencing viewers.
To compare the communication strategies across the major players in
service sector.
To segment customers into several perceived quality segments on the
basis of demographic, psychographic and other profiles.
To study awareness of the customers with regard to the
communication provided by the companies and consumer buying
behavior in service sector

120
Research Design: Descriptive Research
Sampling Design
Target population: Adults ( 18 years) who have used the particular services
as applicable) for at least last 1 year
Sampling unit: Individual / Group / banking & Insurance customers
Sampling Universe: all customers of public & private banking & insurance
sector
Estimated Sample Size: 250 respondents each form different service users
of Banking & insurance sector.
Sampling Technique: Quota sampling: As the population in Gujarat State
does not constitute a homogeneous group, quota sampling has been used so
as to obtain a representative sample. In this technique, the population is
classified into a number of non-overlapping subpopulations and sample items
are selected using convenience or judgmental sampling. The classification
variable used for purpose of this study will be geographical region, where
leading cities of Gujarat will be included. Further, to obtain a better
representation of the population, sample will consists of respondents from
different age groups, income levels and education levels.
Extend: This study was limited to the leading cities of Gujarat state
Sources of data: primary and secondary sources

121
Collection of data:
Secondary data: For conceptual clarity, earlier studies relevant to the
research have been referred from various journals, magazines and websites.
Primary data: Primary data has been collected using Structured
Questionnaires as the survey instrument. Separate set of questionnaires were
administered to the respondents of service sectors.
Tools and techniques: Statistical tools required for the purpose of study
applied.
Research instrument: structured questionnaires
122
4.2 Data Analysis
Introduction
The data, after collection, has to be processed and analyzed in accordance
with the outline laid down for the purpose at the time of developing the
research plan. This is essential for a scientific study and for ensuring that we
have all relevant data for making contemplated comparison and analysis. The
term “analysis” means the separation of a substance into its constituent
elements to determine either their nature (qualitative analysis) or their
proportions. It is computation of certain measures along with searching for
patterns of relationship that exist among data groups. Thus, “in the process of
analysis, relationships or differences, supporting or conflicting with original or
new hypotheses should be subjected to statistical tests of significance to
determine with what validity data have some indication or any conclusions.”
(Kothari, C.R. “Research Methodology”, Wishwa Prakashan pp . 151.) Taking
this statement as guiding torch, the primary data have been analyzed and
conclusions are drawn.
In Today’s era one of the most important things in the world of business is to
trigger off great relationships with Customers & other enterprises so that a
company can earn a name in the market. In order to establish a reputation in
the business world, sellers need to have a great business communication
strategy. Business communication can essentially be divided into internal and
external communication.
Today people are getting communicated for nearly all kinds of services,
products & ideas from different kinds of companies. From education to finance
& retailing to recreation each & every span of the market is full of

123
advertisements, which are the biggest platform providers to introduce the
company to the real customer.
Things like establishing a brand, marketing of products and services,
advertising, working on things like public relations, media management and
even business dealings with customers or other business firms fall in the
category of external business communication. Moreover technological
advances have made it possible for India to compete on a global basis in
areas of communication.
4.3 Demographic Factor-Wise Profile of Investor’s investing in
Banking Sector
The present study is conducted with the objective of identifying the
association between demographics of individual investors and effect of
business communication on their investment behaviors in bank. This chapter
presents the results of the primary survey of investors conducted to achieve
the above mention objective. It examines the null hypothesis that the business
communication has no effect on investment preferences of individual
investor’s demographic characteristics such as age, sex, income, occupation,
employment status and family size. It gives clear idea about the different
types of respondent’s demographic status. The table shows different
demographic factors like Gender, Total Annual Family Income, Education,
Age, and occupation. The respondents from different age group & income
group can be considered important for analyzing the impact of business
communication strategies on consumers. To begin with we shall present a
brief profile of the sample respondents. The rest of the chapter is talk about
the analysis of the data pertaining to investors preferences due to business
communication across their demographics.

124
The research was an attempt to know the investment pattern of investors in
banking sector because of business communication and its impact on
consumers of Gujarat.
Socio-Economic Status of the investors
Table 4.1 Gender, Total Annual Family Income, Education, Age, and occupation
Sl. No. Status Number of Respondents
Percentage to Total
Gender
1. Male 183 77.87
2. Female 52 22.13
Total 235 100
Total Annual Family Income 1 Under 250000 107 45.53
2 250000-500000 80 34.04
3 500000-750000 44 18.73
4 More than 750000 4 1.70
Total 235 100
Education
1 Below Metric 10 4.26
2 Higher Secondary 32 13.62
3 Graduation 139 59.15
4 Post-Graduation 54 22.98
Total 235 100.00
Age
1 Less than 25 48 20.43
2 26-35 81 34.47
3 36-45 66 28.09
4 46-55 27 11.49
5 Above 55 13 5.53
Total 235 100.00
Occupation
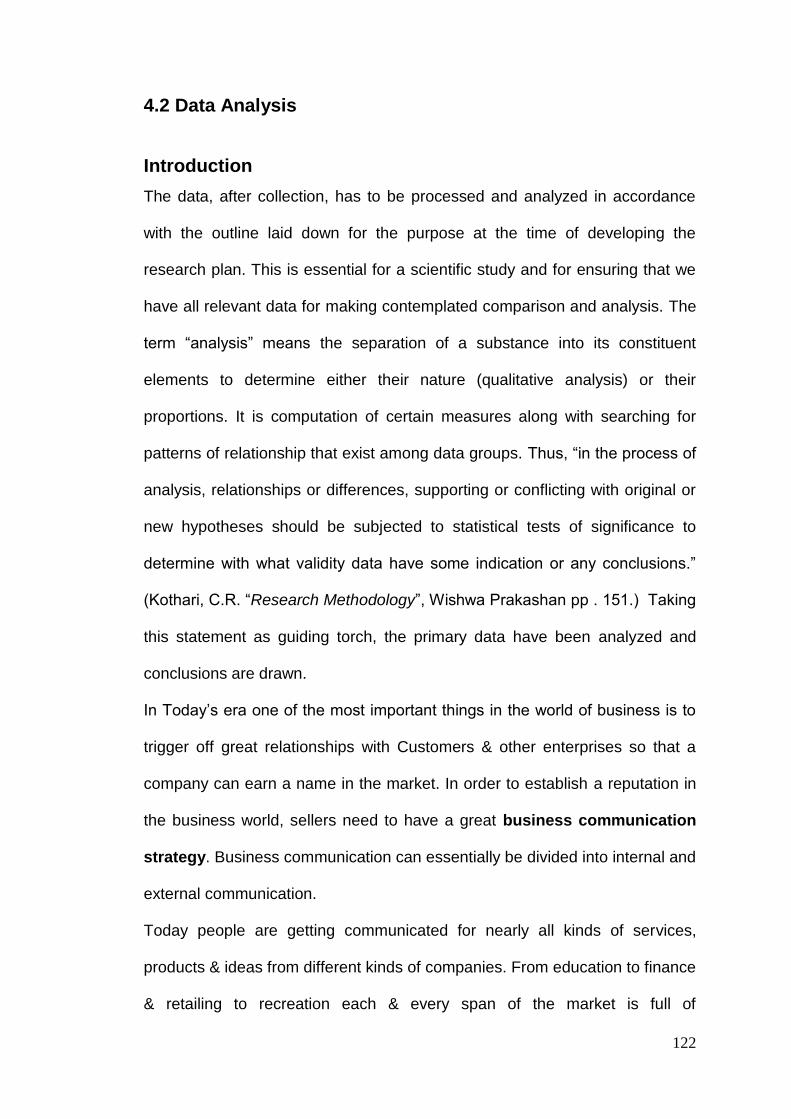
1 Government Service 27 11.49
2 Professional 49 20.85
3 Businessman 64 27.23
4 Private employee 63 26.81
5 Retired Personnel 6 2.55
6 Homemaker 26 11.06
Total 235 100.00

125
Table 4.1 exhibits the socio-economic status of the investors investing in
banking sector. It is clear from Table 4.1 that out of 235 investors investing in
banking sector, 77.87% were male and the remaining 22.13% investors were
female. From figure 5.1 it can be easily seen that there are very less female
who are investing in bank sector.
Fig. 4.1 Gender wise profile
Income play important role in investing. Figure 4.2 gives Total
Annual Income of the respondents. From figure it can be seen that maximum
investors have income less than 250000. Number of the respondents having
Income more than 7500000 is very low. With the income of 250000 to 500000
are also having important role in investing.
0
20
40
60
80
100
120
140
160
180
200
Male Female

126
Fig 4.2 Total Annual Income of Investors
Education Qualification is also one of the most influencing factors in financial
market. Out to 235 investors 4.26 investors education is below metric, 13.62
investors have taken education up to Higher Secondary, 59.15 are graduates
and 22.98% investors are post graduates. The Educational Qualification of
respondents is shown in figure 5.3. Chart shows that most of the respondents
are highly educated.
Fig. 4.3 Educational Qualification of investors
107
80
44
4
Below Metric
Higher Secondary
Graduation
Post Graduation
10.00
32.00
139.00
54.00

127
Age is considered to be the most important demographic factor that plays very
important role in determining the communication strategy especially in sector
like banking. Age has its impact on investment. Figure 4.4 represents
respondent’s age profile. From figure it can be easily seen that most of the
respondent are from 26-35. Figure 4.5 represents occupation of respondents.
In comparison of retired person businessman, private employee and
professionals are investing more in banking. While the number of government
employee and homemaker is also quite significant.
.
Fig 4.4 Age Profile of Respondents
Less than 25
26-35
36-45
46-55
Above 55
128
.
Fig 4.5 Occupation of the respondents
Table 4.2 represents number of customers using different services provided
by Bank. The total numbers of the respondents using services of banks are
235.
Table 4.2 Customers using services of Bank
Bank name Number of Customers
Bank of Baroda 50
Union 23
State Bank of India 37
Central Bank of India 17
HDFC 14
ICICI 11
Punjab National bank 10
Andhra bank 7
Oriental bank 14
Dena bank 16
IDBI 13
Allahabad Bank 3
Axis bank 11
Indian bank 2
Indian overseas Bank 4
Canara bank 3
Total 235
27
49
64 63
6
26

129
According to the table 4.2 number of customer of bank of baroda, union bank
& state bank of India are higher from the total number of respondents. In the
region surveyed the people using the service of allhabad bank are very low in
numbers.
Figure 4.6 represent percentage of customers using different services
provided by bank. From figure it can be easily seen that 21% of customers are
using services of Bank of Baroda, while 16% uses services provided by State
bank of India, it says that still customer have more reliability in government
bank compare to other. It also shows that the percentages of customer in the
surveyed region using the private bank facility are very low.
Fig 4.6 Customers using services of Bank
Bank of Baroda 21%
Union 10%
State Bank of India 16%
Central Bank of
India 7%
HDFC 6%
ICICI 5%
Punjab National bank 4%
Andhara bank 3%
Oriental bank 6%
Dena bank 7%
JOBI 6%
Allahabad Bank 1%
Axis bank 5%
Indian bank 1%
Indian overseas
Bank 2%
Canara bank 1%

130
Table 4.7 represents the reason why customer utilize the services provided by
bank. In order to study the relationship between services and reason of
selecting a particular bank Chi-Square Test has been used.
H0: There is no association between services and reason of selecting a particular bank. H1: : There is significant association between services and reason of selecting a particular bank .
Chi-Square Tests
Value df
Asymp. Sig. (2-sided)
Pearson Chi-Square 135.799(a) 135 .465
Likelihood Ratio 137.903 135 .415
N of Valid Cases 563
Here the value of 799.1352 .with P-value 0.465 which indicates no
relationship between services and reason of selecting a particular bank.
Researcher want to know what are services provided by bank due to which
consumers wants to be a customer of particular bank. Table 4.7 represent the
services utilize by the customer and reason to select particular bank.

131
Table 4.7, Customers utilizing the services provided by bank with reasons.
Bank Name Bank
reputation Convenient
service Regular
customer Excellent Service
Security Accessibility Returns Sales
product
Variety of
products Others
Bank of Baroda
35 17 34 25 13 18 7 10 6 35
Union 10 7 14 10 3 8 3 1 0 0 State
Bank of India
22 14 13 14 12 7 8 5 4 2
Central Bank of
India 8 6 7 6 1 2 3 2 0 0
HDFC 8 3 6 3 0 7 3 1 3 0 Punjab
National bank
3 0 3 3 0 1 1 0 1 0
ICICI 9 6 4 5 2 5 0 0 1 0 Andhra
bank 0 1 3 0 1 1 0 0 0 0
Oriental bank
3 2 7 0 1 3 1 1 1 0
Dena bank
7 5 6 3 3 4 3 0 3 0
IDBI 2 3 1 2 5 1 0 0 0 0 Allahabad
Bank 1 1 1 0 0 1 0 0 1 0
Axis bank 4 5 6 4 1 5 2 2 1 0 Indian bank
2 1 0 1 0 0 0 1 0 0
Indian overseas
Bank 3 1 3 0 0 0 0 0 1 1
Canara bank
3 0 3 0 0 0 0 0 0 0
From table it can be seen that customer gives highest priority to Bank
reputation for selecting a particular bank. To make picture clear researcher
are representing few graphs to show the importance for different services.
Figure 4.7 clear says that Bank reputation, Regular Customers and Excellent
service are the three main reasons for customer to utilize service of bank of
baroda.

132
h
Fig 4.7 Customers using services of Bank of Baroda For bank of baroda, the major factors that contribute most in selecting the
services of bank is the bank reputation and the familiarity with the bank
because 17% are the regular customers of the bank services. Excellent and
convenient services of the bank are also other important factors.
Fig 4.8 Customers using services of State Bank of India
Bank reputation 17%
Convenient service
8%
Regular customer 17%
Excellent Service
12% Security 7%
Accessibility 9%
Returns 4%
Sales product 5%
Variety of products
3%
Others 18%
Bank reputation 21%
Convenient service
14%
Regular customer
13% Excellent Service
14%
Security 12%
Accessibility 7%
Returns 8%
Sales product 5%
Variety of products
4%
Others 2%

133
Figure 4.8 clearly says that customers have given highest priority to Bank
Reputation while selecting State Bank of India. They have also given
approximately same priority to Convenient Service, Regular Customer,
Excellent Service and Security.
Fig 4.8 Customers using services of HDFC Bank
f
Fig 4.9 Customers using services of ICICI Bank
Bank reputation 23%
Convenient service
9%
Regular customer
18%
Excellent Service 9%
Security 0%
Accessibility 20%
Returns 9%
Sales product 3%
Variety of products
9%
Others 0%
Bank reputation 28%
Convenient service
19% Regular customer
12%
Excellent Service 16%
Security 6%
Accessibility 16%
Returns 0%
Sales product 0%
Variety of products
3%
Others 0%

134
Fig 4.8 and fig. 4.9 shows that even in private bank like HDFC and ICICI
customers are using services of bank due to its reputation, convenient
service, regular customer and excellent service.
There are few factors which influenced people’s decision for selecting a
service of a particular bank. Table 4.8 represents what are the influenced
factors which effect customer decision for choosing a particular bank. From fig
4.10 it can be seen that 38% customer’s take their decision on the basis of
Friends/Relative Recommendation, while 21% take decision to use bank
service after meeting the bank officer directly, 15% takes decision on the
basis of sales promotion, 13% takes decision due to sales person and 12%
take decision on the basis of advertisement given by the bank. Research has
also done ONE WAY ANOVA to check whether all the factors have same
effect or not. Results are reported in Table 4.9
Table 4.8 Influenced factors for choosing the services of a bank
Influenced Factor Number of Customers
Friends/Relative recommendation
144
Sales Promotion 57
Contacting bank officer directly
79
Advertisement 46
Sales person 49
Other 6
Table 4.9 ANOVA
Sum of Squares df
Mean Square F Sig.
Between Groups
28.162 4 7.040 36.263 .000
Within Groups
227.157 1170 .194
Total 255.319 1174

135
The value of F-statistic is 36.263 with significance value 0.000, indicating
significant impact of various influenced factors but since Levene’s test of
Homogeneity of variance is 29.401 with significance value p<0.00001, the
assumption of Homogeneity of variance for performing ANOVA is violated. So
one cannot reliable on the result of ANOVA and has to go for Welch and
Brown-Forsythe test. Table 4.10 gives the result of the Welch and Brown-
Forsythe robust test for equality of means. Since Welch and Brown-Forsythe
both of the test has significance value p<0.0001, which indicate significant
effect of various influenced factors. Research also done post hoc test for pair
comparison.
Table 4.10 Robust Tests of Equality of Means
Statistic
(a) df1 df2 Sig.
Welch 32.401 4 584.080 .000 Brown-Forsythe
36.263 4 1139.48
9 .000
a Asymptotically F distributed.
Fig 4.10 Influenced factors for choosing the services of a bank
Friends/Relative recommendatio
n 38%
Sales Promotion 15%
Contacting bank officer directly
21%
Advertisement 12%
Sales person 13%
Other 1%

136
From Table 4.11 it can be easily say that Friends/Relatives recommendation
has maximum effect on customer’s decision. The prompt services by the bank
officers also play a very vital role to influence people to contact the bank
officers directly for choosing the services of the bank. Now-a-days sales
promotion in banking sector is also considered to be important factor for
influencing customers.
Table 4.11 Multiple Comparisons
(I) VAR00001 (J) VAR00001 Mean
Difference (I-J) Std. Error Sig. 95% Confidence Interval
Lower Bound Upper Bound
Tamhane Friends/Relative salespromotion .37021277(*) .04241658 .000 .2508900 .4895356 bankofficer .27659574(*) .04435885 .000 .1518181 .4013734
advertisement .41702128(*) .04107074 .000 .3014709 .5325716
salesperson .40425532(*) .04146452 .000 .2876019 .5209087
salespromotion friends -.37021277(*) .04241658 .000 -.4895356 -.2508900
bankofficer -.09361702 .04169901 .226 -.2109174 .0236834
advertisement .04680851 .03818253 .918 -.0605982 .1542152 salesperson .03404255 .03860578 .991 -.0745532 .1426383
bankofficer friends -.27659574(*) .04435885 .000 -.4013734 -.1518181
salespromotion .09361702 .04169901 .226 -.0236834 .2109174
advertisement .14042553(*) .04032923 .005 .0269674 .2538837
salesperson .12765957(*) .04073018 .018 .0130774 .2422417
advertisement friends -.41702128(*) .04107074 .000 -.5325716 -.3014709 salespromotion -.04680851 .03818253 .918 -.1542152 .0605982
bankofficer -.14042553(*) .04032923 .005 -.2538837 -.0269674
salesperson -.01276596 .03712204 1.000 -.1171868 .0916549
salesperson friends -.40425532(*) .04146452 .000 -.5209087 -.2876019
salespromotion -.03404255 .03860578 .991 -.1426383 .0745532
bankofficer -.12765957(*) .04073018 .018 -.2422417 -.0130774 advertisement .01276596 .03712204 1.000 -.0916549 .1171868
Dunnett T3 Friends/Relative salespromotion .37021277(*) .04241658 .000 .2509168 .4895087
bankofficer .27659574(*) .04435885 .000 .1518458 .4013457
advertisement .41702128(*) .04107074 .000 .3014976 .5325449
salesperson .40425532(*) .04146452 .000 .2876286 .5208821
salespromotion friends -.37021277(*) .04241658 .000 -.4895087 -.2509168 bankofficer -.09361702 .04169901 .225 -.2108912 .0236572 advertisement .04680851 .03818253 .916 -.0605742 .1541913
salesperson .03404255 .03860578 .991 -.0745290 .1426141
bankofficer friends -.27659574(*) .04435885 .000 -.4013457 -.1518458
salespromotion .09361702 .04169901 .225 -.0236572 .2108912
advertisement .14042553(*) .04032923 .005 .0269933 .2538578
salesperson .12765957(*) .04073018 .018 .0131034 .2422157 advertisement friends -.41702128(*) .04107074 .000 -.5325449 -.3014976
salespromotion -.04680851 .03818253 .916 -.1541913 .0605742

137
bankofficer -.14042553(*) .04032923 .005 -.2538578 -.0269933
salesperson -.01276596 .03712204 1.000 -.1171637 .0916318
salesperson friends -.40425532(*) .04146452 .000 -.5208821 -.2876286
salespromotion -.03404255 .03860578 .991 -.1426141 .0745290 bankofficer -.12765957(*) .04073018 .018 -.2422157 -.0131034
advertisement .01276596 .03712204 1.000 -.0916318 .1171637
Games-Howell Friends/Relative salespromotion .37021277(*) .04241658 .000 .2540500 .4863755
bankofficer .27659574(*) .04435885 .000 .1551211 .3980704
advertisement .41702128(*) .04107074 .000 .3045334 .5295091
salesperson .40425532(*) .04146452 .000 .2906928 .5178179 salespromotion friends -.37021277(*) .04241658 .000 -.4863755 -.2540500
bankofficer -.09361702 .04169901 .165 -.2078116 .0205775
advertisement .04680851 .03818253 .736 -.0577546 .1513716
salesperson .03404255 .03860578 .904 -.0716784 .1397635
bankofficer friends -.27659574(*) .04435885 .000 -.3980704 -.1551211
salespromotion .09361702 .04169901 .165 -.0205775 .2078116 advertisement .14042553(*) .04032923 .005 .0299734 .2508777 salesperson .12765957(*) .04073018 .016 .0161125 .2392066
advertisement friends -.41702128(*) .04107074 .000 -.5295091 -.3045334
salespromotion -.04680851 .03818253 .736 -.1513716 .0577546
bankofficer -.14042553(*) .04032923 .005 -.2508777 -.0299734
salesperson -.01276596 .03712204 .997 -.1144228 .0888908
salesperson friends -.40425532(*) .04146452 .000 -.5178179 -.2906928 salespromotion -.03404255 .03860578 .904 -.1397635 .0716784
bankofficer -.12765957(*) .04073018 .016 -.2392066 -.0161125
advertisement .01276596 .03712204 .997 -.0888908 .1144228
* The mean difference is significant at the .05 level.
Table 4.12 and Figure 4.11 represent different banking services used by the
customers. 53% of the customers are using saving account service of a bank,
21% customers are using Fixed Deposits scheme of the bank, 13% are using
loans facilities while 12% are current account service. Researcher has drawn
table which shows service used by customer of a particular bank.
Table 4.12 Services used by the customer
Different banking services
No. of customers
Saving Account 209
Overdrafts 4
Loans 50
Current Account 47
Fixed Deposits 82
Others 0

138
.
Fig 4.11 Services used by the customers
Table 4.13 Banking Services used by customers
Bank Name Saving Account
Overdrafts Loans Current Account
Fixed Deposits
Bank of Baroda 46 1 14 15 24
Union 21 0 4 0 8
State Bank of India 32 1 7 10 13
Central Bank of India
15 0 5 4 5
HDFC 12 0 3 2 4
ICICI 10 0 2 1 3
Punjab National bank
9 0 1 0 6
Andhra bank 7 0 3 0 1
Oriental bank 12 0 1 3 5
Dena bank 15 1 2 3 5
IDBI 11 0 3 3 4
Allahabad Bank 2 0 0 1 0
Axis bank 8 0 4 3 2
Indian bank 2 0 0 0 0
Indian overseas Bank
4 0 1 0 1
Canara bank 3 0 0 2 0
Table 4.13 gives detailed analysis of the services used by the customers.
From table it can be seen that maximum number of customers are using
saving account service. It can be also seen that Customer preferred
Government Bank for Current Account, Fixed Deposit and Loan compare to
private bank.
Saving Account 53%
Overdrafts 1%
Loans 13%
Current Account
12%
Fixed Deposits 21%
139
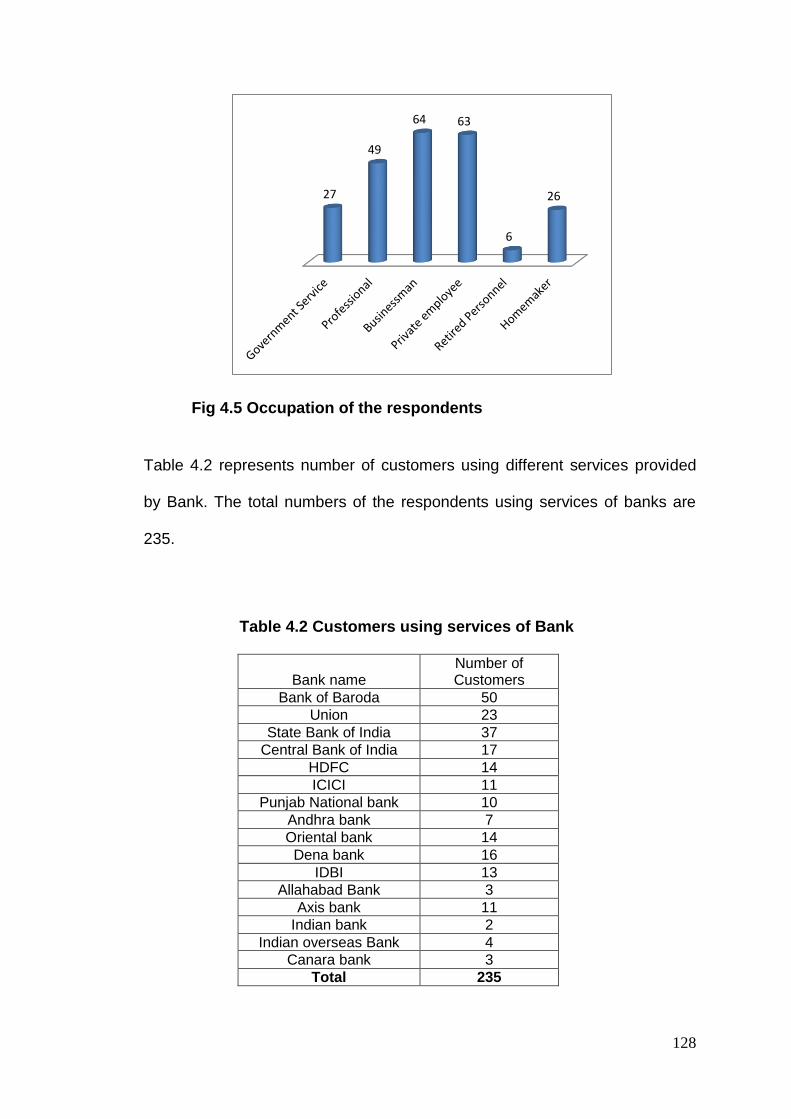
Table 4.14 represent level of satisfaction of different bank. To clear the picture
researcher created table percentage wise.
Table 4.14 Satisfaction level of customers
Bank Name Highly Satisfied (5)
Somewhat Satisfied(4)
Neither Satisfied nor
Dissatisfied(3)
Bank of Baroda 29 18 3
Union 18 4 1
State Bank of India 18 15 4
Central Bank of India
9 6 1
HDFC 7 6 1
ICICI 4 6 0
Punjab National bank
7 4 0
Andhra bank 3 4 0
Oriental bank 7 6 1
Dena bank 9 5 2
IDBI 8 4 1
Allahabad Bank 1 2 0
Axis bank 8 3 0
Indian bank 1 1 0
Indian overseas Bank
2 1 1
Canara bank 3 0 0
Table 4.15 Satisfaction level of customers percentage wise Bank Name Highly
Satisfied (5) Somewhat Satisfied(4)
Neither Satisfied nor Dissatisfied(3)
Bank of Baroda 58.00 36.00 6.00
Union 78.26 17.39 4.35
State Bank of India 48.65 40.54 10.81
Central Bank of India 56.25 37.50 6.25
HDFC 50.00 42.86 7.14
ICICI 40.00 60.00 0.00
Punjab National bank 63.64 36.36 0.00
Andhra bank 42.86 57.14 0.00
Oriental bank 50.00 42.86 7.14
Dena bank 56.25 31.25 12.50
IDBI 61.54 30.77 7.69
Allahabad Bank 33.33 66.67 0.00
Axis bank 72.73 27.27 0.00
Indian bank 50.00 50.00 0.00
Indian overseas Bank 50.00 25.00 25.00
Canara bank 100.00 0.00 0.00

140
Table 4.15 represents the satisfaction level of customer percentage wise.
Some of the points which can be say from table are Customers of Union Bank
of India and Axis bank are highly satisfied with his bank, it can be noted here
Canara bank is not considered because of less customer. Percentages of
Highly Satisfied Customer for ICICI, Andhra Bank, Allahabad bank are very
low, which means customer are not satisfied with bank. Researcher has also
drawn graph to make picture clearer.
Fig 4.12 Satisfaction level of customers
0
20
40
60
80
100
120
Ban
k o
f B
aro
da
Un
ion
Stat
e B
ank
of
Ind
ia
Ce
ntr
al B
ank
of
Ind
ia
HD
FC
ICIC
I
Pu
nja
b N
atio
nal
ban
k
An
dh
ra b
ank
Ori
en
tal b
ank
De
na
ban
k
IDB
I
Alla
hab
ad B
ank
Axi
s b
ank
Ind
ian
ban
k
Ind
ian
ove
rsea
s B
ank
Can
ara
ban
k
Highly Satisfied (5)
Somewhat Satisfied(4)
Neither Satisfied norDissatisfied(3)

141
Table 4.16 Number of Customers who recommend bank to others
Bank Name Definitely(5) Probably(4) May be(3) Probably not (2)
Bank of Baroda 28 15 6 0
Union 16 4 3 0
State Bank of India 19 12 5 1
Central Bank of India 9 6 1 0
HDFC 5 8 0 1
ICICI 5 5 1 0
Punjab National bank 4 6 0 0
Andhra bank 5 1 1 0
Oriental bank 5 9 0 0
Dena bank 7 8 1 0
IDBI 8 4 1 0
Allahabad Bank 2 1 0 0
Axis bank 9 2 0 0
Indian bank 0 2 0 0
Indian overseas Bank 2 0 2 0
Canara bank 3 0 0 0
Table 4.16 gives customer recommendation for particular bank to other. From
table we can say that customer recommends Bank of Baroda, Union Bank
and State Bank of India, i.e. government bank compare to private.
Fig 4.13 Customer Recommendation for Bank
To study the promotion strategy in banking, researcher has framed 5-point
Likert’s Scale which included 12 statements regarding promotion tools. To test
0
5
10
15
20
25
30
Definitely(5) Probably(4) May be(3) Probably not (2)

142
the reliability of scale Cronbach’s Alpha Reliability Test has applied. Result of
these test are as follows:
Reliability Statistics
Cronbach's Alpha
Cronbach's Alpha Based on
Standardized Items N of Items
.841 .842 12
Cronbach’s Alpha value is 0.841, which give support to Reliability of
Questionnaire. It also indicates one can definitely go for further analysis.
Table 4.17 represents the rank given by customers. Figure 4.14 represent the
highest rank given by customers for promotion tool.
Table 4.17 Ranking of Different Promotional Tool given by number of Customers
Promotion Tool Very
Effective(5) 4 3 2
Least
Effective (1)
Advertising on Television 43 92 48 34 10
Advertising in Newspapers 71 71 56 30 6
Personal Selling/Personal Contact 72 70 55 32 5
In Journals and Magazines 15 49 91 61 11
Tele Calling by Salespersons 16 67 76 53 18
Outdoor Advertising Hoardings etc 36 72 78 35 11
Schemes/Gifts/Prizefor customers 52 45 62 45 28
Public Relations/ Events/ Program. 25 58 85 37 28
Online Marketing/E-mail 16 57 81 44 32
Pamphlets/Propaganda 9 32 75 78 40
Letter/Mail/with Relevant Material 16 35 51 67 68
Publishing News in Newspapers 9 38 52 50 88

143
From fig 4.14, it can be easily seen that 19% of the customers have rank
Advertising on Newspaper and Personal Selling/Personal Contact as most
effective tool for promotion, 14% of the customers give priority to
Schemes/Gifts/Prize promotional tool, 11% customers believe on
advertisement on Television as very effective tool while 10% believe Outdoor
Advertising Hoardings etc as most effective tool for promotion.
Fig 4.14 Customers who assign “very effective” to different Promotional
Tool
To study Importance of Advertisement, Sales Promotion and Services
strategy in selecting services of banking, researcher has framed 5-point
Liker’s Scale which included 15 statements. To test the reliability of scale,
11%
19%
19%
4% 4%
10%
14%
7%
4%
2% 4% 2%
Advertising on Television
Advertising in Newspapers
Personal Selling/PersonalContact
In Journals and Magazines
Tele Calling by Salespersons
Outdoor AdvertisingHoardings etc
Schemes/Gifts/Prizeforcustomers
Public Relations/ Events/Program.
Online Marketing/E-mail
Pamphlets/Propaganda

144
KMO and Bartlett's Test and Cronbach’s Alpha Reliability Test has applied.
Result of these test are as follows:
KMO and Bartlett's Test
Kaiser-Meyer-Olkin Measure of Sampling Adequacy. .659
Bartlett's Test of Sphericity
Approx. Chi-Square 490.364
df 105
Sig. .000
Reliability Statistics
Cronbach's Alpha
Cronbach's Alpha Based on
Standardized Items N of Items
.778 .775 15
From the above tables, it can be said that Kaiser-Meyer-Olkin Measure of
Sampling Adequacy found 0.659; it indicates that the sample is adequate for
Factor analysis. The value of Bartlett’s Test of Sphericity is 490.364 with
significance value 0.000, while Cronbach’s Alpha value is 0.778 which give
support to Reliability of Questionnaire. Table 4.17 represents the customer
preference regarding advertisement, sales promotion and service strategy.

145
Fig 4.15 customer’s ranking towards advertisement strategy.
Fig 4.15 Ranking of Advertisement strategy in terms of importance given by number of Customers (Here 1 -means Highest, 2- means High, 3- means Average, 4-low and 5-lowest)
From fig 4.15 it can be said that maximum customers believe that the
contents in the advertisement through public document must be clear and
informative.
0%
10%
20%
30%
40%
50%
60%
70%
80%
90%
100%
1 2 3 4 5
89
98 36 12
2
49
97
59 26
7
24
80
81 38
15
15 75
84 32
28
7 14 42 15
58
Advertising through other media
Advertising banner posting content is easily understandable and appealing to readers.
Advertising through internet is prominent and can be clicked to see the details easily.
Advertising signage is unique, attractive and understood easily.
The contents in the advertisement through the public document is clear and informative

146
Table 4.17 Ranking of Advertisement, Sales Promotion and Services strategy
in terms of importance given by number of Customers
Strategy
Level of Choosing service
Highest High Average Low Lowest
5 4 3 2 1
Advertisement
The contents in the advertisement through
the public document is clear and informative
89 98 36 12 2
Advertising signage is unique, attractive and
understood easily.
49 97 59 26 7
Advertising through internet is prominent
and can be clicked to see the details easily.
24 80 81 38 15
Advertising banner posting content is easily
understandable and appealing to readers.
15 75 84 32 28
Advertising through other media 7 14 42 15 58
Sales Promotion
Giving a special rate to customers, for
example senior citizens.
98 103 24 5 5
Waving commission charge 41 63 58 36 36
Distributing free gift 21 39 70 38 64
Other marketing support 17 11 30 18 48
Services
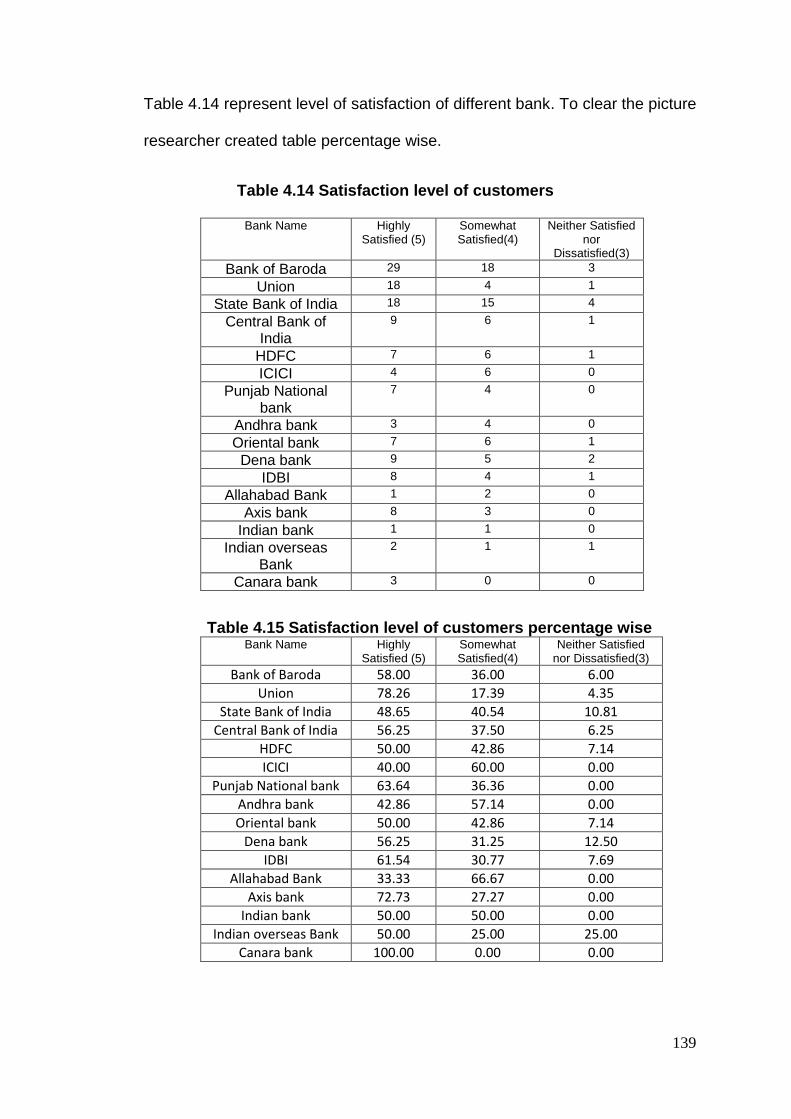
Bank Officers provide prompt service. 91 86 40 11 6
Officers provide the correct information
about service, product and financial
transaction.
80 91 45 12 8
Service officers are polite and courteous. 63 95 53 13 12
Financial Forms are easily accessible. 60 87 54 21 14
A convenient one-stop service point. 57 87 45 19 27
Other comments 2 7 19 13 33

147
.
Fig 4.16 Ranking of Sales Promotion strategy in terms of importance given by number of Customers (Here 1 -means Highest, 2- means High, 3- means Average, 4-low and 5-lowest).
Fig 4.16 shows that customers give maximum importance to “Giving a special
rate to customers, for Example senior citizens. Fig 4.17 represents customer’s
importance regarding Services provided by bank. 91 customers give
importance to prompt service provided by Bank Officers.
0%
10%
20%
30%
40%
50%
60%
70%
80%
90%
100%
1 2 3 4 5
98 103
24 5 5
41 63
58 36
36
21 39
70 38
64
17 11 30 18
48
Other marketing support
Distributing free gift
Waving commission charge
Giving a special rate to customers, for example senior citizens.
148
Fig 4.16 Ranking of service strategy in terms of importance given by number of
Customers (Here 1 -means Highest, 2- means High, 3- means Average, 4-low and 5-lowest).
4.4 Demographic Factor-Wise Profile of Investor’s investing in
life Insurance Company
This section deals with the objective of identifying the association between
demographics of individual investors and effect of business communication on
their investment behaviors in Life Insurance Companies. Here researcher
examines the null hypothesis that the business communication has no effect
on investment preferences of individual investor’s demographic characteristics
such as age, sex, income, occupation, employment status and family size. To
begin with we shall present a brief profile of the sample respondents.
The research was an attempt to know the investment pattern of investors in
Life Insurance because of business communication of Gujarat. This section
gives clear idea about the different types of respondent’s demographic status.
The very first table focuses on the Socio-Economic Status of the customers.
Bank Officers provide prompt service.
Officers provide the correct information about…
Service officers are polite and courteous.
Financial Forms are easily accessible.
A convenient one-stop service point.
Other comments
91
80
63
60
57
2
86
91
95
87
87
7
40
45
53
54
45
19
11
12
13
21
19
13
6
8
12
14
27
33
Series1 Series2 Series3 Series4 Series5
149
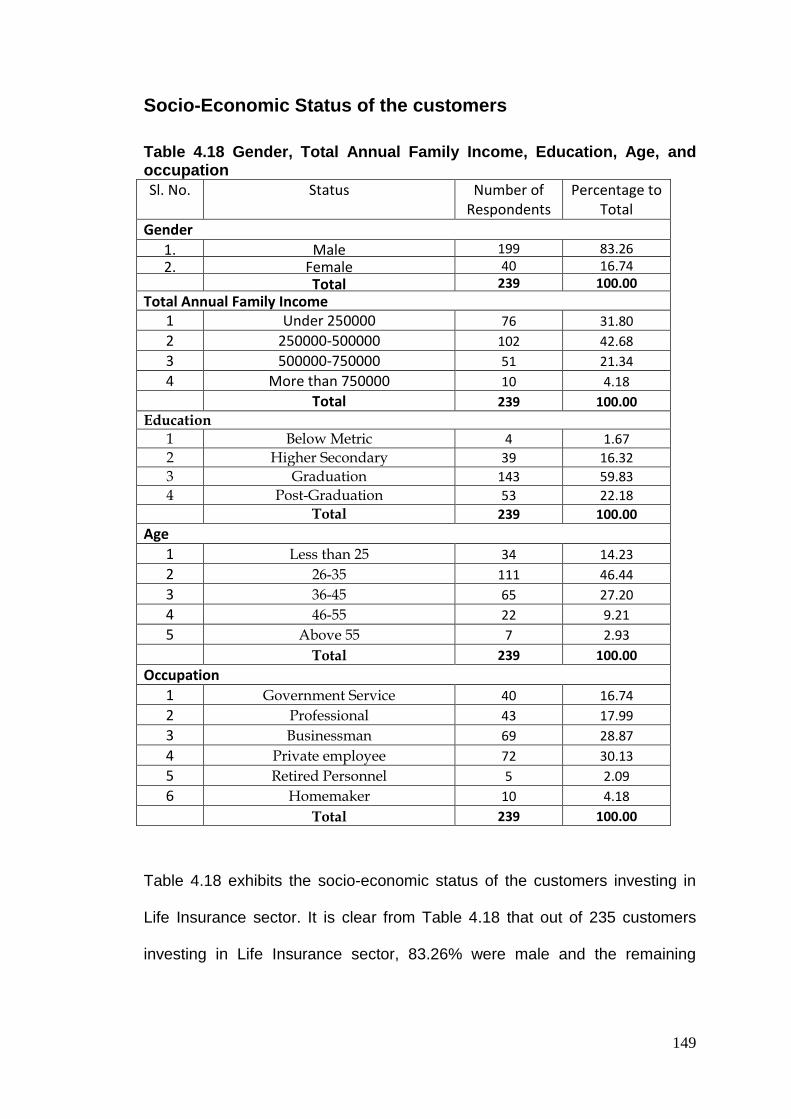
Socio-Economic Status of the customers
Table 4.18 Gender, Total Annual Family Income, Education, Age, and occupation
Sl. No. Status Number of Respondents
Percentage to Total
Gender
1. Male 199 83.26
2. Female 40 16.74
Total 239 100.00
Total Annual Family Income 1 Under 250000 76 31.80
2 250000-500000 102 42.68
3 500000-750000 51 21.34
4 More than 750000 10 4.18
Total 239 100.00
Education
1 Below Metric 4 1.67
2 Higher Secondary 39 16.32
3 Graduation 143 59.83
4 Post-Graduation 53 22.18
Total 239 100.00
Age
1 Less than 25 34 14.23
2 26-35 111 46.44
3 36-45 65 27.20
4 46-55 22 9.21
5 Above 55 7 2.93
Total 239 100.00
Occupation
1 Government Service 40 16.74
2 Professional 43 17.99
3 Businessman 69 28.87
4 Private employee 72 30.13
5 Retired Personnel 5 2.09
6 Homemaker 10 4.18
Total 239 100.00
Table 4.18 exhibits the socio-economic status of the customers investing in
Life Insurance sector. It is clear from Table 4.18 that out of 235 customers
investing in Life Insurance sector, 83.26% were male and the remaining

150
16.74% investors were female. From figure 4.17 it can be easily seen that
there are very less female who are investing in Insurance sector.
..
Fig. 4.17 Gender wise profile
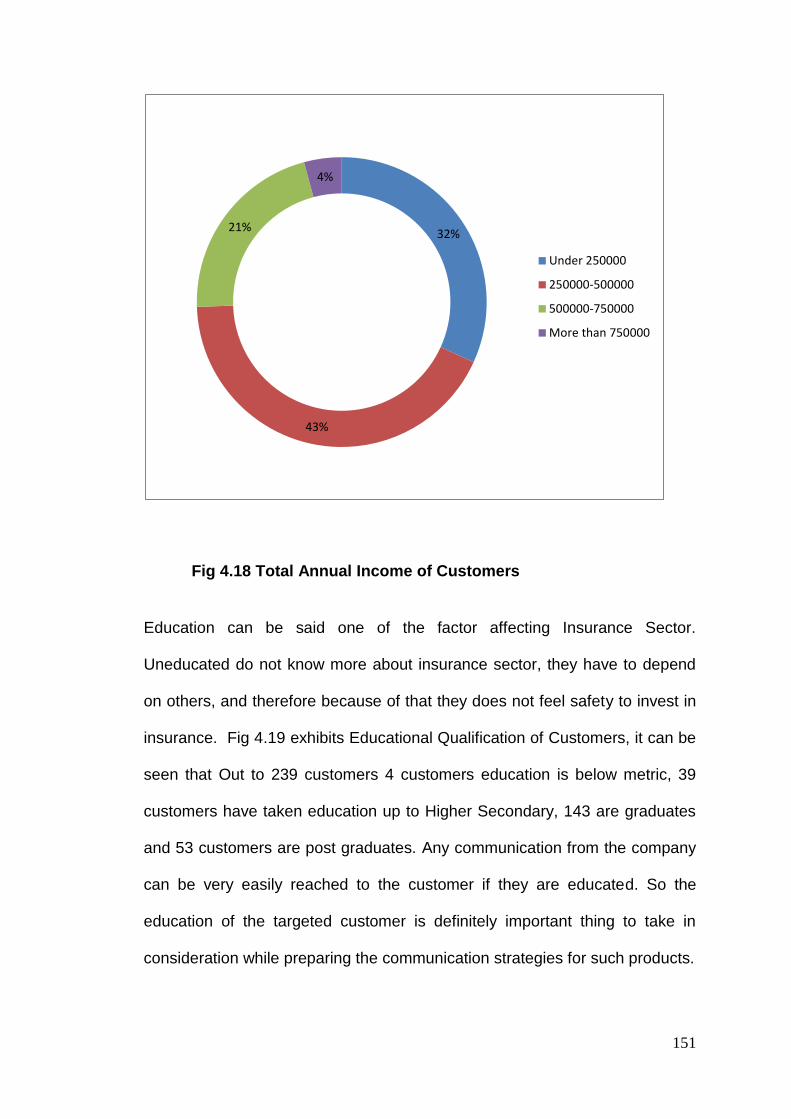
Investing in Insurance Policy lot depend on Income. Figure 4.18 gives Total
Annual Income of the respondents. From figure it can be seen that every
person in different income group are investing due to insecurity in today’s
environment. People from annual income of 500000 are showing higher
interest in investing the insurance policies. Simultaneously persons with
income more than 700000 are less likely to get interest in investing in
insurance policy due to insecurity.
83%
17%
Male Female
151
Fig 4.18 Total Annual Income of Customers
Education can be said one of the factor affecting Insurance Sector.
Uneducated do not know more about insurance sector, they have to depend
on others, and therefore because of that they does not feel safety to invest in
insurance. Fig 4.19 exhibits Educational Qualification of Customers, it can be
seen that Out to 239 customers 4 customers education is below metric, 39
customers have taken education up to Higher Secondary, 143 are graduates
and 53 customers are post graduates. Any communication from the company
can be very easily reached to the customer if they are educated. So the
education of the targeted customer is definitely important thing to take in
consideration while preparing the communication strategies for such products.
32%
43%
21%
4%
Under 250000
250000-500000
500000-750000
More than 750000

152
Fig. 4.19 Educational Qualification of customers
Figure 4.20 represents respondent’s age profile. From figure it can be easily
seen that most of the respondent are from 26-45. Figure 4.21 represents
occupation of respondents.
.
Fig 4.20 Age Profile of Respondents
4
39
143
53
0
20
40
60
80
100
120
140
160
Below Metric HigherSecondary
Graduation PostGraduation
Series1 Series2
Less than 25 14%
26-35 47%
36-45 27%
46-55 9%
Above 55 3%

153
Fig 4.21 Occupation of the respondents
From Fig 4.21 it can be seen that there are 40 respondents whom are
government employee, while remain most of the respondents are from private
sector, as we know private sector can also be said as insecurity sector, so to
make their future secure they will maximum invest in Life Insurance.
Table 4.19 represents number of Life Insurance Policy taken by the
customers and Fig 4.22 represents graphical presentation of the table data. It
can be seen that half of persons have taken life insurance policy for self,
spouse and children who give stamp of proof to our previous statement
regarding employee working in private sector invest more in Life Insurance
Policy.
Table 4.19 Respondents having total Life Insurance Policy
No. of life insurance policy
No. of Respondents
1 71
2 77
3 92
40
43
69
72
5
10
0 10 20 30 40 50 60 70 80
Government Service
Professional
Businessman
Private employee
Retired Personnel
Homemaker

154
Table 4.20 Respondents having Life Insurance Policy for family
Family Members Life Insurance Policy
Self 196
Spouse 173
Children 132
Fig 4.22 Number of Life Insurance Policy
.
Fig 4.23 Respondents having Life Insurance Policy for family
1 17%
2 33%
3 50%
Self Spouse Children
196 173 132

155
Table 4.20 represents respondents having Life Insurance Policy for Self,
Spouse and Children. Fig 4.23 shows that most of respondents have taken
Life Insurance Policy for each family member. Table 4.21 represents reason
for purchasing life insurance policy. Fig 4.24 shows the graphical presentation
of reason for purchasing life insurance data in percentage.
Table 4.21 Reasons for purchasing Life Insurance Policy
Reasons Number of
Respondents
Security Cover 172
Return 84
Saving 114
Income tax Return 100
Other 2
.
Fig 4.24 Reason for purchasing Life Insurance Policy
From Fig 4.24 it can be said that 37% purchase Life Insurance Policy for
Security Cover as most of the respondents are coming from Private Sector.
24% are taking Life Insurance for saving, 21% take Life Insurance Policy take
Security Cover 37%
Return 18%
Saving 24%
Income tax Return
21%
Other 0%

156
for Income tax return as 17% respondents are coming from government
sector, while 18% take for return.
Table 4.22 Total sum assured by Life Insurance for self
Insurance Policy (in lacs) No. of Respondents
Less than 1.5 44
1.5 - 3.0 90
3--5 38
5--10 34
10--20 31
More than 20 2
Table 4.22 show how much person has assured for self in Life Insurance. Fig
4.25 represents that out of total 38% of respondents have invested 1.5 – 3
lacs in Life Insurance for self, while 18% have invested less than 1.5 lacs,
16% invested 3-5 lacs for himself, 14% of respondents have invested 5-10
lacs, 13% invested in between 10-20 lacs in Life Insurance for himself, while
there are 1% respondents who have invested more than 20 lacs for himself in
Life Insurance.
.
Fig 4.25 Total sum in percentage assured by Life Insurance for self
Less than 1.5
18%
1.5 - 3.0 38%
3--5 16%
5--10 14%
10--20 13%
More than 20 1%

157
Table 4.23 Respondents most preferred Insurance Company
Life Insurance Company Number of Customers
LIC 125
RELIGARE 1
KOTAK 13
RELIANCE 17
AVIVA 11
ORIENTAL 1
TATA AIG 13
HDFC STANDARD 14
BAJAJ 20
MAX NEW YORK 4
POSTAL LIFE INSURANCE 1
MPT LIFE 2
BIRLA SUN LIFE 9
NATIONAL INSURANCE 3
ING 5
Total 239
Fig 4.26 Respondents most preferred Insurance Company
LIC 52%
RELIGARE 0%
KOTAK 6%
RELIANCE 7%
AVIVA 5%
ORIENTAL 0%
TATA AIG 6%
HDFC STANDARD 6%
BAJAJ 8%
MAX NEW YORK 2% POSTAL LIFE
INSURANCE 0%
MPT LIFE 1%
BIRLA SUN LIFE 4%
NATIONAL INSURANCE
1% ING 2%

158
Table 4.23 represents the list of Insurance Company preferred by
respondents. 52% respondents have named Life Corporation of India in his
most preferred list, which indicate that respondents have more trust in
Government Insurance Policy compare to Private Insurance Company. Table
4.24 shows different types of policy taken by respondents. From Table 4.24 it
can be seen that respondents mostly invest in Money Back Policy and in
Whole Life Insurance, after that they invest in Term Policy and Child Benefit
plan. There are some respondents who have invested in other insurance
policy also.
Table 4.24 Respondents having different type of Insurance Policy
Insurance Company
Name
Term Policy
Money Back
Policy
Whole Life
Insurance
ULIP Plan
Endowment Policy
Pension Plan
Child Benefit
Plan Other
LIC 20 65 65 10 8 21 38 3
RELIGARE 1 0 0 1 0 0 0 0
KOTAK 3 6 8 3 2 2 4 0
RELIANCE 3 9 9 0 0 3 1 2
AVIVA 5 1 7 1 1 1 5 0
ORIENTAL 0 0 0 0 0 1 0 1
TATA AIG 4 2 2 0 0 1 1 0 HDFC
STANDARD 4 0 2 2 0 1 1 0
BAJAJ 9 3 12 9 0 3 4 0 MAX NEW
YORK 2 3 3 0 0 0 1 0
POSTAL LIFE
INSURANCE 0 1 1 0 1 1 0 0
MPT LIFE 0 0 2 0 0 1 0 0 BIRLA SUN
LIFE 0 3 7 2 1 0 3 0
NATIONAL INSURANCE
1 1 2 0 1 2 1 0
ING 1 2 4 0 1 0 0 1

159
Table 4.25 Respondent’s Premium Paying Mode
Premium payment mode No. of Respondents
Through Agent 169
Online Payment 47
Company Branch office 64
Mobile Payment 8
Electronic Bill payment process 11
ECS 3
Credit card 28
Others 1
Table 4.25 indicates the respondent’s premium paying mode. From table we
can say that still most of the respondents i.e. 169 are paying premium through
agent, which means due to hectic schedule they prefer agent for premium
payment. 47 Respondents are doing payment through online which indicate
that people’s now are becoming familiar with internet. 64 respondents directly
go to branch office, 28 respondents do payment through Credit Card. There
are very less respondents who are doing payment using Mobile, Electronic Bill
Payment Process and ECS. Figure 4.27 represents the graphical presentation
of Premium paying mode.
Fig 4.27 Respondent’s Premium Paying Mode
169
47
64
8 11 3
28
1
ThroughAgent
OnlinePayment
CompanyBranchoffice
MobilePayment
ElectronicBill
paymentprocess
ECS Creditcard
Others

160
To verify which attribute respondents like most to invest in Insurance
Company, researcher has designed question regarding that. Table 4.26
represents the reason for selecting particular Insurance Company. In this
table researcher has consider those respondents who has given 5, 6 and 7
rate scale for attributes. To get clear picture researcher has represent value in
percentages in Table 4.27.
Table 4.26 Attribute which respondents value most
Insurance Company Name
Quality of
Service Returns
Premium Payment Facility
Service features/ attributes
Type of company
(private/Public Sector)
Claim Settlement
Policy/history others
LIC 43 60 67 44 55 30 2
RELIGARE 0 0 0 1 0 0 0
KOTAK 5 9 8 5 6 4 1
RELIANCE 4 7 6 6 4 5 2
AVIVA 4 7 8 7 6 4 1
ORIENTAL 0 1 1 0 0 0 0
TATA AIG 5 3 5 5 9 5 1
HDFC STANDARD 3 4 6 7 7 10 3
BAJAJ 12 10 7 7 10 6 0
MAX NEW YORK 1 3 3 3 2 2 0
POSTAL LIFE I 1 1 1 1 1 1 0
MPT LIFE 1 2 1 1 1 0 0
BIRLA SUN LIFE 1 5 4 1 6 2 1
NATIONAL 1 1 2 1 0 0 0
ING 2 1 4 1 4 2 0
*Here figure in table represents no. of respondents who has given rate scale 5,6 and 7.

161
Table 4.27 Attribute which respondents value most (Values indicate percentage)
Insurance Company
Name
Quality of
Service Returns
Premium Payment Facility
Service features/
Type of company
Claim Settlement
Policy/history others attributes (private/Public
Sector)
LIC 34.4 48 53.6 35.2 44 24 1.6
RELIGARE 0.00 0.00 0.00 100.00 0.00 0.00 0.00
KOTAK 38.46 69.23 61.54 38.46 46.15 30.77 7.69
RELIANCE 23.53 41.18 35.29 35.29 23.53 29.41 11.76
AVIVA 36.36 63.64 72.73 63.64 54.55 36.36 9.09
ORIENTAL 0.00 100.00 100.00 0.00 0.00 0.00 0.00
TATA AIG 38.46 23.08 38.46 38.46 69.23 38.46 7.69
HDFC STANDARD 21.43 28.57 42.86 50.00 50.00 71.43 21.43
BAJAJ 60.00 50.00 35.00 35.00 50.00 30.00 0.00
MAX NEW YORK 25.00 75.00 75.00 75.00 50.00 50.00 0.00
POSTAL LIFE 100.00 100.00 100.00 100.00 100.00 100.00 0.00
MPT LIFE 50.00 100.00 50.00 50.00 50.00 0.00 0.00
BIRLA SUN LIFE 11.11 55.56 44.44 11.11 66.67 22.22 11.11
NATIONAL 33.33 33.33 66.67 33.33 0.00 0.00 0.00
ING 40.00 20.00 80.00 20.00 80.00 40.00 0.00
Research has also done two way ANOVA to check whether the entire
attribute have same effect or not.
Table 4.28 Tests of Between-Subjects Effects
Dependent Variable: VAR00003
Source Type III Sum of Squares df Mean Square F Sig.
Corrected Model 10646.961(a) 16 665.435 16.411 .000
Intercept 4490.182 1 4490.182 110.738 .000
VAR00002 740.000 6 123.333 3.042 .012
VAR00001 9906.961 10 990.696 24.433 .000
Error 2432.857 60 40.548
Total 17570.000 77
Corrected Total 13079.818 76
a R Squared = .814 (Adjusted R Squared = .764)

162
Table 4.28 represents the results of Two-Way ANOVA. Here VAR00001
indicate Insurance Companies and VAR00002 indicate various attributes.
VAR00001 (Insurance Companies) p-value is 0.0000, which indicate that
Insurance Companies differs significantly according to attributes of a
company. Similarly, VAR00002(Attributes) p-value is 0.012, which indicate
that Attributes differs significantly. To know the which Insurance Company is
significant compare to other, POST HOC tests are carried out. Here
researcher has done Least Significant Difference (LSD), Bonferroni and
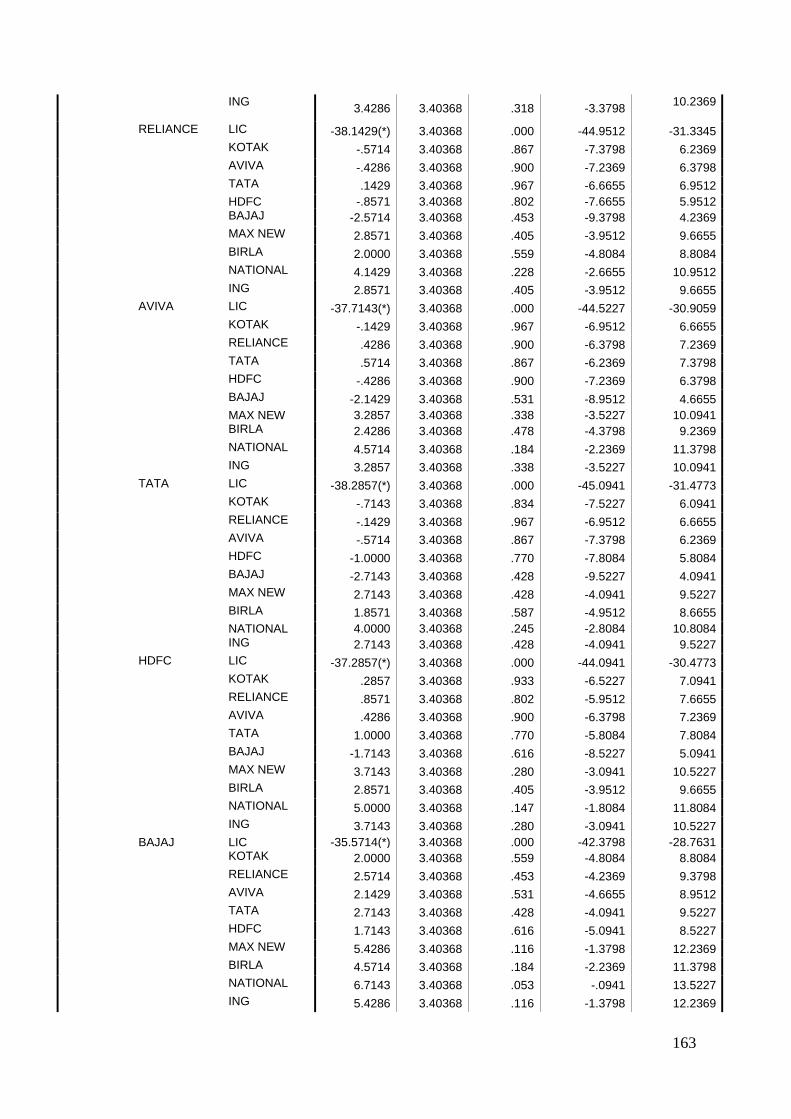
SIDAK POST HOC test. From Multi Comparison table 4.29 it can be seen that
LIC differ significantly with other’s Insurance Company in all the POST HOC
tests, which indicate that LIC attribute are far better than other’s Insurance
Companies.
Table 4.29 Multiple Comparisons Dependent Variable: VAR00003
(I) VAR00001 (J) VAR00001
Mean Difference
(I-J) Std. Error Sig.
95% Confidence Interval
Lower Bound Upper Bound
LSD LIC KOTAK 37.5714(*) 3.40368 .000 30.7631 44.3798 RELIANCE 38.1429(*) 3.40368 .000 31.3345 44.9512
AVIVA 37.7143(*) 3.40368 .000 30.9059 44.5227
TATA 38.2857(*) 3.40368 .000 31.4773 45.0941
HDFC 37.2857(*) 3.40368 .000 30.4773 44.0941
BAJAJ 35.5714(*) 3.40368 .000 28.7631 42.3798
MAX NEW 41.0000(*) 3.40368 .000 34.1916 47.8084
BIRLA 40.1429(*) 3.40368 .000 33.3345 46.9512
NATIONAL 42.2857(*) 3.40368 .000 35.4773 49.0941
ING 41.0000(*) 3.40368 .000 34.1916 47.8084
KOTAK LIC -37.5714(*) 3.40368 .000 -44.3798 -30.7631
RELIANCE .5714 3.40368 .867 -6.2369 7.3798
AVIVA .1429 3.40368 .967 -6.6655 6.9512 TATA .7143 3.40368 .834 -6.0941 7.5227
HDFC -.2857 3.40368 .933 -7.0941 6.5227
BAJAJ -2.0000 3.40368 .559 -8.8084 4.8084
MAX NEW 3.4286 3.40368 .318 -3.3798 10.2369
BIRLA 2.5714 3.40368 .453 -4.2369 9.3798
NATIONAL 4.7143 3.40368 .171 -2.0941 11.5227
163
ING 3.4286 3.40368 .318 -3.3798
10.2369
RELIANCE LIC -38.1429(*) 3.40368 .000 -44.9512 -31.3345
KOTAK -.5714 3.40368 .867 -7.3798 6.2369
AVIVA -.4286 3.40368 .900 -7.2369 6.3798
TATA .1429 3.40368 .967 -6.6655 6.9512
HDFC -.8571 3.40368 .802 -7.6655 5.9512 BAJAJ -2.5714 3.40368 .453 -9.3798 4.2369
MAX NEW 2.8571 3.40368 .405 -3.9512 9.6655
BIRLA 2.0000 3.40368 .559 -4.8084 8.8084
NATIONAL 4.1429 3.40368 .228 -2.6655 10.9512
ING 2.8571 3.40368 .405 -3.9512 9.6655
AVIVA LIC -37.7143(*) 3.40368 .000 -44.5227 -30.9059
KOTAK -.1429 3.40368 .967 -6.9512 6.6655
RELIANCE .4286 3.40368 .900 -6.3798 7.2369
TATA .5714 3.40368 .867 -6.2369 7.3798
HDFC -.4286 3.40368 .900 -7.2369 6.3798
BAJAJ -2.1429 3.40368 .531 -8.9512 4.6655
MAX NEW 3.2857 3.40368 .338 -3.5227 10.0941 BIRLA 2.4286 3.40368 .478 -4.3798 9.2369
NATIONAL 4.5714 3.40368 .184 -2.2369 11.3798
ING 3.2857 3.40368 .338 -3.5227 10.0941
TATA LIC -38.2857(*) 3.40368 .000 -45.0941 -31.4773
KOTAK -.7143 3.40368 .834 -7.5227 6.0941
RELIANCE -.1429 3.40368 .967 -6.9512 6.6655
AVIVA -.5714 3.40368 .867 -7.3798 6.2369
HDFC -1.0000 3.40368 .770 -7.8084 5.8084
BAJAJ -2.7143 3.40368 .428 -9.5227 4.0941
MAX NEW 2.7143 3.40368 .428 -4.0941 9.5227
BIRLA 1.8571 3.40368 .587 -4.9512 8.6655
NATIONAL 4.0000 3.40368 .245 -2.8084 10.8084 ING 2.7143 3.40368 .428 -4.0941 9.5227
HDFC LIC -37.2857(*) 3.40368 .000 -44.0941 -30.4773
KOTAK .2857 3.40368 .933 -6.5227 7.0941
RELIANCE .8571 3.40368 .802 -5.9512 7.6655
AVIVA .4286 3.40368 .900 -6.3798 7.2369
TATA 1.0000 3.40368 .770 -5.8084 7.8084
BAJAJ -1.7143 3.40368 .616 -8.5227 5.0941
MAX NEW 3.7143 3.40368 .280 -3.0941 10.5227
BIRLA 2.8571 3.40368 .405 -3.9512 9.6655
NATIONAL 5.0000 3.40368 .147 -1.8084 11.8084
ING 3.7143 3.40368 .280 -3.0941 10.5227
BAJAJ LIC -35.5714(*) 3.40368 .000 -42.3798 -28.7631 KOTAK 2.0000 3.40368 .559 -4.8084 8.8084
RELIANCE 2.5714 3.40368 .453 -4.2369 9.3798
AVIVA 2.1429 3.40368 .531 -4.6655 8.9512
TATA 2.7143 3.40368 .428 -4.0941 9.5227
HDFC 1.7143 3.40368 .616 -5.0941 8.5227
MAX NEW 5.4286 3.40368 .116 -1.3798 12.2369
BIRLA 4.5714 3.40368 .184 -2.2369 11.3798
NATIONAL 6.7143 3.40368 .053 -.0941 13.5227
ING 5.4286 3.40368 .116 -1.3798 12.2369

164
MAX NEW LIC -41.0000(*) 3.40368 .000 -47.8084 -34.1916
KOTAK -3.4286 3.40368 .318 -10.2369 3.3798
RELIANCE -2.8571 3.40368 .405 -9.6655 3.9512 AVIVA -3.2857 3.40368 .338 -10.0941 3.5227
TATA -2.7143 3.40368 .428 -9.5227 4.0941
HDFC -3.7143 3.40368 .280 -10.5227 3.0941
BAJAJ -5.4286 3.40368 .116 -12.2369 1.3798
BIRLA -.8571 3.40368 .802 -7.6655 5.9512
NATIONAL 1.2857 3.40368 .707 -5.5227 8.0941
ING .0000 3.40368 1.000 -6.8084 6.8084
BIRLA LIC -40.1429(*) 3.40368 .000 -46.9512 -33.3345
KOTAK -2.5714 3.40368 .453 -9.3798 4.2369
RELIANCE -2.0000 3.40368 .559 -8.8084 4.8084
AVIVA -2.4286 3.40368 .478 -9.2369 4.3798
TATA -1.8571 3.40368 .587 -8.6655 4.9512 HDFC -2.8571 3.40368 .405 -9.6655 3.9512
BAJAJ -4.5714 3.40368 .184 -11.3798 2.2369
MAX NEW .8571 3.40368 .802 -5.9512 7.6655
NATIONAL 2.1429 3.40368 .531 -4.6655 8.9512
ING .8571 3.40368 .802 -5.9512 7.6655
NATIONAL LIC -42.2857(*) 3.40368 .000 -49.0941 -35.4773
KOTAK -4.7143 3.40368 .171 -11.5227 2.0941
RELIANCE -4.1429 3.40368 .228 -10.9512 2.6655
AVIVA -4.5714 3.40368 .184 -11.3798 2.2369
TATA -4.0000 3.40368 .245 -10.8084 2.8084
HDFC -5.0000 3.40368 .147 -11.8084 1.8084
BAJAJ -6.7143 3.40368 .053 -13.5227 .0941 MAX NEW -1.2857 3.40368 .707 -8.0941 5.5227
BIRLA -2.1429 3.40368 .531 -8.9512 4.6655
ING -1.2857 3.40368 .707 -8.0941 5.5227
ING LIC -41.0000(*) 3.40368 .000 -47.8084 -34.1916
KOTAK -3.4286 3.40368 .318 -10.2369 3.3798
RELIANCE -2.8571 3.40368 .405 -9.6655 3.9512
AVIVA -3.2857 3.40368 .338 -10.0941 3.5227
TATA -2.7143 3.40368 .428 -9.5227 4.0941
HDFC -3.7143 3.40368 .280 -10.5227 3.0941
BAJAJ -5.4286 3.40368 .116 -12.2369 1.3798
MAX NEW .0000 3.40368 1.000 -6.8084 6.8084
BIRLA -.8571 3.40368 .802 -7.6655 5.9512 NATIONAL 1.2857 3.40368 .707 -5.5227 8.0941
Bonferroni LIC KOTAK 37.5714(*) 3.40368 .000 25.6893 49.4535
RELIANCE 38.1429(*) 3.40368 .000 26.2607 50.0250
AVIVA 37.7143(*) 3.40368 .000 25.8322 49.5964
TATA 38.2857(*) 3.40368 .000 26.4036 50.1678
HDFC 37.2857(*) 3.40368 .000 25.4036 49.1678
BAJAJ 35.5714(*) 3.40368 .000 23.6893 47.4535
MAX NEW 41.0000(*) 3.40368 .000 29.1179 52.8821
BIRLA 40.1429(*) 3.40368 .000 28.2607 52.0250
NATIONAL 42.2857(*) 3.40368 .000 30.4036 54.1678
ING 41.0000(*) 3.40368 .000 29.1179 52.8821
KOTAK LIC -37.5714(*) 3.40368 .000 -49.4535 -25.6893 RELIANCE .5714 3.40368 1.000 -11.3107 12.4535

165
AVIVA .1429 3.40368 1.000 -11.7393 12.0250
TATA .7143 3.40368 1.000 -11.1678 12.5964
HDFC -.2857 3.40368 1.000 -12.1678 11.5964
BAJAJ -2.0000 3.40368 1.000 -13.8821 9.8821
MAX NEW 3.4286 3.40368 1.000 -8.4535 15.3107
BIRLA 2.5714 3.40368 1.000 -9.3107 14.4535
NATIONAL 4.7143 3.40368 1.000 -7.1678 16.5964
ING 3.4286 3.40368 1.000 -8.4535 15.3107
RELIANCE LIC -38.1429(*) 3.40368 .000 -50.0250 -26.2607
KOTAK -.5714 3.40368 1.000 -12.4535 11.3107
AVIVA -.4286 3.40368 1.000 -12.3107 11.4535
TATA .1429 3.40368 1.000 -11.7393 12.0250 HDFC -.8571 3.40368 1.000 -12.7393 11.0250
BAJAJ -2.5714 3.40368 1.000 -14.4535 9.3107
MAX NEW 2.8571 3.40368 1.000 -9.0250 14.7393
BIRLA 2.0000 3.40368 1.000 -9.8821 13.8821
NATIONAL 4.1429 3.40368 1.000 -7.7393 16.0250
ING 2.8571 3.40368 1.000 -9.0250 14.7393
AVIVA LIC -37.7143(*) 3.40368 .000 -49.5964 -25.8322
KOTAK -.1429 3.40368 1.000 -12.0250 11.7393
RELIANCE .4286 3.40368 1.000 -11.4535 12.3107
TATA .5714 3.40368 1.000 -11.3107 12.4535
HDFC -.4286 3.40368 1.000 -12.3107 11.4535
BAJAJ -2.1429 3.40368 1.000 -14.0250 9.7393 MAX NEW 3.2857 3.40368 1.000 -8.5964 15.1678
BIRLA 2.4286 3.40368 1.000 -9.4535 14.3107
NATIONAL 4.5714 3.40368 1.000 -7.3107 16.4535
ING 3.2857 3.40368 1.000 -8.5964 15.1678
TATA LIC -38.2857(*) 3.40368 .000 -50.1678 -26.4036
KOTAK -.7143 3.40368 1.000 -12.5964 11.1678
RELIANCE -.1429 3.40368 1.000 -12.0250 11.7393
AVIVA -.5714 3.40368 1.000 -12.4535 11.3107
HDFC -1.0000 3.40368 1.000 -12.8821 10.8821
BAJAJ -2.7143 3.40368 1.000 -14.5964 9.1678
MAX NEW 2.7143 3.40368 1.000 -9.1678 14.5964
BIRLA 1.8571 3.40368 1.000 -10.0250 13.7393 NATIONAL 4.0000 3.40368 1.000 -7.8821 15.8821
ING 2.7143 3.40368 1.000 -9.1678 14.5964
HDFC LIC -37.2857(*) 3.40368 .000 -49.1678 -25.4036
KOTAK .2857 3.40368 1.000 -11.5964 12.1678
RELIANCE .8571 3.40368 1.000 -11.0250 12.7393
AVIVA .4286 3.40368 1.000 -11.4535 12.3107
TATA 1.0000 3.40368 1.000 -10.8821 12.8821
BAJAJ -1.7143 3.40368 1.000 -13.5964 10.1678
MAX NEW 3.7143 3.40368 1.000 -8.1678 15.5964
BIRLA 2.8571 3.40368 1.000 -9.0250 14.7393
NATIONAL 5.0000 3.40368 1.000 -6.8821 16.8821
ING 3.7143 3.40368 1.000 -8.1678 15.5964 BAJAJ LIC -35.5714(*) 3.40368 .000 -47.4535 -23.6893
KOTAK 2.0000 3.40368 1.000 -9.8821 13.8821
RELIANCE 2.5714 3.40368 1.000 -9.3107 14.4535
AVIVA 2.1429 3.40368 1.000 -9.7393 14.0250

166
TATA 2.7143 3.40368 1.000 -9.1678 14.5964
HDFC 1.7143 3.40368 1.000 -10.1678 13.5964
MAX NEW 5.4286 3.40368 1.000 -6.4535 17.3107
BIRLA 4.5714 3.40368 1.000 -7.3107 16.4535
NATIONAL 6.7143 3.40368 1.000 -5.1678 18.5964
ING 5.4286 3.40368 1.000 -6.4535 17.3107
MAX NEW LIC -41.0000(*) 3.40368 .000 -52.8821 -29.1179
KOTAK -3.4286 3.40368 1.000 -15.3107 8.4535 RELIANCE -2.8571 3.40368 1.000 -14.7393 9.0250
AVIVA -3.2857 3.40368 1.000 -15.1678 8.5964
TATA -2.7143 3.40368 1.000 -14.5964 9.1678
HDFC -3.7143 3.40368 1.000 -15.5964 8.1678
BAJAJ -5.4286 3.40368 1.000 -17.3107 6.4535
BIRLA -.8571 3.40368 1.000 -12.7393 11.0250
NATIONAL 1.2857 3.40368 1.000 -10.5964 13.1678
ING .0000 3.40368 1.000 -11.8821 11.8821
BIRLA LIC -40.1429(*) 3.40368 .000 -52.0250 -28.2607
KOTAK -2.5714 3.40368 1.000 -14.4535 9.3107
RELIANCE -2.0000 3.40368 1.000 -13.8821 9.8821
AVIVA -2.4286 3.40368 1.000 -14.3107 9.4535 TATA -1.8571 3.40368 1.000 -13.7393 10.0250
HDFC -2.8571 3.40368 1.000 -14.7393 9.0250
BAJAJ -4.5714 3.40368 1.000 -16.4535 7.3107
MAX NEW .8571 3.40368 1.000 -11.0250 12.7393
NATIONAL 2.1429 3.40368 1.000 -9.7393 14.0250
ING .8571 3.40368 1.000 -11.0250 12.7393
NATIONAL LIC -42.2857(*) 3.40368 .000 -54.1678 -30.4036
KOTAK -4.7143 3.40368 1.000 -16.5964 7.1678
RELIANCE -4.1429 3.40368 1.000 -16.0250 7.7393
AVIVA -4.5714 3.40368 1.000 -16.4535 7.3107
TATA -4.0000 3.40368 1.000 -15.8821 7.8821
HDFC -5.0000 3.40368 1.000 -16.8821 6.8821 BAJAJ -6.7143 3.40368 1.000 -18.5964 5.1678
MAX NEW -1.2857 3.40368 1.000 -13.1678 10.5964
BIRLA -2.1429 3.40368 1.000 -14.0250 9.7393
ING -1.2857 3.40368 1.000 -13.1678 10.5964
ING LIC -41.0000(*) 3.40368 .000 -52.8821 -29.1179
KOTAK -3.4286 3.40368 1.000 -15.3107 8.4535
RELIANCE -2.8571 3.40368 1.000 -14.7393 9.0250
AVIVA -3.2857 3.40368 1.000 -15.1678 8.5964
TATA -2.7143 3.40368 1.000 -14.5964 9.1678
HDFC -3.7143 3.40368 1.000 -15.5964 8.1678
BAJAJ -5.4286 3.40368 1.000 -17.3107 6.4535
MAX NEW .0000 3.40368 1.000 -11.8821 11.8821 BIRLA -.8571 3.40368 1.000 -12.7393 11.0250
NATIONAL 1.2857 3.40368 1.000 -10.5964 13.1678
Sidak LIC KOTAK 37.5714(*) 3.40368 .000 25.7168 49.4261
RELIANCE 38.1429(*) 3.40368 .000 26.2882 49.9975
AVIVA 37.7143(*) 3.40368 .000 25.8597 49.5689
TATA 38.2857(*) 3.40368 .000 26.4311 50.1403
HDFC 37.2857(*) 3.40368 .000 25.4311 49.1403
BAJAJ 35.5714(*) 3.40368 .000 23.7168 47.4261

167
MAX NEW 41.0000(*) 3.40368 .000 29.1454 52.8546
BIRLA 40.1429(*) 3.40368 .000 28.2882 51.9975
NATIONAL 42.2857(*) 3.40368 .000 30.4311 54.1403
ING 41.0000(*) 3.40368 .000 29.1454 52.8546 KOTAK LIC -37.5714(*) 3.40368 .000 -49.4261 -25.7168
RELIANCE .5714 3.40368 1.000 -11.2832 12.4261
AVIVA .1429 3.40368 1.000 -11.7118 11.9975
TATA .7143 3.40368 1.000 -11.1403 12.5689
HDFC -.2857 3.40368 1.000 -12.1403 11.5689
BAJAJ -2.0000 3.40368 1.000 -13.8546 9.8546
MAX NEW 3.4286 3.40368 1.000 -8.4261 15.2832
BIRLA 2.5714 3.40368 1.000 -9.2832 14.4261
NATIONAL 4.7143 3.40368 1.000 -7.1403 16.5689
ING 3.4286 3.40368 1.000 -8.4261 15.2832
RELIANCE LIC -38.1429(*) 3.40368 .000 -49.9975 -26.2882
KOTAK -.5714 3.40368 1.000 -12.4261 11.2832 AVIVA -.4286 3.40368 1.000 -12.2832 11.4261 TATA .1429 3.40368 1.000 -11.7118 11.9975
HDFC -.8571 3.40368 1.000 -12.7118 10.9975
BAJAJ -2.5714 3.40368 1.000 -14.4261 9.2832
MAX NEW 2.8571 3.40368 1.000 -8.9975 14.7118
BIRLA 2.0000 3.40368 1.000 -9.8546 13.8546
NATIONAL 4.1429 3.40368 1.000 -7.7118 15.9975
ING 2.8571 3.40368 1.000 -8.9975 14.7118
AVIVA LIC -37.7143(*) 3.40368 .000 -49.5689 -25.8597
KOTAK -.1429 3.40368 1.000 -11.9975 11.7118
RELIANCE .4286 3.40368 1.000 -11.4261 12.2832
TATA .5714 3.40368 1.000 -11.2832 12.4261
HDFC -.4286 3.40368 1.000 -12.2832 11.4261 BAJAJ -2.1429 3.40368 1.000 -13.9975 9.7118
MAX NEW 3.2857 3.40368 1.000 -8.5689 15.1403
BIRLA 2.4286 3.40368 1.000 -9.4261 14.2832
NATIONAL 4.5714 3.40368 1.000 -7.2832 16.4261
ING 3.2857 3.40368 1.000 -8.5689 15.1403
TATA LIC -38.2857(*) 3.40368 .000 -50.1403 -26.4311
KOTAK -.7143 3.40368 1.000 -12.5689 11.1403
RELIANCE -.1429 3.40368 1.000 -11.9975 11.7118
AVIVA -.5714 3.40368 1.000 -12.4261 11.2832
HDFC -1.0000 3.40368 1.000 -12.8546 10.8546
BAJAJ -2.7143 3.40368 1.000 -14.5689 9.1403
MAX NEW 2.7143 3.40368 1.000 -9.1403 14.5689 BIRLA 1.8571 3.40368 1.000 -9.9975 13.7118
NATIONAL 4.0000 3.40368 1.000 -7.8546 15.8546
ING 2.7143 3.40368 1.000 -9.1403 14.5689
HDFC LIC -37.2857(*) 3.40368 .000 -49.1403 -25.4311
KOTAK .2857 3.40368 1.000 -11.5689 12.1403
RELIANCE .8571 3.40368 1.000 -10.9975 12.7118
AVIVA .4286 3.40368 1.000 -11.4261 12.2832
TATA 1.0000 3.40368 1.000 -10.8546 12.8546
BAJAJ -1.7143 3.40368 1.000 -13.5689 10.1403
MAX NEW 3.7143 3.40368 1.000 -8.1403 15.5689
BIRLA 2.8571 3.40368 1.000 -8.9975 14.7118

168
NATIONAL 5.0000 3.40368 1.000 -6.8546 16.8546 ING 3.7143 3.40368 1.000 -8.1403 15.5689
BAJAJ LIC -35.5714(*) 3.40368 .000 -47.4261 -23.7168
KOTAK 2.0000 3.40368 1.000 -9.8546 13.8546
RELIANCE 2.5714 3.40368 1.000 -9.2832 14.4261
AVIVA 2.1429 3.40368 1.000 -9.7118 13.9975
TATA 2.7143 3.40368 1.000 -9.1403 14.5689
HDFC 1.7143 3.40368 1.000 -10.1403 13.5689
MAX NEW 5.4286 3.40368 .999 -6.4261 17.2832
BIRLA 4.5714 3.40368 1.000 -7.2832 16.4261
NATIONAL 6.7143 3.40368 .950 -5.1403 18.5689
ING 5.4286 3.40368 .999 -6.4261 17.2832
MAX NEW LIC -41.0000(*) 3.40368 .000 -52.8546 -29.1454 KOTAK -3.4286 3.40368 1.000 -15.2832 8.4261
RELIANCE -2.8571 3.40368 1.000 -14.7118 8.9975
AVIVA -3.2857 3.40368 1.000 -15.1403 8.5689
TATA -2.7143 3.40368 1.000 -14.5689 9.1403
HDFC -3.7143 3.40368 1.000 -15.5689 8.1403
BAJAJ -5.4286 3.40368 .999 -17.2832 6.4261
BIRLA -.8571 3.40368 1.000 -12.7118 10.9975
NATIONAL 1.2857 3.40368 1.000 -10.5689 13.1403
ING .0000 3.40368 1.000 -11.8546 11.8546
BIRLA LIC -40.1429(*) 3.40368 .000 -51.9975 -28.2882
KOTAK -2.5714 3.40368 1.000 -14.4261 9.2832
RELIANCE -2.0000 3.40368 1.000 -13.8546 9.8546 AVIVA -2.4286 3.40368 1.000 -14.2832 9.4261
TATA -1.8571 3.40368 1.000 -13.7118 9.9975
HDFC -2.8571 3.40368 1.000 -14.7118 8.9975
BAJAJ -4.5714 3.40368 1.000 -16.4261 7.2832
MAX NEW .8571 3.40368 1.000 -10.9975 12.7118
NATIONAL 2.1429 3.40368 1.000 -9.7118 13.9975
ING .8571 3.40368 1.000 -10.9975 12.7118
NATIONAL LIC -42.2857(*) 3.40368 .000 -54.1403 -30.4311
KOTAK -4.7143 3.40368 1.000 -16.5689 7.1403
RELIANCE -4.1429 3.40368 1.000 -15.9975 7.7118
AVIVA -4.5714 3.40368 1.000 -16.4261 7.2832
TATA -4.0000 3.40368 1.000 -15.8546 7.8546 HDFC -5.0000 3.40368 1.000 -16.8546 6.8546
BAJAJ -6.7143 3.40368 .950 -18.5689 5.1403
MAX NEW -1.2857 3.40368 1.000 -13.1403 10.5689
BIRLA -2.1429 3.40368 1.000 -13.9975 9.7118
ING -1.2857 3.40368 1.000 -13.1403 10.5689
ING LIC -41.0000(*) 3.40368 .000 -52.8546 -29.1454
KOTAK -3.4286 3.40368 1.000 -15.2832 8.4261
RELIANCE -2.8571 3.40368 1.000 -14.7118 8.9975
AVIVA -3.2857 3.40368 1.000 -15.1403 8.5689
TATA -2.7143 3.40368 1.000 -14.5689 9.1403
HDFC -3.7143 3.40368 1.000 -15.5689 8.1403
BAJAJ -5.4286 3.40368 .999 -17.2832 6.4261 MAX NEW .0000 3.40368 1.000 -11.8546 11.8546
BIRLA -.8571 3.40368 1.000 -12.7118 10.9975
NATIONAL 1.2857 3.40368 1.000 -10.5689 13.1403
169
Based on observed means. * The mean difference is significant at the .05 level.
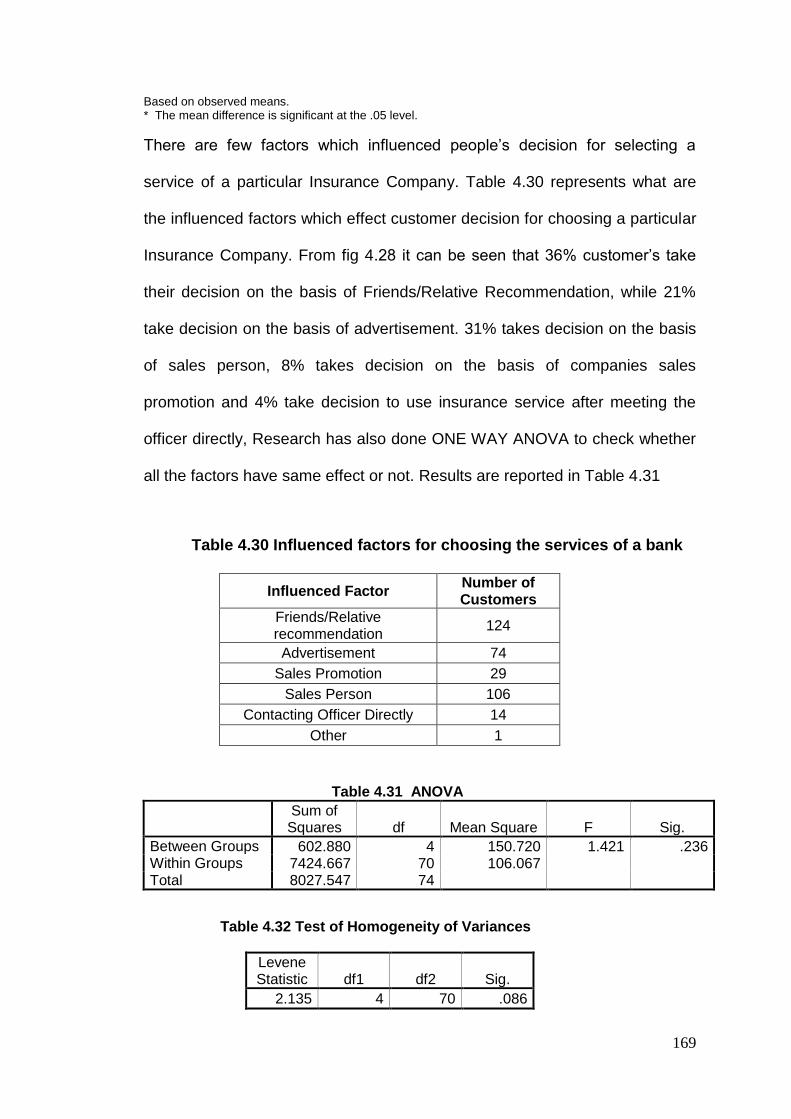
There are few factors which influenced people’s decision for selecting a
service of a particular Insurance Company. Table 4.30 represents what are
the influenced factors which effect customer decision for choosing a particular
Insurance Company. From fig 4.28 it can be seen that 36% customer’s take
their decision on the basis of Friends/Relative Recommendation, while 21%
take decision on the basis of advertisement. 31% takes decision on the basis
of sales person, 8% takes decision on the basis of companies sales
promotion and 4% take decision to use insurance service after meeting the
officer directly, Research has also done ONE WAY ANOVA to check whether
all the factors have same effect or not. Results are reported in Table 4.31
Table 4.30 Influenced factors for choosing the services of a bank
Influenced Factor Number of Customers
Friends/Relative recommendation
124
Advertisement 74
Sales Promotion 29
Sales Person 106
Contacting Officer Directly 14
Other 1
Table 4.31 ANOVA
Sum of Squares df Mean Square F Sig.
Between Groups 602.880 4 150.720 1.421 .236 Within Groups 7424.667 70 106.067 Total 8027.547 74
Table 4.32 Test of Homogeneity of Variances
Levene Statistic df1 df2 Sig.
2.135 4 70 .086

170
The value of F-statistic is 1.421 with significance value 0.236, indicating no
significant impact of various influenced factors, also Levene’s test of
Homogeneity of variance is 2.135 with significance value 0.086, the
assumption of Homogeneity of variance for performing ANOVA is satisfied.
Fig 4.28 Influenced factors for choosing the services of a Insurance Company
Table 4.33 represents level of satisfaction of different Insurance Company. To
clear the picture researcher created table percentage wise.
Table 4.34 represents the satisfaction level of customer percentage wise.
Some of the points which can be say from table are more than 70% of the
respondents of AVIVA and Birla Life Insurance are highly satisfied , it can be
noted here Religare, Oriental, Postal and MPT Insurance Company is not
considered because of less customer. Percentage of Highly Satisfied
Customer for National, ING, and HDFC Insurance Company are 60-70%,
Friends/Relative recommendatio
n 36%
Advertisement 21% Sales Promotion
8%
Sales Person 31%
Contacting Officer Directly
4%
Other 0%

171
while 50-60% of customers are highly satisfied with KOTAK, Reliance, TATA
and Max New York and 48% of the customers are highly satisfied with LIC
and BAJAJ which means LIC and BAJAJ are not taking care of customer.
Researcher has also drawn graph to make picture clearer.
Table 4.33 Satisfaction level of customers
Bank Name Highly Satisfied
(5)
Somewhat Satisfied(4)
Neither Satisfied nor
Dissatisfied(3)
Not Satisfied
LIC 61 48 16 0
RELIGARE 1 0 0 0
KOTAK 7 5 1 0
RELIANCE 10 6 1 0
AVIVA 8 3 0 0
ORIENTAL 0 1 0 0
TATA AIG 7 3 3 0
HDFC STANDARD
9 1 4 0
BAJAJ 12 6 1 6
MAX NEW YORK
1 2 1 0
POSTAL LIFE 1 0 0 0
MPT LIFE 2 0 0 0
BIRLA SUN LIFE
7 0 2 0
NATIONAL
2 0 1 0
ING 2 0 1 0
LIC 1 2 2 0

172
Table 4.34 Satisfaction levels of customer’s percentage wise
Bank Name Highly Satisfied
(5)
Somewhat Satisfied(4)
Neither Satisfied nor
Dissatisfied(3)
Not Satisfied
LIC 48.80 38.40 12.80 0.00
RELIGARE 100.00 0.00 0.00 0.00
KOTAK 53.85 38.46 7.69 0.00
RELIANCE 58.82 35.29 5.88 0.00
AVIVA 72.73 27.27 0.00 0.00
ORIENTAL 0.00 100.00 0.00 0.00
TATA AIG 53.85 23.08 23.08 0.00
HDFC STANDARD 64.29 7.14 28.57 0.00
BAJAJ 48.00 24.00 4.00 24.00
MAX NEW YORK 25.00 50.00 25.00 0.00
POSTAL LIFE 100.00 0.00 0.00 0.00
MPT LIFE 100.00 0.00 0.00 0.00
BIRLA SUN LIFE 77.78 0.00 22.22 0.00
NATIONAL 66.67 0.00 33.33 0.00
ING 66.67 0.00 33.33 0.00
LIC 20.00 40.00 40.00 0.00
Fig 4.29 Satisfaction level of customers
0.00
10.00
20.00
30.00
40.00
50.00
60.00
70.00
80.00
Series1
Series2
Series3
Series4

173
Table 4.35 Number of Customers who recommend Insurance Company to others
Bank Name Definitely(5) Probably(4) May be(3) Probably not (2)
LIC 57 39 25 3
RELIGARE 1 0 0 0
KOTAK 6 5 1 0
RELIANCE 6 8 3 0
AVIVA 6 4 3 0
ORIENTAL 0 1 0 0
TATA AIG 6 2 4 1
HDFC STANDARD 7 3 4 0
BAJAJ 12 3 5 0
MAX NEW YORK 0 3 1 0
POSTAL LIFE 1 0 0 0
MPT LIFE 2 0 0 0
BIRLA SUN LIFE 6 1 2 0
NATIONAL 2 0 1 0
ING 1 2 3 0
Table 4.35 gives customer recommendation for particular Insurance to other.
Fig 4.30 Customer Recommendation for Insurance Company
To study the promotion strategy in Insurance, researcher has framed 12
statements on a 5-point Likert’s Scale, where Scale-5 indicates very effective
0
10
20
30
40
50
60
LIC
REL
IGA
RE
KO
TAK
REL
IAN
CE
AV
IVA
OR
IEN
TAL
TATA
AIG
HD
FC S
TAN
DA
RD
BA
JAJ
MA
X N
EW Y
OR
K
PO
STA
L LI
FE
MP
T LI
FE
BIR
LA S
UN
LIF
E
N
ATI
ON
AL
Definitely(5)
Probably(4)
May be(3)
Probably not (2)

174
and Scale-1 indicate least effective. To test the reliability of scale Cronbach’s
Alpha Reliability Test has applied. Result of these test are as follows:
Table 4.36 Reliability Statistics
Cronbach's Alpha
Cronbach's Alpha Based on Standardized Items N of Items
0.838 0.834 12
Cronbach’s Alpha value is 0.838, which give support to Reliability of
Questionnaire. It also indicates one can definitely go for further analysis.
Researcher has also done ANOVA TEST to test effect of 12 statements.
Table 4.37 ANOVA with Friedman's Test
Sum of
Squares df Mean Square Friedman's Chi-Square Sig
Between People 964.074 238 4.051
Within People Between Items 362.238(a) 11 32.931 457.683 .000
Residual 1718.512 2618 .656
Total 2080.750 2629 .791
Total 3044.824 2867 1.062
Grand Mean = 3.6942 a Kendall's coefficient of concordance W = .119.
The value of F-statistic is 457.683 with significance value 0.000, indicating
significant impact of various statements. Table 4.38 represents the rank given
by customers. Figure 4.14 represent the rank given by customers for
promotion tool.
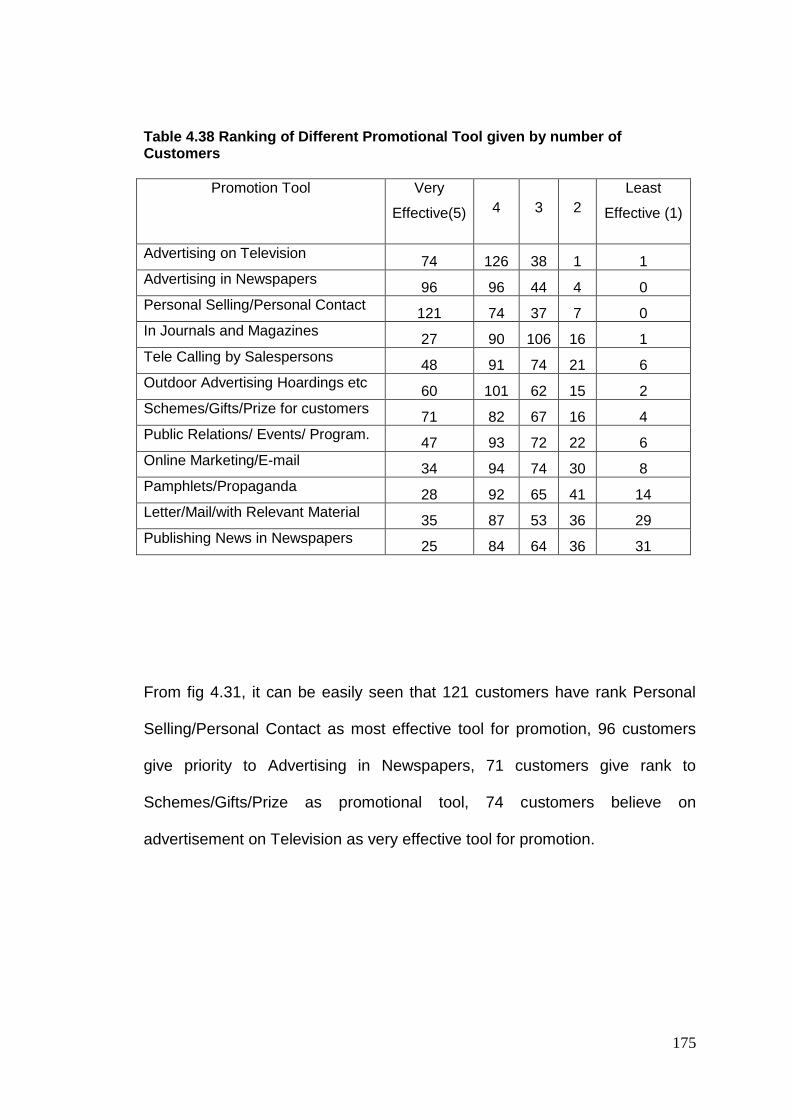
175
Table 4.38 Ranking of Different Promotional Tool given by number of Customers
Promotion Tool Very
Effective(5) 4 3 2
Least
Effective (1)
Advertising on Television 74 126 38 1 1
Advertising in Newspapers 96 96 44 4 0
Personal Selling/Personal Contact 121 74 37 7 0
In Journals and Magazines 27 90 106 16 1
Tele Calling by Salespersons 48 91 74 21 6
Outdoor Advertising Hoardings etc 60 101 62 15 2
Schemes/Gifts/Prize for customers 71 82 67 16 4
Public Relations/ Events/ Program. 47 93 72 22 6
Online Marketing/E-mail 34 94 74 30 8
Pamphlets/Propaganda 28 92 65 41 14
Letter/Mail/with Relevant Material 35 87 53 36 29
Publishing News in Newspapers 25 84 64 36 31
From fig 4.31, it can be easily seen that 121 customers have rank Personal
Selling/Personal Contact as most effective tool for promotion, 96 customers
give priority to Advertising in Newspapers, 71 customers give rank to
Schemes/Gifts/Prize as promotional tool, 74 customers believe on
advertisement on Television as very effective tool for promotion.
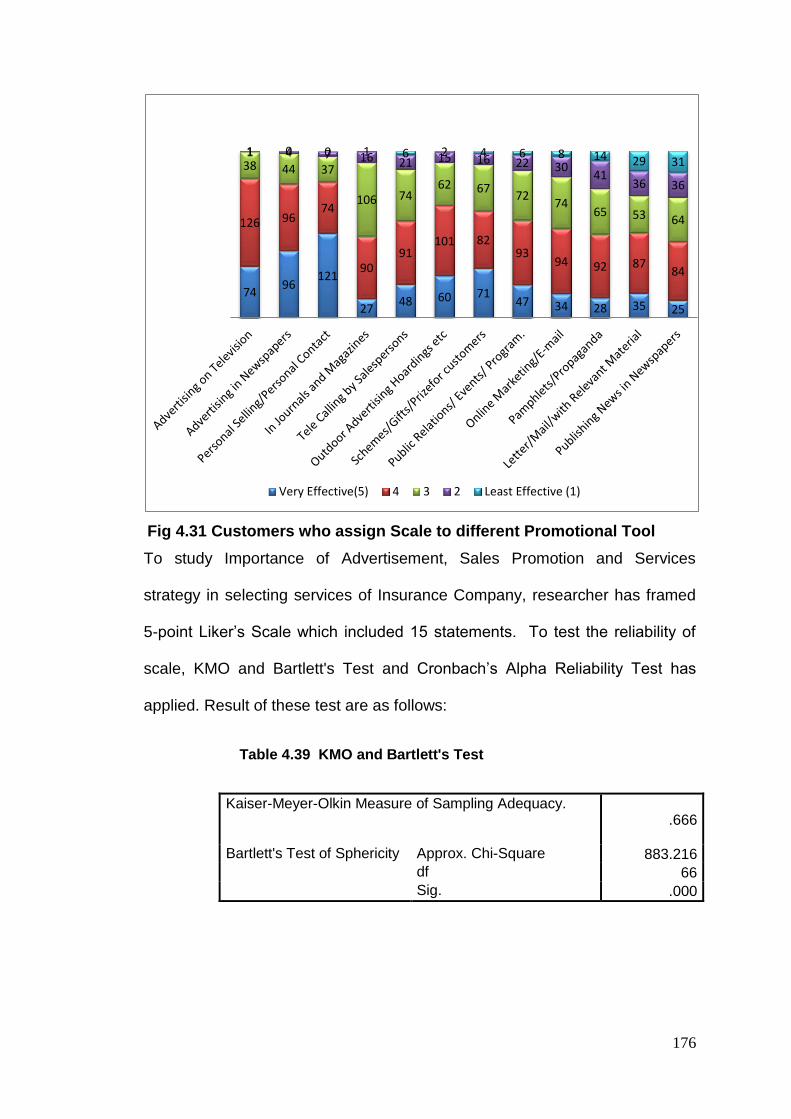
176
Fig 4.31 Customers who assign Scale to different Promotional Tool
To study Importance of Advertisement, Sales Promotion and Services
strategy in selecting services of Insurance Company, researcher has framed
5-point Liker’s Scale which included 15 statements. To test the reliability of
scale, KMO and Bartlett's Test and Cronbach’s Alpha Reliability Test has
applied. Result of these test are as follows:
Table 4.39 KMO and Bartlett's Test
Kaiser-Meyer-Olkin Measure of Sampling Adequacy. .666
Bartlett's Test of Sphericity Approx. Chi-Square 883.216
df 66
Sig. .000
74 96
121
27 48 60 71
47 34 28 35 25
126 96 74
90 91
101 82 93
94 92 87 84
38 44 37
106 74 62 67
72 74
65 53 64
1 4 7 16 21 15 16 22 30 41
36 36
1 0 0 1 6 2 4 6 8 14 29 31
Very Effective(5) 4 3 2 Least Effective (1)

177
Table 4.40 Reliability Statistics
Cronbach's Alpha
Cronbach's Alpha Based on
Standardized Items N of Items
.768 .778 15
Table 4.41 ANOVA
Sum of
Squares df Mean Square F Sig
Between People 693.024 236 2.937
Within People Between Items 152.004 11 13.819 20.261 .000
Residual 1770.579 2596 .682
Total 1922.583 2607 .737
Total 2615.607 2843 .920
Grand Mean = 3.8288
From the above tables, it can be said that Kaiser-Meyer-Olkin Measure of
Sampling Adequacy found 0.666, it indicates that the sample is adequate for
Factor analysis. The value of Bartlett’s Test of Sphericity is 883.216 with
significance value 0.000, while Cronbach’s Alpha value is 0.778 which give
support to Reliability of Questionnaire. The value of F-statistic is 20.261 with
significance value 0.000, indicating significant impact of various statements.
Table 4.42 represents the customer preference regarding advertisement,
sales promotion and service strategy. Fig 4.32 customer’s ranking towards
advertisement strategy.

178
Fig 4.32 Ranking of Advertisement strategy in terms of importance given
by number of Customers (Here series: 1 -means Highest, 2- means High,
3- means Average, 4-low and 5-lowest)
From fig 4.32 it can be said that maximum customers believe that the
contents in the advertisement through public document must be clear and
informative.
56 49 40 26 4
130 104 121
104
8
33 62 43
59
29
19 19 26 26
1
1 5 9 20
28
Series1 Series2 Series3 Series4 Series5

179
Table 4.42 Ranking of Advertisement, Sales Promotion and Services
strategy in terms of importance given by number of Customers
Strategy
Level of Choosing service
Highest High Average Low Lowest
5 4 3 2 1
Advertisement
The contents in the advertisement through
the public document is clear and informative 56 130 33 19 1
Advertising signage is unique, attractive and
understood easily. 49 104 62 19 5
Advertising through internet is prominent
and can be clicked to see the details easily. 40 121 43 26 9
Advertising banner posting content is easily
understandable and appealing to readers. 26 104 59 26 20
Advertising through other media 4 8 29 1 28
Sales Promotion
Giving a special rate to customers, for
example senior citizens. 66 117 33 6 15
Waving commission charge 60 90 65 11 7
Distributing free gift 32 86 65 17 27
Other marketing support 3 5 32 6 17
Services
Bank Officers provide prompt service. 64 148 21 2 2
Officers provide the correct information
about service, product and financial
transaction.
62 100 65 3 3
Service officers are polite and courteous. 69 122 38 3 5
Financial Forms are easily accessible. 68 116 49 4 2
A convenient one-stop service point. 64 116 47 4 3
Other comments 5 7 20 9 2
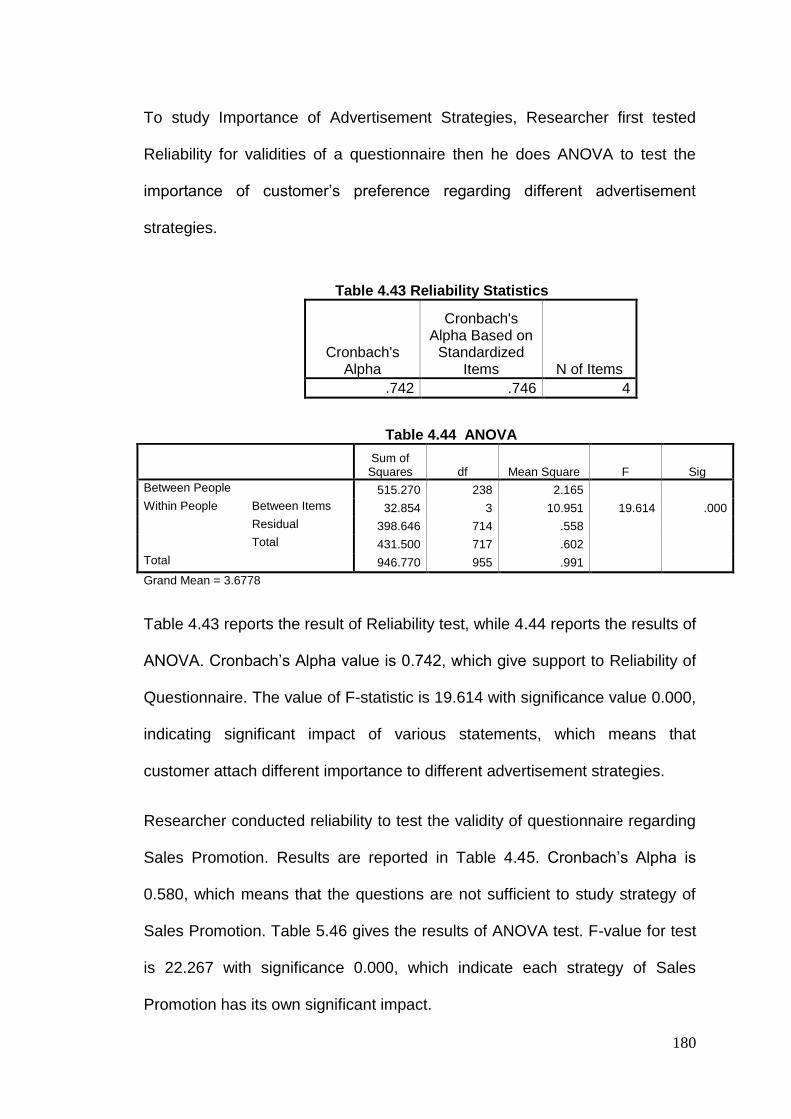
180
To study Importance of Advertisement Strategies, Researcher first tested
Reliability for validities of a questionnaire then he does ANOVA to test the
importance of customer’s preference regarding different advertisement
strategies.
Table 4.43 Reliability Statistics
Cronbach's Alpha
Cronbach's Alpha Based on
Standardized Items N of Items
.742 .746 4
Table 4.44 ANOVA
Sum of
Squares df Mean Square F Sig
Between People 515.270 238 2.165
Within People Between Items 32.854 3 10.951 19.614 .000
Residual 398.646 714 .558
Total 431.500 717 .602
Total 946.770 955 .991
Grand Mean = 3.6778
Table 4.43 reports the result of Reliability test, while 4.44 reports the results of
ANOVA. Cronbach’s Alpha value is 0.742, which give support to Reliability of
Questionnaire. The value of F-statistic is 19.614 with significance value 0.000,
indicating significant impact of various statements, which means that
customer attach different importance to different advertisement strategies.
Researcher conducted reliability to test the validity of questionnaire regarding
Sales Promotion. Results are reported in Table 4.45. Cronbach’s Alpha is
0.580, which means that the questions are not sufficient to study strategy of
Sales Promotion. Table 5.46 gives the results of ANOVA test. F-value for test
is 22.267 with significance 0.000, which indicate each strategy of Sales
Promotion has its own significant impact.

181
Table 4.45 Reliability Statistics
Cronbach's Alpha
Cronbach's Alpha Based on
Standardized Items N of Items
.580 .588 3
Table 4.46 ANOVA
Sum of
Squares df Mean Square F Sig
Between People 439.458 237 1.854
Within People Between Items 34.697 2 17.349 22.267 .000
Residual 369.303 474 .779
Total 404.000 476 .849
Total 843.458 713 1.183
Grand Mean = 3.7017
Fig 4.33 Ranking of Sales Promotion strategy in terms of importance
given by number of Customers (Here 1 -means Highest, 2- means High, 3- means Average, 4-low and 5-lowest).
1 2 3 4 5
66
117
33 6 15
60
90
65
11 7
32
86
65
17 27
3
5
32
6
17
Other marketing support
Distributing free gift
Waving commissioncharge
Giving a special rate tocustomers, for examplesenior citizens.

182
Fig 4.33 shows that customers give maximum importance to “Giving a special
rate to customers, for Example senior citizens. Fig 4.34 represents customer’s
importance regarding Services provided by Insurance Company. Table 4.47
results of Reliability of questionnaires for Services provided by Insurance
Company and Table 4.48 represents ANOVA results. Here Cronbach’s Alpha
value is 0.790, which give support to Reliability of Questionnaire. The value of
F-statistic is 4.101 with significance value 0.003, indicating significant impact
of various statements. The results of ANOVA indicate that Customers feels
that each Strategy regarding Services of Insurance Company is important in
its own.
Fig 4.34 Ranking of service strategy in terms of importance given by number of Customers (Here series: 1 -means Highest, 2- means High, 3- means Average, 4-low and 5-lowest).
Table 4.47 Reliability Statistics
Cronbach's Alpha
Cronbach's Alpha Based on
Standardized Items N of Items
.790 .791 5
64
62
69
68
64
5
148
100
122
116
116
7
21
65
38
49
47
20
2
3
3
4
4
9
2
3
5
2
3
2
Officers provide prompt service.
Officers provide the correct information aboutservice, product and financial transaction.
Service officers are polite and courteous.
Financial Forms are easily accessible.
A convenient one-stop service point.
Other comments
Series1 Series2 Series3 Series4 Series5

183
Table 4.48 ANOVA
Sum of
Squares df Mean Square F Sig
Between People 404.444 237 1.707
Within People Between Items 5.866 4 1.466 4.101 .003
Residual 338.934 948 .358
Total 344.800 952 .362
Total 749.244 1189 .630
Grand Mean = 4.0252

![Chapter 4shodhganga.inflibnet.ac.in/bitstream/10603/35843/12... · ), tertiary butyl hydrogen peroxide (TBHP) and Cumene hydroperoxide (CHP). Besides these, aluminum [43, 44], copper](https://img.pdfslide.us/doc/110x75/5f318d4c4479b6276c09aff3/chapter-tertiary-butyl-hydrogen-peroxide-tbhp-and-cumene-hydroperoxide-chp.jpg)