Embed Size (px)
Citation preview

42
CHAPTER 4 – DATA PRESENTATION AND ANALYSIS
4.1 General
This chapter discusses the data analysis of the research. Quantitative data has been
gathered from primary and secondary data sources have been analyzed in this
section. Primary data has been gathered from focus groups through the survey.
Initially the demographic data are presented, related to the respondents who
participated for the survey. Software known as SPSS version 16.0 and Microsoft
excel has been used to analyze the collected data. Statistical calculations such as
mean, standard deviation and median values have been calculated using SPSS and
Microsoft excel where appropriate.
4.2 Characteristics of Responses
This section summarizes the characteristics of the respondents of the research.
Table 4.1: Industry wise Distribution of Respondents
Frequency Percent Valid
Percent Cumulative
Percent
Valid Manufacturing 45 49.5 49.5 49.5
Service 32 35.2 35.2 84.6
Retail 12 13.2 13.2 97.8
Other 2 2.2 2.2 100.0
Total 91 100.0 100.0
Organizations in different industry sectors such as manufacturing, service, retail and
other sectors were studied under the research. Majority of respondents have received
from manufacturing sector with 49.5%. Service sector and retail sectors have become
the second and third respectively in the industry wise distribution of respondents in
the sample.

43
Table 4.2: Educational level Distribution of the Sample.
Frequency Percent
Valid Percent
Cumulative Percent
Valid Postgraduate Degree 17 18.7 18.7 18.7
Bachelors Degree 29 31.9 31.9 50.5
Diploma 20 22.0 22.0 72.5
Certificate 17 18.7 18.7 91.2
Other 8 8.8 8.8 100.0
Total 91 100.0 100.0 The distribution of level of education of respondents is as shown in Table 4.2.
Majority of the respondents are graduates who are 50.5% of total respondents. 22%
of participant’s posses a Diploma and 18.7% participant are having at least a
certificate level qualification. 91 total numbers of responses were considered in the
research.
Table 4.3: Total ERP Experience Distribution of the Sample
Frequency Percent
Valid Percent
Cumulative Percent
Valid
Years
2 ≥ E ≥0 36 39.56 39.56 39.56
5 ≥ E >2 45 49.45 49.45 89.01
10≥ E >5 9 9.89 9.89 98.90
15 ≥ E >10 1 1.10 1.10 100.00
Total 91 100.0 100.0
The distribution of level of experience of respondents is as shown in Table 4.3. 49%
of respondents are having the experience between 2 to 5 years and 40% are having 0
to 2 years experience.
Summarizes the experience level of the respondents the results says average 3.6 years
total ERP experience with standard deviation of 2 years experience of the
respondents.

44
Table 4.4 summarizes the ERP package characteristics.
Table 4.4: ERP Package Characteristics
Frequency Percent
Valid Percent
Cumulative Percent
Valid Standard package 16 17.6 17.6 17.6
Standard package with customization
73 80.2 80.2 97.8
Non standard package (Developed on company requirement)
2 2.2 2.2 100.0
Total 91 100.0 100.0
According to the Table 4.4, 80.2 % of respondents, the majority use standard
packages with customization. Non standard packages developed on company
requirement reported minimum of 2.2% of total responses.
Table 4.5: ERP Vendor Distribution
Frequency Percent
Valid Percent
Cumulative Percent
Valid SAP 26 28.6 28.6 28.6
Microsoft Dynamics
23 25.3 25.3 53.8
IFS 12 13.2 13.2 67.0
Oracle 10 11.0 11.0 78.0
Sage Accpac 11 12.1 12.1 90.1
Web ERP 6 6.6 6.6 96.7
Other 3 3.3 3.3 100.0
Total 91 100.0 100.0
ERP vendor wise distribution as per the respondent feedback is shown in Table 4.5.
SAP and Microsoft Dynamics ERP packages has recorded as most commonly used

45
ERP packages in the sample.IFS, Sage Accpacc and Oracle, Web ERP and Other
ERP packages records higher usage other than to SAP and Microsoft Dynamics in
the sample.ERP vendor penetration of the sample is shown in Figure 4.1
Figure 4.1: ERP Vendor Penetration of the Sample
Table 4.6: ERP Modular Distribution-Finance
Frequency Percent
Valid Percent
Cumulative Percent
Valid 0 2 2.2 2.2 2.2
Finance Module
89 97.8 97.8 100.0
Table 4.6 shows almost 97.8% use Finance module in their ERP packages.
According to the data it can be conclude most of the companies use their ERP
package especially for their financial activities. 71.4% respondents indicated that
SCM (Supply chain module) is in operation in their companies. Table 4.7 shows the
SCM modular distribution of the sample.

46
Table 4.7: ERP Modular Distribution-SCM
Frequency Percent
Valid Percent
Cumulative Percent
Valid 0 26 28.6 28.6 28.6
SCM (Supply Chain Management)
65 71.4 71.4 100.0
Total 91 100.0 100.0
Table 4.8: ERP Modules Implemented
Frequency Percent Valid Percent
Cumulative Percent
1-2 Modules 11 12.09 12.09 12.09 3-4 Modules 42 46.15 46.15 58.24 5-6 Modules 34 37.36 37.36 95.60 7-9 Modules 4 4.40 4.40 100.00 Total 91 100.00 100.00
The distribution of the number of ERP modules implemented their organizations is
shown in Table 4.8. 83.5% majority of responses in cooperated with 3 to 6 no of
modules with their ERP system.
Table 4.9: Summary of ERP Modules Implemented
N Valid 91
Missing 0 Mean 4.22 Median 4.00 Mode 4 Std. Deviation 1.611
Table 4.9 Summarizes that the ERP modules implemented with mean value of 4
Components with standard deviation of 1.6 of total responses.
Table 4.10 shows the average people involvement with the ERP system for identified
business activities.

47
Table 4.10: Average People Involvement with the ERP System
Name of the ERP
Average people involvement with the ERP Raise
Purchase order (PO) to Good receipt
(GR)
Receive an invoice to payment
completion to the vendor
On a complete
sale
Good receipt (GR)
to issuance
IFS 3 3 4 3 Microsoft Dynamics 3 3 4 2 Oracle 4 4 4 3 Other 6 6 4 6 Sage Accpac 6 3 5 4 SAP 5 5 5 4 Web ERP 2 3 4 4
Results shows SAP , Sage Accpac and other ERP’s records the higher average people
involvement including approval levels compared to ERP’s in the purchase order to
good receipt process. On a complete sale it says the average number of people
involvement with the system are same.SAP, Oracle, and other ERP’s shows higher
number of people involved in receive an invoice to payment completion to the
vendor.
4.3 Statistical Analysis of Parameters
According to the identified high level parameters, descriptive statistics such as mean
and standard deviation of complexities of ERP has been calculated. Table 4.11 in
Appendix-B summarizes statistical parameters for the complexity of ERP based on
product dimension. Rating scale has considered as complexity of ERP varies from
highest complexity to lowest complexity when Likert scale varies from 1 to 5.
Statistical data shows that SAP ERP is most complex and Microsoft Dynamics is
least complexity, according to the feedback received for the product dimension
parameters.

48
ERP Complexity based on People factor dimension is shown in Appendix-C, Table
4.12.
Analysis shows SAP records highest complexity in terms of people point of view.
Web based ERP. Oracle ,Sage Accpac, others ERP’s such as Epicor,IFS,Web based
ERP and Microsoft Dynamics shows from highest complexity to lowest complexity.
Mean value and standard deviation of complexity of ERP derived from Project
dimension parameters are shown in Appendix-D in Table 4.13.
It indicates that Oracle ERP is most complicated in Project dimension point of view
and Web based ERP is least complexity.
In Appendix–E, Table 4.14 shows the measurements of complexity measurement
with the company business processess.It shows how ERP alignment with the
business processes according to the feedback given. Analysis says SAP is less
aligned with companies’ business processes in the target group of and Microsoft
Dynamics is more aligned with business Processes. It can be seen that IFS ERP
system also more aligned with the business processors according to the feedbacks.
Based on the results Vendor wise ERP complexity index has been established. It’s
shown in Table.4.15.
Note: If Mean value closer to 0 it denotes higher complexity and if mean value closer
to 5 it denotes lesser complexity.i.e. ERP varies from highest complexity to lowest
complexity when Likert scale varies from 1 to 5.
Table 4.15: Vendor wise ERP Complexity Index
Name of the ERP Mean Std. Deviation ERP Complexity Index
SAP 3.28 0.32 7 Oracle 3.29 0.15 6 Other 3.34 0.30 5 Sage Accpac 3.35 0.31 4 IFS 3.51 0.20 3 Web ERP 3.76 0.23 2 Microsoft Dynamics 4.01 0.23 1 Graphical representation of complexity index calculated from the survey results is
shown in Figure 4.2.

49
Figure 4.2: Graphical Representation of Vendor based Complexity Index
ERP complexity index indicates that Microsoft Dynamics is least complexity and
SAP records highest complexity according to the survey feedback. Also It indicates
that Web ERP, IFS, Sage Accpac Oracle varies from lower complexity to higher
complex. It provides a general estimation and an idea in ERP systems selection
decision for medium scaled companies in Sri Lanka.
Table 4.16: Correlation among Independent Variables
ProductD PeopleF ProjectD BusinessP
ProductD Pearson Correlation 1 .574** .553** .385**
Sig. (2-tailed) 0.000 0.000 0.000 N 91 91 91 91
PeopleF Pearson Correlation .574** 1 .587** .516**
Sig. (2-tailed) 0.000 0.000 0.000 N 91 91 91 91
ProjectD Pearson Correlation .553** .587** 1 .360**
Sig. (2-tailed) 0.000 0.000 0.000 N 91 91 91 91
BusinessP Pearson Correlation .385** .516** .360** 1
Sig. (2-tailed) 0.000 0.000 0.000 N 91 91 91 91 **. Correlation is significant at the 0.01 level (2-tailed).
In the complexity analysis it can be seen that there is a significantly positive co-
relation among identified high level independent variables. Table 4.16 provides the
3.28
3.29
3.34
3.35
3.51
3.76
4.01
SAP
Oracle
Other
Sage Accpac
IFS
Web ERP
Microsoft Dynamics
ERP Complexity Index

50
correlation coefficients among independent variables. It says that that there is a
positive interrelationship among the Product dimension, People Factor, Project
dimension and Business processes in the complexity analysis.
To improve the clarity of the research in addition to the primary survey it has
been considered some secondary data available. Functionality, ease of use
(Less complexity), total cost of ownership were clearly the top three selection
criteria’s in ERP software decisions. (Abrdeen Group, 2007). According to
the literature survey, total cost of ownership important criteria for ERP
software decisions. Especially this is more important to small and medium
scaled business. Therefore average ERP per user cost has been analyzed as a
secondary data. Information gathered for secondary data sources are mainly
obtained from internet sites that published for Midmarket Enterprise ERP solution
guides and some data obtained from researches done for information systems
application for Medium scaled business in Sri Lanka. First it has been considered per
user cost of ERP for the measurement.
Table 4.17: ERP Average Cost per User
ERP Vendor
Average Software
Cost (Per user)
Source
Infor $5,206 Aberdeen Group, July 2007 Lawson $5,261 Aberdeen Group, July 2007 QAD $5,271 Aberdeen Group, July 2007 Epicor $5,366 Aberdeen Group, July 2007 SAP $6,111 Aberdeen Group, July 2007 Oracle $7,361 Aberdeen Group, July 2007 Dynamics AX $6,150 www.180systems.com/files/ERP-Comparison2008.xls Dynamics NAV $5,350 www.180systems.com/files/ERP-Comparison2008.xls Dynamics GP $3,025 www.180systems.com/files/ERP-Comparison2008.xls Dynamics SL $5,350 www.180systems.com/files/ERP-Comparison2008.xls Epicor Enterprise $3,000 www.180systems.com/files/ERP-Comparison2008.xls
IFS Applications $2,500 www.180systems.com/files/ERP-Comparison2008.xls
Sage Accpac 500 ERP $2,300 www.180systems.com/files/ERP-Comparison2008.xls

51
Table 4.17 shows the ERP per user cost and its graphical representation shows in Figure 4.3.
Figure 4.3: ERP Average Cost per User
According to the data Oracle ERP records highest per user cost. Further researcher has taken in to consideration some Sri Lankan experiences. According to the research done by Munasinghe and Jayawardana - The Success of Information Systems implemented in medium scaled industries-Sri Lankan experience also considered for the analysis as a secondary data.
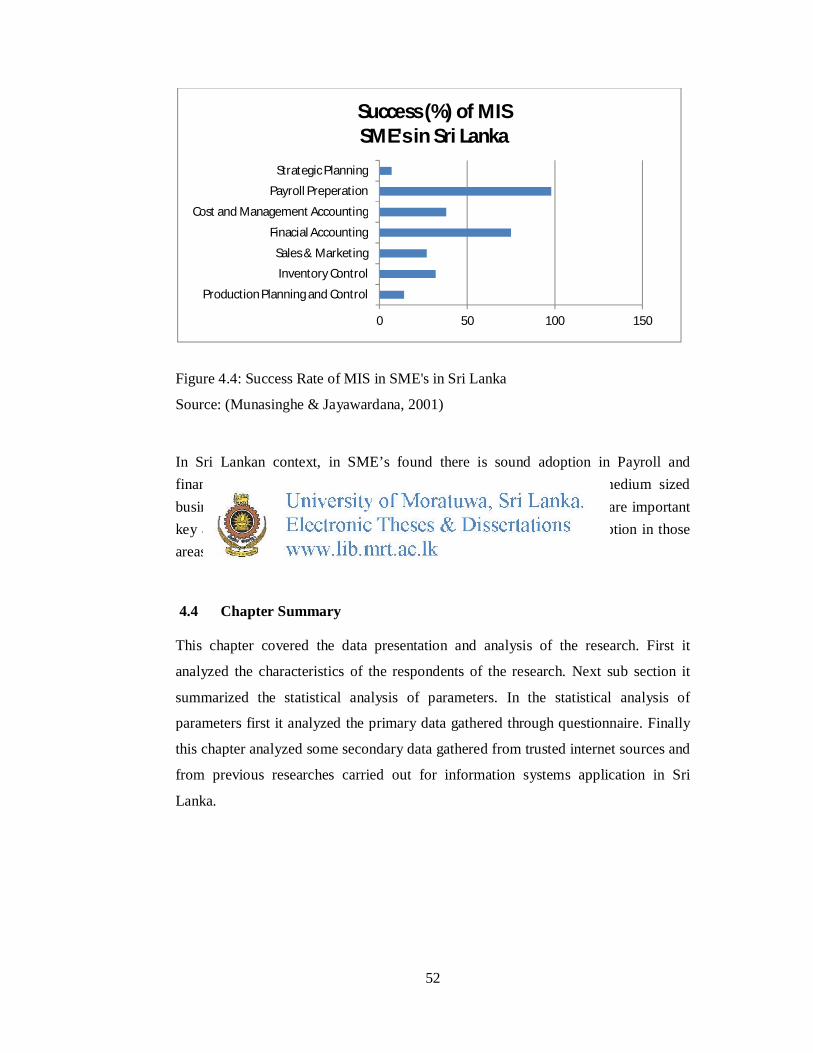
Table 4.18: Over all Success (%) of MIS in SME in Sri Lanka
Functional Area Over all Success (%) of MIS in SME in Sri Lanka
Production Planning and Control 14 Inventory Control 32 Sales & Marketing 27 Financial Accounting 75 Cost and Management Accounting 38 Payroll Preparation 98 Strategic Planning 7
Source: (Munasinghe & Jayawardana, 2001)
$0 $2,000 $4,000 $6,000 $8,000
Infor Lawson
QADEpicor
SAPOracle
Dymanics AXDynamics NAV
Dynamics GPDynamics SL
Epicor EnterpriseIFS Applications
Sage Accpac 500 ERP
Average software cost per user
Average software cost per user
52
Figure 4.4: Success Rate of MIS in SME's in Sri Lanka
Source: (Munasinghe & Jayawardana, 2001)
In Sri Lankan context, in SME’s found there is sound adoption in Payroll and financial accounting key areas as indicated above Figure 4.4 in medium sized business .Though strategic planning, production planning and control are important key areas of any business it can be seen that information systems adoption in those areas are unsatisfactory.
4.4 Chapter Summary
This chapter covered the data presentation and analysis of the research. First it
analyzed the characteristics of the respondents of the research. Next sub section it
summarized the statistical analysis of parameters. In the statistical analysis of
parameters first it analyzed the primary data gathered through questionnaire. Finally
this chapter analyzed some secondary data gathered from trusted internet sources and
from previous researches carried out for information systems application in Sri
Lanka.
0 50 100 150
Production Planning and Control
Inventory Control
Sales & Marketing
Finacial Accounting
Cost and Management Accounting
Payroll Preperation
Strategic Planning
Success (%) of MIS SME's in Sri Lanka