Embed Size (px)
Citation preview

CHAPTER 3.5 RISK ASSESSMENT: DROUGHT
STATE OF IDAHO HAZARD MITIGATION PLAN 2018 3.5-1
3.5 Risk Assessment: Drought
Description Drought is an expected phase in the climactic cycle of almost any geographical region, including the State of Idaho. Objective, quantitative definitions for drought exist, but most authorities agree that, because of the many factors contributing to it and because its onset and relief are slow and indistinct, none are entirely satisfactory. According to the National Drought Mitigation Center (NDMC), drought “originates from a deficiency of precipitation over an extended period of time, usually a season or more. This deficiency results in a water shortage for some activity, group, or environmental sector”. What is clear is that a condition perceived as “drought” in a given location is the result of a significant decrease in water supply relative to what is “normal” in that area. In order to compare drought across regions with very different climates most drought indices rank current conditions based on their departure from what is statistically normal in that area. The United States Drought Monitor ranks drought conditions based on their departure from normal. A percentile represents the frequency at which an event is likely to occur. For example if current conditions are in the 5th percentile, it means such conditions are only likely to be exceeded in dryness in 5% of years. For example the United States Drought Monitor ranks drought based on the following definitions:
• Abnormally Dry (20-30th percentile) • Moderate Drought (10th to 20th percentile) • Severe Drought (5th to 10th percentile) • Extreme Drought (2nd to 5th percentile) • Exceptional Drought (1st to 2nd percentile)
Numerous drought indices have been developed by the scientific community using various methods. It is not uncommon for two different indices to vary widely in their depiction of current conditions, this is due to the fact that drought is experienced and defined in numerous ways by the various indices. For example if some farmers depend on the diversion of streamflow to irrigate crops and other farmers depend only on rainfall to supply water to their crops, their experience of drought could be completely different. The irrigated farms in Idaho depend on longer term water supply conditions especially snowpack accumulation during the winter to maintain streamflows through the summer. The rain fed farms are influenced much more by shortfalls in summer rainfall. There are four generally accepted, basic approaches to measuring drought: meteorological, hydrological, agricultural, and socioeconomic. The first three approaches deal with ways to measure drought as a physical phenomenon. The last deals with drought in terms of supply and demand, tracking the effects of water shortfall as it ripples through socioeconomic systems. (NDMC, 2006):
Meteorological drought is usually an expression of precipitation’s decline from statistically normal conditions over some period of time. As such, these definitions are not usually region-specific, and are

CHAPTER 3.5 RISK ASSESSMENT: DROUGHT
STATE OF IDAHO HAZARD MITIGATION PLAN 2018 3.5-2
based on a thorough understanding of regional climatology. A definition of drought developed in one part of the world may not apply to another, given the wide range of meteorological definitions. Meteorological measurements are the first indicators of drought. Common meteorological drought indices include the Standardized Precipitation Index (SPI, reference), the Standardized Evapotranspiration and Precipitation Index (SPEI, reference), and Evaporative Demand Drought Index (EDDI, reference). All three of these drought indices are assessed at different timescales. The 12-month time scale is roughly equivalent to water supply conditions that impact irrigated agriculture. Figures 3.5.A1 through 3.5.A3 compare the three indices for August of 2015 at a 12-month timescale with Figure 3.5.A3 showing SPEI at the shorter 6-month time scale. Note that EDDI and SPEI which are developed around evaporative demand (or higher than normal temperatures conditions) indicate much more severe drought than SPI which only monitors precipitation.
Figure 3.5.A The 2015 Extreme drought in the Pacific Northwest as defined by EDDI.
Source: NOAA

CHAPTER 3.5 RISK ASSESSMENT: DROUGHT
STATE OF IDAHO HAZARD MITIGATION PLAN 2018 3.5-3
Figure 3.5.A1. The 2015 Extreme drought in the Pacific Northwest as indicated by SPI.
Source: University of Idaho, 2016 Notice that the drought does not appear to be so severe, because the impacts of the drought were exacerbated by higher than normal temperatures not captured by this index. Figure 3.5.A2. The 2015 Extreme drought in the Pacific Northwest as indicated by SPI.
Source: University of Idaho, 2016 Notice that the drought appears much more severe than with the SPI index because evaporative demand is included in the index.

CHAPTER 3.5 RISK ASSESSMENT: DROUGHT
STATE OF IDAHO HAZARD MITIGATION PLAN 2018 3.5-4
Figure 3.5.A3. For the growing season up to August (April – August) the SPEI index amplifies the drought even further.
Source: University of Idaho, 2016 Agricultural drought occurs when there isn’t enough soil moisture to meet the needs of a particular crop at a particular time. Agricultural drought happens after meteorological drought but before hydrological drought. Agriculture is usually one of the first and largest economic sectors to be affected by drought.
The Palmer Drought Severity Index (PDSI, Palmer, and 196 X) and other soil moisture drought indices are good representatives of drought in non-irrigated agricultural regions. Once soil moisture falls below a certain level plant growth and yield will suffer. If soil moisture is depleted beyond the wilting point, the plant will die. Since the PDSI index does not account for irrigation the index has limited function in the irrigated agricultural regions. Note that the 2015 August PDSI map indicates widespread drought across the western United States (see, Figure 3.5.B). Storage capacity in reservoirs and streamflow are not a part of this index, therefore the severity of the drought in agricultural regions along the Snake River Plain were less severe than indicated.

CHAPTER 3.5 RISK ASSESSMENT: DROUGHT
STATE OF IDAHO HAZARD MITIGATION PLAN 2018 3.5-5
Figure 3.5.B. The Palmer Drought Severity Index (PDSI) for August 2015 showing drought across the United States west of the Great Plains.
Source: University of Idaho, 2016 Hydrological drought refers to deficiencies in surface and subsurface water supplies. It is measured as streamflow and as lake, reservoir, and groundwater levels. There is a time lag between lack of rain and less water in streams, rivers, lakes, and reservoirs, so hydrological measurements are not the earliest indicators of drought. When precipitation is reduced or deficient over an extended period of time, this shortage will be reflected in declining surface and subsurface water levels. It should be noted that water supply is not only controlled by precipitation (amount, frequency, and intensity), but also by other factors including evaporation (which is increased by higher than normal heat and winds), transpiration, and human use. The main indicators of hydrologic drought used in Idaho are based on the USGS stream gage network (departure from normal), the NRCS snow water equivalent maps (SWE) and the NRCS Surface Water Supply Index (SWSI). Figure 3.5.C illustrates hydrologic drought in 2015 based on the USGS stream gage network. Note that drought is masked along the heavily regulated Snake River as much of the streamflow is being supported by storage water released from reservoirs. Figure 3.5.D shows the hydrologic water supply drought as represented by the April 1st SWE map published by IDWR using NRCS SWE data. While the whole state appears to be in note that the Snake River and Henry’s Fork, which supply most of the water to agriculture in southern Idaho have the best water supply. These two basins which represent a small section of the map are main source of water for the Snake River above Milner. Thus in 2015 little agricultural drought was experienced for most of southern Idaho. The August

CHAPTER 3.5 RISK ASSESSMENT: DROUGHT
STATE OF IDAHO HAZARD MITIGATION PLAN 2018 3.5-6
SWSI Index for May 1 of 2015 is shown in Table 3.5.E by basin. Note that the water supply of the Snake and Bear rivers are nearly normal at -0.3. Figure 3.5.C. The USGS real-time streamflow monitoring network showing flow as a percentile of normal.
Source: USGS Note the red dots in northern Idaho and the mixed colors in southern Idaho. The mixed colors represent the impacts mixed results of regulated and unregulated streamflow in the basin.

CHAPTER 3.5 RISK ASSESSMENT: DROUGHT
STATE OF IDAHO HAZARD MITIGATION PLAN 2018 3.5-7
Figure 3.5.D. The NRCS snow water equivalent as a percent of normal for Idaho basins as published by IDWR in 2015.
Source: IDWR, 2015
CHAPTER 3.5 RISK ASSESSMENT: DROUGHT
STATE OF IDAHO HAZARD MITIGATION PLAN 2018 3.5-8
Table 3.5.E. The SWSI on May 1st 2015 for all basins in Idaho as calculated by the NRCS. Basin SWSI Spokane -3.9 Clearwater -3.7 Salmon -2.4 Weiser -2.4 Payette -3.3 Boise -1.2 Big Wood -2.4 Little Wood -3.0 Big Lost -0.6 Little Lost/Birch -2.1 Henrys Fork/Teton n/a Snake -0.3 Owyhee -3.5 Bruneau -1.5 Salmon Falls -2.1 Oakley -1.2 Bear -0.3
Source: NRCS, 2015 Socioeconomic drought occurs when physical water shortage starts to affect people, individually and collectively. Or, in more abstract terms, most socioeconomic definitions of drought associate it with the supply and demand of an economic good. It should be noted that water supply is not only controlled by precipitation (amount, frequency, and intensity), but also by other factors including evaporation (which is increased by higher than normal heat and winds), transpiration, and human use. Drought in Idaho is generally associated with a sustained period of low winter snowfall. This results from a temporary, yet significant, change in the large-scale weather patterns in the western U.S. The limited snowpacks result in reduced streamflows and groundwater recharge. Idaho’s system of reservoirs and natural storage can buffer the effects of minor events over a few years, but a series of dry winters (or an especially pronounced single low snowfall event) will result in a shortage of available water. Extended periods of above-average temperatures during the spring and summer can increase the impacts of low snowpacks.
Source: http://khq.images.worldnow.com/images/7805396_G.jpg

CHAPTER 3.5 RISK ASSESSMENT: DROUGHT
STATE OF IDAHO HAZARD MITIGATION PLAN 2018 3.5-9
Location, Extent, and Magnitude Drought can have the broadest effect of all of Idaho’s hazards, sometimes affecting all regions of the State simultaneously. Although deaths and injuries are rarely direct results, drought can have significant impacts on the economic, environmental, and social well-being of the State (also see “Environmental Impacts” later in this section). However the impacts of drought vary widely by region. In northern and central Idaho where ecosystem health, recreation, and forest management dominate water resource management the impacts of drought include poor ski conditions, dry domestic wells, loss of recreational access (Hells Canyon boat ramps and Priest Lake) to lakes and reservoirs, fish kills due to warm stream temperatures, forest and aquatic ecosystem degradation and increased wildfire risk. The largest drought impacts are to agricultural producers, agricultural industries, and aquaculture. While the water supply infrastructure in southern Idaho is among the most robust in the nation with significant crop failure being a low risk, water supply shortages have resulted in significant legal actions and uncertainty that have had significant societal and economic impacts on both the agricultural industries and the businesses and communities built around agriculture. Throughout Idaho drought can have significant impacts on tourism, rangeland management, dryland agriculture, and hydropower production. According to the National Hydropower Association (http://www.hydro.org/why-hydro/available/hydro-in-the-states/west/) in 2013, 58% of Idaho’s power was generated by hydropower plants which represents 74% of the state’s renewable energy production. Significant variability in Idaho’s climate predisposes it to periodic drought. Some areas of the State have a greater potential for drought than others due to limited water resource infrastructure or ecosystem vulnerability. From a water supply vulnerability perspective the NRCS ranks basins in Idaho by linking the SWSI index to a minimum adequate agricultural supply threshold. Table 3.5.E lists the Idaho basins from greatest to least drought vulnerability the lower the SWSI value the less vulnerable the basin is to water shortages. SWSI is probably the most widely used drought index by surface-water irrigators on the Snake River Plain. Based on water rights and farm locations, most irrigators know which SWSI applies to their water supply. Most irrigators who divert from the mainstream of the Snake River above Milner Dam rely on the Snake (or Heise) SWSI.
Extent Several indices are used to measure how precipitation rates are different from historical norms. Government officials likely consult multiple indices before making decisions regarding declarations and the availability of funding. The Palmer Drought Severity Index is widely used by the U.S. Department of Agriculture for assessing large areas where crop growth depends upon precipitation. But in the many irrigated areas of Idaho, the water supply is dependent on mountain snowpack. Water supply can therefore depend on conditions that are quite distant from the crop area, and may be supplemented by reservoir storage. Thus the Palmer Index values do not accurately reflect water supply for irrigated croplands in Idaho (Idaho Drought Plan, 2001).

CHAPTER 3.5 RISK ASSESSMENT: DROUGHT
STATE OF IDAHO HAZARD MITIGATION PLAN 2018 3.5-10
The NDMC is now also using a new index: the Standardized Precipitation Index, which can identify emerging droughts farther in advance than the Palmer Index. (NDMC, 2006). The dissemination of information on the current status and predictions of drought is addressed below, under “Future Occurrence.”
A comparable index for irrigated cropland conditions in the West has been developed by the Natural Resources Conservation Service (NRCS). This index, designated the “Surface Water Supply Index” (SWSI), which is based on the probability distribution of the sum of reservoir carryover storage plus forecasted spring and summer streamflow. In basins without reservoirs, the natural streamflow provides the irrigation supply and the index is computer generated using streamflow as the sole input (Idaho Drought Plan, 2001a). NRCS has worked with individual irrigation districts and water masters to determine the SWSI threshold where shortages of the irrigation agriculture water supply start to occur.
SWSI is based on frequency analysis and is adapted to a particular river basin. Approximately 25 years of record are required for datasets in the SWSI. In Idaho, SWSI values range from -4.1 (extremely dry) to +4.1 (extremely wet), with zero representing average water supply conditions. When the SWSI value is less than -1.2, water supply shortages may be expected. Table 3.5.F provides a statewide snapshot of the availability of SWSI products. This is the October 1, 2017 SWSI all-inclusive summary of the water available for the previous water year including the Oct-Sep streamflow and September 30 reservoir storage as an indicator of the end of season conditions (Idaho NRCS, 2017). As you can see, the SWSI Values are above +3.0 and are above normal going into the winter season 2017-2018.
SWSI is primarily an irrigated agricultural drought index that was developed to track mountain snowpack for agricultural users in downstream locations. For example the Heise SWSI is used by most irrigators who divert from the Snake River within the Eastern Snake River Plain. SWSI was not designed to represent drought conditions in mountain environments, but might be applied to mountainous regions for other risk.
Table 3.5.F. Idaho Surface Water Supply Index (SWSI), October 1, 2017
Basin or Region SWSI Value Most Recent Year with Similar SWSI Value
Spokane 3.3 1982 Clearwater 3.1 1984
Salmon 3.3 1996 Weiser Missing winter streamflow data Payette 3.8 1996
Boise 3.7 1983 Big Wood 3.9 1983
Little Wood 3.9 1983 Big Lost 3.7 1983
Little Lost 3.7 1983 Teton 3.3 1983
Henrys Fork Missing diversion data Snake (Heise) 3.7 2011
Oakley 3.7 2006

CHAPTER 3.5 RISK ASSESSMENT: DROUGHT
STATE OF IDAHO HAZARD MITIGATION PLAN 2018 3.5-11
Basin or Region SWSI Value Most Recent Year with Similar SWSI Value
Salmon Falls 3.7 2011 Bruneau 3.5 2011 Owyhee 2.2 1997
Bear River 3.3 2011
Severity The severity of a drought depends on the degree of moisture deficiency, the duration, and the size and location of the affected area. The longer the duration of the drought and the larger the area impacted, the more severe the potential impacts. Droughts are not usually associated with direct impacts on people or property, but they can have significant impacts on agriculture, which can impact people indirectly. When measuring the severity of droughts, analysts typically look at economic impacts on a planning area. For example, the small City of Arco near the Big Lost River, had to drill 650 feet down to find water during a 1995 drought. Their older wells at 120 feet and 250 were dry (High Country News, 1995).
The Idaho Drought Plan 2001, lists potential economic, environmental, and social impacts from drought. A drought can result in farmers not being able to plant crops or the loss from crop production, loss from dairy and livestock production. This results in loss of work for farm workers and those in related food processing jobs. Other water-dependent industries are commonly forced to shut down all or a portion of their facilities, resulting in further layoffs. A drought can spell disaster for recreational companies that use water (e.g., swimming pools, water parks, and river rafting companies) and for landscape and nursery businesses because people will not invest in new plants if water is not available to sustain them. Also, people could pay more for water if utilities increase their rates.
The National Drought Mitigation Center developed the Drought Impact Reporter in response to the need for a national drought impact database for the United States. The Drought Impact Reporter maps the effects of drought, based on reports from media, observers and other sources. Impacts are an observable loss or change at a specific place and time due to drought. The Drought Impact Reporter is not a comprehensive set of data, but is useful in tracking drought, if submissions are adequate, to aid in better understanding and response to drought impacts. The main emphasis is for drought planning.
The Drought Impact Reporter contains information on 66 drought impacts from droughts that affected Idaho between January 1, 2012 and October 1, 2017. Forty-five percent of them are from media reports. Most of the impacts, 36, were classified as “agriculture.” Other impacts include, “plants and wildlife” (13), “society and public health” (8), “water supply and quality” (26), “business and industry” (3), “fire” (14), “relief, response, and restrictions” (36), and “tourism and recreation” (5). These categories of agriculture, energy, plants and wildlife, society and public health, water supply and quality, business and industry, fire, relief, response, and restrictions, and tourism and recreation are described on the National Drought Mitigation Center, Drought Impact Reporter website http://droughtreporter.unl.edu/.
CHAPTER 3.5 RISK ASSESSMENT: DROUGHT
STATE OF IDAHO HAZARD MITIGATION PLAN 2018 3.5-12
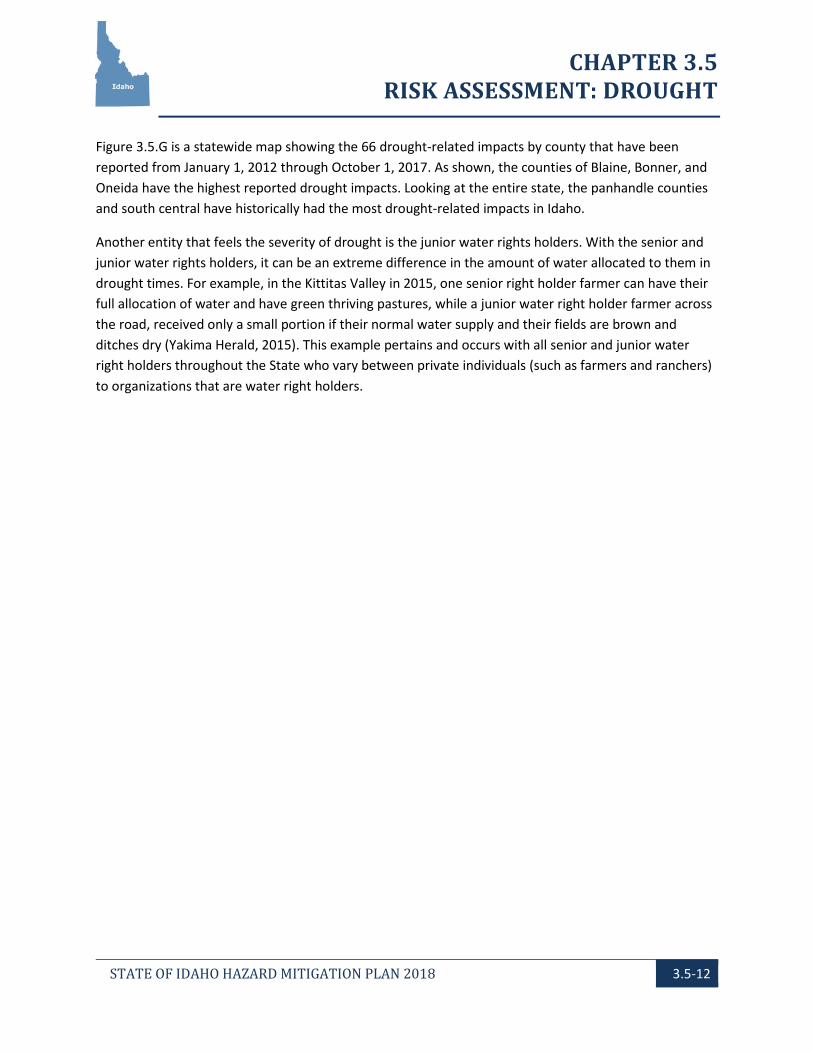
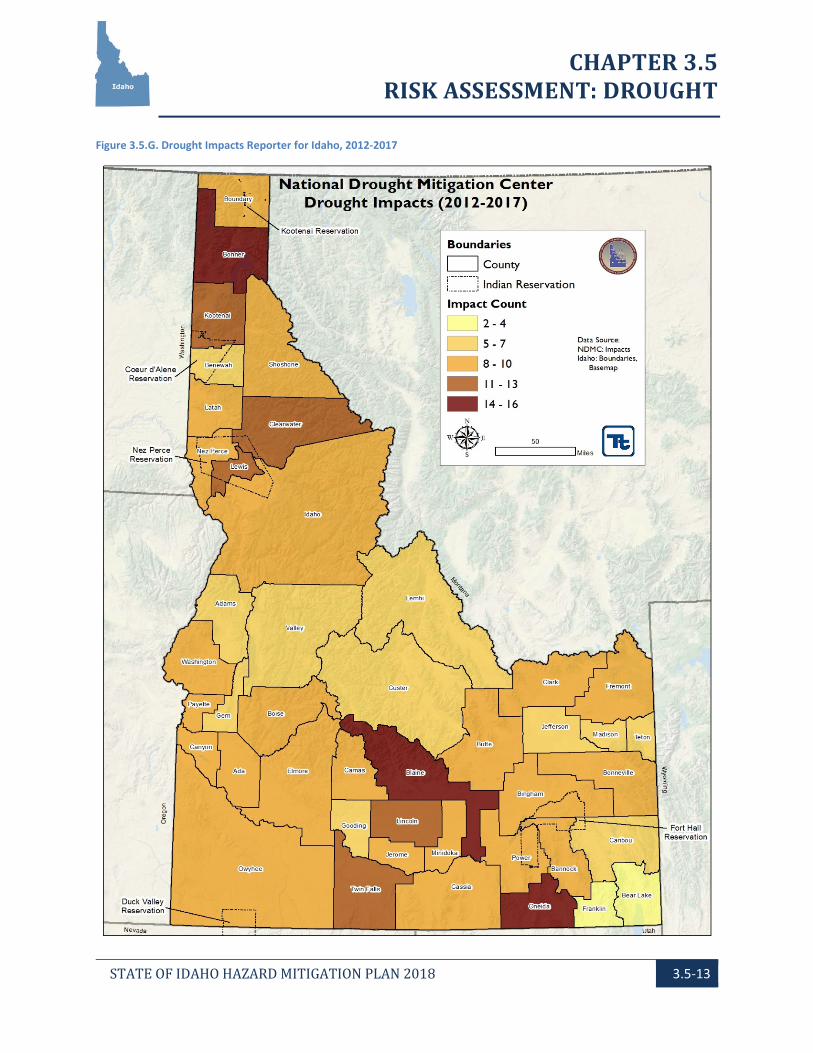
Figure 3.5.G is a statewide map showing the 66 drought-related impacts by county that have been reported from January 1, 2012 through October 1, 2017. As shown, the counties of Blaine, Bonner, and Oneida have the highest reported drought impacts. Looking at the entire state, the panhandle counties and south central have historically had the most drought-related impacts in Idaho.
Another entity that feels the severity of drought is the junior water rights holders. With the senior and junior water rights holders, it can be an extreme difference in the amount of water allocated to them in drought times. For example, in the Kittitas Valley in 2015, one senior right holder farmer can have their full allocation of water and have green thriving pastures, while a junior water right holder farmer across the road, received only a small portion if their normal water supply and their fields are brown and ditches dry (Yakima Herald, 2015). This example pertains and occurs with all senior and junior water right holders throughout the State who vary between private individuals (such as farmers and ranchers) to organizations that are water right holders.
CHAPTER 3.5 RISK ASSESSMENT: DROUGHT
STATE OF IDAHO HAZARD MITIGATION PLAN 2018 3.5-13
Figure 3.5.G. Drought Impacts Reporter for Idaho, 2012-2017

CHAPTER 3.5 RISK ASSESSMENT: DROUGHT
STATE OF IDAHO HAZARD MITIGATION PLAN 2018 3.5-14
The U.S. Drought Monitor, established in 1999, is a weekly map of drought conditions produced jointly by the National Oceanic and Atmospheric Administration, the U.S. Department of Agriculture, and the National Drought Mitigation Center at the University of Nebraska-Lincoln. The USDM is”used by policy makers and media in discussions of drought and allocations of drought relief” (Drought Monitor, 2018)
Figure 3.5.H. Drought Severity Classification as Provided by the US Drought Monitor
Source: US Drought Monitor, 2018
Local NRCS, IDWR, and NWS representatives comprise the Idaho Drought Committee and make recommendations to the US Drought Monitor (USDM) about drought conditions based on snowpack, runoff, and streamflows. The group provides bi-monthly recommendations during the spring and summer months when drought conditions are possible.
Warning Time Droughts are climatic patterns that occur over long periods of time. Only generalized warning can take place due to the numerous variables that scientists have not pieced together well enough to make accurate and precise predictions.
Figure 3.5.I. Example Drought Recommendation from Idaho Drought Committee
Source: Idaho Drought Committee 2018

CHAPTER 3.5 RISK ASSESSMENT: DROUGHT
STATE OF IDAHO HAZARD MITIGATION PLAN 2018 3.5-15
Relationships to Other Hazards Secondary Impacts Droughts can have a large influence on the risks posed by other hazards faced by the State. Locations impacted by drought can have an increased susceptibility to flash flooding, as soils impacted by drought cannot absorb water as efficiently.
The secondary hazard most commonly associated with drought is wildfire. A prolonged lack of precipitation dries out vegetation, reducing fuel greenness, snow pack and moisture, thus increasing availability to burn. Extensive drought increases the potential for large wildfires. Drought can also reduce tree health and survival. In dense forest areas, these impacts allow bark beetles to thrive. While the bark beetle is a natural disturbance agent and outbreaks are not uncommon, in recent years, unprecedented outbreaks have been occurring across western North America. (Desert Research Institute, 2017).
Wildfires can damage or destroy power lines causing outages and reduce water pressure. Reduced freshwater availability will complicate firefighting efforts in urban and suburban areas where chemical retardants and backfires, standard wildfire tactics, are not suitable. The risk of lightning initiating a wildfire event is also increased during dry times.
In addition, drought has impacted Idaho fisheries and angles all over the state. For example, in 2001, the watersheds received less than 60% of normal snowpack and a number of fishing waters were negatively impacted. The Idaho Department of Fish and Game had to modify fishery management by not stocking streams that would likely go dry; allow anglers to harvest more fish before they perished from lack of water on certain streams and reservoirs; and inaccessibility to boat ramps as water levels recede in some waters (IDFG 2001).
In 2014, with almost 5 years of drought, a senior water rights trout farm in Hagerman Valley (Gooding County), demanded their water through litigation. It affected more than 2,300 water right holders; 14 cities, five school districts, irrigators, dairies, and industries that were at risk at not receiving ground water access (MagicValley.com, 2014). This type of litigation has been occurring in Idaho for a very long time and will continue in the future as water is a precious commodity.
Idaho’s reliance on hydropower for irrigation and air conditioning will be impacted by drought conditions. Limited water availability will constrain certain hydropower plant operations and will reduce the resiliency of the entire power grid. Low snow pack years will complicate and exacerbate complex water rights agreements thereby affecting river flows and hydropower reservoirs replenishment. Extended period of drought could also lead to reductions in food and water availability, a situation that would increase the chance of civil disturbances, from a human-caused hazard viewpoint.
Past Occurrence Since 1895 when temperature and precipitation records began to be kept regularly across the State of Idaho, the PDSI index (see Figure 3.5.B) as calculated for the entire state indicates that the first extreme

CHAPTER 3.5 RISK ASSESSMENT: DROUGHT
STATE OF IDAHO HAZARD MITIGATION PLAN 2018 3.5-16
drought of record occurred in 1905 and was followed by two more extreme droughts in 1919 and 1924 (NCDC, 2018). The 1930s witnessed the most severe drought periods on record in which extreme drought conditions occurred in 7 out of 12 years from 1929-1940(1929, 1931, 1934, 1935, 1937, 1939, and 1940) with Exceptional Drought conditions occurring in three of those years: 1934, 1935, and 1937. After the 1930s another extreme drought would not occur again at the statewide scale until the winter of 1967-1977. The drought of 1977 is the last exceptional drought indicated by the PDSI to effect the entire state. It was the drought of 1977 that prompted computerized accounting on the Snake River in Idaho (Sutter et al. 1982). The drought of 1977 was followed by the greatest pluvial in the climate record which started in 1981 and ended in 1985. The next significant drought period was initiated in 1987 and continued until 1994, with extreme drought being experienced in 1988, 1992, and 1994. It was during this extended drought period that the first Idaho State Drought Plan was adopted in 1990 (IDWR, 2001). The 1988-2004 drought was followed by the State’s next greatest pluvial that started in winter of 1994 and continued until 1999. Idaho then swung back from a pluvial into a severe drought period that lasted from 1999 until 2005. The PDSI record that extended pluvial and drought periods as experienced since 1985 have had not occurred previously. The only year of extreme drought in this period was 2001. However there had not been a continuous period of drought of equal magnitude since the 1930’s. Since 2005, Idaho has experience an extended period of slightly drier than normal conditions until 2017. During this period only two major droughts occurred statewide: an extreme drought in 2007 and a severe drought in 2014. However it should be noted that 2015 was an extreme drought year in northern Idaho.

CHAPTER 3.5 RISK ASSESSMENT: DROUGHT
STATE OF IDAHO HAZARD MITIGATION PLAN 2018 3.5-17
Figure 3.5.J. Drought as represented for the State of Idaho from 1895 to 2016.
The most prolonged drought in Idaho was during the 1930s. For most of the State, this drought lasted for 11 years (1929-41), despite greater than average stream flows in 1932 and 1938. In northern Idaho, the drought was interrupted by greater than average stream flows from 1932 until 1937, but then resumed until 1946. Southern and central Idaho experienced a mild drought from 1959 to 1961. During the early 1960s, several areas in the State also experienced water shortages. Of all the statewide drought emergency declarations, only one was also a Federal disaster: 1977, the worst single year on record.
-8
-6
-4
-2
0
2
4
6
8
1895
0118
9801
1901
0119
0401
1907
0119
1001
1913
0119
1601
1919
0119
2201
1925
0119
2801
1931
0119
3401
1937
0119
4001
1943
0119
4601
1949
0119
5201
1955
0119
5801
1961
0119
6401
1967
0119
7001
1973
0119
7601
1979
0119
8201
1985
0119
8801
1991
0119
9401
1997
0120
0001
2003
0120
0601
2009
0120
1201
2015
01
Palm
er D
roug
ht S
ever
ity In
dex
Palmer Drought Severity Index for Idaho
Normal Abnormally Dry Moderate Drought Severe Drought
Extreme Drought Exceptional Drought Normal Abnormally Wet
Moderate Pluvial Severe Pluvial Extreme Pluvial Exceptional Pluvial
PDSI

CHAPTER 3.5 RISK ASSESSMENT: DROUGHT
STATE OF IDAHO HAZARD MITIGATION PLAN 2018 3.5-18
Figure 3.5.K U.S. Drought Monitor Historic Drought Intensity in Idaho
Source: U.S. Drought Monitor, 2017 Idaho has many aquifers that host the state’s ground-water reservoirs. Figure 3.5.L shows the top 11 aquifers in the state. The water level in aquifers vary depending on the amount of precipitation recharge seeps into the ground. In drought times with little precipitation for several weeks, months, or years, the availability of ground-water and aquifer water declines (USGS, 2018). This groundwater in Idaho provides over 92% of the State’s drinking water supply from public and municipal wells and over six trillion gallons of ground-water are applied annually to almost four million irrigated acres of land (Idaho Geological Survey, 2018). Thus aquifers and the State’s ground-water reservoirs are vulnerable to drought conditions.

CHAPTER 3.5 RISK ASSESSMENT: DROUGHT
STATE OF IDAHO HAZARD MITIGATION PLAN 2018 3.5-19
Figure 3.5.L. Idaho Aquifers Map
Source: Idaho State University, 2017
Many sources provided historical information regarding previous occurrences and losses associated with drought events throughout the State of Idaho. The 2013 State HMP discussed drought events that occurred in Idaho through 2012. For this 2018 Plan update, drought events were summarized between January 1, 2012 and October 1, 2017. Table 3.5.M includes events discussed in the 2013 Plan and events that occurred between 2012 and 2017. With drought documentation for Idaho being so extensive, not all sources have been identified or researched. Therefore, Table 3.5.M many not include all events that have occurred in the State and the accuracy of monetary figures is based only on the available information identified during research for this HMP update. Please note that Table 4 includes droughts recorded by the IDWR. State drought emergency declarations are made on a county-by-county basis by the IDWR and must be approved by the Governor. IDWR drought declarations apply only to the administrative processing of applications for temporary changes of water rights. As such, county-wide drought declarations by the Governor are more of a drought mitigation tool than a drought identification process. The location and frequency of county-wide drought declarations is less of a representation of drought vulnerability than it is an indication of how usefulness of the “water right emergency transfer” process is as a drought mitigation tool in a given

CHAPTER 3.5 RISK ASSESSMENT: DROUGHT
STATE OF IDAHO HAZARD MITIGATION PLAN 2018 3.5-20
basin. County-wide drought declarations by the Governor are not used as a mechanism to allow applications for financial or disaster support. Water right changes made under the provisions of these State declarations expire at the end of the current year, unless extended or terminated by the IDWR Director. From the start of 2000 through 2017, there were State drought emergency declarations in Idaho counties every year except 2006, 2009, 2011 and 2017. Table 3.5.M. Drought Events in Idaho, 1977 - 2017
Date(s) of Event Event Type Counties Affected Description
1977 Drought
FEMA-EM-3040
Adams, Bear Lake, Blaine, Camas, Caribou, Elmore,
Idaho, Lincoln, Washington
This event was part of a more widespread water shortage faced by the United States. In Idaho, a lack of winter snowfall resulted in the lowest runoff on record at most gages in the state. Ski resorts were
closed for much of the ski season. Irrigation ditches were closed well before the end of the growing season, and crop yields were below
normal. Domestic wells in the Big and Little Wood River basins became dry early in April 1977, and many shallow wells in six
western Idaho counties became dry in June.
2000
Drought State DRs issued in
June – July
Custer, Blaine, Butte, Lemhi, Lincoln
Counties experienced severely restricted water supplies available for the current irrigation season.
2001
Drought State DRs issued in
April – August
Ada, Adams, Bannock, Bear Lake, Bingham, Blaine, Boise,
Bonneville, Butte, Canyon, Caribou, Cassia, Clarke,
Custer, Elmore, Fremont, Gooding, Jefferson, Jerome,
Lemhi, Lincoln, Madison, Oneida, Owyhee, Payette, Power, Teton, Twin Falls, Salmon Track within Twin
Falls, Washington
Counties experienced severely restricted water supplies available for the current irrigation season. In particular, the hydrologic data showing that basin-wide snowpack is 41 percent of average, with
values for individual sub basins ranging from 47 percent of normal for the Big Wood above Hailey to 22 percent of normal for Fish
Creek.
2002
Drought State DRs issued in
April – September
Butte, Blaine, Bonneville, Clark, Fremont, Bingham, Custer, Lincoln, Madison, Power, Bannock County,
Jefferson, Elmore, Gooding, Oneida, Caribou, Bear Lake
Counties experienced severely restricted water supplies available for the current irrigation season as demonstrated by hydrologic data
showing that the mid-April snowpack is 65 percent of average and streamflow for the basin is 60 percent of normal based on
measurements from the Wild Horse gage on the North Fork of the Big Lost River for the October 2001 to March 2002 period.
2003
Drought State DRs issued in
April – August
Bonneville, Teton, Lemhi, Jefferson, Bear Lake, Owyhee,
Cassia, Madison, Blaine, Oneida, Caribou, Bannock,
Bingham, Butte, Clark, Custer, Fremont, Lincoln, Power
The April 1st forecast from the NRCS Water Supply Outlook indicating that the April through July volume for 2003 was forecast
to be 46 percent of normal. Counties experienced severely restricted water supplies available for the current irrigation season.
2004
Drought State DRs issued in
April - September
Minidoka, Bear Lake, Jerome, Cassia, Elmore, Twin Falls, Franklin, Teton, Oneida,
Jefferson, Bingham, Power, Madison, Bonneville,
Bannock, Gooding, Blaine,
Several years of drought have caused declines in ground water levels, spring flows, and base flows of stream. The storage in Magic Reservoir is 25 percent of capacity and inflow is predicted to be 44 percent of average. Water supplies available from the Snake River for the current irrigation season are near the minimums of record and are similar to those experienced during the drought years of
1977 and 1992.

CHAPTER 3.5 RISK ASSESSMENT: DROUGHT
STATE OF IDAHO HAZARD MITIGATION PLAN 2018 3.5-21
Date(s) of Event Event Type Counties Affected Description
Lemhi, Custer, Fremont, Caribou, Lincoln, Clark, Butte
2005
Drought State DRs issued in
March - June
Lincoln, Ada, Jerome, Gooding, Lemhi, Jefferson, Blaine, Caribou, Twin Falls,
Elmore, Clark, Bannock, Power, Fremont, Madison,
Canyon, Bingham, Bonneville, Custer, Butte
Severe and continuing drought conditions occurred. On March 7, 2005, the Rangeland Drought Task Force reported that several springs in the Challis are dried up for the first time in history.
2007
Drought State DRs issued in March - October
Lewis, Clearwater, Adams, Owyhee, City of Pierce,
Oneida, Minidoka, Caribou, Bonneville, Bannock,
Bingham, Jefferson, Lincoln, Madison, Teton, Blaine, Fremont, Lemhi, Clark,
Custer, Butte
Severe and continuing drought conditions occurred in past several years excluding 2006. The below average precipitation has caused
declines in ground water levels, spring flows, and base stream flow. By October, the lack of precipitation during June through August has
contributed to fire conditions and lack of forage for livestock.
2008
Drought State DRs
issued in July - December
Lewis, Nez Perce, Custer, Butte
Below normal precipitation occurred during the growing seasons that critically affected wheat yields and reduced or damaged forage
crops for livestock.
2010
Drought State DRs issued in
April – May
Franklin, Clark, Lincoln, Blaine, Butte, Custer, Teton,
Fremont
Counties experienced significant drought conditions due to below normal precipitation and snowpack levels. Specifically, total
cumulative snowpack levels in the Big Lost, Little Lost and Salmon River drainages as of April were respectively only 62, 60 and 65
percent of normal.
2012
Drought State DRs
issued May - September
Owyhee, Lemhi, Bannock, Teton, Bear Lake, Blaine, Oneida, Clark, Fremont
The drainage basins experienced rapid snowmelt and depleted snowpack conditions. For example, the snow water equivalent from snowpack levels in the Camas, Beaver, and Medicine Lodge basins in
May was only 33 percent of average due to significant early snow melt.
2013
Drought State DRs
issued May - August
Lincoln, Fremont, Butte, Blaine, Custer, Clark, Teton, Jefferson, Bingham, Gem,
Bonneville, Bear Lake, Power, Madison, Lemhi, Caribou, Oneida, Bannock, Lewis
These counties rely upon water supplies from various drainage basins. The drainage basins experienced abnormally dry conditions
due to below normal precipitation and snowpack levels.
2014
Drought State DRs issued in
April
Blaine, Lincoln, Custer, Clark, Butte, Lincoln
Moderate to severe drought conditions due to below normal snowpack and precipitation levels.
2015
Drought State DRs issued in
April
Butte, Custer, Blaine, Lincoln, Fremont, Teton, Clearwater,
Lewis, Jefferson
Moderate to severe drought conditions due to below normal snowpack and precipitation levels.
2016
Drought State DRs
issued August -
September
Custer, Jefferson, Lemhi Stream flow volumes in the area for the period June through September were forecasted to be about 44 to 70 percent of
average.
Sources: Idaho State HMP 2013b; IDNR, 2017; FEMA, 2017

CHAPTER 3.5 RISK ASSESSMENT: DROUGHT
STATE OF IDAHO HAZARD MITIGATION PLAN 2018 3.5-22
FEMA Disaster Declarations For the 2018 plan update, the only FEMA drought declaration occurred in 1977 as FEMA-EM-3040. The event is described above in Table 3.5.M as well as state drought declarations signed by the Governor. Figure 3.5.N shows the state disaster declarations by county from January 1, 2012 through October 1, 2017. The counties of Blaine and Custer both experienced four declarations and the counties of Butte, Clark, Fremont, Jefferson, Lemhi, Lincoln, and Teton experienced three declarations during this timeframe.

CHAPTER 3.5 RISK ASSESSMENT: DROUGHT
STATE OF IDAHO HAZARD MITIGATION PLAN 2018 3.5-23
Figure 3.5.N. State Disaster Declarations in Idaho

CHAPTER 3.5 RISK ASSESSMENT: DROUGHT
STATE OF IDAHO HAZARD MITIGATION PLAN 2018 3.5-24
In addition to FEMA and State disaster declarations, the State of Idaho has been included in agriculture-related drought disasters. According to the U.S. Department of Agriculture (USDA), these types of disasters are quite common; between one-half and two-thirds of the counties in the United States have been designated as disaster areas in each of the past several years. The USDA Secretary of Agriculture is authorized to designate counties as disaster areas to make emergency loans (EM) to producers suffering losses in those counties and in counties that are contiguous to a designated county. In addition to EM eligibility, other emergency assistance programs, such as Farm Service Agency (FSA) disaster assistance programs, have historically used disaster designations as an eligibility requirement trigger. Table 3.5.O and Figure 3.5.P provide the USDA Secretarial disaster declarations in all counties from January 1, 2012 through October 1, 2017. The counties of Owyhee, Cassia, Fremont, Twin Falls and Elmore received the most USDA declarations during this timeframe.
Table 3.5.O. USDA Secretarial Disasters in Idaho, 2012-2017
County 2012 2013 2014 2015 2016 2017 6-Year Total
Ada 0 2 3 4 1 0 10 Adams 0 4 4 6 1 0 15
Bannock 2 1 2 1 0 0 6 Bear Lake 4 3 0 0 0 0 7 Benewah 0 0 0 4 0 0 4 Bingham 2 1 4 3 0 0 10
Blaine 1 3 6 6 0 0 16 Boise 0 2 2 4 0 0 8
Bonner 0 0 0 5 0 3 8 Bonneville 2 2 4 2 0 0 10 Boundary 0 0 0 4 0 3 7
Butte 2 3 4 4 0 0 13 Camas 0 3 3 4 0 0 10 Canyon 1 2 4 4 1 0 12 Caribou 3 2 2 1 0 0 8 Cassia 3 5 6 7 1 0 22 Clark 4 4 3 5 0 0 16
Clearwater 0 1 0 4 0 0 5 Custer 0 2 4 5 0 0 11 Elmore 0 3 6 8 1 0 18 Franklin 3 2 0 0 0 0 5 Fremont 5 6 3 5 0 0 19
Gem 0 3 4 5 1 0 13 Gooding 0 4 4 4 0 0 12
Idaho 1 3 3 6 0 0 13 Jefferson 2 3 5 4 0 0 14 Jerome 1 3 4 4 0 0 12
Kootenai 0 0 0 3 0 1 4 Latah 0 1 0 4 0 0 5 Lemhi 3 4 2 5 0 0 14 Lewis 0 1 0 2 0 0 3
Lincoln 0 3 2 3 0 0 8 Madison 1 2 4 2 0 0 9

CHAPTER 3.5 RISK ASSESSMENT: DROUGHT
STATE OF IDAHO HAZARD MITIGATION PLAN 2018 3.5-25
County 2012 2013 2014 2015 2016 2017 6-Year Total
Minidoka 1 3 3 4 0 0 11 Nez Perce 0 1 1 4 0 0 6
Oneida 3 4 2 2 1 0 12 Owyhee 2 5 7 8 2 0 24 Payette 1 3 4 4 1 0 13 Power 1 2 3 3 0 0 9
Shoshone 0 1 0 3 0 2 6 Teton 1 2 3 1 0 0 7
Twin Falls 2 4 6 6 1 0 19 Valley 1 2 3 5 1 0 12
Washington 1 4 5 6 1 0 17 TOTAL 53 109 125 174 13 9 483
Source: USDA, 2017

CHAPTER 3.5 RISK ASSESSMENT: DROUGHT
STATE OF IDAHO HAZARD MITIGATION PLAN 2018 3.5-26
Figure 3.5.P USDA Secretarial Disaster Declaration in Idaho

CHAPTER 3.5 RISK ASSESSMENT: DROUGHT
STATE OF IDAHO HAZARD MITIGATION PLAN 2018 3.5-27
Future Occurrence Despite its long agricultural history, Idaho is correctly classified as an arid area with periods of drought. Although defined as “abnormally” dry weather, drought is a normal part of Idaho’s climate and can be expected to reoccur periodically. Since the 1920s, and possibly before, the State has dealt with drought conditions for at least one year each decade and usually for more prolonged periods.
Probability Based on the historical Idaho State Declarations 2000-2017 where county declarations occurred in 14 of the 18 years and the Drought Impact Reporter reporting 66 drought impacts between 2012 through 2017, the State of Idaho can expect a drought of varied severity to occur at a minimum every three years.
NOAA does issue a weekly drought assessment called the U.S. Drought Monitor and a monthly assessment called the U.S. Seasonal Drought Outlook. Examples of these taken during the 2010 plan update, the 2013 plan update, and the current 2018 plan update may help to provide clues as possible trends for future drought conditions. Care should be taken to understand that drought conditions do naturally vary between different seasons, but the data does seem to point towards a possible pattern of increased drought occurrences.
Environmental Impacts The impacts to vegetation and wildlife can include death from dehydration and the spread of invasive species or disease because of stressed conditions. Invasive species pose problems for the ecosystems in which they are introduced. Like many hazards that affect Idaho's environment, invasive species have both direct and indirect impacts. If introduced to Idaho, quagga mussels, for example, would collapse the microscopic food supply that is vital to the existing fisheries. Further, the mussels attach to water intake pipes and screens used for drinking water and industrial plants. Not only would these pests cause environmental problems, but they would also cause secondary economic impacts to communities.
Drought could jeopardize the existence of rare species and/or vegetative communities. Both the state salmon population and sage grouse population/habitat are greatly threatened by drought. Idaho Power Company and others involved in Salmon recovery are seeing reduced returns that they believe correlate with the extreme drought that effected northern Idaho, Oregon, and Washington in 2015. The native species themselves are adapted to drought, but invasive species, increased fire potential, and other hazards exacerbated by drought could definitely have severe impacts on the health and recovery of endangered species. Invasive species can sometimes take advantage of drought conditions to displace native species.
Environmental impacts are also likely at the interface of the human and natural world. The loss of crops or livestock due to drought can have far-reaching economic effects (detailed more under “Vulnerability”). Wind and water erosion can alter the visual landscape, and dust can damage property. Water-based recreational resources are affected by drought conditions. Indirect impacts from drought

CHAPTER 3.5 RISK ASSESSMENT: DROUGHT
STATE OF IDAHO HAZARD MITIGATION PLAN 2018 3.5-28
arise from wildfire, which may have additional effects on the landscape and sensitive resources such as historic or archeological sites; wildfire is discussed in another section of this Plan.
Climate Change Impacts Providing projections of future climate change for a specific region is challenging. Shorter term projections are more closely tied to existing trends making longer term projections even more challenging. The further out a prediction reaches the more subject to changing dynamics it becomes. Climate change is already impacting water resources, and resource managers have observed the following:
Historical hydrologic patterns can no longer be solely relied upon to forecast the water future; Precipitation and runoff patterns are changing, increasing the uncertainty for water supply and quality,
flood management, and ecosystem functions; and Extreme climatic events will become more frequent, necessitating improvement in flood protection,
drought preparedness, and emergency response (CA DWR, 2008).
The climate of Idaho is changed. Over the past 100 years, most of the State has warmed one to two degrees (°F). In the coming years, it is predicted that streams will be warmer, populations of several fish species will decline, wildfires will become more common, deserts may expand, and water may be less available for irrigation (USEPA, 2016). By 2050, Idaho is projected to see a 110 percent increase in drought threat. Production of potatoes and trout will be impacted by drought, and Idaho is the biggest producer of each (States at Risk, 2015). In addition to a warming climate, Idaho has been impacted by El Niño and La Niña. El Niño is a weather pattern that is characterized by unusually warm ocean temperatures along the equator in the Pacific Ocean and has important consequences for weather and climate over the United States. El Niño in general acts to tilt the odds toward wetter and cooler than average conditions across much of the south, and towards drier and warmer conditions in many of the northern regions (FEMA 2016). El Niño typically brings below normal temperatures and less precipitation to Idaho. This can impact the rain and snowfall, impacting the State’s water supply (Boise State Public Radio 2015). Drier weather can also lead to an increase in the number of wildfires (McKenzie 2008).
A research project at the University of Idaho sought to identify and develop indicators of climate change in the State of Idaho. Indicators provide useful information about what is occurring in complex systems. The following information is extracted and summarized from the website providing information on their findings that affect drought:
Temperature and Growing Season—through the analysis of climate data throughout Idaho, scientists have found that the growing season in Idaho has increased by an average of 13 days since early in the 20th century. On average, the last spring frost occurs eight days earlier and the first fall frost is five days later.

CHAPTER 3.5 RISK ASSESSMENT: DROUGHT
STATE OF IDAHO HAZARD MITIGATION PLAN 2018 3.5-29
Snowpack—Scientists in Idaho have been measuring snowpack levels in the state since 1937. These annual measurements provide clear evidence that snowpack has been declining in the state over the past 50 years.
Streamflow—Measurements of stream flow across the state indicate that spring runoff is occurring earlier and that the total annual volume of flow has decreased. These observations are based on records from 1950 to 2005.
Stream Temperature—Average stream temperatures in the state may be increasing. Annual average temperatures in the North Clearwater River have increased by just over 1ºF over a 36-year period.
Salmon Migration—Sockeye salmon migration has been occurring earlier in the spring. Thirty years’ worth of data suggests that salmon are returning to freshwater streams about one day earlier per decade.
Development Trend Impacts An understanding of population and development trends can assist in planning for future development and ensuring that appropriate mitigation, planning, and preparedness measures are in place. The State considered the following factors to examine previous and potential conditions that may affect hazard vulnerability: potential or projected development; projected changes in population; and other identified conditions as relevant and appropriate. The U.S. EPA’s Integrated Climate and Land-Use Scenarios (ICLUS) project generated projected population and land use projections for the United States through 2100. The project examined multiple scenarios taking into account various population growth and economic development parameters that have been used as the baseline for the Intergovernmental Panel on Climate Change’s (IPCC) Special Report on emissions Scenarios (SRES). Population change took into account assumptions regarding fertility, mortality, and immigration, which was then used to drive the land use projections. Map 2.F. in Chapter 2 (State Profile) displays the projected population growth by 2026.
Drought affects the entire State, but particularly southeastern Idaho and the upper portions of the Snake River Plain. Figure 3.5.Q illustrates the extent of the Snake River Plain regional aquifer in Idaho. The Snake River Plain regional aquifer intersects many of the counties that are projected to experience population growth. These Counties include: Ada County, Bannock County, Blaine County, Bonneville County, Canyon County, Clark County, Elmore County, Lincoln County, and Madison County. Larger populations will increase stress on water supplies, which will be exacerbated during a drought. Another impact to consider is how drought could negatively affect the State's agricultural economy. Drought can also lead to reduced quality of living conditions and poverty. Mitigating the effects of drought is a significant consideration in planning for future water use.

CHAPTER 3.5 RISK ASSESSMENT: DROUGHT
STATE OF IDAHO HAZARD MITIGATION PLAN 2018 3.5-30
Figure 3.5.Q. The Snake River Plain Regional Aquifer System
Source: USGS, 1994
Drought conditions and development are interrelated – as water is drawn down from increased rates of use, drought can occur more readily than from lack of precipitation alone. A substantial impact from drought in Idaho is stress on the utilities that rely on hydroelectric power, which could result in increases in power costs to citizens. Planning for power sources is an important part of development. According to Idaho Power, they control 17 hydroelectric facilities along the Snake River and its tributaries; the Hells Canyon Complex consists of the Brownlee, Oxbow, and Hells Canyon dams and their facilities, and annually generates 30% of the total energy generated (Idaho Power). Droughts can result in decreases in water flow, which will effectively reduce total amount of energy that can be produced and induce stress upon the energy grid.
Vulnerability Assessment Overall, the entire state is vulnerable to the drought hazard, and all state and local assets are susceptible to the impacts of an event. IDWR produced the Idaho Drought Plan, revised in 2001, “to provide current and historical information, guidance and a framework for managing water shortage situations in Idaho.” The efforts put forth to assemble the plan and the historical information contained therein are indicative of the State’s awareness of its vulnerabilities. The State is vulnerable to drought because it is already in an arid region of the country. However, the southeastern and upper Snake River Plain counties have the highest probability for persistent stream flow deficits.

CHAPTER 3.5 RISK ASSESSMENT: DROUGHT
STATE OF IDAHO HAZARD MITIGATION PLAN 2018 3.5-31
According to the USDA’s Census of Agriculture, the following counties had the greatest market value of products sold (over $500 million each): Cassia County, Gooding County, Jerome County, Twin Falls County, and Canyon County (in descending order). In total, these five Counties account for $3.6 billion in market value of products sold (approximately 46.2% of State total). In the event of a prolonged, widespread drought, these counties may experience the greatest potential economic losses. As described in “Impacts on Developments,” the Snake River Plain region is of the most vulnerable areas to droughts in the State. Of these counties, Jerome County is completely located within the area of the regional aquifer, and the other four are partially located in this area as well. Additionally, Canyon County, as projected by the EPA’s ICLUS model, will experience population growth by 2020, which will place stress on the current water supply even during non-drought conditions.
Critical Infrastructure and State Facility Impacts A statewide drought analysis was conducted based on best available data for the State of Idaho. This section discusses statewide vulnerability of areas susceptible to drought and potential losses to state assets and critical facilities. No specific, statewide loss estimate exists for the drought hazard. Historical drought losses tend to be related to temporary and permanent losses of property, particularly agricultural damages. The State’s vulnerability to the drought hazard was assessed qualitatively for the plan Update. Drought events generally do not impact buildings. No State buildings are anticipated to be directly affected by a drought, and all are expected to be operational during a drought event. However, droughts contribute to conditions conducive to wildfires. Risk to life and property is greatest in areas where forested areas adjoin urbanized areas known as the wildland-urban interface (WUI). Therefore, all state facilities and critical facilities in and adjacent to the WUI zone are considered vulnerable to wildfire. Section 3.1 describes the State’s vulnerability to the wildfire hazard. In addition to direct drought impacts, all sectors may be affected by cross-sector dependencies and cascading impacts from losses to water, agricultural and energy services.
Water and Wastewater When groundwater is not replenished over a period of time, aquifer and well water levels diminish making irrigation and drinking water difficult to obtain. Besides physical scarcity, contamination of water sources can occur during drought conditions. Water reservoirs may experience increased pollutant levels and lower levels of oxygen, contributing to higher concentrations of illness-causing bacteria and protozoa as well as toxic blue-green algae blooms. (Environment Canada/USGS 2015) Moreover, smaller bodies of water make it easier to achieve toxicity from poisons or pollutants introduced by adversaries.
CHAPTER 3.5 RISK ASSESSMENT: DROUGHT
STATE OF IDAHO HAZARD MITIGATION PLAN 2018 3.5-32
Food and Agriculture Drought conditions will create immediate negative impacts to crop and animal production. This will result in reduced supplies and increasing prices. Reduced revenues will have a negative velocity effect on farm incomes and agriculturally-supported businesses and labor. Drought can increase unemployment, increase farm credit risk, capital shortfalls and eventual loss of tax revenue. Crop shortages can create a need to import commodities normally grown locally and crop customers may look to other markets for short- or long-term contracts. There may also be short-term effects concerning insect infestations, plant disease and wind erosion. Over the past several centuries, both food and water have been used as tools of terrorism and conquest and current policies pay scant attention to history. In particular, the Idaho Department of Fish and Game operates 19 fish hatcheries statewide that have sustained sufficient water for hatchery-raising fish operations for the most part, but they want to stock these fish in the best places for anglers. So they want to place these hatchery-raised fish in the best locations and not in danger of suffocation from low water and/or warm water temperatures. This is a million dollar industry for the State and they want to maintain the industry as much as possible. In drought years such as 2001, 2002 and 2005, the hatchery managers changed their stocking plans to provide as much fishing opportunity as possible (IDFG, 2001; IDFG, 2005).
Energy Idaho’s reliance on hydropower for cheap irrigation and air conditioning will be impacted by drought conditions. Limited water availability will constrain certain hydropower plant operations and will reduce the resiliency of the entire power grid. Low snow pack years will complicate and exacerbate complex water rights agreements thereby affecting river flows and hydropower reservoirs replenishment.
Transportation Idaho’s waterways are not normally used for commercial conveyance. The Port of Lewiston is considered to be a seaport and is the origin of a modest amount of barge traffic to Portland. Recreation, hunting, fishing and water sports will be impacted by drought. Extreme temperatures often accompanying drought will be detrimental to roadways, bridges and rail lines (rail line buckling known as sun kinks).
Communications Communications equipment and information technology data centers use water for cooling. Data centers, for example, often use high-tonnage HVAC systems that require drinkable water to operate computer room cooling systems. Further, drought conditions make wildfires more likely and dangerous, damaging electric transmission and distribution systems as well as wooden electrical and communications poles and aerial equipment, including fiber optic and copper lines, microwave towers and equipment in vaults.

CHAPTER 3.5 RISK ASSESSMENT: DROUGHT
STATE OF IDAHO HAZARD MITIGATION PLAN 2018 3.5-33
Emergency Services Drought conditions and abnormal heat can adversely impact emergency response capabilities by increasing wildfire duration and intensities, damaging or destroying power lines causing outages and reducing water pressure. Reduced freshwater availability will complicate firefighting efforts in urban and suburban areas where chemical retardants and backfires, standard wildfire tactics, are not suitable.
Healthcare and Public Health Under extreme drought conditions, where local water supplies are depleted and water utilities are unable to supply adequate water pressure, hospitals could be impacted. Healthcare facilities, including hospital, clinics and nursing homes, rely on water for heating, cooling and ventilation systems, as well as for equipment sterilization, sanitation, water-based patient treatments, fire suppression and hazmat-decontamination. Inadequate water supplies would force certain healthcare facilities to move elsewhere. Drought may cause dust conditions that could increase risk of potentially deadly dust pneumonia as well as increased wildfire-caused airborne particles such as smoke and pollen.
Chemical and Critical Manufacturing Water is used in manufacturing for fabricating, processing, washing, and diluting, cooling and transporting products. Water is also incorporated into products and used for sanitation needs within manufacturing facilities. Food, paper, chemicals, refined petroleum and primary metal manufacturers all use large amounts of water. Industry uses about 4 percent of all water used (9 percent if hydroelectric generation is excluded.) Depletion or interruption of the water supply could lead to reduced productivity or even temporary closures of key facilities, with impacts reverberating down supply chains.
Vulnerability Assessments and Loss Estimations Drought impacts cross jurisdictional boundaries and primarily impact the population’s water supply and the agricultural industry. Buildings are not anticipated to be directly affected by a drought, and all are expected to be operational during a drought event. As discussed above, droughts can create conditions conducive to wildfires, and therefore local populations and buildings in and adjacent to the wildfire hazard areas are considered vulnerable to wildfire.
Drought events impact the economy, including loss of business function and damage and loss of inventory. Industries that rely on water for business may be impacted the hardest (e.g., agriculture). Even though a majority of businesses will still be operational, they may be impacted aesthetically. These aesthetic impacts are most significant to the recreation and tourism industry.
Idaho’s dependence on resource-based industries also make the State economically vulnerable to drought. Losses ripple through the economy and may result in serious long-term consequences.
Economic impacts may include: • Losses from crop, dairy and livestock, timber, and fishery production and associated businesses. • Losses from recreation providers and associated businesses.

CHAPTER 3.5 RISK ASSESSMENT: DROUGHT
STATE OF IDAHO HAZARD MITIGATION PLAN 2018 3.5-34
• Losses related to the increased costs resulting from increased energy demand and from shortages caused by reduced hydroelectric generation capacity.
• Revenue losses for Federal, State, and local governments from a reduced tax base and for financial institutions from defaults and postponed payments.
• Losses from impaired navigability of streams, rivers, and canals. • Long-term loss of economic growth and development.
The agriculture industry is a major aspect of the State’s economy; Idaho ranks 5th nationally for its share of the State’s overall economy and ranks 7th for agricultural goods and food product exports per capita (Idaho Department of Commerce 2016). A prolonged drought event could have significant impacts to the State’s economy, particularly in counties that have large amounts of agricultural lands. Additionally, damaged and dead crops are also vulnerable to wildfires which can spread easily during periods of drought.
According to the 2012 USDA Agricultural Census, approximately 12,349 farm operators reported farming as their primary occupation. The market value of agricultural products sold from all farms in the State total over $7.8 billion, with total sales averaging $314 million per farm. Crop sales, including nursery and greenhouse, accounted for over $3.4 billion (43.6%) of total sales. Livestock, poultry, and their products accounted for over $4.4 billion (56.4%) of total sales. The lead agricultural products sold were crops, including nursery and greenhouse crops ($3.4 billion); grains, oilseeds, dry beans, and dry peas ($1.4 billion); and vegetables, melons, potatoes, and sweet potatoes ($967.5 million) (USDA 2014). It is evident that damage or complete loss of a crop will have direct economic impacts on the agricultural industry.
Consequence Analysis Evaluation On June 8, 2017, a Consequence Analysis Evaluation was conducted aligning with hazards profiled in the State Hazard Mitigation Plan. The assessment was conducted by a diverse planning team comprised of subject matter experts from across the State. This effort mirrored a similar exercise that occurred during both the 2010 and 2013 State Hazard Mitigation Plan updates.
The exercise is intended to provide another way to assess the State’s vulnerability to its hazards and was conducted as a group exercise. Participants were asked to individually rank the following systems on a scale from 0 (no consequences) to 5 (most severe consequences), separately evaluating both the short-term (0-6 month) and long-term (6+ months) consequences of the scenario.
Systems Evaluated: • The public • First responders • Continuity of operations • Property, facilities, and infrastructure • Economic conditions • Public confidence in government

CHAPTER 3.5 RISK ASSESSMENT: DROUGHT
STATE OF IDAHO HAZARD MITIGATION PLAN 2018 3.5-35
Scenario July: As a result of extremely low snowpack in the Tetons, low levels in the Eastern Snake River Plain Aquifer and record high temperatures, a record drought is occurring in the Magic Valley of Idaho (Blaine, Camas, Cassia, Gooding, Jerome, Lincoln, Minidoka and Twin Falls Counties). Lack of irrigation water has directly impacted farming operations in this agricultural center of the state, including commodities beans, sugar beets, corn and potatoes. Dairy production is also being impacted, especially in Jerome and Gooding Counties. Results
Looking at the consequences of this drought event, exercise participants felt that the most severe consequences would be felt by the economy, the public, the environment and the built environment for both the short and long-term. Both the short and long-term impacts are fairly equal across all systems for this hazard scenario. Some observations of the group to note included:
• This exercise made it clear that the State needs to update its Drought Plan, which was last updated in 2001.
• It was noted that certain FEMA grant monies can now be spent towards projects and programs focused on aquafer recharge.
• This event presents perhaps the largest economic consequences, both short and long-term, as compared to all other hazard scenarios.
0.000.501.001.502.002.503.003.504.004.50
Consequence AnalysisDrought - Magic Valley, ID
Short-Term Consequence (0-6 months) Long-Term Consequence (6+ months)

CHAPTER 3.5 RISK ASSESSMENT: DROUGHT
STATE OF IDAHO HAZARD MITIGATION PLAN 2018 3.5-36
Mitigation Rationale As detailed above, drought is a major natural hazard in the State with respect to its economic impact and land area extent. With respect to number of deaths, drought is not a major hazard. Mitigation for this hazard focuses on sustainable practices and ecosystem management that are integral to a cohesive strategy to protect critical infrastructure and key resources. The National Drought Mitigation Center http://drought.unl.edu/ provides drought education materials on prevention through water conservation, water recycling, protecting water supplies, and storage. Because the Idaho Drought Plan falls under the Idaho Department of Water Resources (IDWR), reliance is given to that agency for both response and mitigation planning. Drought tends to be a hazard that develops slowly and can last anywhere from weeks to multiple years. Every drought poses its own unique set of challenges and impacts.
Policy Framework Mitigation of drought is established, generally, in the Idaho Disaster Preparedness Act of 1975 as amended (Idaho State Code Chapter 10, Title 46) and, more specifically, in the Governor’s Executive Order, 2000-04. The Executive Order also assigns the following responsibilities:
• Department of Agriculture – Primary support agency for mitigation activities pertaining to agricultural issues.
• Department of Commerce – Primary support agency for mitigation activities pertaining to economic injury/losses that result from disasters.
• Department of Water Resources – Develops drought mitigation programs in concert with IOEM.
The Idaho Drought Plan (IDWR, 2001) provides historical information, guidance, and a framework for managing water shortage situations in Idaho. The information presented in the Idaho Drought Plan outlines and describes technical issues and documents activities accomplished during recent water shortages. It is also designed as a resource and educational tool to be used during future water shortages. The Idaho State Water Plan, prepared by the Idaho Water Resource Board (IDWR) with assistance from IDWR, establishes the statewide water policy plan and component plans for individual basins or other geographic designations. These plans may be reviewed and re-evaluated on a periodic basis and may address drought issues if warranted.
Source: ThinkStock.com

CHAPTER 3.5 RISK ASSESSMENT: DROUGHT
STATE OF IDAHO HAZARD MITIGATION PLAN 2018 3.5-37
The issue of whether to formally declare a drought statewide is both controversial and important. Most public agencies approach formal declaration with caution. Formal designations may not bring additional Federal support or minimize economic impacts and they can have a serious economic impact on tourism, agriculture, financing and many other related industries. Unless a water shortage situation is of extreme magnitude, the safest approach is to let county and local governments determine their own response. There is an existing and effective network of public agencies, water system managers, and experts who can assess their particular needs. If necessary, additional technical assistance can be provided by the Idaho Water Supply Committee.
Existing Mitigation Planning Programs A robust drought mitigation strategy typically includes:
• maintaining monitoring programs, • developing institutions or organizations to communication the hazard to both the public and to
governmental entities responsible for drought mitigation and declarations, and • reducing the vulnerability of society to the risks of drought by improving resource sustainability.
The State of Idaho began implementation of the statewide Drought Plan in 2001 and is continuing to improve its drought mitigation strategies in all three aspects. The first section of this chapter describes existing and developing drought monitoring programs and institutions that the state of Idaho utilizes to disseminate drought information at regional, state, and national levels. The remaining sections describe projects to reduce societal risk to drought through increasing the sustainability of the resources. Drought Monitoring The Idaho Drought Plan, last revised in 2001, established the Idaho Water Supply Committee. The Idaho Water Supply Committee is a state based organization led by the Idaho Department of Water Resources (IDWR) which meets on a monthly basis from January through April. The Idaho Water Supply Committee is composed of state, federal, and private entities. The meetings are open to the public and are a forum for experts across the state to collaborate and discuss water supply concerns. Topics of discussion include the mountain snowpack, streamflow forecasts, projected irrigation supply, reservoir operations, and weather forecasts. A sub-committee of the Idaho Water Supply Committee coordinates drought categorization with the United States Drought Monitor (USDM). The sub-committee includes representatives from the National Weather Service, the National Resource Conservation Service, USGS, Bureau of Reclamation, canal companies, irrigation districts, and IDWR. The sub-committee discusses localized drought conditions and submits recommendations to the USDM on the drought classification across the state. The drought classification defined by the USDM triggers an automatic Secretarial Disaster Declaration by the United States Department of Agriculture when the USDM drought classification is a “Severe Drought” for eight consecutive weeks (https://www.fsa.usda.gov/Assets/USDA-FSA-Public/usdafiles/FactSheets/2017/emergency_disaster_designation_and_declaration_process_oct2017.pdf). The Secretarial Drought designation allows farmers to apply for emergency loans and other

CHAPTER 3.5 RISK ASSESSMENT: DROUGHT
STATE OF IDAHO HAZARD MITIGATION PLAN 2018 3.5-38
emergency assistance programs. At the regional level, IDWR has begun coordinating with the National Integrated Drought Information System (NIDIS) to develop a Drought Early-Warning System for the Pacific Northwest (https://www.drought.gov/drought/dews/pacific-northwest ).
State Government Drought-related resource management is intimately intertwined with general water supply management. Consequently, drought mitigation is to a large degree an extension of normal water management procedures.
The Idaho Department of Water Resources serves as the lead State agency in coordinating drought-related activities. IDWR has two major responsibilities related to drought:
• Administration of all water rights. • Inventory, monitoring, and planning of the State’s water resources.
IDWR analyzes water supply data early in the water year to determine the probability of shortages. If a drought becomes likely, the interagency Water Supply Committee, chaired by IDWR, coordinates the State’s drought-related activities. Idaho’s Water Supply Committee was created as an action element of the Idaho Drought Plan first prepared in 1990, when Idaho was in a period of sustained drought. The committee, composed of State, Federal, and private agency representatives, performs a number of tasks:
• Compiles drought-related data; • Coordinates State agency actions; • Provides public information; and • Promotes water and energy conservation.
At the end of the 1992 water year, the Idaho Water Resource Board (IDWR) offered financial assistance in the form of one-time cost-share grants to assist regional entities in establishing winter cloud seeding projects. Projects were initiated in the Upper Snake, Bear, and Boise River basins during the winter of 1992-93. Subsequently, the legislature gave IDWR authority to coordinate weather modification projects designed to increase water supplies. The legislature also approved funding for IDWR to provide financial assistance to local or regional entities that are funding winter-season weather modification programs.
The Water Quality Division of the Department of Environmental Quality has oversight for the safety of drinking water, groundwater protection, non-point and point source pollution, and municipal facilities construction. By maintaining the public water supply in good quality, shortages are mitigated. The Division contracts with the seven health districts for oversight of small community and non-community drinking water systems, addressing source protection and safe delivery for more than 2,080 community and non-community water systems statewide. The Division also administers State and Federal construction grants programs intended to provide financial assistance to Idaho communities needing new wastewater treatment systems or improvements to existing systems in order to protect public health and comply with water quality standards.

CHAPTER 3.5 RISK ASSESSMENT: DROUGHT
STATE OF IDAHO HAZARD MITIGATION PLAN 2018 3.5-39
In 2010, IDWR partnered with the NDMC and the USDA Risk Management Agency (RMA) to sponsor a workshop on the Vegetation Drought Response Index (VegDRI) and the more experimental product, Vegetation Outlook (VegOut). The workshop helped inform the agricultural community about new means to prevent losses from drought.
Federal Government The Bureau of Reclamation modifies its resource management and technical functions to reduce the adverse impacts of periodic water shortages. Drought mitigation is possible through four mechanisms:
• Project Sizing – projects are designed to limit the impact of water shortages. Centralized facilities with overly large, complex distribution systems are vulnerable to hazards on several levels. Consideration should be given to emerging sustainable water technologies geared towards smaller-scale, distributed infrastructure systems that integrate decentralized systems with traditional, centralized conveyance and treatment networks.
• Water Conservation and Efficiency Improvement – conservation and efficiency measures are incorporated into new projects and retrofitted into older projects; assistance is available to other agencies.
• Technical Assistance in Water Conservation Planning – Technical assistance is provided for the development and implementation of water conservation plans.
Project (Dam) Operations – Projects are operated, to the extent feasible and permitted by law, to use the water resource in an efficient manner. The NRCS monitors and reports the snow pack in the western United States. This information is used to make volumetric stream flow forecasts for major rivers in the State (in conjunction with the NWS). This early warning allows for water-use adjustments and possible avoidance of a drought situation. The Water Resources Division of the USGS also collects, interprets, and disseminates hydrologic information.
NOAA, with the U.S. Department of Agriculture and the NDMC in Lincoln, Nebraska, issues a weekly drought assessment called the U.S. Drought Monitor and a monthly assessment called the U.S. Seasonal Drought Outlook.
Source: ThinkStock.com

CHAPTER 3.5 RISK ASSESSMENT: DROUGHT
STATE OF IDAHO HAZARD MITIGATION PLAN 2018 3.5-40
The Idaho branch of USDA’s NRCS is working with IDWR and IOEM on drought monitoring and proactively predicting drought. It is also working with the USDA’s Risk Management Agency to improve crop insurance participation in order to reduce costs.
General Mitigation Approaches Hazard Management Hazard management of drought involves the long-term reduction of the probable gap between water supply and demand. Supply can be addressed through the development of storage and delivery capacity (construction of reservoirs and associated facilities), improved operation of existing facilities, and weather modification. Demand can be addressed through various forms of conservation.
Weather modification is designed to increase the amounts of moisture realized from storms. Any weather modification program with the goal of increasing basin-wide winter snow packs should be a multiyear commitment. Analyses indicate that a 5- to 20-percent seasonal precipitation increase can be achieved for climatic situations such as those in Idaho.
Water conservation efforts may include: • Administering conjunctive use of surface and ground water; • Implementing water quality management and wastewater reuse; • Reducing water conveyance losses; • Reducing consumptive use by changing the type of water application system, incremental
pricing for water use, lower-flow appliances, capturing and reusing rainwater for non-potable uses;, and
• Restore ecosystems as a means to reduce risk and protect natural resources, i.e. returning fire to the ecosystem so that forest health is restored and aquifer replenishment is enhanced.
Preparedness measures should include preparatory measures and policies that may help communities and infrastructure assets and systems cope with the impacts. Drought contingency planning can also ensure continuity of public services and quality of life. Aquifer Recharge Programs Current Aquifer Recharge Program Following the completion of the comprehensive aquifer management plan for the Snake River in 2009, the Governor and Idaho legislature tasked the Idaho Water Resource Board (IDWR) with developing an aquifer recharge program capable of recharging an average of 250,000 acre-feet/year by 2024. The Idaho Water Resource Board (IDWR) has committed over $14 million in capital improvements from 2013 to 2018. By 2024, it is estimated that the Idaho Water Resource Board (IDWR) will invest over $40 million for capital improvements.
The Idaho Water Resource Board (IDWR) has recharge water rights with priority dates ranging from 1980 and 1998, and since these recharge rights are junior to most irrigation water rights, these rights are usually utilized between the irrigation seasons. In addition, the water available for the IWRB to
CHAPTER 3.5 RISK ASSESSMENT: DROUGHT
STATE OF IDAHO HAZARD MITIGATION PLAN 2018 3.5-41
conduct recharge is significantly different above and below Minidoka Dam due to senior power and reservoir storage water rights. Below Minidoka Dam, water is usually available all winter long; however, above Minidoka Dam water is only available for recharge approximately fifty percent of the time. In drought years, the maximum water supply available for recharge is estimated to be 150,000 acre-feet. In the winter of 2014-2015, 75,475 acre-feet was diverted for recharge throughout the ESPA. The following winter, 2015-2016, the recharge volume decreased to 66,000 acre-feet as water was only available below Minidoka Dam. Due to infrastructure improvements and a better water supply, in the winter of 2016-2017, the IWRB was able to recharge 317,715 acre-feet throughout the ESPA. This winter (2017-2018), building on the previous large water supply year, the Idaho Water Resource Board (IDWR) recharge is expecting recharge to exceed 500,000 acre-feet (personal communication with Wesley Hipke, Recharge Program Manager). In Search of Sustainability - A Comprehensive Aquifer Management Plan for the East Snake Plain Aquifer Hazard management of drought also involves the long-term reduction of the gap between water supply and demand. On the Eastern Snake Plain Aquifer, the imbalance in aquifer inflows and outflows is exacerbated in times of drought. A decline in aquifer storage corresponds to a decline in discharge from the aquifer to the Snake River. The East Snake Plain Aquifer and the Snake River are major water resources utilized in southern Idaho. In order to address the water supply and demand imbalance, the Idaho Water Resource Board (IDWR) developed a comprehensive aquifer management plan for the Eastern Snake Plain Aquifer in 2009 (www.idwr.idaho.gov/waterboard/WaterPlanning/CAMP/ESPA/PDFs/ESPA_CAMP_lowres.pdf). The goal of the aquifer management plan was to achieve an incremental positive change in the aquifer budget of 600,000 acre-feet by 2030 by decreasing extractions from the aquifer and increasing recharge. The five main methods to adjust the water-budget in the plan are as follows:
1) Groundwater to surface water conversions (100,000 acre-feet/year), 2) Managed Aquifer Recharge (150,000 acre-feet/year), 3) Voluntary Demand Reduction (250,000 to 350,000 acre-feet/year), 4) Weather Modification (cloud-seeding: 50,000 acre-feet), 5) Minimize Loss of Incidental Recharge.
A Voluntary Agreement to Reduce Groundwater Pumping The State of Idaho has also encouraged a voluntary agreement to reduce groundwater pumping from the Eastern Snake Plain Aquifer. Senior surface water irrigators and junior groundwater users reached an agreement in 2015 to reduce consumptive use of groundwater on the Eastern Snake Plain Aquifer by 240,000 acre-feet annually. The reduction in consumptive use can be a reduction of groundwater pumping or through managed recharge to mitigate the pumping. The agreement is the result of l decade of litigation between the surface water irrigators who claimed injury by the groundwater pumpers to their surface water supplies on the Snake River.
CHAPTER 3.5 RISK ASSESSMENT: DROUGHT
STATE OF IDAHO HAZARD MITIGATION PLAN 2018 3.5-42
Sustainability of Idaho’s Water Resources – Promote and Finance Projects that will Ensure Sustainability of Water Sources into the Future The 2016 Legislature passed Senate Concurrent Resolution 137 requesting the Idaho Water Resource Board (IDWR) identify and implement stabilization and sustainability projects to stabilize and enhance ground water supplies throughout Idaho. Ground water supplies have been declining in areas throughout the state and these declines have resulting in reduced water supplies unable to sustain surface and ground water uses. These reduced water supplies cause contentious, costly, and time consuming litigation. The legislature encouraged the Idaho Water Resource Board (IDWR) to undertake a proactive approach to reversing these declines to prevent economic impacts that would inevitability arise if ground water levels continue to decline. In 2017, the Idaho Water Resource Board (IDWR) added a Sustainability policy to section 8A of the State Water Plan that reads, “Sustainability is the active stewardship of Idaho’s water resources to satisfy current uses and assure future uses of this renewable resource in accordance with state law and policy.”
A Collaborative Weather Modification Program Since adoption of the comprehensive aquifer management program, the Idaho Water Resource Board (IDWR) has teamed up with Idaho Power Company to support a collaborative weather modification/cloud-seeding effort. Idaho Power Company runs the cloud-seeding program with financial support from the Idaho Water Resource Board (IDWR). Idaho Power Company currently conducts cloud seeding in the Payette, Boise, Big Wood, and the upper Snake River basins. The power company estimates that cloud seeding in the Payette basin on average supplies an additional 270,000 acre-feet to their hydropower plants in the Hells Canyon Complex. They also estimate that cloud seeding in the upper Snake River basin supplies an additional 420,000 acre-feet to all their hydropower projects on the Snake River below Milner Dam (www.idahopower.com/energy/delivering-power/power-plants/cloud-seeding). Cloud-seeding/weather modification is only a drought mitigation strategy when it provides more water during times of shortage.
Additional Projects Adding Resiliency to Idaho Water Resources Other major efforts currently carried out by the state to protect water supplies and water quality include the Mountain Home Air Force Base Water Sustainability Project, the Upper Salmon River Basin Program, and aquifer studies in the Boise and Lewiston basins. The Mountain Home Air Force Base Water Sustainability project aims to provide a sustainable surface water supply while relieving demand on the aquifer. The groundwater use by the airbase and its neighbors is currently unsustainable. The Upper Salmon Basin Project is seeking ways to augment streamflows for anadromous fish. The Boise and Lewiston aquifer studies are developing tools to better understand the current state of the resources.
Landscape Health Idaho Rangeland Drought Task Group. Wildfire and drought cause shortages of forage and displace ranchers who depend on rangelands. The Idaho Cattle Association, Idaho Wool Growers Association, Idaho State Department of Agriculture, Idaho Farm Bureau, Idaho Department of Lands, Bureau of Land

CHAPTER 3.5 RISK ASSESSMENT: DROUGHT
STATE OF IDAHO HAZARD MITIGATION PLAN 2018 3.5-43
Management, Natural Resources Conservation Service, and other state and federal agencies initiated the Idaho Rangeland Drought Task Group (IRDTG) in 2002. The group improves coordination to reduce potential drought-related conflicts and hardships by informing producers of available drought assistance from federal, state, and other agencies. The IRDTG works collaboratively with livestock producers to address drought conditions throughout Idaho, and help manage changes that may be necessary to ensure healthy, functional rangelands. The intent of the IRDTG is to present potential alternatives to producers and facilitate coordination between state and federal land management agencies. Cover Crop Pasture Exchange. The IRDTG proposed the facilitation of a cover crop grazing exchange as a way to help producers impacted by drought and wildfire. The IRDTG is continually encouraging farmers who may be willing to grow forage cover crops, potentially due to inadequate water supplies from drought conditions to grow other crops. The forage cover crop acreages can then be made available for livestock grazing to ranchers in need of immediate forage due to drought conditions or wildfire. The forage cover crops will not only help protect the farmer’s fields from erosion but also provide vital livestock forage for fellow producers. For more information on cover crops, forage producers can contact their local Natural Resources Conservation Service (NRCS) Office. NRCS has also developed a brief fact sheet regarding this program. Those who are interested in engaging in the program can list cover crops that are available for grazing opportunities or looking for pasture for livestock grazing by signing up with the confidential information exchange program at www.idahocattle.org/grazingshare.aspx. Information/Outreach and Public Education Drought-related educational efforts geared towards conservation both increase the effective water supply (by reducing demand) and build “drought resistance” by demonstrating how to withstand the effects of a prolonged drought. Drought-education materials should be designed to help residents and businesses learn methods of water conservation and instill these methods in their everyday lifestyles.
Early information is vitally important to the agricultural community, allowing farmers to make important seed ordering and planting decisions.
NOAA’s National Weather Service has recently produced a Drought Fact Sheet. This informational flysheet provides useful information for the public regarding drought monitoring, forecasting, and links to other drought-related resources. Drought Early Warning System (DEWS)
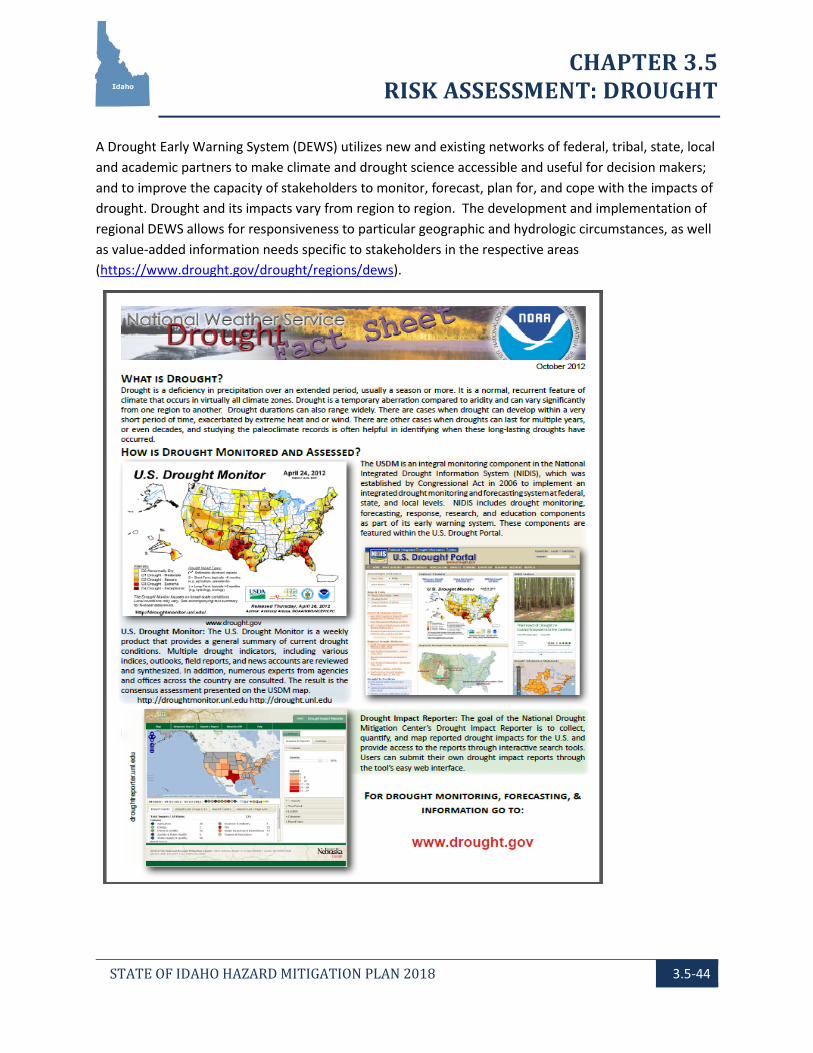
CHAPTER 3.5 RISK ASSESSMENT: DROUGHT
STATE OF IDAHO HAZARD MITIGATION PLAN 2018 3.5-44
A Drought Early Warning System (DEWS) utilizes new and existing networks of federal, tribal, state, local and academic partners to make climate and drought science accessible and useful for decision makers; and to improve the capacity of stakeholders to monitor, forecast, plan for, and cope with the impacts of drought. Drought and its impacts vary from region to region. The development and implementation of regional DEWS allows for responsiveness to particular geographic and hydrologic circumstances, as well as value-added information needs specific to stakeholders in the respective areas (https://www.drought.gov/drought/regions/dews).
CHAPTER 3.5 RISK ASSESSMENT: DROUGHT
STATE OF IDAHO HAZARD MITIGATION PLAN 2018 3.5-45
THIS PAGE INTENTIONALLY
LEFT BLANK