Embed Size (px)
Citation preview

Drought risk analysis
-a state of the art-
Veit BlauhutEnvironmental Hydrological Systems

11/5/2018 2
Drought
Source: NDMC
Drought: climatological induced deficit in water availability that causes negative
social, economic and ecological impacts. (adapted from Knutson et al. 1998)

11/5/2018 3
Understanding drought risk
Drought risk is not: frequency and severity of the hazard
Drought risk is: likelihood of adverse effects of drought as a product of both the
frequency and severity of the hazard and corresponding vulnerability

Picturing drought – impacts globally

11/5/2018 5
Picturing drought – impacts Europe
Source: European Drought Impact report Inventory,
1.10.2018

11/5/2018 6
Review of …
Foci of the review
• Location
• Focus
• Spatial scale
• Temporal scale
• Paradigms of analysis
• Data applied
• Visualisation of risk via maps
Drought risk analyses (English & German) displaying drought risk via
mapping:
Drought risk = f(hazard x vulnerability)

11/5/2018 7
Drought risk analyses around the globe
Misuse of “drought risk” terminology (drought risk as reoccurrence of drought)
Remaining: 53 studies on drought risk

11/5/2018 8
Sectors & scales of DRAs

11/5/2018 9
Paradigms of drought risk analysis
Data approach Combination methodDrought risk
f( hazard, vulnerability)

11/5/2018 10
Data approach
Drought risk
f( hazard x VULNERABILITY)
Impact approach
Impacts as proxy of pastvulnerability
Factor approach(weighted) combination of different factorscharacterising vulnerability
Natural sciences
Quantification of risk based on
the linkage between drought indices
and impacts (as a proxy for
vulnerability)
Risk analysis
Social sciences
Assessment of vulnerability by
a combination of ‘relevant’,
vulnerability factors
stemming from epistemic fundi
Vulnerability assessment

11/5/2018 11
Drought risk paradigms - data
Drought risk
f( hazard x VULNERABILITY)
Impact approach
Impacts as proxy of pastvulnerability
Factor approach(weighted) combination of different factorscharacterising vulnerability
• Agricultural yields
• Financial losses
• Energy production
• Reported drought
impacts
• Landuse
• Population density
• GDP
• Water Management
plans
• …..

11/5/2018 12
Drought risk paradigms – pros & cons
Drought risk
f( hazard x VULNERABILITY)
Impact approach
Impacts as proxy of pastvulnerability
Factor approach(weighted) combination of different factorscharacterising vulnerability
Hybrid approach
Combination of impact and vulnerability information
• Quantification of the impact
• Specific focus
• Application of time series (dynamic)
• Misses the root causes of impacts
(vulnerability)
• Understanding of possible drivers of
drought risk (beyond the hazard)
• Stakeholder interaction
• Application of recent data (static)
• Misses a quantification of potential losses
Combination method
11/5/2018 13
• Statistics are reliable and transparent • Intransparent weighting and verification
procedures
Statistical model
Drought risk
f( hazard, vulnerability)
Conceptual model
Lei et al. 2011 Kipterer & Mundia 2011

11/5/2018 14
Data approach vs. combination method
Impact information: statistical model
Vulnerability information: conceptual models

11/5/2018 15
Predictor selection & result verification
Predictor selection:
• 35% of DRAs did not provide any information on selection criteria
• ~ 55% of DRAs named expert knowledge (including literature and pre-studies)
• Predictor selection by : principal component analysis (Wu et al. 2011),
stepwise multivariable logistic regression (Blauhut et al. 2016)
Verification of results:
• ~ 50% are based on a statistical model tested
• 65% of conceptual models did not verify results
• Applied verification methods are:
• Quantitative, e.g. comparison to other studies or sources of information;
or expert judgement
• Qualitative: sensitivity analyses
Lack of transparent selection criteria
Lack of result verification

11/5/2018 16
Input data
Risk:
Hazard
Vulnerability
Impact

11/5/2018 17
Hazard
Hit list:
SPI 7 application
NDVI 5 application
SPEI 4 application
Dominance of meteorological drought
Lack of multiple hazard indicators
Prevalence of standardised indices
33% of DRAs apply actual conditions, model a linkage of actual hazard
conditions to impact/vulnerability

11/5/2018 18
Vulnerability factors (75% of DRAs)

11/5/2018 19
Hit list vulnerability factors
Hugh variety
Lack of common standards
Prevalence of landuse and technological/ infrastructural information

Impact information
• > 60% of DRAs apply impact information
• Modelled and observed information
• Sources of information are:
• Statistics, no defined drought focus, e.g. annual yields, hydropower
production (Worldbank, Eurostat)
• “Drought induced” impact information (EM-DAT, EDII)
Lack of drought attributed impact information
General lack of sector specific impact information with regard to higher
sector-wise temporal and spatial resolution
11/5/2018 21
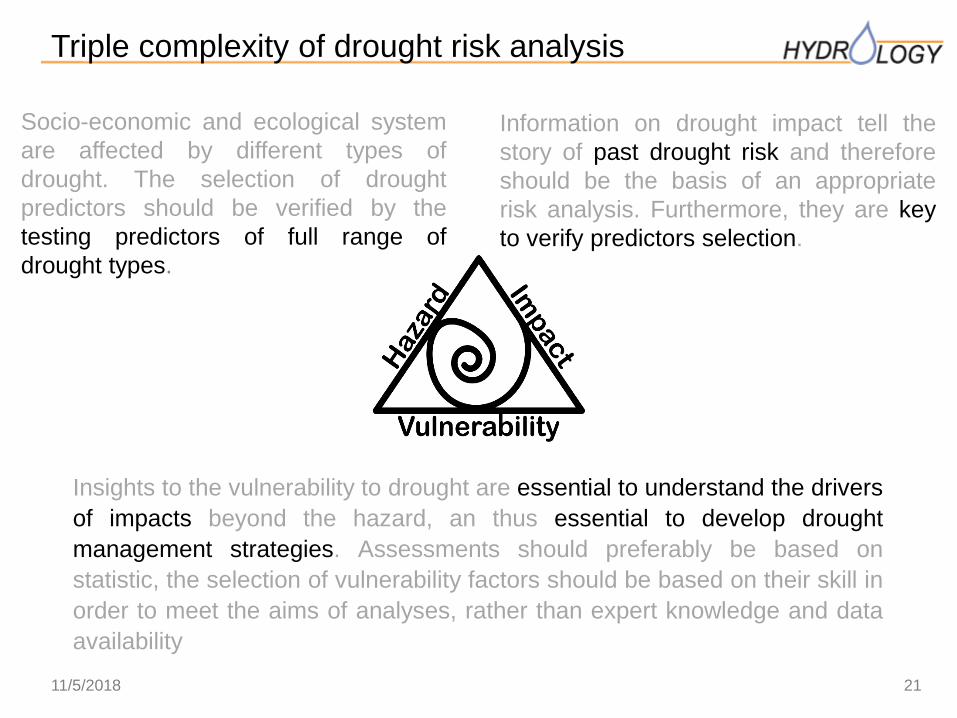
Triple complexity of drought risk analysis
Information on drought impact tell the
story of past drought risk and therefore
should be the basis of an appropriate
risk analysis. Furthermore, they are key
to verify predictors selection.
Socio-economic and ecological system
are affected by different types of
drought. The selection of drought
predictors should be verified by the
testing predictors of full range of
drought types.
Insights to the vulnerability to drought are essential to understand the drivers
of impacts beyond the hazard, an thus essential to develop drought
management strategies. Assessments should preferably be based on
statistic, the selection of vulnerability factors should be based on their skill in
order to meet the aims of analyses, rather than expert knowledge and data
availability

25%
6%
1%4%
5%
2%
22%
8%
14%
1%2%
6%
3%1%
Agriculture and Livestockfarming
Forestry
Freshwater Aquaculture and Fisheries
Energy and Industry
Waterborne transportation
Tourism and Recreation
Public water supply
Water quality
Freshwater ecosystems
Terrestrial ecosystems
Soil system
Wildfires
Air quality
Human health and public safety
Conflicts
11/5/2018 22
Affected sectors in Europe

23
Multi-sectoral focus
Likelihood of impact occurrence :
Impacts x Hazard x Vulnerability Factors = Risk15 impact
Categories
(annual impacts)
5 indices (different
timescales, months)
81 vulnerability factors
(Blauhut et al. 2016)
• Region and sector specific identification of relevant drought indices
• Region and sector specific identification of relevant vulnerability factors
• Combination of best performing hazard indices and vulnerability factors
• Region & sector specific likelihood of impact occurrence

24
Multi-sectoral focus
Likelihood of impact occurrence / drought risk = f(hazard, impact, vulnerability)

25
Agriculture: level of detail
30
• Yield statistics
• Agricultural impact reports
• Yield statistics
• Modelled yields
Agriculture: unspecific Agriculture: specific
Probability of drought disaster occurrence by
agricultural disaster survey data, China
Hao et al. 2011
DeNitrification-DeComposition, maize losses due
to days without rainfall, Liaoning province
Sun et al. 2017

26
User to address: supra-regional agencies
Spinoni et al. 2015
Country scale County scale
Blauhut et al. 2016
Hydropower production

11/5/2018 27
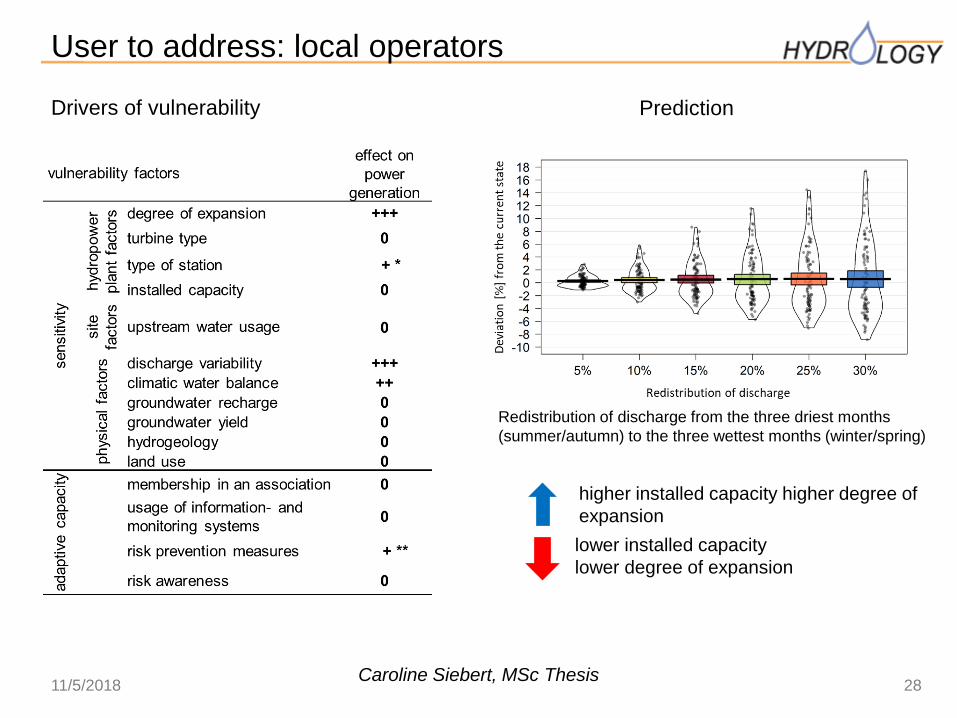
User to address: local operators
Drought risk of hydropower production Vulnerability of hydropower stations
Annual loss in energy production in percentage to
average productionEnergy production = f(density of water, earth acceleration,
degree of efficiency, drop height, usable runoff)
Caroline Siebert, MSc Thesis
Vulnerability to drought index based
on questionnaire & physical factors
11/5/2018 28
User to address: local operators
lower installed capacity
lower degree of expansion
higher installed capacity higher degree of
expansion
Prediction
Redistribution of discharge from the three driest months
(summer/autumn) to the three wettest months (winter/spring)
Drivers of vulnerability
Caroline Siebert, MSc Thesis

Take home messageAnalysis should address the NEED(S) of the user(s):
• Sector specific analyses enable to provide a strong statement on
drought risk of the systems investigated
basis for drought management
• Spatial scale: depends on the user addressed
• Temporal scale: applicability for early warning vs. general insights
Data:
• Combination of hazard, vulnerability & impact information
• Lack of standards in vulnerability assessment, convenience of using available
data rather then investigating novel, more relevant information
• Lack of impact information
• Transparency of predictor selection criteria
Method:
• Increase transferability!
• Higher reliability of statistical models
• Transparency of methods applied
• Verification of results
• Discussion of uncertainties
• Guidance on drought risk analysis: drought risk analysis catalogue?

Thank you
Veit Blauhut
Environmental Hydrological Systems, University of Freiburg, Germany
Picture by Alexander Gerst, Aug. 2018